Article

Analysis of Fine Dust Removal Time Using Circular Hole Electrodes of Various Sizes by Corona Discharge

School of Electrical Engineering, Pusan National University, Busan 46241, Korea
*
Author to whom correspondence should be addressed.
Energies 2018, 11(8), 1956; https://doi.org/10.3390/en11081956
Submission received: 12 June 2018 / Revised: 24 July 2018 / Accepted: 24 July 2018 / Published: 27 July 2018

Abstract

:
Corona discharge technology is used widely for air purification in laboratory experiments and industry. On the other hand, corona discharge technology has the disadvantage of requiring large-sized electrodes. Therefore, research is needed to reduce the size of the electrodes. In this study, circular hole aluminum electrodes and an air purifier system were designed to reduce the size of the electrodes. Several sets of power conversions were performed to generate a corona discharge. The system consisted of a half bridge inverter, step-up transformer, and Cockcroft Walton circuit. The range of input and output voltages was 30–70 V and 20–25 kV, respectively. A corona discharge was generated by the output voltage. The system could remove smoke in less time with a combination of 13 kHz and an electrode with a hole diameter of 0.2 cm than with the other combinations. The electrode hole diameter affected the removal time of species such as hydrogen carbon hydrogen oxygen (HCHO, formaldehyde), total volatile organic compounds (TVOC), and fine dust, which was confirmed by laboratory experiments. Mathematical derivation and experiments were carried out to prove the validity of the approach; the Clean Air Delivery Rate (CADR) index was 480 μm/m3.

1. Introduction

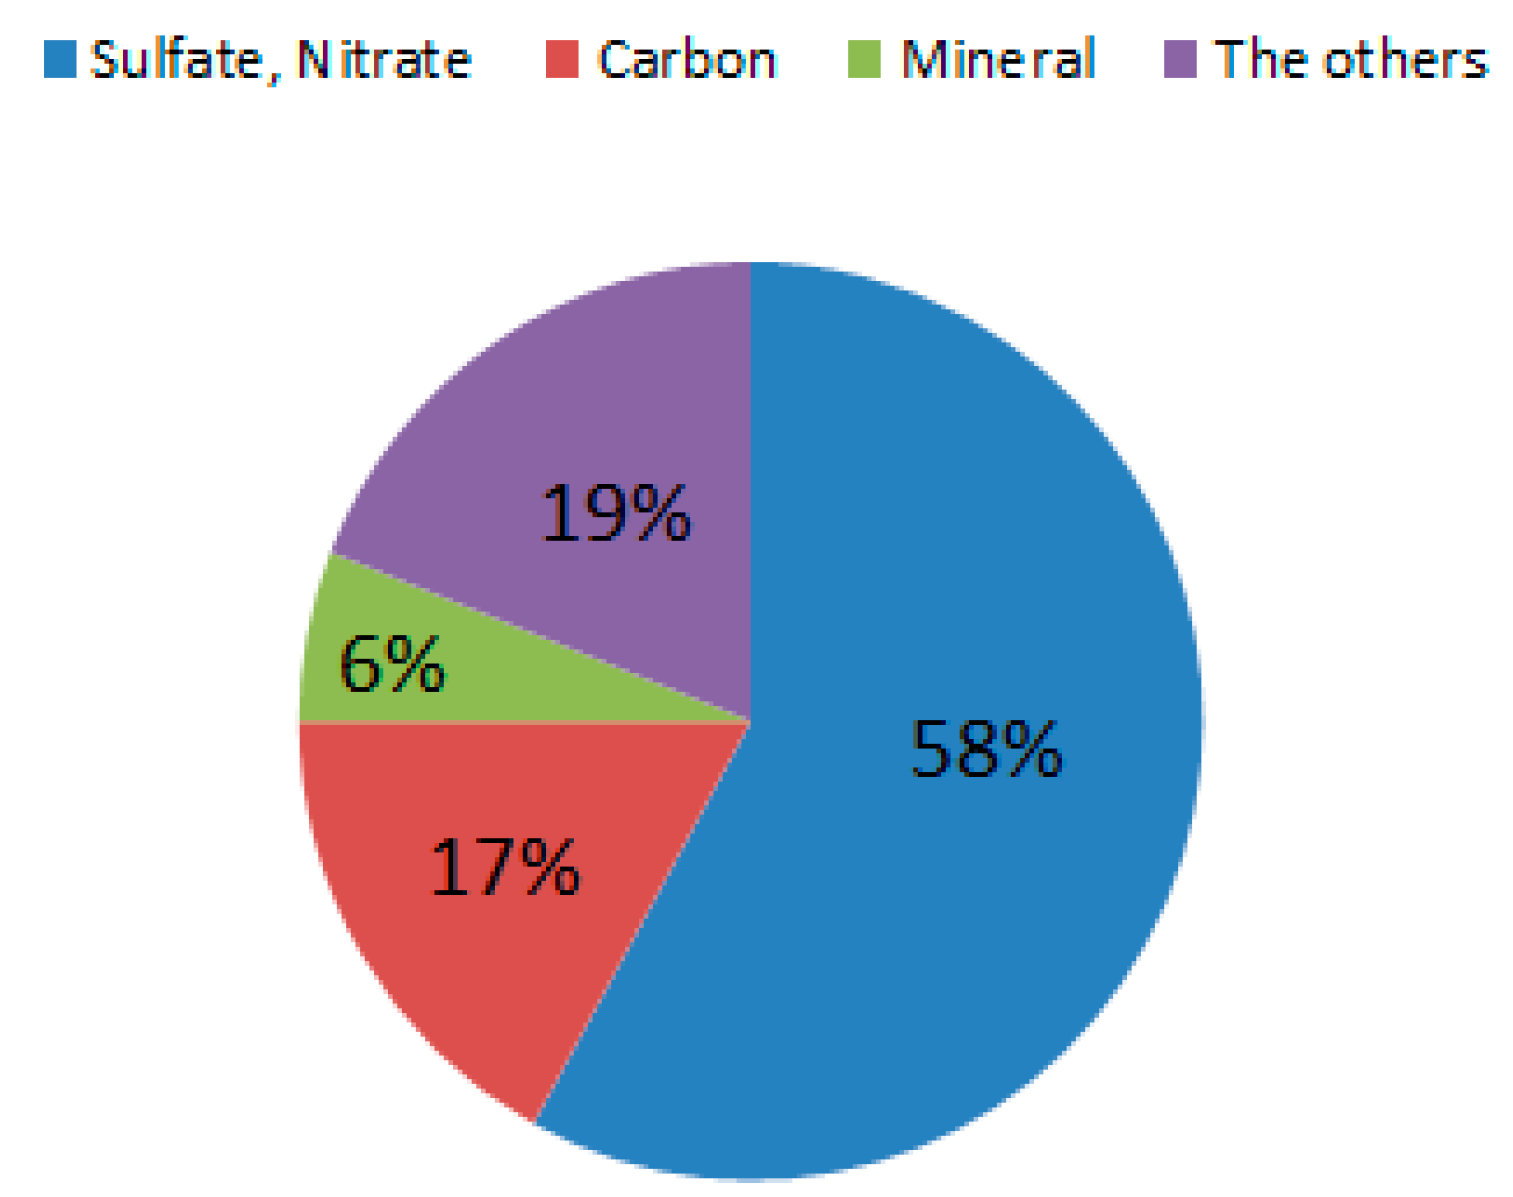
Recently, with the development of industry, the use of fossil fuels and the demand for personal vehicles are increasing. Therefore, the quantity of fine dust is also increasing. Most fine dust is composed of sulfates and nitrates, which cause smog and have adverse effects on human health (Figure 1).
General dust can be observed by the naked eye and easily removed. On the other hand, fine dust has a very small particle size of 10 μm or less and is difficult to recognize visually. Hence, it cannot be removed completely without the help of a fine dust removal system [1,2]. Even on a clear day without smog, these fine particles can enter the respiratory tract when their concentration is high. If this occurs, the dust can be discharged through the respiratory tract depending on its size.
Once fine dust enters our body, the cells responsible for the immunity function act to remove dust and protect our body, a side effect of which is inflammation. These inflammatory reactions in the organs of our body, such as airways, lungs, cardiovascular, and brain can cause asthma, respiratory or cardiovascular diseases [3]. In addition, fine dusts affect not only the human body but also industries and ecosystems. For industrial activities, the semiconductor and display industries are dust-sensitive areas, where only 0.1 μg of dust particles are allowed in a 30 cm × 30 cm × 30 cm space. This is because the defect rate increases when exposed to fine dust. The automobile industry may be adversely affected by the coating process, and in the case of automation equipment, malfunctions due to fine dust may occur. In addition, the visibility distances are reduced, which also hinders the operation of airplanes and passenger.
Fine dust can cause acid rain to sanitize soils and water, cause soil degradation, damage to ecosystems and other vegetation damage. Even heavy metals such as cadmium in the air can cause damage to crops, soil and aquatic organisms. In addition, when fine dust adheres to the leaves of a plant, it blocks the pores of the leaves and inhibits photosynthesis and the like, thereby delaying the growth of the crops [4].
Nowadays, fine dust is attracting much attention. However, air pollutants are not only fine dust. Air pollutants are classified into organic pollutants, inorganic pollutants, and biological pollutants. Biological pollutants are mites, insects, etc. and their harmfulness is relatively low. Organic pollutants are typically HCHO, TVOC, and inorganic pollutants including dust, asbestos fibers, and so on. Readers may refer to Table 1, to check air pollutants and their health effects.
In this paper, we focused on the elimination of HCHO, TVOC, which are the most harmful organic substances for the human body and focusing on fine dust. HCHO and TVOC are defined as follows:
HCHO is a flammable colorless gas with an irritating odor and is used as a sterilizing preservative. Indoors are mainly found in building materials, insulation, adhesives, household goods, chemical fiber, gas combustion, and tobacco smoke.
TVOC is a general term for organic compounds at a boiling point of 50–260 °C and consisting of benzene, toluene, ethylbenzene, xylene and styrene. The sources of TVOC are building materials, finishing materials and adhesives, cleaning supplies, cleaning agents, photocopier toners, and indoor combustion. In addition, Table 2 shows the contamination status of fine dust, HCHO, and TVOC.
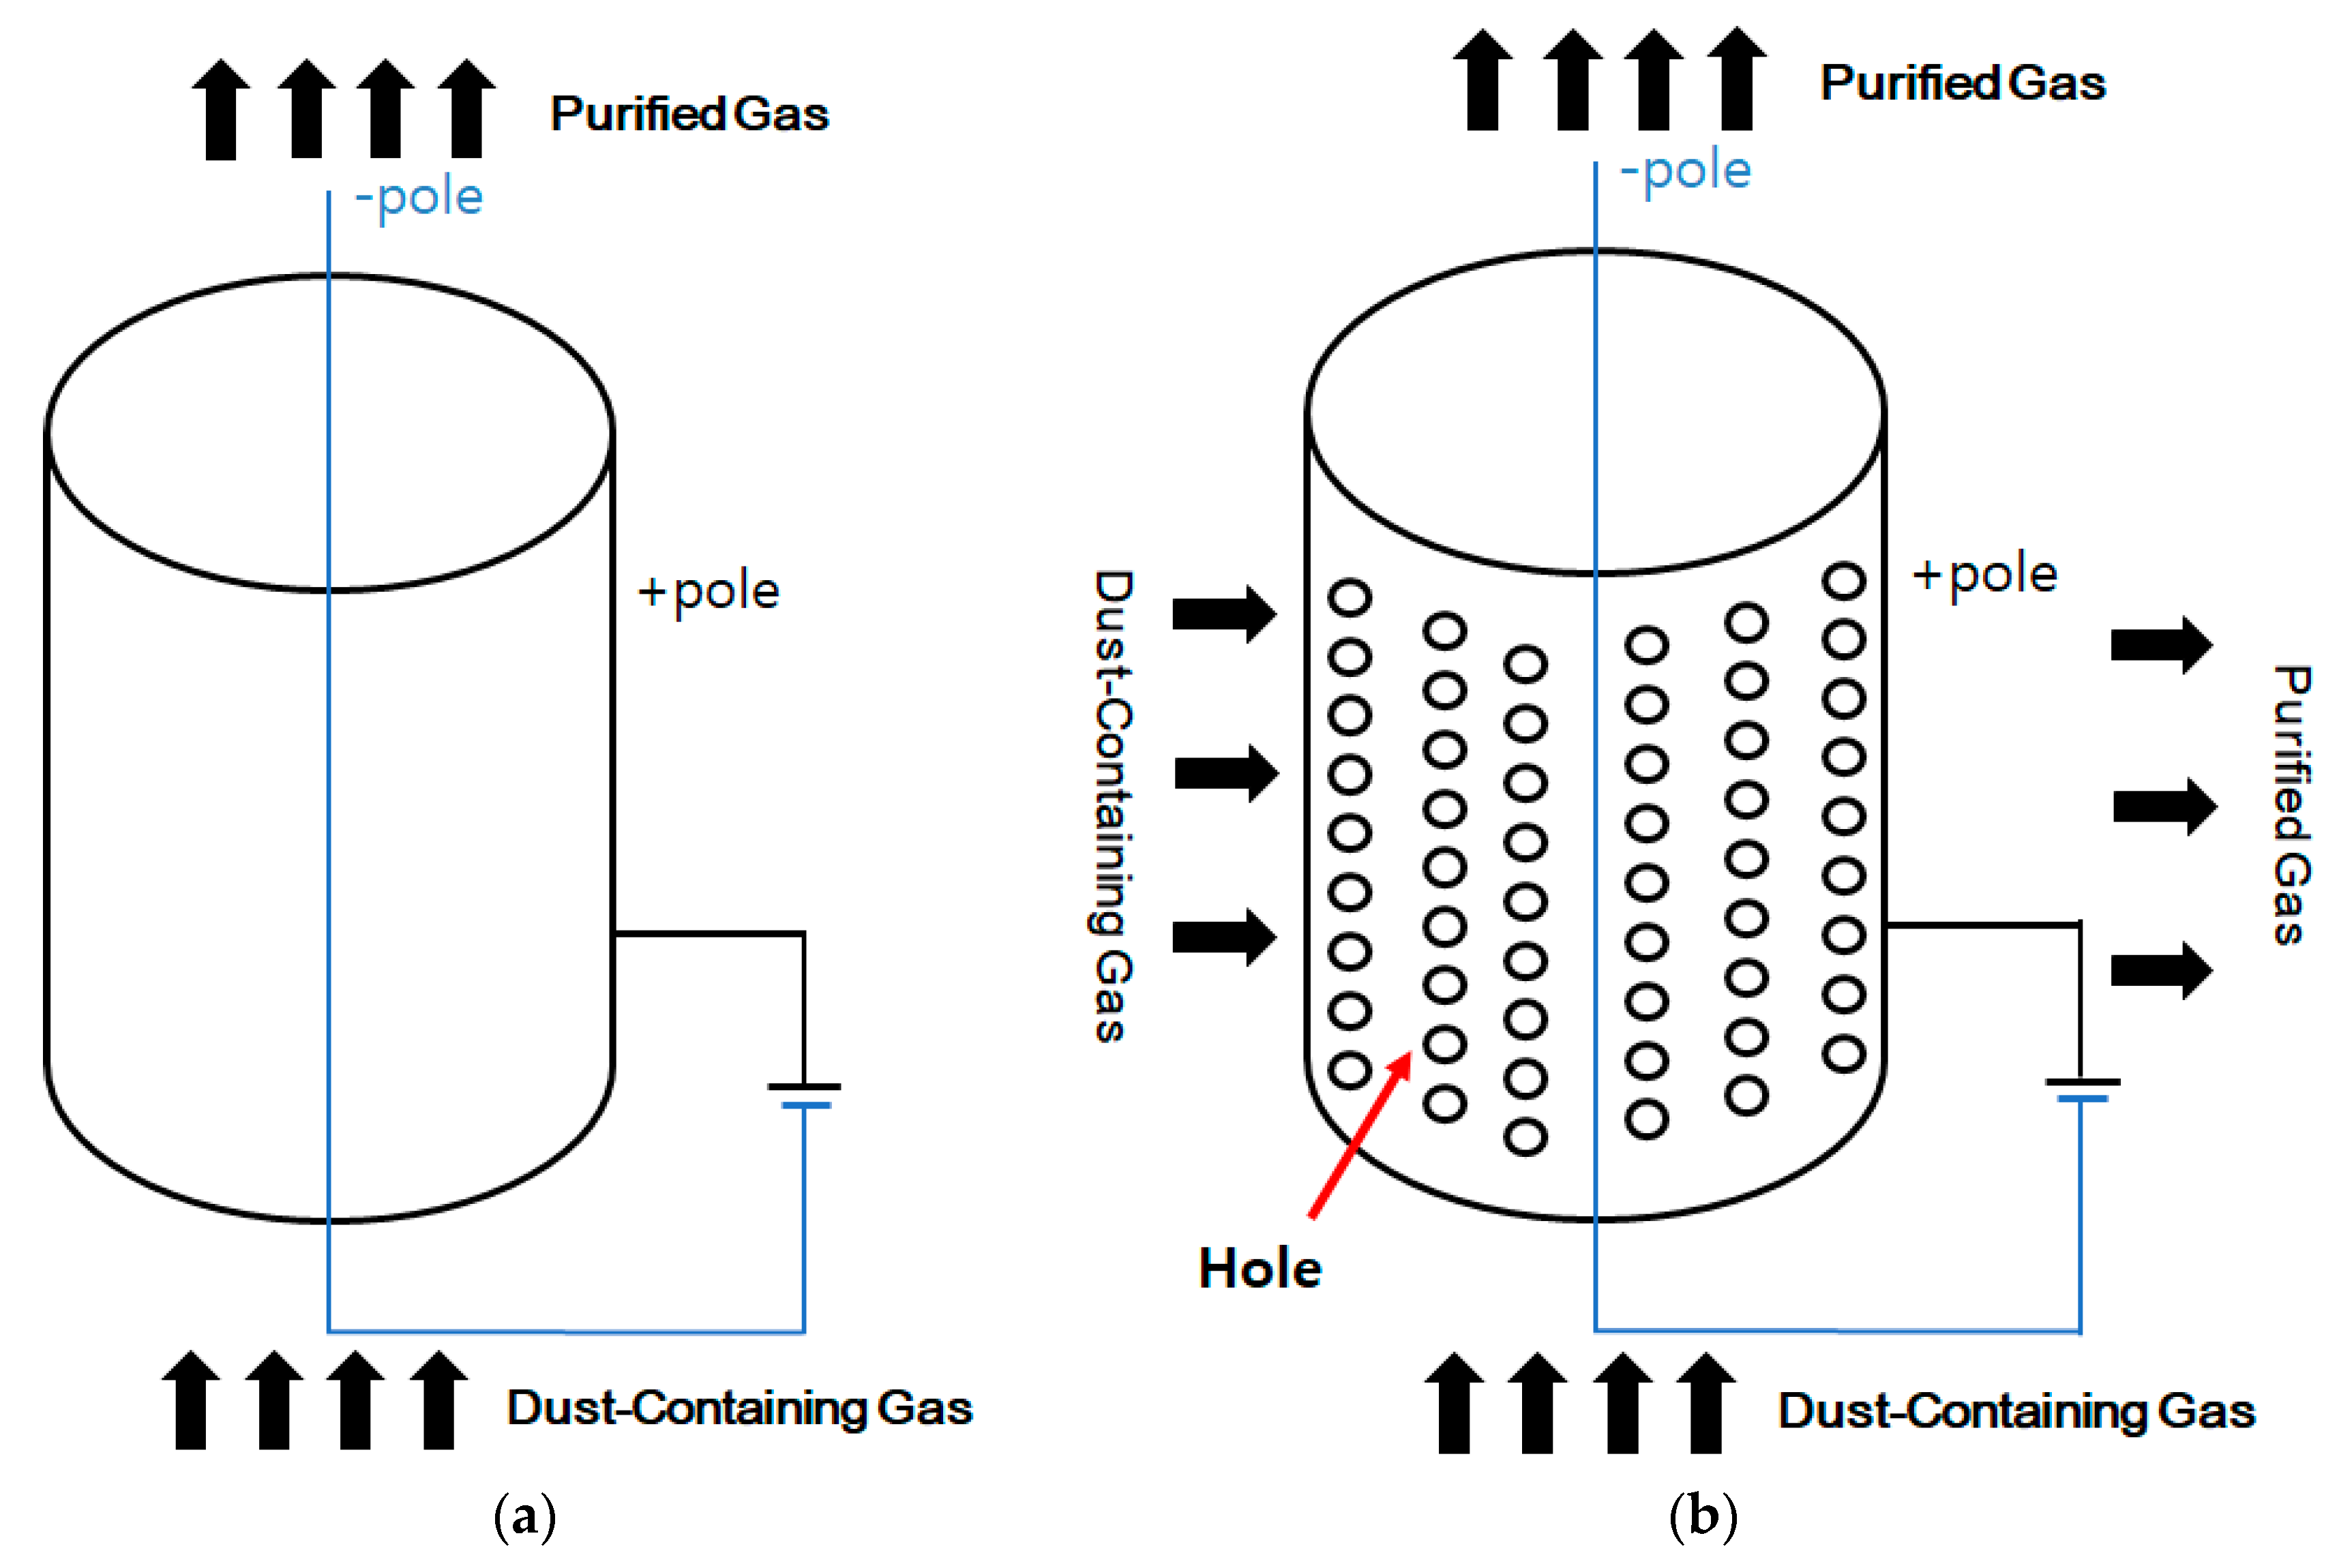
Air cleaning methods are based largely on centrifugal force using a filter and corona discharge. The dust collection efficiency using centrifugal force is low for fine particles. In addition, centrifugal force cannot be used for adhesive, corrosive, and abrasive gases, and it produces a large amount of noise. The use of a filters is uneconomical because it is necessary to replace the filter periodically. If the filter is not replaced, bacteria grow, which can also be harmful to the human body. In the case of a corona discharge, the electrode of the dust collector is made of aluminum, and the filter does not need to be replaced. When the filter is saturated, however, the electrodes cannot be collected smoothly. Therefore, the dust must be removed. To remove the collected fine dust, the electrodes are sprayed with water after disconnecting them from the power supply. This method of using a corona discharge for removing fine dust has high performance [5,6]. Previous studies have suggested that the optimal frequency is a very important factor for a fine dust removal system but it is difficult to understand the mechanism of fine dust removal using just the optimal frequency and its effect on polluted air [7]. A literature survey showed that most papers focus on a fine dust monitoring system using an Arduino board and an optical sensor but these cannot solve the fine dust problem [8,9].
A large electrode is needed to obtain a corona discharge. To remove the fine dust rapidly [10], this study focused on decreasing the electrode size. This paper suggests a new electrode shape with greater efficiency compared to other electrodes with the same area. To achieve better performance with the same area, the size of the electrode should be optimized. To demonstrate this, this study assessed the optimal frequency and CADR index during the fine dust removal experiments.

2. Basic Theory

2.1. Corona Discharge

A corona discharge is a gas discharge, which is a type of preceding discharge in a non-uniform electric field. In other words, before reaching the final form of discharge, such as arc discharge and spark discharge, the peripheral gas is ionized locally only in the concentrated region (1–100 μA) to form a plasma and emit light. Such a discharge pattern is called a corona discharge. Figure 2 illustrates the discharge phenomenon.
When the voltage is increased in the glow discharge state, the plasma is continuously conducted from the cathode of the electrode to the anode in an arc shape, which is arc discharge which is the final form of gas discharge. The spark discharge is a monotonic property that occurs instantaneously, other than arc discharge [11].

2.2. The Principle of Fine Dust Removal

A corona discharge is an electrical discharge caused by the ionization of a fluid, such as air, surrounding a charged conductor. Spontaneous corona discharges occur naturally in high-voltage systems. A corona discharge will occur when the electric field around a conductor is high enough to form a conductive region but not high enough to cause electrical breakdown or arcing to nearby objects [12,13,14,15]. The discharge is often seen as a bluish glow in the air adjacent to pointed metal conductors carrying high voltages and emits light through the same property as a gas discharge lamp (Figure 3).
The electrostatic precipitator is a dust collecting device that removes fine dust by attracting various dust particles contained in the air just like Figure 4. Corona discharge occurs when a high voltage is applied between the (+) and (−) poles. The moment this occurs, charged ions are generated. (−) Charged ions combine with the dust particles in the incoming air (−) making the dust migrate to the (+) pole attached to the electrostatic precipitator. This principle makes it easy to remove various kinds of fine dust particles [16,17].

3. Methodology

3.1. An Overview of Proposed Fine Dust Removal System

Figure 5 shows the entire system. A high voltage of 20–25 kV can be obtained through several power conversions, which can generate a corona discharge.

3.2. Components of Fine Dust Removal System

3.2.1. Half Bridge Inverter

A half-bridge inverter (Figure 6) is divided in half by the input voltage and connected alternately to the load via two switches. Therefore, the half bridge inverter requires two MOSFET or IGBT. Two capacitors with the same capacitance are used to divide the input voltage in half. The switches, S1 and S2, of the single-phase half-bridge inverters are turned on alternately and the output voltage is determined by the switching states. When S1 is ON, the output voltage is +Vdc/2, whereas when S2 is ON, the output voltage is −Vdc/2 [18]:
V o ( t ) = { Vdc 2 Vdc 2 ( S 1   ON ,   S 2   OFF ,   0 t T 2 ) ( S 2   ON ,   S 1   OFF , T 2 t T )
If switches of S1 and S2 are ON at the same time, the input power is shorted, so switches of S1 and S2 should not be ON at the same time. Accordingly, switches S1 and S2 are turned on alternately, and the output voltage alternates between +Vdc/2 and −Vdc/2.
If the half bridge inverter load is RL (resister and inductor), in order to get the load current at the positive half period (S1 turn ON, S2 turn OFF), the voltage of RL is obtained the half of the input dc voltage. ( V dc 2 ) If KVL (Kirchhoff’s Law) is used for the RL circuit. The differential equation for the closed circuit is as follows [19,20]:
V 1 = L di o dt + Ri o
Using the Laplace transform, the equation can be expressed as:
V 1 S = sLI o ( s ) LI o ( 0 ) + RI o ( s )
I o (s) can be expressed using Equation (3):
I o ( S ) = V 1 s ( sL + R ) + Li o ( 0 ) sL + R = V 1 R ( 1 s 1 s + R L ) + i o ( 0 ) s + R L
Using the Equation (4), the Laplace inverse transform can be expressed as i o (t):
i o ( t ) = V 1 R V 1 R e R L t + i o ( 0 ) e R L t
If the time constant, τ = L R at t = 0, and i o ( 0 ) = I o , then i o ( t ) is can be expressed as Equation (6):
i o ( t ) = V 1 R ( 1 e t τ ) I o e t τ
The switching frequency is f, so it can express T = 1 f . When t = T 2 , I o ( t = T 2 ) = I o :
I o = V 1 R ( 1 e T 2 τ ) I o e T 2 τ
I o can be expressed using Equation (7):
I o = V 1 R · 1 e T 2 τ 1 + e T 2 τ
Using the Equation (6), i o ( t ) can be expressed at 0 t T 2 :
i o ( t ) = V 1 R ( 1 e t τ ) V 1 R · 1 e T 2 τ 1 + e T 2 τ e t τ
Under the (S1 OFF, S2 OFF) condition, V dc 2 = V 1 . Equation (10) can be derived from Equation (2):
V 1 = L di o dt + Ri o
In the same way, i o ( t ) can be found at T 2 < t < T . In addition, Equation (11) can be derived:
i o ( t ) = V 1 R ( 1 e t T 2 τ ) + V 1 R · 1 e T 2 τ 1 + e T 2 τ e t T 2 τ
Figure 7 shows the current flow according to switch ON/OFF state and input/output voltage.

3.2.2. Step-Up Transformer

The EI (E type and I type core) core transformer is used in this experiment. Ferrites are used as high permeability materials from low frequency to hundreds of MHz. Therefore, it is the most suitable in terms of economics and efficiency in the step-up transformer design (Table 3) [21].

3.2.3. Cockcroft Walton Circuit

The Cockcroft Walton circuit (Figure 8) involves the stacking of N number of rectifiers and capacitors (Figure 8, N = 8). If no load is applied, a DC voltage of n times of the secondary voltage peak value of the transformer can be generated. Using this principle, a DC high voltage, such as 20–25 kV, can be obtained. Corona discharge occurs using the proper DC high voltage. The generated corona discharge can remove various kinds of fine dust quickly [22]:
Eout = N × Eac ( peak   value )

3.2.4. Corona Discharge Electrodes

Figure 9 shows the basic electrode shape (a) and the newly proposed electrode shape (b). Shape (b) is designed to reduce the fine dust removal time and the electrode hole size:
η = 1 exp ( w A Q )
Equation (13) is indicating the fine dust removal efficiency. A is the dust collection area (m2), W is particle movement speed (m/s), Q is gas flow rate (m3/s) [23].
Figure 10 shows the different hole sizes of the (A)–(E) electrodes: (A) is 0 cm in diameter; (B) is 0.4 cm in diameter; (C) is 0.3 cm in diameter; (D) is 0.2 cm in diameter; and (E) is 0.1 cm in diameter. The fine dust removal time can be checked using the (A)–(E) electrodes.

4. Performance Evaluation Using CADR

CADR is air cleanliness performance index set by the American Association of Home Appliance Manufacturers (AHAM). The CADR index is evaluated by measuring the number of particles in the sealed chamber. The number of particles in the closed chamber decreases exponentially and can be obtained using Equations (14)–(17) [24]:
C t = C i × e Kt
e Kt = C t C i
ln [ C t C i ] = Kt
K = 1 t × ln [ C t C i ]
Ct is the number of particles after t minutes, Ci is the initial number of particles, K is the attenuation constant, and t is the time. The particle attenuation ratio can be obtained using Equation (17). By substituting in Equation (18), the CADR index can be obtained the particle attenuation constant Ke and the natural attenuation constant Ki:
CADR = V   ( K e K i )

5. Experimental Setup

The experimental setup is shown in Figure 11 and Figure 12. For each experiment an acrylic box is filled with smoke using a cigarette. The acrylic box was sealed so that no outside air could pass through. After sealing, cigarette smoke was injected through a small gas inlet. After the injection, the gas inlet is tightly sealed through the stopper, and the preparation for the experiment is finished. To test the numerical values more precisely, this experiment is performed by a JSM-100 (fine dust measuring instrument, made by Korea, company name: Inparo). Table 4 shows the specifications of the JSM-100, which has sharp optical dust sensors with internal infrared diodes and diagonally arranged phototransistors. Light emitting diodes project light and the phototransistors detect the dark areas due to the passage of fine dust particles. In addition to this function, the presence of smoke or dust can be checked by the output pulse pattern. Fine dust sensors can measure up to 2.5   μ m particles.

6. Results and Discussion

6.1. Analysis of the CADR Index

This experiment is conducted on cigarette smoke to confirm the effectiveness of the proposed D electrode. The particle attenuation ratio was obtained using Equation (17). For the initial concentration of 500   μ m/m3, the initial attenuation is reduced to less than 30% after 60 min. On the other hand, 98% of particles decrease after 25 min after operation of the air cleaning system. The particle attenuation constant Ke (0.1564809) and the natural attenuation constant Ki (0.0037) are obtained by this experiment with this air cleaning system. By substituting in Equation (18), the CADR index can be obtained. The volume V is (4150 mm × 4330 mm × 2900 mm). The test is performed into the center of the height of 1400 mm. The following experimental results of CADR index is about 480 m3/h. To obtain a more accurate CADR index, further experiments are required in a place larger than this experimental volume.

6.2. Analysis of Changes in Air Pollution Status

The removal times of smoke, fine dust, HCHO, and TVOC were measured using the JSM-100 system. If using the instrument for a long time, odors and gases may accumulate in the instrument and affect the measurement/test result. In order to calibrate it, after the first experiment, we turn on the detector and check it in a well-ventilated place for more than one hour. Thereafter, additional experiments were repeated. In addition, the removal times were compared according to the hole size. First, the removal time of smoke, which contains large dust particles, was examined. The optimal switching frequency was determined and the optimal conditions of the other experiments were also demonstrated.
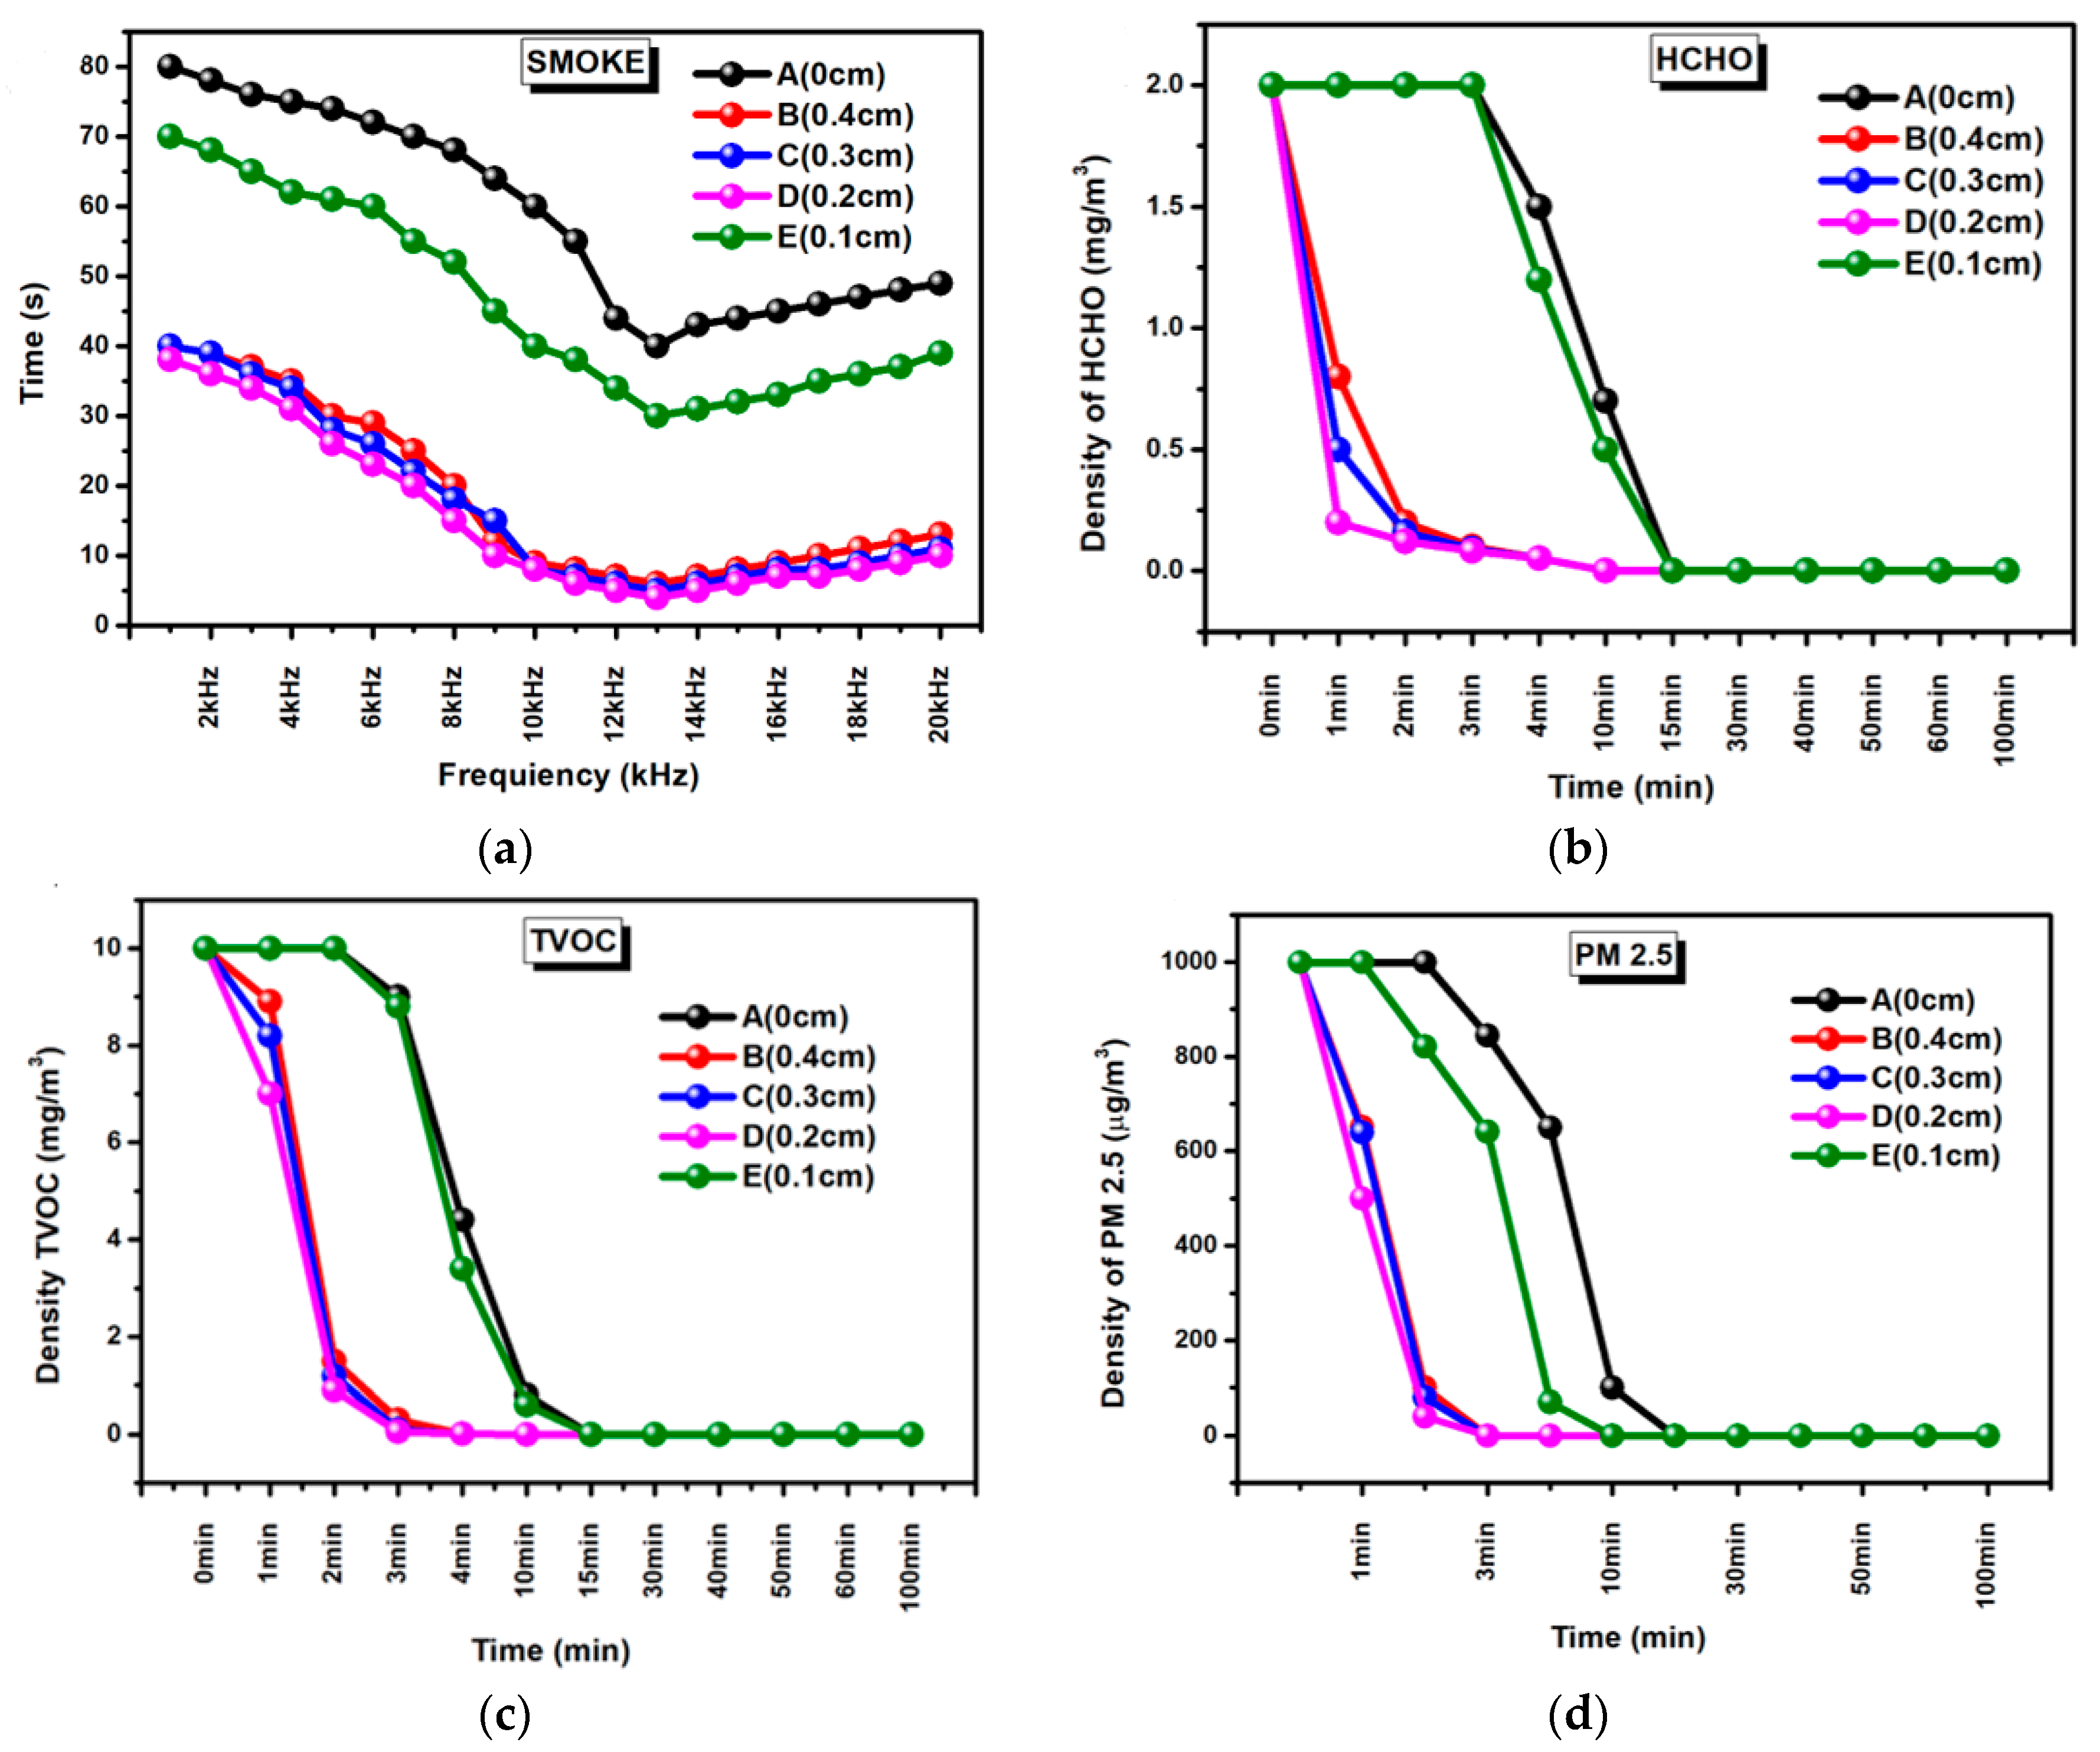
As shown in 
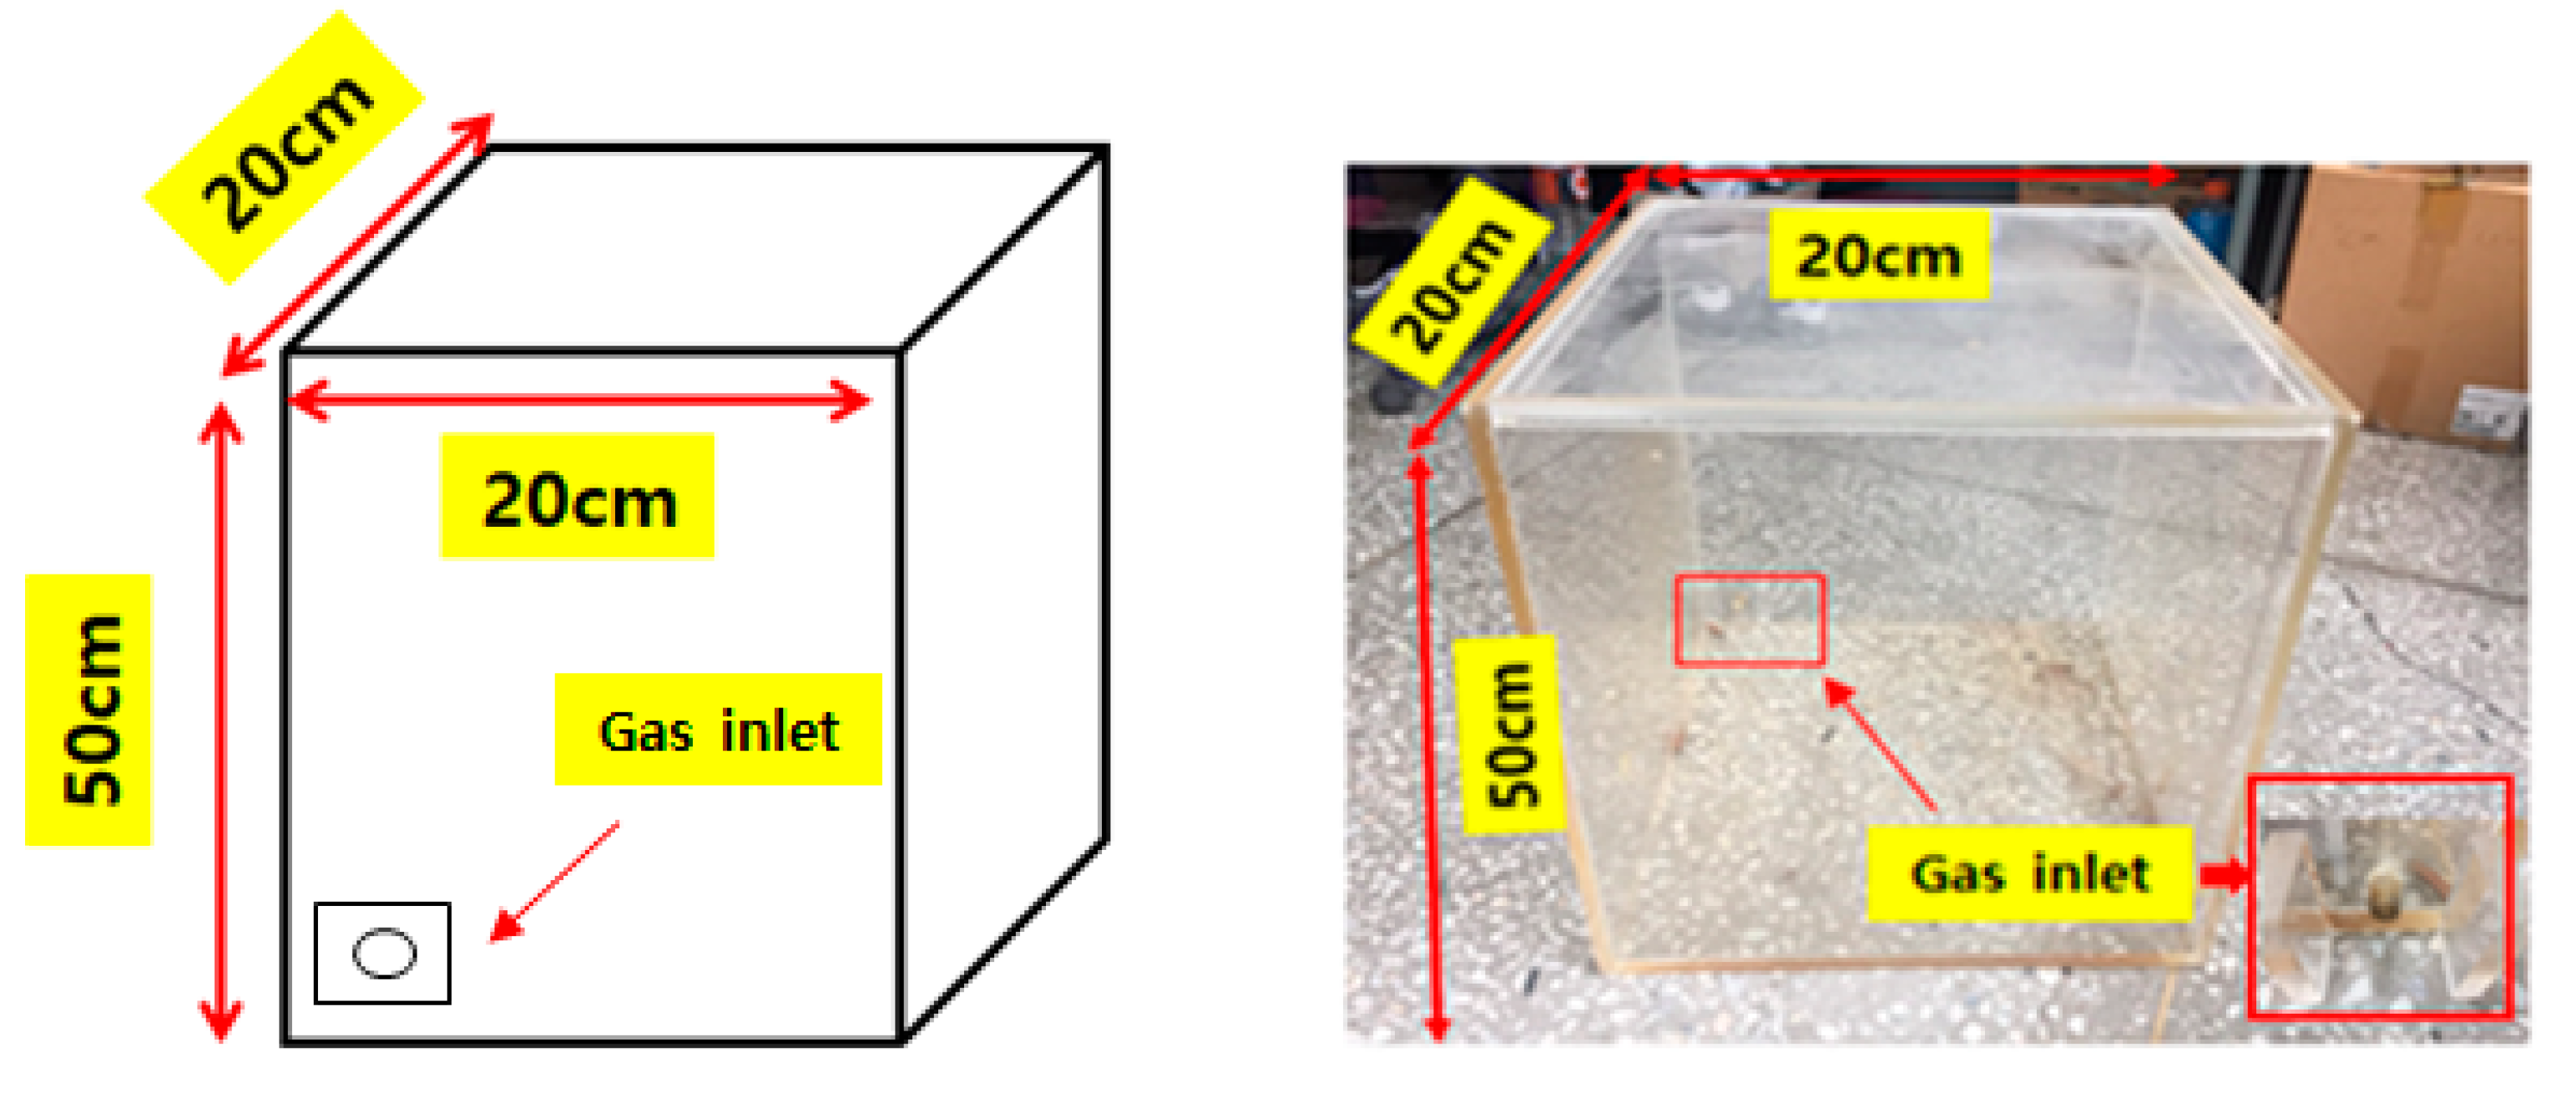
Figure 13a, electrodes (A)–(E) are the fastest at the switching frequency of 13 kHz in removing smoke. The experiments of HCHO, TVOC, and PM2.5 (particle material) are also performed with the switching frequency of 13 kHz in the (20 cm × 20 cm × 50 cm) acrylic box with the input DC voltage of 30 V.
Formaldehyde (HCHO) is a flammable colorless gas that has a long-lasting, irritating odor with adverse effects on the human body, such as headache/amnesia and emotional disturbances. If the HCHO density value is large than 0.30 mg/m3, the present air is not good.
Referring to Figure 13b, the data are derived by comparing with electrodes (A)–(E). Electrode (A) showed the fastest purging. The air is purified within 3 min by the (D), (B), (C), whereas, more than 6 min is needed in case of using electrodes (A) and (E).
TVOC is a precursor of photochemical reaction and means harmful substance to the human body/environment by generating secondary pollutants, such as ozone and aldehydes. The experimental results show that it takes approximately 4 min for (D), (C), (B) models. However, it takes 7 min for (A), (C) models shown in Figure 13c.
If the PM2.5 concentration is greater than 101 μ g/m3, the present air is not clean. The experimental results show that electrode (D) cleans the fine dust within almost 2 min. And electrodes (B) and (C) clean almost the same time (3 min) but electrode (C) cleans a little faster than electrode (B). On the other hand, the electrodes (A) and (D) clean the fine dust more than 6 min as shown in Figure 13d.
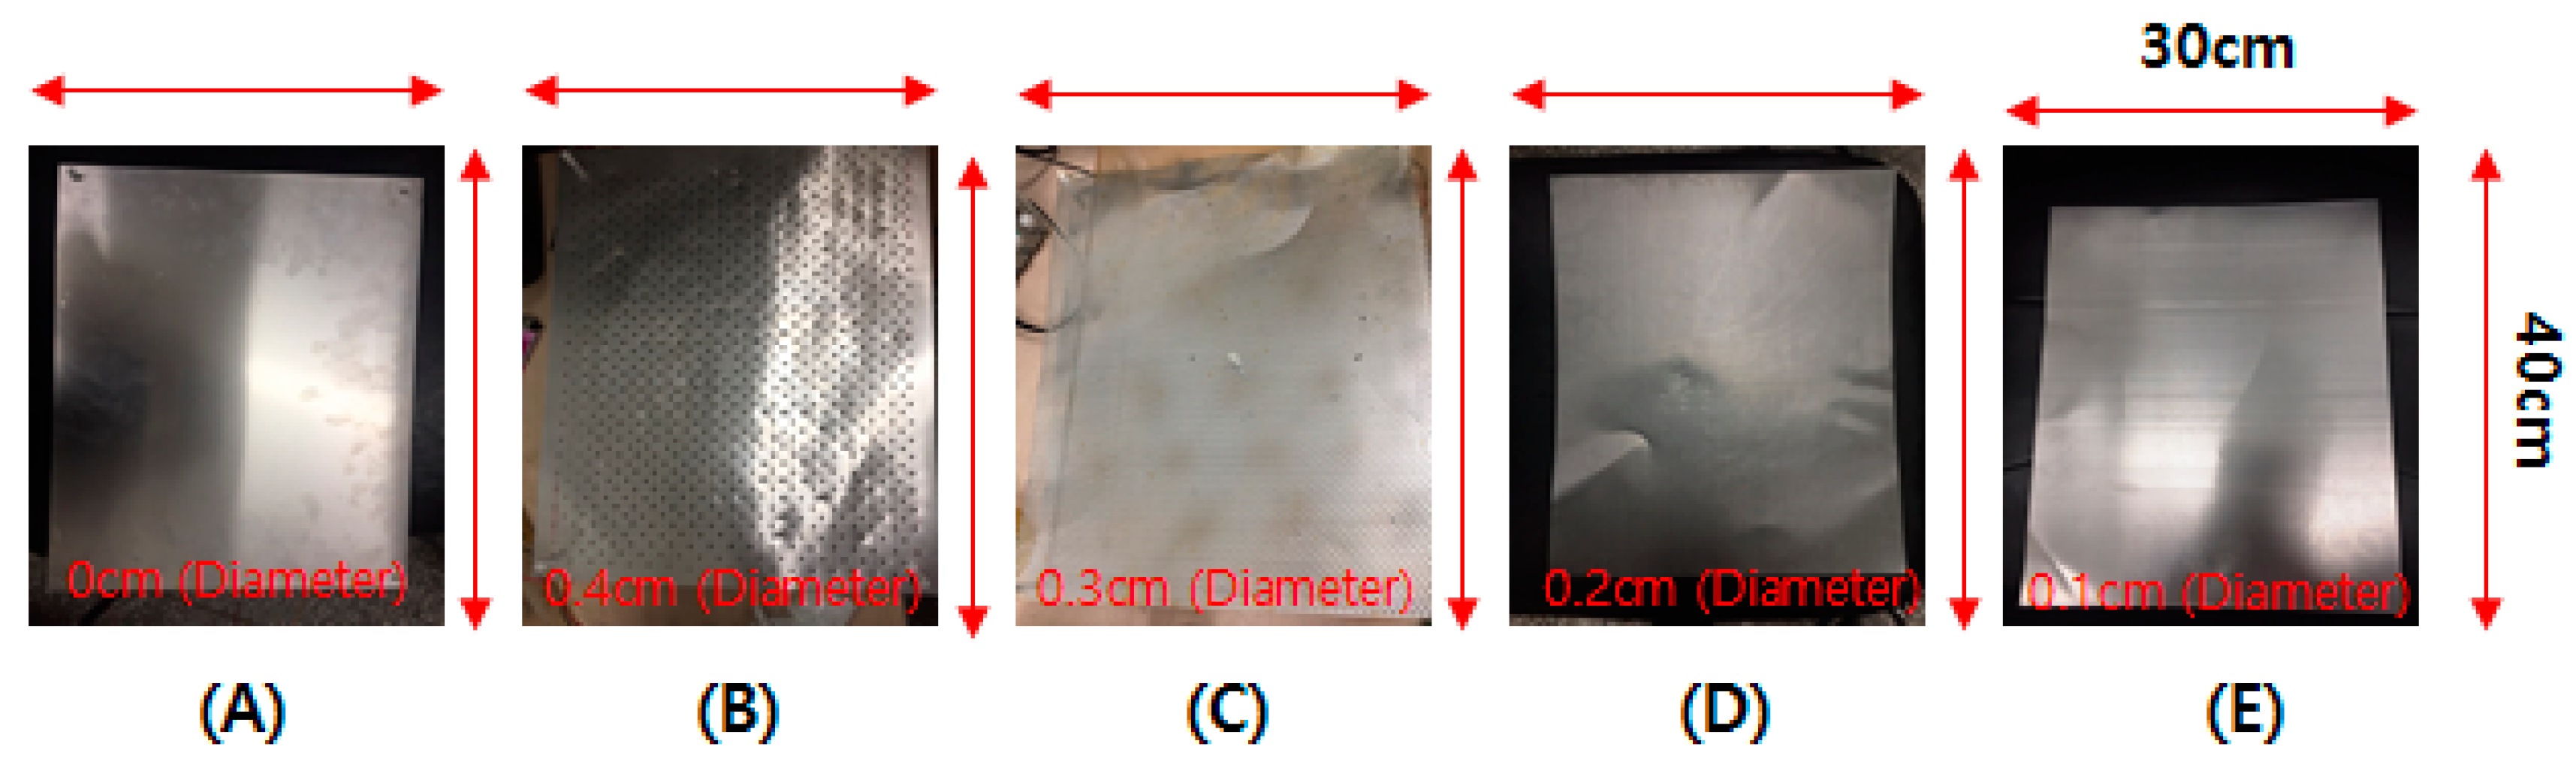
Electrode (D) shows the excellent results under all the conditions. Referring to Equation (13), it can be seen that the larger the area of the electrode, the greater the ability to remove fine dust. However, the experiment with the largest area electrode (A) showed the worst result. Because the faster of the moving speed of gas, the higher the efficiency of dust collection. In case of electrode (A), the electrode area is the largest, but the movement speed of gas is the lowest, so the fine dust cannot be removed quickly. By adopting holes on the electrode surface, the gas is easily moved through the holes and the removal speed is increased due to the smooth movement. Based on these experimental results, it is confirmed that the gas motion speed can be controlled by the diameter of hole. In the case of too large a hole, the discharge area is narrow and it isn’t effective. On the contrary, in the case of too small a hole, the gas motion speed is slow and doesn’t give good results. From these experiments, we know that the diameter of 0.2 cm has the best fine dust removal quality. In the near future, it will be necessary to carry out the comparative experiment using a larger size electrode for practical industrial use.

6.3. Data Sets and Standard Deviation

Table 5, Table 6, Table 7 and Table 8, is data sets and standard deviation. The standard deviation was obtained by using the experimental data. The standard deviation data shows that electrode (D) is the least deviating in all data. Also, referring to Figure 13, it can be seen that electrode (A) has the lowest removal rate and the standard deviation also has the largest deviation in the whole experiment. Except for the optimum frequency experiment of Smoke, the standard deviation is (D) < (C) < (B) < (E) < (A) (removal time). In the case of the smoke experiment, the standard deviation is recorded in the order of (D) < (B) < (C) < (E) < (A) (removal time). The smoke removal experiment is to find the optimum frequency. Therefore, the closer to the optimum frequency, the faster the removal. There is not much difference in voltage when it goes away from the optimum frequency. The electrode (B) model was recorded as low when viewed only by the deviation of the electrode (C) model and the electrode (B) model. However, when comparing electrodes (B) and (C) only for each removal time, electrode (C) shows a quick removal time as a whole.

7. Conclusions

Fine dust is a large problem in modern society. This paper proposed a method for removing fine dust using a corona discharge. The optimal hole diameter of the electrode was determined. When the hole was too large, the discharge area was narrow, making it ineffective. On the other hand, when the hole was too small, the gas motion speed is slow and the result was poor. A hole diameter of 0.2 cm was found to be optimum for achieving the best fine dust removal quality. The hole diameter also affected the removal time of HCHO and TVOC.

Author Contributions

H.-J.K. and D.-H.K. conceptualize the idea of this research project. H.-J.K. developed a successful proposal to the funding body. D.-H.K., M.-S.K., M.A.K. discussed the electrodes of size. The electrodes and corona discharger circuit fabrication and integration of the experimental setup was mostly carried out by D.-H.K. and M.-S.K., under the supervision of H.-J.K. Paper was written by D.-H.K. and H.-J.K.

Funding

This research was funded and conducted under the Competency Development Program for Industry Specialists of the Korean Ministry of Trade, Industry and Energy (MOTIE), operated by Korea Institute for Advancement of Technology (KIAT). (No. N0001126, HDR program for Industrial convergence/connected for creative robot human resource development) and BK21 program. In addition, we thank so much for the supporting funds of Doosan-Yonkang Foundation.

Conflicts of Interest

The authors declare no conflict of interest.

Nomenclature

HCHOHydrogen Carbon Hydrogen Oxygen (Formaldehyde)
TVOCTotal Volatile Organic Compounds
PMparticulate matter
CADRClean Air Delivery Rate
AHAMAmerican Association of Home Appliance Manufacturers
COCarbon Monoxide
CO2Carbon Dioxide
NO2Nitrogen Dioxide

References

  1. Hu, X.; Zhang, J.-J.; Mukhnahallipatna, S.; Hamann, J.; Biggs, M.J.; Agarwal, P. Transformations and destruction of nitrogen oxides—NO, NO2 and N2O—In a pulsed corona discharge reactor. Fuel 2003, 82, 1675–1684. [Google Scholar] [CrossRef]
  2. Beckers, F.J.C.M.; Hoeben, W.F.L.M.; Pemen, A.J.M.; Heesch, E.J.M. Low level NOx removal in ambient air by pulsed corona technology. J. Phys. D Appl. Phys. 2013, 46, 29. [Google Scholar] [CrossRef]
  3. Cristina, S.; Feliziani, M. Calculation of ionized fields in DC electrostatic precipitators in the presence of dust and electric wind. In Proceedings of the Conference Record of the 1991 IEEE Industry Applications Society Annual Meeting, Dearborn, MI, USA, 28 September–4 October 1991; pp. 616–621. [Google Scholar]
  4. Ailshire, J.A.; Clarke, P. Fine particulate matter air pollution and cognitive function among U.S. older adults. J. Gerontol. Ser. B Psychol. Sci. Soc. Sci. 2014, 70, 322–328. [Google Scholar] [CrossRef] [PubMed]
  5. Wang, C.-S. Electrostatic Forces in Fibrous Filters—A Review. Powder Technol. 2001, 118, 166–170. [Google Scholar] [CrossRef]
  6. Tokarek, S.; Bernis, A. An Exemple of Particle Concentration Reduction in Parisian Subway Stations by Electrostatic Precipitation. Environ. Technol. 2006, 27, 1279–1287. [Google Scholar] [CrossRef] [PubMed]
  7. Kim, S.-W.; Park, J.-W.; Joung, J.-H.; Chung, H.-J.; Choi, J.-Y.; Kim, H.-J. A Study on the Smoke Removal Characteristics of the ESP Adopting Resonant dc-dc Converter. KIEE Int. Trans. Electrophys. Appl. 2004, 4, 193–200. [Google Scholar]
  8. Chang, S.; Jeong, K. A Mobile Application for Fine Dust Monitoring System. In Proceedings of the 2017 18th IEEE International Conference on Mobile Data Management (MDM), Daejeon, Korea, 29 May–1 June 2017; pp. 336–339. [Google Scholar]
  9. Lu, Z.; Yong, Y. On-line size measurement of fine dust through digital imaging. In Proceedings of the 2015 IEEE 3rd International Conference on Smart Instrumentation, Measurement and Applications (ICSIMA), Kuala Lumpur, Malaysia, 24–25 November 2015. [Google Scholar]
  10. Jang, J.H.; Kun, L.; Jo, Y.M. Fine dust control by HVAC in Seoul metro subway. In Proceedings of the 2009 ICCAS-SICE, Fukuoka, Japan, 18–21 August 2009; pp. 1703–1706. [Google Scholar]
  11. Munir, Z.A.; Anselmi-Tamburini, U.; Ohyanagi, M. The effect of electric field and pressure on the synthesis and consolidation of materials: A review of the spark plasma sintering method. J. Mater. Sci. 2006, 41, 763–777. [Google Scholar] [CrossRef]
  12. Animals See Power Lines as Glowing, Flashing Bands, Research Reveals. Available online: https://www.theguardian.com/environment/2014/mar/12/animals-powerlines-sky-wildlife (accessed on 24 July 2018).
  13. Vishay Offers C-stability in X2 Capacitors. CapacitorIndustry.com, 14 June 2012. Available online: http://sciencewise.info/resource/Corona_discharge/Corona_discharge_by_Wikipedia (accessed on 24 July 2018).
  14. Xia, L.; Huang, L.; Shu, X.; Zhang, R.; Dong, W.; Hou, H. Removal of ammonia from gas streams with dielectric barrier discharge plasmas. J. Hazard. Mater. 2008, 152, 113–119. [Google Scholar] [CrossRef] [PubMed]
  15. Hoeben, W.F.L.M.; Beckers, F.J.C.M.; Pemen, A.J.M.; van Heesch, E.J.M.; Kling, W.L. Oxidative degradation of toluene and limonene in air by pulsed corona technology. J. Phys. D Appl. Phys. 2012, 45, 1–14. [Google Scholar] [CrossRef]
  16. Penetrante, B.M.; Bardsley, J.N.; Hsiao, M.C. Kinetic analysis of non-thermal plasmas used for pollution control. Jpn. J. Appl. Phys. 1997, 36, 5007–5017. [Google Scholar] [CrossRef]
  17. Brocilo, D.; Chang, J.S.; Findlay, R.D.; Kawada, Y.; Ito, T. Using a commercial partial discharge detector to investigate ac corona in air. In Proceedings of the 2001 Annual Report Conference on Electrical Insulation and Dielectric Phenomena, Kitchener, ON, Canada, 14–17 October 2001. [Google Scholar]
  18. Meade, T.; O’Sullivan, D.; Foley, R.; Achimescu, C.; Egan, M.; McCloskey, P. Parasitic inductance effect on switching losses for a high frequency dc-dc converter. In Proceedings of the 2008 Twenty-Third Annual IEEE Applied Power Electronics Conference and Exposition, Austin, TX, USA, 24–28 February 2008. [Google Scholar] [CrossRef]
  19. Choi, B.; Lim, W.; Bang, S.; Choi, S. Small-signal analysis and control design of asymmetrical half-bridge DC-DC converters. IEEE Trans. Ind. Electron. 2006, 53, 511–520. [Google Scholar] [CrossRef]
  20. Sathishkumar, P.; Himanshu; Piao, S.; Khan, M.A.; Kim, D.-H.; Kim, M.-S.; Jeong, D.-K.; Lee, C.; Kim, H.-J. A Blended SPS-ESPS Control DAB-IBDC Converter for a Standalone Solar Power System. Energies 2017, 10, 1431. [Google Scholar] [CrossRef]
  21. Kliger, R. Integrated transformer-coupled isolation. IEEE Instrum. Meas. Mag. 2003, 6, 16–19. [Google Scholar] [CrossRef]
  22. Zheng, Y.; Zhang, B.; He, J. Current-voltage characteristics of dc corona discharges in air between coaxial cylinders. Phys. Plasmas 2015, 22, 023501. [Google Scholar] [CrossRef]
  23. Gutsol, K.; Nunnally, T.; Rabinovich, A.; Fridman, A.; Starikovskiy, A.; Gutsol, A.; Kemoun, A. Plasma assisted dissociation of hydrogen sulfide. Int. J. Hydrogen Energy 2012, 37, 1335–1347. [Google Scholar] [CrossRef]
  24. Association of Home Appliance Manufacturers. Available online: https://www.aham.org/ (accessed on 24 July 2018).
Figure 1. Fine dust component.
Energies 11 01956 g001
Figure 2. Discharge phenomenon.
Energies 11 01956 g002
Figure 3. Corona discharger. (a) glow; (b) spark; (c) arc.
Energies 11 01956 g003
Figure 4. The method to get rid of fine dust.
Energies 11 01956 g004
Figure 5. Design of the fine dust removal system.
Energies 11 01956 g005
Figure 6. Half bridge inverter with gate driver and using DSP chip (F28335) for PWM generator and DC-DC converter for gate driver.
Energies 11 01956 g006
Figure 7. Mode 1 (S1 ON, S2 OFF, V o >   0 , I o >   0 ), Mode 2 (S1 OFF, S2 ON, V o <   0 , I o >   0 ), Mode 3 (S1 OFF, S2 ON, V o <   0 , I o <   0 ), Mode 4 (S1 ON, S2 OFF, V o >   0 , I o <   0 ).
Energies 11 01956 g007
Figure 8. Cockcroft Walton circuit and transformer.
Energies 11 01956 g008
Figure 9. (a) The basic electrode shape; (b) The newly proposed electrode shape.
Energies 11 01956 g009
Figure 10. Proposed aluminum circular hole electrodes (A)–(E).
Energies 11 01956 g010
Figure 11. Fine dust removal system.
Energies 11 01956 g011
Figure 12. Acrylic box (20 cm × 20 cm × 50 cm).
Energies 11 01956 g012
Figure 13. (a) Smoke (cigarette) removing time versus switching frequency; (b) HCHO purification time; (c) TVOC purification time; (d) fine dust purification time.
Energies 11 01956 g013
Table 1. Air pollutants and their health effects.
PollutantHealth Effect
Inorganic PollutantsDustPneumoconiosis
COOrganization Asphyxia
CO2Dyspnoea, Death
NO2Bronchitis, Asthma
FiberLung Cancer
Radon
Organic PollutantsTVOCHematosis Nerve Skin Disability, Carcinogenic Potency
HCHOVomit, Diarrhea, Dyspnoea
Bio-contaminantsVirusAtopic Dermatitis, Flu
Tick
Table 2. State of air pollution.
Air PollutionGoodBadVery Bad
fine dust0–0.15 μ g/m316–100 μ g/m3Greater than 101 μ g/m3
TVOCLess than 0.3 mg/m30.3–2.5 mg/m3Greater than 2.5 mg/m3
HCHOLess than 0.10 mg/m30.10–0.30 mg/m3Greater than 0.30 mg/m3
Table 3. Transformer specification.
Step-Up Transformer
CoreFerrite
Turns Ratio76
Primary Voltage15–35 V
Secondary Voltage1140–2260 V
Frequency10–20 kHz
Table 4. The specification of JSM-100.
HCHO/TVOCPM1/PM2.5/PM10
MetricsHCHO and TVOCParticle diameter test1   μ m/2.5   μ m/10   μ m
Measuring range0–1.999 mg/m3 (HCHO)Detection modeDensity (per liter)
-0–9.999 mg/m3 (TVOC)Detection range0–999   μ g/m3
Sample ModeDiffusion type--
Density unitmg/m3--
Table 5. Smoke (Data sets and standard deviation).
Smoke
FrequencyRemoval Time (s)
(A)(B)(C)(D)(E)
1 kHz8040403870
2 kHz7839393668
3 kHz7637363465
4 kHz7535343162
5 kHz7430282661
6 kHz7229262360
7 kHz7025222055
8 kHz6820181552
9 kHz6412151045
10 kHz6098840
11 kHz5587638
12 kHz4476534
13 kHz4065430
14 kHz4376531
15 kHz4487632
16 kHz4598733
17 kHz46108735
18 kHz47119836
19 kHz481210937
20 kHz4913111039
standard deviation14.1082312.2443312.2958111.6727313.87263
Table 6. Fine dust (Data sets and standard deviation).
TimePM2.5 ( μ g/m3 )
(A)(B)(C)(D)(E)
0 min999999999999999
1 min999651640500999
2 min9991008040821
3 min8440.040.020.02641
4 min6500.020.020.0270
10 min1000.020.020.020.05
15 min0.060.020.020.020.02
30 min0.020.020.020.020.02
40 min0.020.020.020.020.02
50 min0.020.020.020.020.02
60 min0.020.020.020.020.02
100 min0.020.020.020.020.02
standard deviation465.3715327.044325.814309.2775431.4158
Table 7. TVOC (Data sets and standard deviation).
TimeTVOC (mg/m3)
(A)(B)(C)(D)(E)
0 min9.9999.9999.9999.9999.999
1 min9.9998.98.279.999
2 min9.9991.51.20.99.999
3 min90.30.10.058.8
4 min4.40.010.010.013.4
10 min0.80.0010.00010.00010.6
15 min0.0010.0010.00010.00010.001
30 min0.0010.0010.00010.00010.001
40 min0.0010.0010.00010.00010.001
50 min0.0010.0010.00010.00010.001
60 min0.0010.0010.00010.00010.001
100 min0.0010.0010.00010.00010.001
standard deviation4.652613.6402723.528473.3427454.638037
Table 8. HCHO (Data sets and standard deviation).
TimeHCHO (mg/m3)
(A)(B)(C)(D)(E)
0 min1.9991.9991.9991.9991.999
1 min1.9990.80.50.21.999
2 min1.9990.20.160.121.999
3 min1.9990.10.0910.0811.999
4 min1.50.0510.0520.0511.2
10 min0.70.0010.0010.0010.5
15 min0.0010.0010.0010.0010.001
30 min0.0010.0010.0010.0010.001
40 min0.0010.0010.0010.0010.001
50 min0.0010.0010.0010.0010.001
60 min0.0010.0010.0010.0010.001
100 min0.0010.0010.0010.0010.001
Standard deviation0.9558720.5922270.5740650.5685780.945321

