Article

Experimental and Theoretical Study on the Cooling Performance of a CO2 Mobile Air Conditioning System

1
School of Mechanical Engineering, Shanghai Jiaotong University, Shanghai, 200240, China
2
Shanghai High Efficient Cooling System Research Center, Shanghai, 200240, China
*
Author to whom correspondence should be addressed.
Energies 2018, 11(8), 1927; https://doi.org/10.3390/en11081927
Submission received: 26 April 2018 / Revised: 31 May 2018 / Accepted: 5 June 2018 / Published: 24 July 2018
(This article belongs to the Section D: Energy Storage and Application)

Abstract

:
CO2 (GWP = 1) is considered as a promising natural alternative refrigerant to HFC-134a in mobile air conditioning (MAC) applications. The objective of this study is to investigate the cooling performance characteristics of a CO2 MAC system. A prototype CO2 MAC system, consisting of a CO2 electrical compressor, CO2 parallel flow microchannel heat exchangers, and an electrical expansion valve, was developed and tested. Factor analysis experiments were conducted to reveal the effect of outdoor temperature on the cooling performance of this CO2 MAC system. Compared with a conventional R134a MAC system, the prototype CO2 MAC system achieved comparable cooling capacity, but had COP reductions of 26% and 10% at 27 °C and 45 °C outdoor conditions, respectively. In addition, based on refrigerant properties, theoretical cycle analysis was done to reveal the impact of evaporator, gas cooler and compressor, on the system cooling performance. It is concluded that the increase of overall compressor efficiency or the decrease of gas cooler approaching temperature could greatly improve the COP of this CO2 MAC system.

1. Introduction

As a countermeasure against global warming, the international treaty of the Kigali Amendment to the Montreal Protocol for HFC reduction will be binding on all 197 countries starting 2019, and national regulations in the EU, Japan and the USA are phasing out the use of HFC-134a (GWP = 1430) in mobile air conditioning (MAC) systems [1]. The natural refrigerant CO2 (GWP = 1), which offers no toxicity, no flammability, no harmful influence on the environment, high volumetric capacity and better heat transfer properties, is considered a promising alternative to HFC-134a in MAC applications [2,3,4]. The European automotive manufacturer Daimler-Benz has announced that CO2 MAC systems will be offered worldwide for the first time in its S-Class and E-Class series production vehicles [5]. In addition, the physical properties of CO2 pose potential advantages for heat pump application and low ambient temperature operation [6]. The power consumption for cabin heating in electrical vehicles significantly affects the driving range, resulting in a range reduction of up to 50% for considered cases in cold climate conditions [7]. For these applications remarkable developments have been achieved in recent years with thermoacoustic refrigerators [8], and the use of CO2 as a refrigerant becomes more attractive in mobile heat pump system applications to improve heating efficiency and extend the driving range of electrical vehicles [9,10,11], and to reduce the noise pollution typical of vehicles [12].
In recent years, several research projects on the applications of refrigeration machines, heat pumps and their component have been described in the literature [13], and several studies have focused on CO2 MAC components and systems. Kim and Jin et al. [14,15] developed models to predict the performance of a mobile CO2 micro-channel evaporator, and the estimated heat transfer and pressure drop results were verified by experimental data. Kim et al. [16] studied the effects of operating parameters on the cooling performance of a CO2 automotive air conditioning system and concluded that the CO2 refrigerant system exhibited good performance. The results of comparative experiments [17,18] demonstrated that the COP of a CO2 air conditioning system was much higher than that of HFC-R134a for 90% air conditioning (AC) operation, and the COP was lower only in the 10% usage at high ambient temperature (above 30 °C). Brown et al. [19] evaluated the performance merits of CO2 and R134a automotive air conditioning systems using vapor compression and transcritical cycle simulation models and considered a current-production configuration for the R134a and CO2 system. The results from simulation models showed that the COP of CO2 was lower by 21% at 32.2 °C and by 34% at 48.9 °C. The COP reduction was even greater at higher speeds and ambient temperatures. The study also found that large entropy generation in the gas cooler was the primary cause for the lower COP of CO2.
However, although serpentine type CO2 evaporators and mechanical belt-driven compressors were used in previous comparative research, there is limited data available on the CO2 MAC system with state-of-the-art components, such as parallel flow microchannel heat exchangers and electrical compressors. Besides, the efficiency of key component is of significance to improve system performance, which has not been clearly investigated for CO2 MAC systems. The purpose of this paper is to compare the steady-state performance of MAC systems operating with CO2 and R134a, and evaluate the impact of key components on improving the COP of CO2 MAC systems. A prototype CO2 MAC system consisting of a CO2 electrical compressor, CO2 parallel flow microchannel heat exchangers, and an electrical expansion valve (EXV) was developed and tested. Comparison experiments were carried out with CO2 and R134a MAC systems under various outdoor temperature conditions. Besides, theoretical cycle analyses were done to reveal the impact of evaporator, gas cooler and compressor, on the system cooling performance.

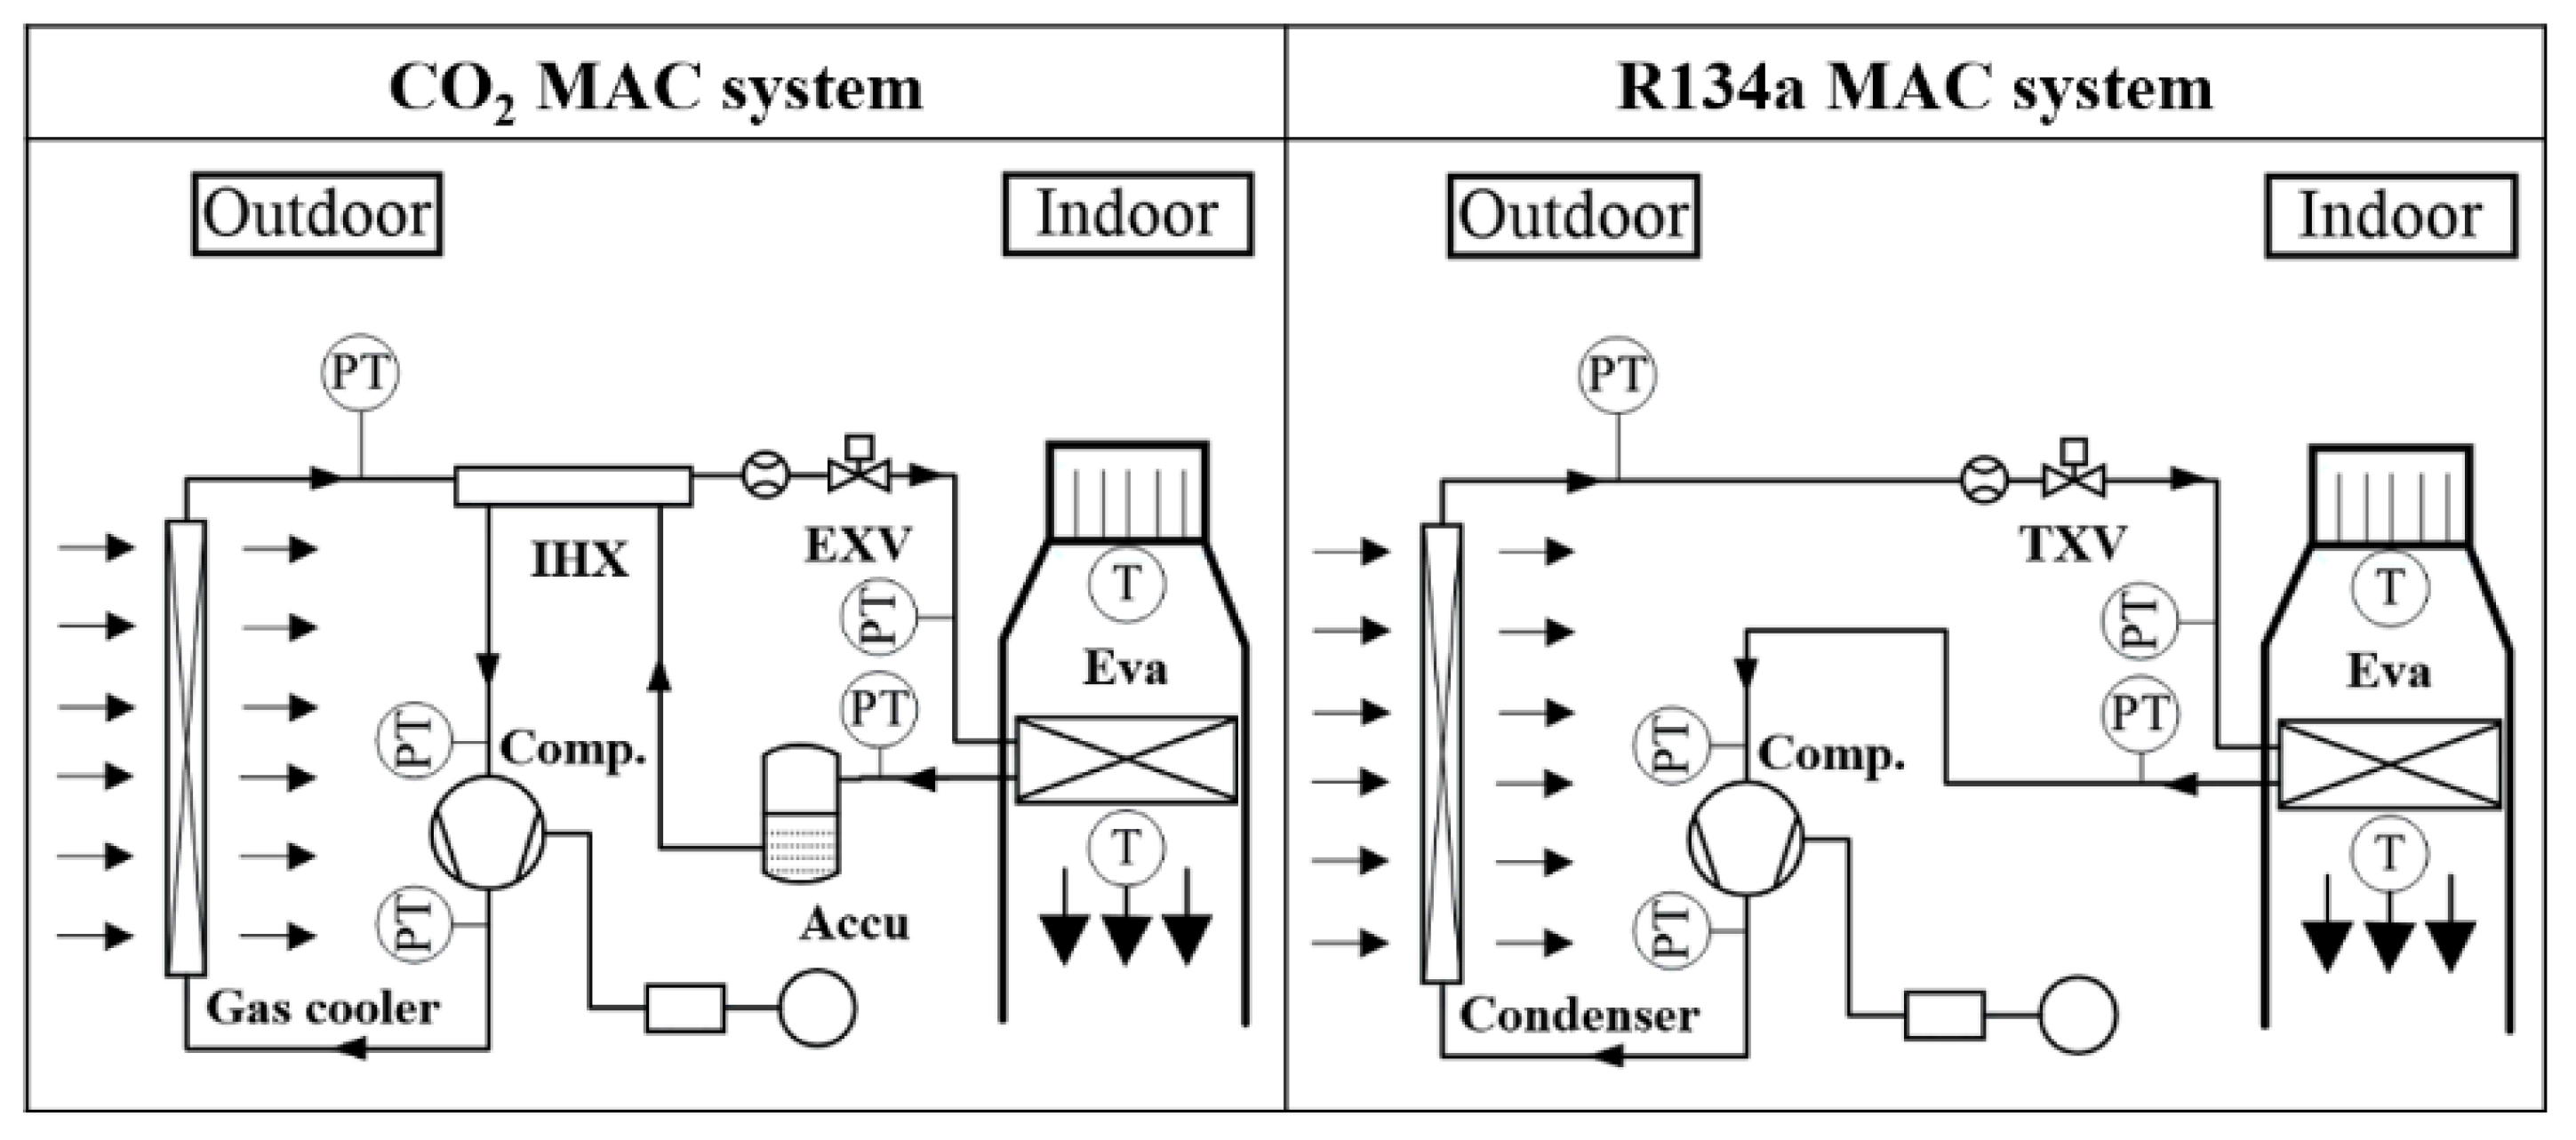
2. Experimental Setup

Figure 1 shows the calorimeter facility used to measure the cooling performance of MAC systems operating with CO2 and R134a. The CO2 MAC system is composed of an electrical compressor, a gas cooler, an evaporator, an EXV, an internal heat exchanger (IHX), and an accumulator. The CO2 compressor is a rotary type with 6 ccm displacement, a type of stationary compressor that is widely applied in domestic CO2 heat pump water heaters. The R134a electrical compressor with integrated inverter is driven by a 300 V DC power supply, whereas the CO2 electrical compressor with separated inverter is driven by a 220 V AC power supply. The prototypes of the CO2 gas cooler and CO2 evaporator used in this test rig are compact parallel microchannel heat exchangers made of aluminum. Their sizes are 570W × 330H × 12D (mm) and 230W × 200H × 38D (mm), respectively. The 0.7 mm hydraulic diameter and 0.5 mm wall thickness of the refrigerant channels provide the pressure resistance for CO2 heat exchangers. The IHX is an aluminum tube in tube heat exchanger with a length of 1.5 m. The CO2 EXV used here is controlled by a step motor driver, whose continuous opening adjustment can smoothly regulate the CO2 mass flow rate and the system’s high pressure. An accumulator with a volume of 600 mL is installed after evaporator, to serve as a system refrigerant charge buffer. Here, a conventional mobile R134a MAC system is used as a contrast. Figure 2 shows the schematic diagrams of these two systems. The R134a compressor is a scroll type with 27 ccm displacement, and the R134a heat exchangers have the same dimensions as the CO2 heat exchangers. The specifications of each component of the R134a and CO2 systems are listed in Table 1.
The calorimeter facility (the same as that described in Liang et al. [20]) consisted of an outdoor chamber and an indoor chamber with different open wind tunnels. The gas cooler/condenser and evaporator were separately installed at the inlets of the wind tunnels. The air conditions in each chamber can be controlled by the environmental system, which consists of a refrigeration unit, an electrical heater, and humidity control equipment. The environmental dry bulb temperature and wet bulb temperature can be controlled within ±0.2 °C. A variable speed blower produced the flow of air through each heat exchanger, and standard nozzles in the wind tunnel were used to measure the flow rate. Uncertainties of the experimental parameters and measured data are listed in Table 2.
The temperatures of the refrigerant and air were measured by platinum resistance temperature sensors with an uncertainty of ±0.2 °C. Pressure transducers with an accuracy of ±0.5% of transducer full scale 10 V measured the refrigerant absolute pressures up to 4 MPa for R134a and 20 MPa for CO2. The refrigerant mass flow rate was accurately measured by a Coriolis type flow meter with an accuracy of ±0.15% up to 600 kg · h 1 . The compressor input power including the invert power loss was measured by a power meter with an accuracy of ±0.5%. The cooling capacity (Q) of the tested CO2 heat pump was determined by the air side and refrigerant side heat transfer rate using Equation (1). The air side heat transfer was calculated by the heat balanced method using Equation (2). The refrigerant side heat transfer rate was obtained by the enthalpy difference calculation, using Equation (3). The overall system COP was determined by Equation (4):
Q = ( Q a + Q r ) / 2
Q a = m a ( h a , o u t h a , i n )
Q r = m r ( h e v a , i n h e v a , o u t )
C O P = Q / W
During the test, the data were recorded using a 34972A data acquisition system (Agilent). A new steady state condition for the environment chamber and MAC system was generally reached in two hours. All measurements were taken at a sampling interval of 10 s. Each measurement was taken at least 20 min after steady-state operation was achieved. Using single-sample uncertainty analysis method [21], the overall relative uncertainty of the cooling capacity and COP were calculated as 5.5% and 6.3%, respectively.

3. Experimental Results

The comparison experiments were conducted for MAC systems operating with CO2 and R134a. The dry bulb temperature and wet bulb temperature of the evaporator inlet air were controlled at 27 °C and 19.5 °C, respectively. The R134a compressor speed was controlled at 5400 RPM, and the CO2 compressor speed was maintained at 4800 RPM to obtain a comparable system cooling capacity with R134a. The outdoor air velocity was kept at 2 m/s, and outdoor air temperature was varied from 27 °C to 45 °C to determine its effect on system performance. The TXV in R134a system was able to control superheat at evaporator outlet by automatically adjusting the refrigerant mass flow, whereas the EXV used in CO2 system was manually regulated to control the optimum high pressure with maximum system COP. The outlet state of CO2 evaporator was not actively controlled. A 600 mL low-pressure accumulator, installed at the outlet of evaporator, serves as a CO2 refrigerant charge buffer. Using this accumulator with J-tube and oil bleed hole, the evaporator outlet is maintained slightly wet and oil could be returned back to compressor. With the internal heat exchanger (IHX) after the accumulator, the liquid from accumulator is evaporated before the compressor inlet, which avoids wet compression and protects compressor [3].
The refrigerant charge was adjusted to the proper amount at the start of the experiment for each system, and then all experiments were performed at constant refrigerant charge. Figure 3 shows the results of system characteristics with varied refrigerant charge for R134a and CO2 MAC system. Referred to SAE standard [22], the proper refrigerant charge was determined at the point of best COP, which was 950 g for R134a system and 1100 g for CO2 system, respectively.
The cooling performance of both systems were tested at outdoor temperature of 27 °C, 32 °C, 35 °C, 40 °C, 42 °C and 45 °C. Figure 4 shows the results of COP and cooling capacity with respect to refrigerant and outdoor temperature. Increasing the outdoor temperature results in declination in COP and cooling capacity for both systems. When the outdoor temperature increases from 27 °C to 45 °C, the cooling capacity of CO2 and R134a is decreased by 21% and 13%, respectively. By comparison, the cooling capacity of CO2 system was 4.7% higher than R134a system at the outdoor temperature of 27 °C, and it was 4.6% lower at the outdoor temperature of 45 °C. It indicates that the CO2 system is able to provide a comparable cooling capacity as the R134a system regardless of outdoor temperature. Figure 4 also shows that the COP of CO2 system is reduced from 2.0 to 1.3 by 38%, and the COP of R134a system declines from 2.8 to 1.4 by 49%, as the outdoor temperature increases from 27 °C to 45 °C. It is concluded that the COP of CO2 system is 10–26% lower than that of the R134a system under same operation conditions and the COP reduction decreases with the increase of outdoor temperature.
Figure 5 shows the experimental results of the CO2 gas cooler outlet temperature and R134a condensing temperature with varied outdoor temperature. The CO2 gas cooler outlet and R134a condensing temperature are on average 9.3 °C and 17.7 °C higher than outdoor temperature, respectively. Figure 5 also shows the comparison of evaporation temperature with varied outdoor temperature. As the outdoor temperature increases from 27 °C to 45 °C, the CO2 evaporation temperature improves from 1.9 °C to 7.2 °C, and the R134a evaporation temperature increases from 1.6 °C to 4.7 °C. By comparison, the evaporation temperature of CO2 is 0.3 °C–2.5 °C higher than that of R134a, and their difference increases with the increasing outdoor temperature. The relatively higher evaporation temperature of CO2 system could partly explain the experimental results of narrowed COP reduction at high outdoor temperature.
Figure 6 shows the compressor overall efficiency and pressure ratio with respect to refrigerant and outdoor temperature. The pressure ratio is defined as the discharge pressure divided by the suction pressure. The overall compressor efficiency was calculated from the experimental data. It should be noted that the measured mass flow rate concluded that for the refrigerant and lubricant oil, the oil circulation ratio (OCR) was around 3% for the MAC system. Hence the calculated efficiency results will be a few percentage points higher than the actual efficiency. As the outdoor temperature increases from 27 °C to 45 °C, the efficiency of the CO2 rotary compressor changes from 0.72 to 0.69, and the efficiency of the R134a scroll compressor decreases from 0.65 to 0.47. This indicates the overall efficiency of the CO2 compressor is higher than that of the R134a one by 11.8% and by 47.4%, at 27 °C and at 45 °C outdoor temperature, respectively. Since the compressor overall efficiency proportionally affects the COP of system, the 47.4% higher efficiency of CO2 compressor at 45 °C will improve the COP of the CO2 system by 47.4%, which mainly accounts for the narrowed COP reduction at 45 °C outdoor temperature.
Figure 6 also shows that with the change of outdoor temperature, the pressure ratio of CO2 increased from 2.8 to 3.0 by 8%, but the pressure ratio of R134a increased from 4.5 to 6.2 by 37%. This indicates that the pressure ratio of CO2 is smaller and less affected by outdoor temperature, compared with that of the R134a system. This may account for why the CO2 compressor is more efficient and maintains a high efficiency of around 70% even under high outdoor temperature conditions.

4. Theoretical Analysis

4.1. Thermodynamic Calculation

Thermodynamic calculations were done to investigate the theoretical performance of the CO2 MAC system, revealing reveal the impact of key component efficiency. The same evaporation temperature of 0 °C was firstly assumed for both the R134a and CO2 cycles, which represents the same heat transfer temperature difference during the evaporative process. Then the evaporation temperature for the CO2 system was set from 0 °C to 5 °C, to evaluate its impact on the COP improvement. As for the refrigerant state at the evaporator outlet, superheating was set as 5 °C for the R134a evaporator, and vapor quality was set as 0.95 for the CO2 evaporator. For the gas cooler and condenser, fitting data from comparison experiments in Section 3 was used, whereby the condenser temperature was assumed as 17.7 °C higher than the outdoor temperature, and the gas cooler approach temperature was assumed as 9.3 °C. Moreover, the lower approach temperatures of gas cooler ( Δ T g , a p ) with 6 °C, 3 °C and the ideal 0 °C were assumed in the simulation, to reveal the COP improvement potential by the optimization of the gas cooler. Δ T g , a p is defined as the temperature difference between the refrigerant outlet and air inlet of the CO2 gas cooler, which is shown in the following Equation (5). Δ T c , a p is defined as the temperature difference between the refrigerant condensing temperature and the air inlet of the R134a condenser, which is shown in the following Equation (6). The optimum discharge pressure of the CO2 system is defined as the discharge pressure with the maximum system COP, which is shown in the following Equation (7):
Δ T g , a p = T r , g , o u t T a , g ,   i n
Δ T c , a p = T r , c ,   c o n T a , c ,   i n
p g , o u t , o p =   p g , o u t ( max ( C O P ) )
The compressor overall efficiency defined as Equation (8) was assumed as a constant value 0.60 for both R134a and CO2, to calculate and compare their system performance under the same compressor efficiency conditions. Then the efficiency of CO2 compressor was set as 0.65, 0.70, 0.75 and 0.80, to reveal its impact on the COP of the CO2 system. The volumetric efficiency defined as in Equation (9) was assumed as 0.90, and the isentropic efficiency defined as in Equation (10) was assumed as 0.85. The displacement of the CO2 compressor and R134a compressor were set as 6 ccm and 27 ccm, respectively, which were the same displacements used in the experiments. The effectiveness of IHX in the CO2 system defined as Equation (11) was assumed as 0.50. The throttling valve was ideal. No pressure drops were considered in the heat exchangers and connecting tubes. During the experiments, thermal insulation material was wrapped around the outside of the IHX and connecting tubes, thus the heat transfer with the ambient from the IHX and tubes was negligibly small and it is not considered in the thermodynamic calculation:
η c o m p = m r · ( h 2 s h 1 ) W c o m p
η v o l = 60 · m r · v 1 V c o m p · R P M
η i s = h 2 s h 1 h 2 h 1
ε = Q e x p Q m a x = h c o l d , o u t h c o l d , i n h h o t , o u t h c o l d , i n
Table 3 lists the calculation conditions for system comparison between CO2 and R134a. The properties were referred to NIST REFPROP Version 8.0, and the simulation was coded using Matlab software. Since the optimum efficiency of a trans-critical CO2 cycle is dependent on the high pressure, a series of COPs were calculated with different high pressures and the maximum COP was then recorded during simulations. The COP and cooling capacity for both systems were the most important output results from simulation.

4.2. Results Discussion

1. Effect of CO2 evaporation temperature
The effect of CO2 evaporation temperature on system COP at varied outdoor temperature is discussed. The CO2 evaporation temperature was varied from 0 °C to 5 °C, and the R134a evaporation temperature was kept at 0 °C. Their COP results are shown in Figure 7, from which it can be observed that increase in CO2 evaporation temperature will bring an improvement of the COP of the CO2 system. For instance, as the evaporation temperature changes from 0 °C to 5 °C, the COP of the CO2 system increases from 2.0 to 2.4 by 20% at 27 °C, and increases from 1.1 to 1.2 by 11% at 45 °C outdoor temperature. Moreover, when the evaporator temperature of CO2 becomes 5 °C higher than that of R134a, the COP reduction between R134a and CO2 is narrowed from 33% to 22% at 27 °C, and reduced from 42% to 35% at 45 °C outdoor temperature. It is concluded the increase of evaporation temperature could partly compensate for the COP disadvantage of CO2 system, but the improvement percentage decreases with increasing outdoor temperature.
2. Effect of CO2 gas cooler approach temperature
In this section, the effect of gas cooler approach temperature on system COP at varied outdoor temperatures is discussed. During the simulation, the CO2 gas cooler approach temperature was changed from the experimental state of 9.3 °C to a most ideal state of 0 °C, and the R134a condensing temperature was maintained at 17.7 °C higher than the outdoor temperature. The simulation COP results shown in Figure 8 demonstrate that the COP of CO2 system improves with the decreasing approach temperature. For instance, when the approach temperature decreases from 9.3 °C to 0 °C, a 23–59% COP improvement is achieved under different outdoor conditions. When the outdoor temperature is 27 °C, the COP of the CO2 system improves by 18%, 40% and 59% as the approach temperature is reduced to 6 °C, 3 °C and 0 °C, respectively. Figure 8 also shows when the approach temperature is 0 °C, the COP of the CO2 system is superior to that of the R134a one by 6% at 27 °C outdoor temperature, but inferior to R134a by 23% at 45 °C outdoor temperature. This indicates that the COP of the CO2 system could be significantly enhanced by the reduction of gas cooler approach temperature and has the potential to surpass that of R134a in low outdoor temperature conditions.
3. Effect of CO2 compressor overall efficiency
In this section, the effect of CO2 compressor overall efficiency on system COP at varied outdoor temperatures is discussed. During the simulation, the compressor overall efficiency of CO2 increased from 0.60 to 0.80, and the R134a system with 0.60 compressor efficiency served as a contrast. The increase of compressor efficiency could save compressor input work and thus enhance the system efficiency. Figure 9 shows the COP results with respect to compressor overall efficiency. When the efficiency increases to 0.65, 0.70, 0.75 and 0.80, the COP of the CO2 system is improved by 8%, 17%, 25% and 33%, respectively, at all outdoor temperatures. The COP of the CO2 system is directly proportional to the compressor’s overall efficiency and this relation is not affected by the outdoor conditions. By comparison, the improved COP of CO2 with 0.80 compressor efficiency is 11–22% lower than that of the R134a system with 0.60 compressor efficiency.

4.3. Further Discussion

Since the CO2 system shows lower COP than the R134a system in the experiments, it is necessary to optimize this system and promote its efficiency in future research. The CO2 gas cooler and CO2 evaporator used in this test are prototypes, whose efficiency have much room to be improved. Theoretical analysis has concluded that the COP could be enhanced by up to 59% by reducing the gas cooler approach temperature, and an 11–18% COP increase could be achieved by increasing the evaporation temperature by 5 °C. Thus it could be expected that design optimization of the gas cooler and evaporator will compensate for the COP disadvantage of the CO2 system and make CO2 refrigerant more competitive. Additionally, our theoretical analysis also indicates that a low approach temperature or a high evaporation temperature have a bigger positive effect on the COP when the outdoor temperature is lower, thus it should be noticed that narrowing the COP reduction at high outdoor temperatures will be more difficult.
The CO2 compressor used in this test shows 11.8–47.4% higher overall efficiency than an R134a compressor. This high compressor efficiency plays a significant role in enhancing the COP of the CO2 system. The worse performance for the R134a compressor with higher outdoor temperature may be affected by the increasing pressure ratio. However, this CO2 compressor is a stationary vertical type commercial compressor, with a height of 300 mm, a heavy weight of 17 kg, and limitation of 120 °C discharge temperature, which is not suitable for mobile applications. Thus developing a high efficiency mobile CO2 compressor should be a focus of future research.

5. Conclusions

This paper presents theoretical and experimental investigations into MAC systems operating with CO2 and R134a. Carbon dioxide (CO2, R744 in the ASHRAE classification) is a natural fluid, (GWP = 1), and it does not have the contraindications of other natural fluids (it is inert, non-inflammable and non-toxic), and presents the additional advantage of low cost. However, it has working pressures even 10 times higher than that of the other refrigerants and all of the heat is rejected from the gas cooler without undergoing a condensation phase change process in the supercritical region. Comparative experimental studies on a prototype CO2 system and a conventional R134a system were conducted with different outdoor temperatures in a calorimetric test facility. Theoretical cycle analysis were done to reveal the impact of evaporator, gas cooler and compressor on the system cooling performance. The following conclusions can be drawn from the experimental analysis:
(1)
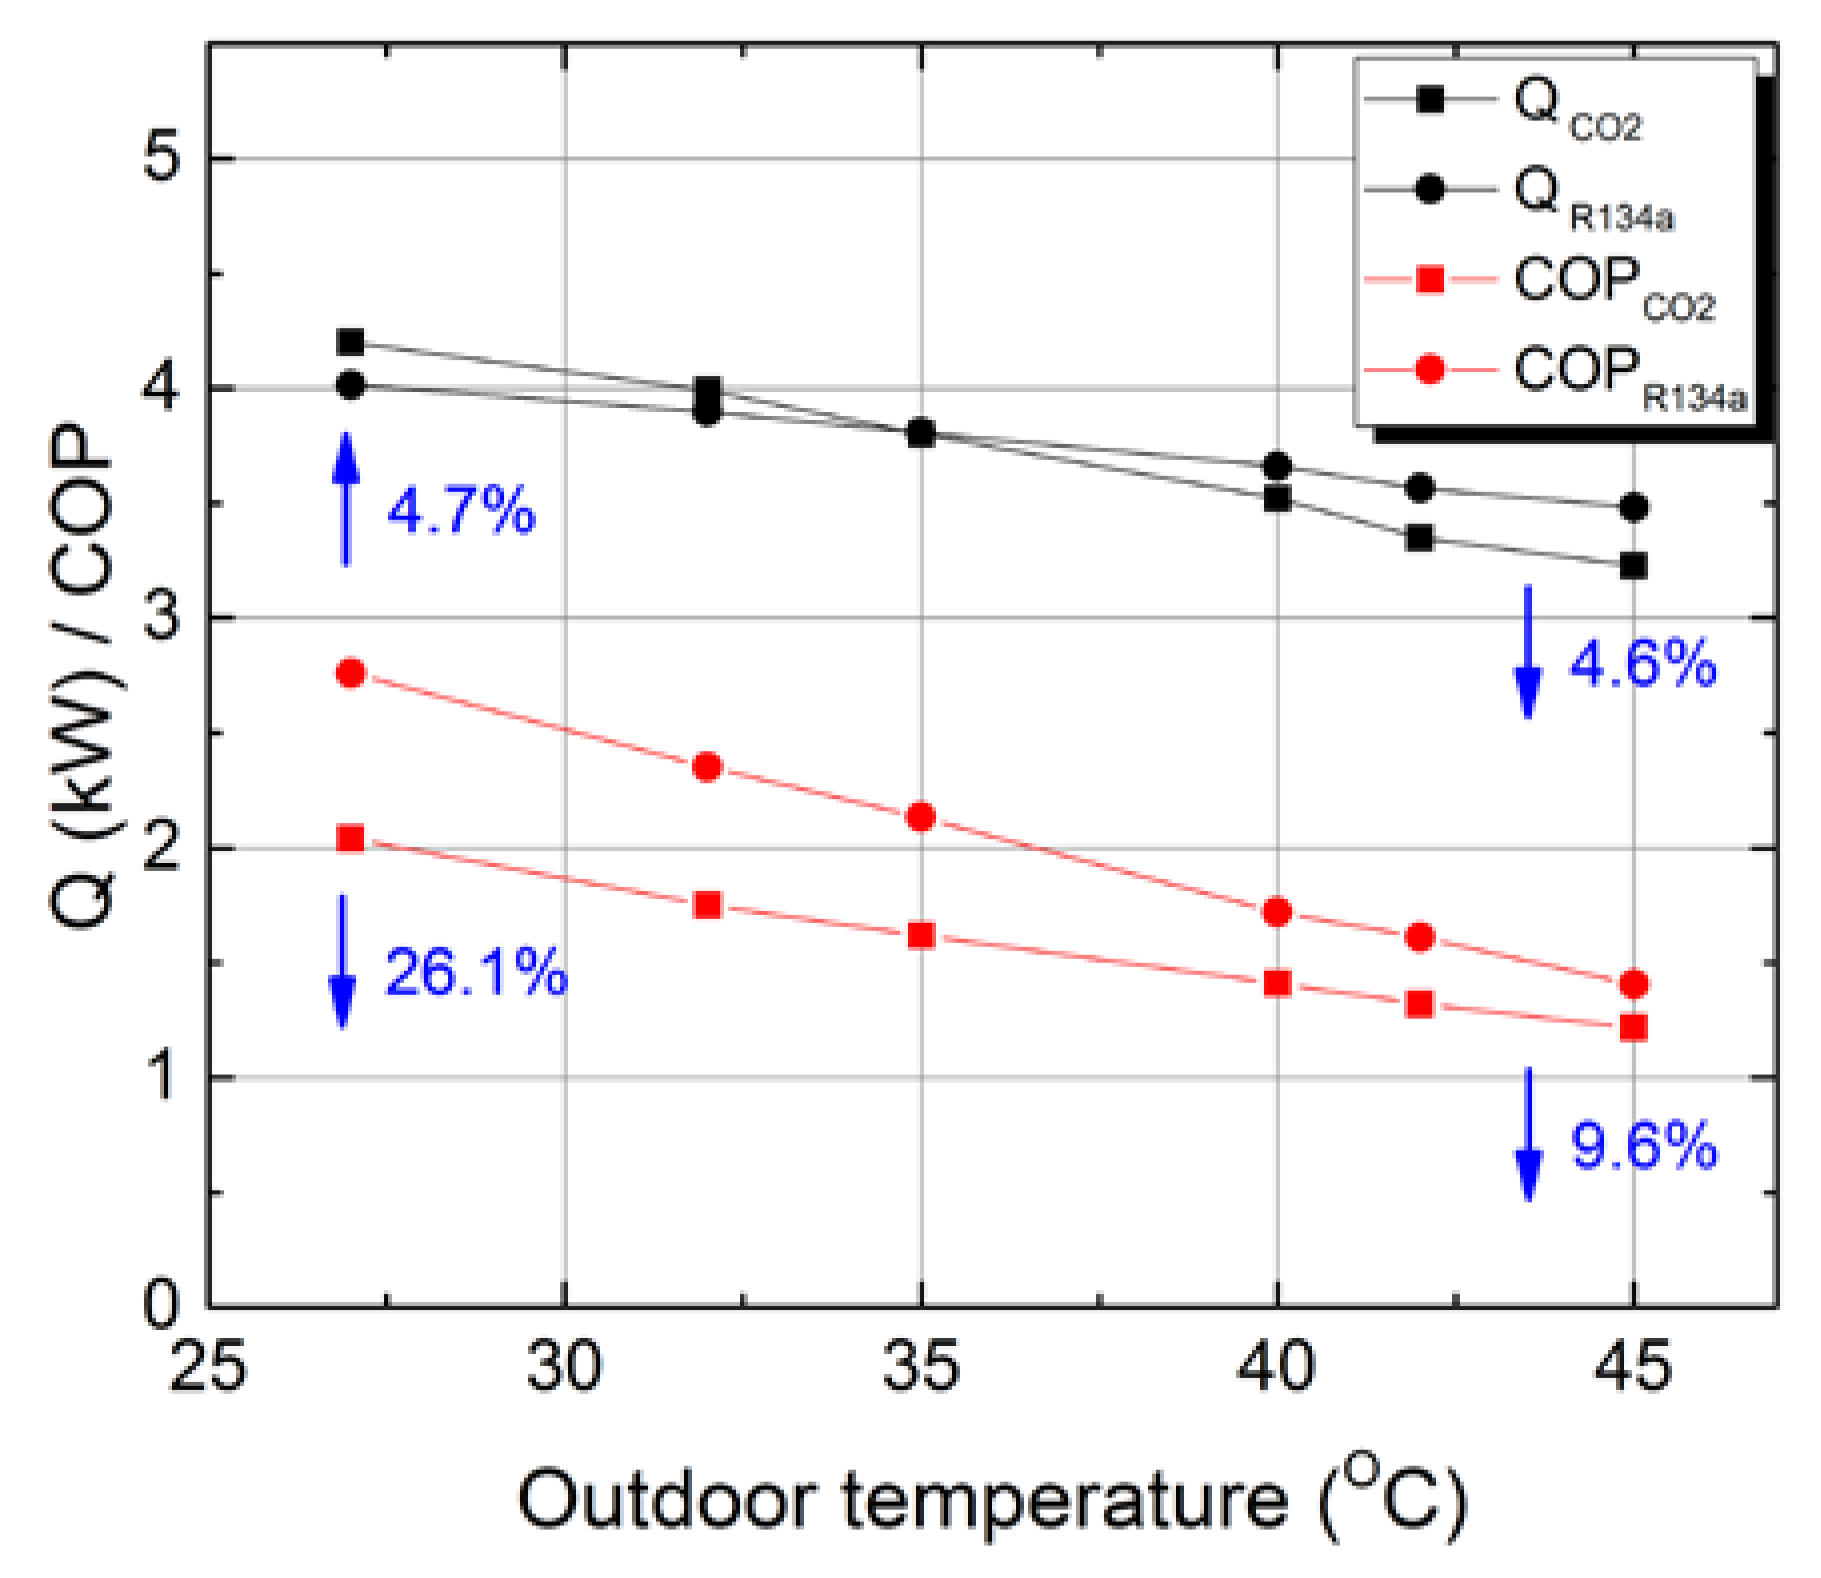
Increasing the outdoor temperature results in a decline in the cooling capacity and COP for both systems. When the outdoor temperature increases from 27 °C to 45 °C, the cooling capacity of CO2 and R134a are decreased by 21% and 13%, respectively, and the COP of CO2 and R134a are reduced by 38% and 49%, respectively.
(2)
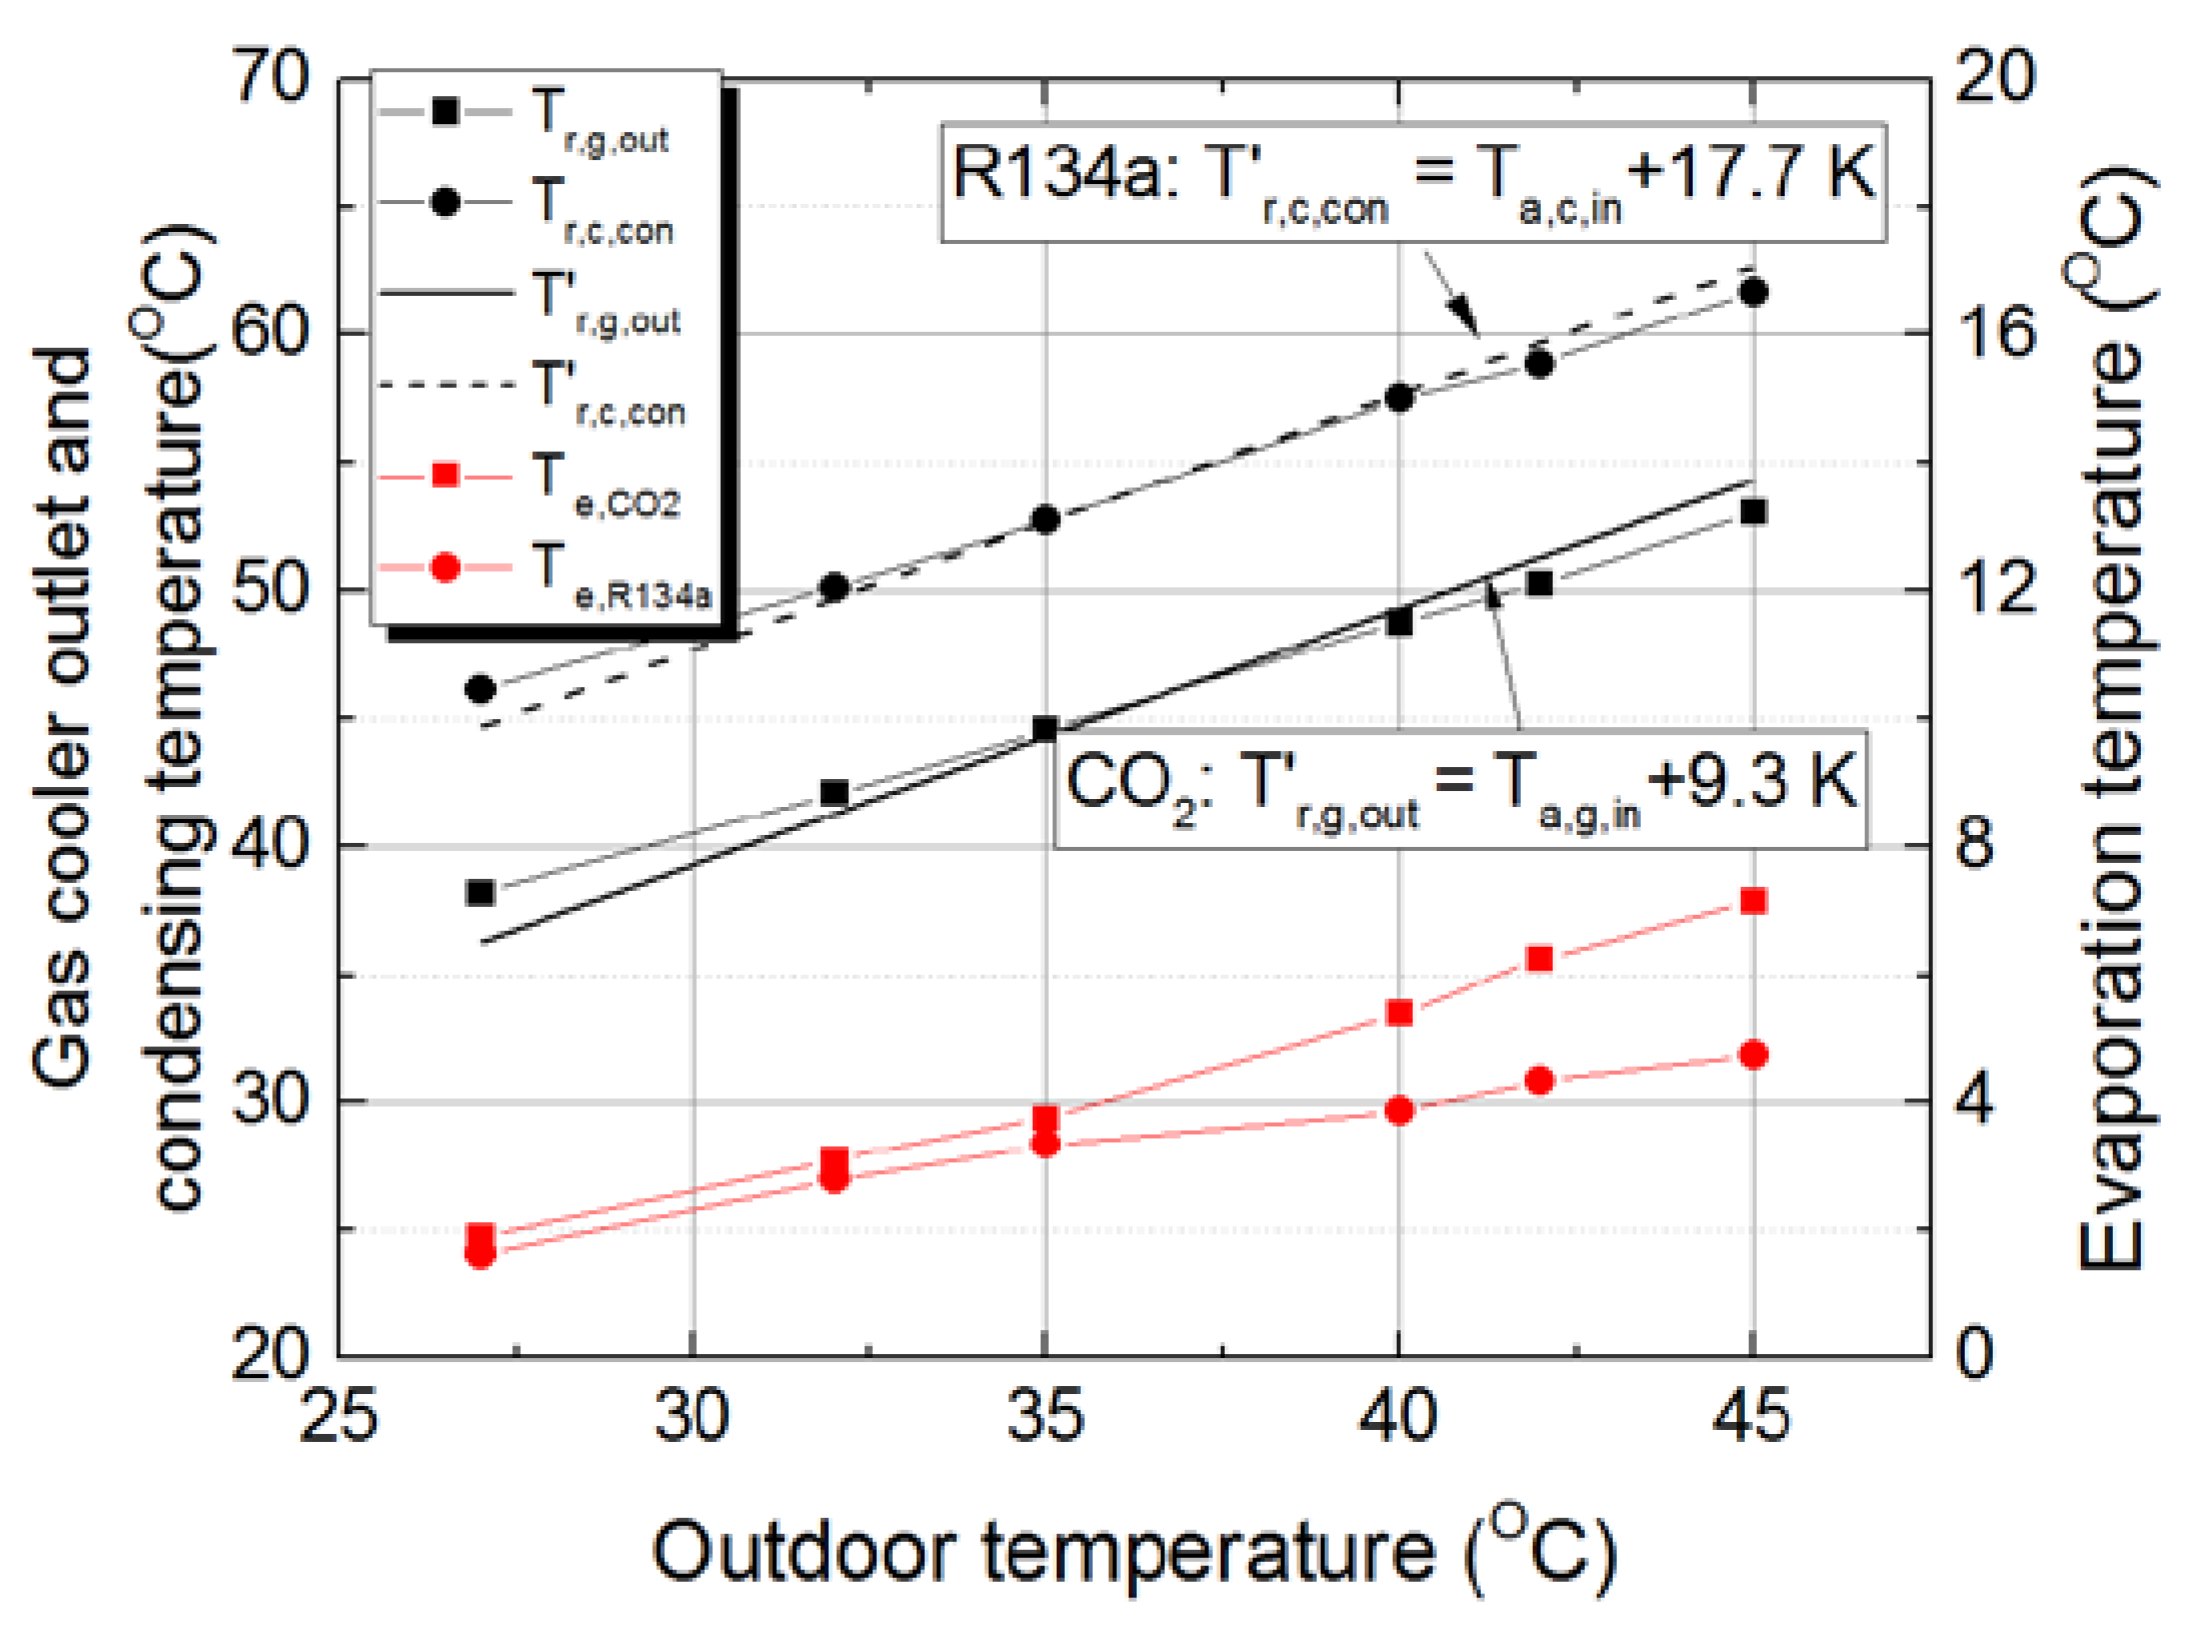
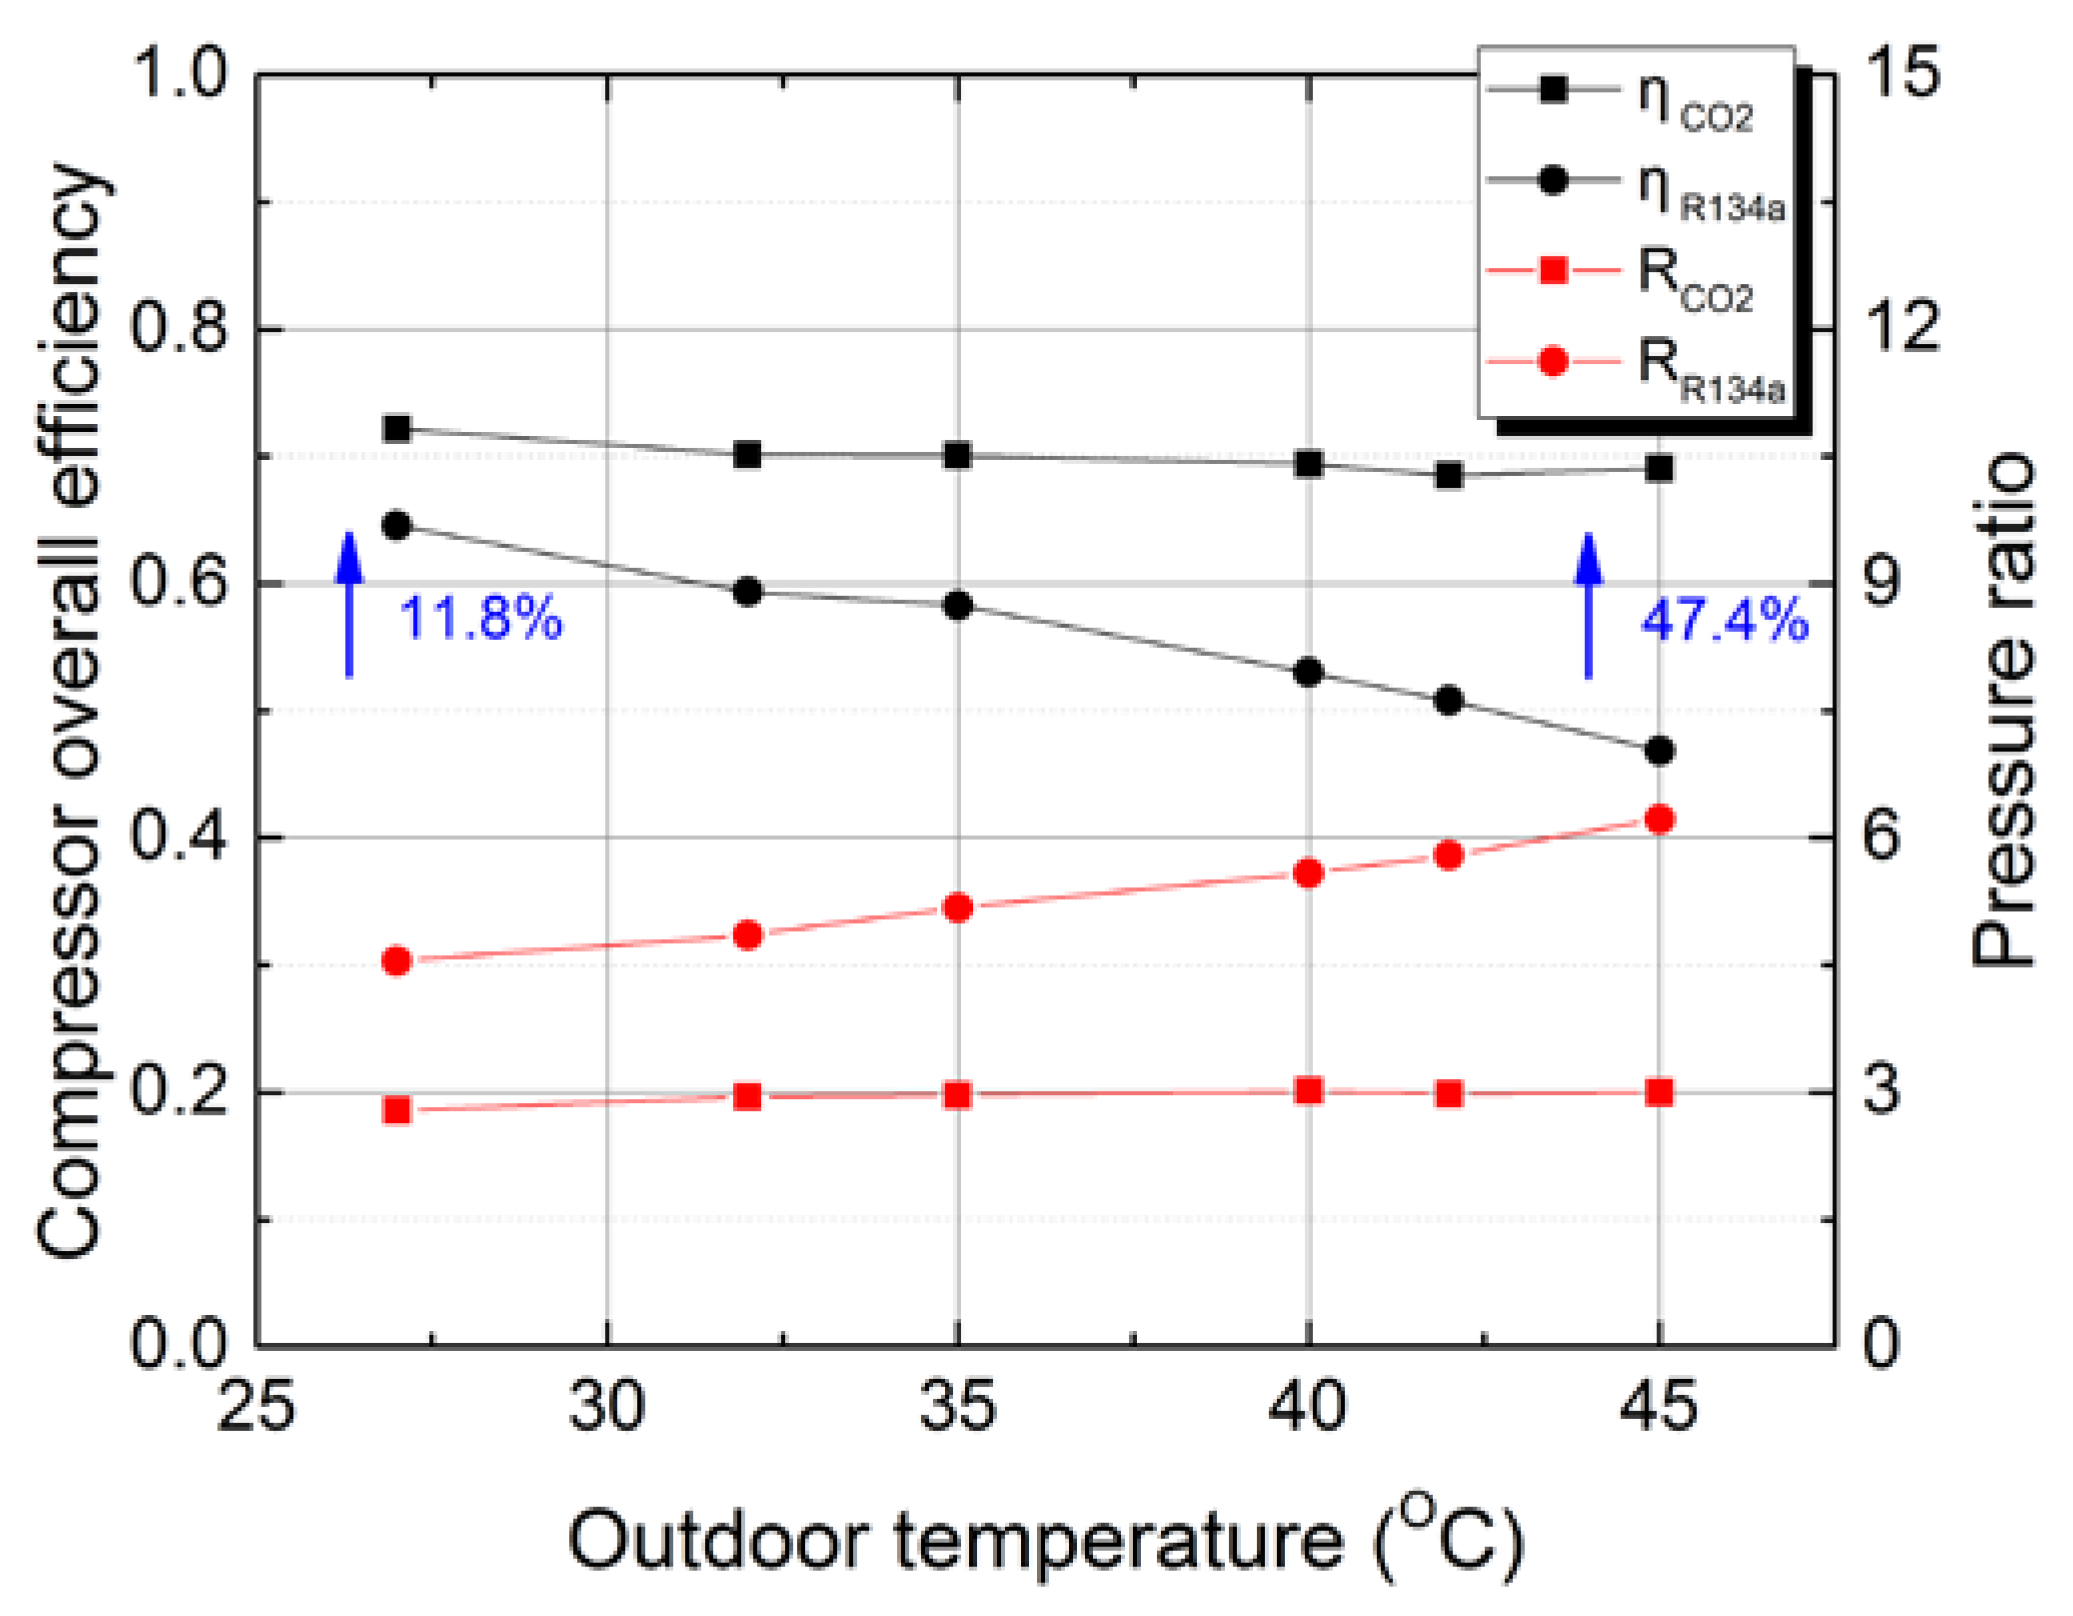
By comparison, the CO2 MAC system is able to provide a comparable cooling capacity with the R134a system regardless of outdoor temperature. The COP of CO2 MAC system is 10–26% lower than that of R134a system. The COP reduction narrows at high outdoor temperatures, which could be explained by the change of compressor efficiency and evaporator temperature. The evaporation temperature of CO2 is 0.3 °C–2.5 °C higher than that of R134a, and the compressor overall efficiency of CO2 is 11.8–47.4% higher than that of a R134a compressor.
(3)
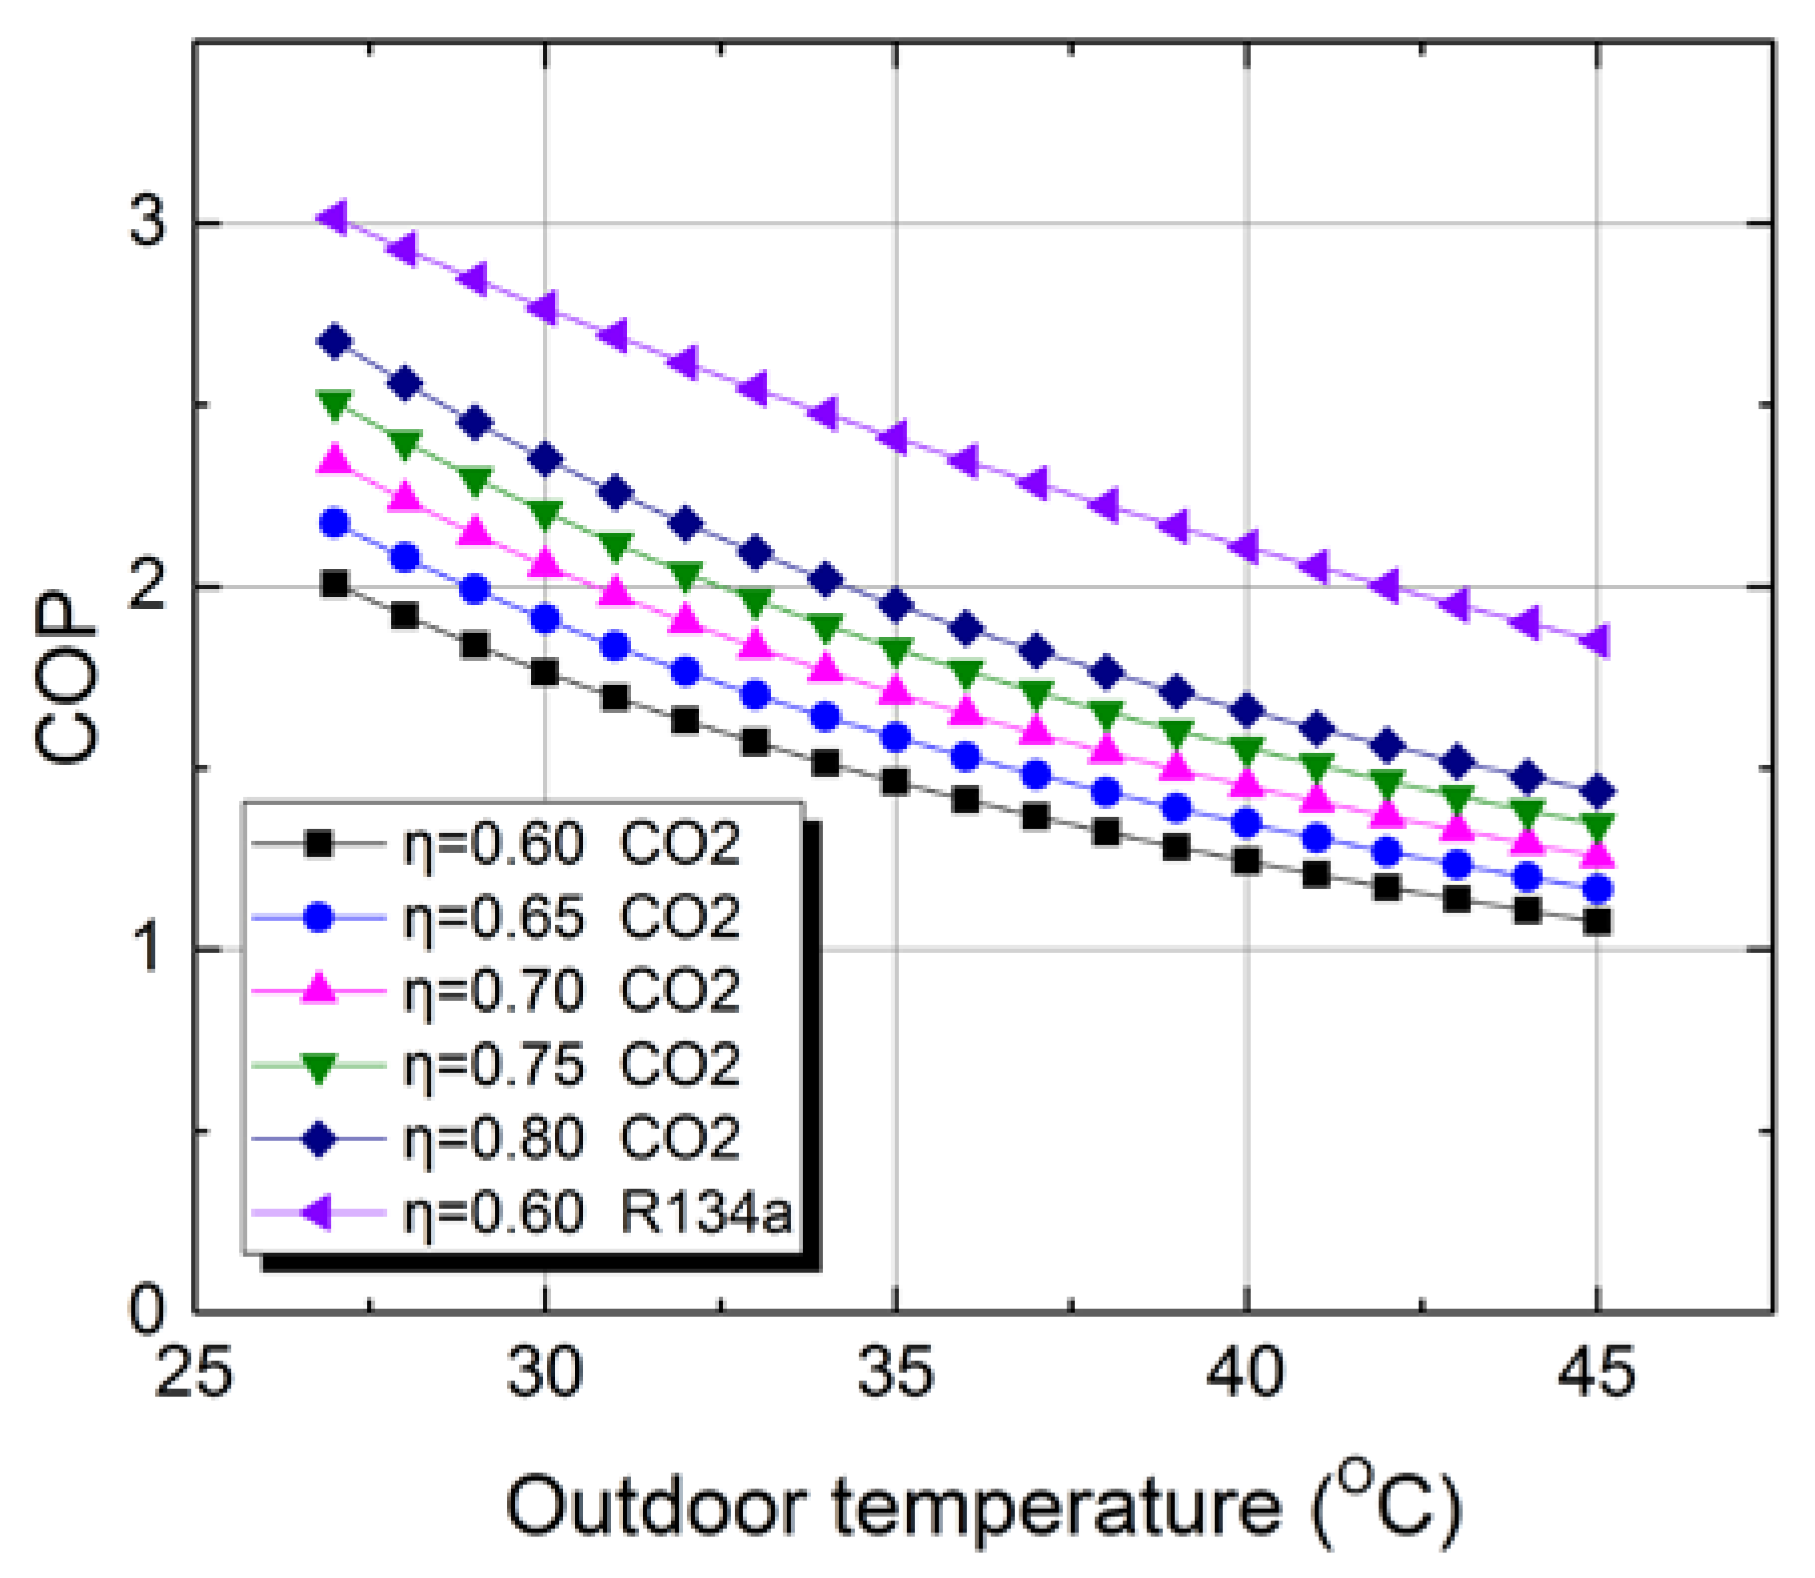
Theoretical calculations demonstrate that a 5 °C evaporation temperature increase could improve the COP of CO2 by 11–18%, and decreasing the gas cooler approach temperature from 9.3 °C to 0 °C will enhance the COP by 23–59%. When the compressor overall efficiency increases from 0.60 to 0.80, the COP of CO2 is improved by 33% regardless of the outdoor temperature conditions. These impacts indicate that the COP of the CO2 system could be significantly enhanced by component optimization and has the potential to surpass that of R134a systems.

Author Contributions

Investigation, J.S.; Methodology, B.Y.; Supervision, J.C.; Writing—review & editing, D.W.

Funding

This research was funded by National Nature Science Foundation of China (NO. 51776119).

Conflicts of Interest

The authors declare no conflicts of interest.

Nomenclature

Roman
CpSpecific heat [ J · kg 1 · K 1 ]
EXVElectrical expansion valve
hEnthalpy [ kJ · kg 1 ]
IHXInternal heat exchanger
mMass flow rate [ kg · s 1 ]
pPressure [MPa]
QCooling capacity [kW]
RPressure ratio
TTemperature [°C]
T′Fitting temperature
TXVThermal expansion valve
vSpecific volume [ m 3 · kg 1 ]
VDisplacement [ m 3 · rev 1 ]
WWork [kW]
ΔTTemperature difference [°C]
Greek letters
η Efficiency
ε Effectiveness
Subscripts
1Suction point
2Discharge point
2sIsentropic point
aAir
apApproach
cCondenser
condCondensing
compCompressor
diffDifference
eEvaporation
evaEvaporator
expExpectation
gGas cooler
inInlet
isIsentropic
maxMaximum
outOutlet
opoptimum
rRefrigerant
volVolumetric
Acronyms
COPCoefficient of performance
GWPGlobal warming potential
MACMobile air conditioning
OCROil circulation ratio
RPMRevolutions per minute

References

  1. Andersen, S.O.; Chowdhury, S.; Craig, T.; Baker, J.A. Comparative Manufacturing and Ownership Cost Estimates for Secondary Loop Mobile Air Conditioning Systems (SL-MACs). In Proceedings of the WCX™ 17: SAE World Congress Experience, Detroit, MI, USA, 4–6 April 2017. [Google Scholar]
  2. Lorentzen, G.; Pettersen, J. A New, Efficient and Environmentally Benign System for Car Air-Conditioning. Int. J. Refrig. 1993, 16, 4–12. [Google Scholar] [CrossRef]
  3. Kim, M.H.; Pettersen, J.; Bullard, C.W. Fundamental process and system design issues in CO2 vapor compression systems. Prog. Energy Combust. Sci. 2004, 30, 119–174. [Google Scholar] [CrossRef]
  4. Cannistraro, G.; Cannistraro, M.; Cannistraro, A.; Galvagno, A. Analysis of Air Pollution in the Urban Center of Four Cities Sicilian. Int. J. Heat Technol. 2016, 34, S219–S225. [Google Scholar] [CrossRef]
  5. Daimler Official Website. Available online: https://www.daimler.com/sustainability/product/further-environmental-technologies/co2-air-conditioning-system.html (accessed on 6 June 2018).
  6. Cecchinato, L.; Corradi, M.; Fornasieri, E.; Zamboni, L. Carbon Dioxide as Refrigerant for Tap Water Heat Pumps: A Comparison with the Traditional Solution. Int. J. Refrig. 2005, 28, 1250–1258. [Google Scholar] [CrossRef]
  7. Higuchi, Y.; Kobayashi, H.; Shan, Z.; Kuwahara, M.; Endo, Y.; Nakajima, Y. Efficient Heat Pump System for PHEV/BEV. In Proceedings of the WCX™ 17: SAE World Congress Experience, Detroit, MI, USA, 4–6 April 2017. [Google Scholar]
  8. Piccolo, A.; Siclari, R.; Rando, F.; Cannistraro, M. Comparative Performance of Thermoacoustic Heat Exchangers with Different Pore Geometries in Oscillatory Flow. Mplementation of Experimental Techniques. Appl. Sci. 2017, 7, 784. [Google Scholar] [CrossRef]
  9. Kim, S.C.; Kim, M.S.; Hwang, I.C.; Lim, T.W. Performance evaluation of a CO2 heat pump system for fuel cell vehicles considering the heat exchanger arrangements. Int. J. Refrig. 2007, 30, 1195–1206. [Google Scholar] [CrossRef]
  10. Kim, S.C.; Kim, M.S.; Hwang, I.C.; Lim, T.W. Heating performance enhancement of a CO2 heat pump system recovering stack exhaust thermal energy in fuel cell vehicles. Int. J. Refrig. 2007, 30, 1215–1226. [Google Scholar] [CrossRef]
  11. Wang, D.; Yu, B.; Hu, J.; Chen, L.; Shi, J.; Chen, J. Heating Performance Characteristics of CO2 Heat Pump System for Electrical Vehicle in a Cold Climate. Int. J. Refrig. 2017, 85, 27–31. [Google Scholar] [CrossRef]
  12. Cannistraro, G.; Cannistraro, M.; Cannistraro, A. Evaluation of the Sound Emissions and Climate Acoustic in Proximity of One Railway Station. Int. J. Heat Technol. 2016, 34, S589–S596. [Google Scholar] [CrossRef]
  13. Cannistraro, G.; Cannistraro, M.; Restivo, R. Smart Control of Air Climatization System in Function on the Values of Mean Local Radiant Temperature. Smart Sci. 2015, 3, 157–163. [Google Scholar] [CrossRef]
  14. Kim, M.H.; Yin, J.M.; Bullard, C.W.; Hrnjak, P.S. Development of a micro-channel evaporator model for a CO2 mobile air-conditioner. Am. Soc. Mech. Eng. Adv. Energy Syst. Div. 2000, 40, 47–54. [Google Scholar]
  15. Jin, J.; Chen, J.; Chen, Z. Development and validation of a microchannel evaporator model for a CO2 air-conditioning system. Appl. Therm. Eng. 2011, 31, 137–146. [Google Scholar] [CrossRef]
  16. Kim, S.C.; Won, J.P.; Kim, M.S. Effects of operating parameters on the performance of a CO2 air conditioning system for vehicles. Appl. Therm. Eng. 2009, 29, 2408–2416. [Google Scholar] [CrossRef]
  17. Martin, K.; Lang, G.; Rieberer, R. Mobile HVAC-System with CO2 as Refrigerant—Simulations and Measurement; SAE Technical Paper; SAE International: Warrendale, PA, USA, 2005. [Google Scholar]
  18. Yin, J.; Park, Y.C.; Boewe, D.; McEnaney, R.; Beaver, A.; Bullard, C.W.; Hrnjak, P. Experimental and Model Comparison of Transcritical CO2 versus R134a and R410 System Performance; Discussion; Science Et Technique Du Froid: Oslo, Norway, 1998. [Google Scholar]
  19. Brown, J.S.; Yana-Motta, S.F.; Domanski, P.A. Comparitive analysis of an automotive air conditioning systems operating with CO2 and R134a. Int. J. Refrig. 2002, 25, 19–32. [Google Scholar] [CrossRef]
  20. Liu, C.C.; Li, C.Z.; Chen, J.P. Experimental and simulation study on the air side thermal hydraulic performance of automotive heat exchangers. Appl. Therm. Eng. 2015, 87, 305–315. [Google Scholar]
  21. Moffat, R.J. Describing the Uncertainties in Experimental Results. Exp. Therm. Fluid Sci. 1988, 1, 3–17. [Google Scholar] [CrossRef]
  22. SAE International. Procedure for Measuring System COP [Coefficient of Performance] of a Mobile Air Conditioning System on a Test Bench; SAE Surface Vehicle Standard J2765; SAE International: Atlanta, GA, USA, 2008. [Google Scholar]
Figure 1. Schematic diagram of the calorimeter facility used to measure MAC system performance.
Energies 11 01927 g001
Figure 2. Schematic diagrams of the CO2 MAC system and R134a MAC system.
Energies 11 01927 g002
Figure 3. System characteristics with varied refrigerant charge for (a) R134a system (b) CO2 system.
Energies 11 01927 g003
Figure 4. Cooling capacity and COP for CO2 and R134a MAC systems at varied outdoor temperature.
Energies 11 01927 g004
Figure 5. The gas cooler outlet, condensing temperature, and evaporation temperatures at varied outdoor temperatures.
Energies 11 01927 g005
Figure 6. The compressor overall efficiency and pressure ratio at varied outdoor temperature.
Energies 11 01927 g006
Figure 7. Effect of evaporation temperature on the COP of the CO2 system.
Energies 11 01927 g007
Figure 8. Effect of gas cooler approach temperature on the COP of the CO2 system.
Energies 11 01927 g008
Figure 9. Effect of compressor overall efficiency on the COP of the CO2 system.
Energies 11 01927 g009
Table 1. The specification of the R134a and CO2 AC system components.
ComponentR134aCO2
CompressorScroll type, mobile compressor, horizontal configuration, 1000–7200 RPM, 27 ccm/rev, 7.0 kgRotary type, commercial compressor, vertically configuration, 1000–6000 RPM, 6 ccm/rev, 17 kg
Condenser/gas coolerMicro channel, parallel flow, aluminum, mass production component, 570W × 330H × 12D (mm), 1 slab, 3 passes, 20-14-10Micro channel, parallel flow, aluminum, prototype, 570W × 330H × 12D (mm), 1 slabs, 3 passes, 20-14-10
EvaporatorMicro channel, parallel flow, aluminum, mass production component, 230W × 200H × 38D; 2 slabs, 4 passes, 16-16-16-16Micro channel, parallel flow, aluminum, prototype, 230W × 200H × 38D, 2 slabs, 6 passes, 10-11-11-11-11-10
Throttling valveTXV, aluminum, mass production component, 1.5 t of cooling EXV, copper, driven by step motor, commercially available, valve port diameter 1.6 mm
IHXWithout Tube-in-tube, aluminum, prototype, 1.5 m
AccumulatorWithout 600 mL, commercially available
Table 2. Uncertainties of the experimental parameters and measured data.
ItemsUncertainties
Temperature sensors (RTD-type, Yokogawa, Japan)±0.2 °C
Pressure transducers (GE-Druck, USA)±0.5%, Max 4 MPa or 20 MPa
Mass flow rate (Coriolis type, KROHNE, Germany)±0.15%, Max 600 kg · h 1
Digital power meter (WT210, Yokogawa, Japan)±0.5% reading
Data logger (34972A, Agilent, USA)0.004% dcV of full scale
Heating capacityMax 5.5%
Heating COPMax 6.3%
Table 3. Simulation conditions for system comparison between CO2 and R134a.
T e , C O 2 T e , R 134 a Δ T g , a p Δ T c , a p η c o m p , C O 2 η c o m p , R 134 a ε T e v a , o u t q e v a , o u t
10 °C0 °C9.3 °C17.7 °C0.60.60.55 °C0.95
20, 1, 2, 3, 4, 5 °C0 °C9.3 °C17.7 °C0.60.60.55 °C0.95
30 °C0 °C9.3, 6, 3, 0 °C17.7°C0.60.60.55 °C0.95
40 °C0 °C9.3 °C17.7 °C0.6, 0.65, 0.7, 0.75, 0.80.60.55 °C0.95

