Thermal Comfort, Energy and Cost Impacts of PMV Control Considering Individual Metabolic Rate Variations in Residential Building

1
Graduate School, Hanbat National University, San 16-1, Dukmyung-Dong, Yuseong-Gu, Daejeon 34158, Korea
2
School of Architecture and Building Science, Chung-ang University, 84, Heukseok-ro, Dongjak-gu, Seoul 06974, Korea
3
Department of Architectural Engineering, Hanbat National University, San 16-1, Dukmyung-Dong, Yuseong-Gu, Daejeon 34158, Korea
*
Author to whom correspondence should be addressed.
Energies 2018, 11(7), 1767; https://doi.org/10.3390/en11071767
Submission received: 30 May 2018
/
Revised: 3 July 2018
/
Accepted: 3 July 2018
/
Published: 5 July 2018
(This article belongs to the Special Issue Wireless Sensor Networks, Internet of Things and Smart Residential)
Abstract
:To date, most of the indoor environment control is based on the dry-bulb air temperature, which is one of the simplified control methods having the limitation to truly represent the thermal comfort of individual occupants. A variety of factors affect the thermal comfort such as dry-bulb air temperature, humidity, air movement, radiation, clothing insulation, and metabolic activity level. In this circumstance, this study investigated the effects of considering hourly metabolic rate variations for predicted mean vote (PMV) control on the actual thermal load, energy usage, and life cycle cost (LCC). The case adopting PMV control taking the hourly metabolic rate into account was comparatively analyzed against the conventional dry-bulb air temperature control, using a detailed simulation technique after the validation process. As a result, when the activity state of the occupant is house cleaning in the summer, the indoor temperature decreases rapidly due to the high amount of activity. It requires a temperature that is 11.7 °C and 9.7 °C lower than the conventional dry-bulb air temperature control method, respectively, and generally forms a higher indoor air temperature than the conventional control method after 7 p.m. This means the difference in temperature to satisfy the comfort of the occupant according to the amount of activity, and during winter as opposed to summer, was found to form a lower indoor air temperature than the conventional temperature control. In case of annual boiler gas consumption, PMV control showed 7.3% less energy consumption than the dry-bulb air temperature control and showed 28.8% less energy consumption than the dry-bulb air temperature control for annual cooling electricity consumption. Considering the cooling and heating energy reduction rate and the initial installation cost of measuring equipment for real-time metabolic rate and PMV measurement, a payback period of approximately 4.15 years was required.
1. Introduction
1.1. Background
Today, one of the most important factors in the field of building science around the world is to minimize energy consumption while maintaining a pleasant indoor environment for the occupants. The importance of reducing energy consumption has been an important aspect for a long time, and studies and programs related to energy consumption optimization algorithms and programs have been actively performed [1]. In terms of the Korea Institute of S&T Evaluation and Planning (2015, 29) based on OECD (Organization for Economic Cooperation and Development) data, the energy intensity of OECD countries has been consistently declining as a result of technical and policy efforts in various countries over the past 40 years [2]. In addition, many countries regulate indoor space based on dry-bulb air temperature or recommend proper room temperature compliance to reduce energy consumption in buildings. Although these national policies may have a positive effect on reducing heating and cooling energy consumption, they are fragmentary policies and regulations that do not consider the thermal comfort experienced by the occupants [3]. Modern people today spend most of their day in indoor spaces such as houses and offices, and the demand for a pleasant indoor environment is growing as the quality of life improves along with social change [4]. PMV is a comfort index of the occupant that is influenced by air temperature, mean radiant temperature, air velocity, air humidity, clothing, and activity level, and the PMV calculation equation is implemented by software for the convenience of the user [5,6]. In conditioned spaces, the thermal comfort conditions of the human body as a whole can be evaluated by means of the PMV index [5,7] which integrates the influence of the thermal comfort factors (air temperature, air velocity, mean radiant temperature, humidity, clothing insulation, and activity) into a value on the well-known ASHRAE (American Society of Heating, Refrigerating, and Air-Conditioning Engineers) 7-points scale with a range of −3 to +3 (Table 1). Formulated by Fanger in 70’s [8], the PMV-index is an objective method based on an analysis of the heat balance equation for the human body together with the influence of the physical environment and expressed as a subjective sensation [7]. The typical comfort range is between −0.5 and 0.5 [9], and related studies are actively underway in many areas such as the metabolic rate, PMV, and high-efficiency air conditioners [10].
1.2. Literature Review
In terms of existing studies related to this, there are two main categories. In the studies related to metabolic rate, ISO 8996:2004 defines a different method for determining the metabolic rate in the ergonomic context of a climatic work environment [11]. ISO 9920:2007 specifies a method for estimating the steady-state thermal characteristics of a garment ensemble based on known clothing, ensemble, and textile values. Other effects of clothing such as moisture absorption, cushioning, and touch feeling are not considered. Taking into consideration the influence of rain and snow on the temperature characteristics, we deal with the asymmetry of special protective clothing, discomfort due to the separated insulation of different parts of the body and clothing ensemble [12]. Malchaire J et al.’s study emphasizes that accurate evaluation of metabolic rate is necessary for evaluating severe working conditions. This paper revised the foundation described in the ISO 8996 standard concerning the evaluation of the metabolic rate at the workstation from the record of the worker’s heart rate during the representative period. From the review of the literature, an expression different from the formula given in the standard is proposed to estimate the maximum work capacity at rest, maximum heart rate, heart rate, metabolic rate, and baseline relationship. The Monte Carlo simulation is used to determine the inaccuracy of the estimated equivalent metabolic rate from these parameters and formal approximations. The result shows that the standard deviation of this estimate varies from 10 to 15% [13]. Next, in terms of existing studies related to PMV, d’Ambrosio Alfano et al. focuses on important parameters influencing the quality of the indoor environment and affects researchers of human comfort and indoor air quality. The analysis of every single topic in his research and its impact on past and present research requires more space than available in review articles. The authors are convinced that the research described in this document will serve as a beacon for researchers working on current and future thermal comfort [14]. The evaluation of PMV is a very hard matter as stressed by d’Ambrosio Alfano et al. especially when the metabolic rate is unknown. In particular, we compared all existing smartphones and web applications for computing PMV indexes running on different platforms for mobile devices with reference software compliant with the ISO 7730 standard. Unfortunately, there were only four applications that take into account all six variables that cause warmth and data entry seems very difficult. In addition, only one app considered the basic clothing insulation value correction by pumping effect. Based on the results of this preliminary test, web apps and smartphone tools for the evaluation of hot comfort by PMV currently on the market must be used with special care [15]. Leger J et al.’s study performed an experimental investigation of the electric heating system showing that the heat distribution influences the effectiveness of the device to actually maintain the thermal comfort. Baseboard heaters, convectors, and radiant heaters are compared in equal thermal comfort conditions within two climatic chambers at different cold room temperatures. To demonstrate the reproducibility of the results, a statistical analysis is presented. The results show that despite achieving similar thermal comfort, the convector consumes less energy than the baseboard and radiant heater. Therefore, there is an opportunity to improve the heating efficiency by improving the heat distribution of the device [16]. The existing studies above showed that PMV control can improve the thermal comfort and reduce the load, but they did not investigate the comprehensive impacts of considering metabolic rate during PMV control on thermal comfort and energy consumption in detail. In order to solve the limitations of such prior studies, the purpose of this study is to evaluate the thermal comfort of the occupant and the cooling and heating energy saving effect through PMV control considering the actual metabolic rate of the occupant and to enhance the applicability of measuring the metabolic rate for PMV control in Korea through economic analysis (Lifecycle cost).
1.3. Metabolic Rate
Metabolic rate is a physiological measure of metabolism during physical activity. The metabolic rate can be expressed as (O2 mL/kg/min)*3.5, which indicates the amount of oxygen an adult consumes sitting down relaxing [17]. The Activity Level (unit: W) is an element that determines the amount of heat generated by an individual, and the Activity Level varies widely from 72 W up to 900 W [18]. The following Table 2 [19] shows various behavioral conditions according to the metabolic rate used in this study. The minimum value is 72 W/Person which indicates the sleeping state of the occupant, and the maximum value is 360 W/Person which indicates the house cleaning state.
2. Method
2.1. Simulation Software
EnergyPlus v6.0 developed by the U.S Department of Energy was used as a theoretical analysis tool to conduct this study. EnergyPlus is the program combining the advantage of DOE-2 in the system analysis and the advantage of BLAST in the load analysis [17]. In addition, the building cooling and heating load analysis was based on the heat balance method recommended by the American Society of Heating Refrigerating and Air-conditioning Engineer (ASHRAE). The credibility of this program was verified by developing simulation tools as per the ASHRAE 140 guidelines which were the representative dynamic simulation protocol. In addition, the computations are based on the fully integrated solution of zone, air, and surface balances, systems, and plants [20]. Finally, detailed information on the assumptions, detailed algorithm, and validation of EnergyPlus models related to boiler calculations can also be found in Reference [20].
2.2. Predicted Mean Vote (PMV) Assessment During Simulation
PMV is one of the representative thermal indicators, developed as a comfort index by P.O. Fanger [8]. It is based on the heat balance of the human body and is divided into a 7-point scale as shown in Table 1. PMV is not only influenced by metabolic rate and clothing, but also by physical environmental factors such as air temperature, mean radiant temperature, airspeed, and humidity. The general comfort range of the occupant is −0.5 to +0.5 [10].
It is essential to accurately evaluate PMV in each time-step during the simulation and thus the following descriptions are provided in this section related to the variables such as clothing insulation, air velocity, relative humidity, and mean radiant temperature, which directly affect the PMV value. To begin with, clothing insulation is assumed to be equal to a constant value of 0.5 clo from 1 December through 28 February, 0.5 from 1 March through 30 April and from 1 November through 30 November, 0.65 during May and October, and 0.5 from 1 June through 30 September. Air velocities and relative humidities are automatically computed by the EnergyPlus software in each time-step since they are not the input variables but the variables that are the variables affected by a variety of operating conditions such as heating/cooling load and supply airflow provided to each zone, and so forth. Finally, MRT (Mean Radiant Temperature), which has a significant effect on PMV, is also computed by the EnergyPlus software in each time-step due to the fact that surface temperatures are determined by the heating operation conditions such as the supply hot water temperature and supply water flow into the radiant heating system, which, in turn, are determined by the heating load of each time-step in each zone.
2.3. Schedule
The hourly variations of metabolic rate were based on ISO 18523-2 Residential Buildings Annex A [20]. Of the schedule for a family of four presented by the ISO 18523-2 Residential Buildings Annex A [20], a 44-year-old housewife who spends the most time in the residential building was applied. Table 3 and Table 4 represent the Weekday and Holiday Schedules of the corresponding woman, respectively, and the values are averaged by the hour of the 15-min schedule presented by the ISO.
2.4. Description of the Simulated Apartment Building
The EnergyPlus simulation model selected a residential apartment located in Paju, Gyeonggi Province, Korea. The floor plan of each floor is shown in Figure 1 and and exterior view is presented in Figure 2. Zones 1 and 2 are facing south, Zone 3 facing northwest, and Zone 4 is facing northeast. The modeling is a 15-story general residential apartment with the same floor height of 2.7 m. In addition, Zone 1 and Zone 2 are 10.4 m wide, 14.4 m long, with a window area ratio of 34.3%, while Zone 3 and Zone 4 are 12.1 m wide, 12.1 m long, with a window area ratio of 21.3%.
2.5. Simulation Condition
In this study, the radiant floor heating system was applied for the heating and the cooling system was achieved through an indoor window air conditioner. The building used in this study was a simulation model based on a residential building located in Paju, Gyeonggi Province, Korea, but since the weather data provided by EnergyPlus did not exist, the weather data of Incheon area was used, which is located nearby. The internal heat gain conditions for the simulation modeling are shown in Table 5, and the analysis period of the model was set for a whole year. The heating and cooling system was not operated during the unoccupied hours and when the occupant was sleeping according to the Occupancy Schedule and the Hours of Operation Schedule. In order to control the PMV more accurately, each household was divided into 5 zones with 3 rooms, a kitchen, and a living room, excluding the veranda and bathroom. The assumption was to measure the metabolic rate of the occupant in real-time by installing a temperature and humidity sensor (KRW 2000), airflow sensor (KRW 70,000), MRT sensor (KRW 45,000), camera (KRW 6000), and board (KRW 90,000), respectively. The total sum of the five devices is about KRW 213,000, which will be considered later in the economic analysis. In addition, the thermal properties of building constructions were configured as shown in Table 6 based on the drawing of the building, and the floor construction in which hot water pipes were laid for floor radiant heating consists of the material in the reverse order of the interior ceiling.
2.6. Simulation Case
In order to analyze the annual cooling and heating load and energy reduction effect through PMV control considering the real-time activity of the occupant in the residential building in this study, it was compared with the conventional dry-bulb temperature control method. In other words, the cooling and heating loads of the conventional indoor dry-bulb temperature control and PMV control were compared, and the representative days of summer and winter were designated as Weekday and Holiday for a more precise comparison analysis. In the conventional dry-bulb temperature control method, the cooling and heating temperatures were set at 25 °C and 21 °C, respectively, and in PMV control, the cooling and heating were configured at PMV 0.5 and −0.5, respectively. The representative days were selected as 6–7 August in the summer and 25–26 December in the winter, and these days represented the Weekday and Holiday, respectively. The representative days were selected by analyzing the upper 1% and lower 1% temperature by compiling weather data from 3 March 2009 to 31 March 2018 of the Incheon area.
2.7. Weekday, Holiday Schedule
In this study, the system operation time for Weekday and Holiday was determined according to the schedule of the occupant, and Table 3 and Table 4 show the results. When PMV control is performed through EnergyPlus, values below 1.0 are out of range of ASHRAE 55-2017, and thus accurate PMV evaluation is impossible. Therefore, all systems are set to OFF during the sleeping and unoccupied states in consideration of the schedule of the occupant.
3. Result and Discussion
3.1. PMV
This study predicted the level of thermal sensation expressed in terms of PMV on the representative days of summer and winter. As mentioned above, the system operating time is the time excluding sleeping time and unoccupied time. The sleeping time and unoccupied time are scheduled based on the ISO 18523-2 Residential buildings Annex A [20]. As a result, Figure 3 and Figure 4 show dry-bulb temperature control and PMV control for the summer representative days (6–7 August). The analysis was performed except for sleeping time, and the cooling and heating system was not operated when the occupant was outside or during the unoccupied time period. In case of PMV control, PMVs of the time period in which the occupant is active in the corresponding zone are all located within the comfort zone. On the other hand, dry-bulb temperature control did not satisfy the comfort of the occupant most of the time, and PMV varied from −0.6 to 1.6. This indicates that it is difficult to satisfy the comfort of the occupant through dry-bulb temperature control when the activity level of the occupant is high. The change of the activity level over time is shown in Table 3 and Table 4. During sleeping time and unoccupied time, the cooling and heating system do not operate, and the metabolic rate 1.0 and lower values including sleeping time and unoccupied time are outside the metabolic rate range of ASHRAE 55-2017, which makes accurate PMV evaluation impossible. As a result, even in the case of PMV control, PMV shows values from −0.5 to −0.8 which is below the heating setting value. On the other hand, Figure 3 and Figure 4 show that the indoor PMV is maintained at PMV +0.5, which is the cooling setting value when the activity of the occupant is high, and PMV values temporarily decreased as the activity level decreased.
Figure 5 and Figure 6 show PMV values for the representative days of winter (25–26 December), respectively. In the case of PMV control, PMV values when the occupant is active in the zone exist within the comfort zone, where the PMV is +0.5 during the period of increased activity and the PMV is slightly lower than +0.5 during the period of decreased activity. Because the sleeping and unoccupied time of the occupant are outside the metabolic rate range of ASHRAE 55-2017, PMV values are not correctly estimated and, therefore, not located within the comfort zone. The dry-bulb temperature control did not satisfy the comfort condition in many time periods, and the comfortable sensation of the occupant was “slightly warm” from 9 a.m. to 10 a.m., when the activity of the occupant was high.
Comparing the representative days of summer and winter, in the case of PMV control, the PMV was within the comfort zone at all time periods when the occupant was indoors. On the other hand, in case of dry-bulb temperature control, the comfort of the occupant was not satisfied during a significant number of time periods, and PMV dissatisfaction was higher in the summer compared to winter.
3.2. Indoor Temperature
The indoor temperature during summer and winter is analyzed in this chapter. The operating time of the system is the time excluding sleeping time and unoccupied time. As a result, in terms of Figure 7 and Figure 8 which show the indoor temperature of the representative days of summer, the system of the conventional control and PMV control does not operate when the activity state of the occupant is sleep or unoccupied and shows a similar indoor temperature at the corresponding time period. On the other hand, a large temperature difference occurs depending on the activity of the occupant when the system state is ON. On 6 August, the highest activity is observed at 10 a.m. and the activity level of the occupant reaches 360 W. Accordingly, the temperature difference at 10 a.m. between the PMV control and the conventional temperature control method is 11.7 °C. In addition, the activity is highest at 9 a.m. on 7 August (Weekday), and the activity level reaches 284 W. Accordingly, the temperature difference at 9 a.m. between PMV control and the conventional temperature control method is 7.6 °C. Figure 3 and Figure 4 show that indoor temperature difference between dry-bulb temperature control and PMV control is closely related to the activity level schedule when the comfort of the occupant is considered.
Figure 9 and Figure 10 show the indoor temperature change of the representative days of winter, and unlike the representative days of summer, the indoor temperature is higher in the case of the conventional temperature control than in the case of PMV control. This indicates that the indoor temperature generally set in winter is higher than the required temperature. In terms of the indoor temperature and PMV on 25 December (Holiday), there is almost no temperature difference between the temperature until 7 a.m. when the system is OFF and when the system is turned ON at 8 a.m. This is because it takes a considerable amount of time to reach the required comfort zone due to the thermal storage effect even after the floor radiant heating is operated. Figure 5 shows that PMV experienced by the occupant does not have a significant temperature difference due to the increased activity from 8 a.m. to 10 a.m. and is located within the comfort zone. The indoor temperature shows a sudden increase at 8 a.m. on 26 December (Weekday), and this is because the activity of the occupant declines at 8 a.m. and the system is controlled to satisfy the comfort of the occupant by increasing the indoor temperature.
3.3. Hourly Cooling and Heating Rate
The hourly zone heating and cooling are analyzed in this chapter. As shown in Figure 11, PMV control generates a rapidly high cooling rate at 10 a.m. This is because the occupant is in the house cleaning state which requires a high activity level at the corresponding time period. Due to the high activity of the occupant, the maximum load difference on the representative day of the 6 August (Holiday) between PMV control and dry-bulb temperature control was 14,045.2 W. In addition, the cooling rate was lower than that of the conventional control method for the rest of the day except for 10 a.m. and 5 p.m. when the activity was high, but the daily total load of PMV control on the representative day of the 6 August (Holiday) was 12% higher than that of the dry-bul28b temperature control due to the high cooling rate at 10 a.m. As for Figure 12 for the weekday, the cooling rate rapidly increases at 9 a.m. Like the holiday, this is because the occupant is in the house cleaning state which requires a high activity level at the corresponding time period. Due to the high activity of the occupant, the maximum load difference on the representative day of 7 August (Weekday) between PMV control and dry-bulb temperature control was 6862.2 W. Like the holiday, the weekday also shows a lower cooling rate than that of the conventional control method except for the house cleaning time which requires high activity, and the load increases and decreases irregularly according to the amount of activity rather than constantly decreasing as in the conventional control method. Even though a high cooling rate occurred at 9 a.m, in case of the weekday, the daily total load of PMV control on the representative day of 7 August (Weekday) was 21% lower than that of the dry-bulb temperature control. Figure 11 and Figure 12 both show unusually high cooling rates at 10 a.m. and 9 a.m. due to the high activity when the occupant is in the house cleaning state. PMV control shows a high load for the holiday, while the dry-bulb temperature control shows a high load for the weekday. This is because the high activity of the occupant in the house cleaning state shows a high cooling rate in both holiday and weekday, but the daily average holiday activity level of the occupant is higher than the weekday activity level due to the higher activity level after 5 p.m. on the holiday.
However, controlling the PMV for every household considering the high activity when the occupant is cleaning seems to be unrealistic. In fact, the cooling system is not over-operated as shown in Figure 11 and Figure 12, and most of the windows are open during cleaning time. Therefore, this study reflects this part and assumes to conduct the same dry bulb temperature control as the conventional control method at 10 a.m. (Holiday) and 9 a.m. (Weekday) when the occupant is cleaning for further analysis. As a result, the house cleaning time periods in Figure 13 and Figure 14 show a sharp decrease of cooling load compared to Figure 11 and Figure 12 and show the same results as the previous graph for other time periods. Accordingly, PMV control shows a 29.3% cooling load reduction effect of 19.9 kWh on the holiday and a 39.7% reduction of 11.3 kWh on the weekday compared to the conventional control method.
On the representative days of 25–26 December in the winter, the graph forms of holiday and weekday were significantly different from the previous representative days of summer. Figure 15 shows that no load is generated even though the system is in the ON state when the activity is high, and the heating rate was generated from 7 p.m. to 11 p.m. when the activity is low. In case of maximum heating rate, even though PMV control was 958.2 W higher than dry-bulb temperature control, the daily total heating rate of PMV control was 52.5% less than that of dry-bulb temperature control. In addition, the heating rate of PMV control occurred intensively from 8 p.m. to 10 p.m. when the activity level of the occupant was low.
Figure 16 shows a high heating rate at 8 a.m. when the activity level is the lowest, and shows a higher heating load than that of the conventional control method due to low activity at 10 p.m. Examining the conventional control method and PMV control method separately, the amount of activity from 7 a.m. to 10 a.m. on the weekday is higher than that of the holiday, which results in the difference of heating load between the two cases. Although the maximum heating rate of PMV control was 1923.8 W higher than that of dry-bulb temperature control, the daily total heating rate of PMV control was 5.58% less than that of dry-bulb temperature control. Dry-bulb temperature control showed the highest heating rate when the system starts to operate for both holiday and weekday and PMV control showed the highest heating rate when the activity level of the occupant was the lowest. In the case of PMV control, this confirms that the activity level and heating rate are closely related.
3.4. Daily Energy Consumption
The daily energy consumption was analyzed in this chapter. Figure 17 shows the electric consumption in August. The maximum and minimum energy consumption occurred on 11 August and 28 August, respectively. In addition, as a result of comparing the energy consumption of the conventional control and PMV control in August, PMV control consumes 176.9 kWh less energy than the conventional control, which corresponds to a 28.8% reduction rate. Figure 18 shows the gas consumption in December. The maximum and minimum energy consumption occurred on 16 December and 8 December, respectively. In addition, as a result of comparing the energy consumption of the conventional control and PMV control in December, PMV control consumes 249 kWh less energy than the conventional control, which corresponds to a 24.8% reduction rate.
Figure 17 and Figure 18 show the site energy consumption. In order to calculate the primary energy, as stipulated under operating regulations of the Building Energy Efficiency Certification Program (2016.03.03, 6th), electricity is calculated by multiplying the site energy in Figure 17 by 1.1, and the gas is calculated by multiplying the site energy heating rate in Figure 18 by 2.75. Table 7 [21] shows the primary energy conversion factors of the operating regulations of the Building Energy Efficiency Certification Program.
3.5. Monthly and Annual Heating and Cooling Energy Consumption
In this chapter, the annual heating and cooling energy consumption analysis is performed, and the results are shown in Figure 19 and Figure 20. The heating energy consumption was the highest in January and the lowest in April. In May, dry-bulb temperature control did not generate heating energy, but PMV control generated heating energy, and PMV control showed a higher heating rate consumption in March, April, and May. In the case of annual gas consumption, PMV control showed 7.3% less energy consumption than dry-bulb temperature control. Cooling energy showed the highest consumption in August, and the consumption of dry-bulb temperature control was higher than PMV control in every month. Based on annual cooling energy, PMV control can reduce energy consumption by 28.8% compared to dry-bulb temperature control.
In other words, boiler gas consumption mainly occurred in January, February, March, April, November, and December, while window air conditioner electricity consumption occurred in May, June, July, August, September, and October. In the case of applying the conventional control method for house cleaning time which requires a high activity level from the occupant on the weekday and holiday, the window air conditioner electricity consumption through PMV control reduces the electricity consumption by 28.8%, gas consumption by 7.3%, and annual energy consumption by 15.7% resulting in an excellent energy reduction effect.
3.6. Economic Analysis
In this chapter, the economic efficiency was comparatively analyzed when the indoor space was controlled by the conventional dry-bulb temperature control and PMV control. In order to perform the economic efficiency evaluation, the life-cycle cost (LCC) analysis was performed based on the present value analysis method using the average discount rate of 3.24% of the 10-year base rate of the Bank of Korea, and the analysis period was for 11 years. The equipment required for PMV control and dry-bulb temperature control are listed in the following Table 8, and the initial investment cost was calculated by reviewing the quotations from many specialized companies. The annual maintenance cost of each system is assumed to be the same because the purpose is to analyze the payback period according to the annual energy cost reduction.
In case of the simulation model, each household was divided into 5 zones with 3 rooms, a kitchen, and a living room, excluding the veranda and bathroom. The total installation cost for the 5 zones of dry bulb temperature control was KRW 275,000 ($254.75), while the total installation cost for the 5 zones of PMV control was KRW 1,340,000 ($1241.32), so the initial installation cost difference between the two control methods was KRW 1,065,000 ($986.57). As a result of the monthly energy consumption analysis of dry-bulb temperature control and PMV control, PMV control showed a 7.2% and 28.8% reduction rate of annual gas and electricity energy consumption compared to dry-bulb temperature control, respectively, and an annual average energy reduction rate of 15.7%. In terms of calculating the operating cost of each system, the site energy consumption was calculated by considering the cooling and heating load and the COP of each system, and the daily and monthly power consumption was converted into the electric rate for calculation. In terms of the electric rate according to the electric base consumption, the residential service (high-voltage) rate table provided by KEPCO [22] was used, which is summarized in Table 9. The electric rates according to electricity consumption are shown in Table 10. In case of using 200 kWh or less, the guaranteed deduction for required consumption was applied through a limit reduction of KRW 2500 ($2.32) per month, and for summer (July to August) and winter (December to February), the electric rate was calculated based on the super-user rate of KRW 574.6 ($0.53)/kWh when using more than 1000 kWh. In addition, the gas rate according to gas consumption was based on the rate table provided by KOGAS [21], and the amount of adding a 10% premium to KRW 13.5353 ($0.01) per MJ was converted into kWh for calculation. As a result, the total annual savings amounted to KRW 158,845 ($147.15).
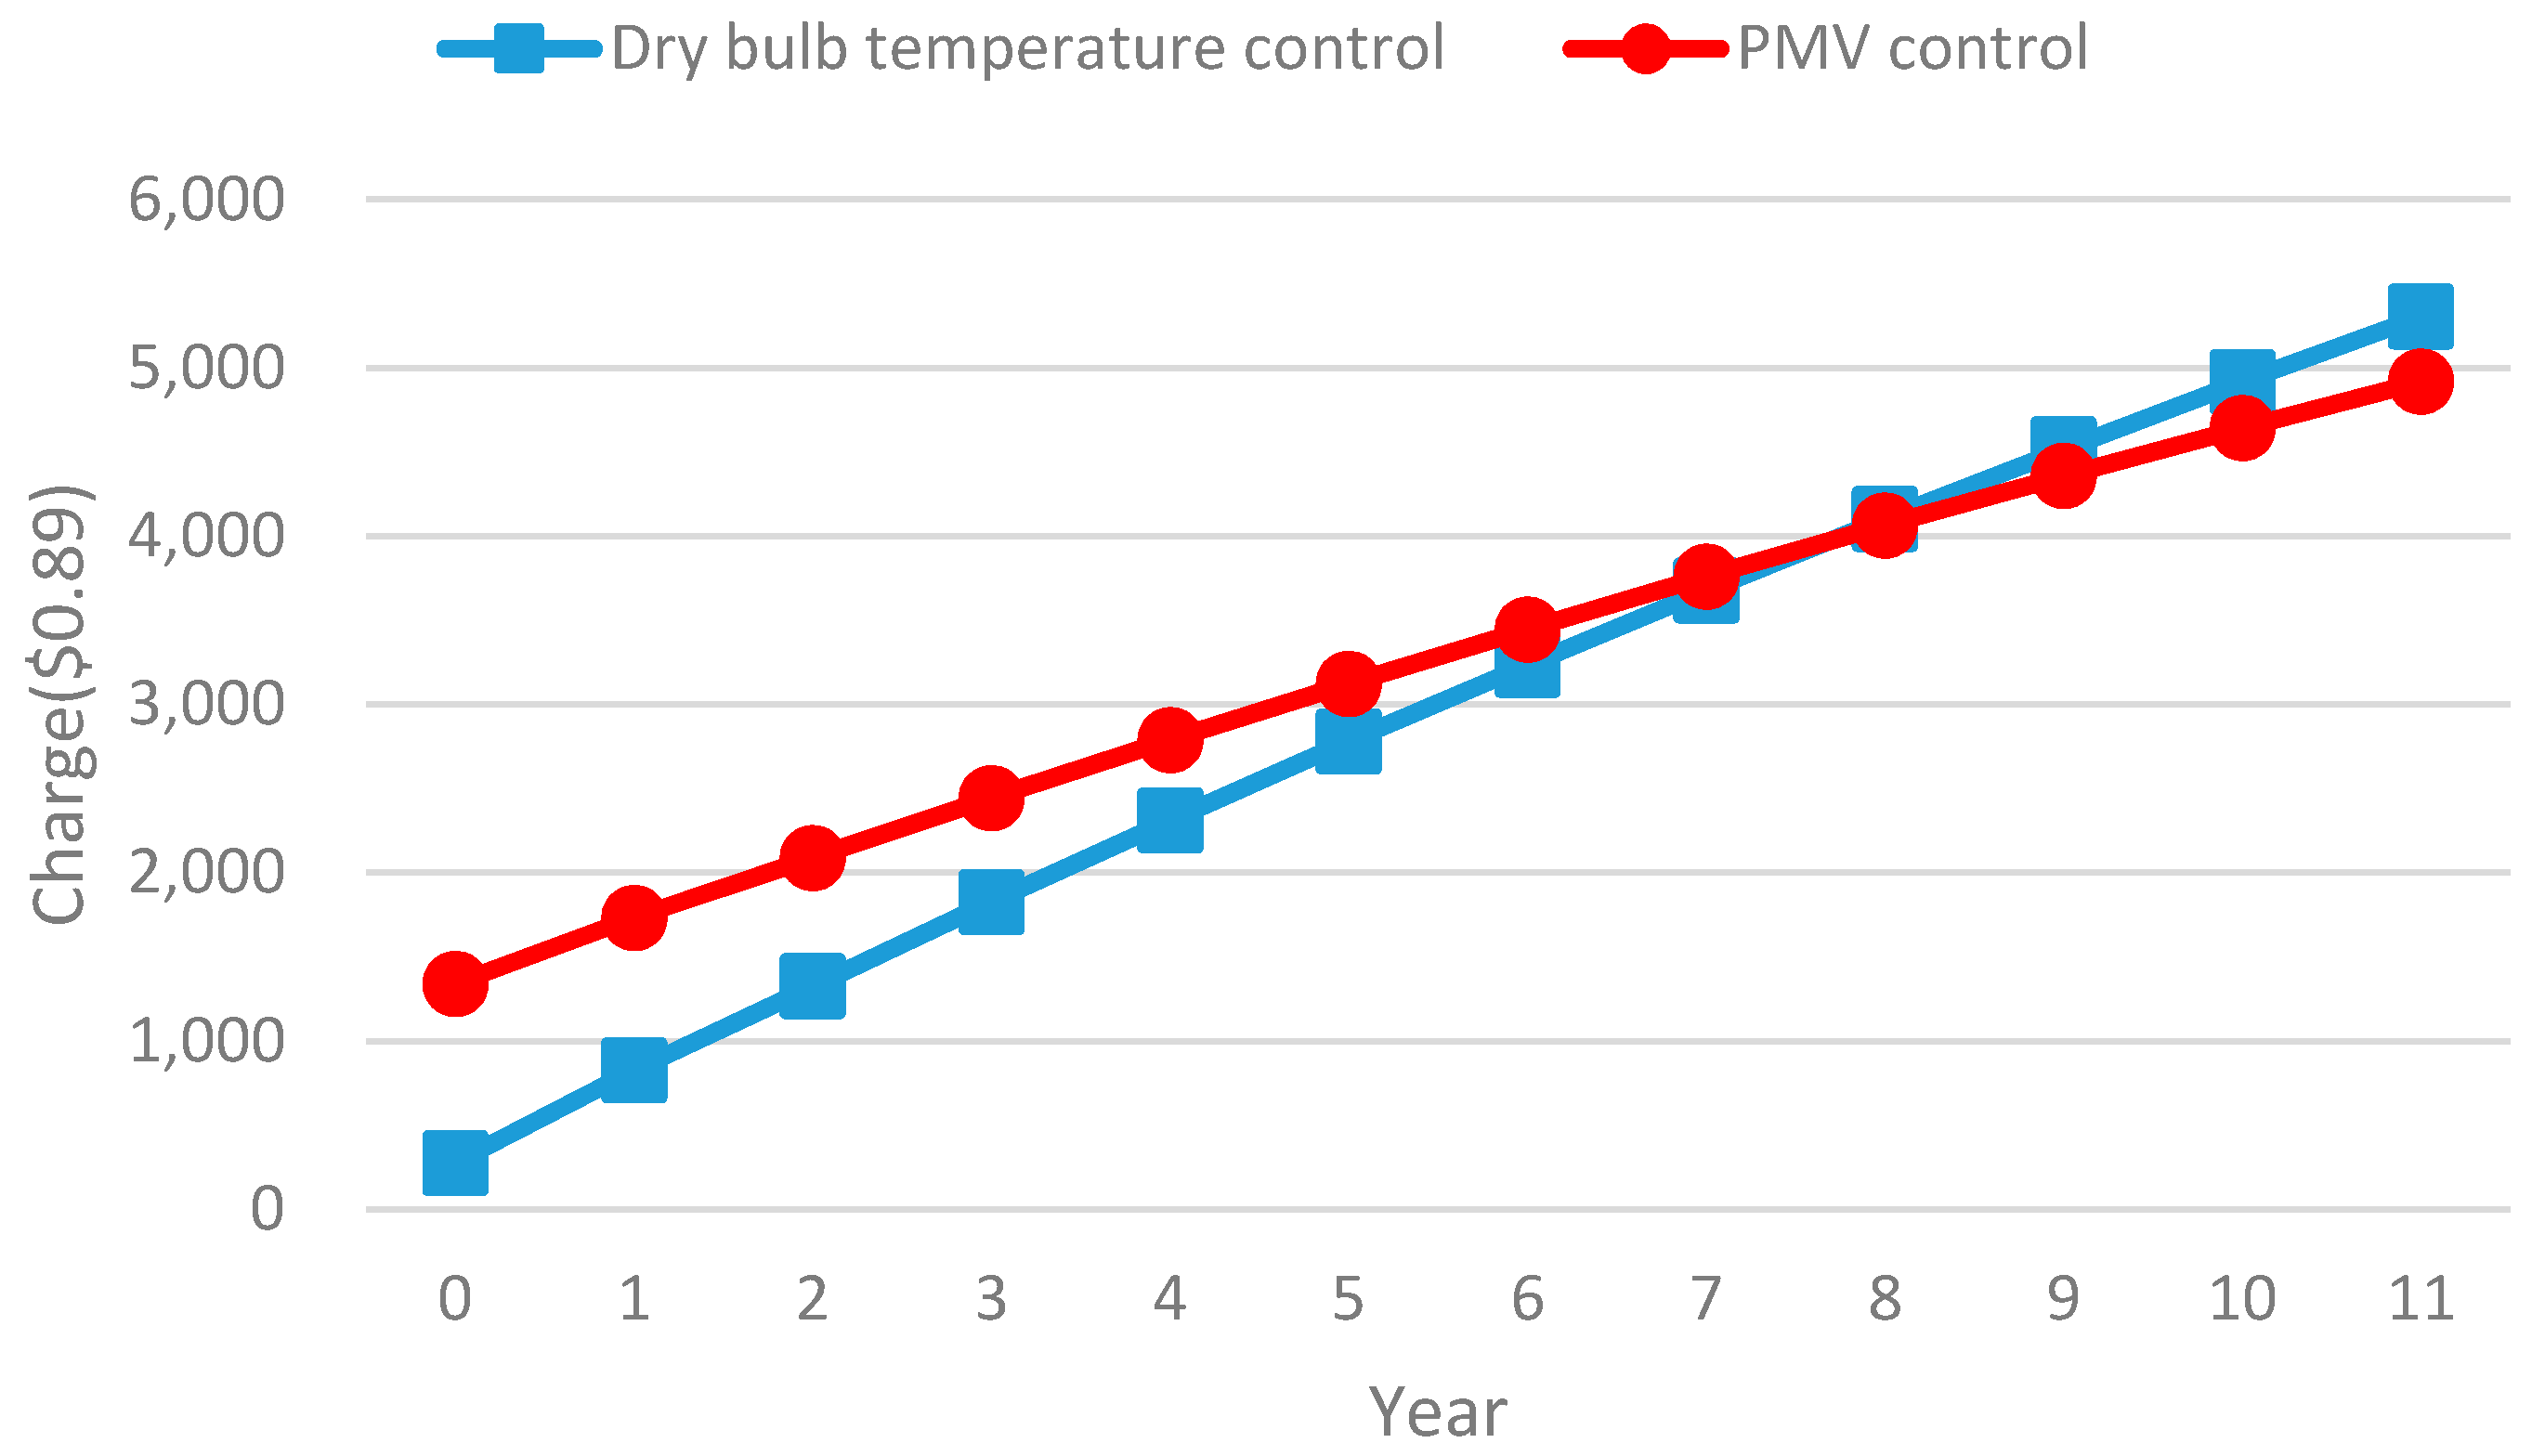
The present value of future cash and the capitalization factor of annuity were considered in order to analyze the initial investment cost payback period according to the reduction of annual energy consumption through comparison between dry-bulb temperature control and PMV control. As a result, the calculation equations are shown in Equations (1)–(3), and the payback period analysis results considering the rate calculations and corresponding equations mentioned above are shown in Figure 21
PF: The present value of future cash
PA: Capitalization factor of annuity
A: Annual cost
F: Cost incurred after n years
P: Present value
I: Discount value
n: Analysis period
The present value of future cash for dry-bulb temperature control is KRW 275,000 ($254.75), and the capitalization factor of annuity for PMV control is KRW 1,340,000 ($1241.32). The annual cost was KRW 158,845 ($147.15), and the analysis period was for 11 years. The Table 10 shows the present value by year. As a result of payback period analysis, a payback period of about 8.4 years was required as can be seen in Figure 21. Since the schedule and activity level of the simulation model was based on a 44-year old woman from a family of four as presented in the ISO 18523-2 Residential Buildings Annex A [20], there will be some difference depending on the type of building, family members, and climate by region.
4. Conclusions
In this study, the annual cooling and heating energy saving effect of PMV control taking hourly metabolic rate variations into account was evaluated in comparison with dry-bulb temperature control for the indoor environment of a 15-story residential apartment equipped with a radiant floor heating system and window air conditioner, and the LCC analysis was performed through the capitalization factor of annuity considering the annual cost, present value of future cash, and discount value. In case of PMV control, the indoor air was controlled to maintain a value between PMV −0.5 and +0.5 which corresponds to the comfort zone, and the conclusions of this study are as follow.
In case of PMV control, when the system is ON, hourly PMVs are all located within the comfort zone. The system is turned OFF when the activity state of the occupant is sleep or unoccupied, in which PMV varies from −0.5 to −0.8, which is almost near the comfort region but not exactly within the PMV set-point of between −0.5 and +0.5. In addition, PMV values were observed to vary over time as the activity of the occupant increased or decreased.
When the activity state of the occupant is house cleaning in the summer, the indoor temperature decreases rapidly due to the high amount of activity. It requires a temperature that is 11.7 °C and 9.7 °C lower than the conventional dry-bulb air temperature control method, respectively, and generally forms a higher indoor air temperature than the conventional control method after 7 p.m. This means the difference in temperature to satisfy the comfort of the occupant according to the amount of activity, and during winter as opposed to summer, it was found to form a lower indoor air temperature than the conventional temperature control.
In case of annual boiler gas consumption, PMV control showed 7.3% less energy consumption than dry-bulb air temperature control, and PMV control showed 28.8% less energy consumption than dry-bulb air temperature control for annual cooling electricity consumption.
Considering the cooling and heating energy reduction rate and the initial installation cost of measuring equipment for real-time metabolic rate and PMV measurement, a payback period of about 4.15 years is required, and in case of mass production, the payback period is expected to be further reduced due to the reduction of production costs. However, the corresponding schedule is based on a 44-year old woman described in ISO Standard 18523-2, and there will be some differences depending on the climatic condition by region and the type of building.
Author Contributions
All authors contributed equally to this work. All authors designed the simulations, discussed the results and implications and commented on the manuscript at all stages. S.H.H. performed the energy simulations and J.M.L. led the development of the paper. J.W.M. and K.H.L. performed the result analysis and discussion.
Acknowledgments
This research was supported by a grant (code 18CTAP-C130966-02) from Infrastructure and Transportation Technology Promotion Research Program funded by Ministry of Land, Infrastructure and Transport of Korean government.
Conflicts of Interest
The authors declare no conflict of interest.
References
- Kim, Y.S.; Chang, S.J. Development of indoor CO2 level associated building PMV prediction model using artificial neural network. Archit. Inst. Korea 2017, 37, 612–615. [Google Scholar]
- Korea Institute of S&T Evaluation and Planning 2015, 29. Available online: http://www.kistep.re.kr/c3/sub6.jsp (accessed on 26 December 2015).
- Kim, S.H.; Yun, S.J.; Chung, K.S. A study on the application of simulation-based simplified PMV regression model for indoor thermal comfort control. J. Energy Eng. 2015, 24, 69–77. [Google Scholar] [CrossRef]
- Jang, H.I.; Suh, S.J. Analysis of indoor thermal environment and energy consumption in office building controlled by PMV. Korean Sol. Energy Soc. 2013, 33, 15–22. [Google Scholar] [CrossRef]
- AREN 3050 Environmental Systems for Building I. Prediction Thermal Comfort. Available online: http://ceae.colorado.edu/~brandem/aren3050/ (accessed on 20 October 2005).
- Federation of European Heating, Ventilation and Air-conditioning Association. Indoor Environment and Productivity in Office Environment-Summary of the Key Contents of REHVA Guidebook No. 6; REHVA: Brussels, Belgium, 2014. [Google Scholar]
- d’Ambrosio Alfano, F.R.; Olesen, B.W.; Palella, B.I.; Riccio, G. Thermal comfort: Design and assessment for energy saving. Energy Build. 2014, 81, 326–336. [Google Scholar] [CrossRef]
- Fanger, P.O. Thermal Comfort; Danish Technical Press: Copenhagen, Denmark, 1970. [Google Scholar]
- ASHRAE (American Society of Heating, Refrigerating and Air-Conditioning Engineers). Thermal Environmental Conditions for Human Occupancy; ASRHAE Standard 55: Atlanta, GA, USA, 2017. [Google Scholar]
- ISO (International Organization for Standardization). Moderate Thermal Environments—Determination of the PMV and PPD Indices and Specification of the Conditions for Thermal Comfort; ISO 7730; ISO: Geneva, Switzerland, 2005. [Google Scholar]
- ISO. Ergonomics of the Thermal Environment—Determination of Metabolic Rate; ISO 8996:2004; ISO: Geneva, Switzerland, 2004. [Google Scholar]
- ISO. Ergonomics of the Thermal Environment—Estimation of Thermal Insulation and Water Vapour Resistance of a Clothing Ensemble; ISO 9920:2007; ISO: Geneva, Switzerland, 2007. [Google Scholar]
- Malchaire, J.; Ambrosio Alfano, F.R.; Palella, B.I. Evaluation of the metabolic rate based on the recording of the heart rate. Ind. Health 2017, 55, 219–232. [Google Scholar] [CrossRef] [PubMed] [Green Version]
- Ambrosio Alfano, F.B.; Olesen, B.W.; Palella, B.I. Povl ole fanger’s impact ten years later. Energy Build. 2017, 152, 243–249. [Google Scholar] [CrossRef]
- Ambrosio Alfano, F.B.; Palella, B.I.; Riccio, G. Notes on the calculation of the PMV index by means of apps. Energy Procedia 2016, 101, 249–256. [Google Scholar] [CrossRef]
- Leger, J.; Rousse, D.R.; Le Borgne, K.; Lassuec, S. Comparing electric heating systems at equal thermal comfort: An experimental investigation. Build. Environ. 2018, 128, 161–169. [Google Scholar] [CrossRef]
- Jette, M.; Sidney, K.; Blumchen, G. Metabolic Equivalents (METS) in Exercise Testing, Exercise Prescription and Evaluation of Functional Capacity; Department of Kinanthropology, School of Human Kinetics, University of Ottawa: Ottawa, ON, Canada, 1990; Volume 13, pp. 555–565. [Google Scholar]
- The U.S. Department of Energy. EnergyPlus Engineering Reference: The Reference to EnergyPlus Calculations; The U.S. Department of Energy: Washington, DC, USA, 2011. [Google Scholar]
- The U.S. Department of Energy. EnergyPlus Input Output Reference: The Encyclopedic Reference to EnergyPlus Input and Output; The U.S. Department of Energy: Washington, DC, USA, 2010. [Google Scholar]
- ISO. Energy Performance of Buildings—Schedule and Condition of Building, Zone and Space Usage for Energy Calculation, Part 2 Residential Buildings, Annex A; ISO 18523-2; ISO: Geneva, Switzerland, 2018. [Google Scholar]
- Korea Energy Agency. Available online: http://www.kogas.or.kr/portal.contents.do?key=2024 (accessed on 1 January 2016).
- Korea Electric Power Corporation. 2016. Available online: http://cyber.kepco.co.kr/ckepco (accessed on 1 December 2016).
Figure 1.
Floor plan.
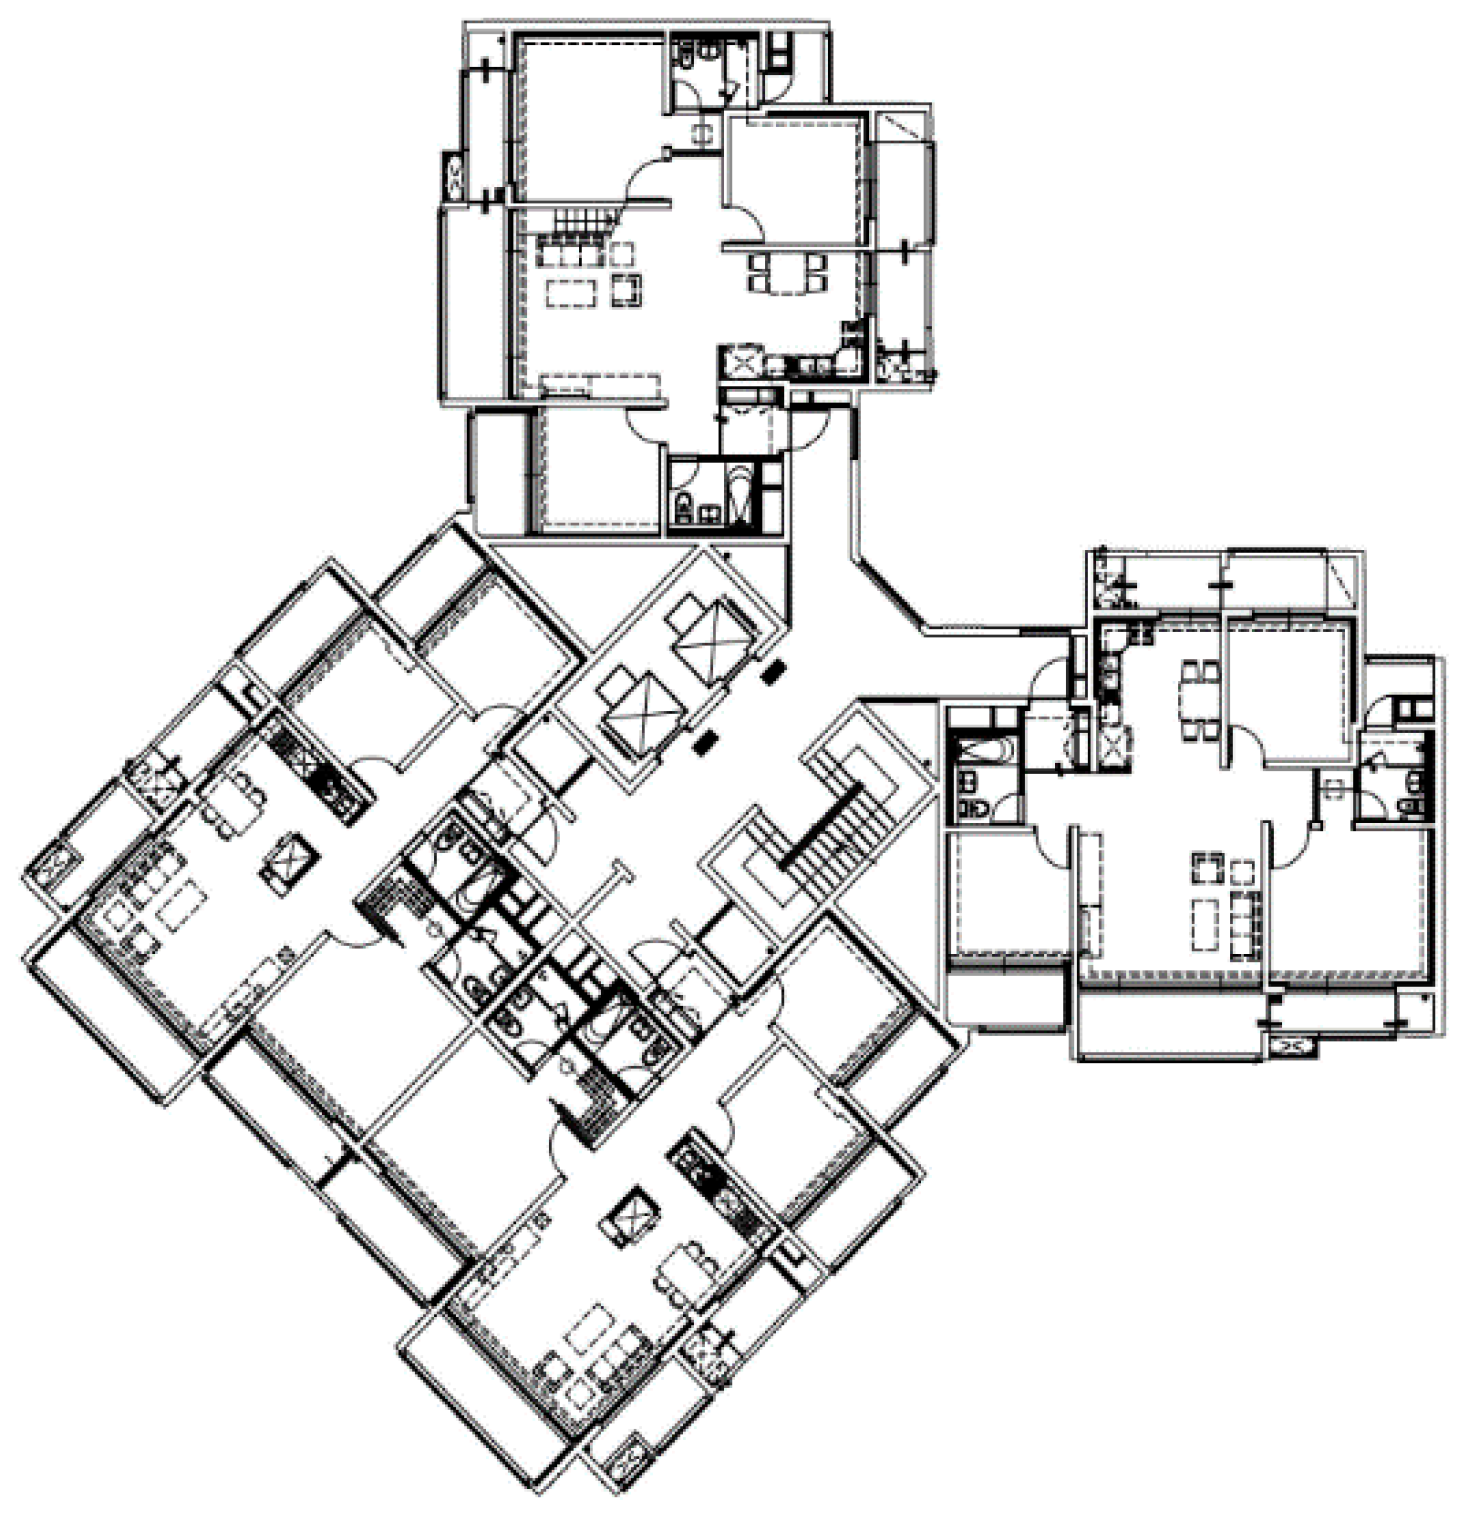
Figure 2.
The exterior view of the simulation model.
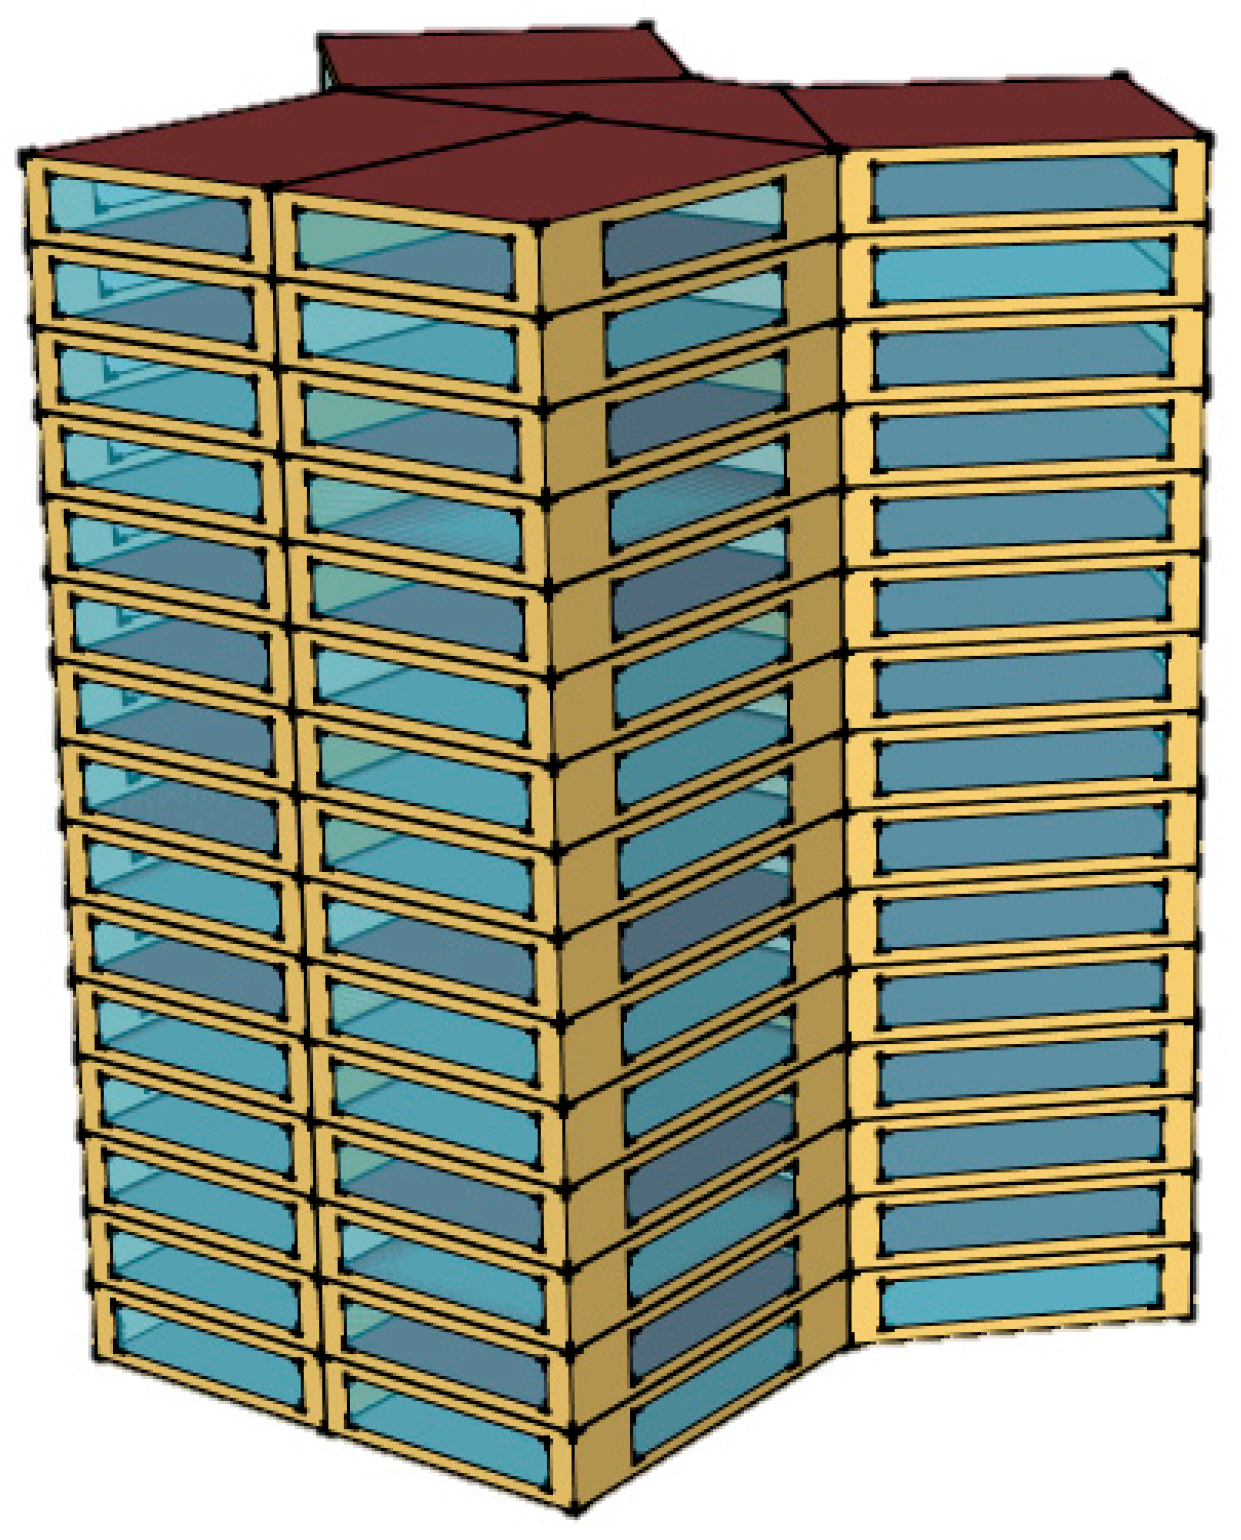
Figure 3.
The predicted mean vote (PMV) variations in the summer holiday (6 August).
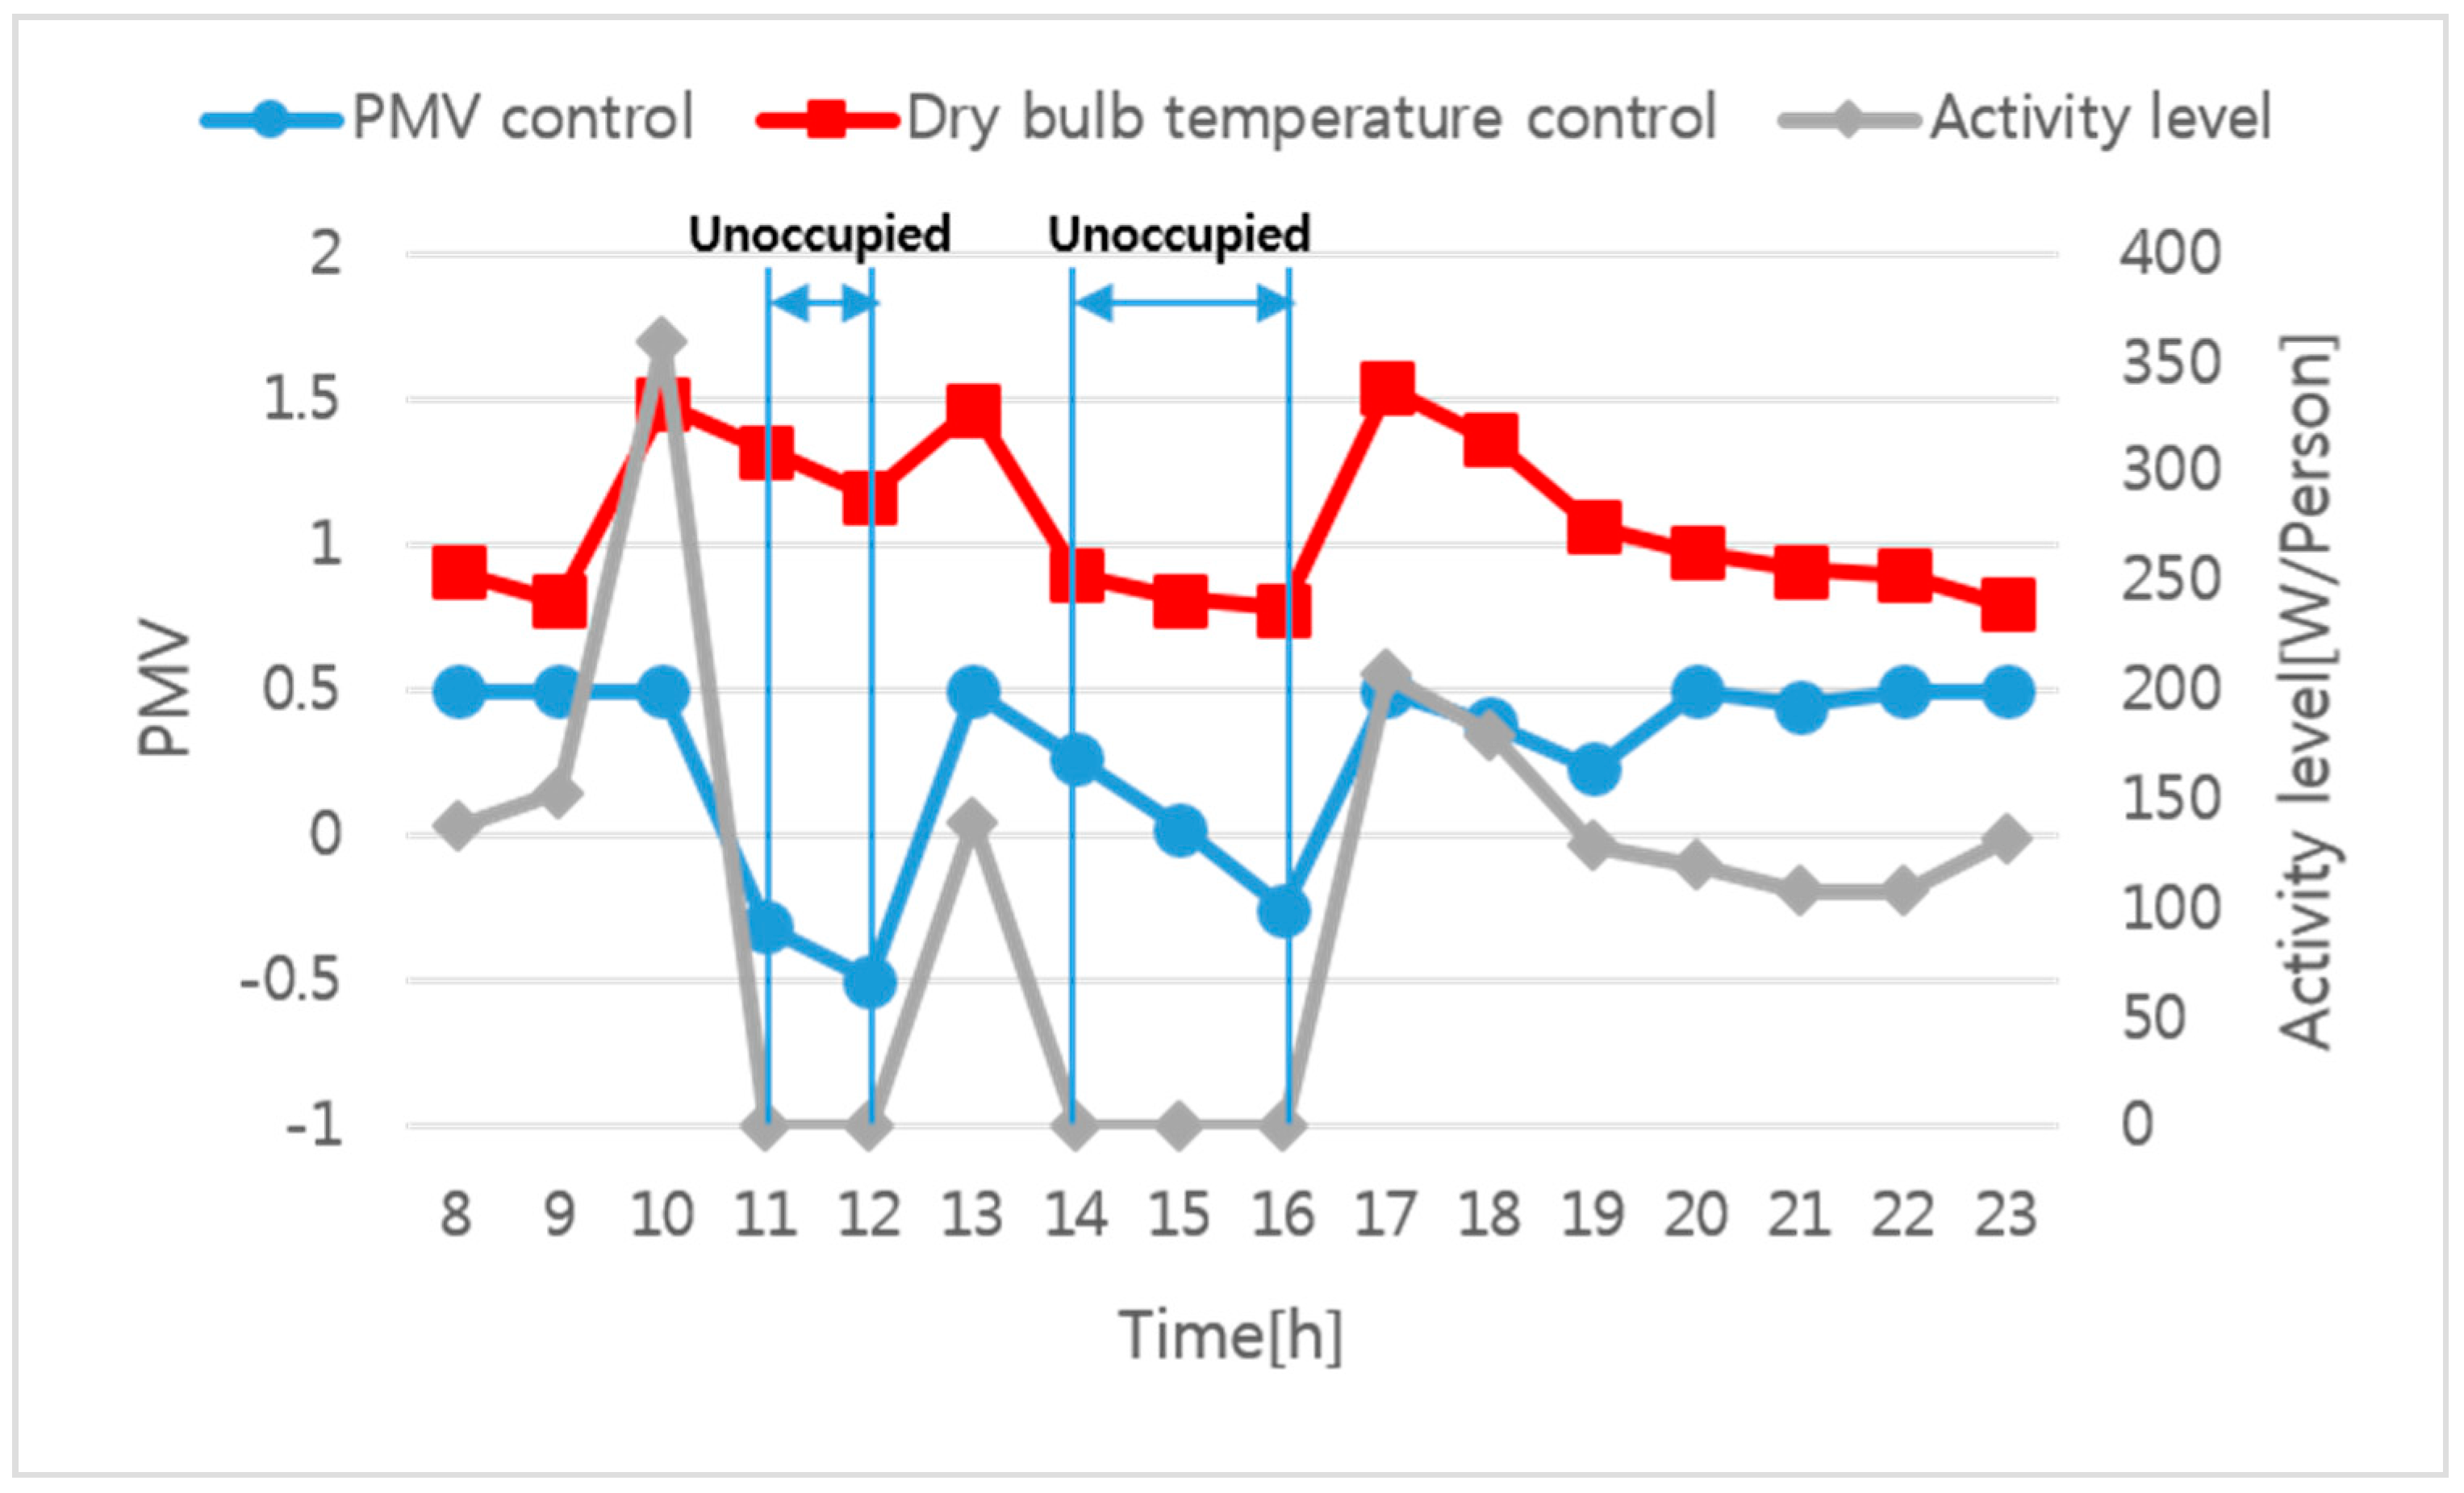
Figure 4.
The PMV variations in the summer weekday (7 August).
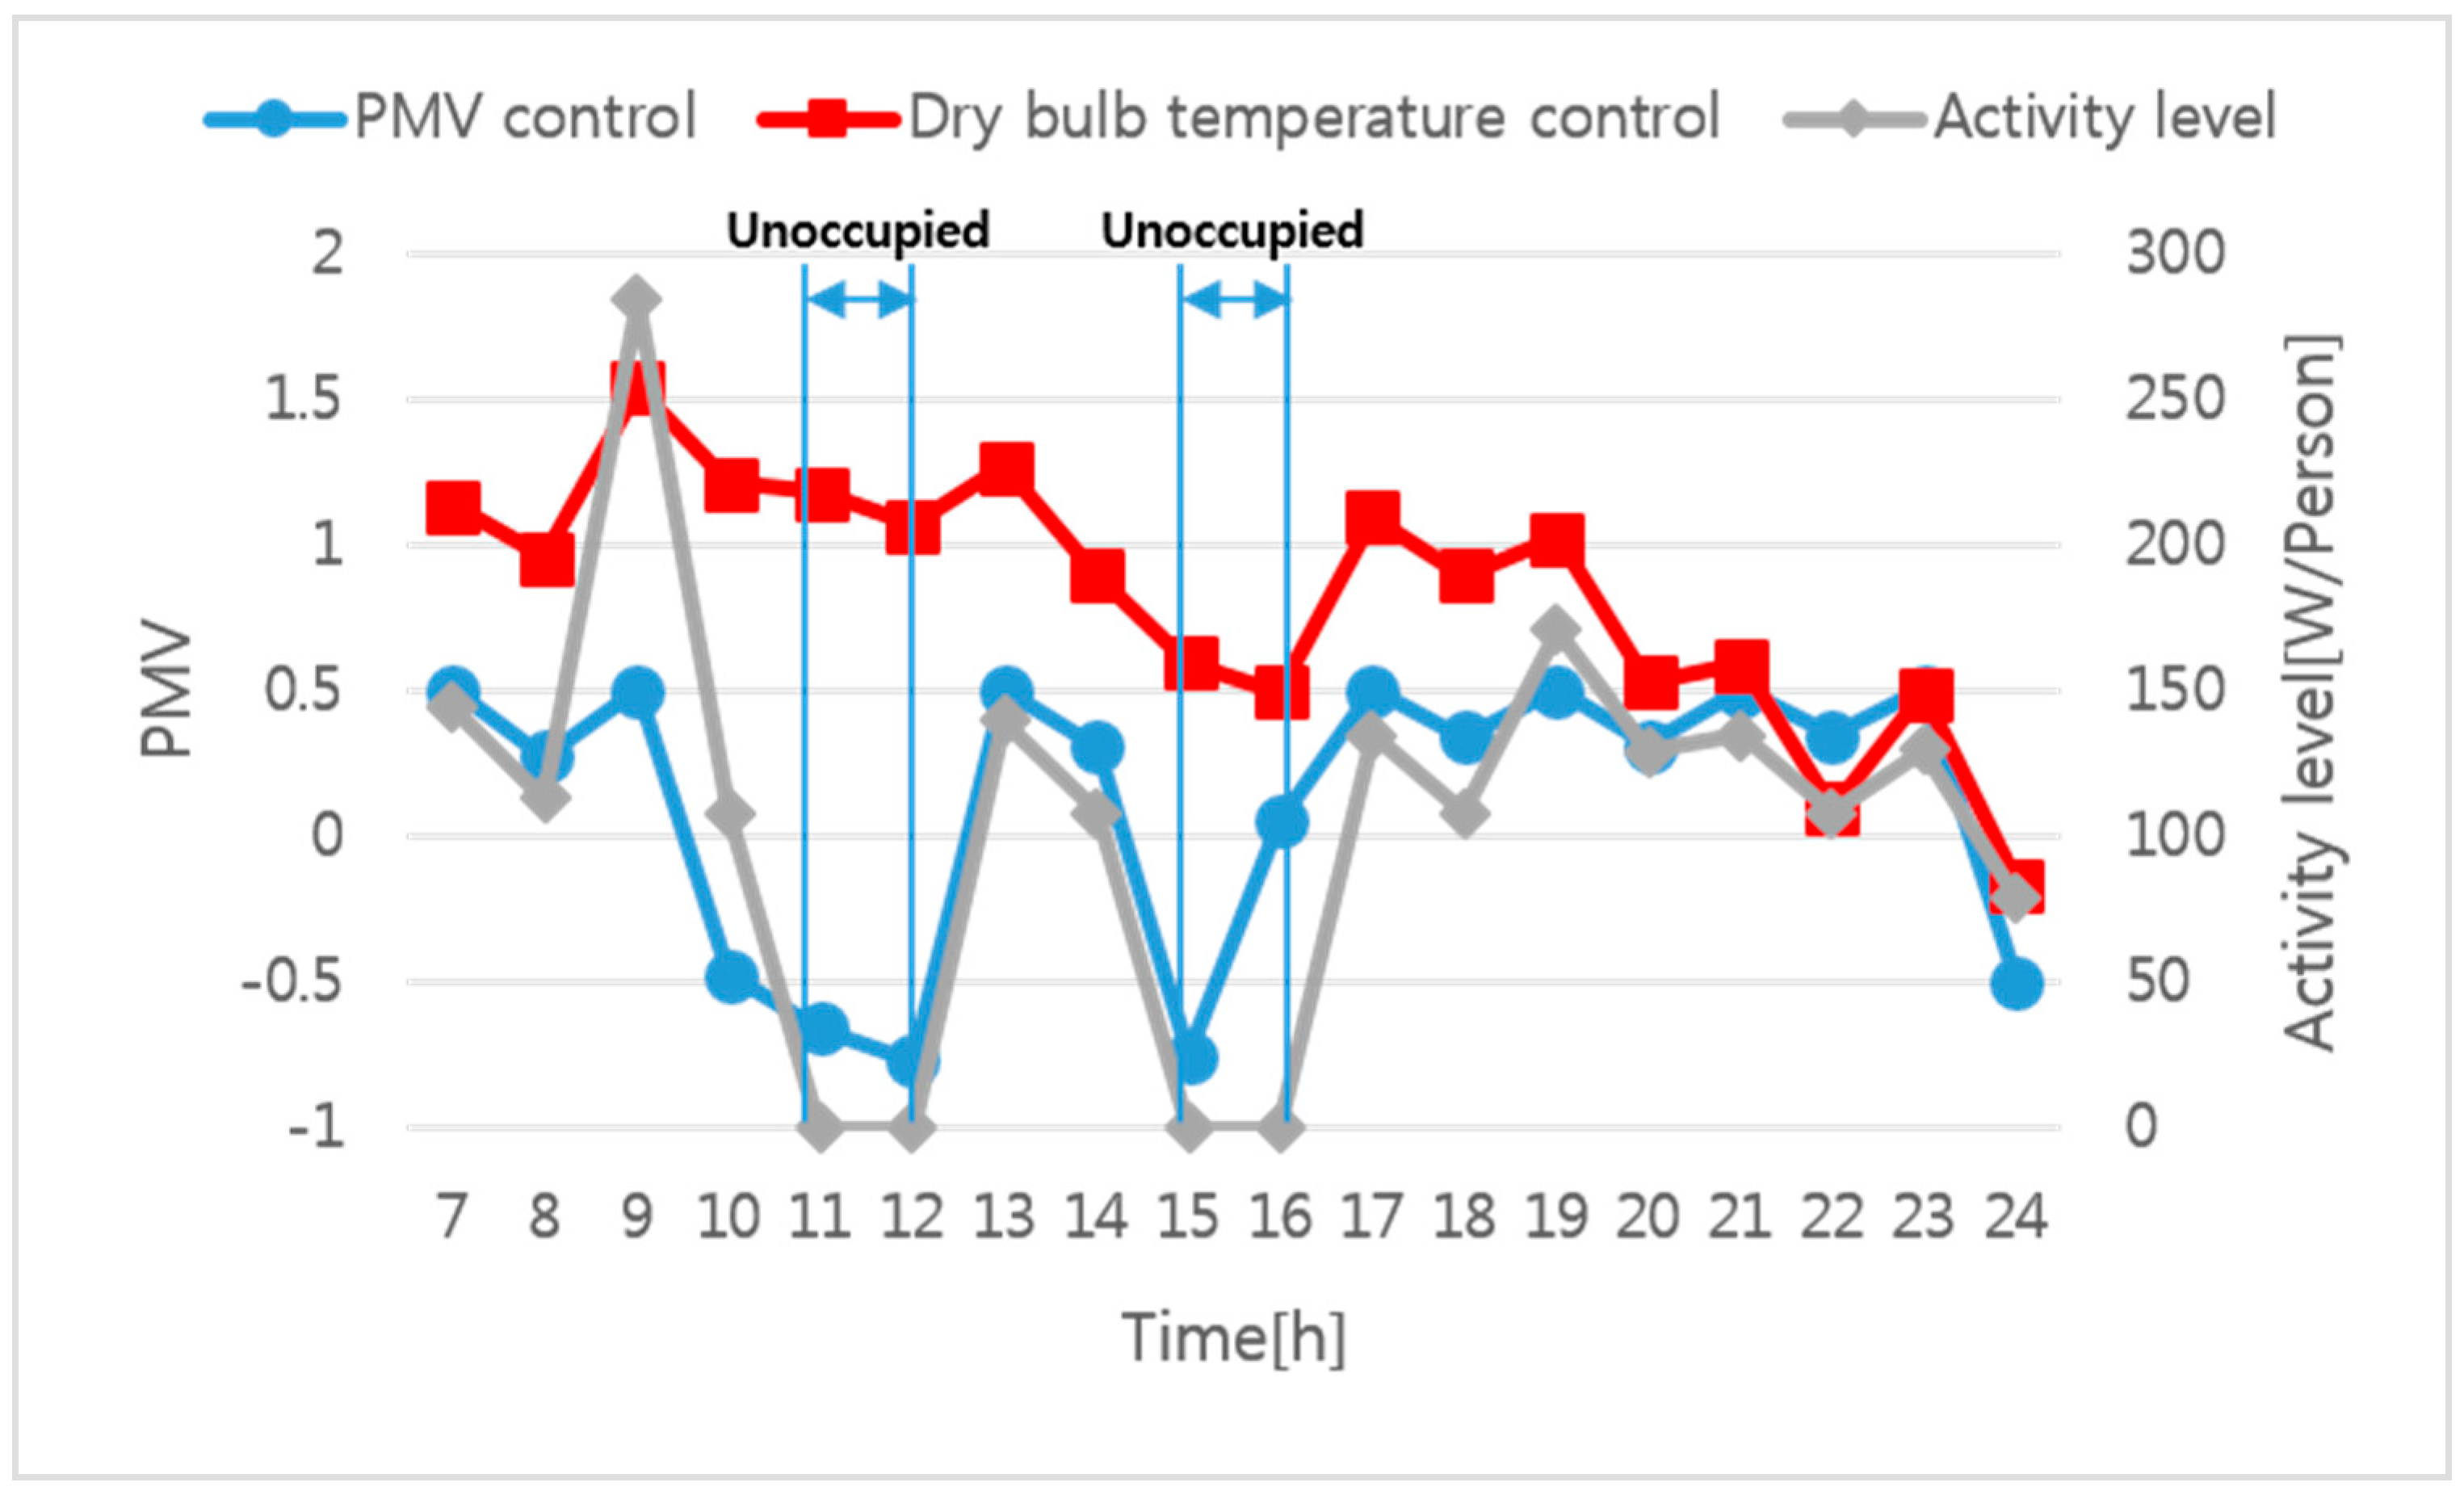
Figure 5.
The PMV variations in the winter holiday (25 December).
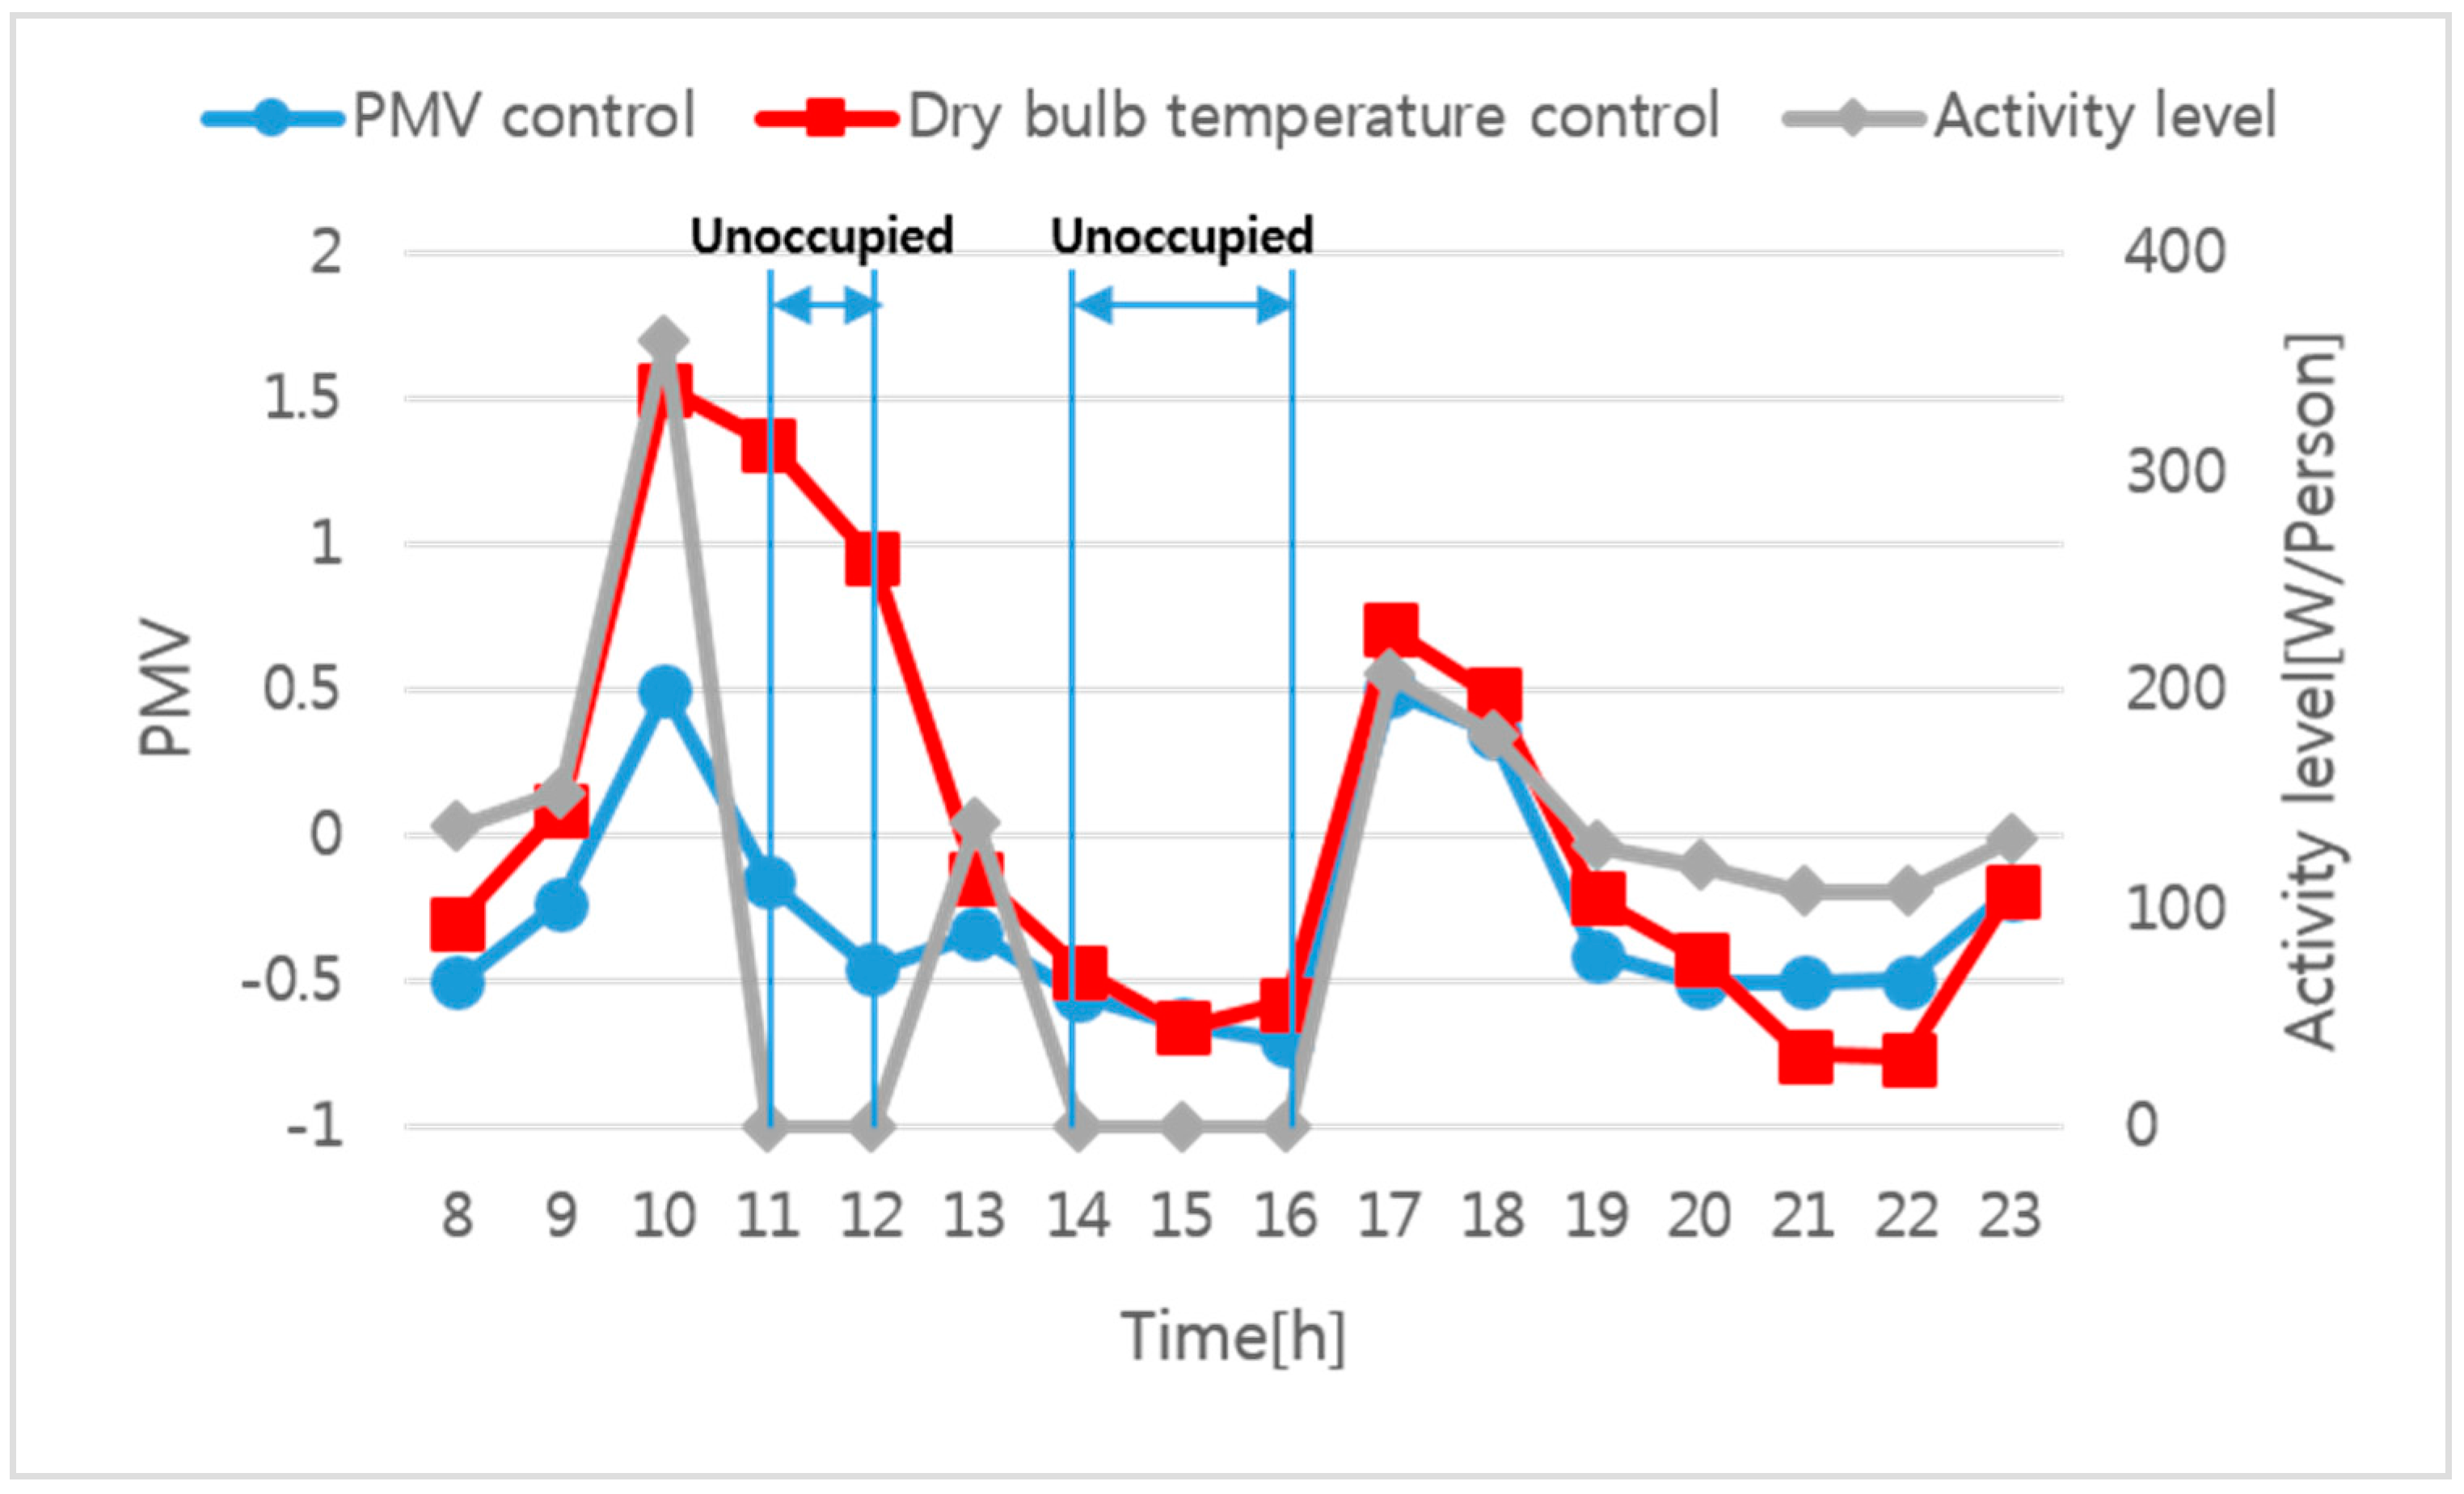
Figure 6.
The PMV variations in the winter weekday (26 December).
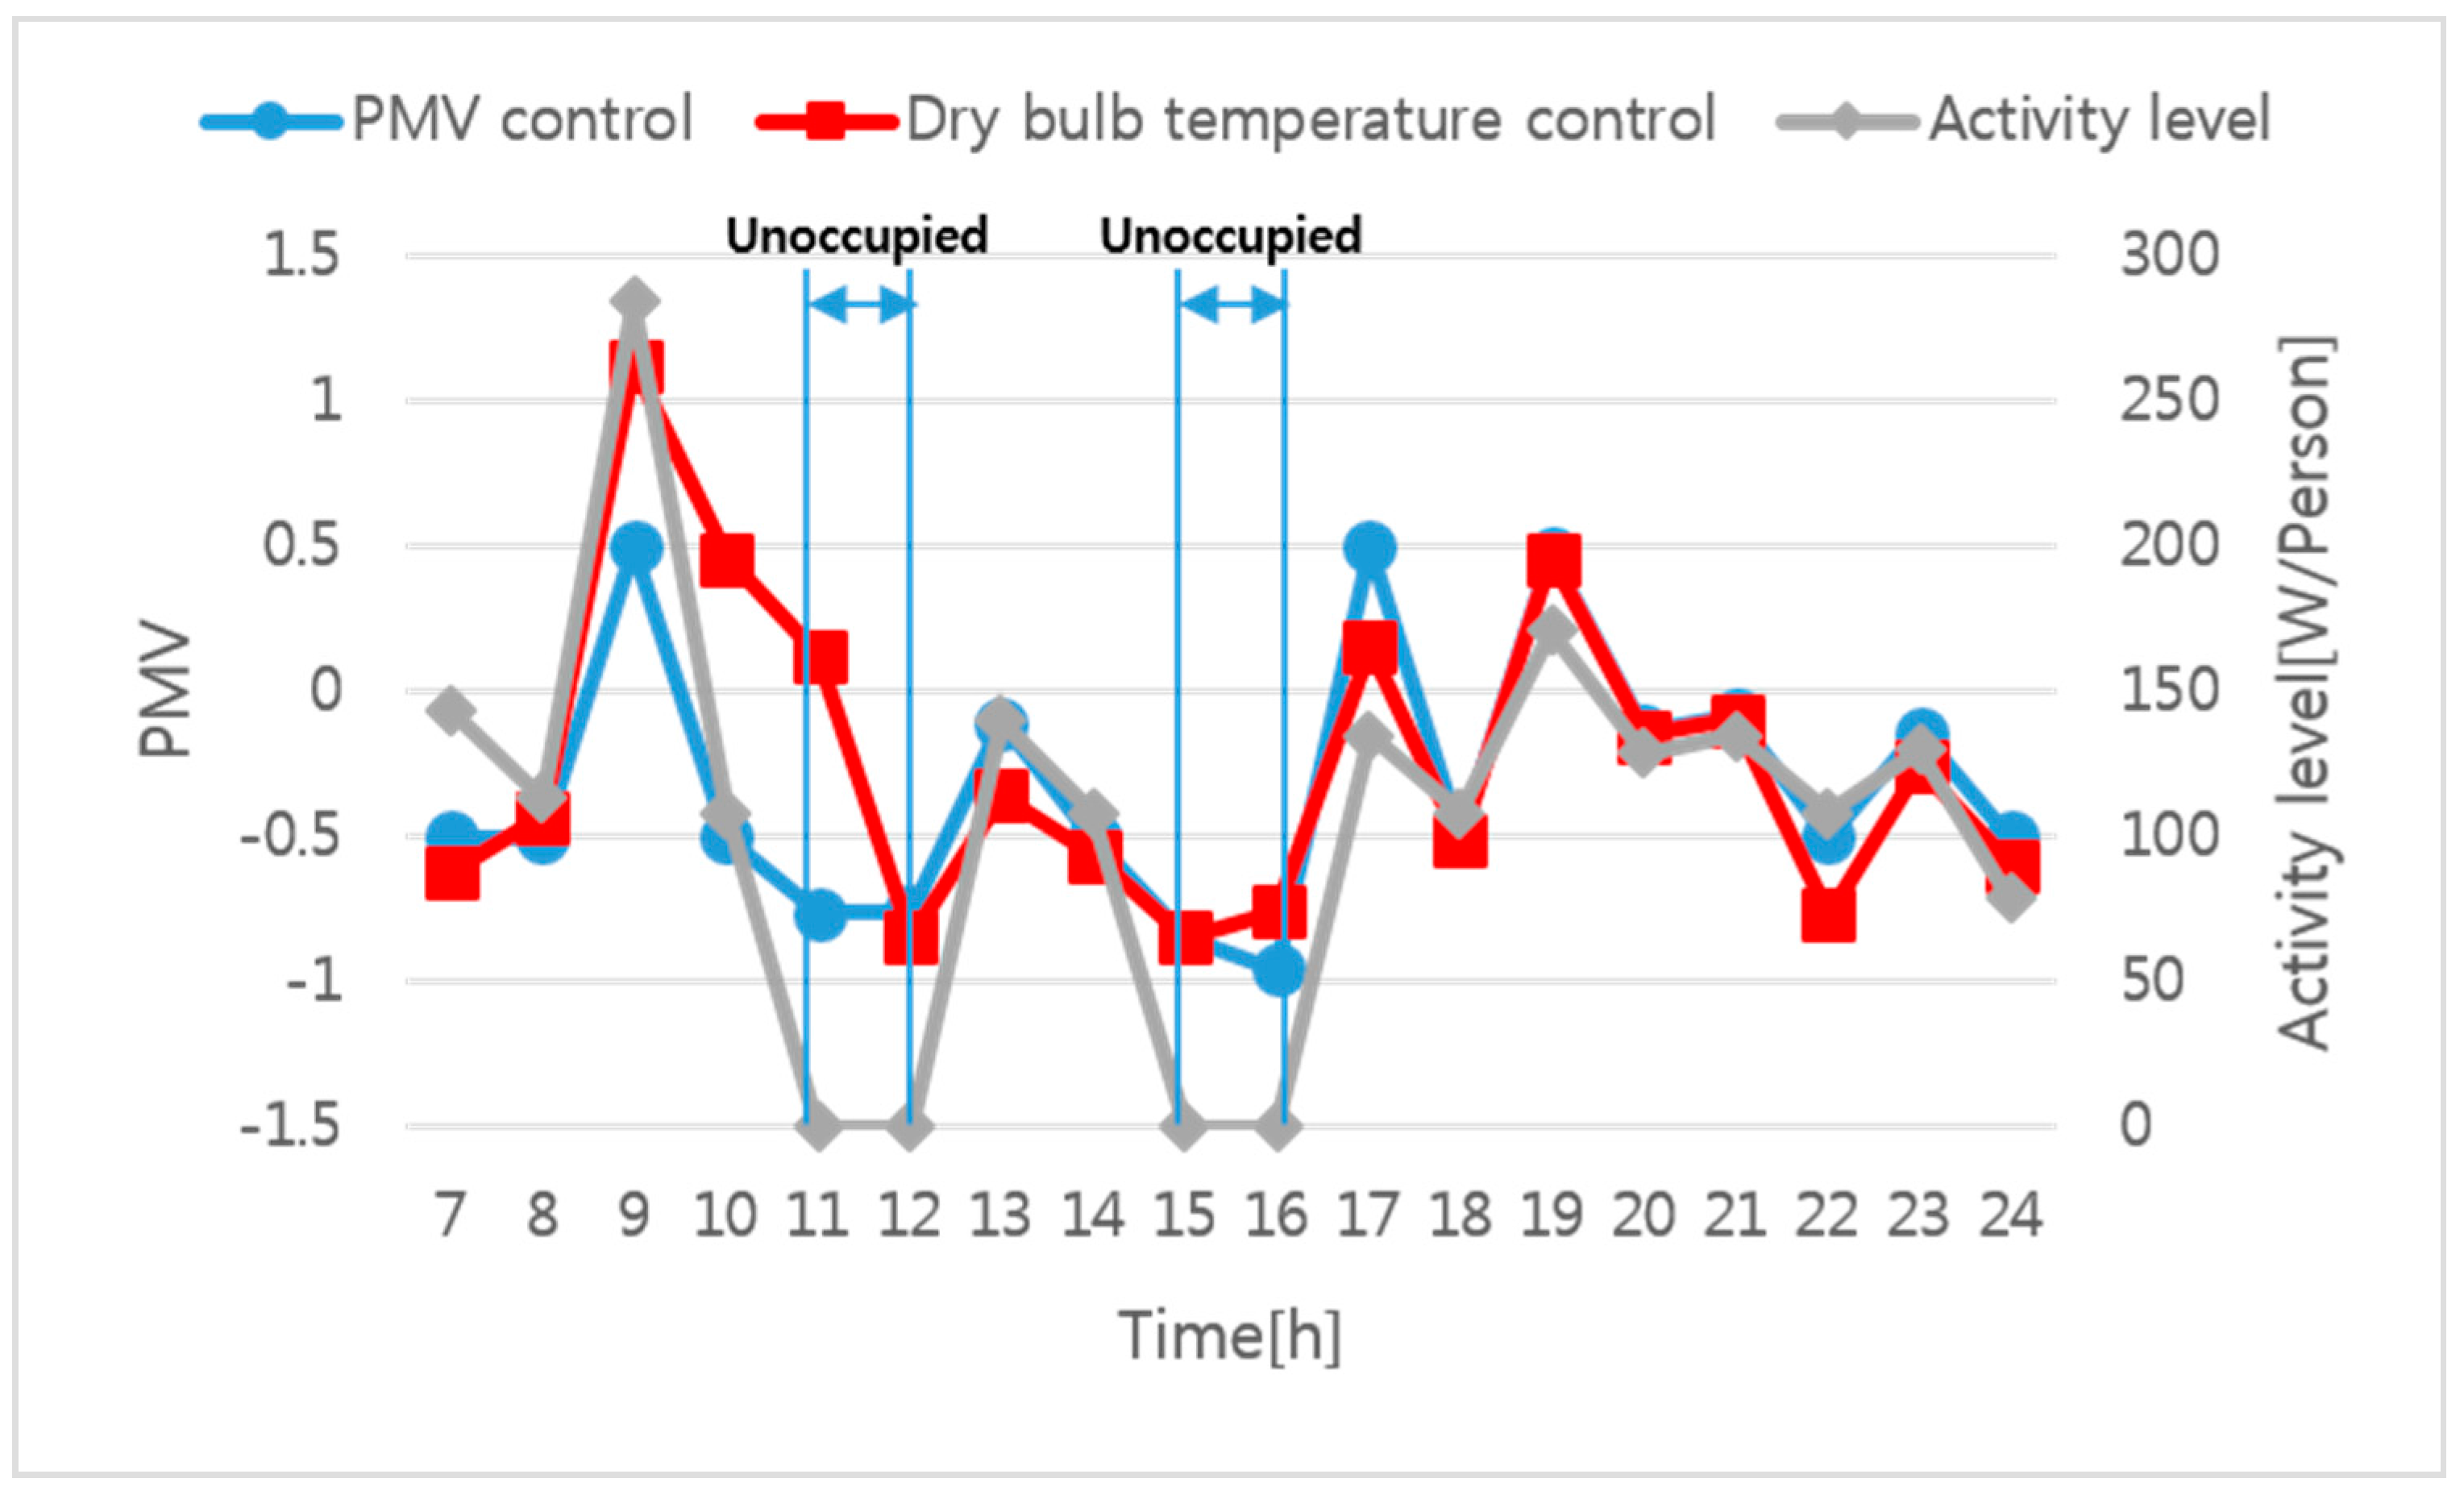
Figure 7.
The indoor temperature holiday (6 August).
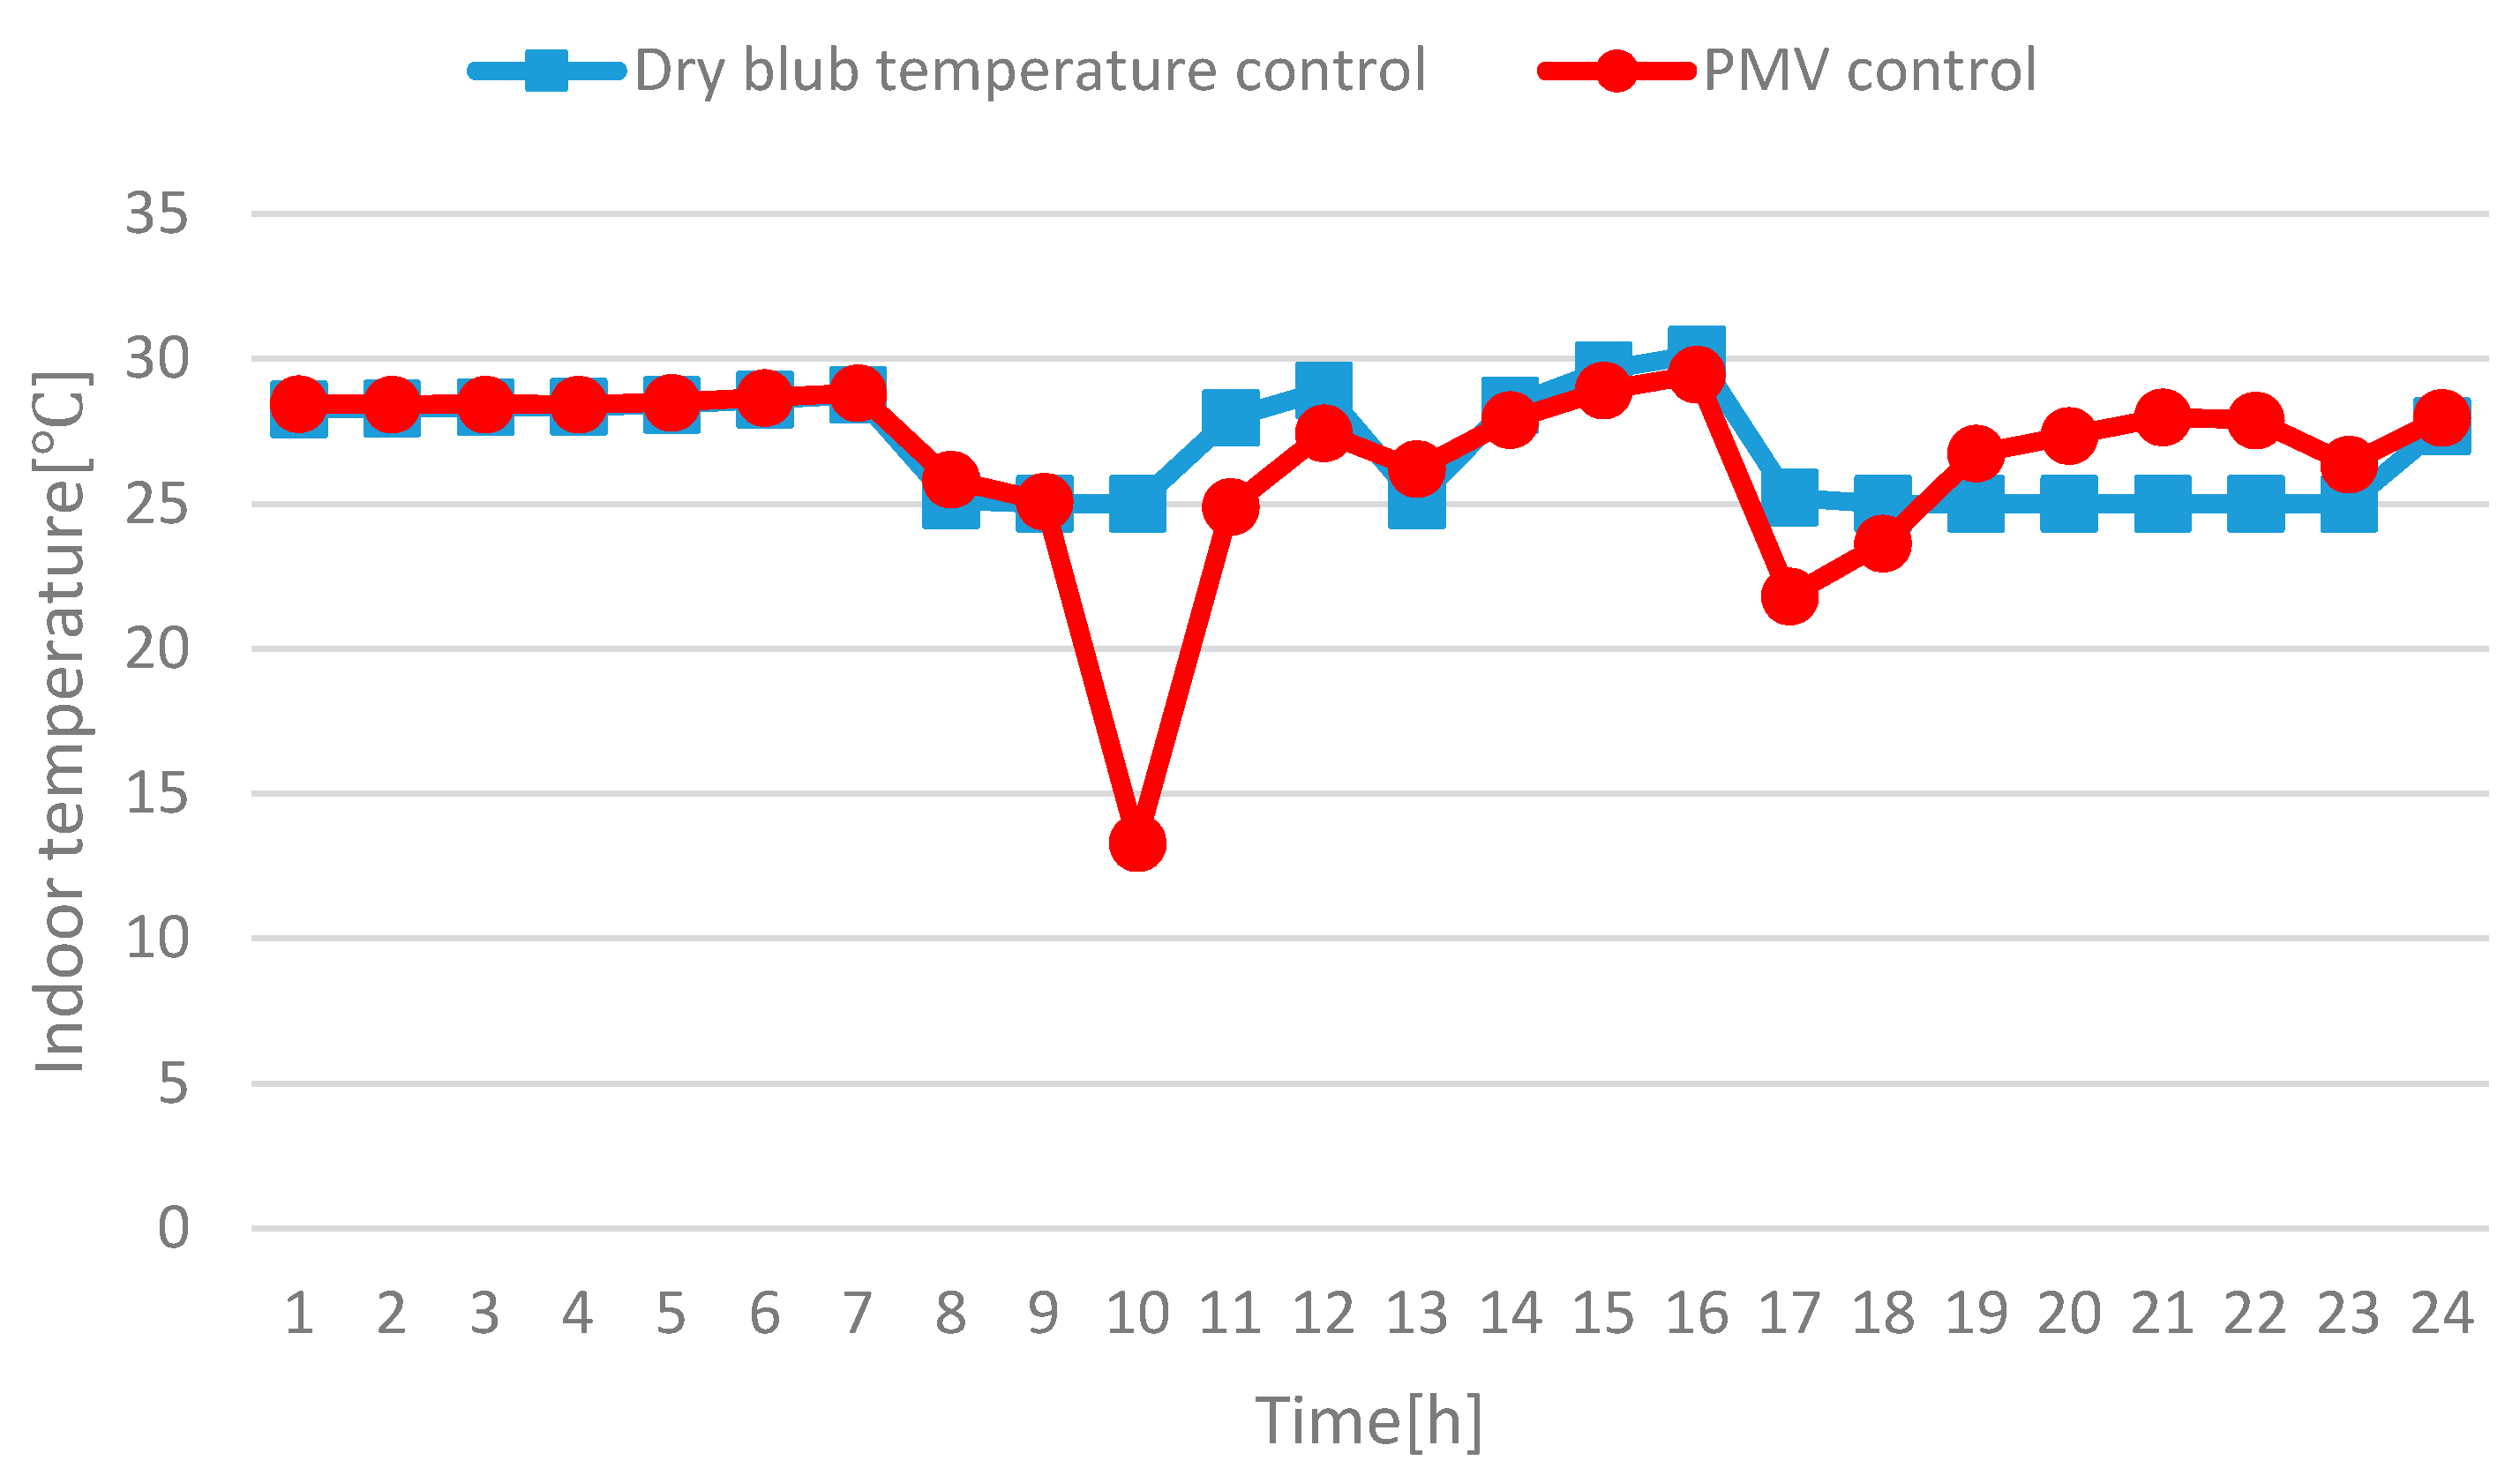
Figure 8.
The indoor temperature weekday (7 August).
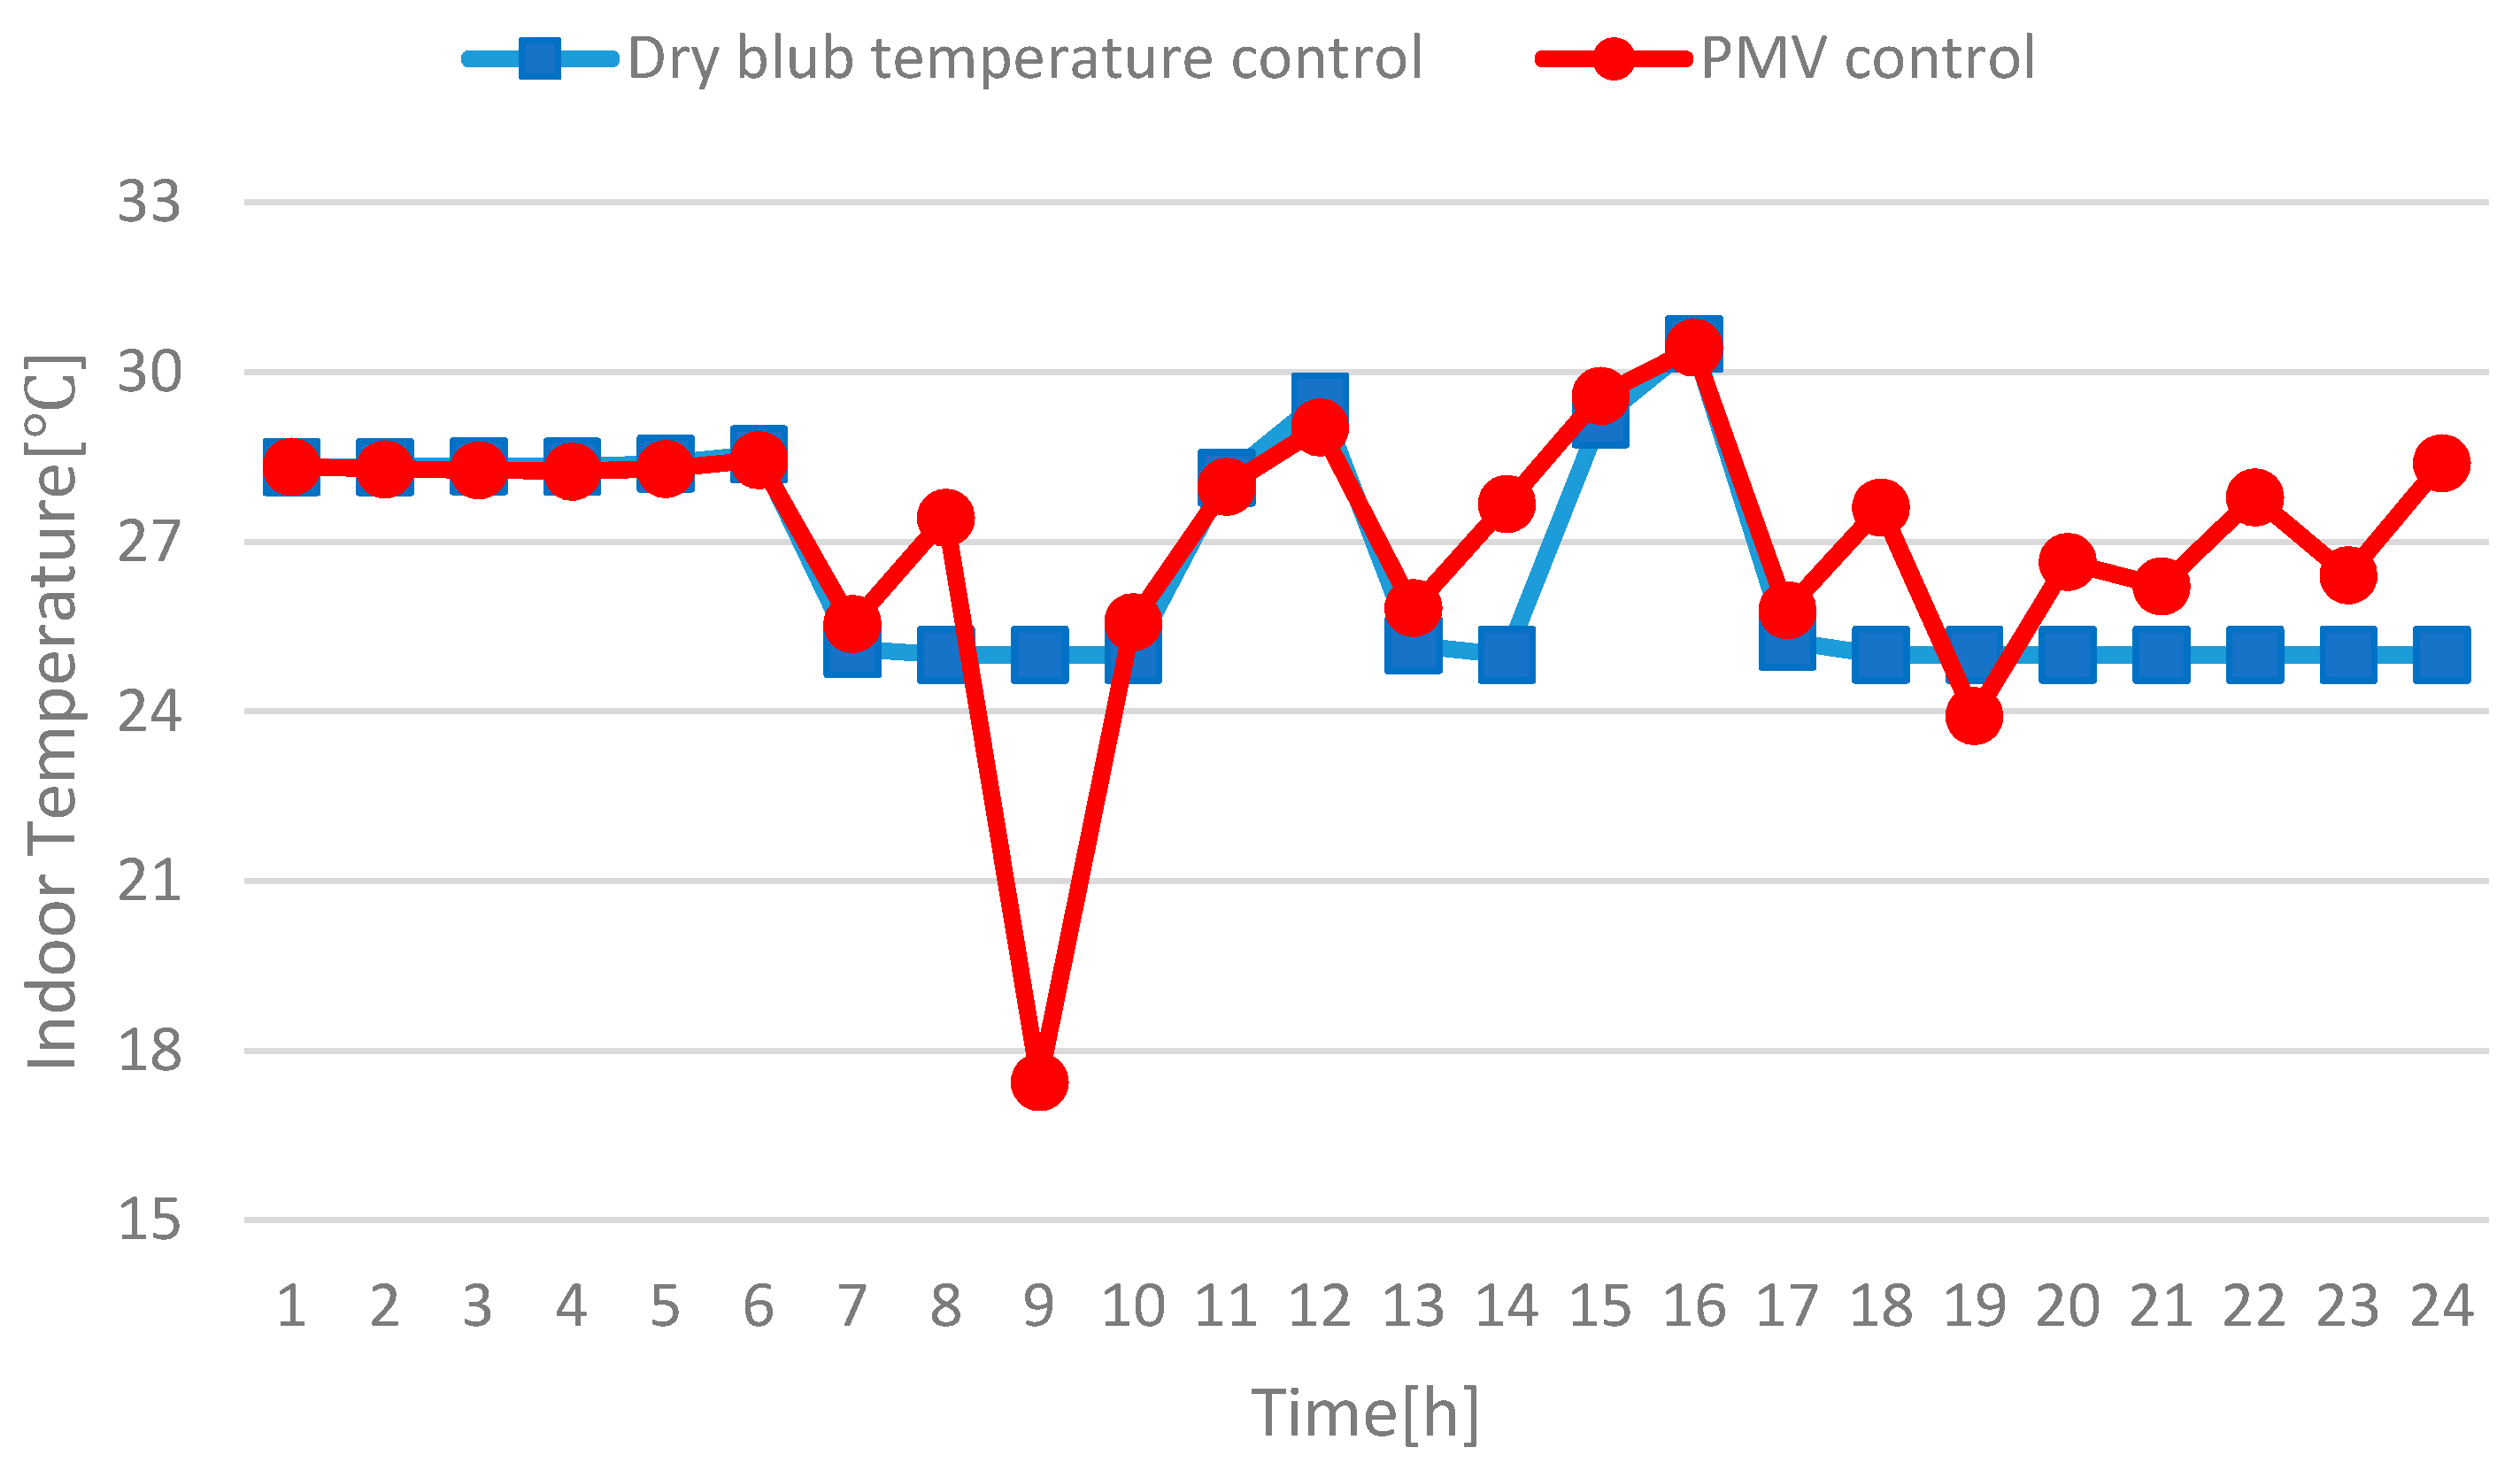
Figure 9.
The indoor temperature holiday (25 December).
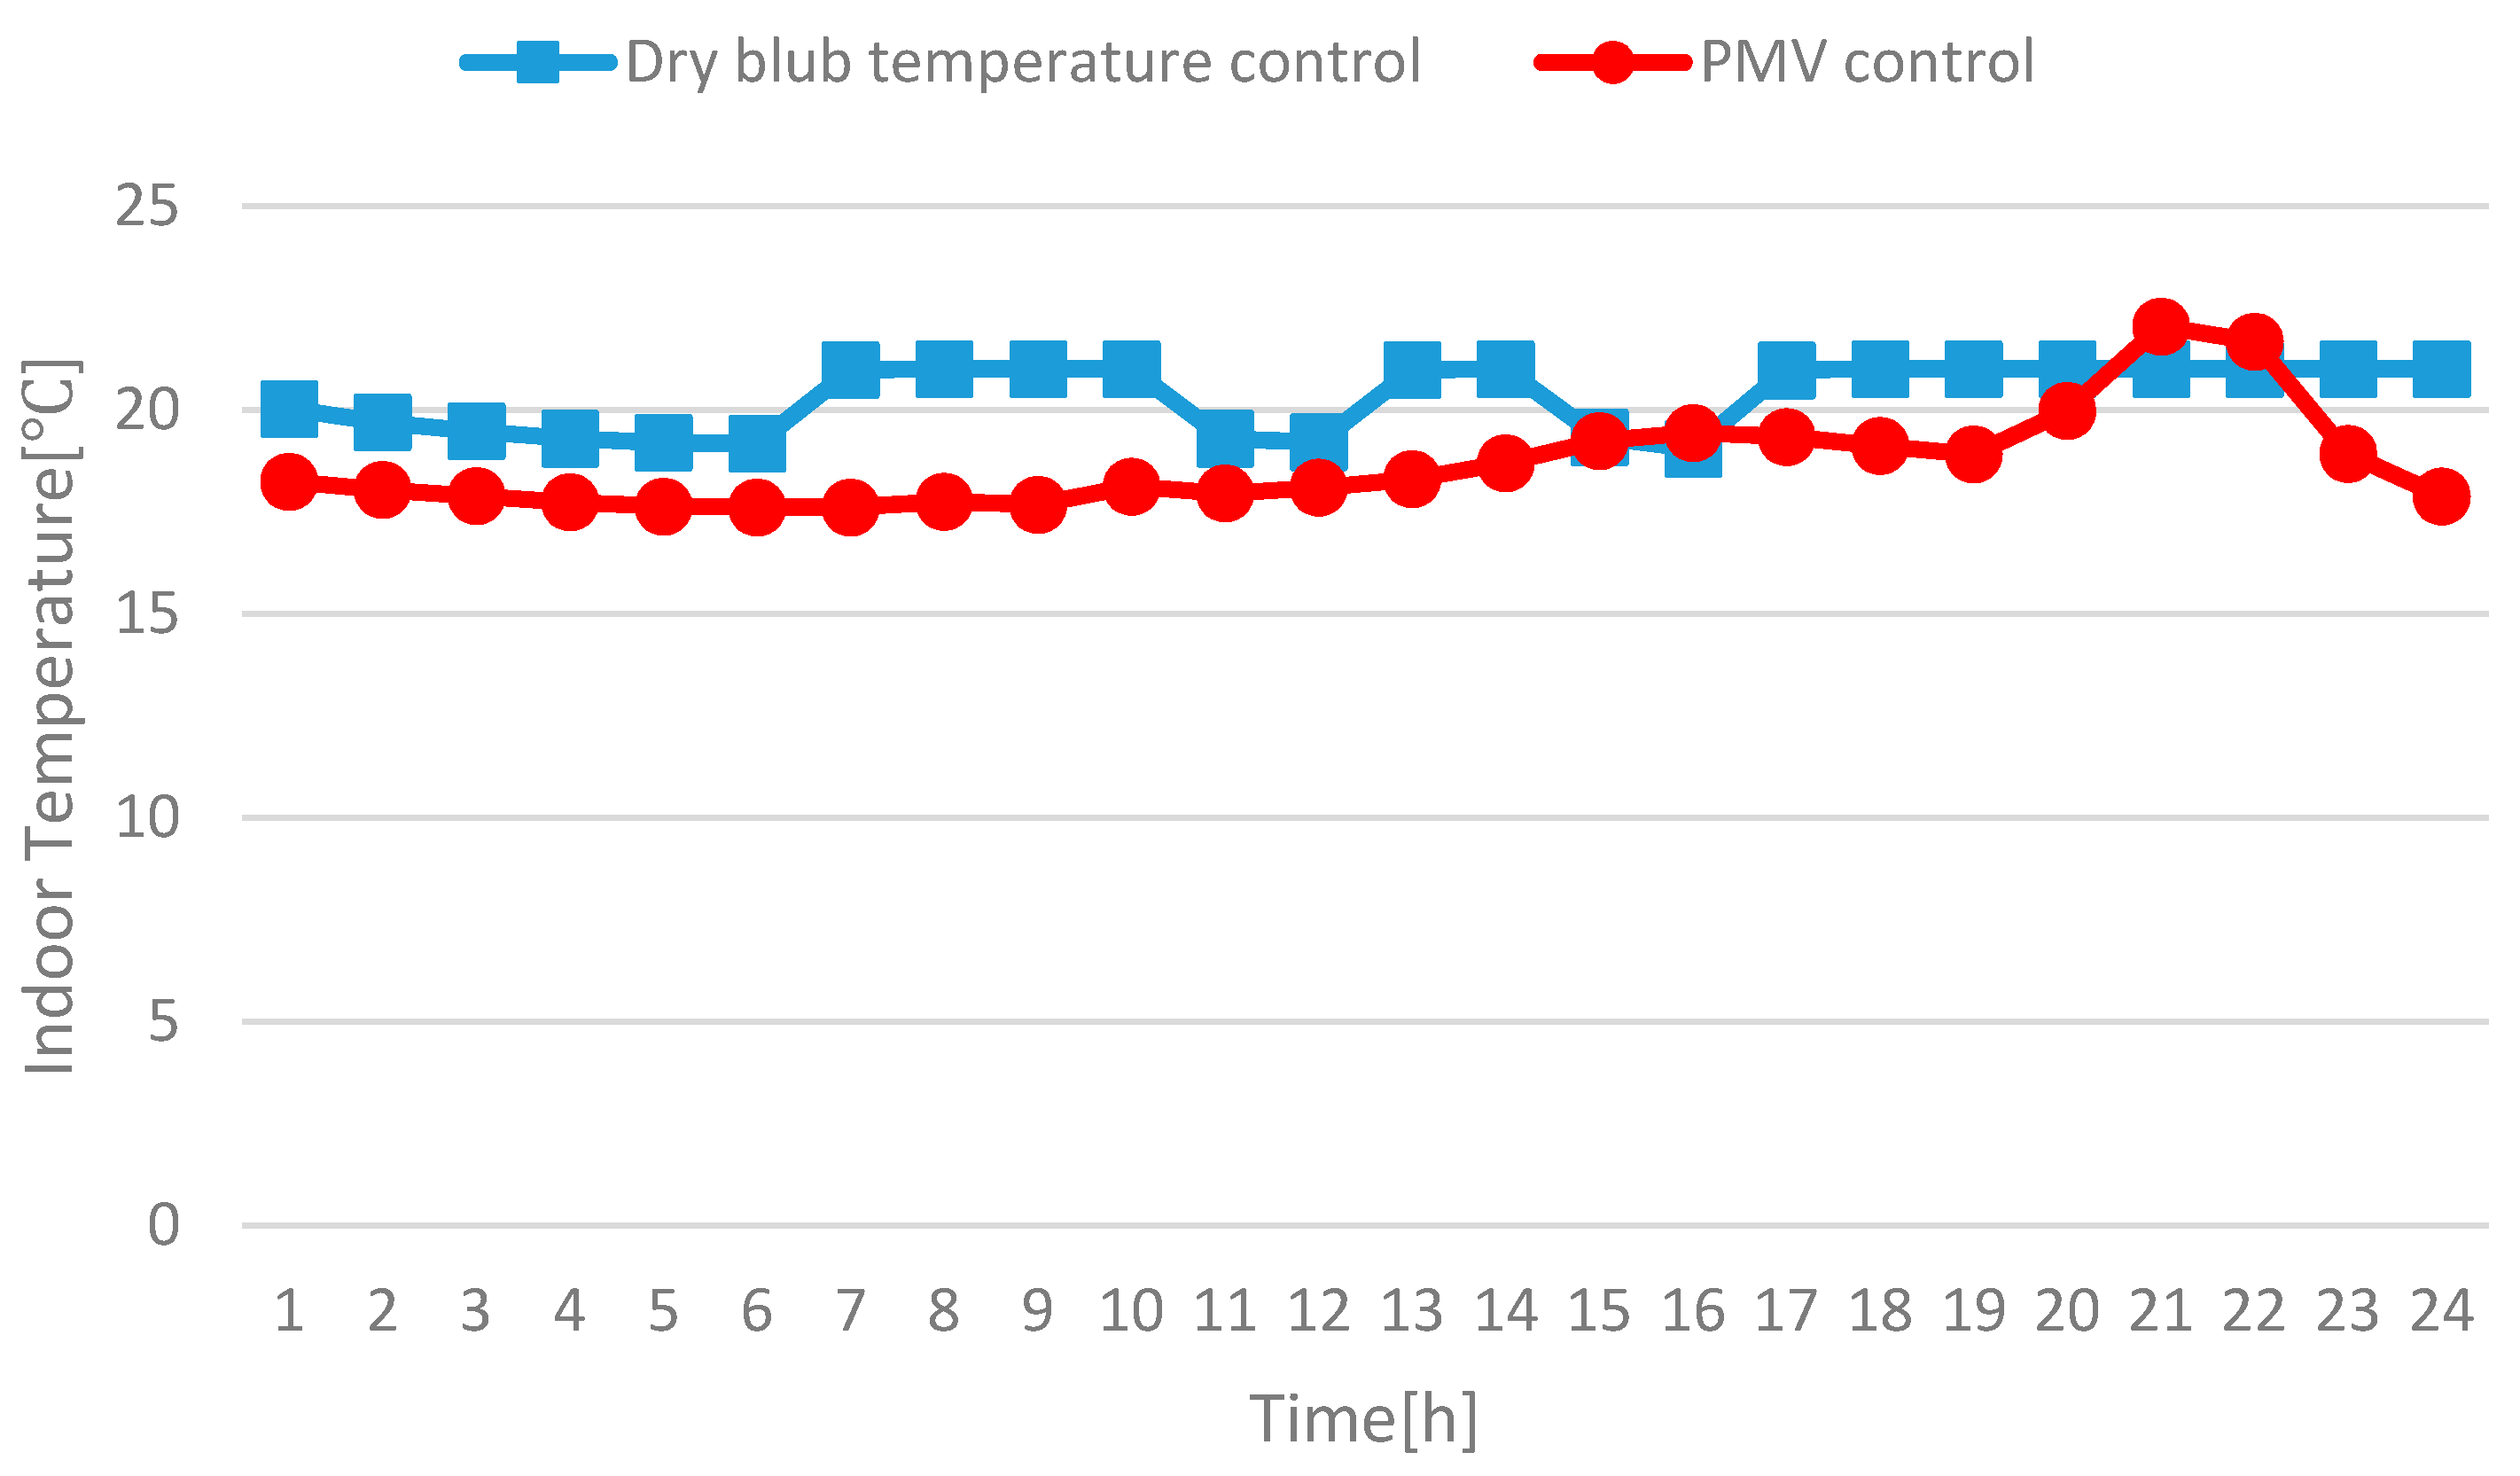
Figure 10.
The indoor temperature weekday (26 December).
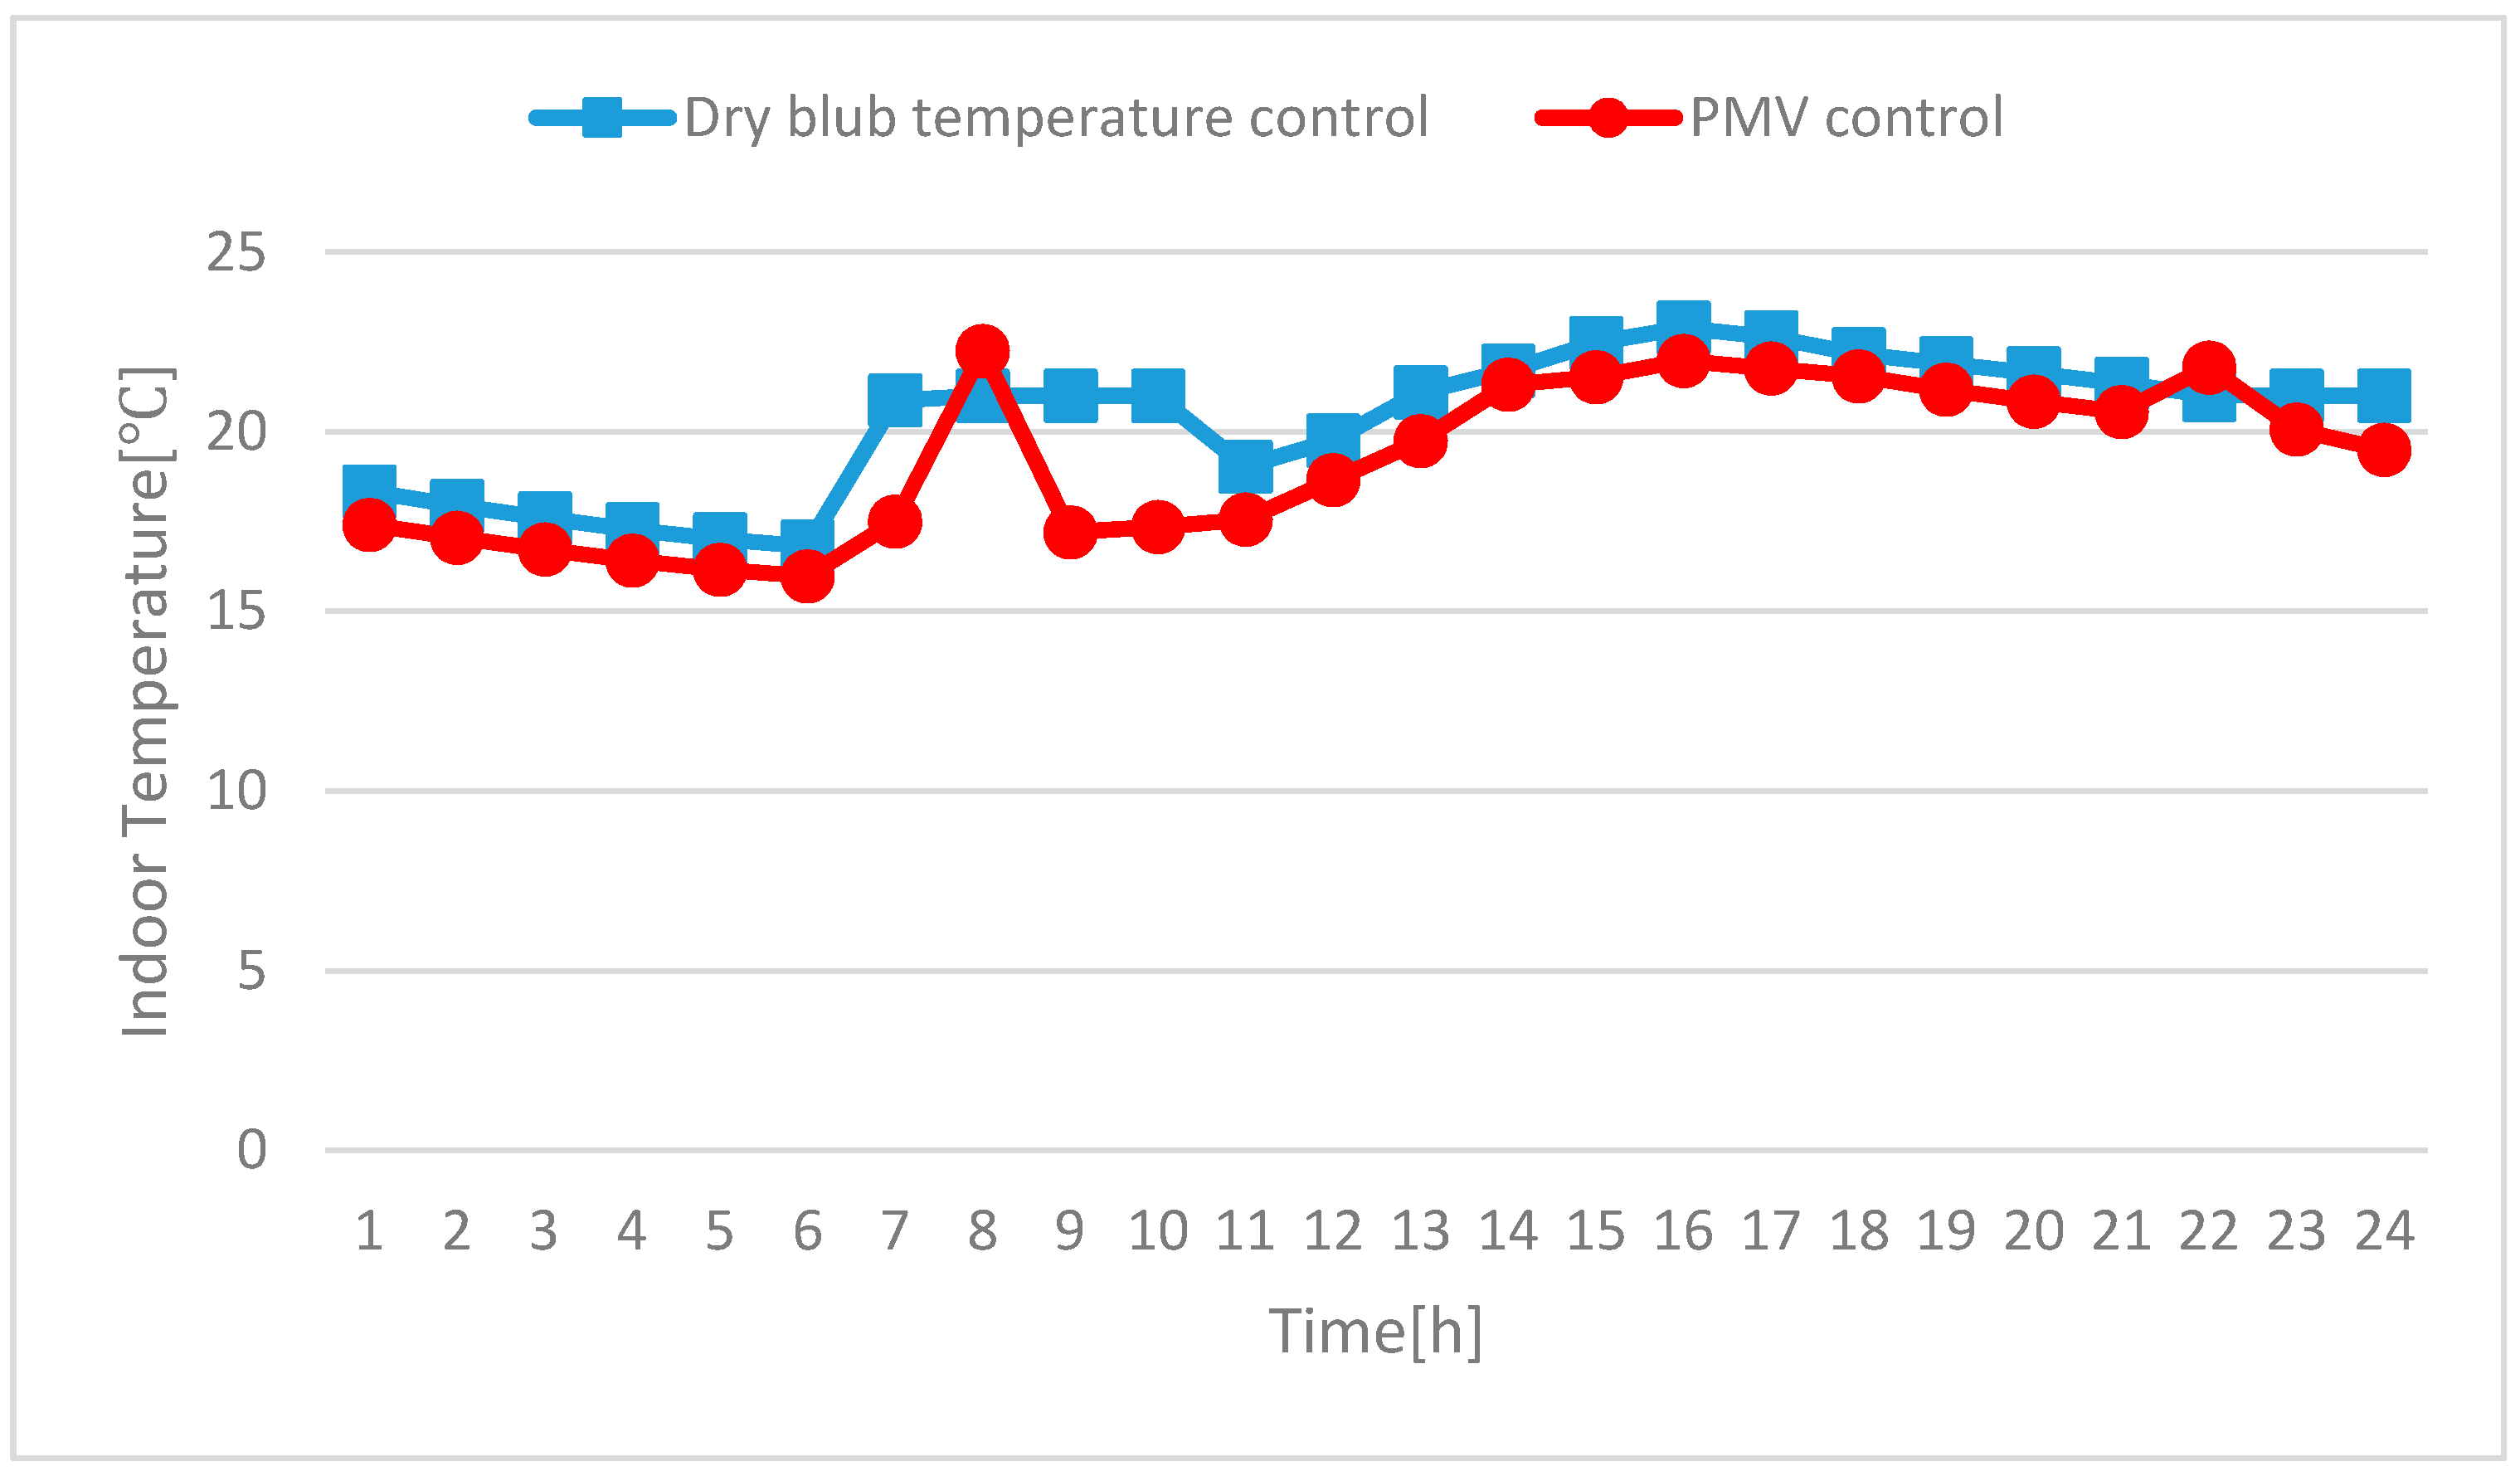
Figure 11.
The hourly zone cooling rate holiday (6 August).
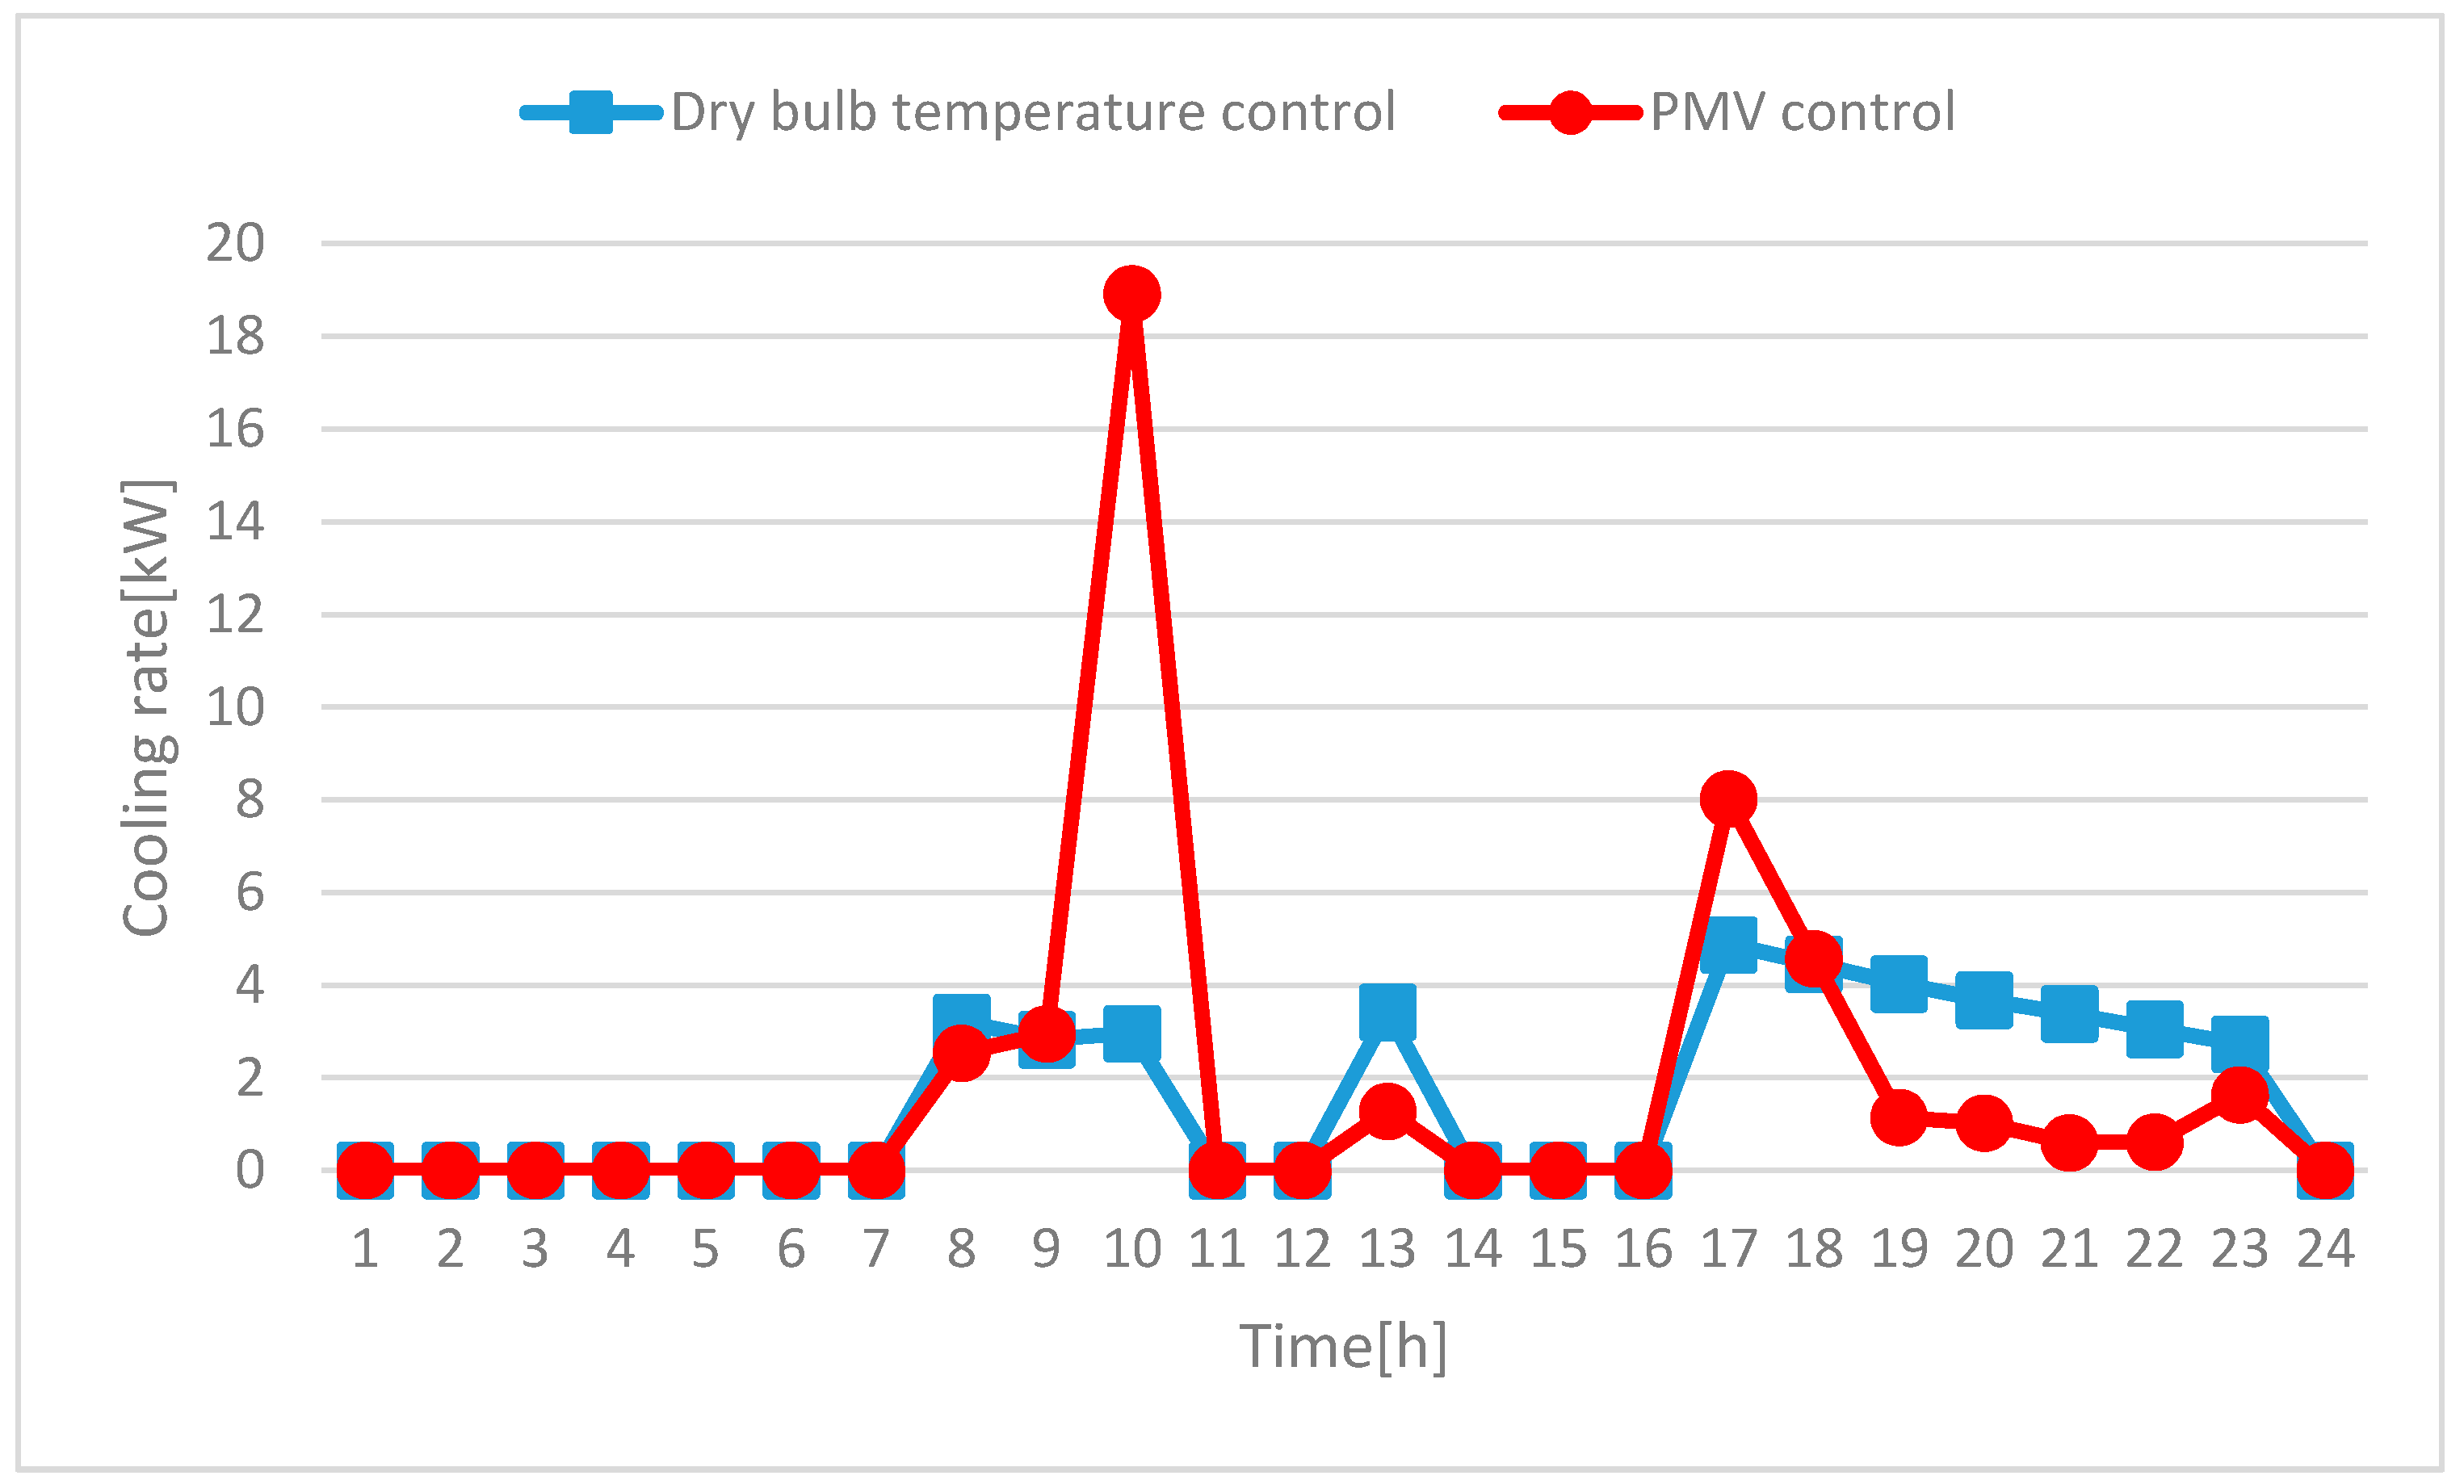
Figure 12.
The hourly zone cooling rate weekday (7 August).
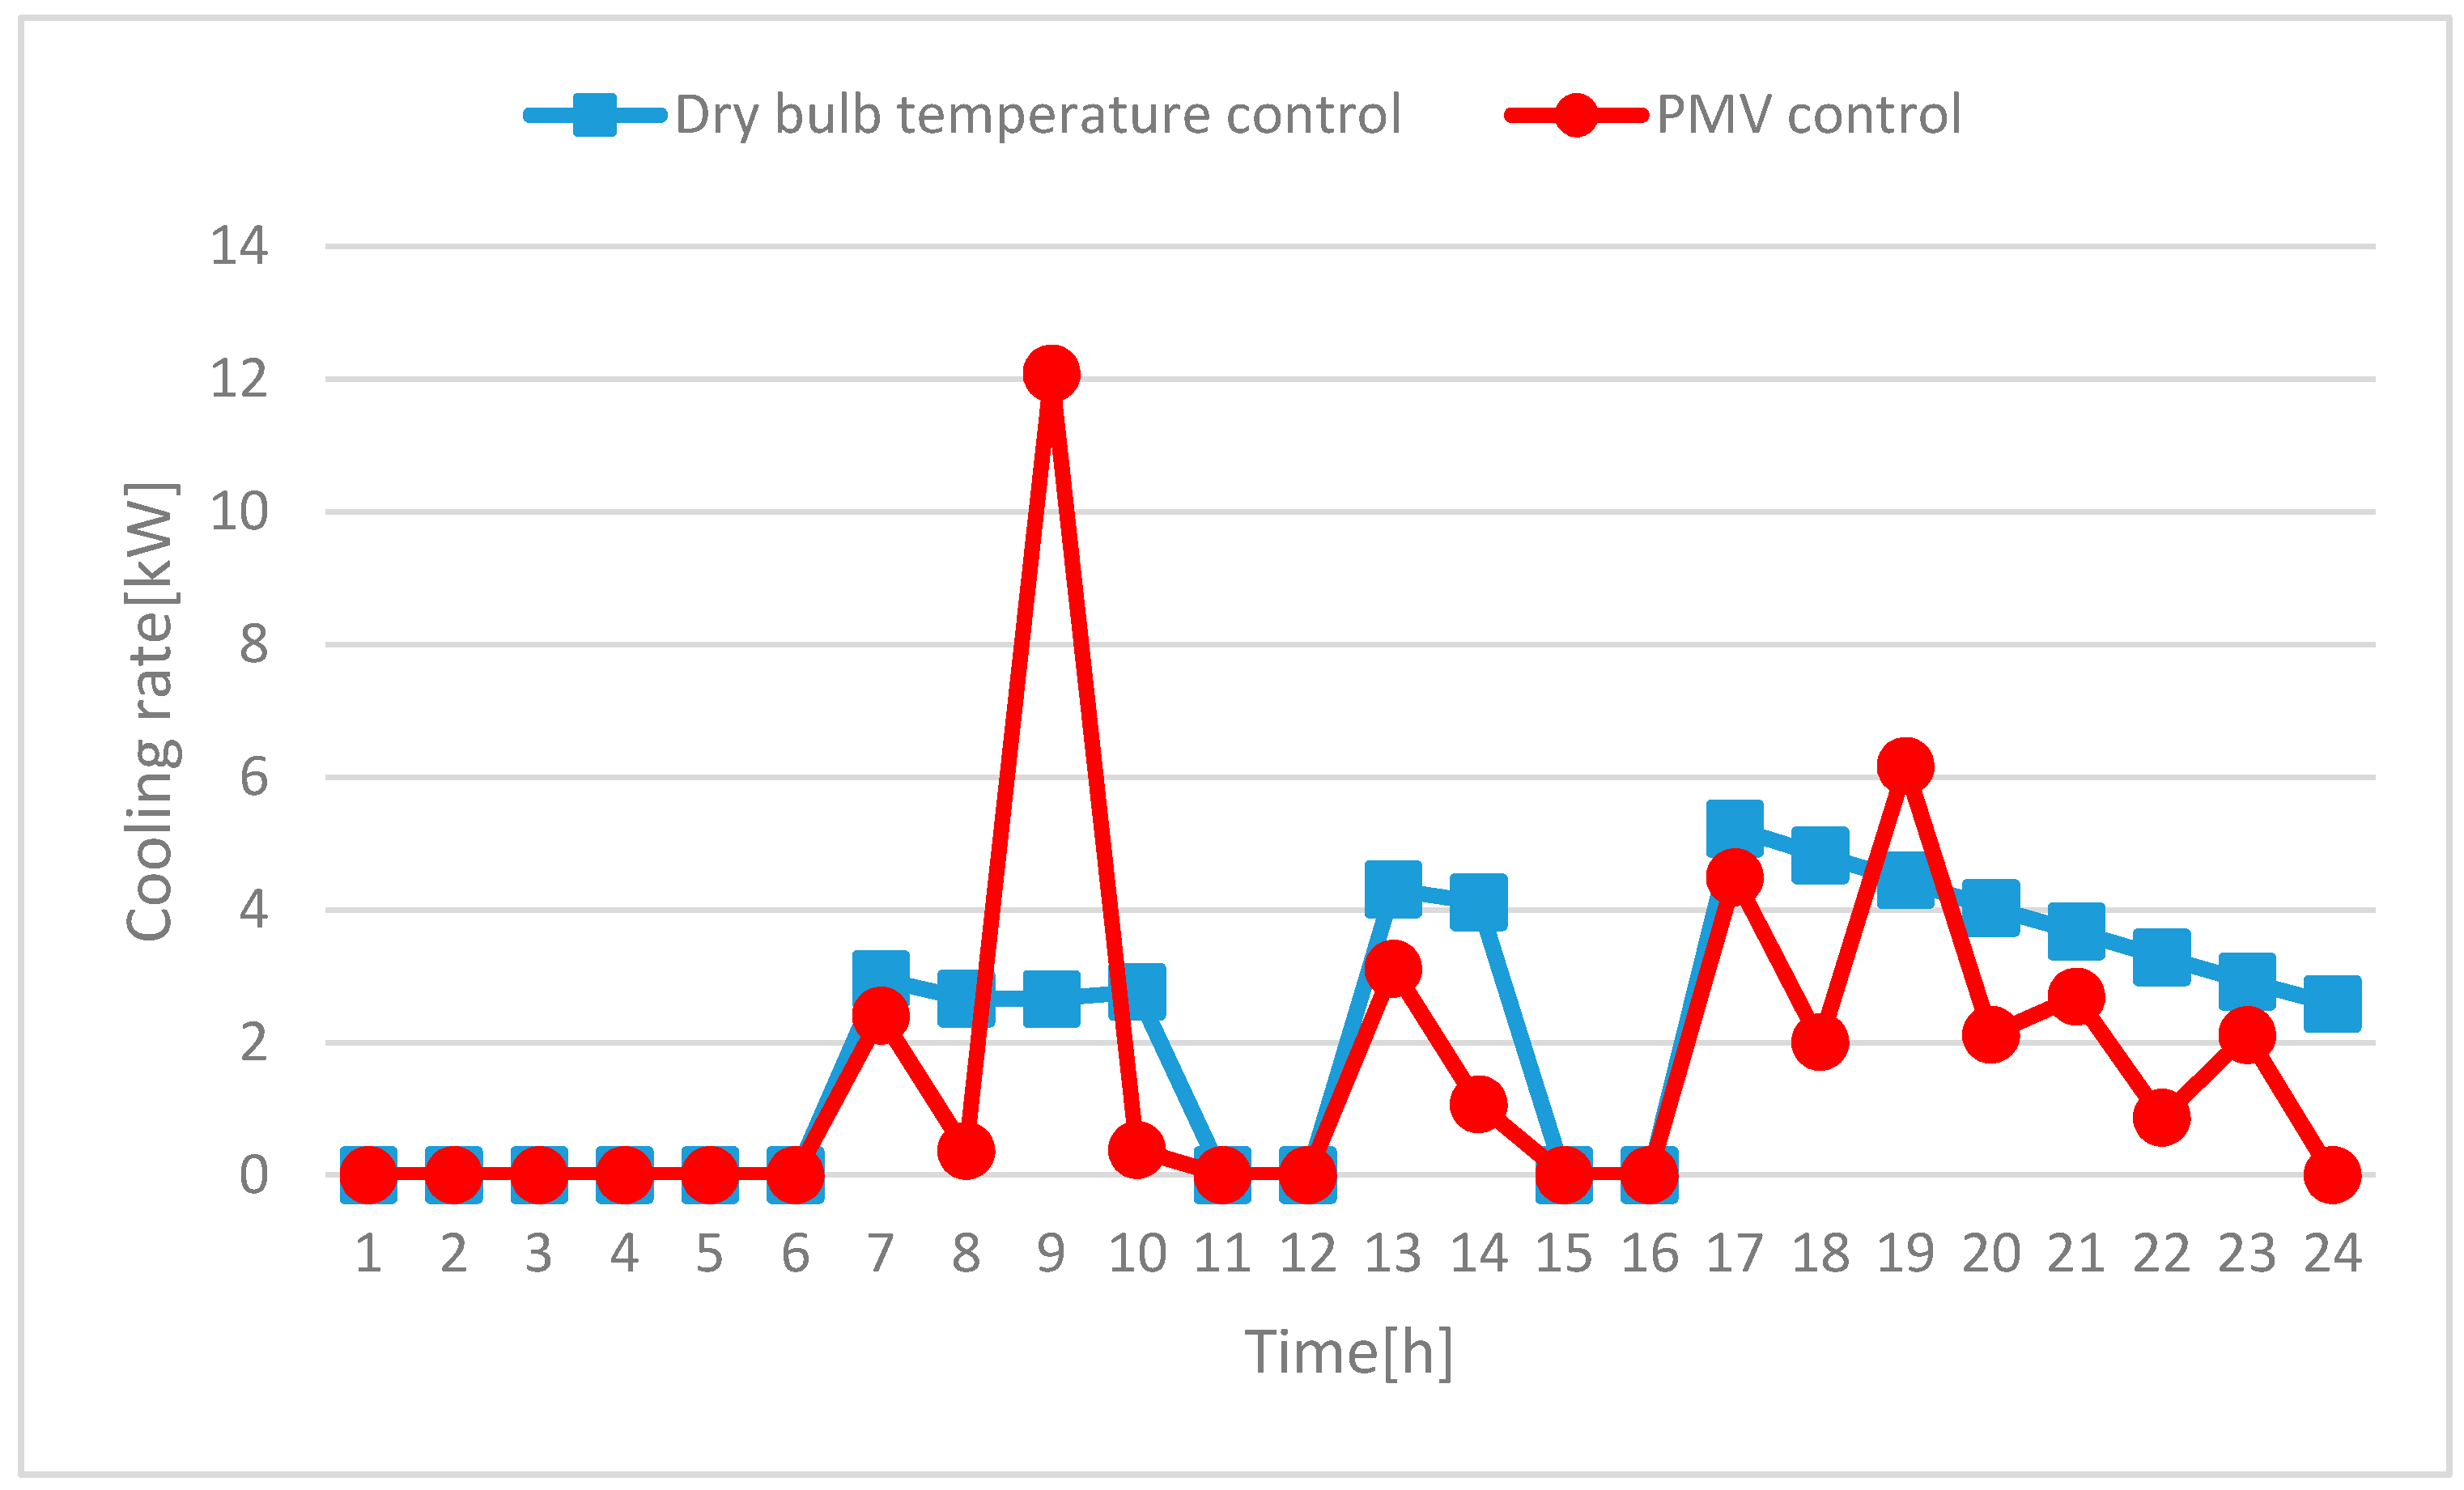
Figure 13.
The hourly zone cooling rate for the holiday (6 August).
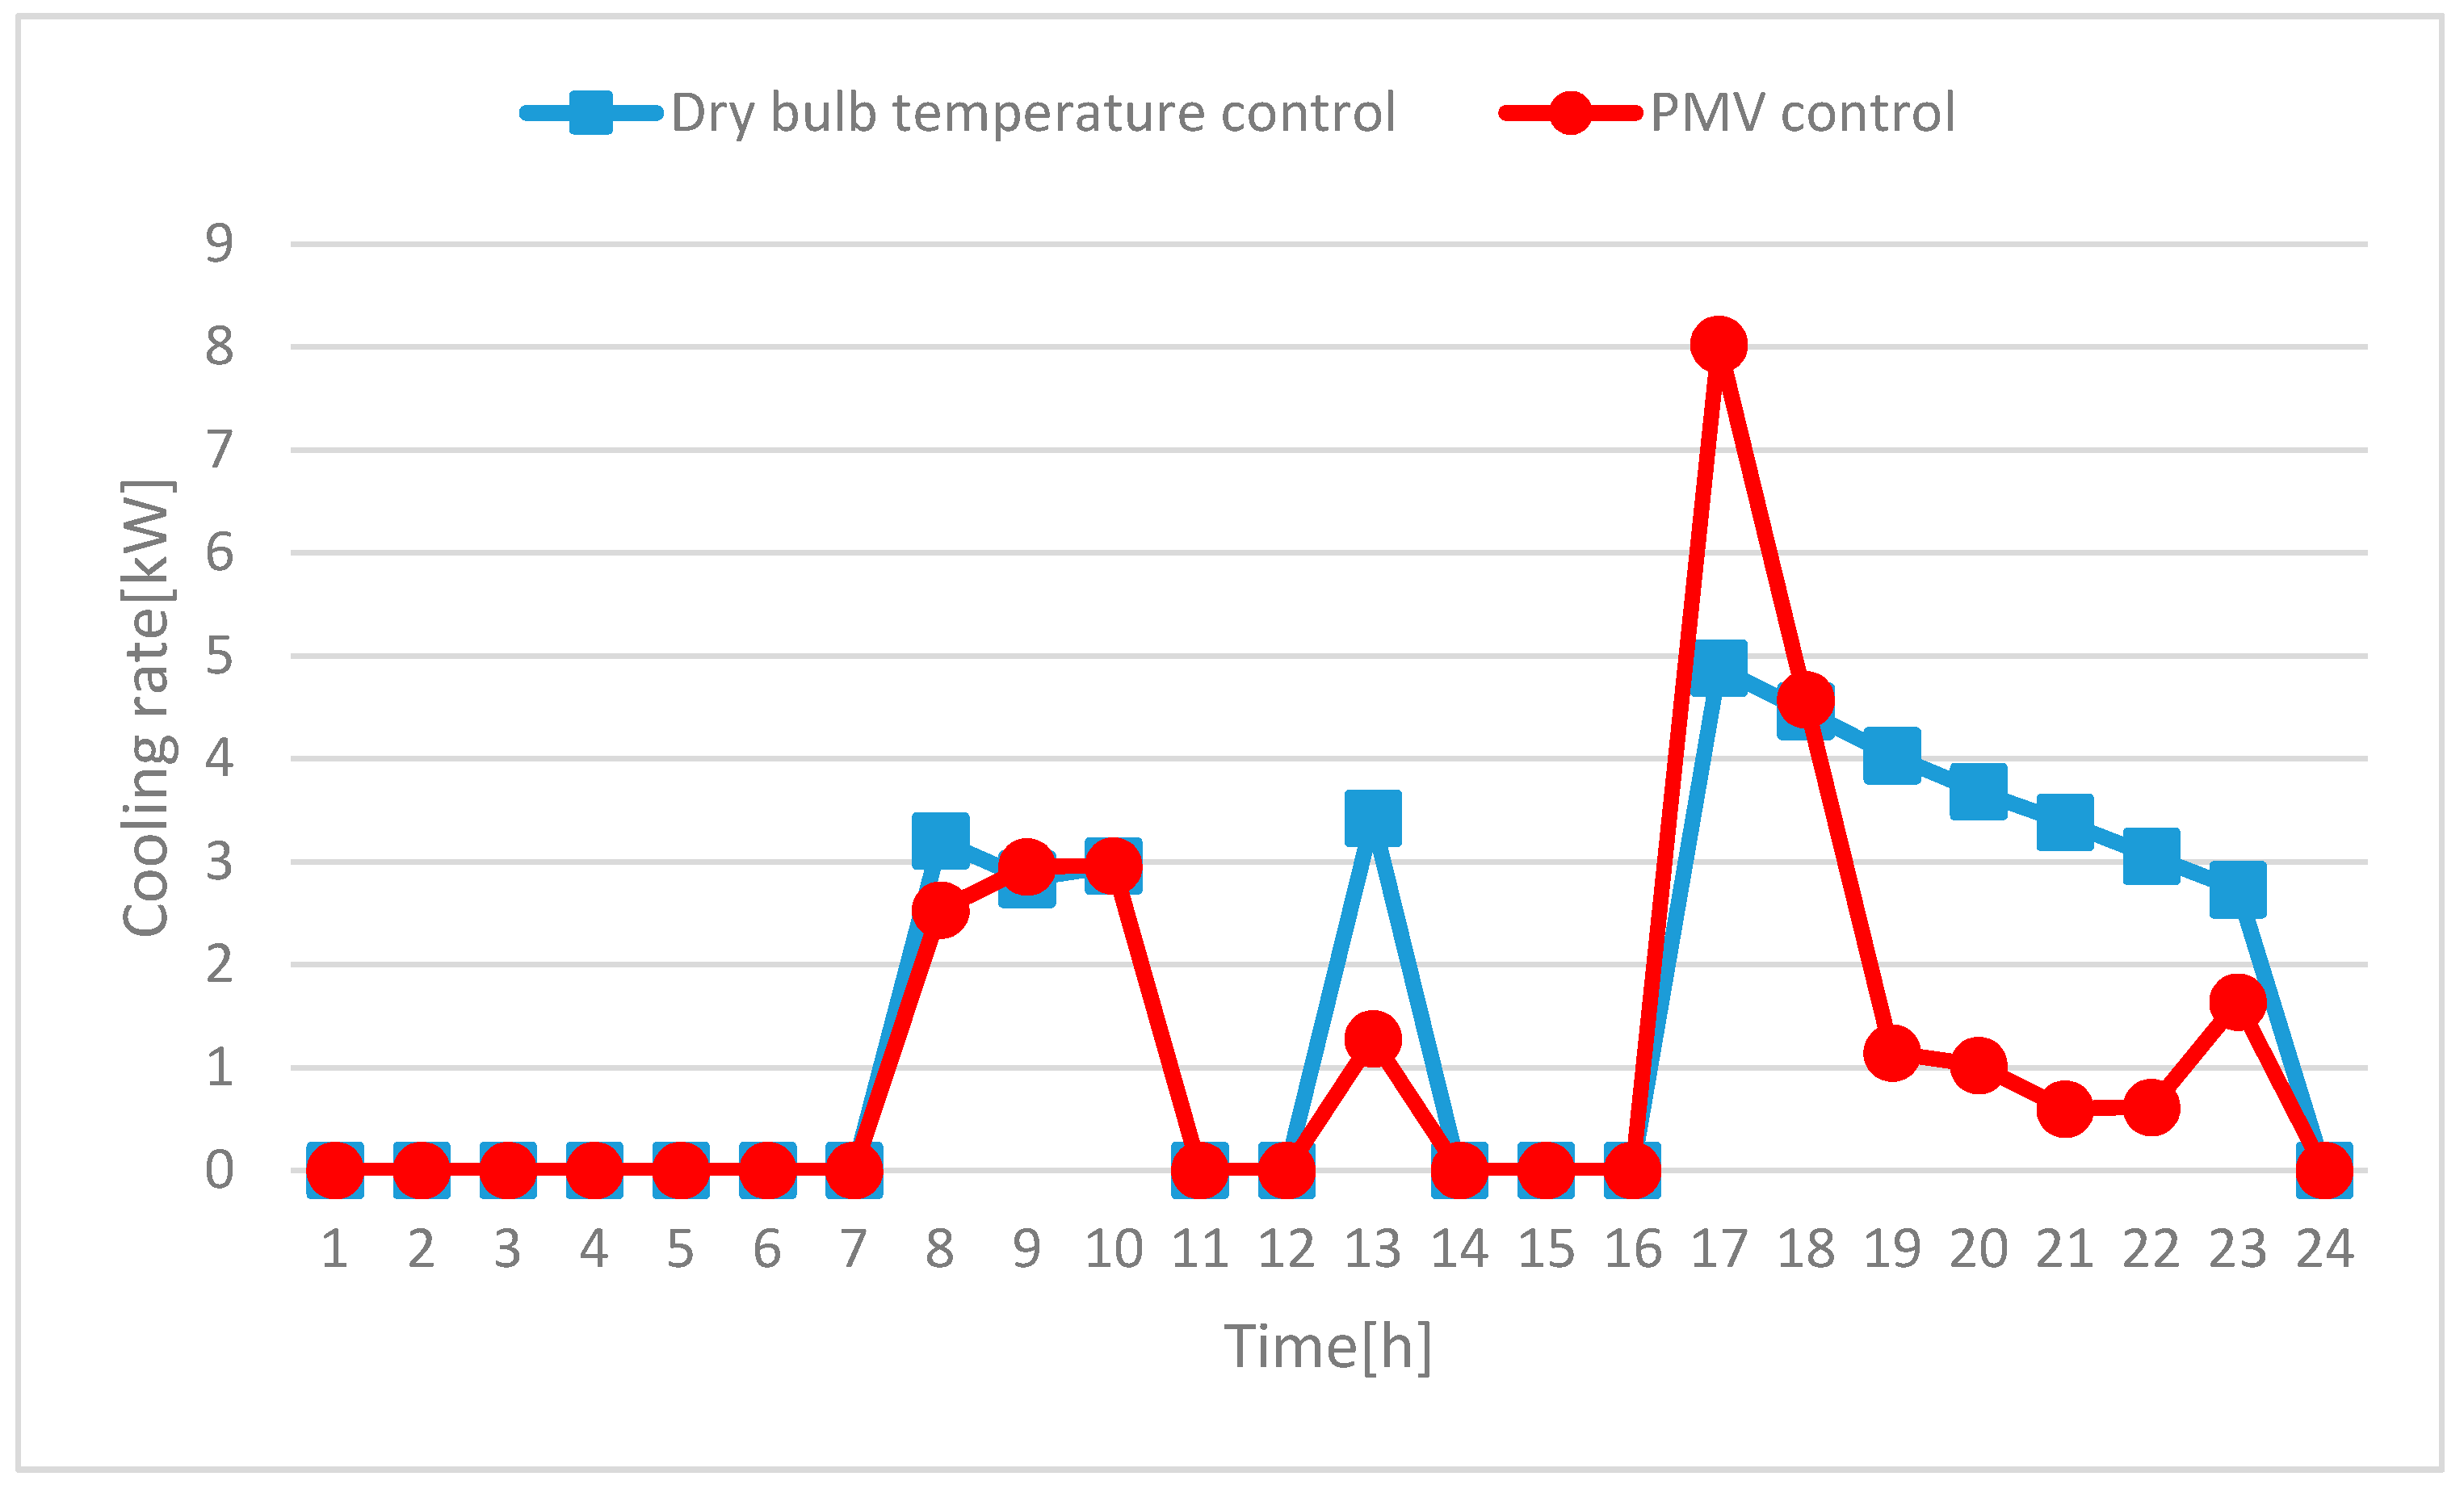
Figure 14.
The hourly zone cooling rate for the weekday (7 August).
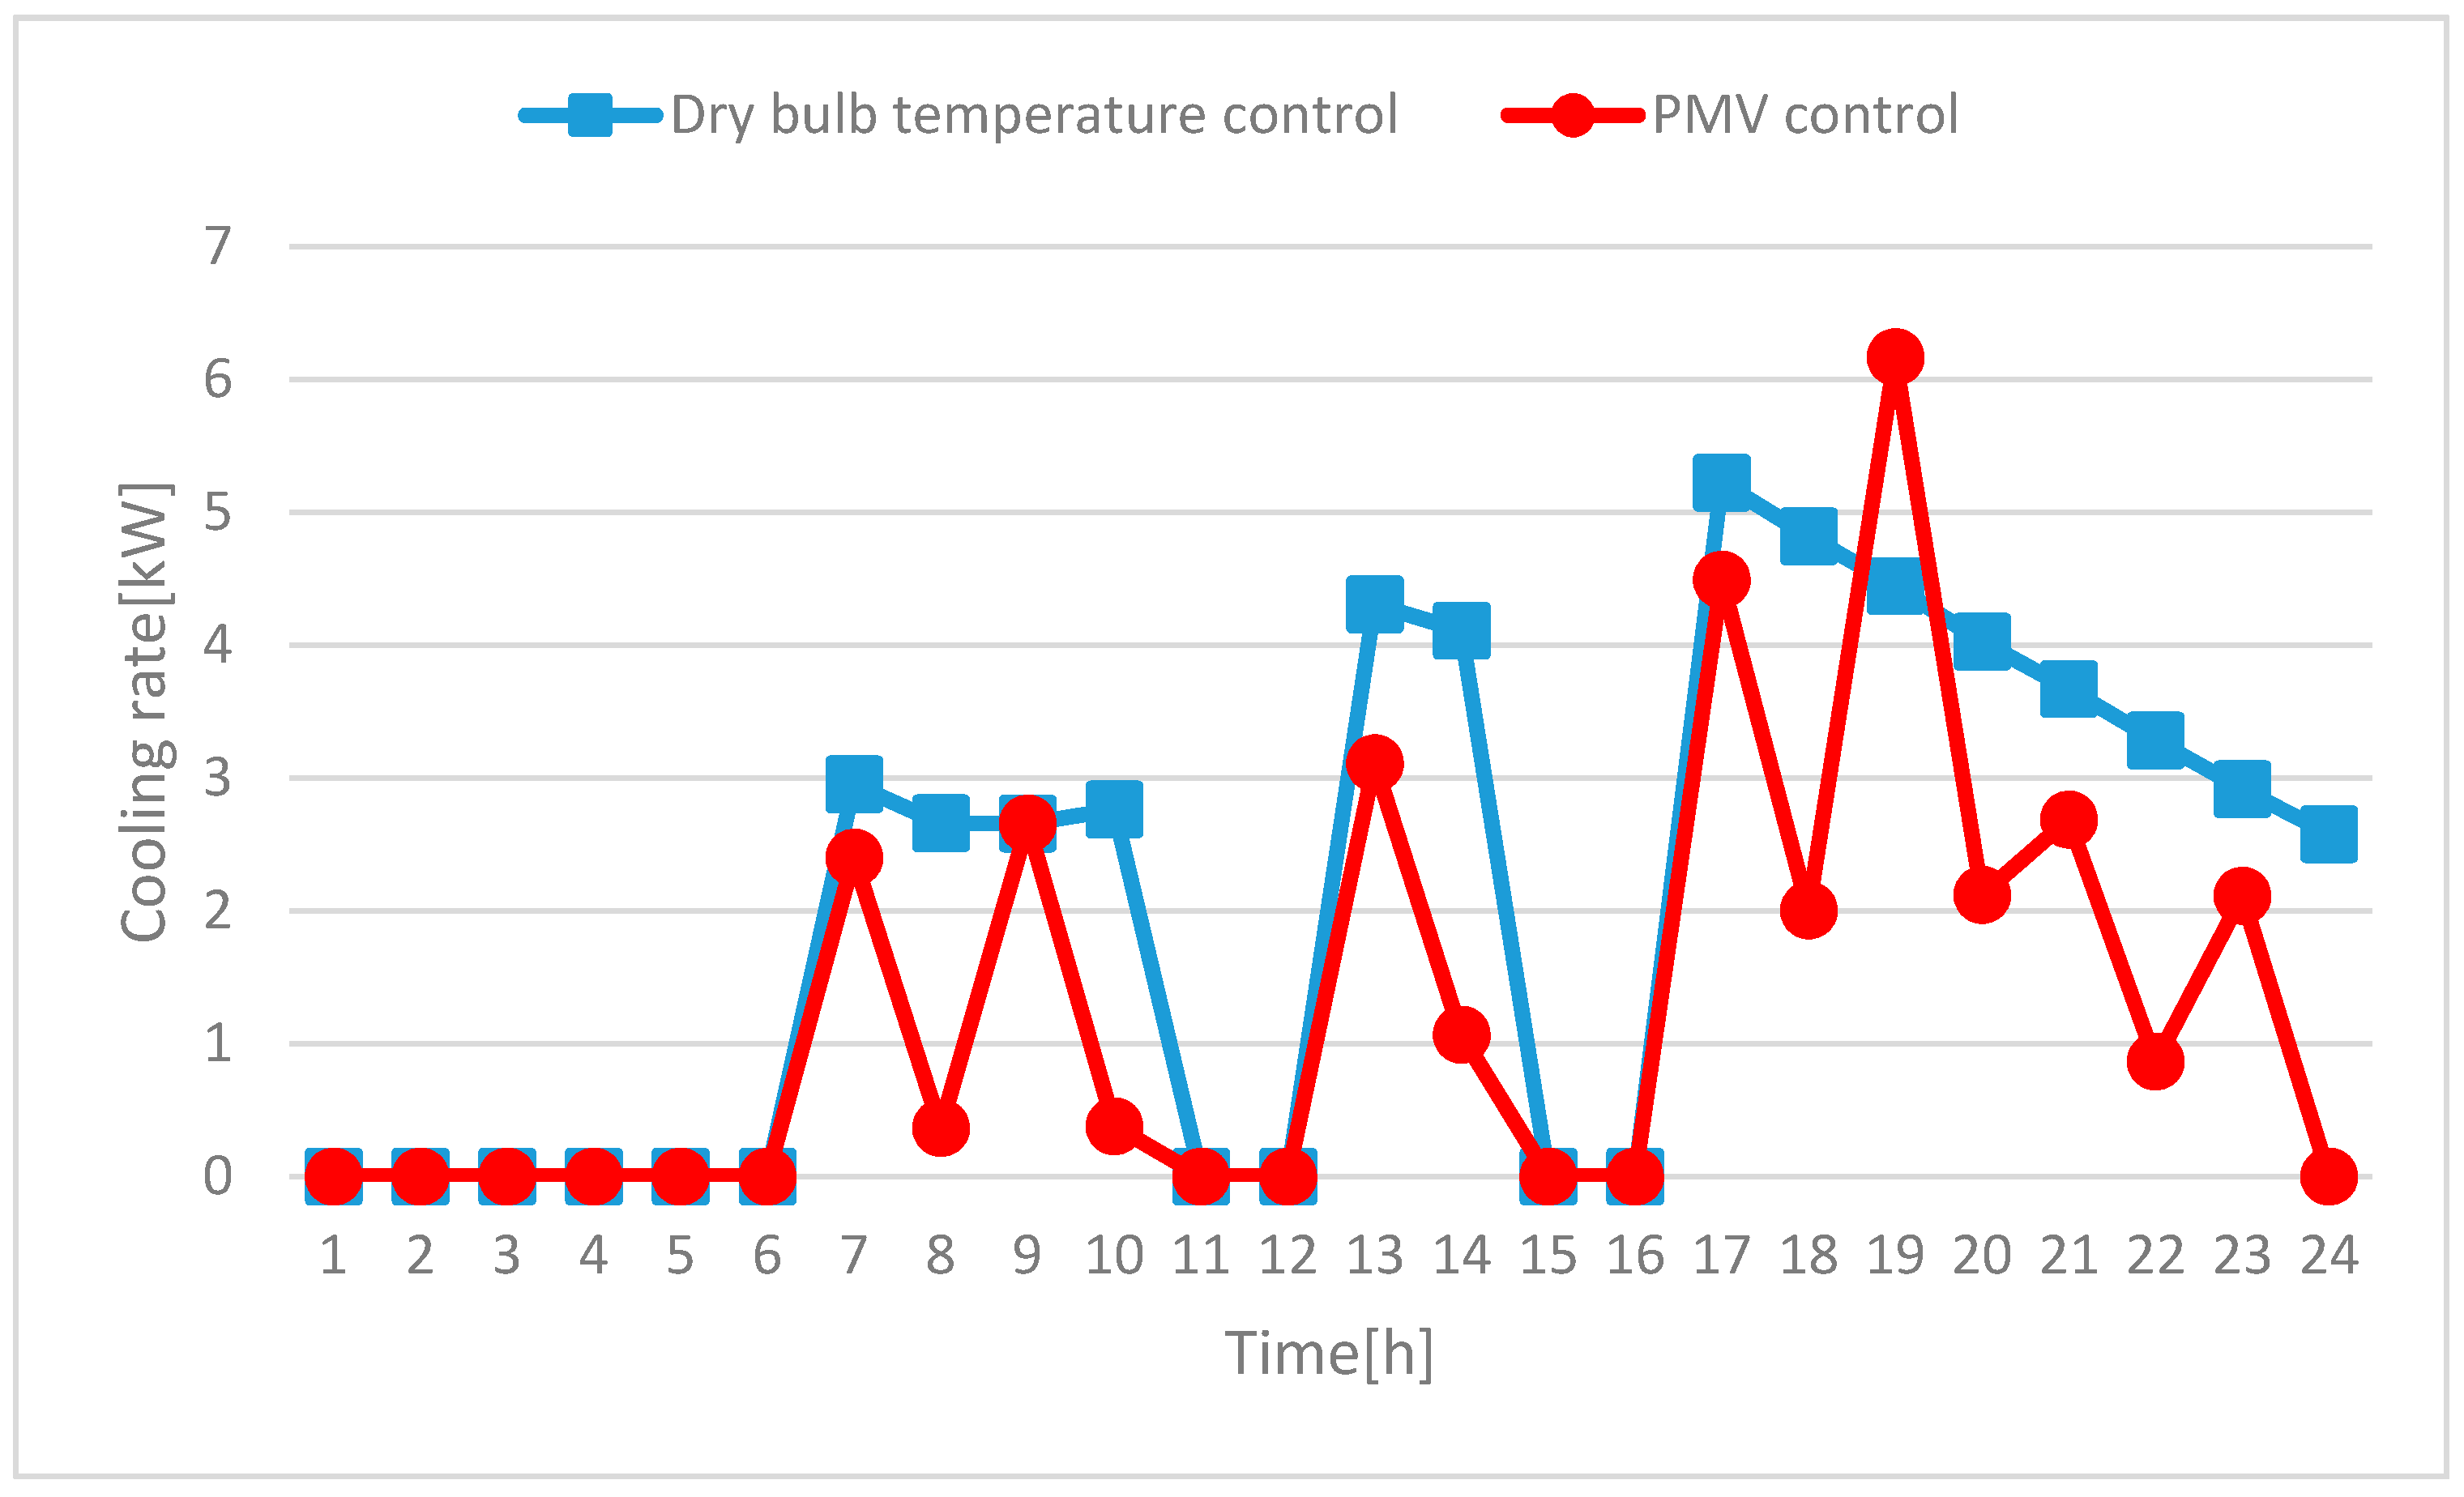
Figure 15.
The heating rate supplied by the radiant floor heating system during the holiday (25 December).
Figure 15.
The heating rate supplied by the radiant floor heating system during the holiday (25 December).
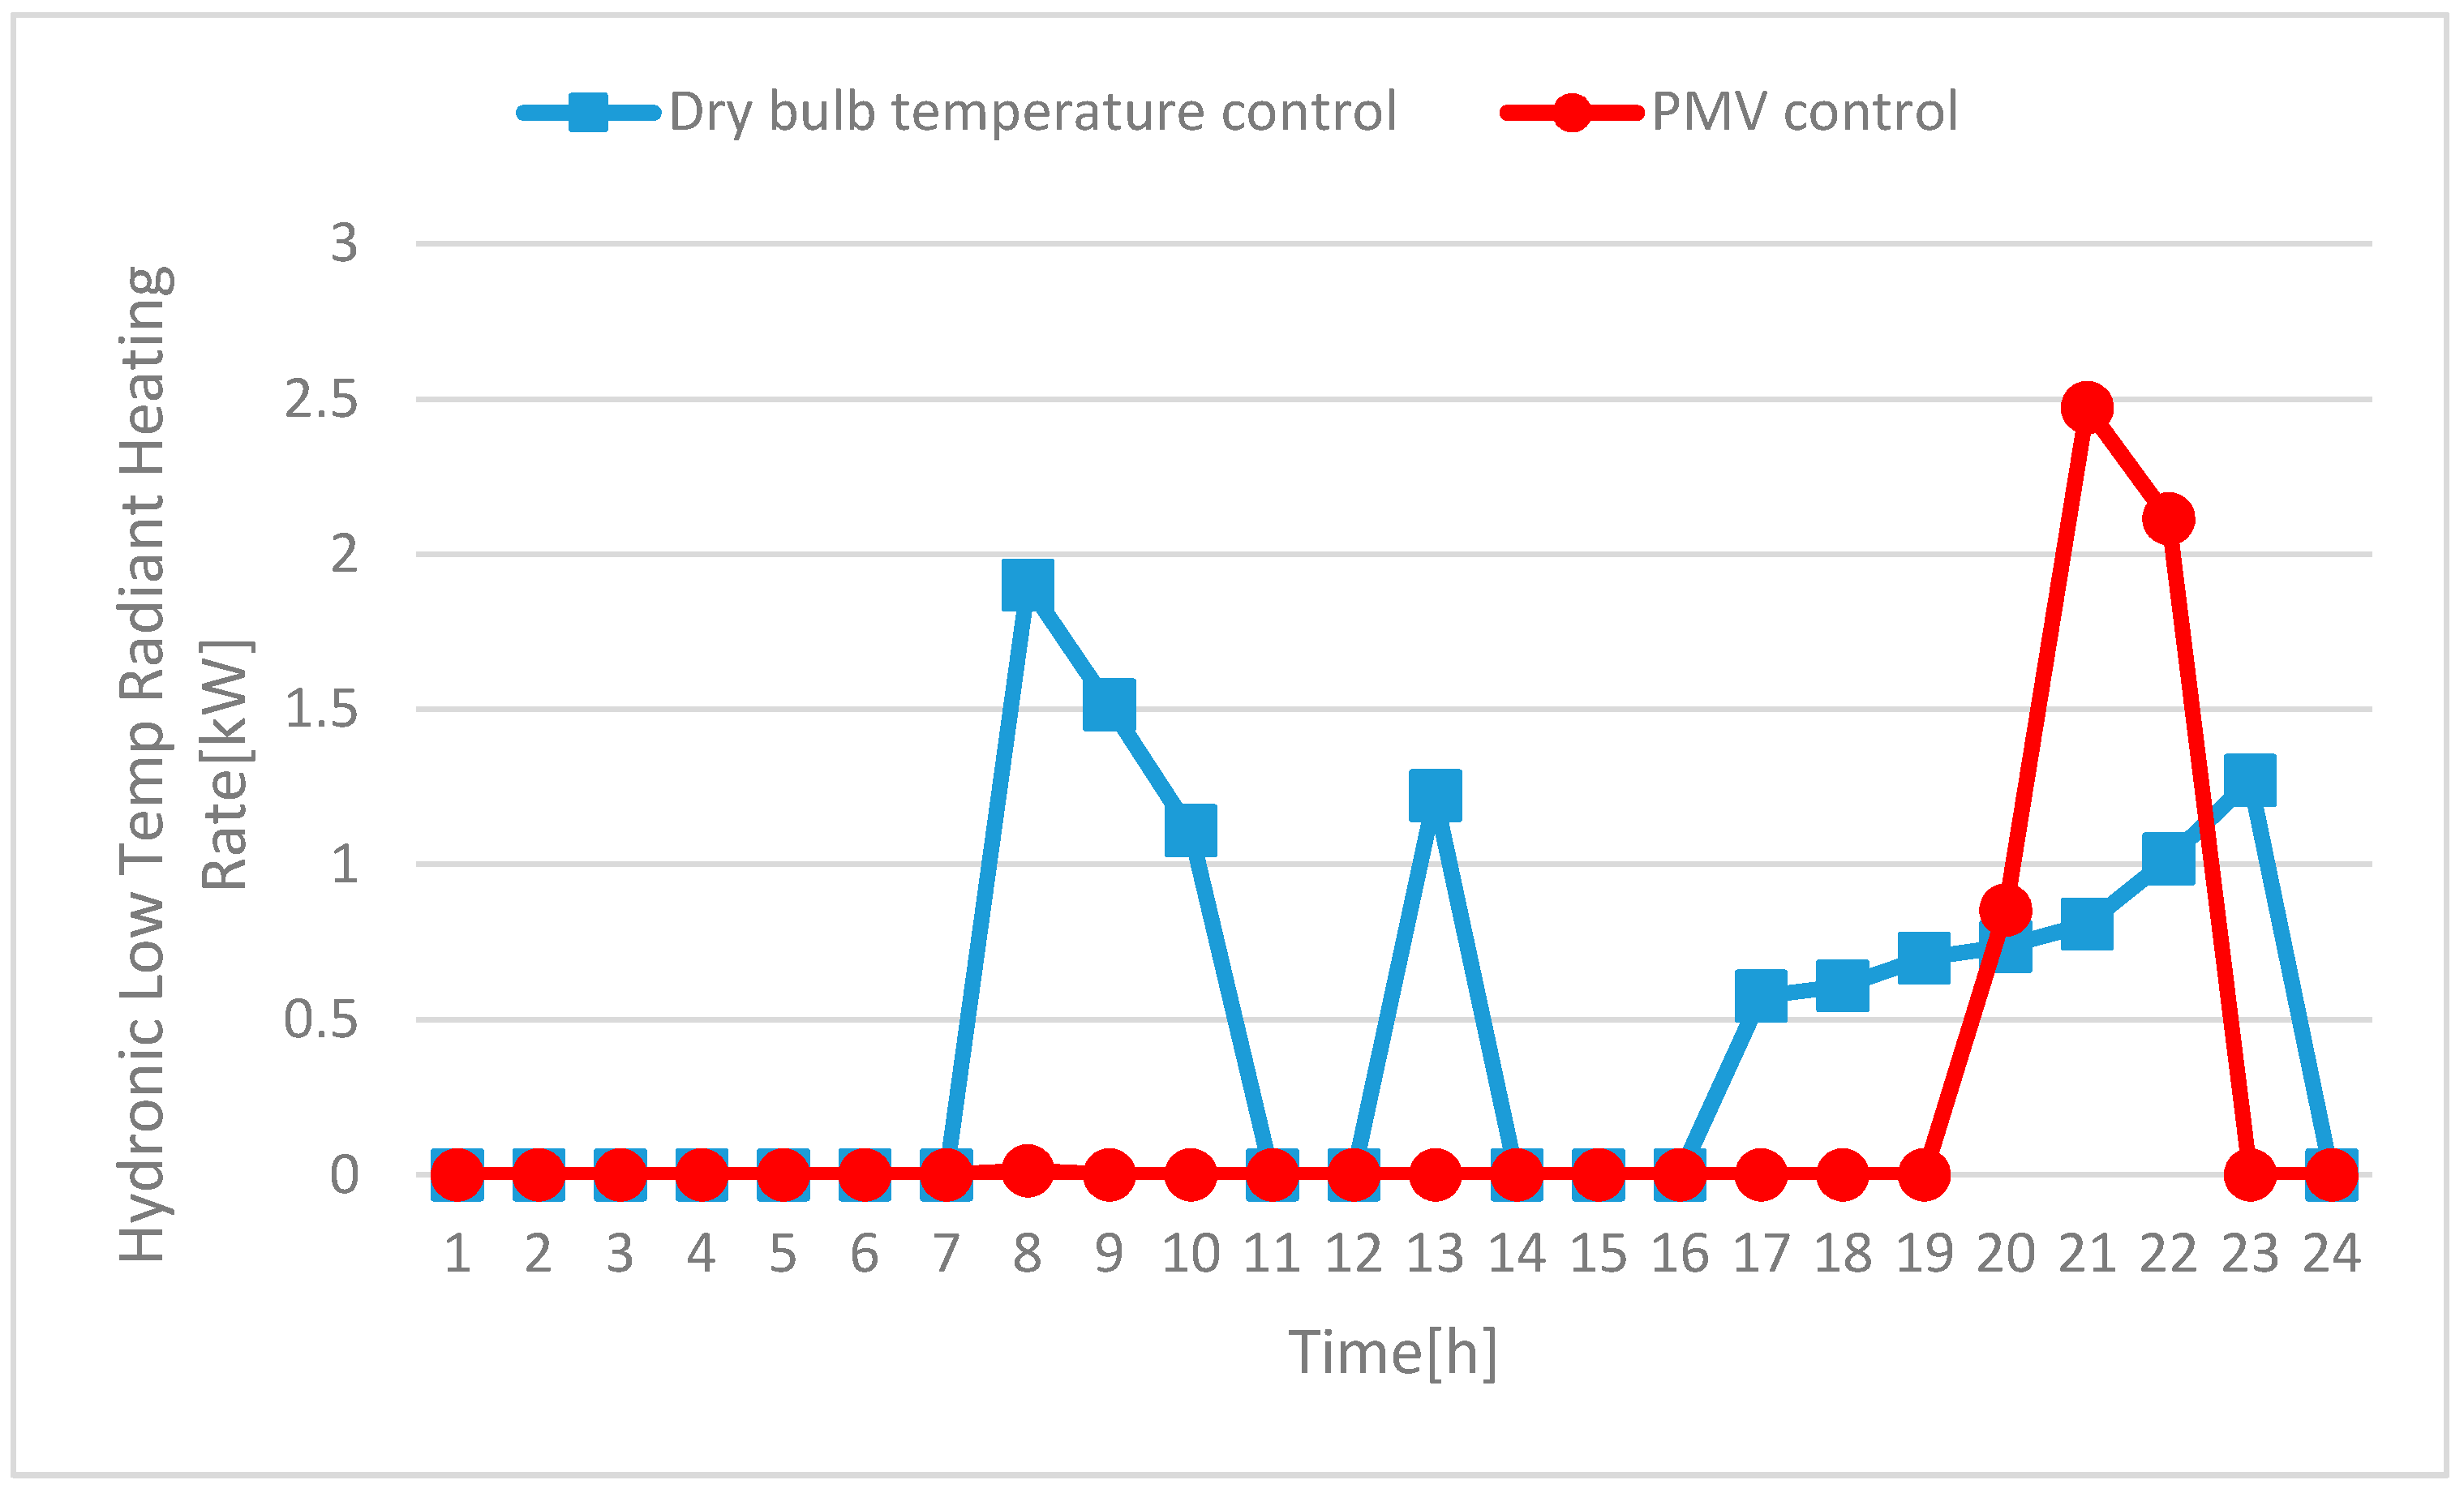
Figure 16.
The heating rate supplied by the radiant floor heating system during the weekday (25 December).
Figure 16.
The heating rate supplied by the radiant floor heating system during the weekday (25 December).
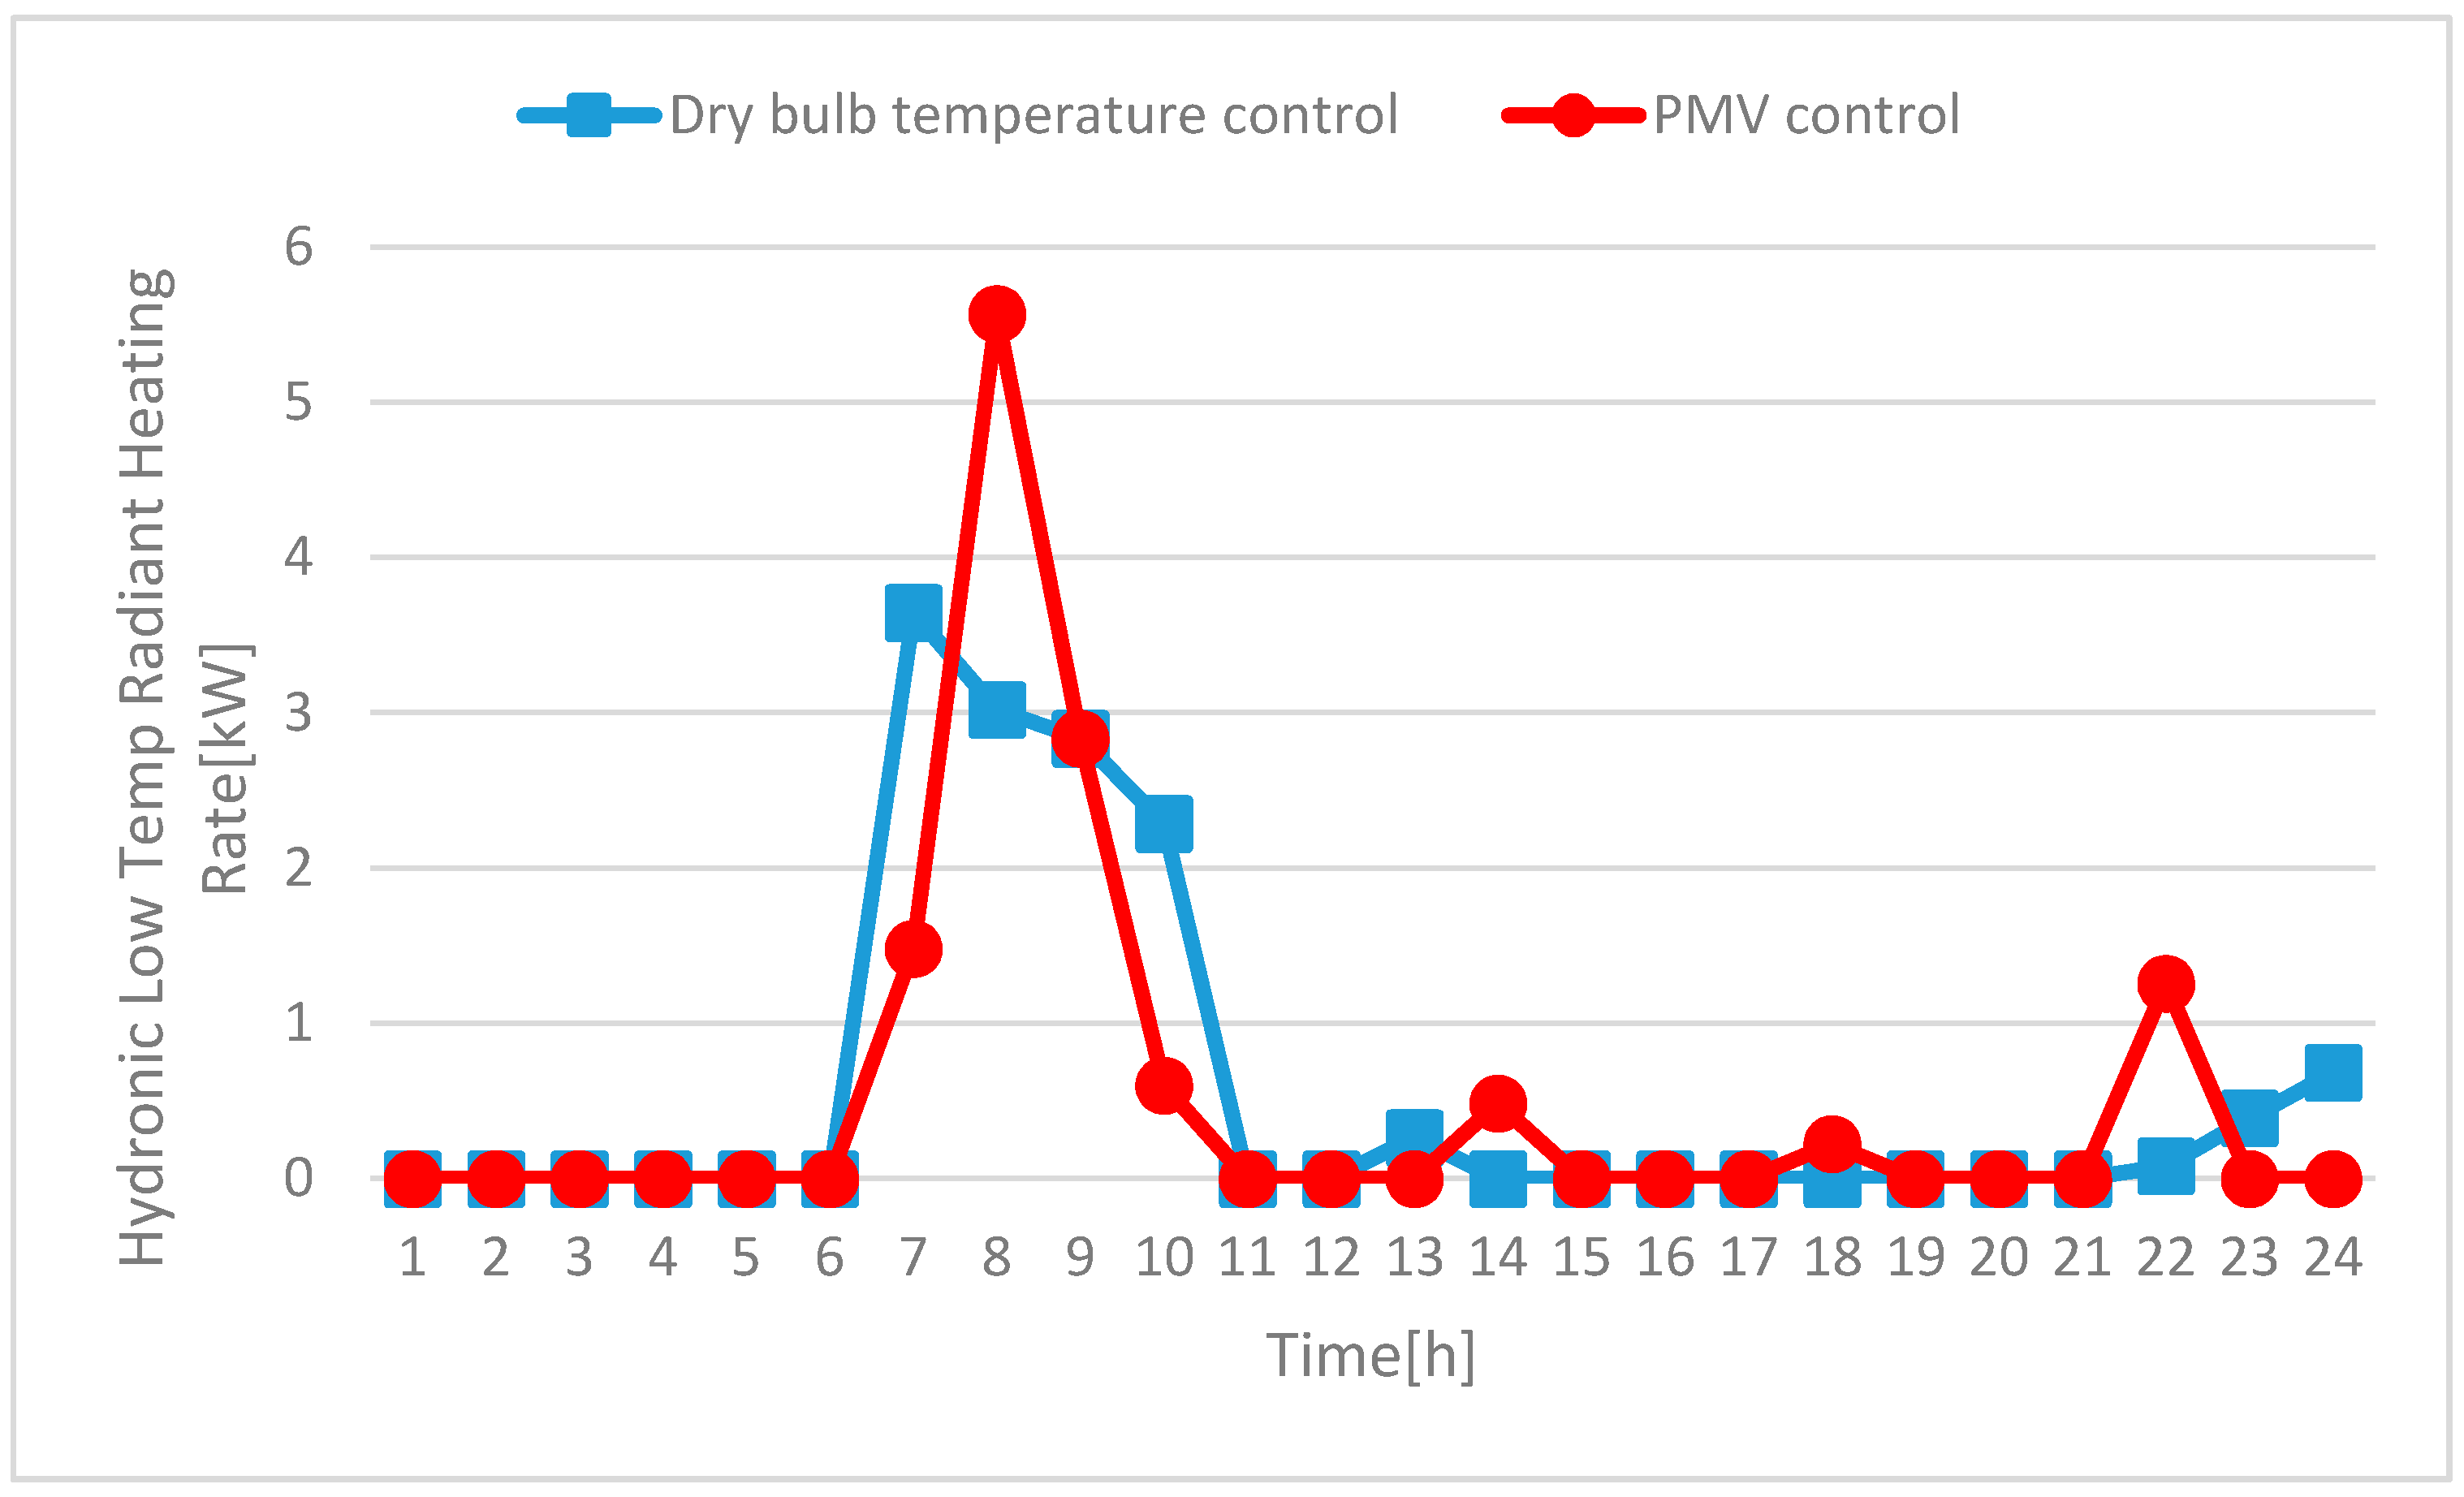
Figure 17.
The August electric consumption.

Figure 18.
The December gas consumption.
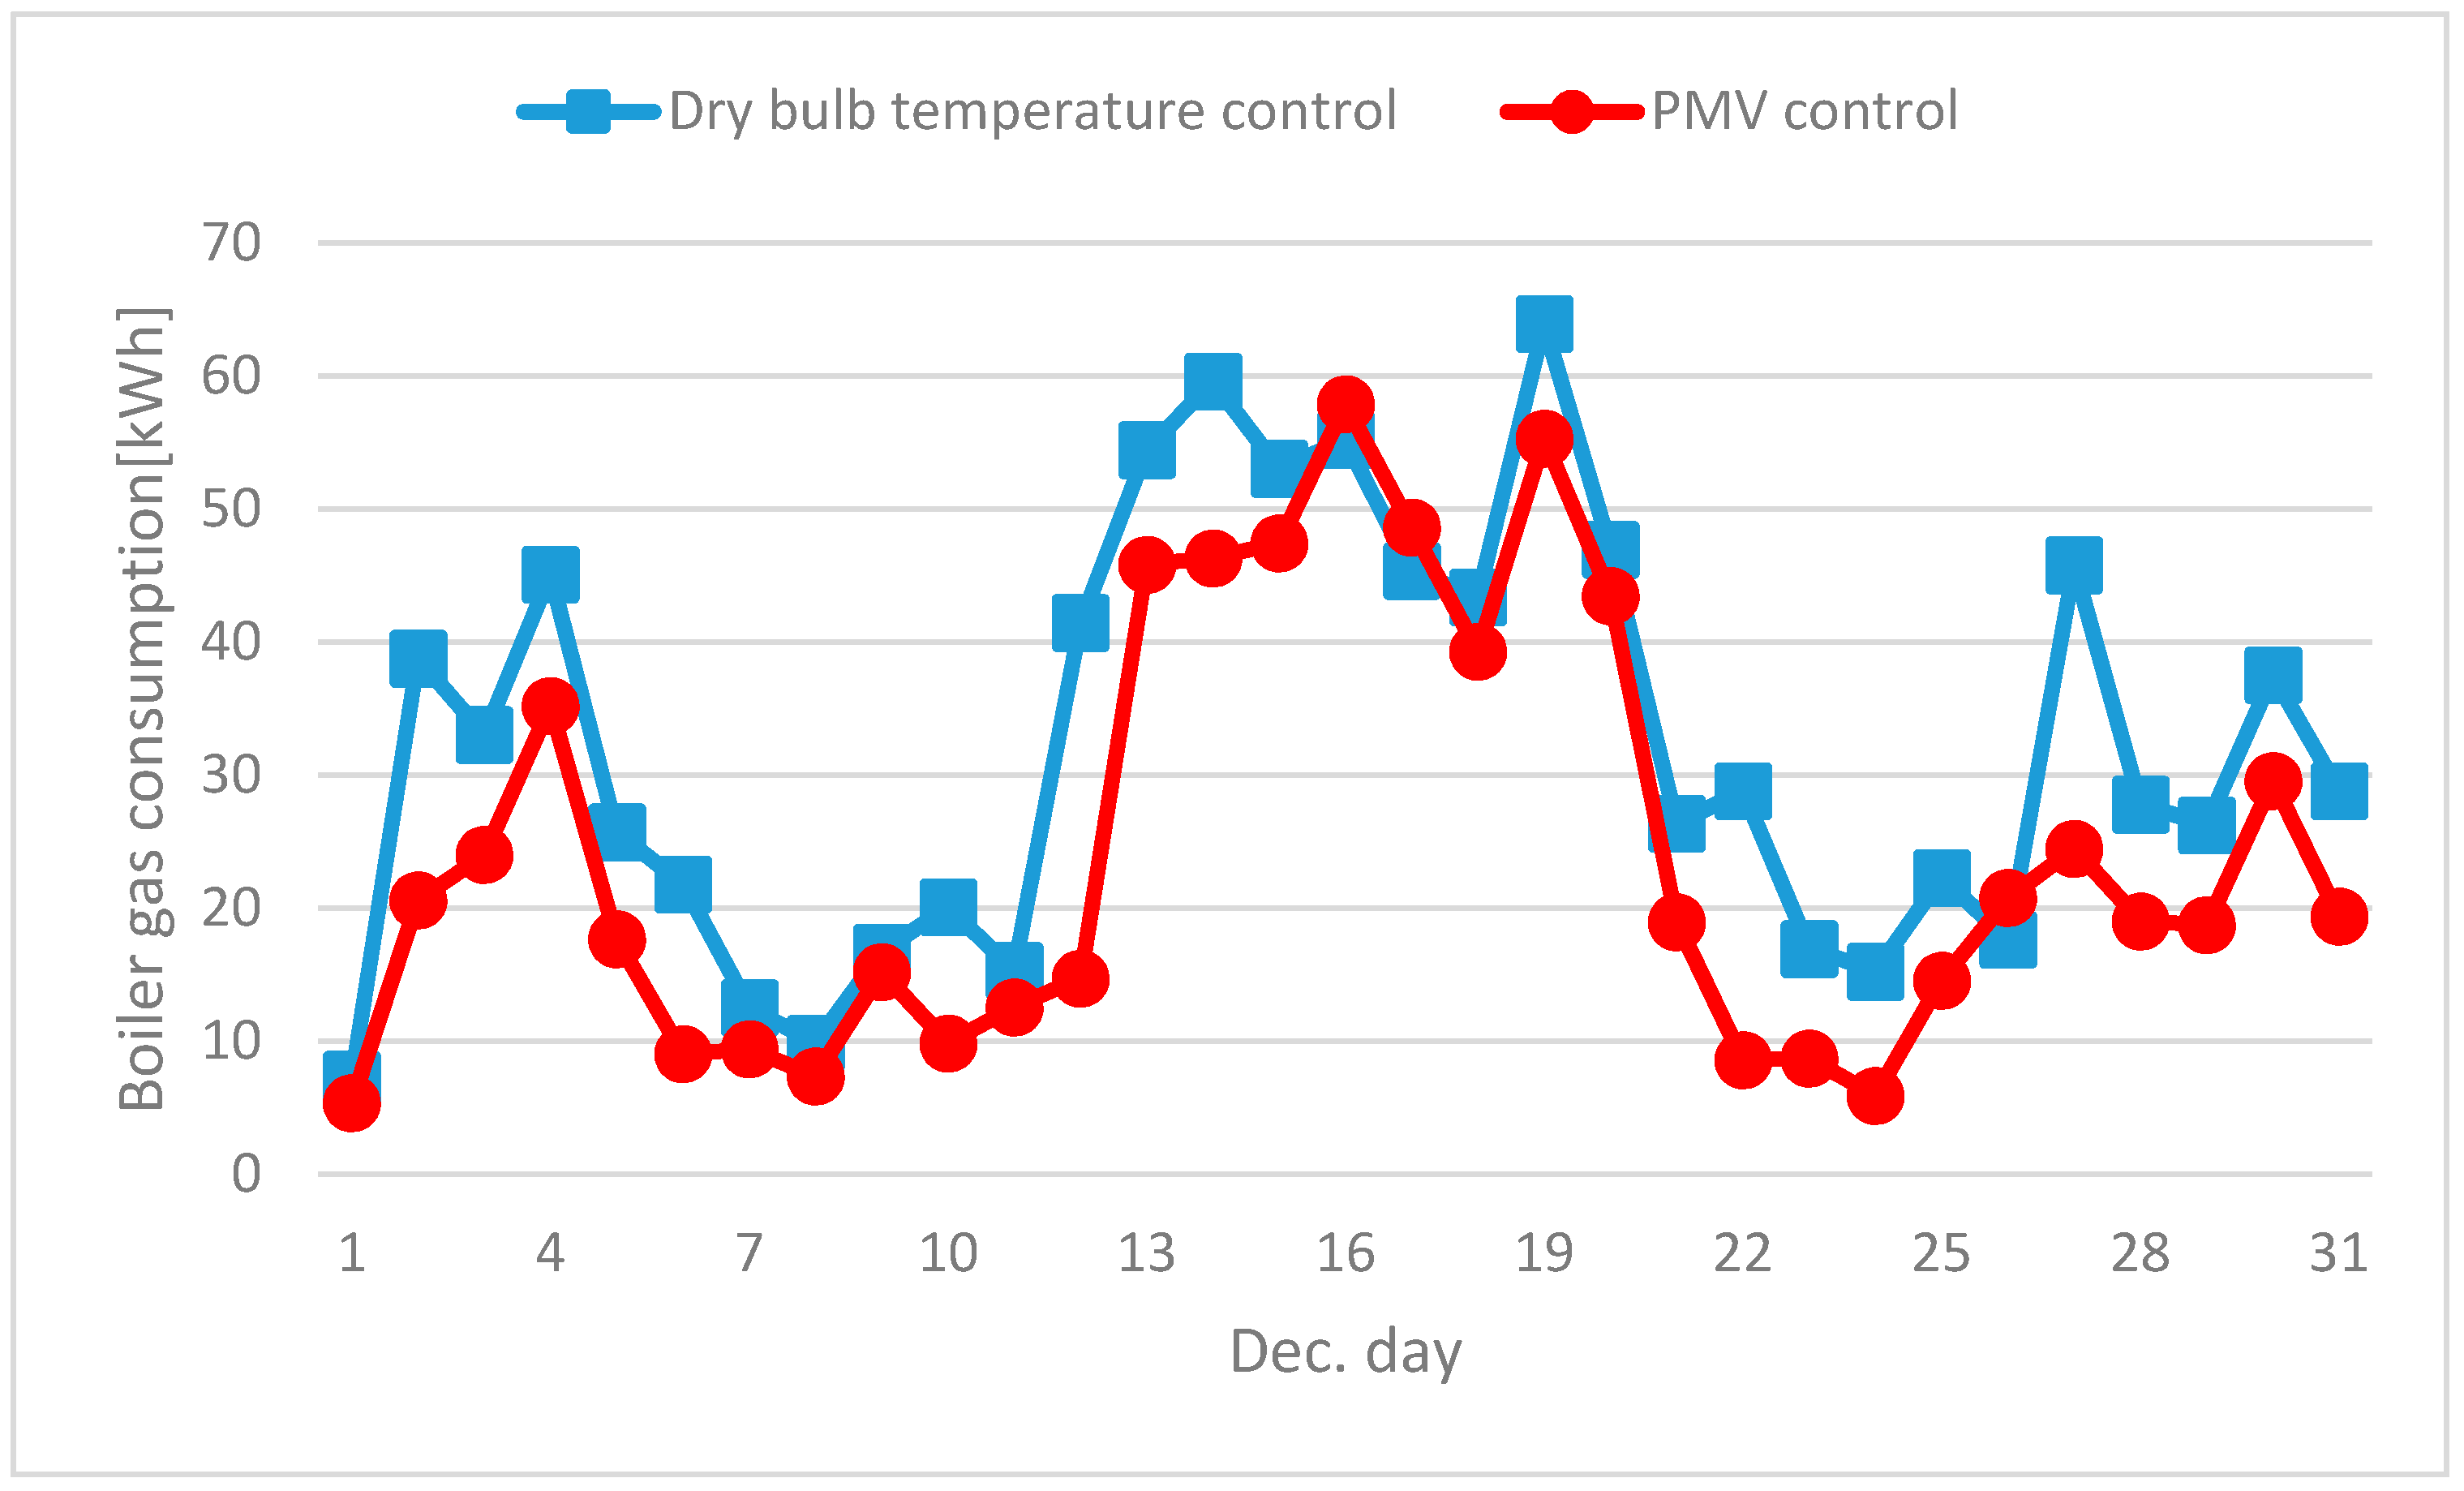
Figure 19.
The annual heating energy consumption.

Figure 20.
The annual cooling energy consumption.
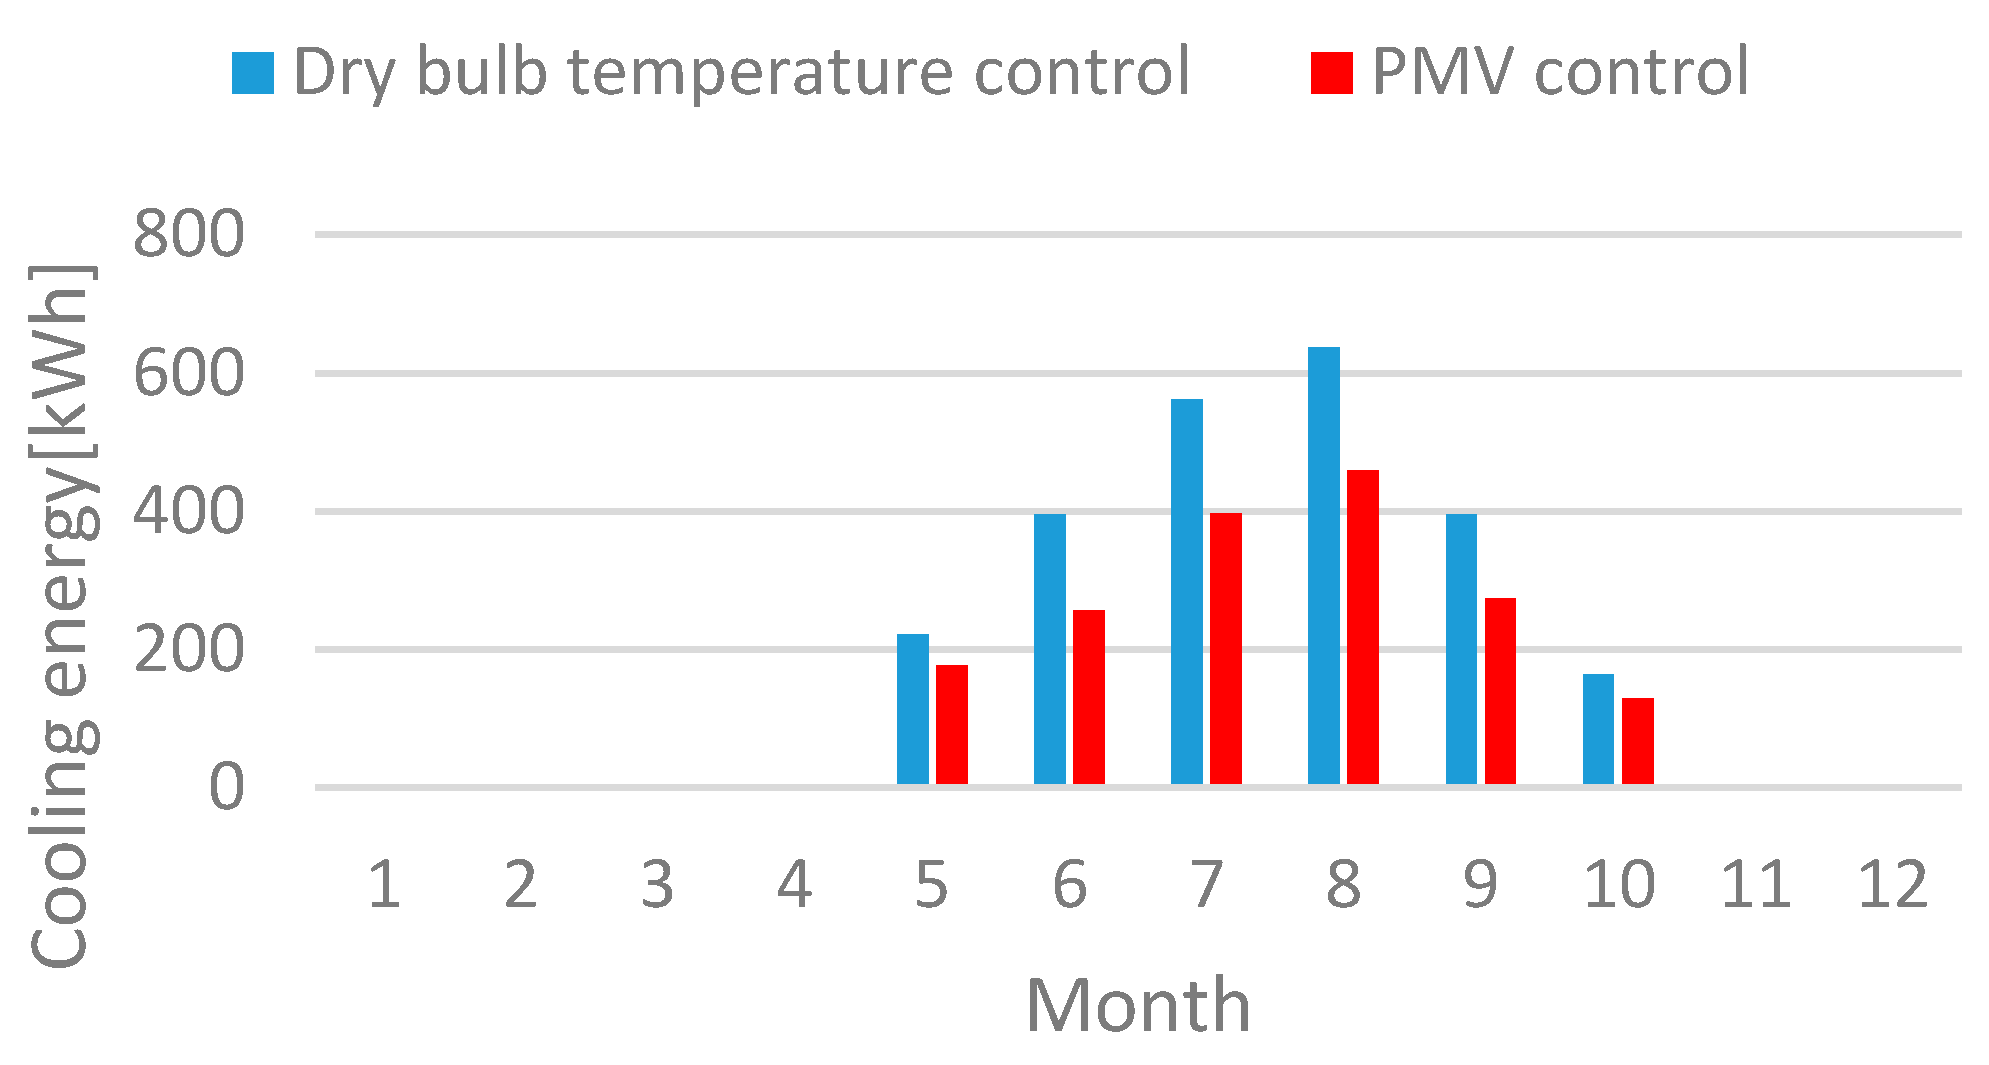
Figure 21.
The lifecycle cost (LCC) analysis.

Table 1.
The seven-point thermal sensation scale.
| +3 | Hot |
| +2 | Warm |
| +1 | Slightly warm |
| 0 | Neutral |
| −1 | Slightly cool |
| −2 | Cool |
| −3 | Cold |
Table 2.
The metabolic rates for various activities.
| Activity | Activity Level (W/Person) | Metabolic Rate Per Person (Met) |
|---|---|---|
| Sleeping | 72 | 0.7 |
| Reclining | 81 | 0.8 |
| Seated, quiet | 108 | 1 |
| Standing, relaxed | 126 | 1.2 |
| Reading, seated | 99 | 1 |
| Writing | 108 | 1 |
| Typing | 117 | 1.1 |
| Filling, seated | 126 | 1.2 |
| Filling, standing | 144 | 1.4 |
| Cooking | 171 to 207 | 1.6 to 2.0 |
| House cleaning | 207 to 360 | 2.0 to 3.4 |
Table 3.
The weekday system ON/OFF and activity level.
| Time | Metabolic Rate | System (ON/OFF) | Activity Level |
|---|---|---|---|
| (W/Person) | |||
| 1:00 | 0.7 | OFF | 72 |
| 2:00 | 0.7 | OFF | 72 |
| 3:00 | 0.7 | OFF | 72 |
| 4:00 | 0.7 | OFF | 72 |
| 5:00 | 0.7 | OFF | 72 |
| 6:00 | 0.7 | OFF | 72 |
| 7:00 | 1.4 | ON | 144 |
| 8:00 | 1.05 | ON | 113 |
| 9:00 | 2.7 | ON | 284 |
| 10:00 | 1 | ON | 108 |
| 11:00 | 0 | OFF | 0 |
| 12:00 | 0 | OFF | 0 |
| 13:00 | 1.35 | ON | 140 |
| 14:00 | 1 | ON | 108 |
| 15:00 | 0 | OFF | 0 |
| 16:00 | 0 | OFF | 0 |
| 17:00 | 1.3 | ON | 135 |
| 18:00 | 1 | ON | 108 |
| 19:00 | 1.6 | ON | 171 |
| 20:00 | 1.225 | ON | 129 |
| 21:00 | 1.3 | ON | 135 |
| 22:00 | 1 | ON | 108 |
| 23:00 | 1.25 | ON | 130 |
| 0:00 | 0.775 | ON | 79 |
Table 4.
The holiday system ON/OFF and activity level.
| Time | Metabolic Rate | System (ON/OFF) | Activity Level |
|---|---|---|---|
| (W/Person) | |||
| 1:00 | 0.7 | OFF | 72 |
| 2:00 | 0.7 | OFF | 72 |
| 3:00 | 0.7 | OFF | 72 |
| 4:00 | 0.7 | OFF | 72 |
| 5:00 | 0.7 | OFF | 72 |
| 6:00 | 0.7 | OFF | 72 |
| 7:00 | 0.7 | OFF | 72 |
| 8:00 | 1.325 | ON | 138 |
| 9:00 | 1.5 | ON | 153 |
| 10:00 | 3.4 | ON | 360 |
| 11:00 | 0 | OFF | 0 |
| 12:00 | 0 | OFF | 0 |
| 13:00 | 1.35 | ON | 140 |
| 14:00 | 0 | OFF | 0 |
| 15:00 | 0 | OFF | 0 |
| 16:00 | 0 | OFF | 0 |
| 17:00 | 2 | ON | 207 |
| 18:00 | 1.7 | ON | 180 |
| 19:00 | 1.225 | ON | 129 |
| 20:00 | 1.125 | ON | 120 |
| 21:00 | 1 | ON | 108 |
| 22:00 | 1 | ON | 108 |
| 23:00 | 1.25 | ON | 132 |
| 0:00 | 0.7 | OFF | 72 |
Table 5.
The internal load level.
| People | |
| Number of People Calculation Method | Area/Person |
| Zone Floor Area per Person | 32 m2/Person |
| Fraction Radiant | 0.3 |
| Light | |
| Design Level Calculation Method | Watts/Area |
| Watts per Zone Floor Area | 3.88 W/m2 |
| Return Air Fraction | 0 |
| Fraction Radiant | 0.2 |
| Fraction Visible | 0.2 |
| Equipment | |
| Design Level Calculation Method | Watts/Area |
| Watts per Zone Floor Area | 5.38 W/m2 |
Table 6.
The construction properties.
| Construction | |
|---|---|
| Exterior Floor | I02 50 mm insulation board |
| M15 200 mm heavyweight concrete | |
| Exterior Wall | M01 100 mm brick |
| M15 200 mm heavyweight concrete | |
| I02 50 mm insulation board | |
| F04 Wall airspace resistance | |
| G01a 19 mm gypsum board | |
| Interior Wall | G01a 19 mm gypsum board |
| F04 Wall airspace resistance | |
| G01a 19 mm gypsum board | |
| Exterior Roof | M11 100 mm lightweight concrete |
| F05 Ceiling airspace resistance | |
| F16 Acoustic tile | |
| Interior Ceiling | Finish flooring |
| INS-Expanded EXT polystyrene R12 2 In | |
| Concrete-dried sand and gravel 4 | |
| Exterior Window | Clear 3 mm |
| Air 13 mm | |
| Clear 3 mm | |
| Interior Window | Clear 3 mm |
| Exterior Door | F08 Metal surface |
| I01 25 mm insulation board | |
| Interior Door | G05 25 mm wood |
Table 7.
The primary energy conversion factors.
| Category | Primary Energy Conversion Factor |
|---|---|
| Gas(fuel) | 1.1 |
| Electricity | 2.75 |
| District heating | 0.728 |
| District cooling | 0.937 |
Table 8.
The initial investment cost.
| Dry Bulb Temperature Control | PMV Control | ||
|---|---|---|---|
| Type | Price (KRW) | Type | Price (KRW) |
| Temperature controller | 55,000 ($50.95) | Temperature & humidity sensor | 2000 ($1.85) |
| Airflow sensor | 70,000 ($64.84) | ||
| MRT | 45,000 ($41.69) | ||
| Camera | 6000 ($5.56) | ||
| Board | 90,000 ($83.37) | ||
| Temperature controller | 55,000 ($50.95) | ||
Table 9.
The rate table according to power consumption [22].
Table 9.
The rate table according to power consumption [22].
| Base Rate (KRW) | Energy Charge (KRW/kWh) | ||
|---|---|---|---|
| 1–200 kWh | 730 ($0.68) | 1–200 kWh | 78.3 ($0.07) |
| 201–400 kWh | 1260 ($1.17) | 201–400 kWh | 147.3 ($0.14) |
| 400 kWh~ | 6060 ($5.61) | 400 kWh~ | 215.6 ($0.2) |
Table 10.
The analysis period present value.
| Year | Dry Bulb Temperature Control Present Value (KRW 1000) | PMV Control Present Value (KRW 1000) |
|---|---|---|
| 1 | 825.68 ($767.30) | 1731.84 ($1609.52) |
| 2 | 1325.07 ($1231.48) | 2087.18 ($1939.76) |
| 3 | 1825.52 ($1696.74) | 2443.27 ($2270.71) |
| 4 | 2310.27 ($2147.29) | 2788.19 ($2591.26) |
| 5 | 2779.80 ($2583.46) | 3122.29 ($2901.76) |
| 6 | 3234.60 ($3006.13) | 3445.90 ($3202.52) |
| 7 | 3675.12 ($3415.54) | 3759.36 ($3493.83) |
| 8 | 4101.82 ($3812.1) | 4062.98 ($3776.01) |
| 9 | 4515.13 ($4196.22) | 4357.07 ($4049.32) |
| 10 | 4915.46 ($4568.28) | 4641.93 ($4313.66) |
| 11 | 5303.24 ($4928.66) | 4917.85 ($4570.07) |
© 2018 by the authors. Licensee MDPI, Basel, Switzerland. This article is an open access article distributed under the terms and conditions of the Creative Commons Attribution (CC BY) license (http://creativecommons.org/licenses/by/4.0/).
Share and Cite
MDPI and ACS Style
Hong, S.H.; Lee, J.M.; Moon, J.W.; Lee, K.H. Thermal Comfort, Energy and Cost Impacts of PMV Control Considering Individual Metabolic Rate Variations in Residential Building. Energies 2018, 11, 1767. https://doi.org/10.3390/en11071767
AMA Style
Hong SH, Lee JM, Moon JW, Lee KH. Thermal Comfort, Energy and Cost Impacts of PMV Control Considering Individual Metabolic Rate Variations in Residential Building. Energies. 2018; 11(7):1767. https://doi.org/10.3390/en11071767
Chicago/Turabian StyleHong, Sung Hyup, Jong Man Lee, Jin Woo Moon, and Kwang Ho Lee. 2018. "Thermal Comfort, Energy and Cost Impacts of PMV Control Considering Individual Metabolic Rate Variations in Residential Building" Energies 11, no. 7: 1767. https://doi.org/10.3390/en11071767
Note that from the first issue of 2016, this journal uses article numbers instead of page numbers. See further details here.