An Experimental Investigation on Flame Pulsation for a Swirl Non-Premixed Combustion


National Thermal Power Engineering & Technology Research Center, North China Electric Power University, Beijing 102206, China
*
Author to whom correspondence should be addressed.
Energies 2018, 11(7), 1757; https://doi.org/10.3390/en11071757
Submission received: 12 June 2018
/
Revised: 28 June 2018
/
Accepted: 28 June 2018
/
Published: 4 July 2018
(This article belongs to the Section I: Energy Fundamentals and Conversion)
Abstract
:Flame pulsation has a significant effect on combustion, and understanding its oscillatory behavior is important to the combustion community. An experiment was performed to analyze the pulsation characteristics of a swirl non-premixed flame under various parameters. The results showed that as fuel mass flow rate increased, the puffing frequency increased due to the decreased flame radiation fraction, and the puffing amplitude became smaller resulting in a more stable flame. With an increase in combustor pressure, the flickering frequency declined because of the increasing soot radiation, while the flickering amplitude uniformly increased, leading to more deteriorative flame stability. With an increment in mass flow rate of primary air, the puffing frequency decreased due to the enhanced mixing between fuel and primary air. Also, the puffing amplitude had an oscillating relationship with the mass flow rate of primary air. When the exit velocity of the injector was increased, the flickering frequency diminished nearly linearly because of the improving swirl intensity, and the flickering amplitude was approximately unaffected by injector exit velocity. Moreover, the measured puffing frequencies summarized over all cases varied within the range of 3–22 Hz, the predicted values from theoretical models based on non-swirl flame also fell within this range. The puffing frequency of swirl combustion was more sensitive to the variation in operating conditions than that of non-swirl combustion. Additionally, the obtained correlations indicated that the Strouhal number St was proportional to Fr−1.4 (the Froude number) and Re−2.9 (the Reynolds number), respectively.
1. Introduction
Turbulent non-premixed flames are widely employed in the majority of practical combustion systems, primarily due to the ease with which such flames can be controlled. Observation of a luminous non-premixed flame indicates that the flame is not in a quiescent state at any time; it exhibits a considerable oscillatory behavior which is often referred as “flame pulsation,” “flame puffing,” or “flame flickering” [1].
Kelvin-Helmholtz instability initiates large vortices around the flame surface driven by buoyant force. These vortices, having convective motion, cause flame pulsation [2]. The pulsation can exist even with stabilized supplies of fuel and oxidizer. Flame puffing always induces a recurring alteration in the structure of flame, which affects the entrainment rate of air into the flame, flame length, flame radiation, and combustion efficiency. Under severe cases, the flickering can result in the extinction of the flame and the combustion device’s failure, such as a gas turbine combustor and boiler furnace. Therefore, understanding flame oscillatory behavior is significant to the combustion community [3].
In recent decades, research has been performed to explore the characteristics of non-premixed flame puffing. Bahadori et al. [4] experimented to examine the impact of gravity level on flame oscillating frequency f and amplitude A. The results showed that the oscillation frequency of flame is proportional to a power function of gravitational acceleration g as f ∝ g0.5. It was also found that the oscillating amplitude have an analogous functional deviation with the gravity level. Durox et al. [5] discovered that the correlation between gravity and the puffing frequency approaches f ∝ g0.67. Arai et al. [6] ascribed the increasing of flickering frequency under higher gravitational levels to the increment in velocity of the wave and decline in wavelength. Some investigators examined the impact of burner diameter d on the pulsation frequency; they found that the frequency scales with burner diameter d as f = Cd−0.5 [7], where C is constant. However, the value for C is diverse among different studies. For example, C has a value of 1.68 from the research by Malalasekera et al. [1], 1.5 from the study by Cetegen and Kasper [8], 1.73 from the results of Bejan [9], and 1.52 from the investigation by Pagni [10].
Yilmaz et al. [11] experimentally measured the flow field of an oscillating diffusion flame with Particle image velocimetry (PIV). It was observed that the flame pulsations were strongest at lower flow rates of fuel. A flame quenching mechanism appeared to be responsible for flow oscillation. Yilmaz et al. [12] pointed out in their experimental results that the relationship between pulsation frequency and fuel flow rate is not stable, and the frequency presents a non-monotonic variation trend with the fuel flow rate. Pan et al. [2] employed a bluff-body burner to study the flame flickering mechanism; the results revealed that increasing annular air flow velocity gradually increases the flickering frequency. Tang et al. [13] investigated the influence of aspect ratio on puffing behavior with a rectangular burner. It was concluded that the pulsation frequency amplifies with the increment of aspect ratio. Gotoda et al. [14] explored the effect of the oxygen concentration of the surrounding gas on flame oscillation. It was found that the oscillation frequency increases monotonically with an increase in oxygen fraction, while the oscillation amplitude decreases drastically with increasing oxygen concentration.
Recently, some investigations presented the puffing characteristics in a sub-atmospheric pressure [13,15,16,17]. The flickering behavior in a confined compartment was detected in multiple studies [18,19,20]. Moreover, some data processing methods can be found in studies [20,21].
Flame puffing frequency is usually correlated by Strouhal number St, Froude number Fr, and Reynolds number Re, which are defined as Equations (1)–(3).
where f is frequency, d is injector exit diameter, ve is injector exit velocity, and ν is fluid kinematic viscosity. St is a suitable non-dimensional parameter in the research of oscillating and periodic phenomena. The relationship for St with Fr, St with Re could be expressed as St ∝ Fra, St ∝ Reb, respectively, from some researches such as Arai et al. [6] and Yilmaz et al. [12]. Generally, the values for exponents a and b are negative and varying for different experimental situations.
From the above, the vast majority of studies on flame pulsation behavior were performed under the non-swirling conditions, while the puffing characteristics under swirl flame were still unknown. Swirl has widespread use in combustion systems, as it plays critical role in stabilizing flame, controlling the flame size and combustion intensity [22], and lowering NOx emissions [23,24]. Therefore, it is necessary to explore the flame flickering for swirl combustion. Meanwhile, although the flame puffing at low combustion pressure (less than atmospheric pressure) was examined as summed above, the puffing behavior at high pressure (much more than atmospheric pressure) has not been reported, which may be quite different from the behavior under sub-atmospheric pressure.
Combustion pressure is a critical parameter in gas turbine combustor, which determines the cycle thermal efficiency [25] and significantly affects flame properties, such as flame zone and NOx emission [26]. Industrial gas turbine manufacturers have been pursuing the engines with higher pressure ratios, such as Mitsubishi M501H (25), GE 7HA/9HA (22), and ALSTOM GT26 (33). However, due to experimental complications, combustor testing at higher pressures is extremely limited [27], and combustion characteristics under high pressure are relatively less explored. Consequently, studying the flame puffing at elevated pressure has great significance. Moreover, primary air addition in fuel before it burns is often employed to shorten flame length [28], but its effects on flame oscillation are also not understood.
In the present analysis, an experiment was performed to investigate the flame pulsation at various operating conditions under a swirl non-premixed flame. Flame pulsation was determined by measuring the fluctuation of the rate of flame heat-release [2,29]. The varying parameters include flow rate of fuel ṁF, combustor pressure P, mass flow rate of primary air ṁpri, and exit velocity of injector ve. At first, flame dynamic behavior was analyzed with a sequence of instantaneous images for a typical condition. Second, the frequency and amplitude for varying operating conditions were examined. Finally, the measured frequency was compared with the predicted value using theoretical models, and the scaling relationships for St with Fr, St with Re were obtained respectively.
2. Experimental Setup
2.1. Experimental Apparatus
The combustion test facility for this investigation has a design power of 20 kW, which can be operated under high-pressure conditions. The test rig is primarily composed of three sections, as can be seen in Figure 1.
- (1)
- An air compressor and a high-pressure gas holder are the main components of the supply section. A mass flow rate controller (MFC) measures and controls the flow rate of fuel (methane) coming from the gas holder. MFC’s maximum flow rate capacity is 36 g/min. The air compressor supplies the combustion air at a maximum of 2.5 kg/min flow rate. An electric control valve (not shown in Figure) regulates the air flow, and an air flow meter measures the flow rate.
- (2)
- Second, there is combustion section consisting of a combustor and swirl burner. As shown in Figure 2, the combustor is 1.35 m long cylindrical chamber which is axisymmetric and have 0.3 m diameter. The Swirl burner consists of a radial swirler, central fuel tube, and convergent-divergent passing. The swirler improves the mixing quality of fuel and air. It has 10 straight vanes having a setting angle α of 50°. The convergent-divergent nozzle is designed to enhancing flame stability. The angle between the vertical line and the nozzle’s divergent side face is 42°. A fraction of air (primary air) tangentially flows through the radial swirler and carries fuel supplied by the central fuel tube into combustion chamber, where combustion occurs. On a mass basis, primary air is only 5% of the total air supplied. The primary air premixes the fuel in the burner sector before combustion and controls the flame length. The level of mixing between fuel and primary air is still insufficient as the mixing occurs in a shorter distance. The remaining/surplus air (secondary air) flows into the annular slot through a wind distributing plate and then enters the combustor flowing adjacent to the inner wall. Secondary air supports combustion and cools the wall to avert damage to the metallic parts caused by overheating. To observe and record the flame structure, a window (which is optically accessible) is attached to the combustor wall.
- (3)
- Finally, there is exhaust section comprised of a pressure regulating valve and induced draught system. The former controls the combustor operating pressure, while the latter draws exhaust gas out to the atmosphere.
2.2. Measurement Methods
To examine the dynamic behavior of flame, the flame zone was detected by recording the CO2* chemiluminescence image through the optical window with a high-speed COMS camera (Olympus i speed 3, Olympus, Essex, UK) coupled to a band filter (BG 38, HB-OPTICAL, Shenyang, China) which has a bandwidth of 340–600 nm, as displayed in Figure 3.
The CO2* chemiluminescence method was reviewed by Samaniego et al. [30] and is often employed for determining flame zone. Although within the 340–600 nm wavelength range, various species such as CH, PAH, and C may exist, but their impact is trivial and can be ignored since, in hydrocarbon flames, the prime emitter is CO2*. As the review [30] suggests, when integrated over 340–600 nm range, more than 95% of chemiluminescence comprises CO2* emission. So, chemiluminescence from the whole 340–600 nm range can be captured and inferred as CO2* emission. CO2* indicates the reaction zone and is formed in three fundamental stages as described in Equation (4) [30]
CO2* is produced in the first stage of reaction and returns to its ground state in the second and third stages of the reaction. In the second step, CO2* emits light and returns to the ground state (CO2). The final stage of reaction is a quenching step, and as can be seen in Equation (4), it contends with the second step reaction.
The measurement of flame chemiluminescence is extensively employed to study heat-release dynamics, as the total chemiluminescence emission is proportional to the overall heat-release rate [31]. So the overall heat-release rate can be indicated by the total chemiluminescence emission, which is obtained by summing the intensity of the chemiluminescence image (i.e., the gray values of all pixels in an image) [32,33,34]. The chemiluminescence was captured in time sequence, and the recording frame rate of the camera was set to 400 frames per second (fps), with an image resolution of 1280 H × 1024 V pixels. The fluctuation of heat-release rate was taken as flame oscillation signal. This signal was calculated and analyzed for each condition by Fast Fourier Transform (FFT) to obtain the flame pulsation frequency.
2.3. Experimental Conditions
To examine the impact of the operating conditions on flame pulsation frequency and amplitude, experiment cases were organized into four classes, as displayed in Table 1. Cases 1–3 were used to explore the influence of fuel mass flow rate ṁF. Cases 4–6 were employed to explore the effect of combustion pressure P. Cases 7–10 were used to investigate the effect of mass flow rate of primary air ṁpri. Cases 11–14 were employed to investigate the effect of injector exit velocity ve.
3. Results and Discussion
3.1. Flame Dynamics
The flame oscillation is a consequence of flame-vortex interaction; this phenomenon is also referred to as Kelvin-Helmholtz instability. It is mainly caused by the upward convection of large toroidal vortices, which are driven by buoyancy induced by combustion [1,3]. The pulsation process can be seen in Figure 4. The combustion of fuel produces high-temperature gases, which are accelerated by buoyant force in the surrounding low-temperature air. The gas velocity at the flame front is higher than that of ambient air, causing the formation of a toroidal vortex V1 outside the flame surface at 0 ms. This vortex promotes the air entrainment into flame zone, as it moves downstream due to natural convection, leading to the production of a characteristic necking. As this vortex travels downstream with the gases, creating a low-pressure region behind it, the burning gases from upstream simultaneously fill this low-pressure zone and generate a bulge. As the bulge goes up, another vortex V2 is formed below the bulge at 10 ms; it rises as V1. The motion of vortices gives rise to the flame puffing.
Moreover, some interesting flame characteristics were observed during the flickering process. At 10 ms, a local flame auto-ignition appeared near the flame base, resulting in the gradual enlargement of combustion zone at flame base in subsequent images from 10 ms to 17.5 ms. Afterward, the flame lifted off downstream from 17.5 ms to 30 ms, and the height of lift-off increased progressively in this period of time. After that, re-ignition at the flame base was found at 32.5 ms. The phenomena indicate the auto-ignition and lift-off behavior at the flame base alternately proceed during the process of flame pulsation. Another interesting observation was the flame extinction at the flame tip, as can be seen at 30 ms, since the vortex motion entrained cool surrounding air toward the flame tip, as indicated by the red circle at 27.5 ms. As a result, the local temperature decreased too much due to the excessive air entrainment, leading to the local extinction, which induced the oscillation of flame length. Furthermore, the segmental flame is observed to be cut off from the main body by excessive entrained air, producing an isolated small burning region, as can be seen in 0–5 ms, which is also an obvious behavior of the flame pulsation. These behaviors provided more insights into the understanding to flame puffing.
3.2. Frequency and Amplitude versus Fuel Mass Flow Rate
The time variation in flame heat-release rate normalized by its time-mean value under varying fuel mass flow rate is displayed in Figure 5. The time length was 1.28 s for each case, corresponding to 512 frames of images, as the recording frame rate of high-speed camera was set as 400 fps. Figure 5 also shows the corresponding amplitude-frequency curve of heat-release rate. It was observed that several peak spectrum values with a certain amount of amplitude exist in the low-frequency domain, mainly in the range of 0–50 Hz. Compared to the single-peak spectrum for flame with no swirl in previous researches [1,3], current spectrum observed in this research could have occurred due to the effect of swirl on flame oscillation. In spite of the multiple peak values emerging on the graph, one distinct peak value corresponding to the main frequency always can be found for each condition. The dominant frequencies and the normalized peak-to-peak amplitudes in Figure 5 are summarized in Figure 6.
It can be observed in Figure 6 that the puffing frequency f increased with the increase in mass flow rate of fuel (sharply from 12 g/min to 14 g/min but moderately from 14 g/min to 16 g/min). This was mainly attributed to the increased non-adiabatic flame temperature Tf due to the decreased flame radiation fraction χ, which is defined as the ratio between the rate of radiation heat-transfer from flame to ambient and the total heat-release rate by the flame [35]. As the ṁF increased, the total heat-release rate increased, the radiation fraction χ, decreased as depicted in [35]. The reduction of χ resulted in the elevation of Tf. Since the difference between non-adiabatic flame temperature Tf and adiabatic flame temperature Tad is mainly attributed to flame radiation, which is always the primary way of flame heat-transfer to the surroundings in most industrial combustion devices, especially for gaseous firing [36]. The increased Tf intensified the buoyancy force acting on the toroidal vortices as the density difference between flame and surrounding gas was enlarged at higher flame temperature, as shown in Equation (5) according to the ideal-gas state equation. As a result, the vortices traveled up with higher velocity, leading to the reduction of the puffing time period, and hence the puffing frequency increased.
where ρ∞ is the ambient gas density, ρf is the flame density, Rg is gas constant, and T∞ is the temperature of the ambient gas.
It also can be seen in Figure 6 that the normalized peak-to-peak amplitude of flame puffing decreased with the increment of fuel mass flow rate (rapidly from 12 g/min to 14 g/min but slowly from 14 g/min to 16 g/min), which implied that the flame oscillation became more stable at a higher fuel mass flow rate.
3.3. Frequency and Amplitude versus Combustor Pressure
The time variation in flame heat-release rate normalized by its time-mean value under varying combustor pressure is presented in Figure 7, of which the dominant frequencies and the normalized peak-to-peak amplitudes are summed up in Figure 8.
It can be seen in Figure 8 that the flame puffing frequency diminished with the increment in combustor pressure P (sharply from 3 bar to 4 bar but gently from 4 bar to 5 bar). This was explained by the increased soot at higher pressure [37] and thus enhanced the flame radiation since soot is the dominant contributor to flame radiation [38]. As a result, flame temperature decreased, and the buoyant force became weaker, thus causing a lower flickering frequency due to the slower convection velocity. It has been reported that the oscillating frequency increased as P was increased under the sub-atmospheric condition, with a pressure exponent of 1/3 [5]. This conflicts with present results. The difference may be due to the addition of swirl in our investigation as compared with the direct jet flame with no swirl in the previous research. The swirl field is more complex than non-swirl field because of the occurrence of spiral structure in swirl condition (i.e., the precessing vortex core (PVC)). This may lead to different pulsation behavior from that of non-swirl flame.
Figure 8 also shows that the normalized peak-to-peak amplitude of flame flickering uniformly increased with the increase in P, which indicated that flame oscillation deteriorated under higher P.
3.4. Frequency and Amplitude versus Primary Air Mass Flow Rate
The time variation in flame heat-release rate normalized by its time-mean value under varying primary air mass flow rate is presented in Figure 9, of which the dominant frequencies and the normalized peak-to-peak amplitudes are summarized in Figure 10.
It can be observed in Figure 10 that the puffing frequency reduced with the increment of the primary air mass flow rate ṁpri. This probably resulted from the enhancement of the mixing between fuel and primary air. As ṁpri increased, the relatively separated fuel and primary air got more chances to mix with each other before burning, resulting in the broadened region of fuel-lean/rich mixture. Hence, burning initiated in the premixing state producing more low-temperature flame regions. Meanwhile, the high-temperature reaction regions by the pure diffusion combustion with entirely separated fuel and air reduced [39]. Consequently, the overall flame temperature decreased, causing weaker buoyancy and inducing low velocity vortex movement, thus triggering lowered frequency.
One also can find that, in Figure 10, the normalized peak-to-peak amplitude of flame puffing did not vary monotonously with ṁpri. First, it significantly rose up as ṁpri varied from 95 g/min to 100 g/min, then slowly declined as ṁpri changed from 100 g/min to 105 g/min, and dramatically descended as ṁpri changed from 105 g/min to 110 g/min. This suggests that the intensity of flame pulsation had an oscillating relationship with primary air mass flow rate.
3.5. Frequency and Amplitude versus Injector Exit Velocity
The time variation in flame heat-release rate normalized by its time-mean value under varying injector exit velocity is presented in Figure 11, of which the dominant frequencies and the normalized peak-to-peak amplitudes are summarized in Figure 12.
As illustrated in Figure 12, the flickering frequency diminished nearly linearly with the rise in injector exit velocity ve, which was attributed to the improved swirl intensity at larger ve. As ve raised at a given fuel to primary air ratio, the radial swirler’s swirl number rose which has been verified in the previous research [40]. As a result, the mixing of fuel and primary air was strengthened since swirling flow induced high levels of turbulence which promoted the mixing [23]. Accordingly, similar to previous analysis, more premixed fuel-lean/rich zones were created which burned to produce low flame temperature, and less stoichiometric mixture zones for pure diffusion combustion (which generates high flame temperature) were formed. Therefore, the global flame temperature decreased, leading to the reduced frequency. Because, at lower temperature buoyant force decreased, causing a lower upward traveling velocity of the moving vortices.
In Figure 12, one also can observe that the normalized peak-to-peak amplitude of flame flickering changed within a small varying range less than 0.1. The amplitude approximately unchanged with the increasing ve. This indicated that the flame oscillation strength was almost unaffected by ve.
3.6. Predicted Frequencies and Correlations
The obtained puffing frequencies of present investigation for all cases varied within the range of 3–22 Hz, which was a relatively low-frequency band. Some theoretical models based on the flame with no swirl were developed for predicting the frequency, which merely depended on the burner diameter, i.e., f = Cd−0.5 [7]. Where C is constant, various models have different values for C. For example, C is 1.68 in the model of Malalasekera et al. [1], 1.5 in the model of Cetegen and Kasper [8], 1.73 in the model of Bejan [9], and 1.52 in the model of Pagni [10]. These models were employed to calculate puffing frequency. For 0.01 m injector exit diameter d, the calculated results are presented in Table 2.
It can be found in Table 2 that the predicted values from all theoretical models fall within the range of measurement value, i.e., 3–22 Hz. This implied that the puffing frequency of swirling flame was also concentrated on the low-frequency domain similar to that of non-swirl flame. However, the former seems more complicated than the latter in two aspects: (1) as stated before, the frequency spectrum under swirl combustion has multiple peak spectrum values with a certain amount of amplitudes existing in the low-frequency domain, which is different from the single-peak spectrum for non-swirl combustion in previous researches [1,3]. (2) The puffing frequency of swirl burning was more sensitive to the variation in operating conditions than that of non-swirl burning, which was primarily influenced by the diameter of burning nozzle.
Flame flickering frequency is often correlated by Strouhal number St (defined in Equation (1)), Froude number Fr (defined in Equation (2)), and Reynold number Re (defined in Equation (3)), for example, as determined by Arai et al. [6] and Yilmaz et al. [12]. This relation can provide information relating to puffing frequency. The measured data of the cases including the variation of air velocity at a given pressure (cases 7–14) were used to examine the relationship for St with Fr, and St with Re. The results are shown in Figure 13; one can see that St decreased with increasing Fr or Re, which was analogous to the observation in the study [12]. The corresponding fitted correlations were obtained as represented in Equations (6) and (7), with an exponent of −1.4 for Fr term and an exponent of −2.9 for Re term.
4. Conclusions
The flame pulsation of a swirl non-premixed combustion was studied by conducting an experiment under various operating conditions. The flame dynamics were analyzed, and the puffing frequencies and amplitudes were obtained. Also, a comparison was performed between the measured frequencies and predicted values with several theoretical models based on the non-swirl flame. The relationships for St with Fr, St with Re were also examined. The primary finding of this investigation include
- (1)
- Flame pulsation was caused by the upward movement of large toroidal vortices, which were driven by buoyancy induced by combustion. Some interesting oscillating phenomena during the puffing process were observed, including the flame’s auto-ignition at the flame base, the variation in flame lift-off height, flame extinction at the flame tip, and the formation of some isolated small burning regions. These behaviors provided more insights into the understanding of flame puffing.
- (2)
- As fuel mass flow rate ṁF increased, the puffing frequency amplified due to the increased flame temperature caused by the decreased flame radiation fraction. The puffing amplitude became smaller with the increase in ṁF, which implied the flame oscillating became more stable at higher ṁF.
- (3)
- As combustor pressure P increased, the flickering frequency declined because of the decreased flame temperature induced by the increasing soot radiation. The flickering amplitude uniformly increased with the increment of P, which indicated that flame oscillations were deteriorated under higher P.
- (4)
- As the primary air mass flow rate ṁpri increased, the puffing frequency decreased due to the reduced flame temperature resulted from the enhanced mixing between fuel and primary air. The puffing amplitude varied non-monotonously with an increase in ṁpri, which suggested that the intensity of flame pulsation had an oscillating relationship with ṁpri.
- (5)
- As the injector exit velocity ve increased, the flickering frequency diminished almost linearly because of the dropped flame temperature caused by the improved swirl intensity. The flickering amplitude remained approximately unchanged with an increment in ve, which indicated the flame oscillation strength was almost unaffected by ve.
- (6)
- The obtained puffing frequencies of the current measurement for all cases varied within the range of 3–22 Hz, the predicted values from all theoretical models fall within this range. The puffing frequency of swirl burning was more sensitive to the variation in operating conditions than that of non-swirl burning. The obtained correlations indicated St was proportional to Fr−1.4 and Re−2.9, respectively.
Author Contributions
Z.X. and Z.F. conceived and designed the experiments; Z.X., X.H., and Y.J. performed the experiments; Z.X. and X.H. analyzed the data; Z.X. and X.H. contributed reagents/materials/analysis tools; Z.X. and S.W.S. wrote the paper.
Funding
This research was funded by the Beijing Natural Science Foundation (Grant No. 3162030) and the Fundamental Research Funds for the Central Universities (Grant No. 2017XS134).
Conflicts of Interest
The authors declare no conflict of interest.
References
- Malalasekera, W.M.G.; Versteeg, H.K.; Gilchrist, K. A Review of Research and an Experimental Study on the Pulsation of Buoyant Diffusion Flames and Pool Fires. Fire Mater. 1996, 20, 261–271. [Google Scholar] [CrossRef]
- Pan, K.L.; Li, C.C.; Juan, W.C.; Yang, J.T. Low-frequency oscillation of a non-premixed flame on a bluff-body burner. Combust. Sci. Technol. 2009, 181, 1217–1230. [Google Scholar] [CrossRef]
- Sahu, K.B.; Kundu, A.; Ganguly, R.; Datta, A. Effects of fuel type and equivalence ratios on the flickering of triple flames. Combust. Flame 2009, 156, 484–493. [Google Scholar] [CrossRef]
- Bahadori, M.Y.; Zhou, L.; Stocker, D.P.; Hegde, U. Functional Dependence of Flame Flicker on Gravitational Level. AIAA J. 2001, 39, 1404–1406. [Google Scholar] [CrossRef]
- Durox, D.; Yuan, T.; Villermaux, E. The Effect of Buoyancy on Flickering in Diffusion Flames. Combust. Sci. Technol. 1997, 124, 277–294. [Google Scholar] [CrossRef]
- Arai, M.; Sato, H.; Amagai, K. Gravity effects on stability and flickering motion of diffusion flames. Combust. Flame 1999, 118, 293–300. [Google Scholar] [CrossRef]
- Hamins, A.; Yang, J.C.; Kashiwagi, T. An experimental investigation of the pulsation frequency of flames. Symp. Combust. 1992, 24, 1695–1702. [Google Scholar] [CrossRef]
- Cetegen, B.M.; Kasper, K.D. Experiments on the oscillatory behavior of buoyant plumes of helium and helium-air mixtures. Phys. Fluids 1996, 8, 2974–2984. [Google Scholar] [CrossRef]
- Bejan, A. Predicting the pool fire vortex shedding frequency. J. Heat Transf. 1991, 113, 261. [Google Scholar] [CrossRef]
- Pagni, P.J. Pool vortex shedding frequencies. Appl. Mech. Rev. 1990, 43, 160. [Google Scholar]
- Yilmaz, N.; Lucero, R.E.; Donaldson, A.B.; Gill, W. Flow characterization of diffusion flame oscillations using particle image velocimetry. Exp. Fluids 2009, 46, 737–746. [Google Scholar] [CrossRef]
- Yilmaz, N.; Burl Donaldson, A.; Edward Lucero, R. Experimental study of diffusion flame oscillations and empirical correlations. Energy Convers. Manag. 2008, 49, 3287–3291. [Google Scholar] [CrossRef]
- Tang, F.; Hu, L.; Wang, Q.; Ding, Z. Flame pulsation frequency of conduction-controlled rectangular hydrocarbon pool fires of different aspect ratios in a sub-atmospheric pressure. Int. J. Heat Mass Transf. 2014, 76, 447–451. [Google Scholar] [CrossRef]
- Gotoda, H.; Kawaguchi, S.; Saso, Y. Experiments on dynamical motion of buoyancy-induced flame instability under different oxygen concentration in ambient gas. Exp. Therm. Fluid Sci. 2008, 32, 1759–1765. [Google Scholar] [CrossRef]
- Fang, J.; Tu, R.; Guan, J.F.; Wang, J.J.; Zhang, Y.M. Influence of low air pressure on combustion characteristics and flame pulsation frequency of pool fires. Fuel 2011, 90, 2760–2766. [Google Scholar] [CrossRef]
- Wang, Q.; Hu, L.; Tang, F.; Zhang, X.; Delichatsios, M. Characterization and comparison of flame fluctuation range of a turbulent buoyant jet diffusion flame under reduced- and normal pressure atmosphere. Procedia Eng. 2013, 62, 211–218. [Google Scholar] [CrossRef]
- Tao, C.F.; Cai, X.S.; Wang, X. Experimental Determination of Atmospheric Pressures Effects on Flames from Small Scale Pool Fires. J. Fire Sci. 2013, 31, 387–394. [Google Scholar] [CrossRef]
- Pretrel, H.; Audouin, L. Periodic puffing instabilities of buoyant large-scale pool fires in a confined compartment. J. Fire Sci. 2013, 31, 197–210. [Google Scholar] [CrossRef]
- Chen, X.; Lu, S.; Wang, X.; Liew, K.M.; Li, C.; Zhang, J. Pulsation Behavior of Pool Fires in a Confined Compartment with a Horizontal Opening. Fire Technol. 2016, 52, 515–531. [Google Scholar] [CrossRef]
- Chen, X.; Lu, S.X. On the Analysis of Flame Pulsation and Fire Induced Vent Flow Oscillatory Behaviors in Confined Enclosures with Horizontal Openings. Procedia Eng. 2018, 211, 104–112. [Google Scholar] [CrossRef]
- Chen, J.; Bao, Q. Digital image processing based fire flame color and oscillation frequency analysis. Procedia Eng. 2012, 45, 595–601. [Google Scholar] [CrossRef]
- Domkundwar, V.M.; Sriramulu, V.; Gupta, M.C. Analysis of swirling recirculating reacting turbulent jets passing through diffusers. Combust. Flame 1978, 33, 241–249. [Google Scholar] [CrossRef]
- Cheng, T.S.; Chao, Y.C.; Wu, D.C.; Yuan, T.; Lu, C.C.; Cheng, C.K.; Chang, J.M. Effects of fuel-air mixing on flame structures and NOxemissions in swirling methane jet flames. Symp. Combust. 1998, 27, 1229–1237. [Google Scholar] [CrossRef]
- Terasaki, T.; Hayashi, S. The effects of fuel-air mixing on NOxformation in non-premixed swirl burners. Symp. Combust. 1996, 26, 2733–2739. [Google Scholar] [CrossRef]
- Boyce, M.P. Theoretical and Actual Cycle Analyses. In Gas Turbine Engineering Handbook; Elsevier: Waltham, MA, USA, 2012; p. 90. ISBN 9780123838421. [Google Scholar]
- Gomez-Ramirez, D.; Kedukodi, S.; Gadiraju, S.; Ekkad, S.V.; Moon, H.-K.; Kim, Y.; Srinivasan, R. Gas turbine combustor rig development and initial observations at cold and reacting flow conditions. In Proceedings of the ASME Turbo Expo: Turbomachinery Technical Conference and Exposition, Seoul, Korea, 13–17 June 2016. [Google Scholar]
- Lefebvre, A.H.; Ballal, D.R. Emissions. In Gas Turbine Combustion: Alternative Fuels and Emissions; CRC Press: Boca Raton, FL, USA, 2010; pp. 366–382. ISBN 9781420086058. [Google Scholar]
- Turns, S. Laminar diffusion flames. In An Introduction to Combustion: Concepts and Applications; McGraw-Hill: Columbus, OH, USA, 2000; pp. 338–340. [Google Scholar]
- Li, M.; Tong, Y.; Klingmann, J.; Thern, M. Impact of vitiation on a swirl-stabilized and premixed methane flame. Energies 2017, 10, 1557. [Google Scholar] [CrossRef]
- Samaniego, J.-M.; Egolfopoulos, F.N.; Bowman, C.T. CO2* Chemiluminescence in Premixed Flames. Combust. Sci. Technol. 1995, 109, 183–203. [Google Scholar] [CrossRef]
- Lee, J.G.; Santavicca, D.A. Experimental Diagnostics for the Study of Combustion Instabilities in Lean Premixed Combustors. J. Propuls. Power 2003, 19, 735–750. [Google Scholar] [CrossRef]
- Tachibana, S.; Kanai, K.; Yoshida, S.; Suzuki, K.; Sato, T. Combined effect of spatial and temporal variations of equivalence ratio on combustion instability in a low-swirl combustor. Proc. Combust. Inst. 2015, 35, 3299–3308. [Google Scholar] [CrossRef]
- Yoon, J.; Kim, M.K.; Hwang, J.; Lee, J.; Yoon, Y. Effect of fuel-air mixture velocity on combustion instability of a model gas turbine combustor. Appl. Therm. Eng. 2013, 54, 92–101. [Google Scholar] [CrossRef]
- Meier, W.; Weigand, P.; Duan, X.R.; Giezendanner-Thoben, R. Detailed characterization of the dynamics of thermoacoustic pulsations in a lean premixed swirl flame. Combust. Flame 2007, 150, 2–26. [Google Scholar] [CrossRef]
- Turns, S.R. Turbulent Nonpremixed Flames. In An Introduction to Combustion: Concepts and Applicationsan Introduction to Combustion: Concepts and Applications; McGraw-Hill: Columbus, OH, USA, 2000; pp. 501–502. ISBN 9780124974517. [Google Scholar]
- Viskanta, R.; Menguc, M.P. Radiation heat transfer in combustion systems. Prog. Energy Combust. Sci. 1987, 13, 97–160. [Google Scholar] [CrossRef]
- Lefebvre, A.H. Flame radiation in gas turbine combustion chambers. Int. J. Heat Mass Transf. 1984, 27, 1493–1510. [Google Scholar] [CrossRef]
- Claus, R.W. Spectral Flame Radiance from a Tubular-Can Combustor; NASA Lewis Research Center: Cleveland, OH, USA, 1981. [Google Scholar]
- Law, C.K. Chemical Thermodynamics. In Combustion Physics; Cambridge University Press: New York, NY, USA, 2006; p. 41. ISBN 9780511754517. [Google Scholar]
- Sheen, H.J.; Chen, W.J.; Jeng, S.Y.; Huang, T.L. Correlation of Swirl Number for a Radial-Type Swirl Generator. Exp. Therm. Fluid Sci. 1996, 12, 444–451. [Google Scholar] [CrossRef]
Figure 1.
High-pressure combustion test rig schematic diagram.
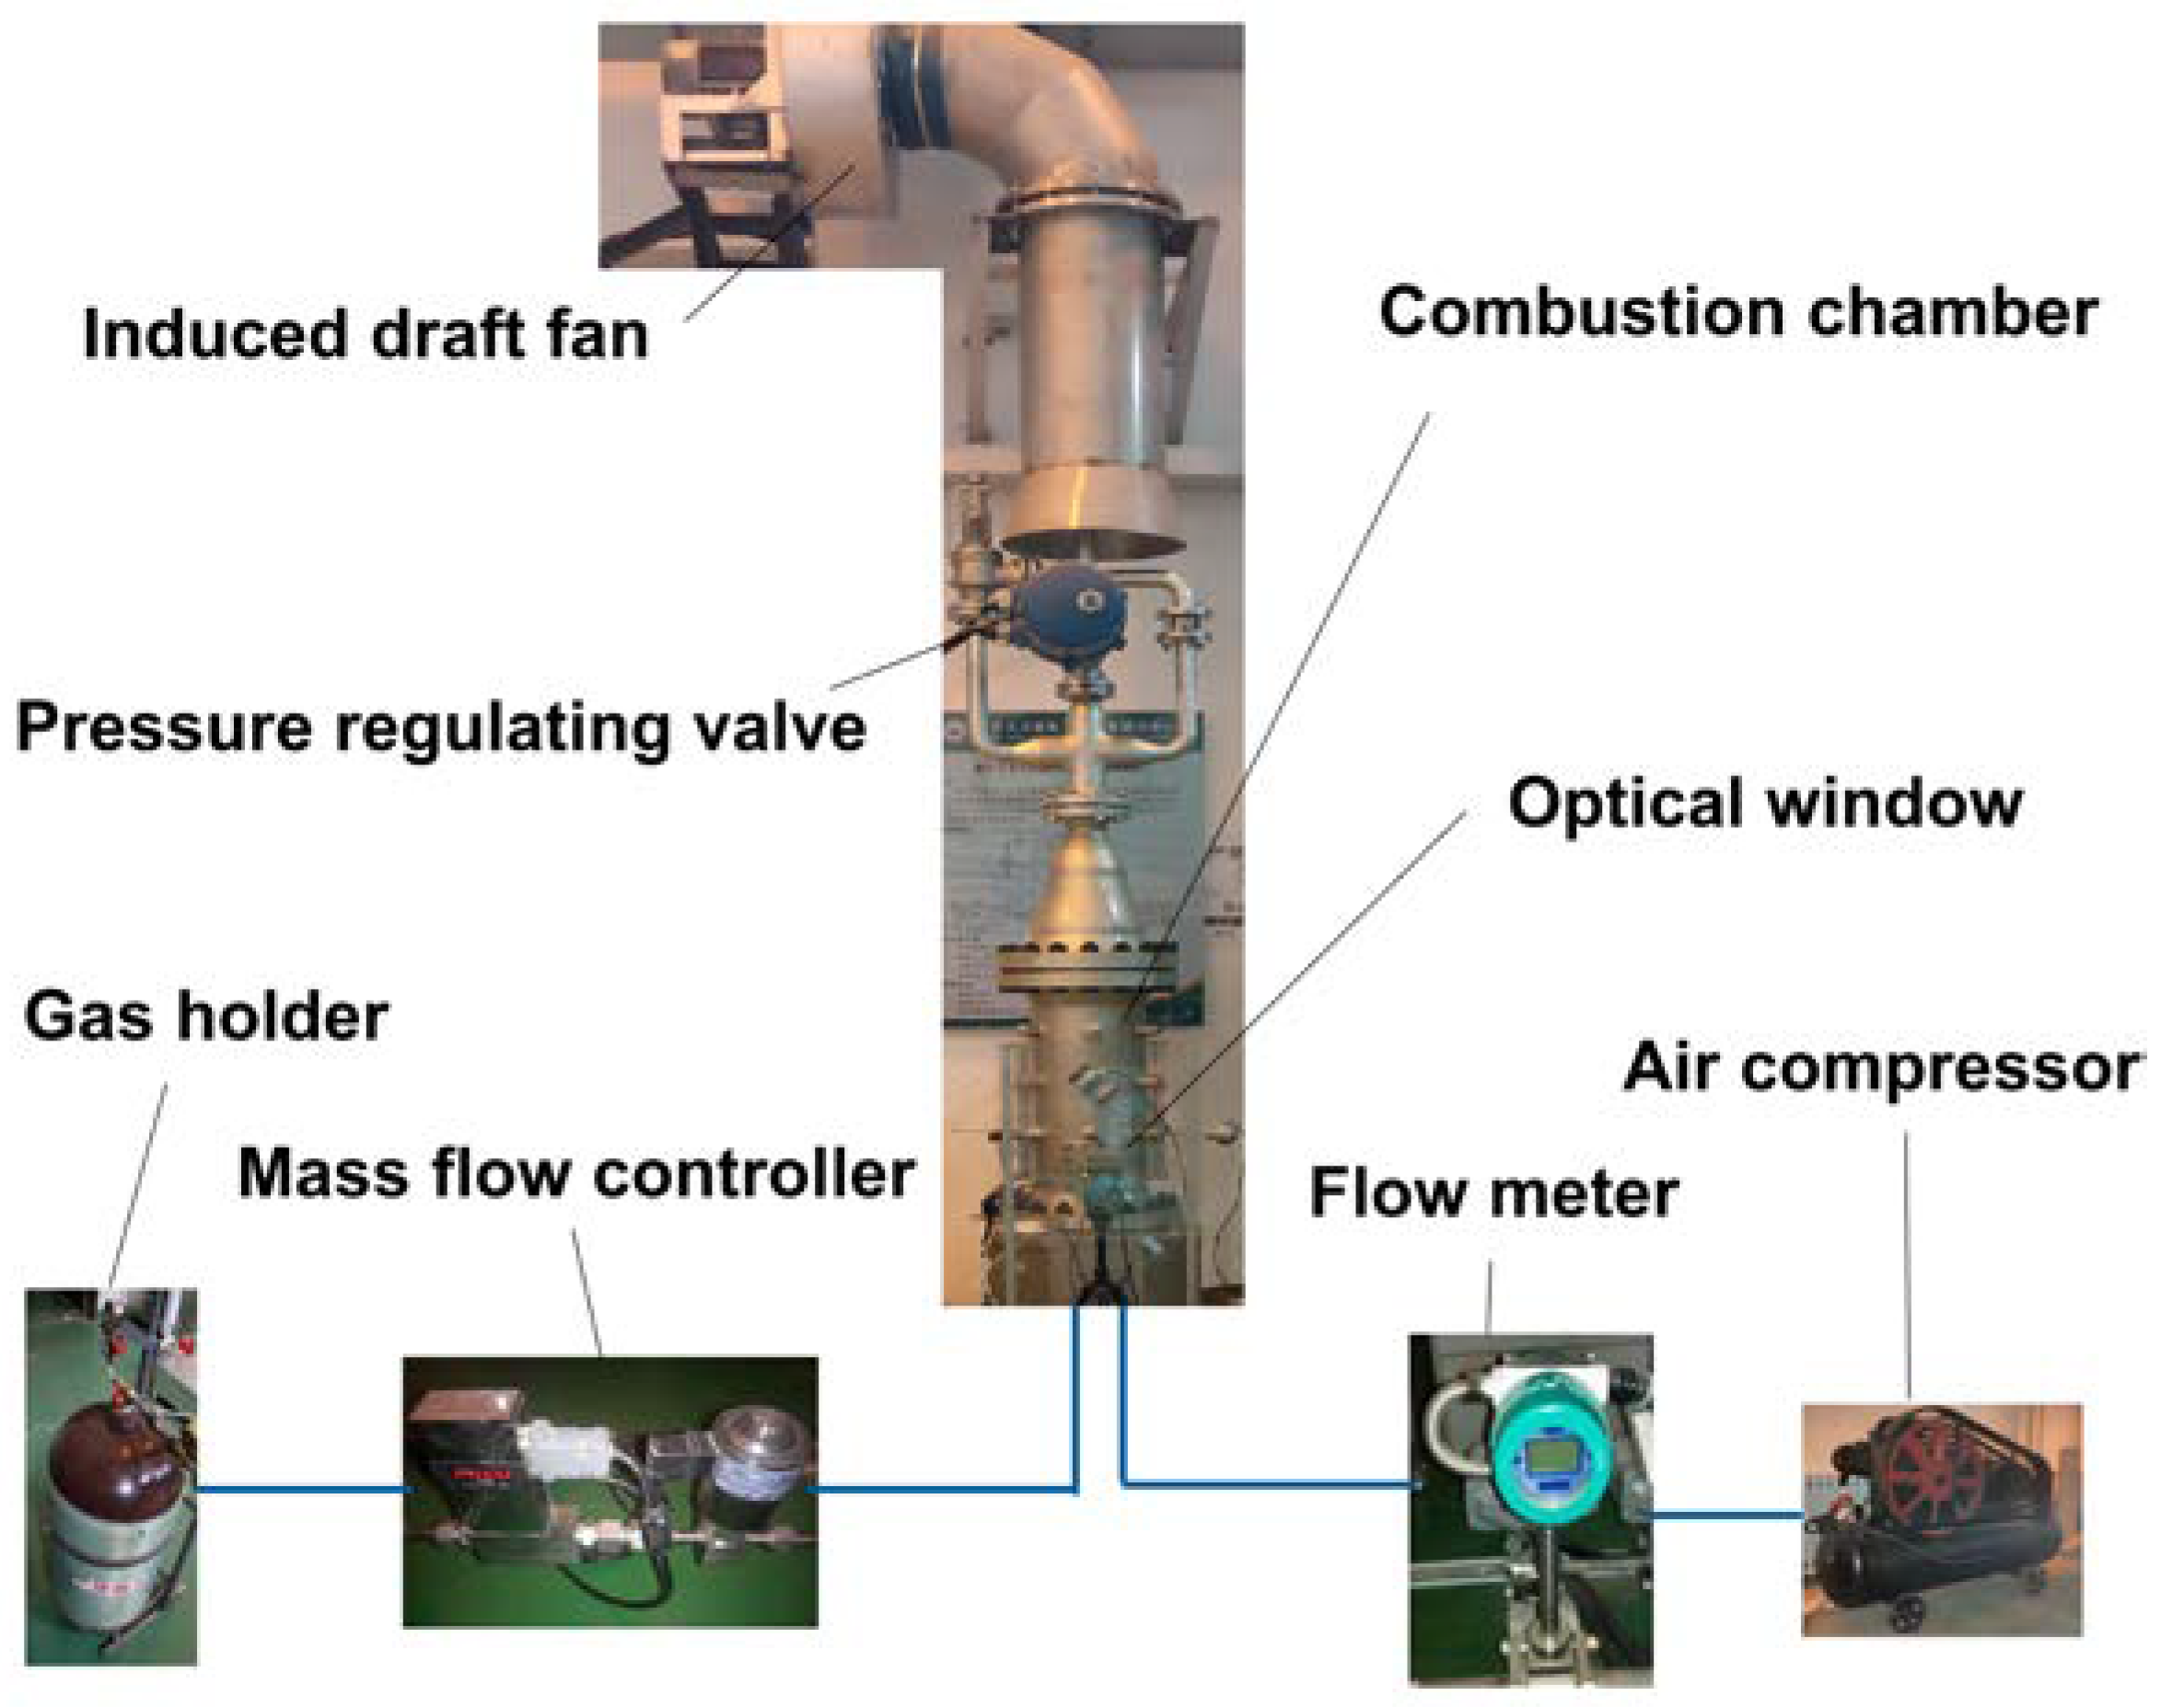
Figure 2.
The combustor and swirl burner.
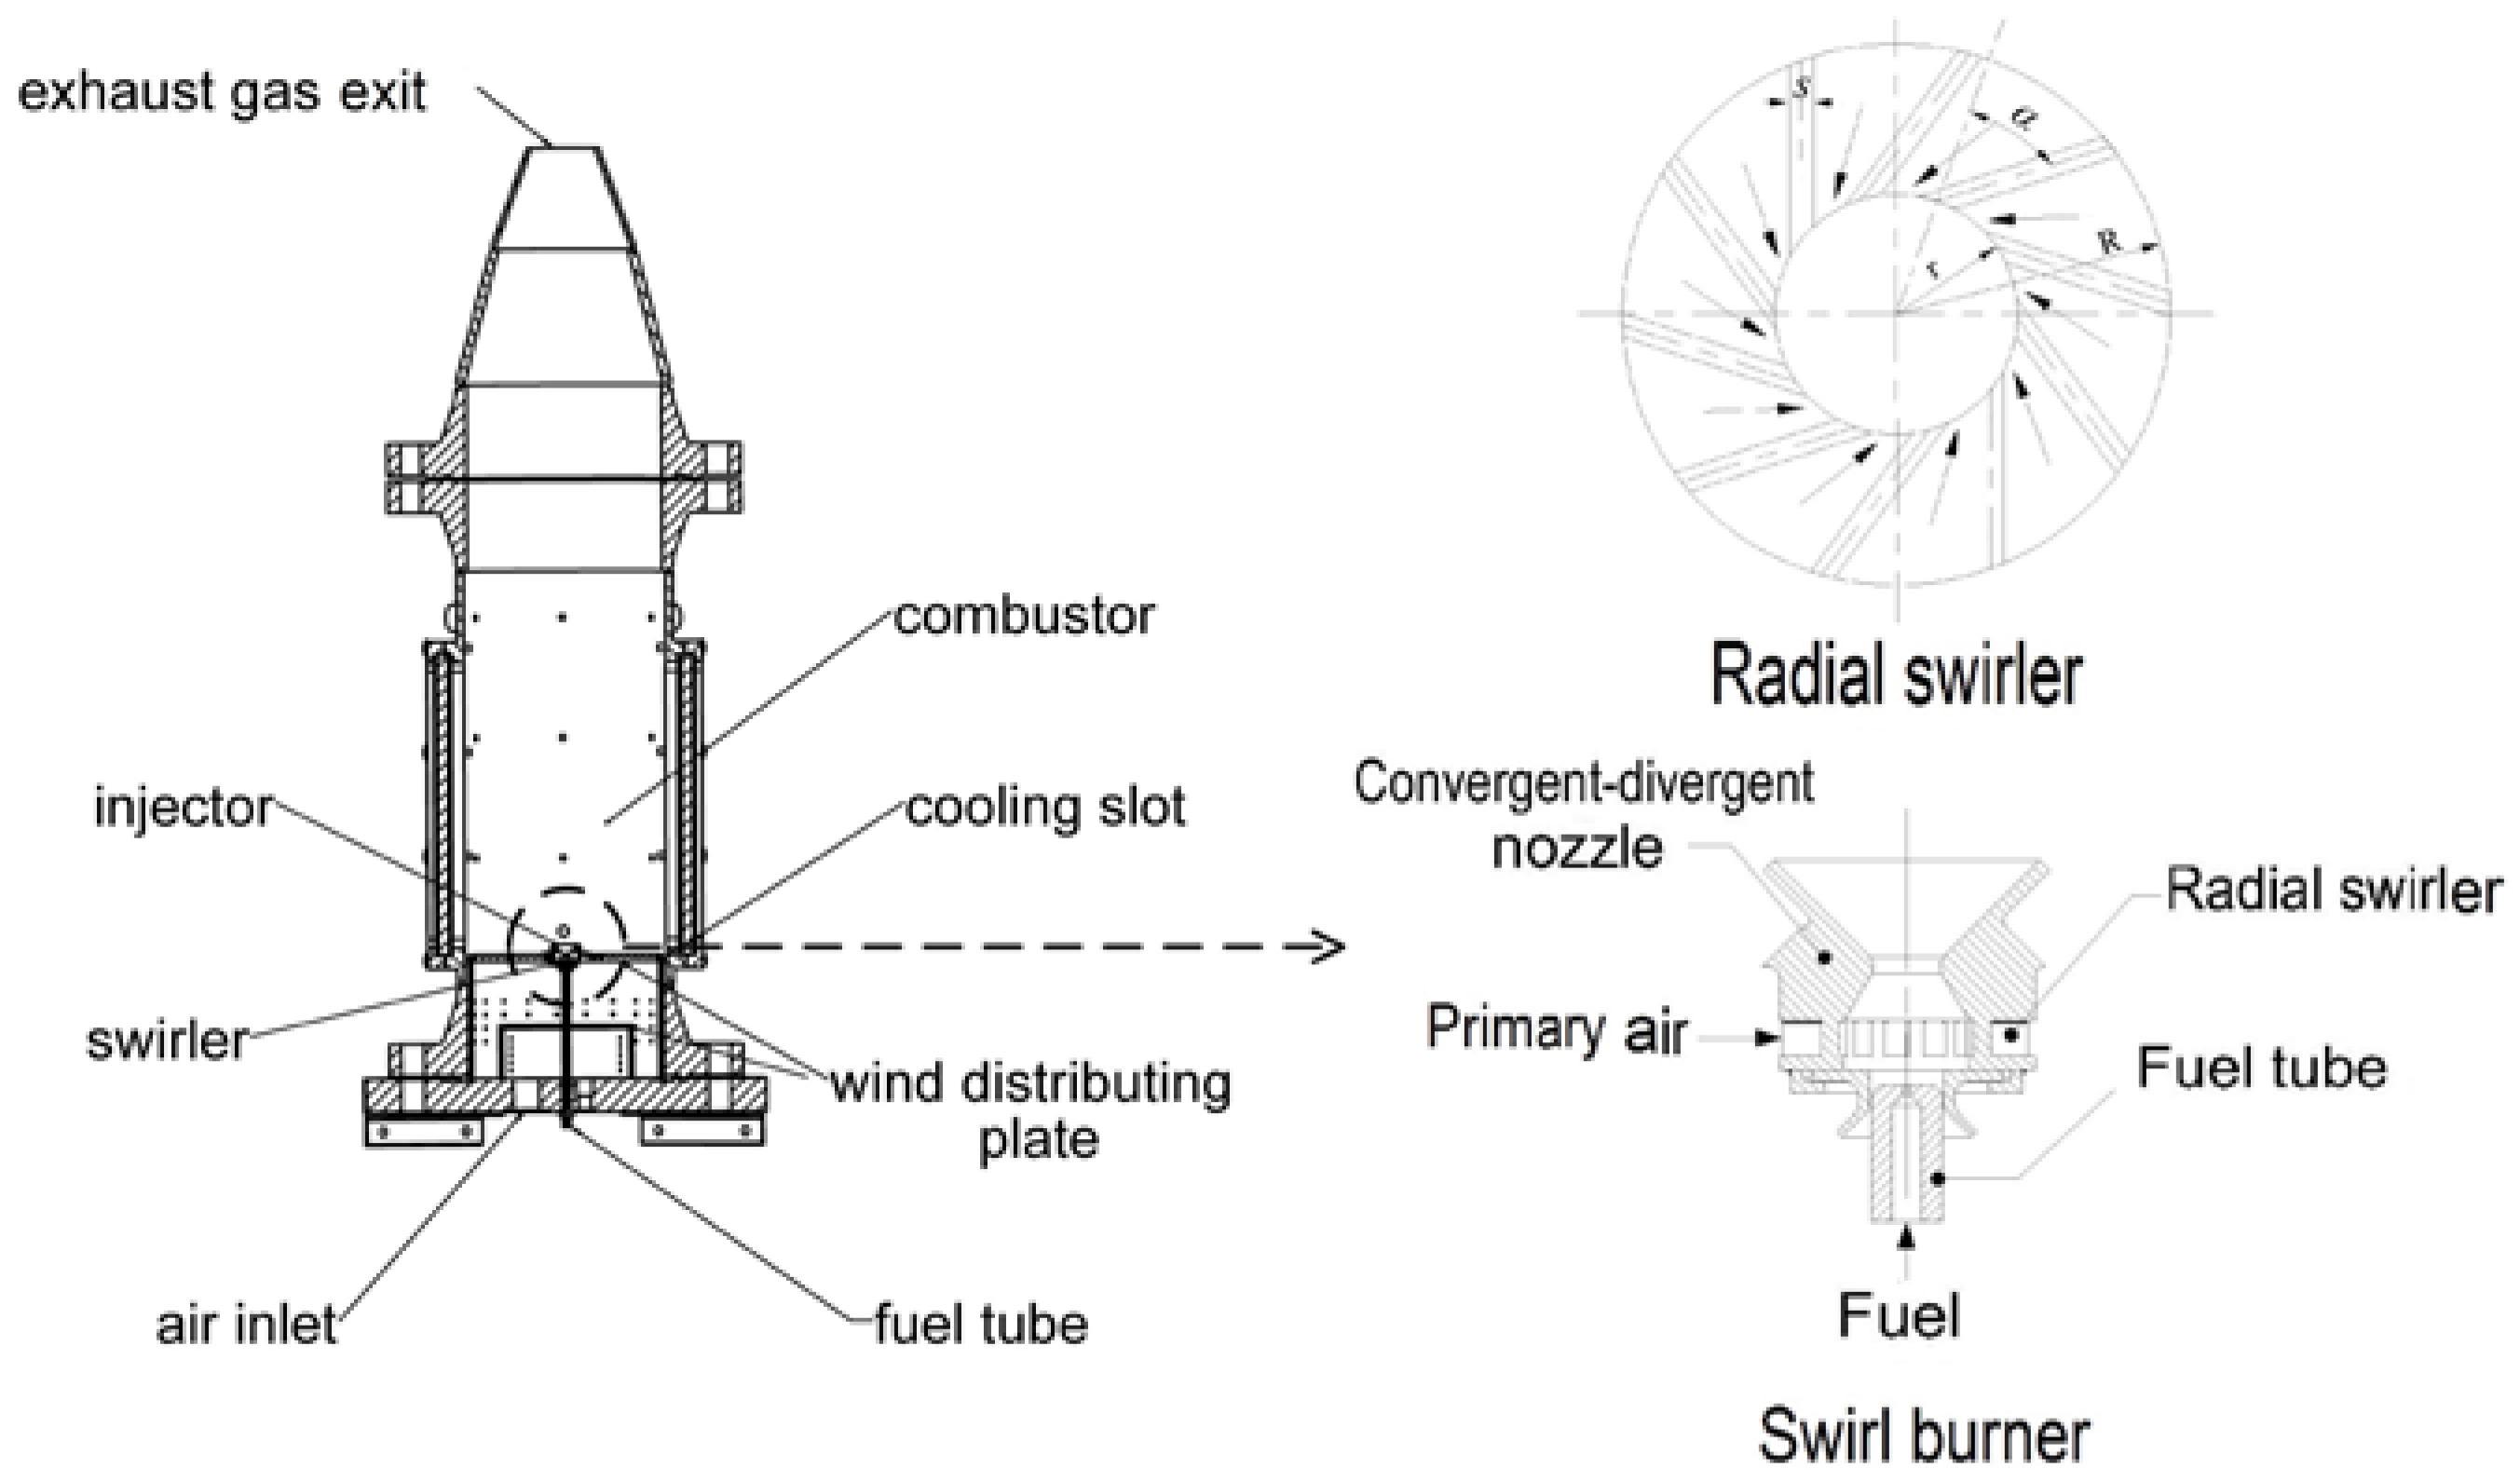
Figure 3.
Flame measuring instruments: (a) high-speed camera; (b) optical filter.
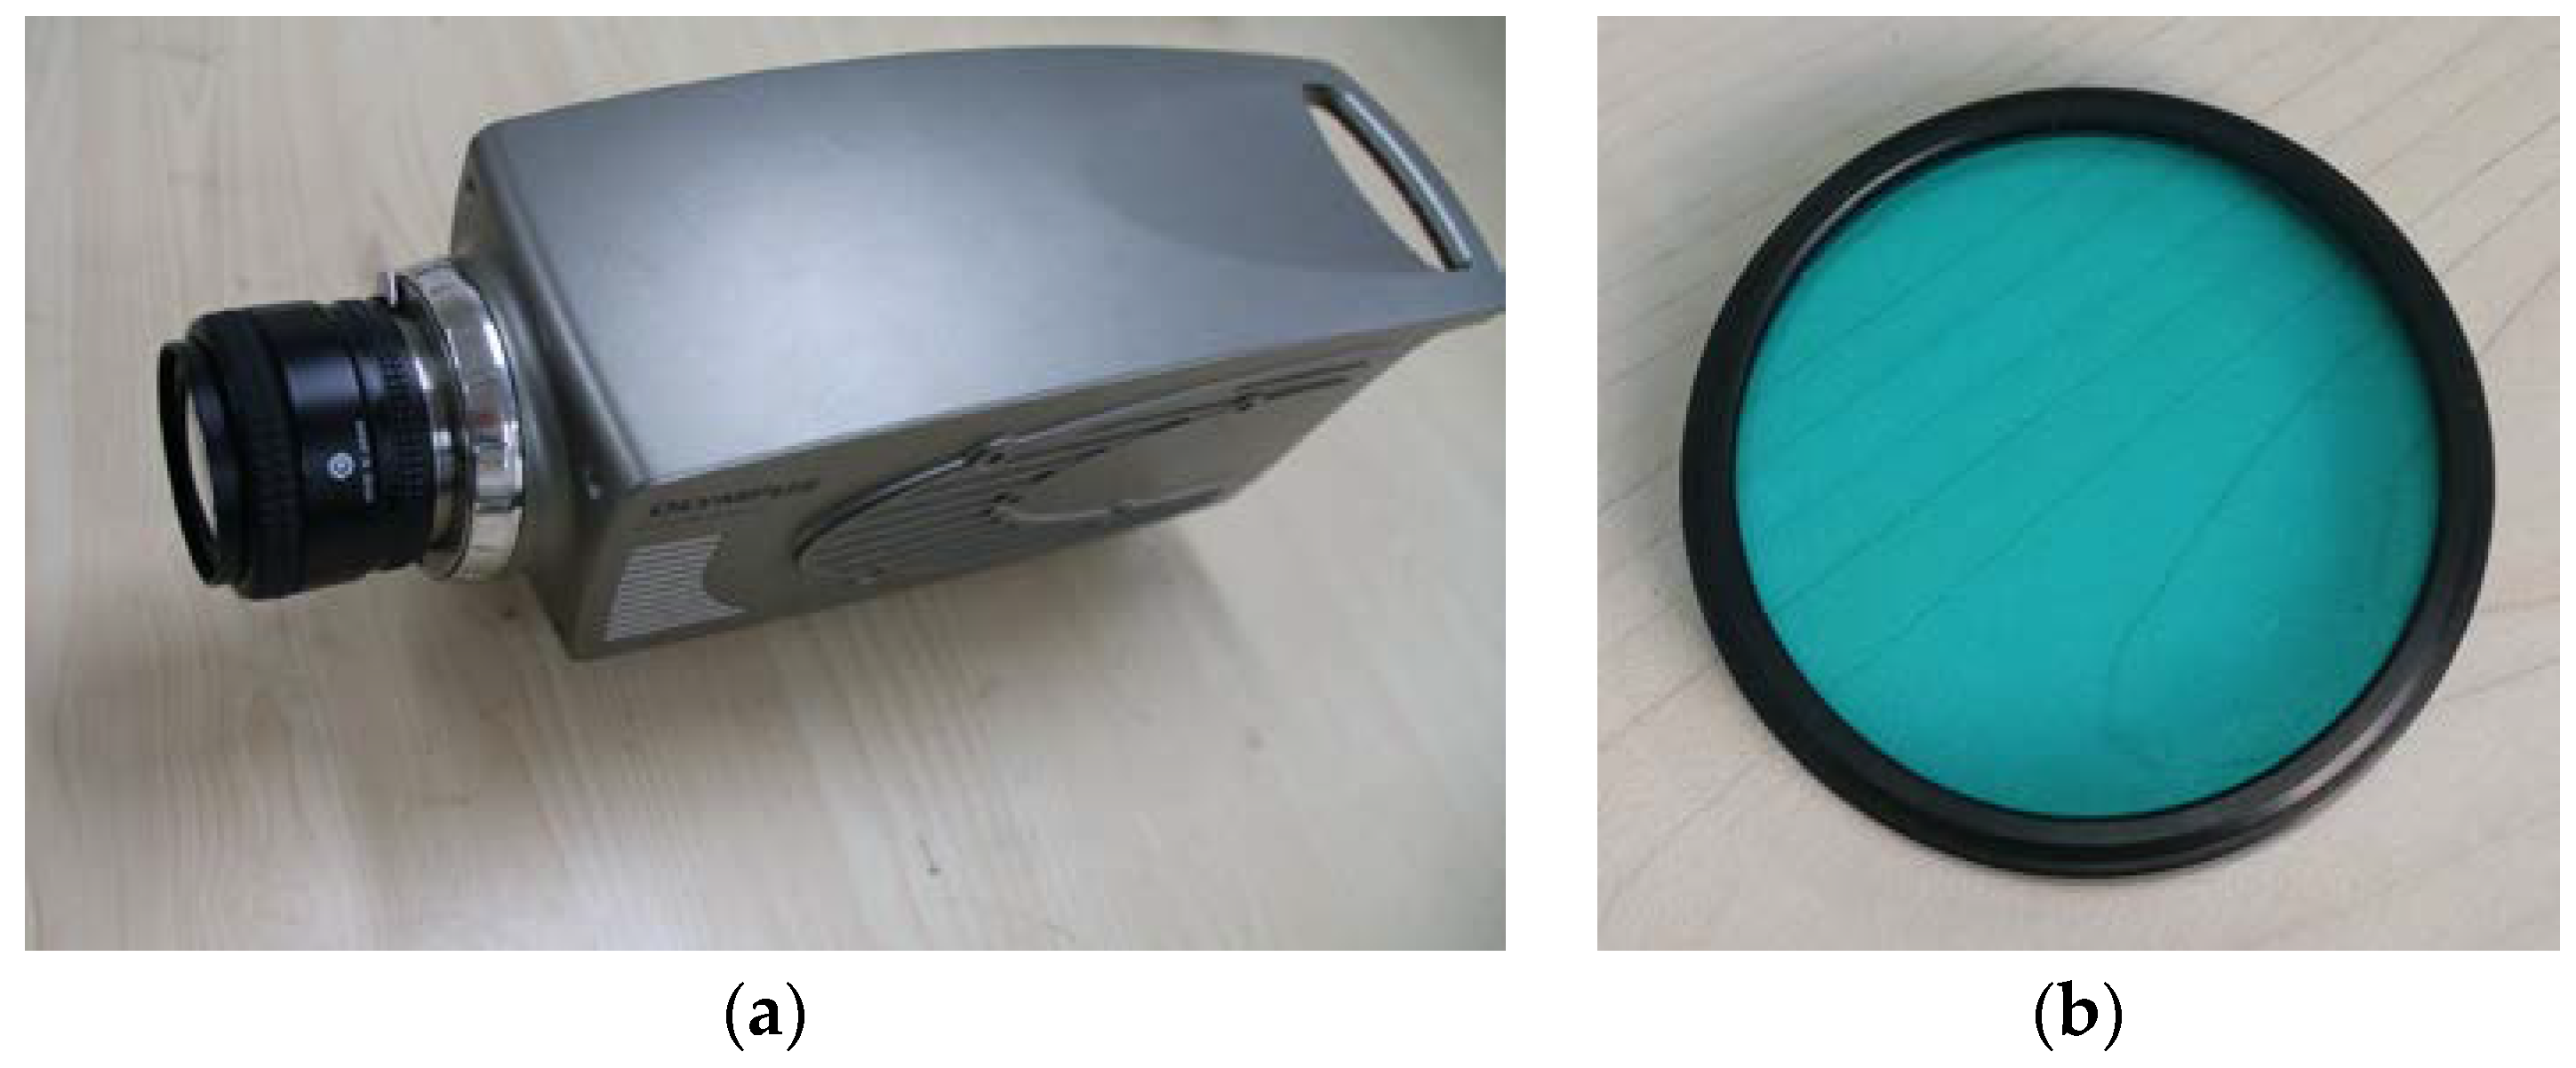
Figure 4.
A sequence of continuous images for a typical condition.

Figure 5.
Flame heat-release rate pulsation curves and corresponding spectrum curves for fuel mass flow rate: (a) pulsation curve at ṁF = 12 g/min; (b) spectrum curve at ṁF = 12 g/min; (c) pulsation curve at ṁF = 14 g/min; (d) spectrum curve at ṁF = 14 g/min; (e) pulsation curve at ṁF = 16 g/min; (f) spectrum curve at ṁF = 16 g/min.
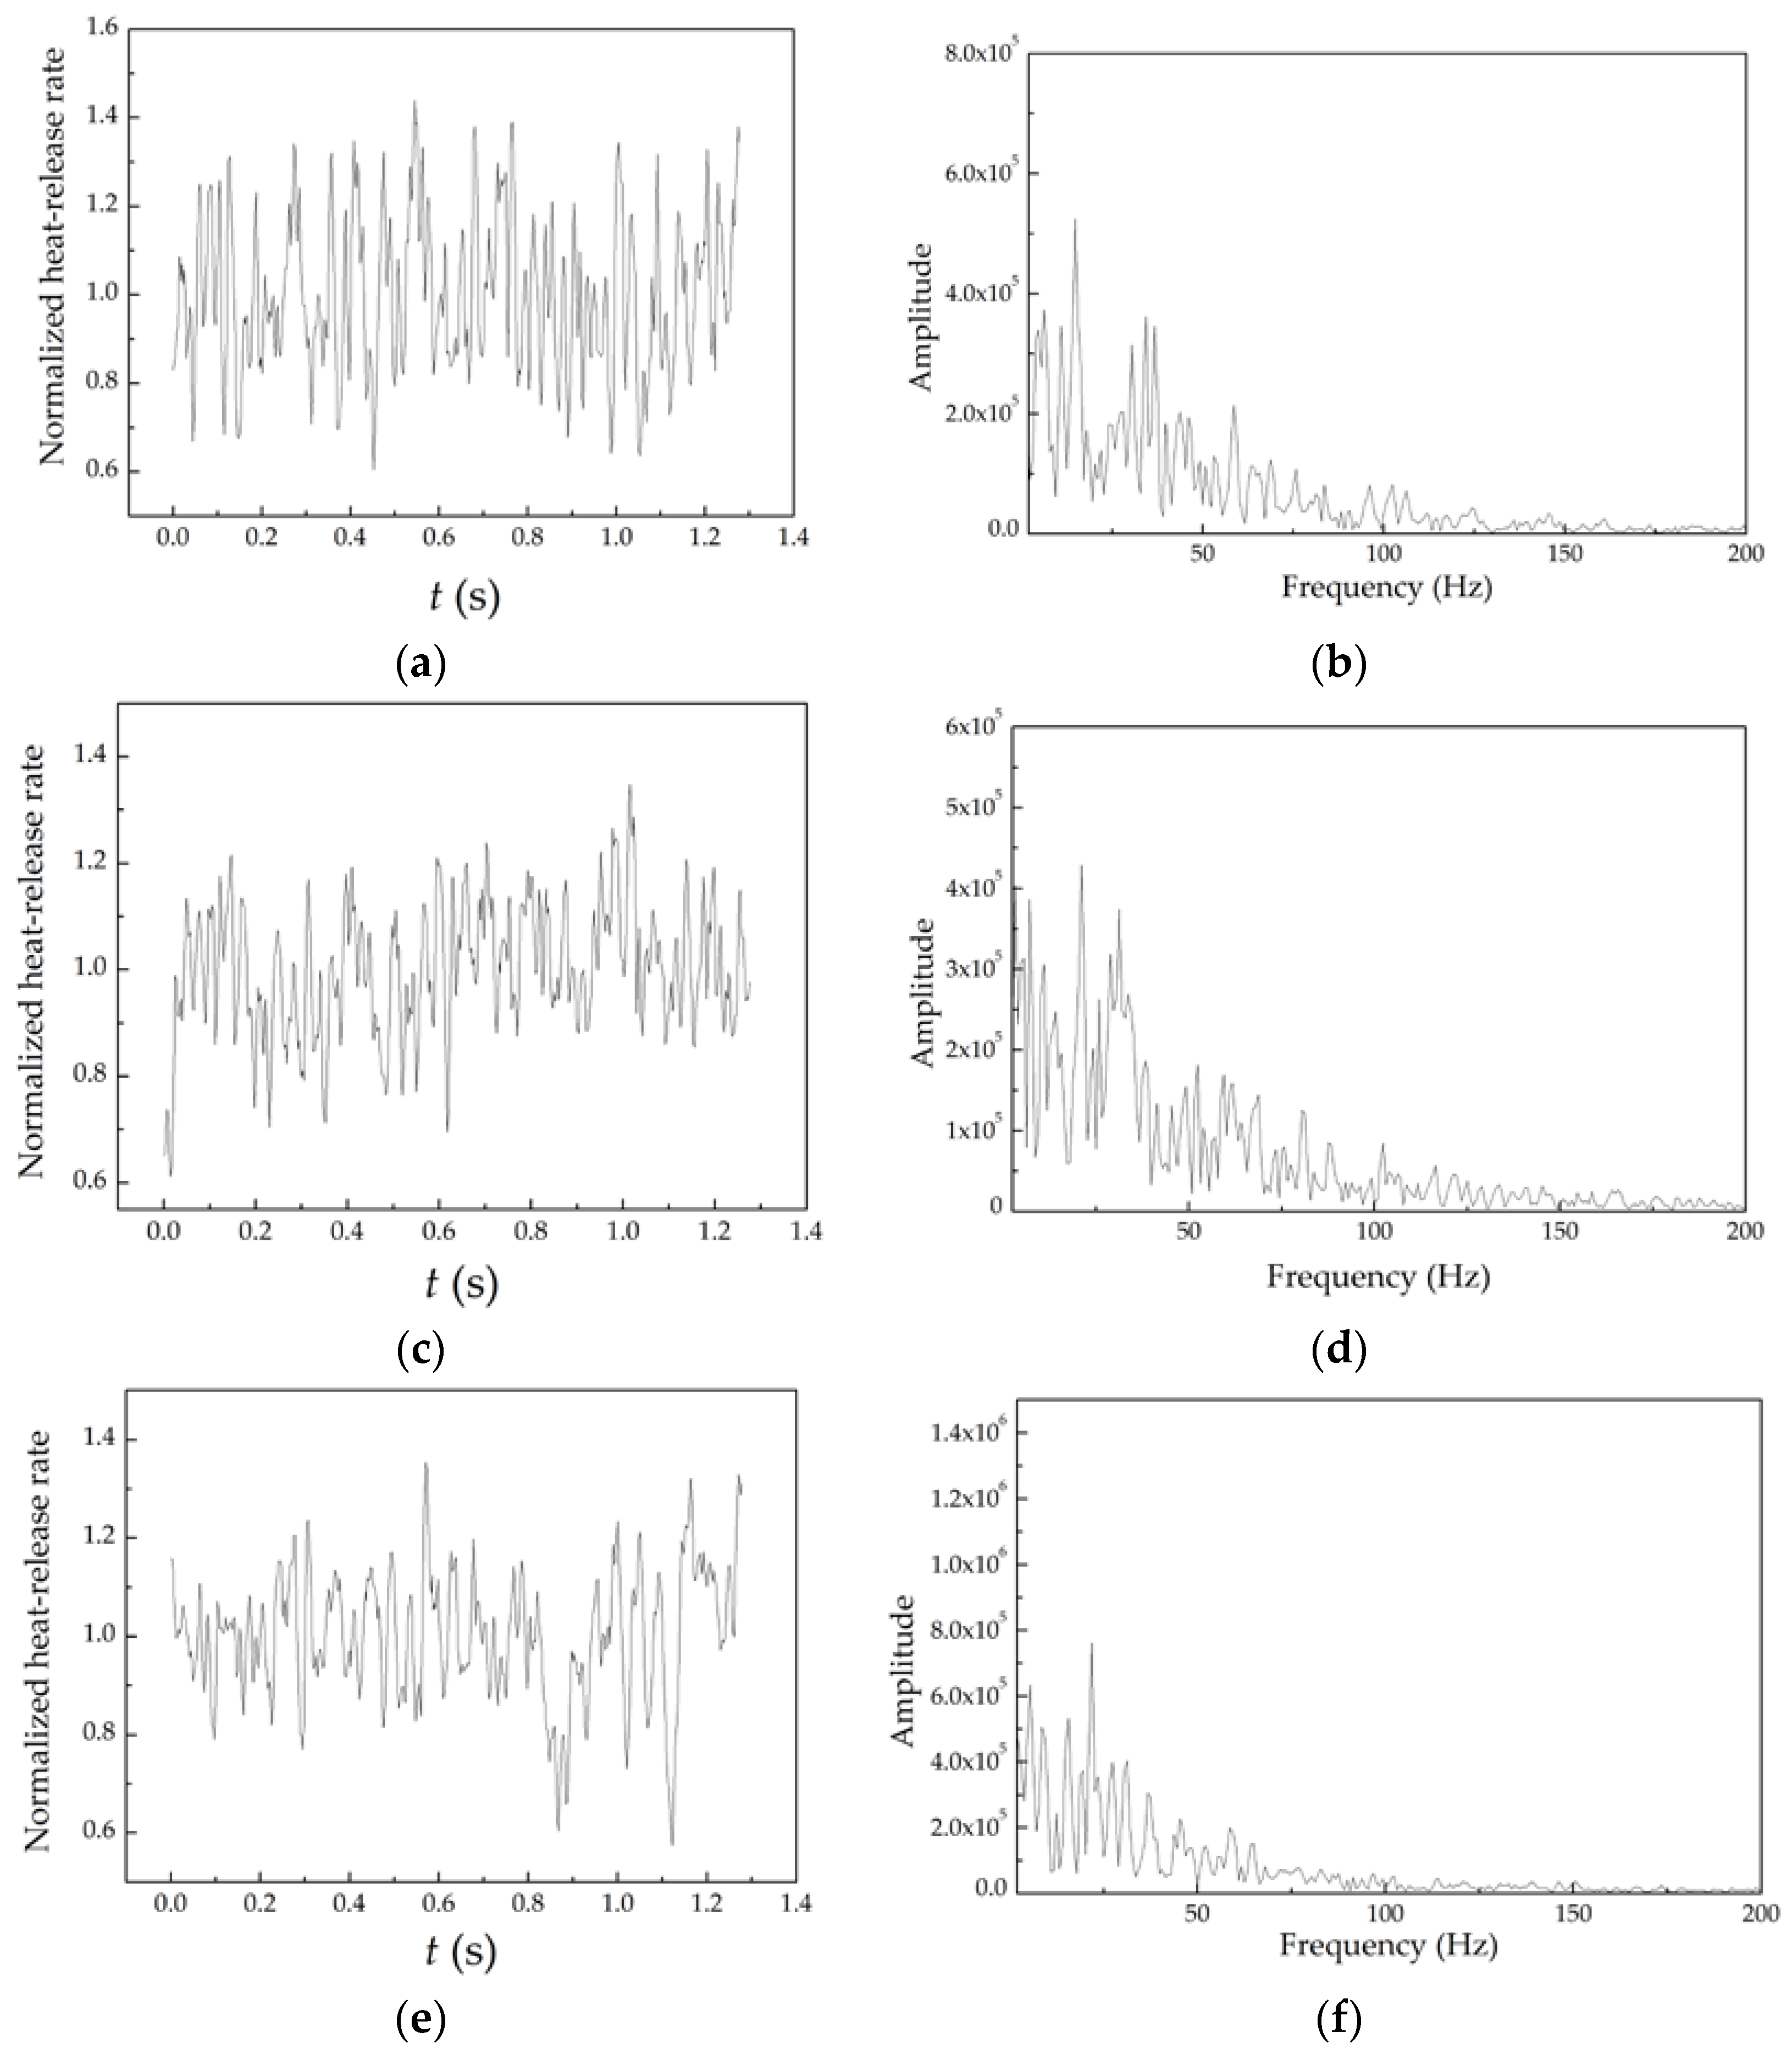
Figure 6.
Pulsation frequency and amplitude of flame heat-release rate for fuel mass flow rate.
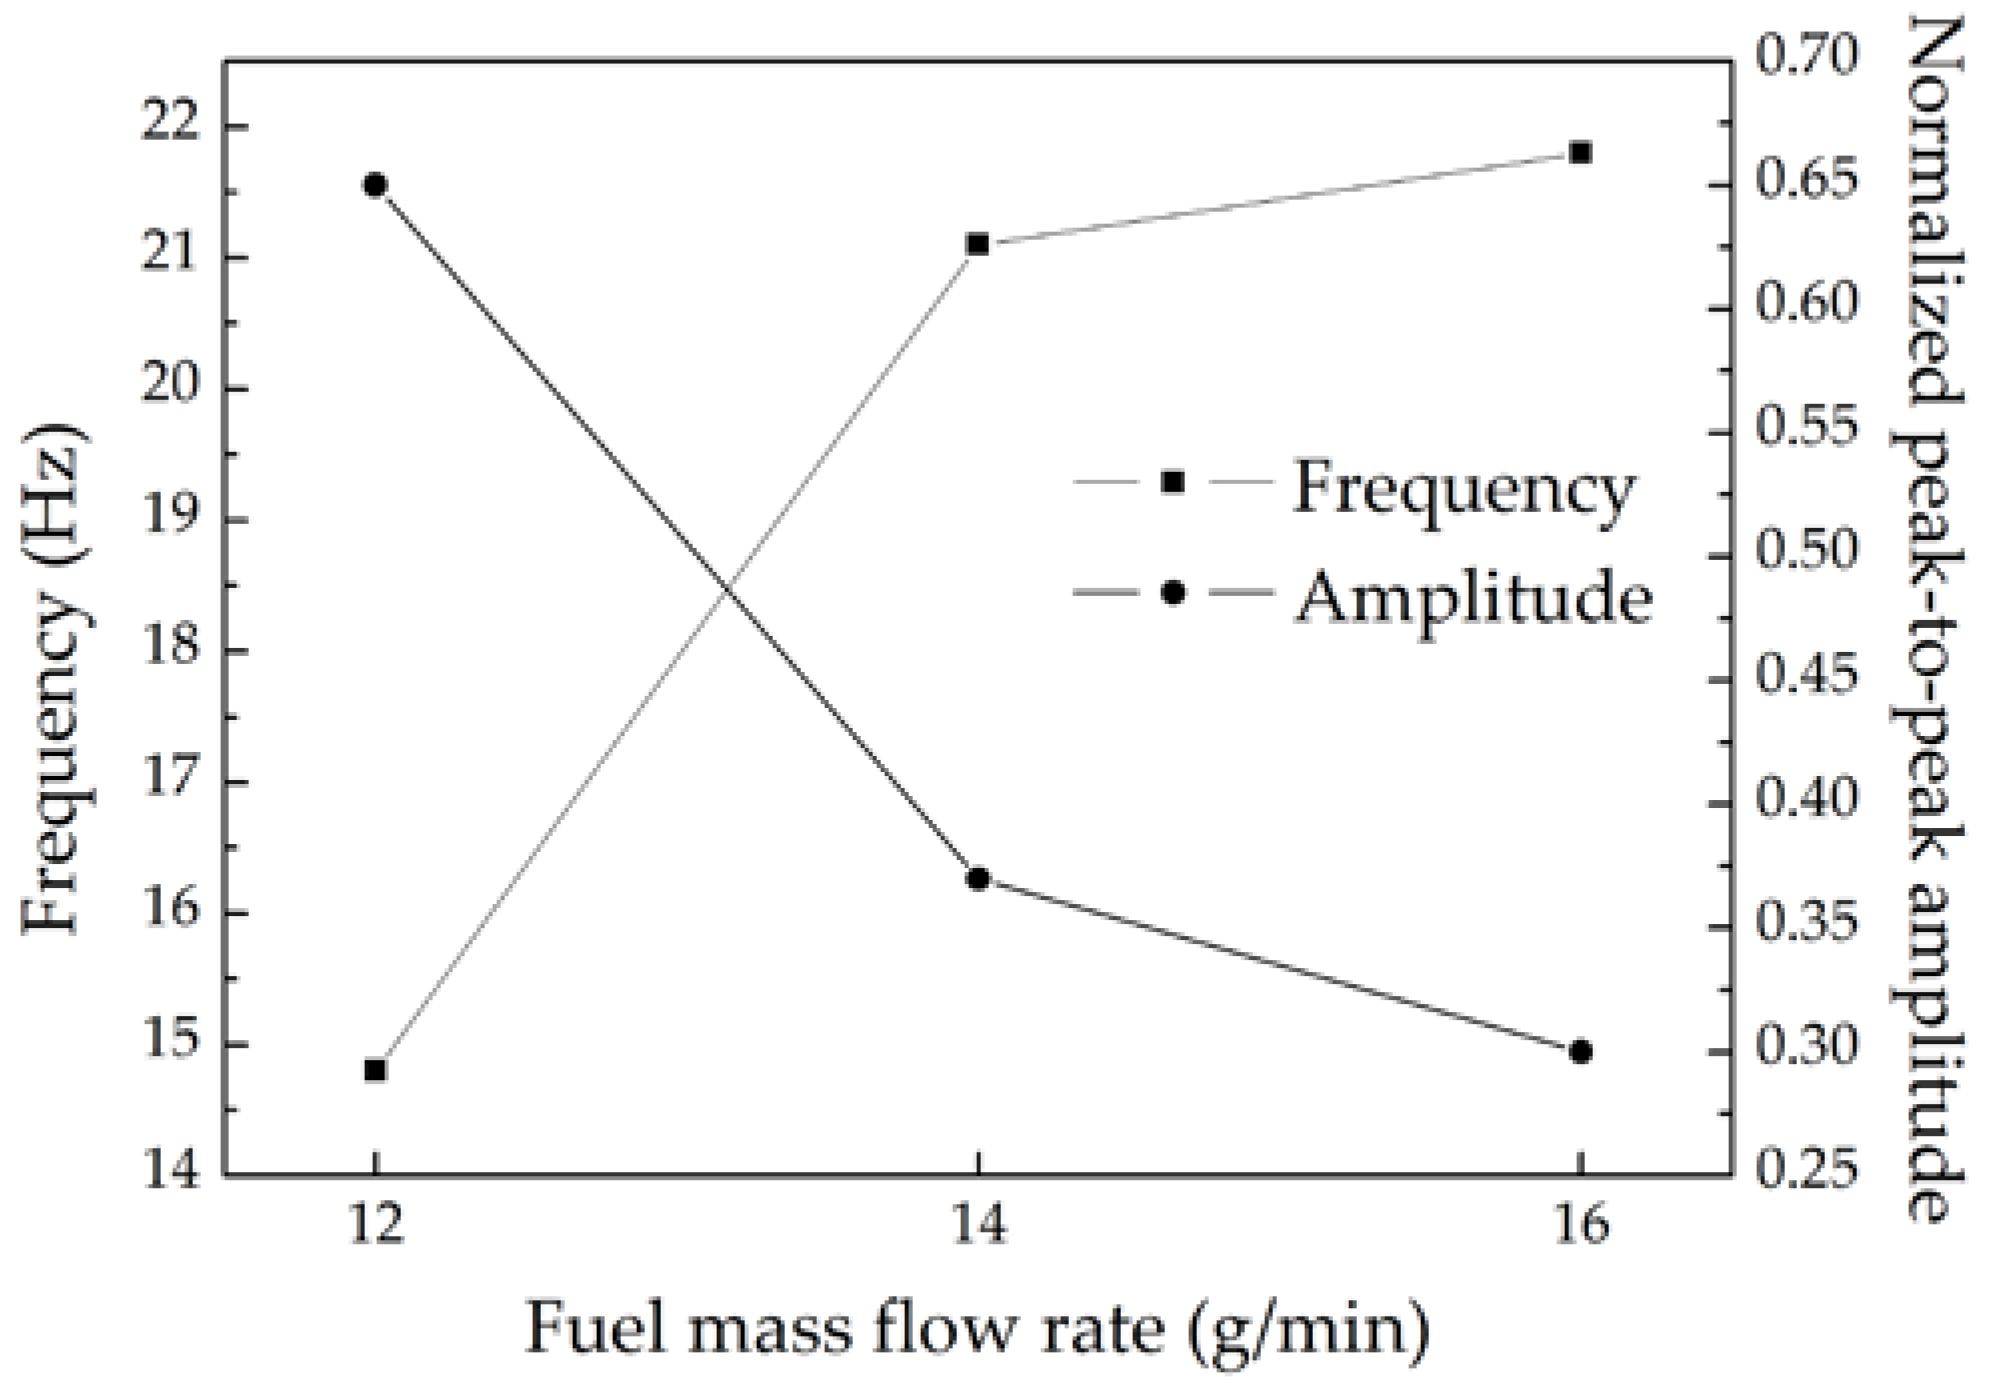
Figure 7.
Flame heat-release rate pulsation curves and corresponding spectrum curves for combustor pressure: (a) pulsation curve at P = 3 bar; (b) spectrum curve at P = 3 bar; (c) pulsation curve at P = 4 bar; (d) spectrum curve at P = 4 bar; (e) pulsation curve at P = 5 bar; (f) spectrum curve at P = 5 bar.
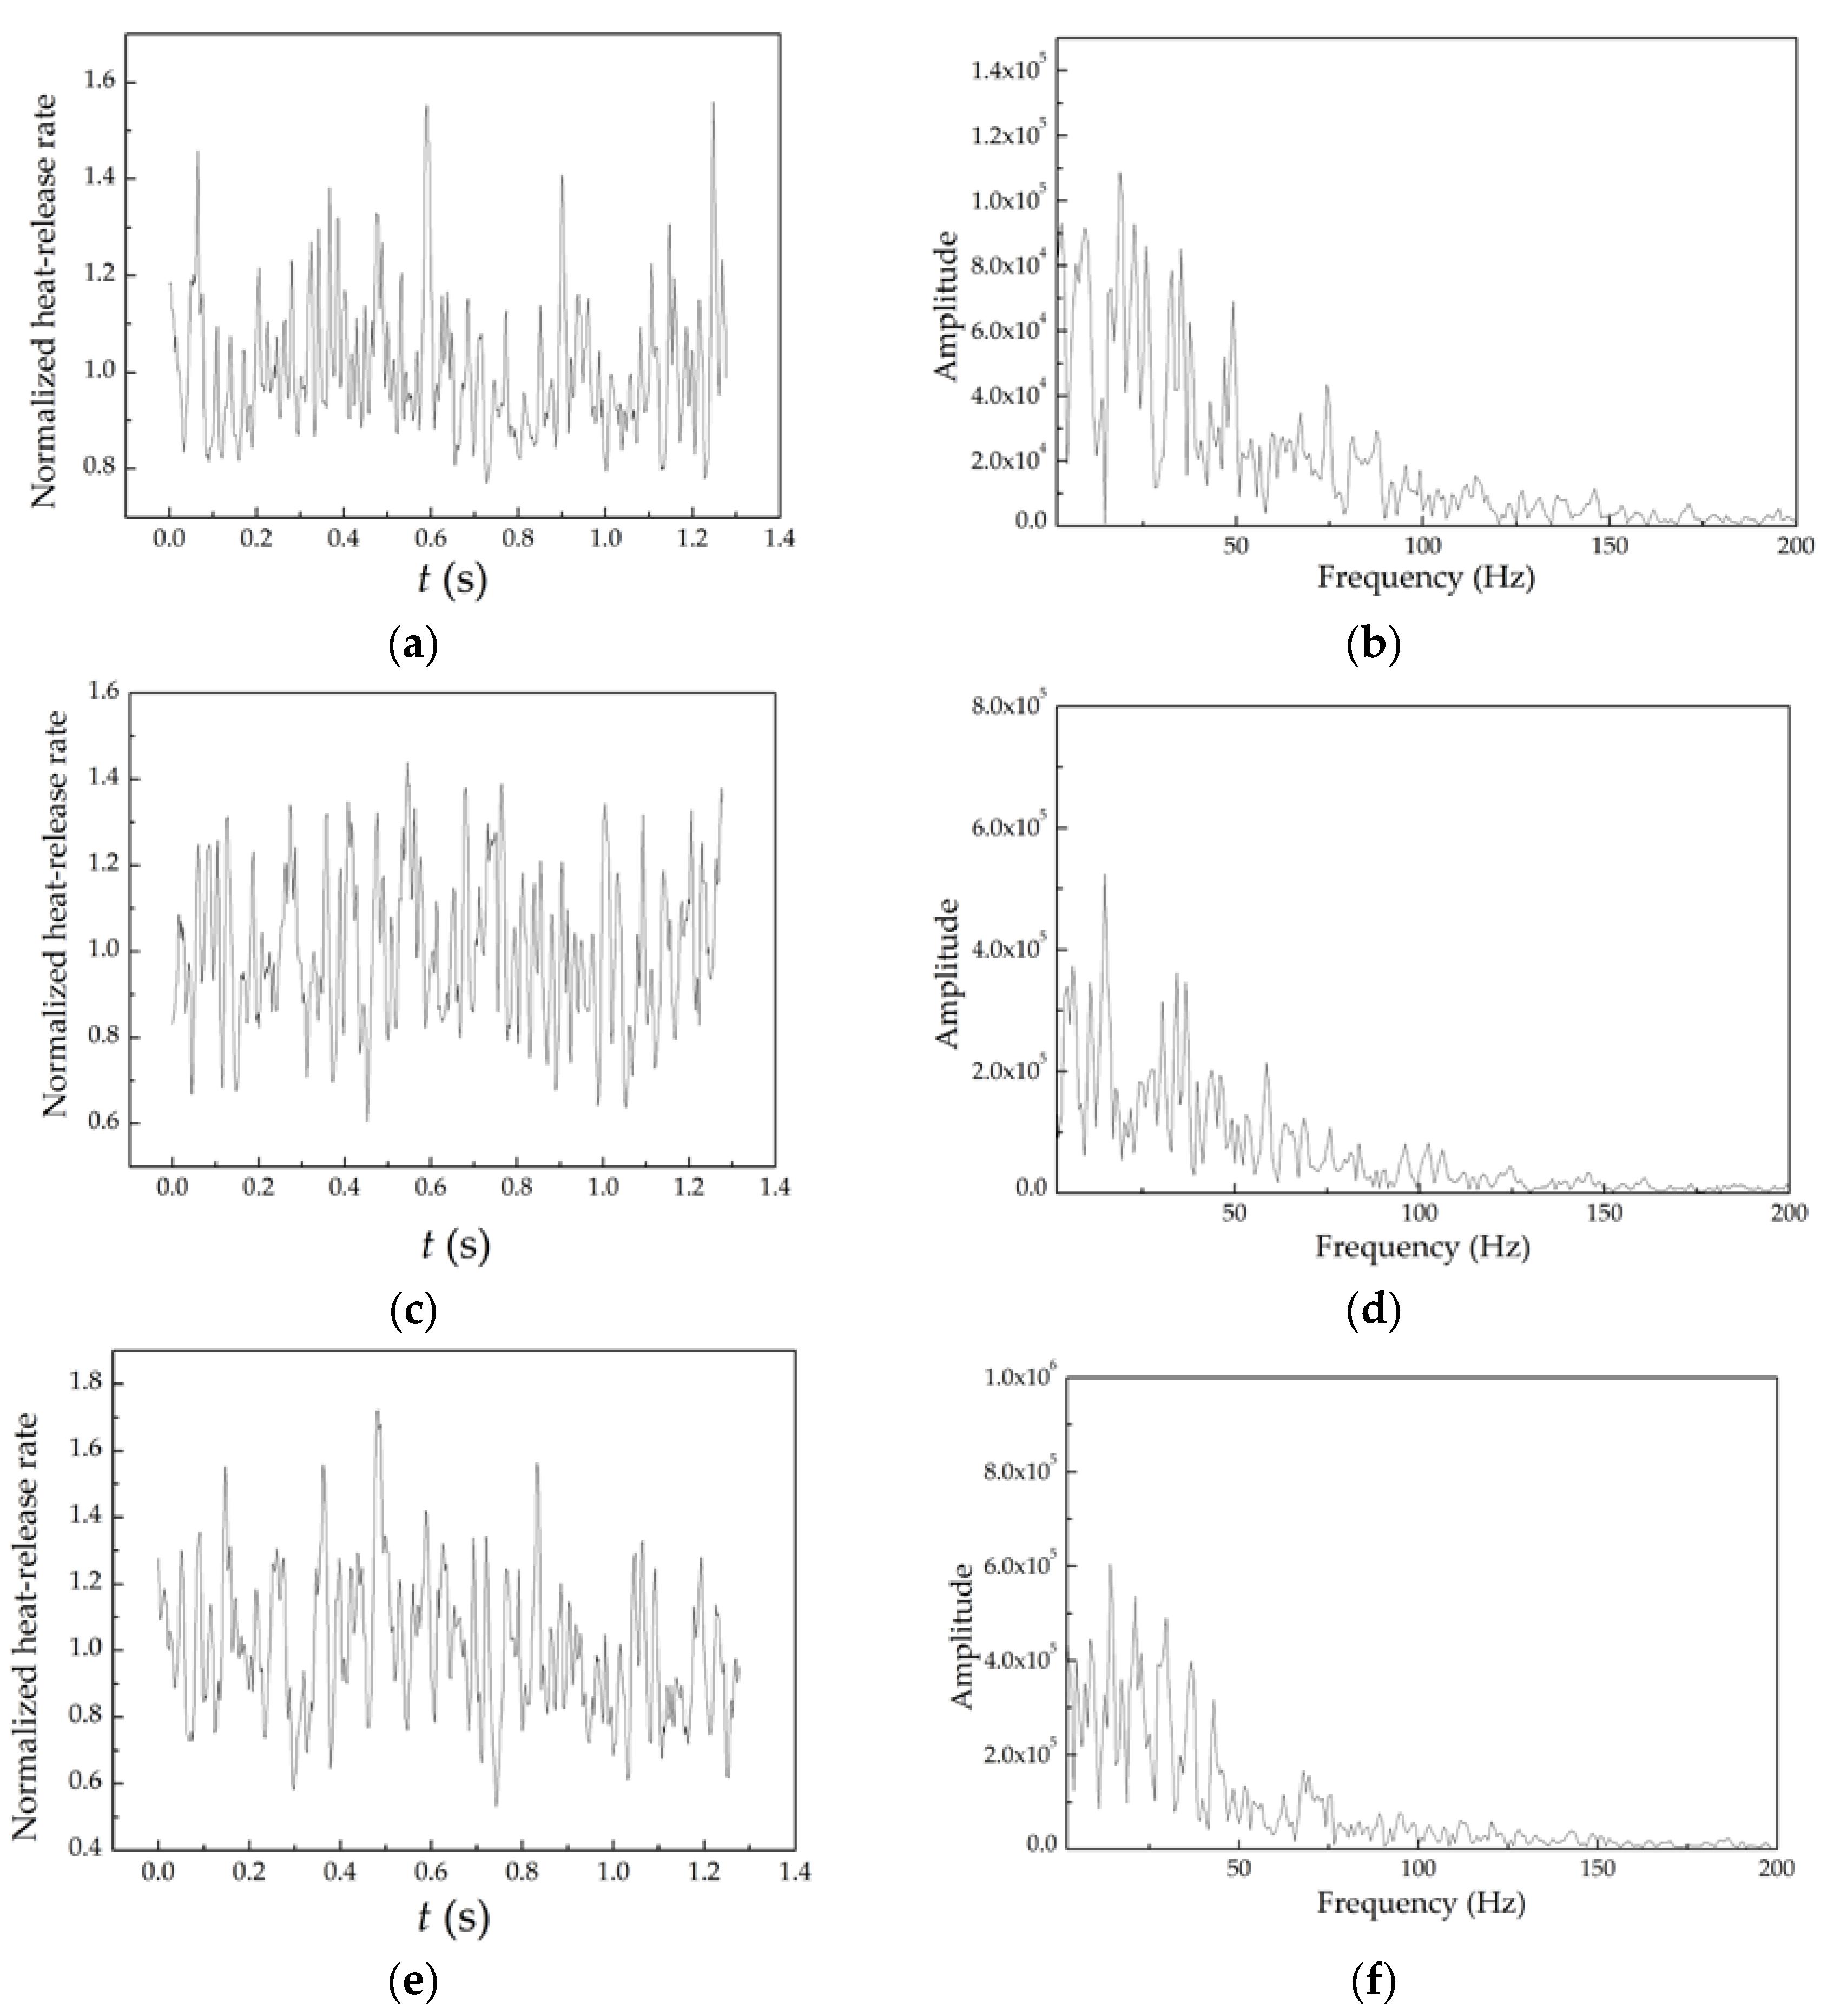
Figure 8.
Pulsation frequency and amplitude of flame heat-release rate for combustor pressure.

Figure 9.
Flame heat-release rate pulsation curves and corresponding spectrum curves for primary air mass flow rate: (a) pulsation curve at ṁpri = 95 g/min; (b) spectrum curve at ṁpri = 95 g/min; (c) pulsation curve at ṁpri = 100 g/min; (d) spectrum curve at ṁpri = 100 g/min; (e) pulsation curve at ṁpri = 105 g/min; (f) spectrum curve at ṁpri = 105 g/min; (g) pulsation curve at ṁpri = 110 g/min; (h) spectrum curve at ṁpri = 110 g/min.

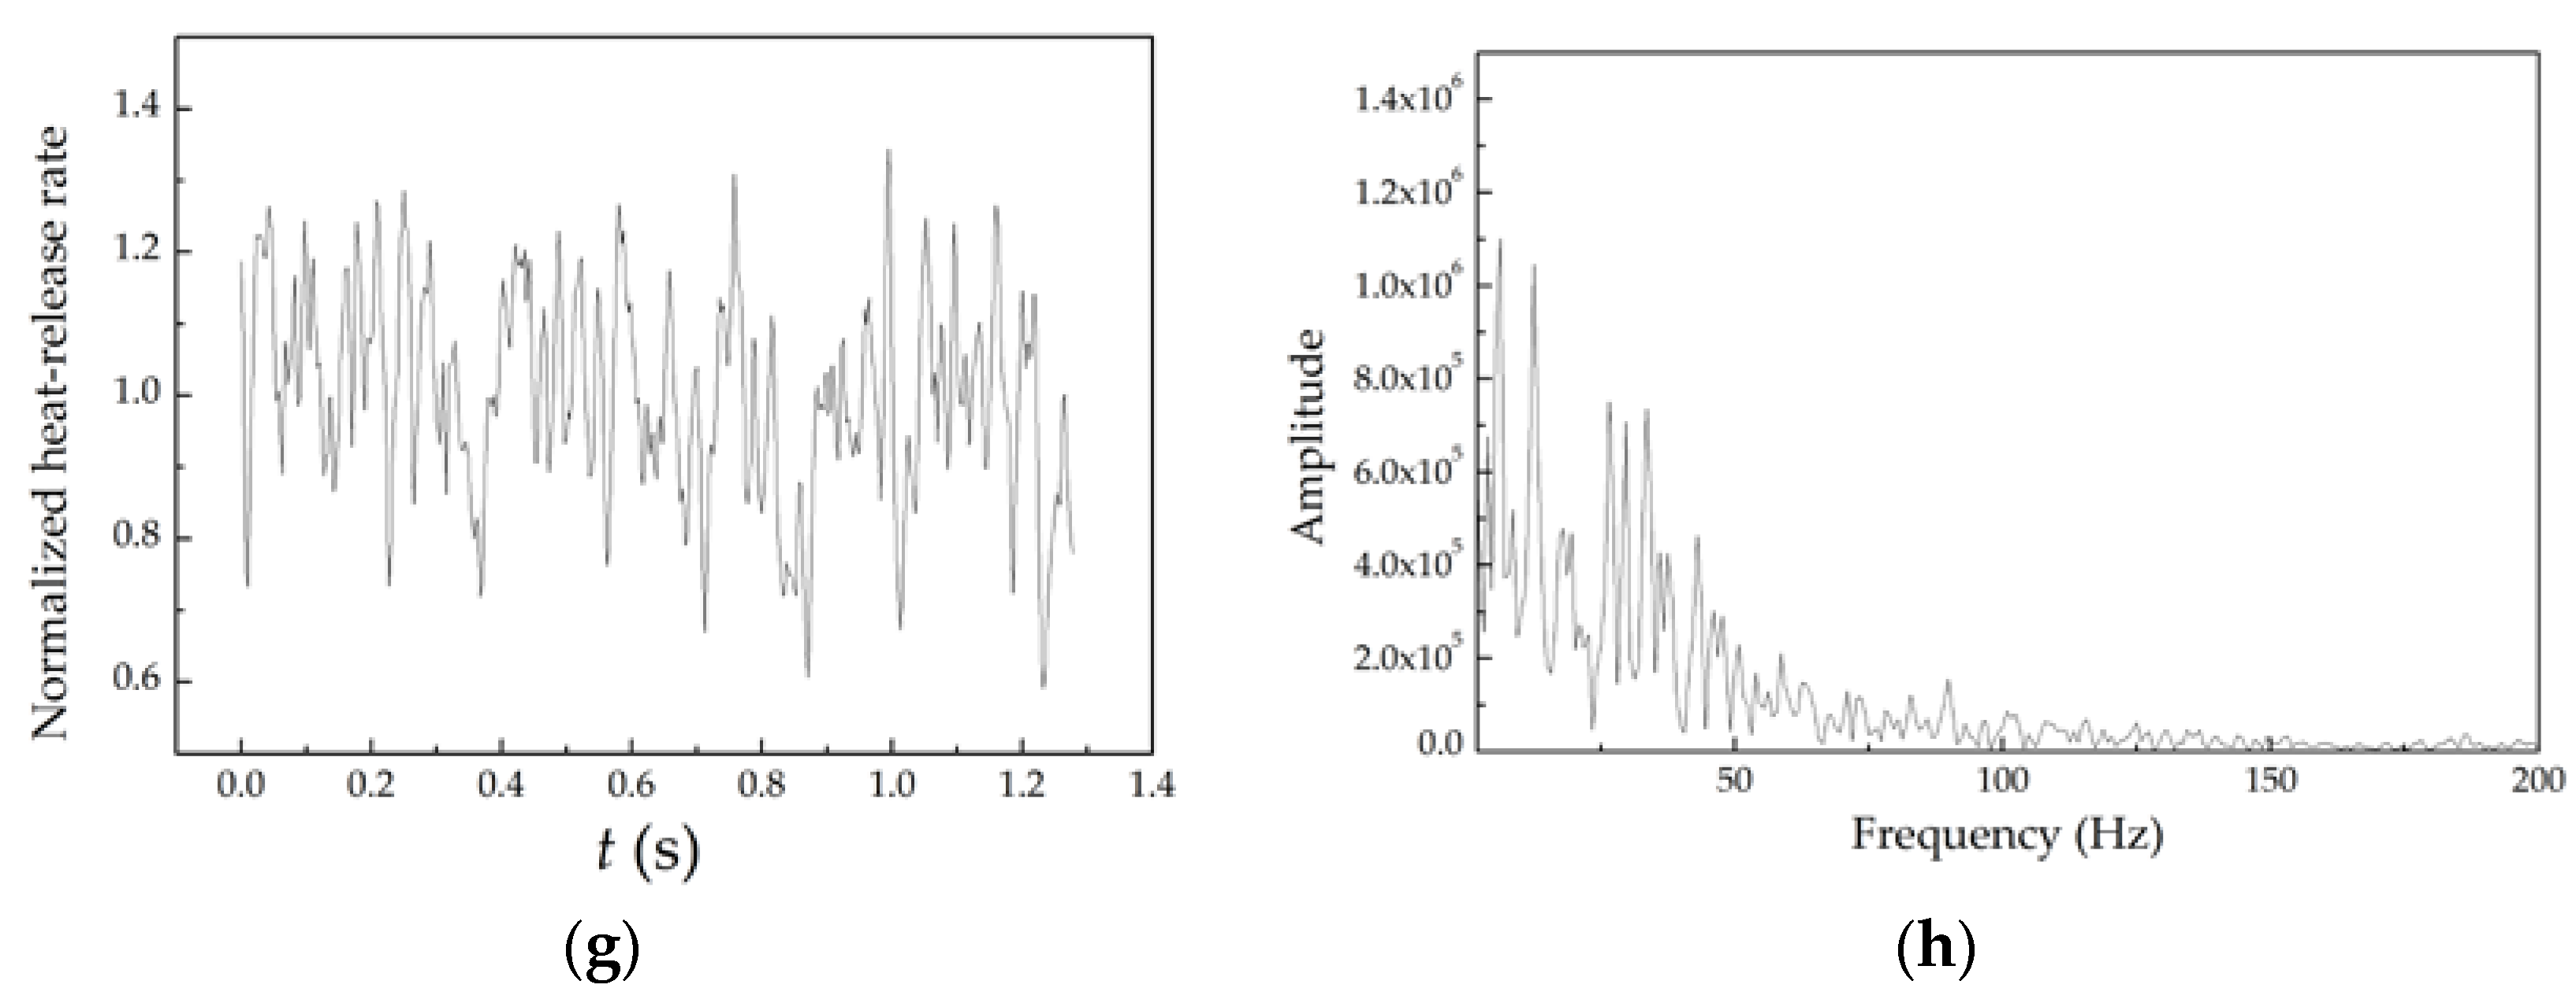
Figure 10.
Pulsation frequency and amplitude of flame heat-release rate for primary air mass flow rate.
Figure 10.
Pulsation frequency and amplitude of flame heat-release rate for primary air mass flow rate.
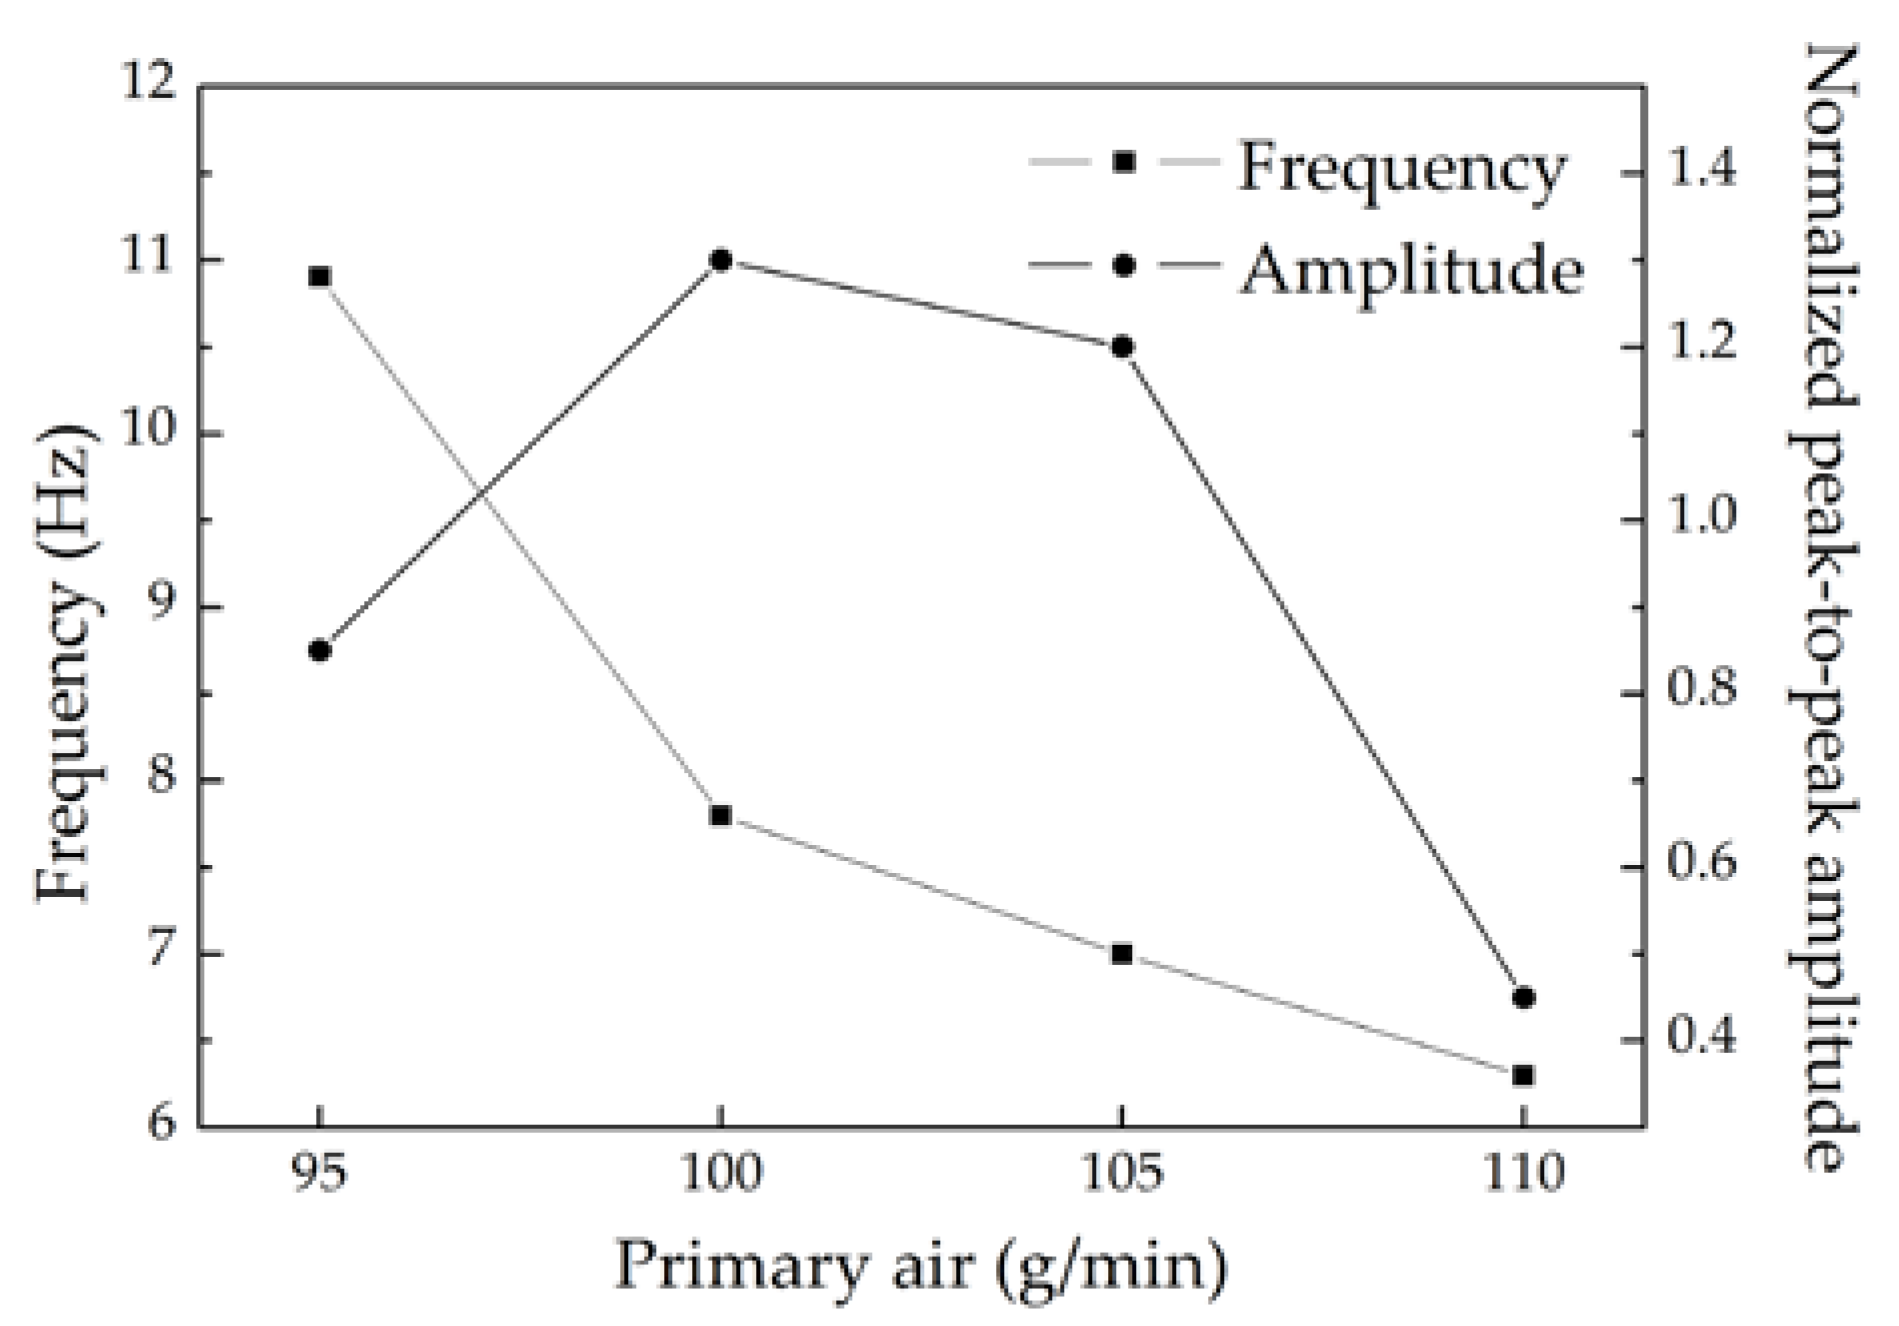
Figure 11.
Flame heat-release rate pulsation curves and corresponding spectrum curves for injector exit velocity: (a) pulsation curve at ve = 2.56 m/s; (b) spectrum curve at ve = 2.56 m/s; (c) pulsation curve at ve = 3.16 m/s; (d) spectrum curve at ve = 3.16 m/s; (e) pulsation curve at ve = 3.76 m/s; (f) spectrum curve at ve = 3.76 m/s; (g) pulsation curve at ve = 4.35 m/s; (h) spectrum curve at ve = 4.35 m/s.
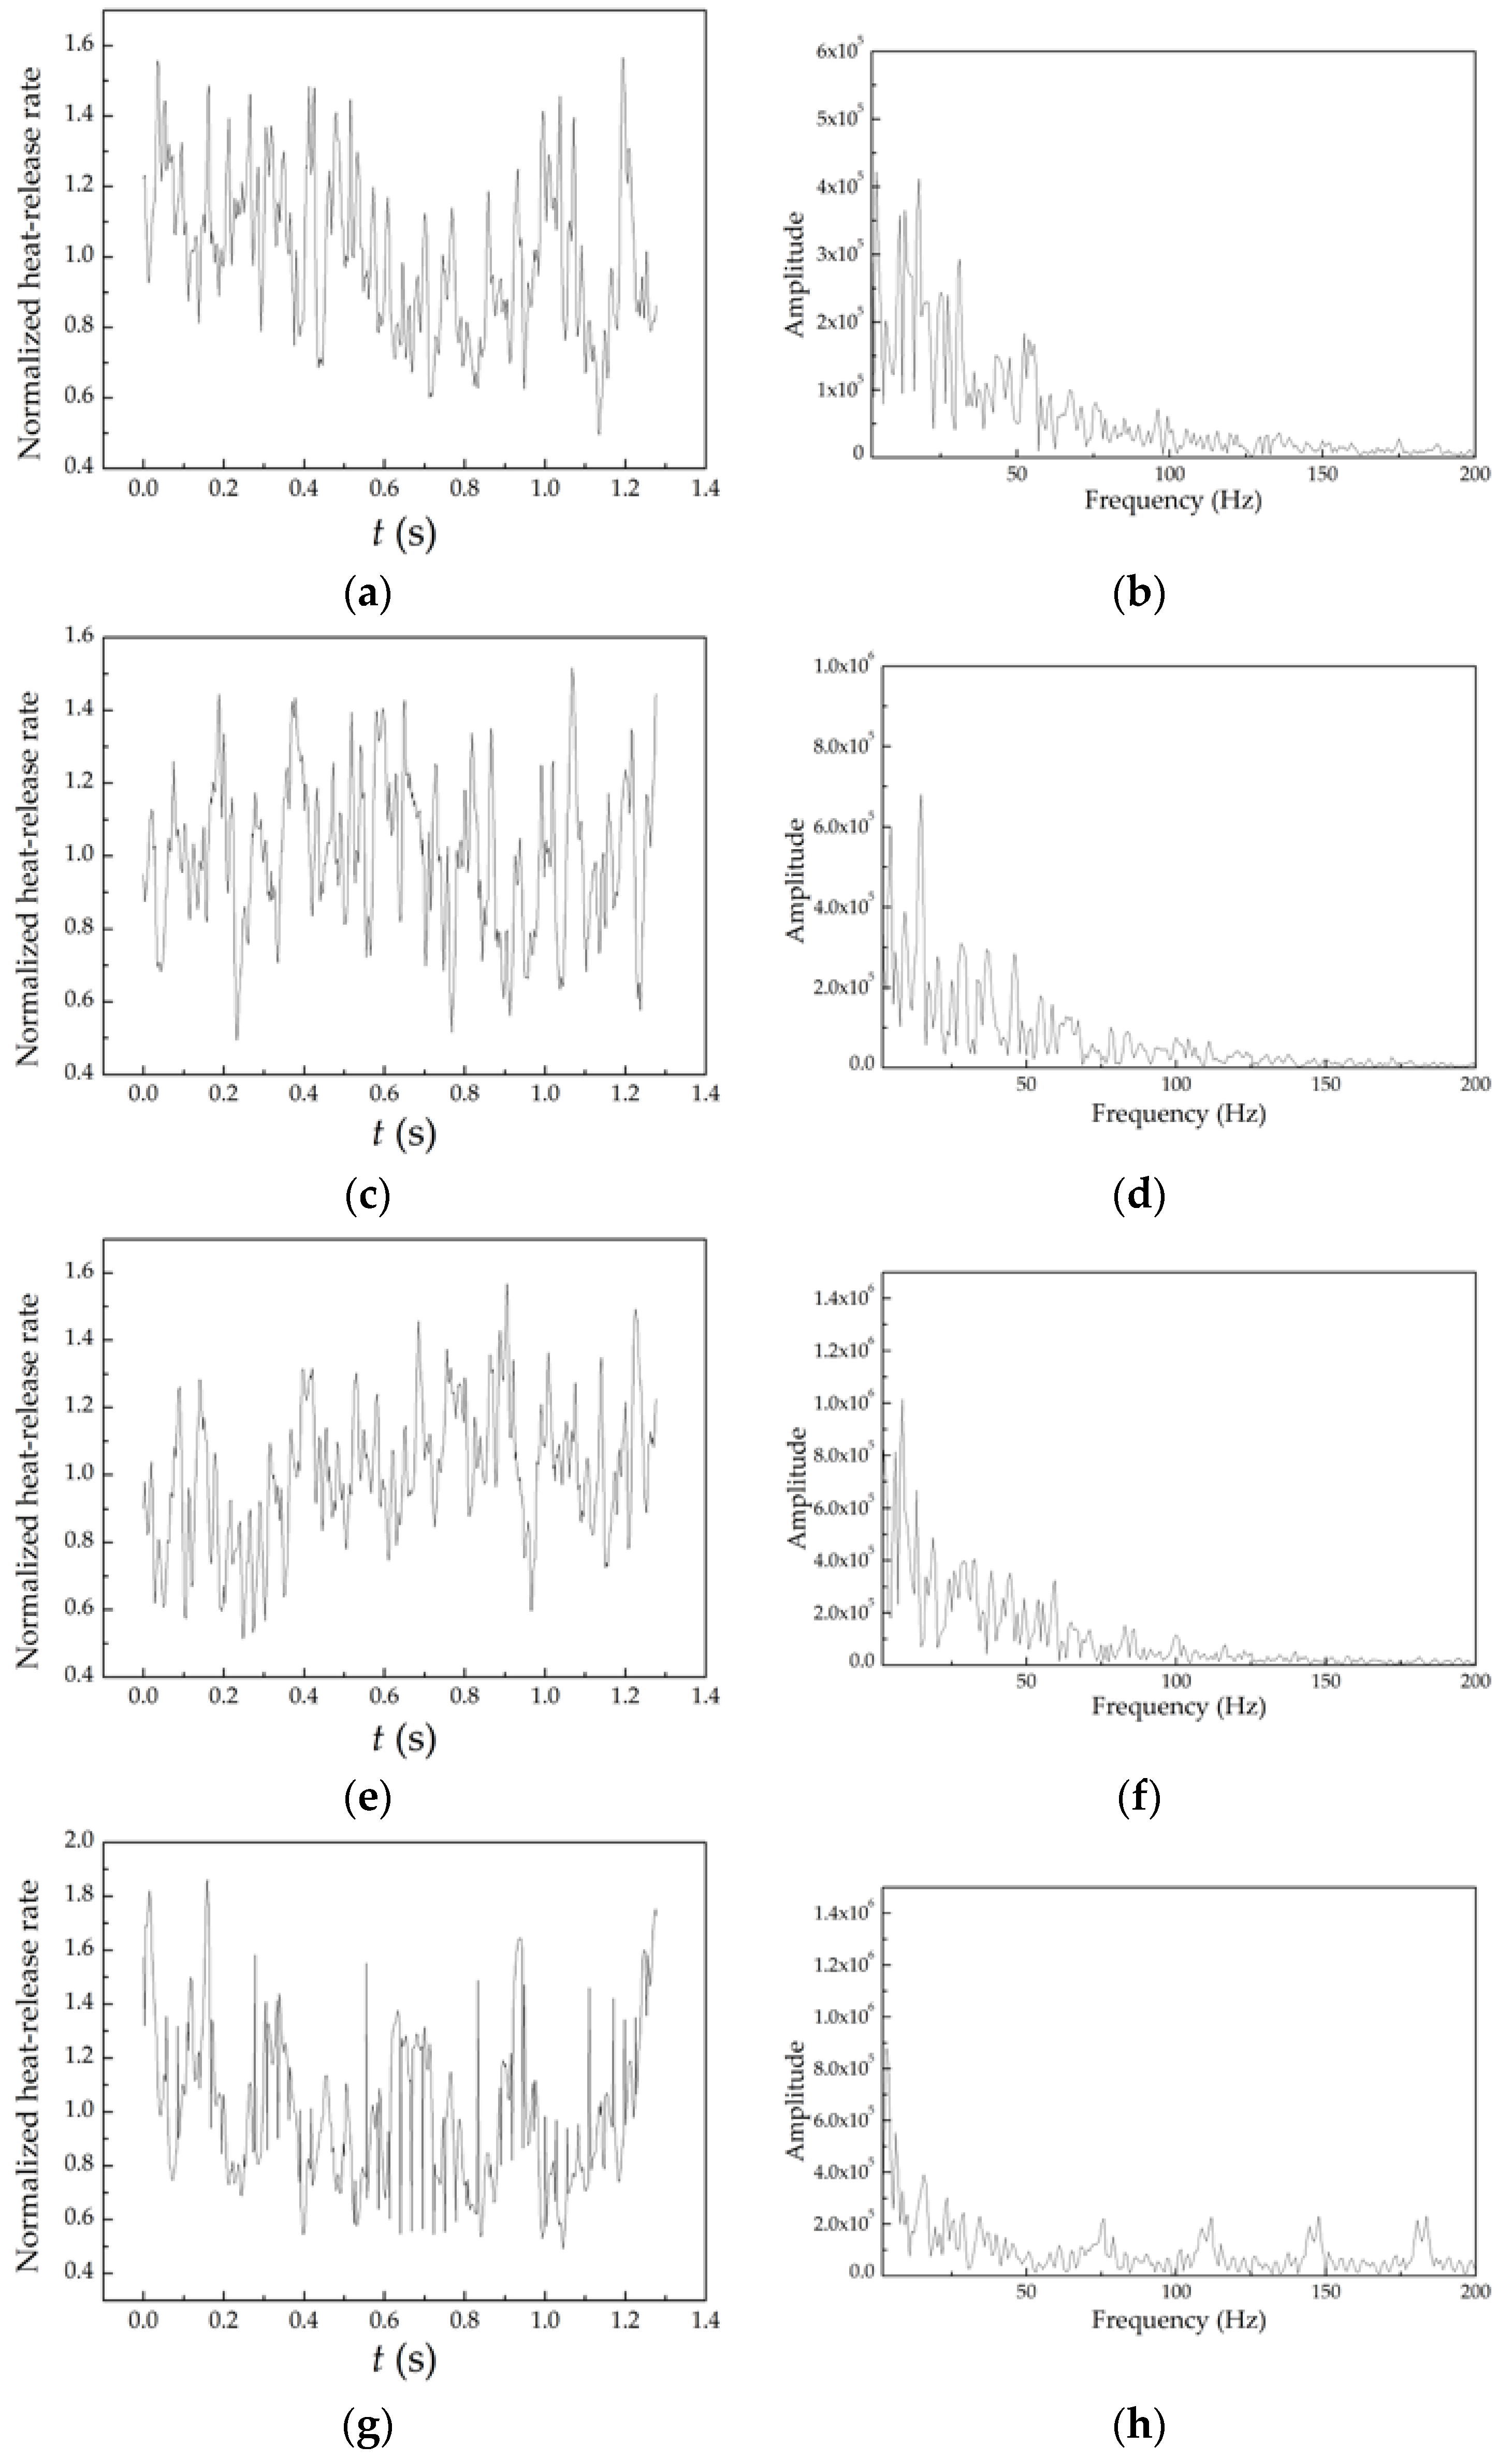
Figure 12.
Pulsation frequency and amplitude of flame heat-release rate for injector exit velocity.
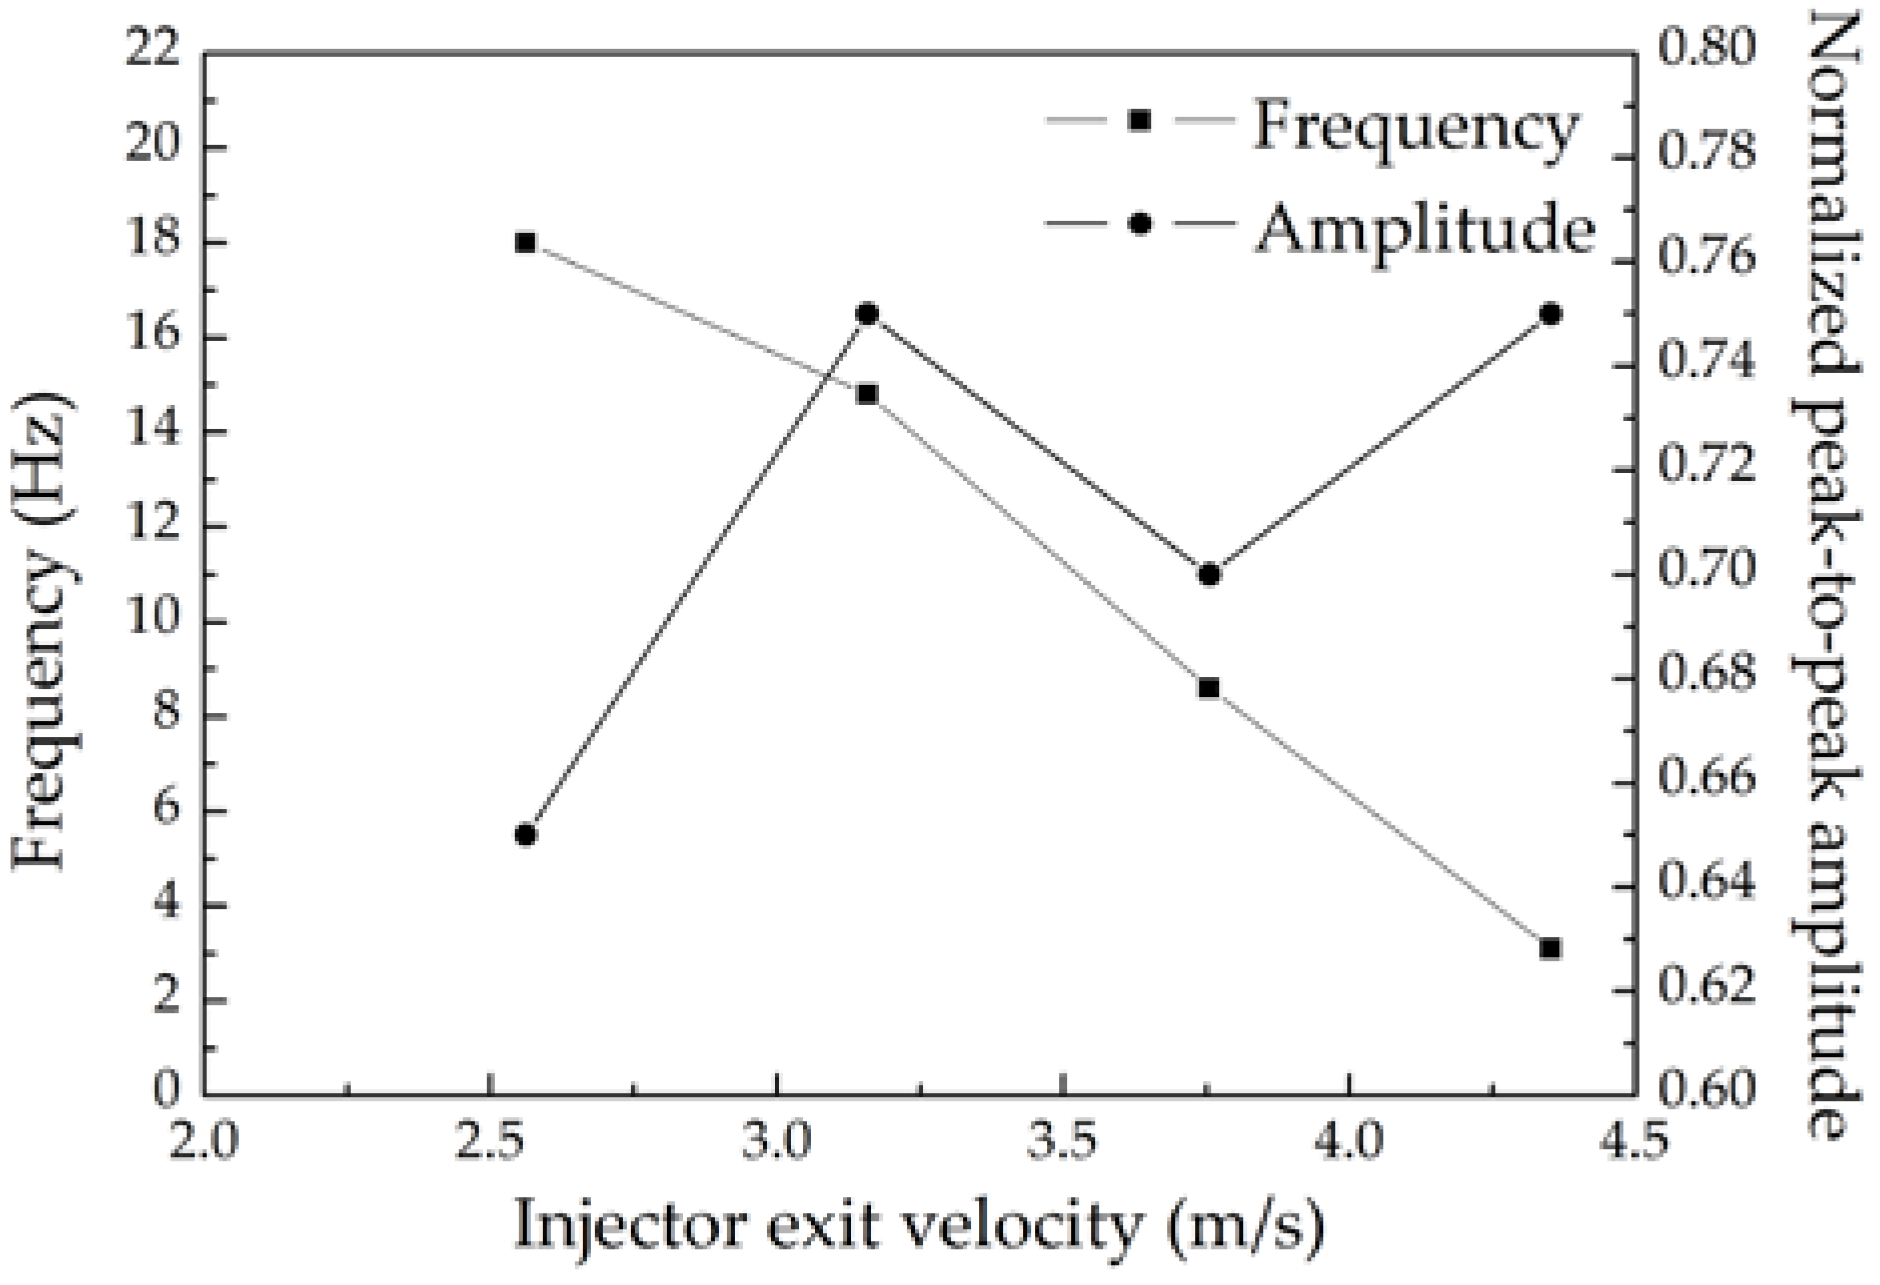
Figure 13.
The variation in Strouhal number with (a) Froude number; (b) Reynold number.


Table 1.
Test cases of the experiment.
| Case | Combustor Pressure, P (bar) | Fuel Mass Flow Rate, ṁF (g/min) | Air Mass Flow Rate, ṁA (kg/min) | Primary Air, ṁpri (g/min) | Injector Exit velocity, ve (m/s) |
|---|---|---|---|---|---|
| 1 | 4 | 12 | 2.1 | 105 | 5.13 |
| 2 | 4 | 14 | 2.1 | 105 | 5.22 |
| 3 | 4 | 16 | 2.1 | 105 | 5.31 |
| 4 | 3 | 12 | 2.1 | 105 | 6.84 |
| 5 | 4 | 12 | 2.1 | 105 | 5.13 |
| 6 | 5 | 12 | 2.1 | 105 | 4.11 |
| 7 | 5 | 16 | 1.9 | 95 | 3.90 |
| 8 | 5 | 16 | 2.0 | 100 | 4.07 |
| 9 | 5 | 16 | 2.1 | 105 | 4.25 |
| 10 | 5 | 16 | 2.2 | 110 | 4.42 |
| 11 | 5 | 8 | 1.3 | 65 | 2.56 |
| 12 | 5 | 10 | 1.6 | 80 | 3.16 |
| 13 | 5 | 12 | 1.9 | 95 | 3.76 |
| 14 | 5 | 14 | 2.2 | 110 | 4.35 |
© 2018 by the authors. Licensee MDPI, Basel, Switzerland. This article is an open access article distributed under the terms and conditions of the Creative Commons Attribution (CC BY) license (http://creativecommons.org/licenses/by/4.0/).
Share and Cite
MDPI and ACS Style
Xi, Z.; Fu, Z.; Hu, X.; Sabir, S.W.; Jiang, Y. An Experimental Investigation on Flame Pulsation for a Swirl Non-Premixed Combustion. Energies 2018, 11, 1757. https://doi.org/10.3390/en11071757
AMA Style
Xi Z, Fu Z, Hu X, Sabir SW, Jiang Y. An Experimental Investigation on Flame Pulsation for a Swirl Non-Premixed Combustion. Energies. 2018; 11(7):1757. https://doi.org/10.3390/en11071757
Chicago/Turabian StyleXi, Zhongya, Zhongguang Fu, Xiaotian Hu, Syed Waqas Sabir, and Yibo Jiang. 2018. "An Experimental Investigation on Flame Pulsation for a Swirl Non-Premixed Combustion" Energies 11, no. 7: 1757. https://doi.org/10.3390/en11071757
Note that from the first issue of 2016, this journal uses article numbers instead of page numbers. See further details here.