Graphene Oxide: An Effective Promoter for CO2 Hydrate Formation


1
Jiangsu key laboratory of oil-gas storage and transportation technology, Changzhou 213016, China
2
Changzhou University, School of Petroleum Engineering, Changzhou 213016, China
*
Author to whom correspondence should be addressed.
Energies 2018, 11(7), 1756; https://doi.org/10.3390/en11071756
Submission received: 29 May 2018
/
Revised: 28 June 2018
/
Accepted: 3 July 2018
/
Published: 4 July 2018
Abstract
:The main difficulties in applying technologies based on hydrate formation are the slow hydrate formation rate, low storage capacity, severe formation conditions and environmentally devastating promoters. Nano-sized graphene oxide has special microstructure features such as its functional groups and a large specific surface area, which can lead to high heat and mass transfer efficiency, large gas dissolution, fast nucleation and formation rate. In this work, CO2 hydrate formation with and without graphene oxide nanoparticles was investigated. Herein, the promoting mechanism and effects of graphene oxide concentrations in different initial pressures ranging from 3 to 5 MPa at 279 K on CO2 hydrate formation process were studied experimentally. The experimental results showed that graphene oxide can shorten the induction time by 53–74.3% and increase the gas consumption up to 5.1–15.9% under different system pressures. Based on the results, the optimum concentration was ascertained as 50 ppm under which condition, the induction time and the reaction time were the shortest while the pressure drop and the gas consumption reached the maximum.
1. Introduction
With the booming energy demand, the emissions of the major greenhouse gas, CO2, have increased sharply, which contributes to global warming. In response to this problem, technologies based on carbon capture, utilization and storage (CCUS) [1] have become attractive. Many technologies have been developed, and one effective way to capture CO2 is through hydrate formation [2,3]. CO2 hydrate-based capture is a unique technology that can be used in CCUS and is less energy-intensive. The basis for the application is the rapid entrapment of CO2 gas through hydrate formation in a mild formation conditions and the release of the captured gas through hydrate decomposition. However, the success of these promising and practical applications was primarily hindered by certain technological difficulties in hydrate formation, such as insufficient storage capacities and slow formation rates.
At present, the most common methods to speed up the hydrate formation used in the laboratory are physical and chemical methods. From a macro perspective, physical methods include stirring [4], bubbling [5], atomizing [6] and external field ways [7,8], which aim to enlarge the gas and liquid-water phases contact area and enhance the heat and mass transfer during the hydrate formation process, finally speeding up the generation rate. From a microscopic point of view, according to different promotion mechanisms, the chemical methods could be divided into the thermodynamic promotion and the kinetic promotion. Thermodynamics promoters, which aim to lower the hydrate phase equilibrium conditions and moderate the reaction conditions, typically include tetrahydro-furan (THF) [9], tetrabutylammonium bromide (TBAB) [10], acetone and gas additives. Kinetic promoters are mainly based on surfactants, which mainly play a role in decreasing the surface tension of the liquid, reducing the diffusion resistance of gas molecules into the liquid phase, and increasing the solubility of gas molecules. Kinetic promoters includes sodium dodecyl benzenesulfonate (SDBS) [11], sodium dodecyl sulfate (SDS) [9] and so on. However, physical methods usually require additional energy because of their sophisticated equipment, which is not conducive to continuous industrial production. On the other hand, the surfactants have a low recovery rate. Some surfactants are even toxic and harmful to the environment. Therefore, in recent years, many scholars have studied tiny particles, metal oxides and others compounds as new promoters whose promotion mechanism is not completely equivalent to that of the traditional surfactants.
The thermal conductivity of nanofluids had been studied in previous studies. It was found that the nanoparticles could not only significantly improve the thermal conductivity, but also enhance heat and mass transfer. Nano-sized Al2O3 have been proved to offer higher thermal conductivity than the base fluid without nanoparticles [12] and they can enhance the mass transfer coefficient, accelerate absorption rates and increase the surface viscosity up to 26% and 11%, respectively, at 0.01 vol % during CO2 absorption and diffusion processes in Al2O3 nanofluids in comparison with pure methanol [13]. Many investigators have studied the influences of different nanofluids on the CO2 absorption rate. Measured CO2 absorption rates in SiO2 nanofluids were higher than those in Al2O3 nanofluids [14]. Further studies proved that in aqueous NaCl solution-based Al2O3 nanofluids, CO2 solubility was enhanced dramatically [15,16]. A study on CO2 absorption in water-based nanofluids of SiO2 and ZnO nanoparticles was carried out where compared with pure water, the total CO2 absorption enhancement was 14% and 7% in the nanofluids with 0.1 wt % ZnO and SiO2, respectively [17]. Nano-sized SiO2 also can be used to promote CH4 hydrate formation which can reduce the dissociation rate of CH4 hydrates, shorten the induction time and significantly increase the growth rate [18]. Recently, many active studies on hydrate formation-promoting technology using nanoparticles and metal oxides have been carried out. Based on the heat transfer enhancement in nanofluids, HFC134a hydrate formation in different mass fractions of nano-copper suspensions was studied and found that the heat and mass transfer efficiency were enhanced with the increase of nano-copper particles [19]. CuO nanoparticles could speed up gas consumption rates, increase the mole percent of water to hydrate conversion and shorten induction times [20,21]. Silver nanoparticles are also proposed to promote CH4 hydrate formation and increase the amount of hydrate formation [22,23]. Further studies showed that the mixture of silver nanoparticles and SDS can significantly enlarge the storage capacity [24]. The CH4 hydrate formation in presence of multi-walled carbon nanotubes (MWCNTs) and oxidized multi-walled carbon nanotubes (OMWCNTs) was studied and experimental results showed that both MWCNTs and OMWCNTs could accelerated hydrate formation rate and gas consumption in OMWCNTs nanofluids was merely 4.5 times higher than that in pure water [25]. Studies on metal oxide powders, such as silicon, aluminum, zinc, titanium and magnesium oxides, proved that metal oxide powders could cut down the induction time and increase gas consumption during hydrate formation. Moreover the induction time decreases as the size of the promoter particles increases, which means the activity of the powder depends on the properties of its surface, including the nature of surface functional groups, especially the presence of carbon-containing groups (including carbonate). It was concluded that modification of the oxide particle surface could be used to efficiently promote hydrate formation [26]. Studies on the effects of different metal oxide nanoparticles (Al2O3, CeO2, SiO2) on hydrate formation were carried out and it was proved that the maximum CO2 hydrate formation rate was obtained in the solution with 0.6 wt % SDS and 0.2 wt % Al2O3 nanoparticles [27]. The phase equilibrium conditions and gas consumption in the presence of 0.1 wt % SDS and 0.1 wt % ZnO nanoparticles were tested and results showed that the formation time decreased while the number of the consumed gas moles increased for nanofluids in comparison to pure water. The amounts of enhancement of the gas consumption for ZnO nanofluids were about 6–16% at different pressures. [28]. The effect of different concentrations of Al2O3/ZnO nanoparticles in aqueous solution on the CH4 + C2H6 + C3H8 hydrate formation kinetics were investigated and the gas consumption in the presence of these two types of nanoparticles increased by almost 121% in comparison with that of a pure water system. The storage capacity also increased with the addition of the mixed nanoparticles [29].
Nanoparticles play a great role in promoting hydrate formation which has pointed out a new research direction for enhanced hydrate formation. Graphene oxide (GO) is a kind of new carbon material with excellent properties, such as the huge specific surface area, superior dispersion in water and so on. It can be produced by the oxidation of graphene with only one carbon atom thickness, therefore there are abundant functional groups on its surface, which makes GO both hydrophilic and lipophilic (amphipathy), so the amphipathy characteristics of GO make it act as a surfactant, which can be used to lower the surface tension. At present, there are few reports about the effect and mechanism of GO on hydrate formation. The thermal conductivity and hydrophilicity of GO have been investigated [30]. The addition of the GO nanofluids could significantly improve the thermal conductivity of the base fluid, which resulted from the comprehensive effect of the conduction between the dispersion of the liquid and that of the GO nanoparticles. It was explained that the thermal conductivity of the GO nanofluids resulted from the comprehensive effect of the conduction between the dispersion of the liquid and that of the GO nanoparticles. It was also proved that GO was a kind of hydrophilic material with the contact angle of 31.6°. Nevertheless, in worldwide studies, the influence of GO on hydrate formation characteristics is rarely reported at present. In this research, the effect of GO-based nanofluids on CO2 hydrate formation as a promoter was experimentally studied in a high-pressure reaction kettle equipped with a magnetic stirrer. This research aimed to confirm whether the GO nanoparticles could be used as an additive to promote hydrate formation. Change regularities of temperature and pressure, induction time, gas consumption and promoting mechanism were also presented in the system with the GO nanoparticles.
2. Experimental Section
2.1. Materials
The CO2 (purity of 99.99%) was supplied by Changzhou Jiangnan Industrial Gases Co. Ltd. (Changzhou, China). The surfactant applied in the experiments was GO with a purity of 99.9% obtained from the Jiang Nan Graphene Research Institute in Changzhou, China. The surfactant was weighted with an electronic analytical balance with an uncertainty of ±0.0002 g purchased from Shanghai Yue Ping Scientific Instrument Co. Ltd. (Shanghai, China) to prepare aqueous solutions with the required concentrations of surfactant. The distilled water was prepared by our laboratory. Then, the aqueous solutions containing GO were prepared in an ultrasonic bath (KQ-50DE type, supplied by Kunshan Ultrasonic Instrument Co. Ltd., Kunshan, China) which could effectively avoid the formation of inhomogeneous nanoparticle dispersions as well as aggregation and agglomeration.
2.2. Apparatus
As shown in Figure 1, the experiments were performed in an assembled experimental apparatus consisting of a high-pressure reactor, a constant temperature bath, and a data acquisition system. The stirred bath reactor was a SS-316 spheroidal vessel with a capacity of 500 cm3 that can operate pressures from 0 to 30 MPa. A coolant bath was used to maintain the system temperature with ethylene glycol. The temperature in the reactor and coolant bath were measured by using Pt100 thermometers with an accuracy of ±0.1 K respectively. The operating temperature of the thermostatic bath system (THD-2030 type) ranged from 258.15 to 293.15 K with the control accuracy of ±0.01 K. Advanced gas driven pressurization method was applied to the high-pressure gas supply system. In addition, the pressure of the reaction system was measured by a pressure sensor with an accuracy of ±5% (0–10 MPa) inserted into the reactor. The process of gas hydrate formation can be real-time monitored by a fiber optic camera system. The temperature and pressure were acquired by a data acquisition system driven by a personally computer that were tracked and recorded at 1 s intervals.
2.3. Procedure
Solutions containing GO nanoparticles with particle weight percentages ranging from 20 to 300 ppm were prepared with deionized water. Then through ultrasonic vibration for 30 min, the large-sized nanoparticles were broken up and evenly distributed nanofluids were obtained.
The cell was rinsed three times with distilled water. The reactor was subsequently charged with a proper amount of distilled water or aqueous solution of GO particles (170 mL), and dissolved gas in the solution was removed by a vacuum pump. The reaction system temperature was maintained at 279 K by the constant temperature bath, and when the specified temperature was reached, the reactor was slowly pressurized to the set value (3–5 MPa). The experimental cell included a magnetic stirrer. The stirring speed used in this study is 400 rpm. The pressure and temperature were acquired by a data acquisition system. When CO2 was consumed to form hydrate, the pressure of the system decreased. Hydrate formation was determined by observing through a viewing window and judging the curves of the temperature and pressure. When the pressure was maintained at a certain value for 30 min, the system was considered to have reached the steady state.
3. Results and Discussion
3.1. Effect of GO on CO2 Hydrate Formation Process
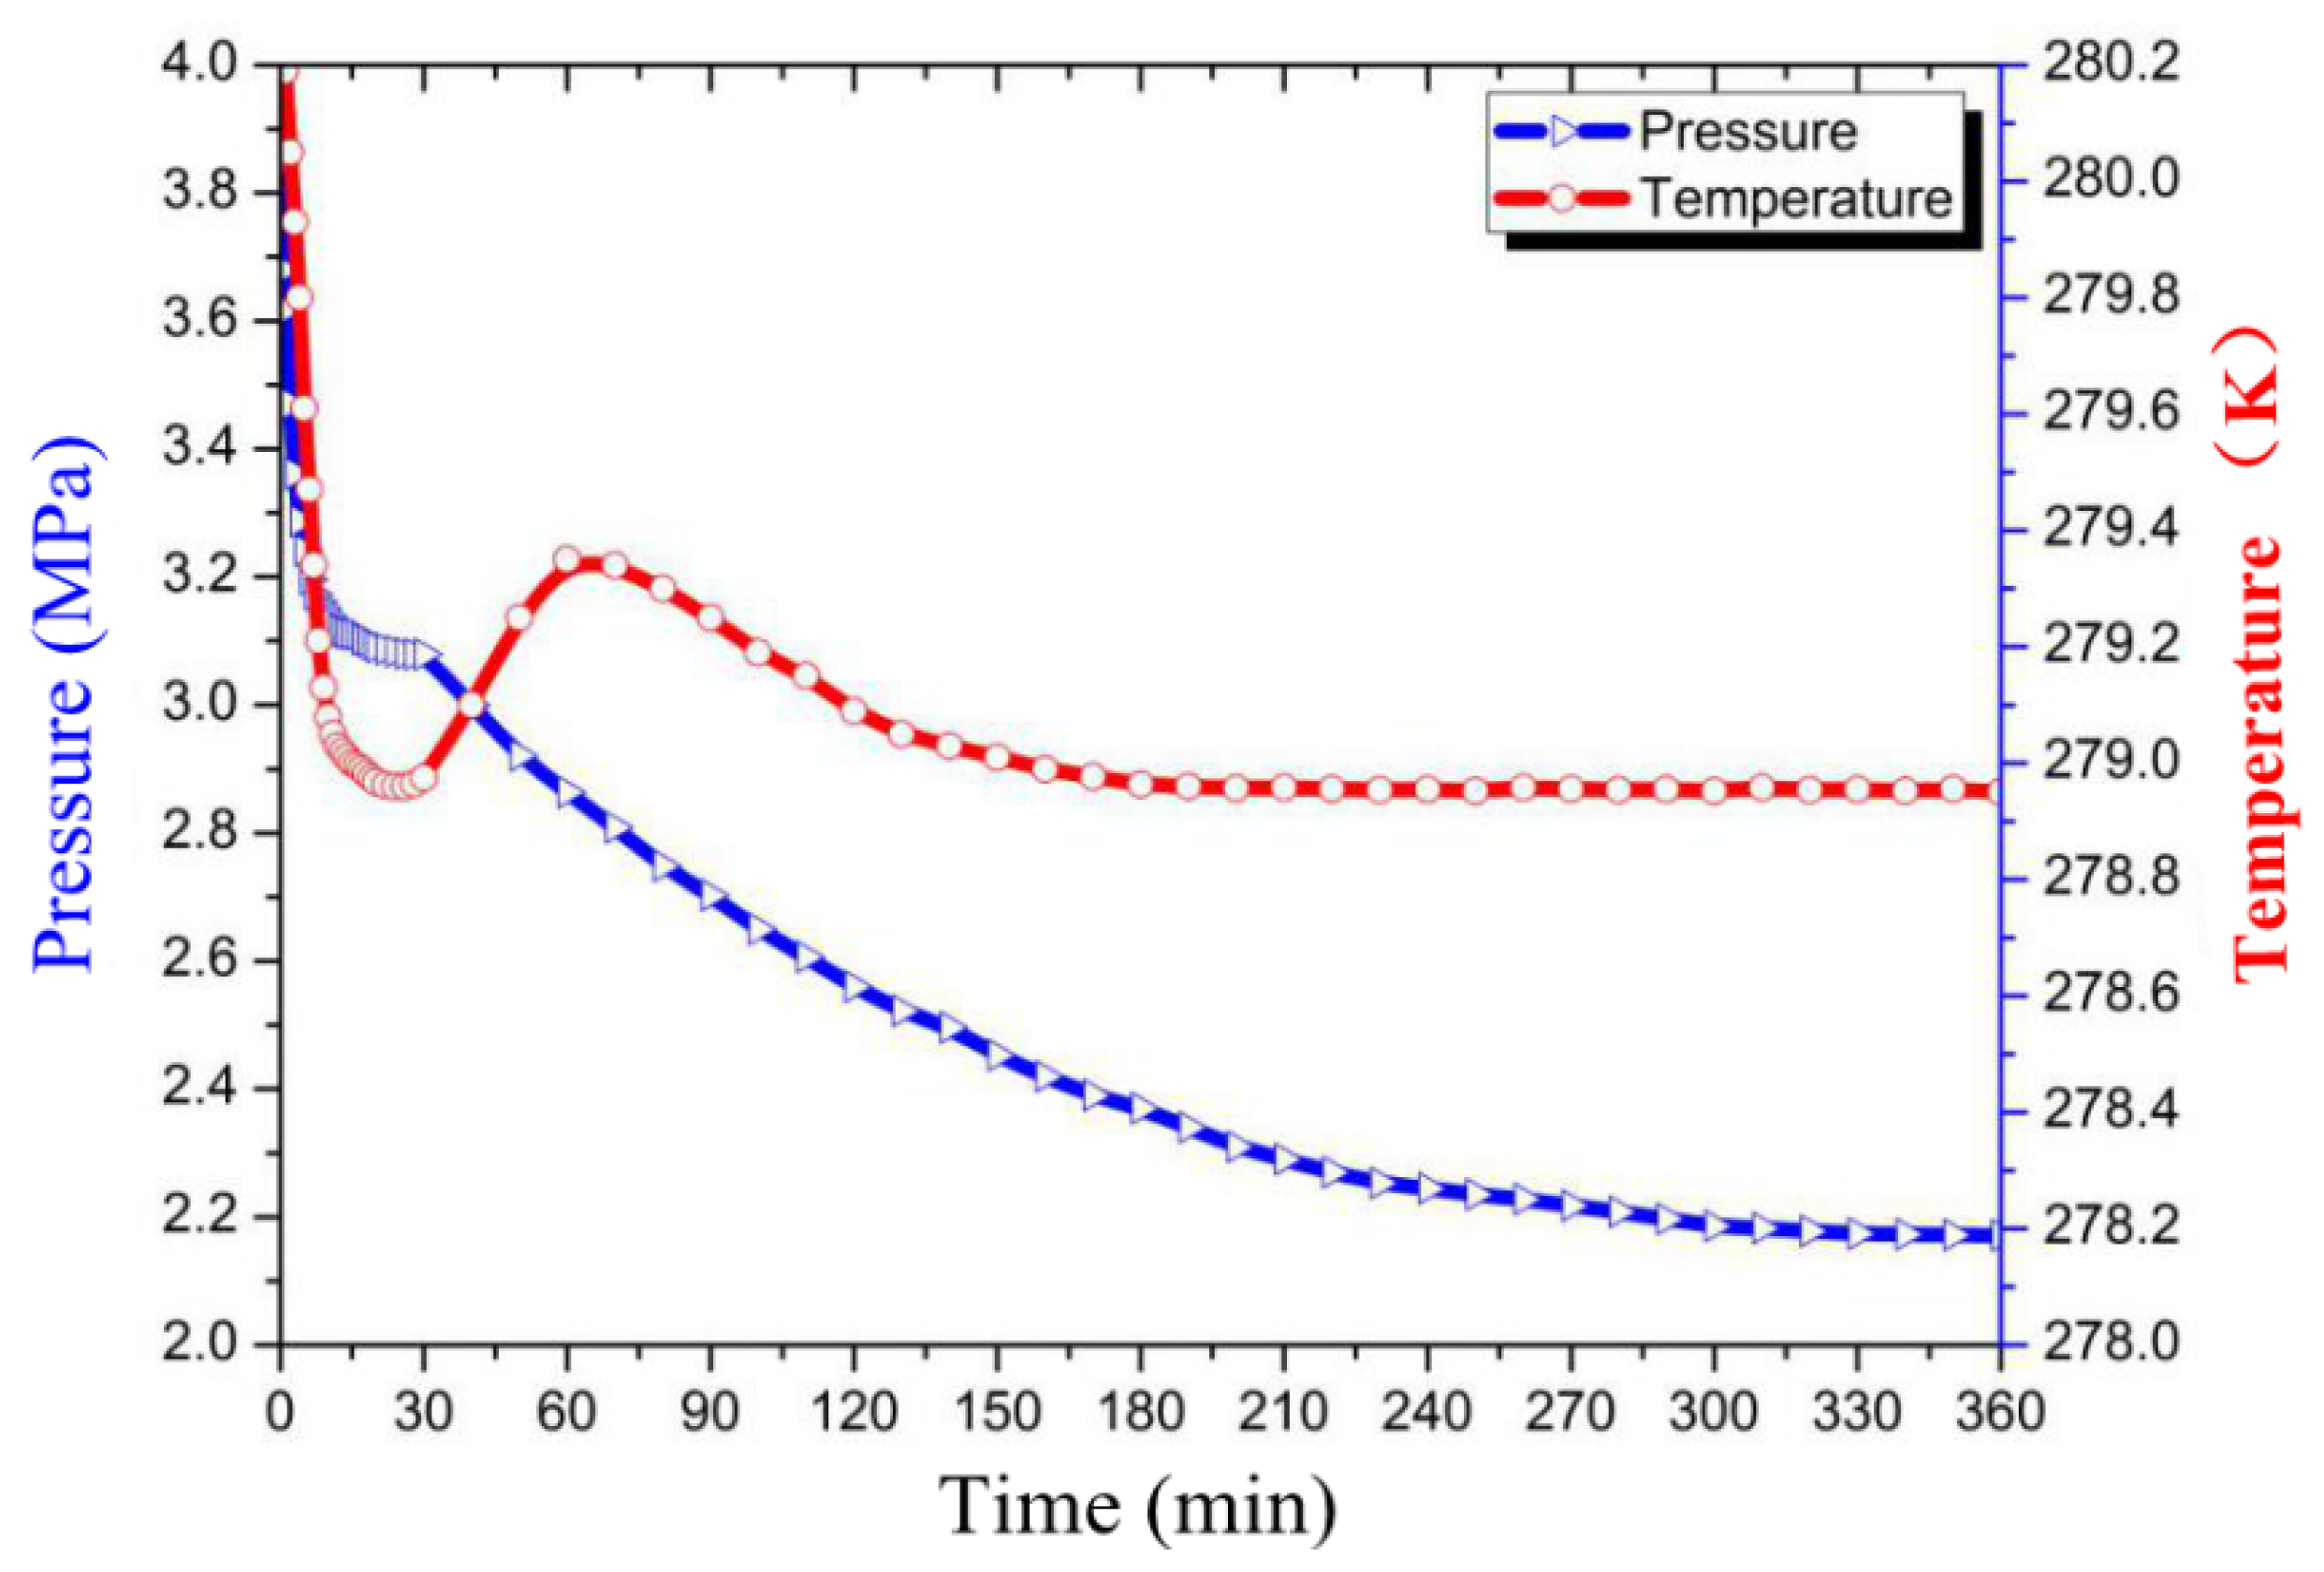
Figure 2 presents the curves of temperature and pressure versus time during the CO2 hydrate formation with 360 min in the concentration of 100 ppm of GO particles solution at the set system temperature and pressure (279 K, 3.8 MPa). Figure 2 indicates that when the pressure reaches 3.8 MPa, the actual temperature in the reactor is higher than the set temperature by approximately 1.5 K. The rise of the system temperature was mainly caused by the gas compression. On the other hand, the temperature was lower than the set value after 10 min because of the favorable solubility of CO2 and the effect of the water bath. At the beginning of the reaction within 5 min, the pressure plunged due to large amounts of gas being dissolved in the solution. However, the temperature and pressure changed slightly in 5–28 min with the dissolution of the gas. This stage is defined as the induction time, that is, the pressure tends to be stable and the hydrate crystal nuclei begin to form gradually. When the induction time was over and reached 28 min, the hydrate growth stage began. With the large amount of gas hydrate formed, the gas consumption and the temperature rose suddenly, while the system pressure obviously decreased. It can be explained by the fact that the hydrate reaction is an exothermic process. During the early stages of the crystal nucleus growth period, the growth rate of hydrates reached a maximum owing to the relatively higher degree of super-cooling and certain driving forces like pressure in the system. At the same time, the instantaneous temperature of the system obviously increased, and then gradually approached the initial value. The causes of this phenomenon are mainly three: firstly, a large amount of hydrate film is generated at the beginning of the reaction, hindering the gas uptake and finally resulting in the formation of less hydrate and releasing less heat. Secondly, the water bath device played a role in dissipating the heat. In addition, GO possesses a great thermal conductivity which can dissipate the generated heat quickly to prevent the continued growth of the hydrate from suffering the influence of heat. As the reaction proceeds the pressure drop gradient was gently reduced and the rate of hydrate formation gradually slowed down, until the system temperature and pressure were stabilized (279 K, 2.171 MPa). On the whole, this process lasted about 360 min.
Figure 3 shows the change in hydrate macroscopic structure during the formation with GO at 279 K and 3.8 MPa. Figure 3a presents the initial stage of hydrate formation with agitation. Twenty min later, a small amount of crystal nuclei appeared (Figure 3b). Then after 25 min, large amounts of nucleation crystals appeared as white flocculates, shown in Figure 3c. Figure 3d is the final stage of hydrate formation. To reduce the error and to eliminate errors, each experiment was repeated several times.
3.2. Effect of GO on the Induction Time
In this work, the pressure variation method was applied to define the induction time. Gas was injected into the reactor and the cell pressure was kept at a certain degree at a constant temperature, then the change of pressure versus time during hydrate formation was recorded just as shown in Figure 4. At the beginning, the pressure gradually decreased due to gas dissolution. The system pressure tended to be stable with the increasing gas dissolution. Then, it began to form hydrate crystal nuclei gradually, and this period, described above, was the induction time. Subsequently, with the continuous growth of the hydrate crystal nuclei, macro scale hydrate crystals were formed. Elevated gas consumption led to a rapid decline in the system pressure. At the same time, as the pressure decreased, the hydrate formation rate slowed down, and finally the system pressure tended to be stable.
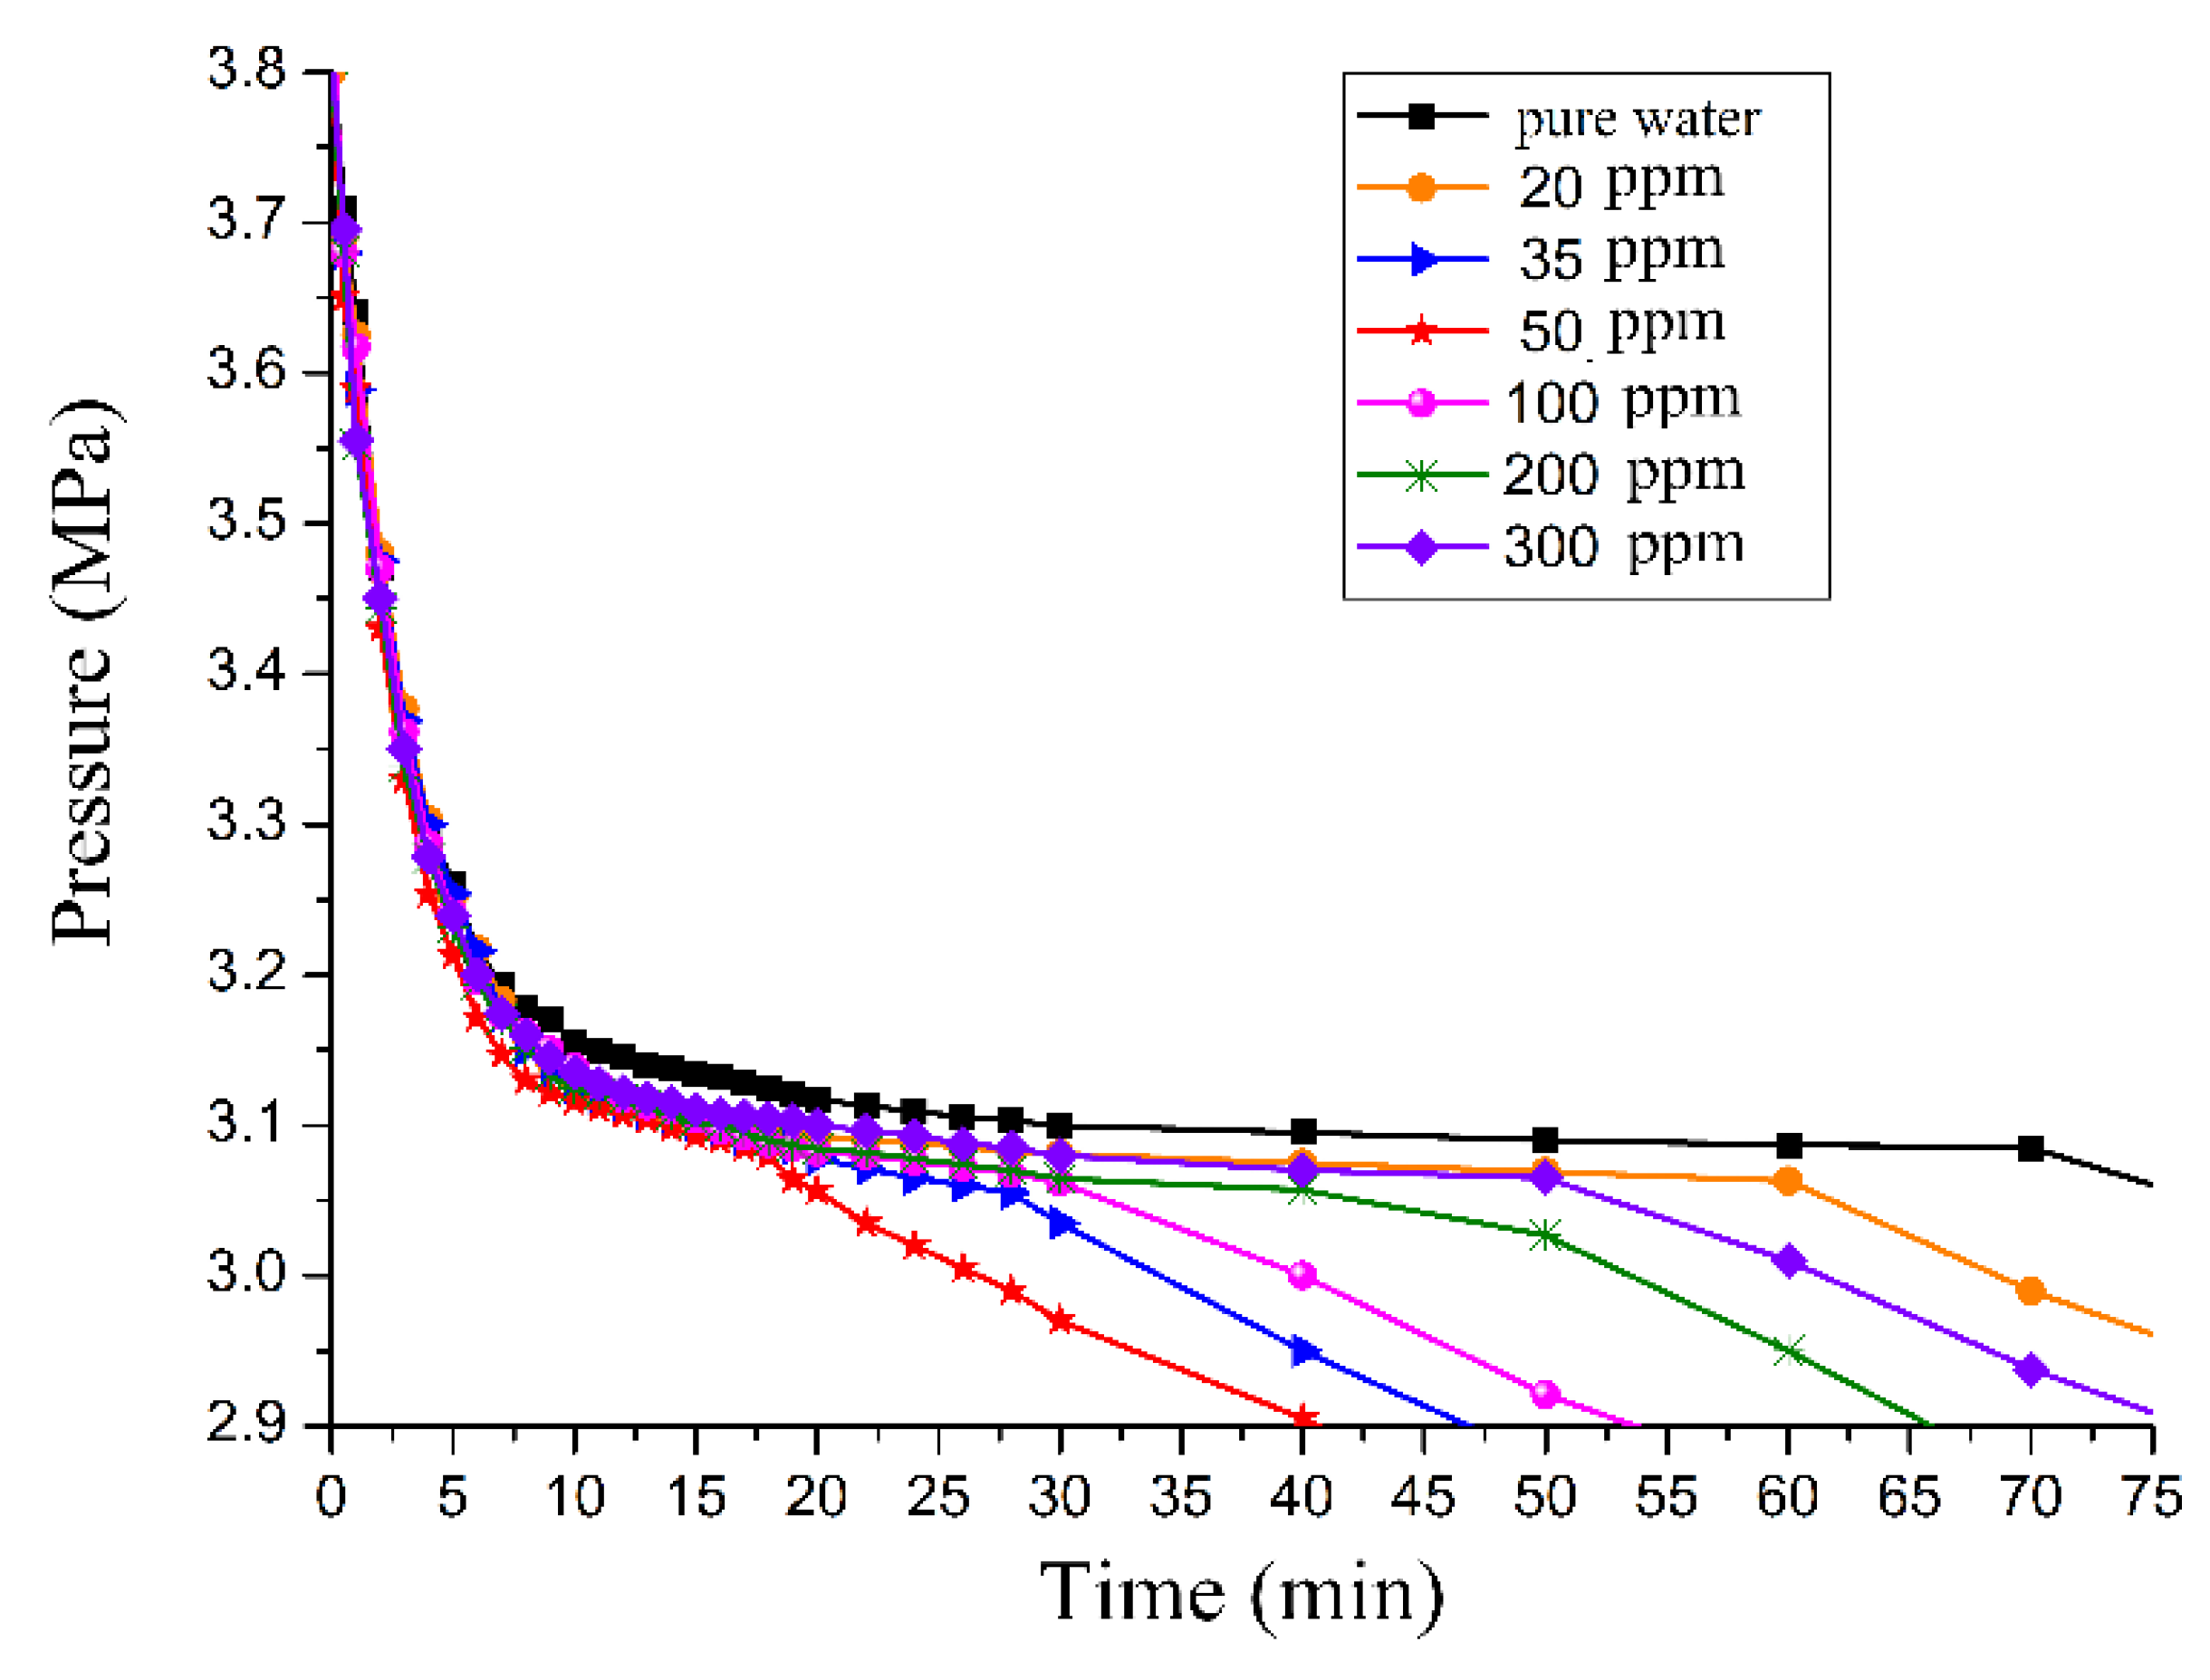
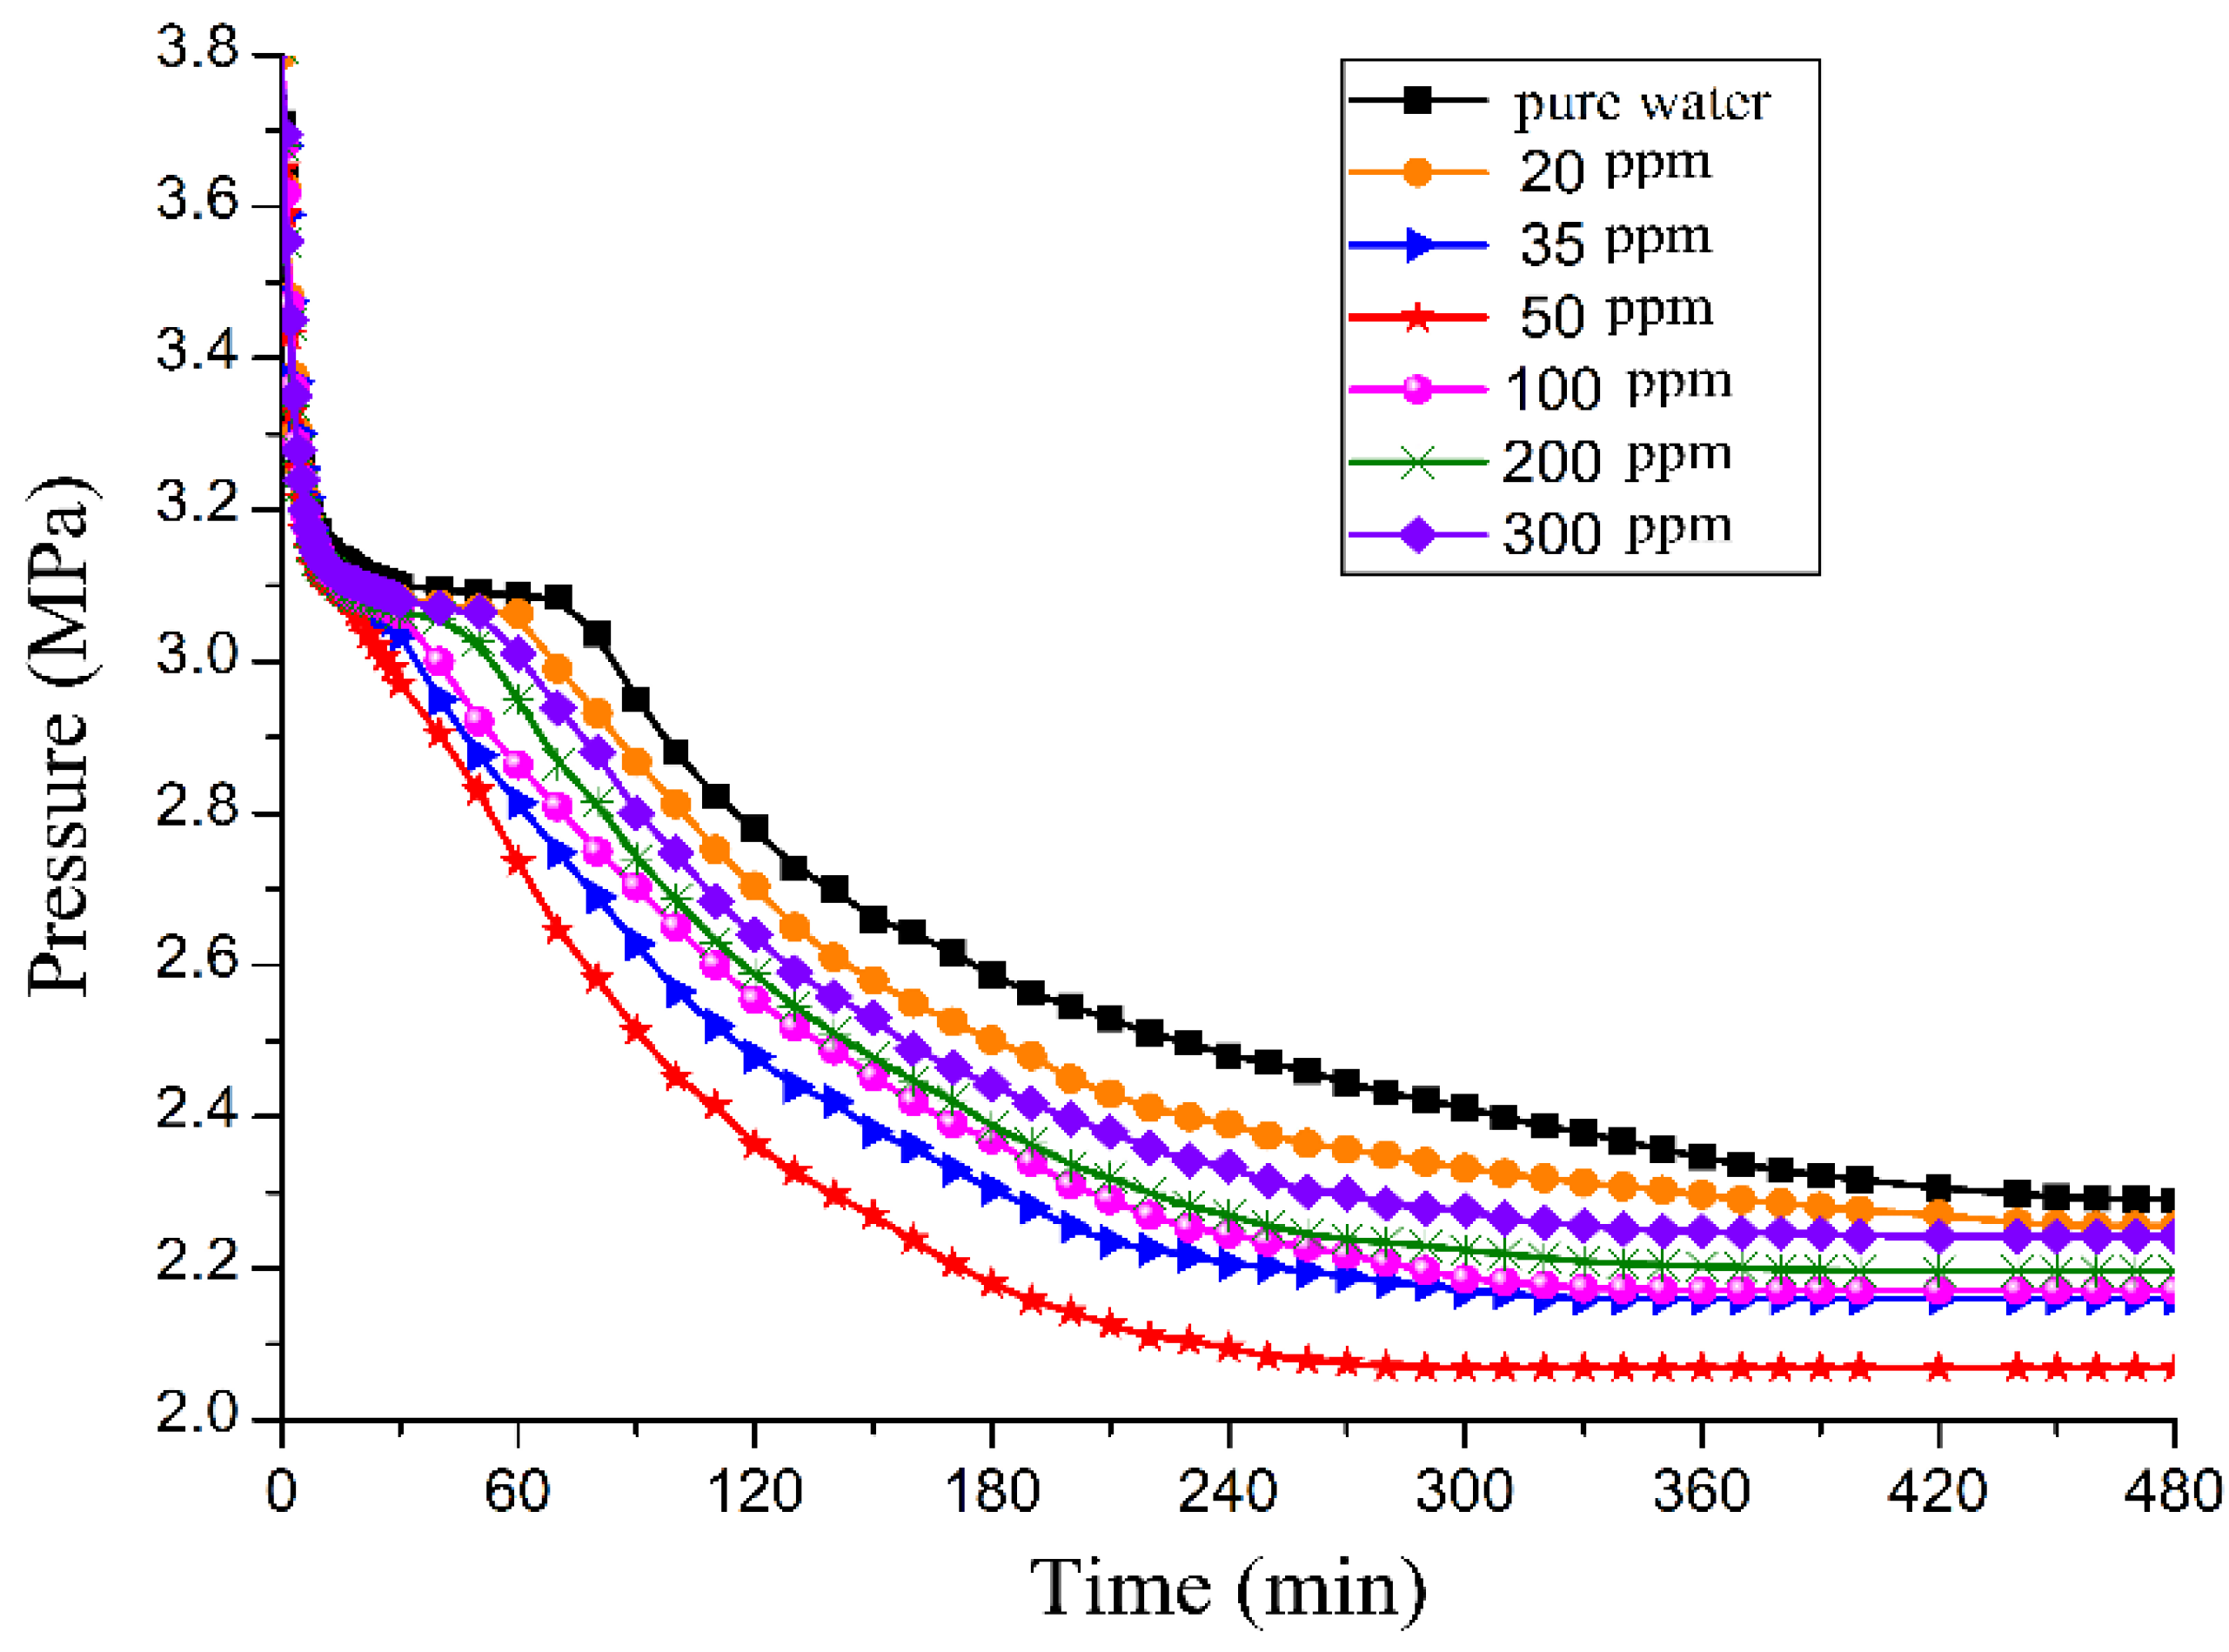
Figure 4 presents the system pressure change curves during hydrate formation under the fixed conditions of temperature and pressure and under different concentrations of GO within the initial 75 min. According to the pressure variation and the view window, after the pressure change curve tended to be smooth, in other words, after the induction period, the pressure dropped suddenly again, and amounts of hydrates formed. As shown in Figure 4, the induction time was only 15 min in the 50 ppm aqueous solution of GO, while the induction time was 68 min in pure water.
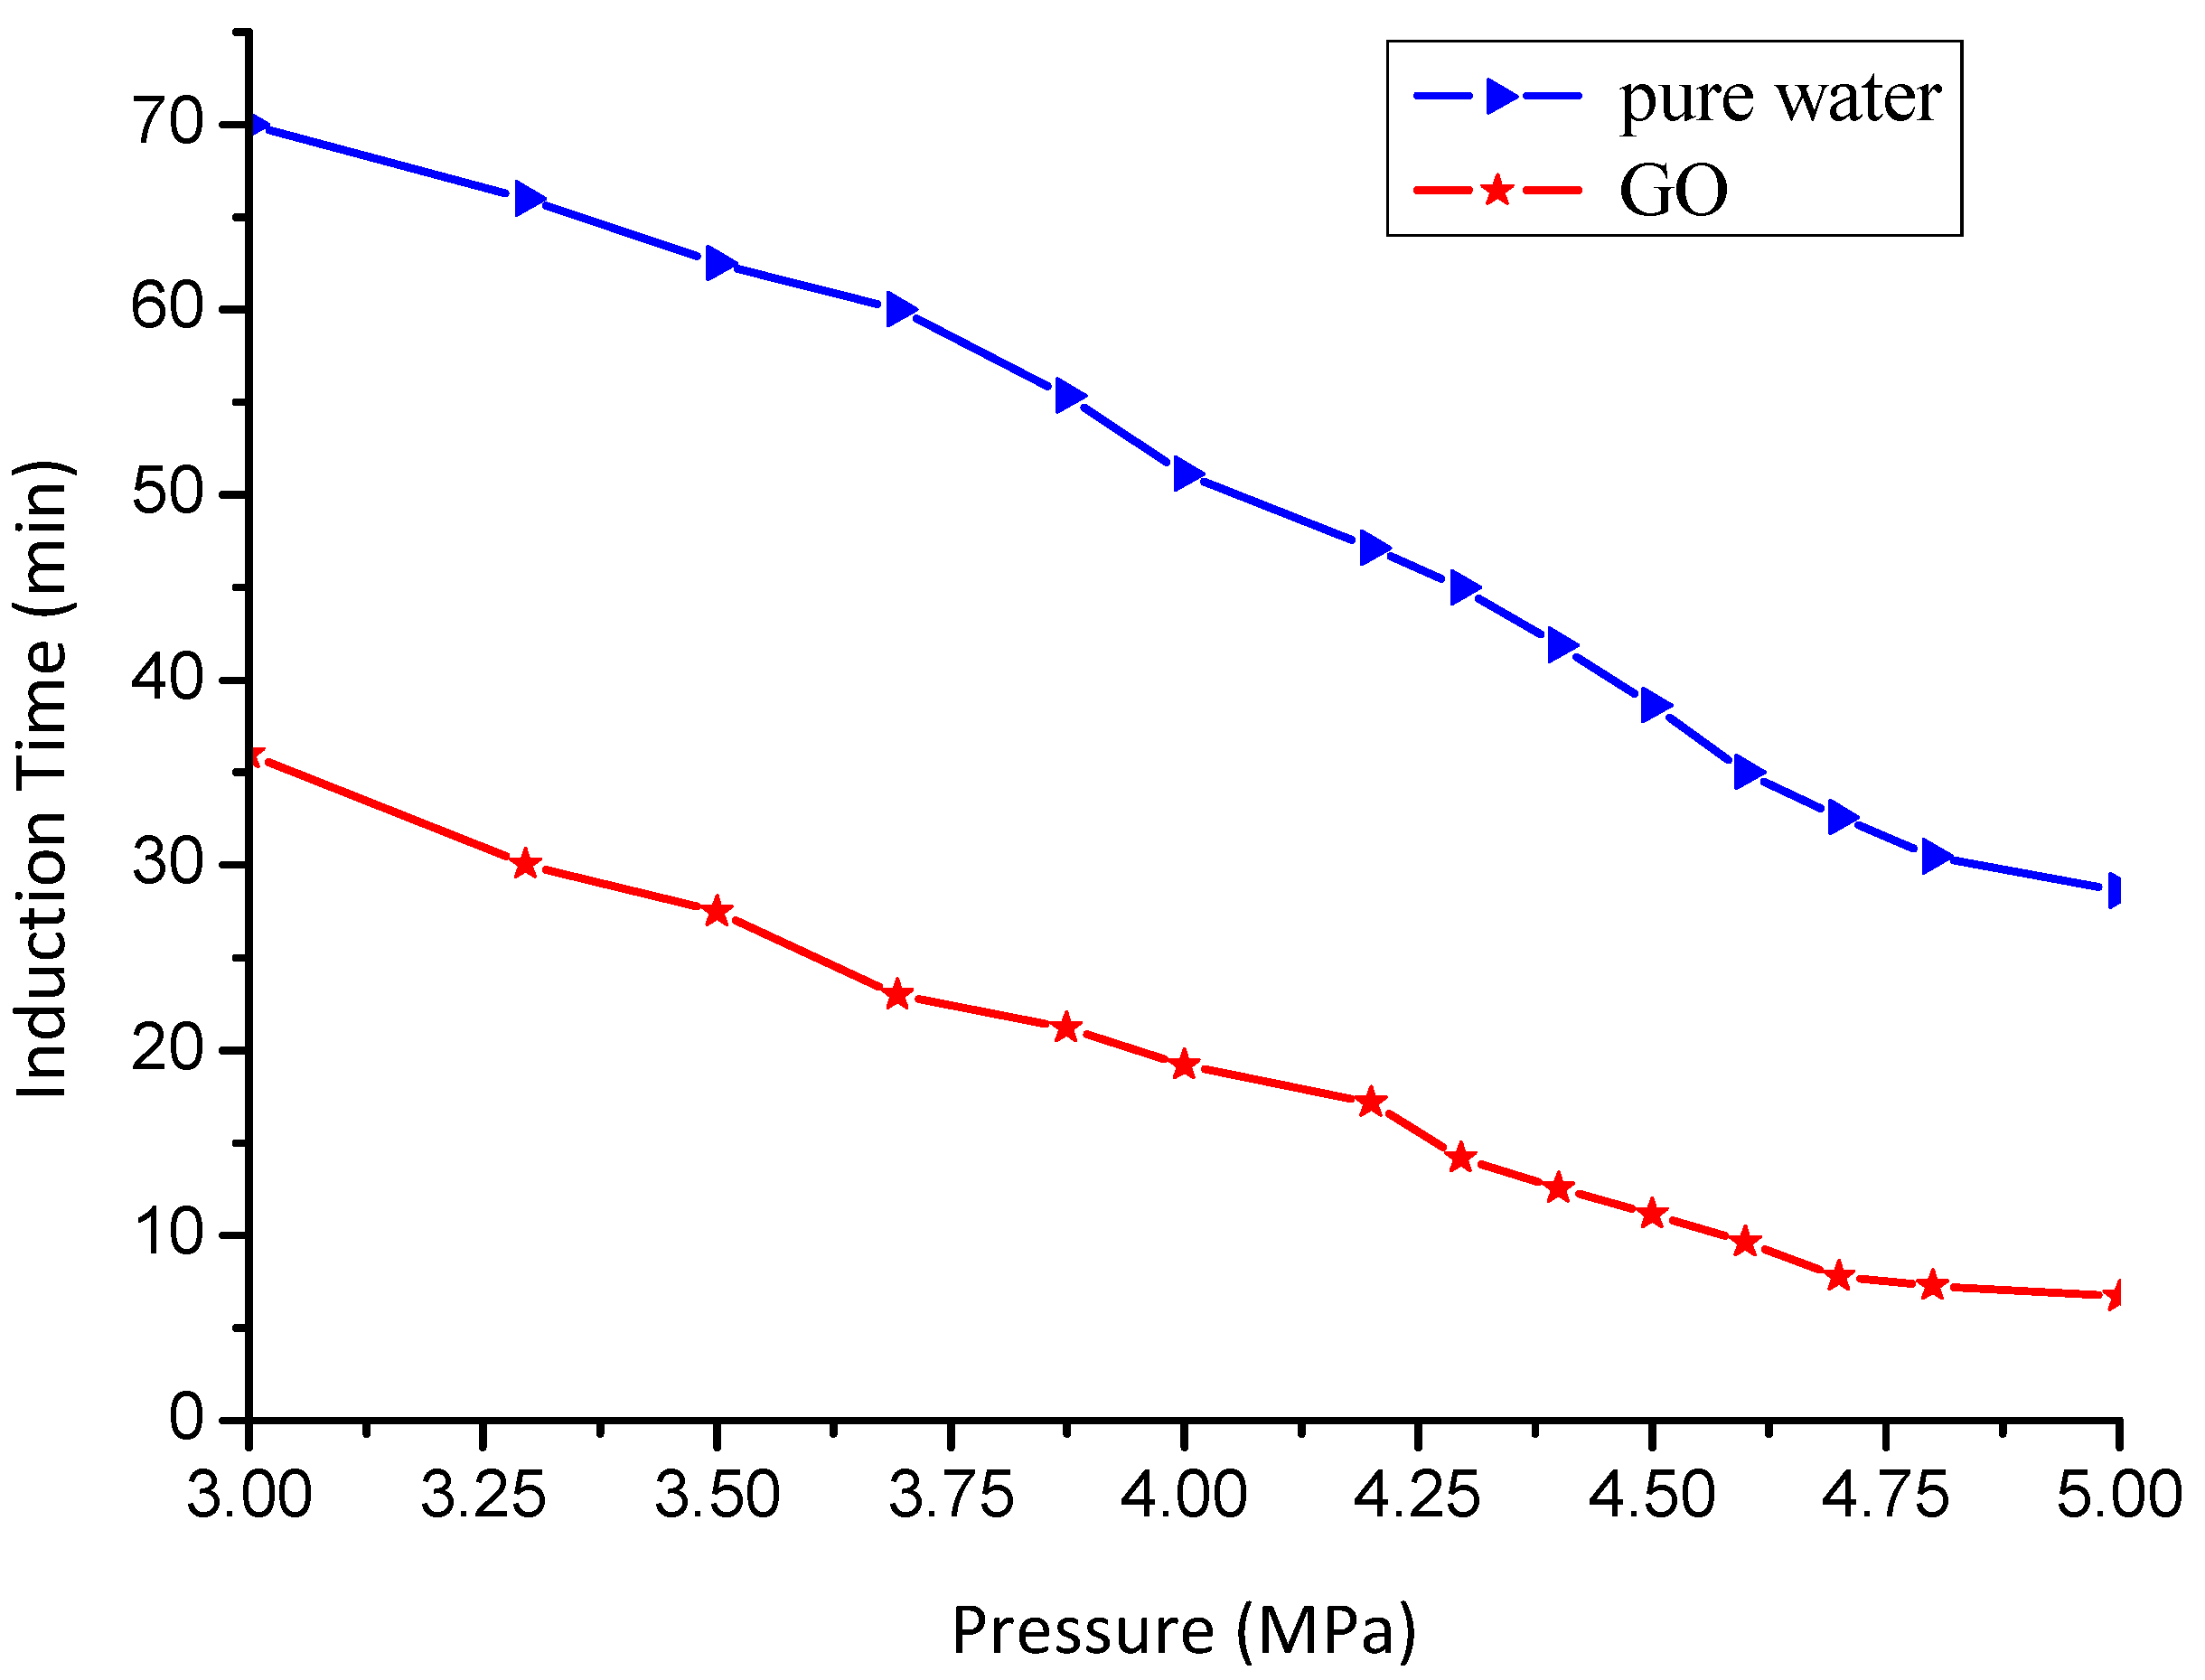
The same method was used to test and record the induction time both in the solution of GO and pure water, at 279 K and different pressures (3, 3.3, 3.5, 3.7, 3.9, 4, 4.2, 4.3, 4.4, 4.5, 4.6, 4.7, 4.8 and 5 MPa, respectively). The results of the comparison are presented in Figure 5.
The induction time in GO suspension decreased by 53–74.3% compared with that in pure water. With the increase of pressure, the length of induction both in the GO and pure water systems time showed a downward trend. More specifically, the effect of pressure on induction time in GO system was not as significant as in the pure water system, which was also indicated in Figure 5. From the view of economic considerations, in order to accelerate hydrate formation rate, reduce induction time, change formation conditions and cut equipment investment, it is a favorable choice to add GO as a hydrate formation promoter which can maintain a higher hydrate formation rate at a lower pressure. It can be explained by the following facts. Firstly, the high hydrophilicity of GO makes it easy to form hydrogen bonds with water molecules, which can effectively promote the hydrate nucleation efficiency. Meanwhile, it performs like a surfactant existing at the gas-liquid interface, which plays a role in decreasing the surface free energy and enhancing the gas solubility. On the other hand, the GO has a high thermal conductivity, which dissipates the reaction heat energy over time during the hydrate formation process and shortens the induction time.
3.3. Effect of GO on Gas Consumption
In engineering, gas pressures lower than 1 MPa and temperatures ranging from 283.15 to 293.15 K can be deemed as ideal gas conditions. The lower the temperature and the higher the pressure during a certain gas hydrate formation process, the bigger the deviation from the ideal state. Thus, it is necessary to introduce a compressibility factor into the ideal gas state equation, and the CO2 gas consumption could be calculated as follows [4]:
where, Δn is the amount of gas consumed during the hydrate formation in mol. V, P, T represent the gas volume, pressure and temperature in m3, Pa and K. Subscripts i and f stand for the initial and final conditions. R is the universal gas constant. Z is the compressibility factor measured by the Peng-Robinson equation of state [31]:
where, subscripts cr and r represent the critical state and the contrastive state, respectively.
The experiments proved that the critical compressibility factor of real gas was in the range of 0.23–0.33, and more than 60% hydrocarbon gases were about 0.27. In this experiment, Zcr = 0.274 and the calculation error was less than 5%, which was within the allowable error range [32].
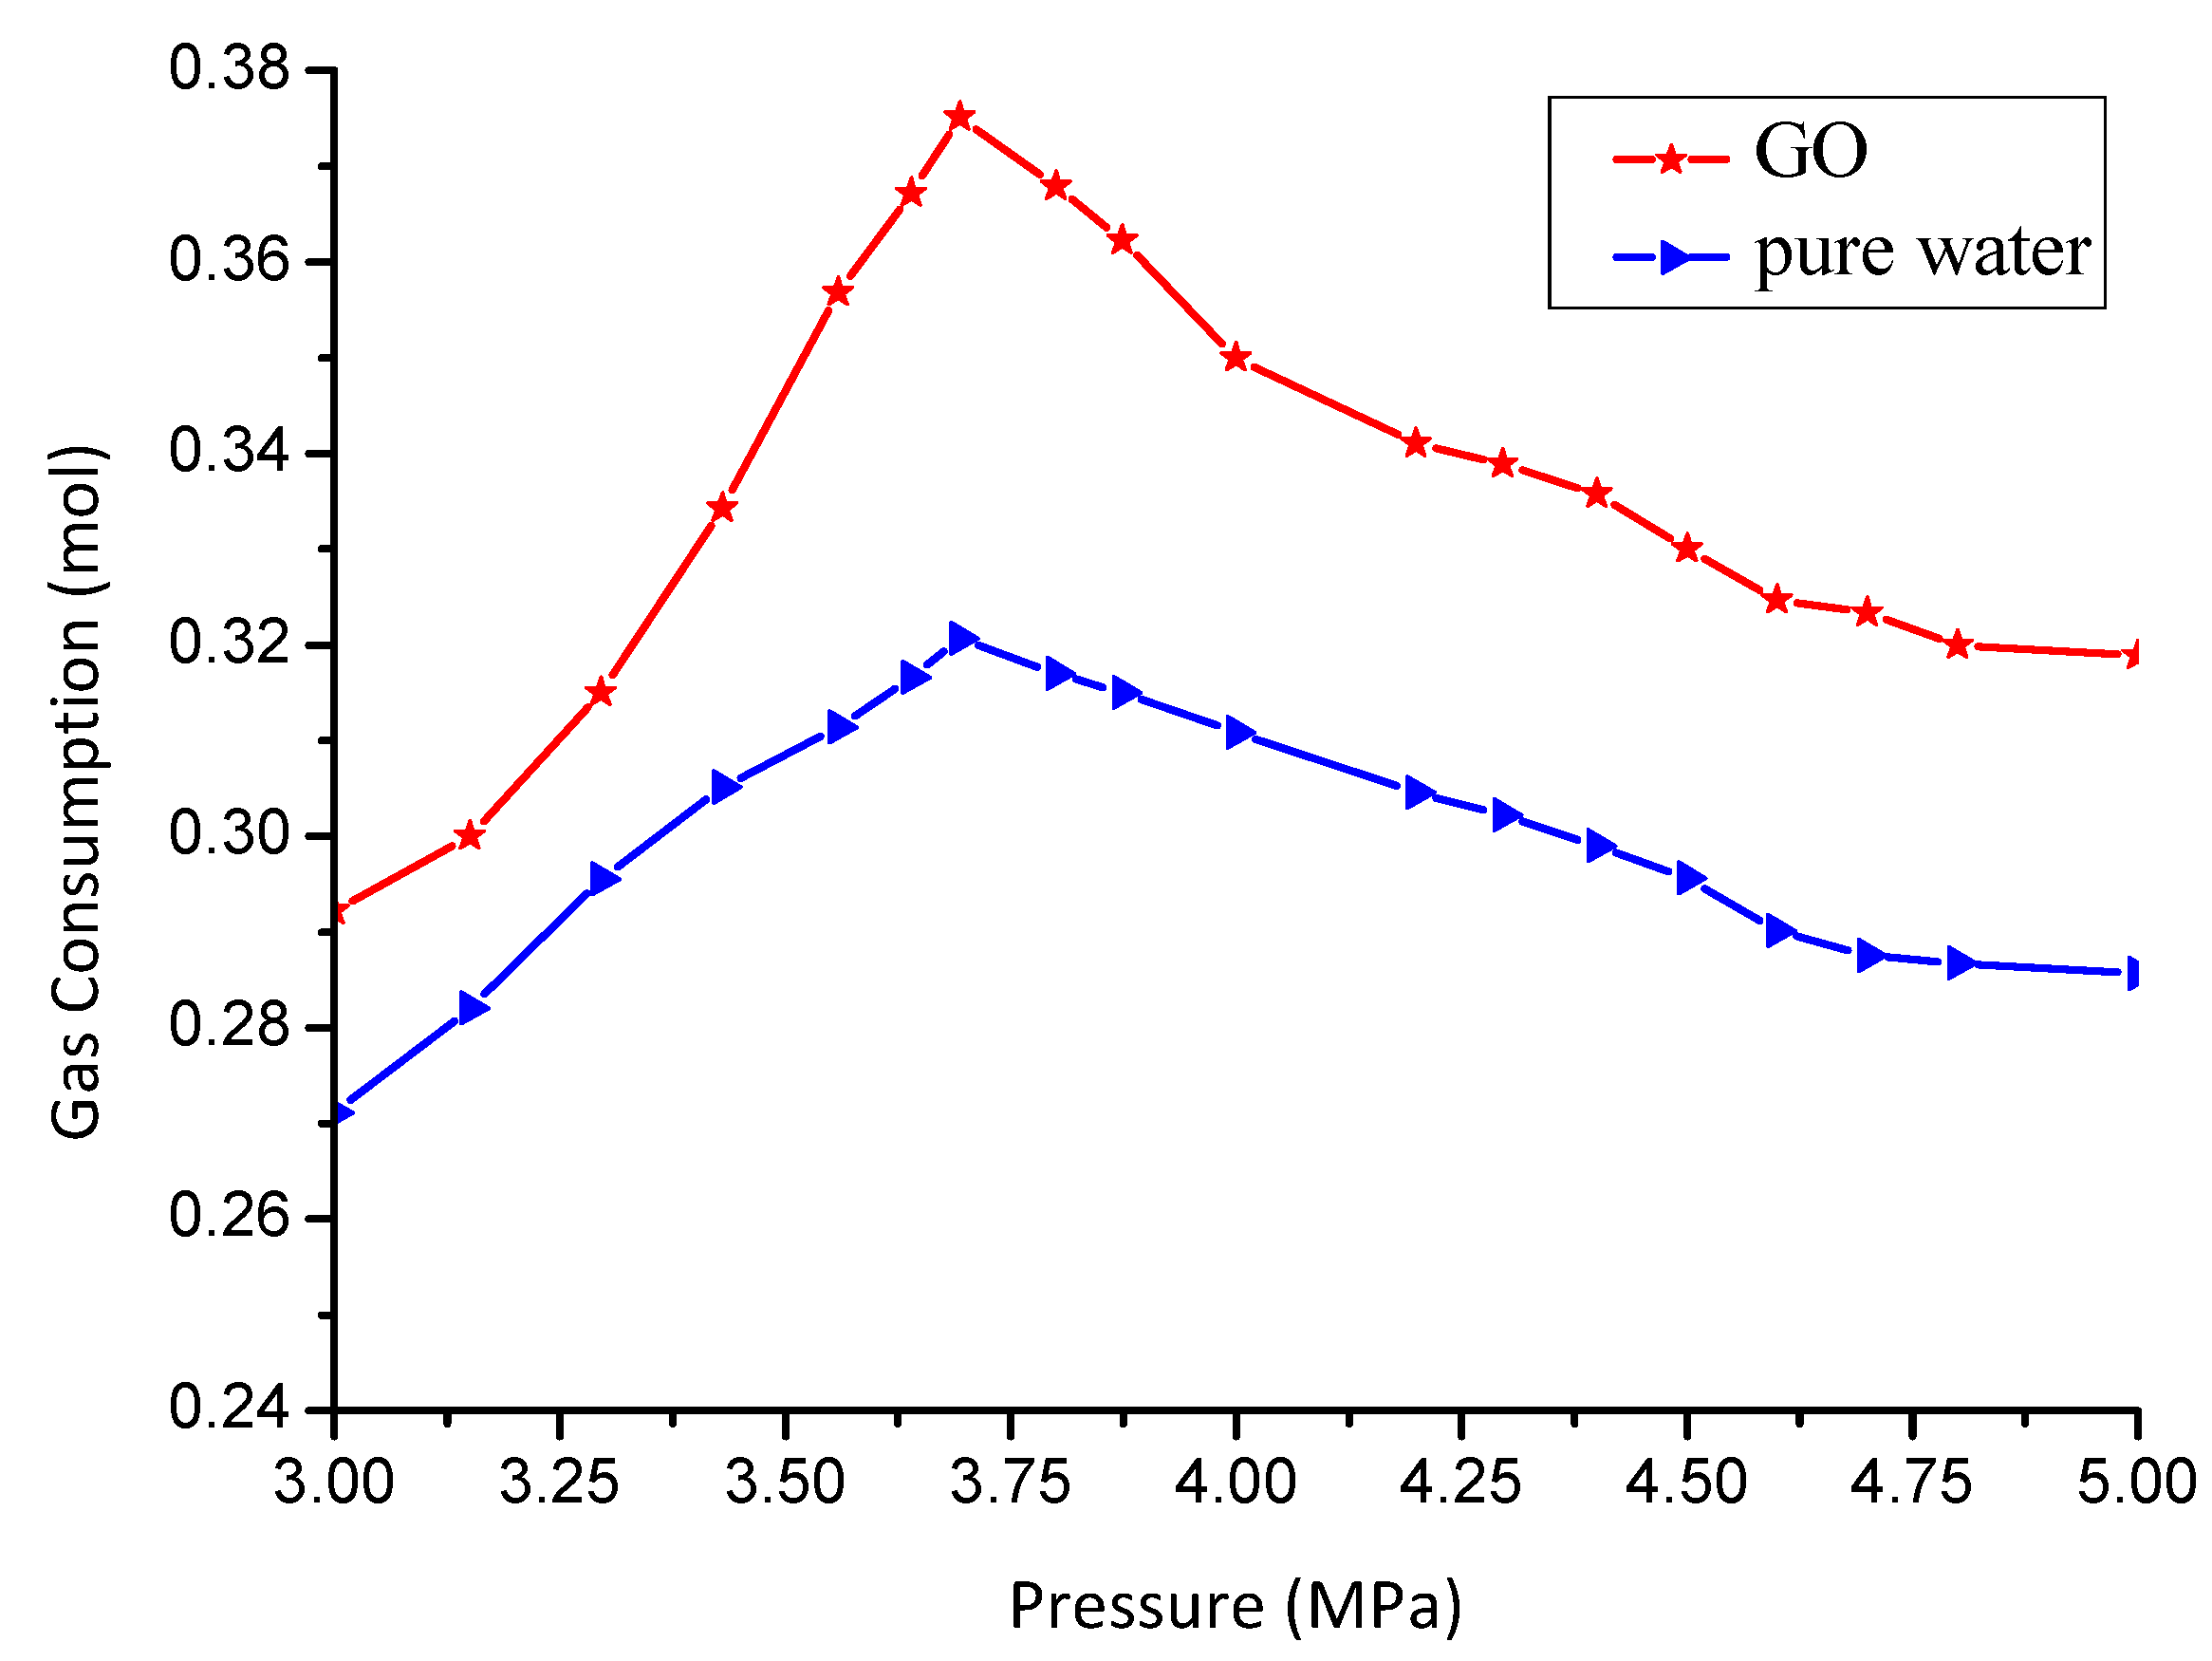
CO2 consumption was measured at different pressures at 279 K, and in pure water or in the 50 ppm concentration GO suspension with stirring. The experimental results were illustrated in Figure 6. They show that the amount of CO2 gas consumed in the GO suspension was larger (increased by 5.1–15.9%) than that in pure water under the same pressure. CO2 gas consumption in the two systems reached the maximum at 3.7 MPa and the amount of the gas consumed with additive was 0.372 mol while without it was 0.321 mol, an increase by 10.7%. When the pressure exceeded 3.7 MPa, the gas consumption curve showed a downward trend with increasing pressure. It was explained that the hydrate formation required a certain driving force which can be enhanced by the increasing system pressure or the decreasing temperature. Moreover, there was not a simple linear relation between the driving force of CO2 hydrate formation and the increasing system pressure. The change of molar Gibbs free energy varies in different gradients from quick to slow and then generally tends to gradual changes with the increase of pressure [33]. Therefore, when the pressure was high enough and the driving force was not changed yet, then the gas would be blocked into the liquid phase by a dense hydrate film which was rapidly generated at a high pressure. The dense hydrate film kept the consumption of the gas during the hydrate formation from augmenting. Hence, there is an economic and effective range of pressure that increase hydrate formation rate and the capacity of gas storage. This empirical rule still needs further research.
3.4. Effect of the GO Concentration on Promotion
GO nanoparticles can be applied to promote hydrate formation, because of their surface activity, hydrophilic modification and heat and mass transfer properties, but the promotion effects were affected by the concentration. A series of experiments on CO2 hydrate formation were carried out in pure water and in GO suspensions of different concentrations (20, 35, 50, 100, 200, 300 ppm) at 279 K and 3.8 MPa. The results are shown in Figure 7 and Figure 8. Many aspects of the influences of GO concentration were analyzed, such as the induction time variation, pressure changes, the whole reaction time, and the gas consumption.
The pressure change curves of CO2 hydrate formation process at different GO concentrations are shown in Figure 7. It clearly shows that the pressure drop amplitude during hydrate formation process in any concentrations of GO was larger than that in pure water. At the end of the hydrate formation reaction, the final pressure in pure water was 2.3 MPa, and the pressure drop amplitude was 1.5 MPa. However, the pressure drop amplitudes were 1.555, 1.64, 1.731, 1.629, 1.604 and 1.558 MPa with the increase of the GO concentrations and higher than the pure water system by 3.67–15.4%. In the first 5 min of the reaction, due to the rapid dissolution of CO2, the pressure changed sharply and the differences among curves were not obvious. After 5 min, the pressure in the GO suspension was a little lower than that in pure water, and the pressure drop amplitude increased obviously with the decrease of concentration. Through analysis, it could be interpreted in two ways. On one hand, the hydrophilic properties of GO make it easily form hydrogen bonds with water molecules, which promotes the hydration of gas in water. Besides, large numbers of nucleation sites were provided, which could improve the efficiency of gas hydrate nucleation. On the other hand, the amphiphilic GO presents a range of hydrophilic to hydrophobic properties from the edge of the graphene sheet to the center. Therefore, it can function as a surfactant to reduce the energy between interfaces, which enlarges the gas-liquid contact area, increases the gas solubility in the liquid, and improves the growth rate of hydrates. It can be known from Figure 7 that the time duration of the complete reaction was different with the change of the GO concentrations. For example, it only took 270 min to form the CO2 hydrate in the GO suspension of 50 ppm, while it required 480 min in the pure water system.
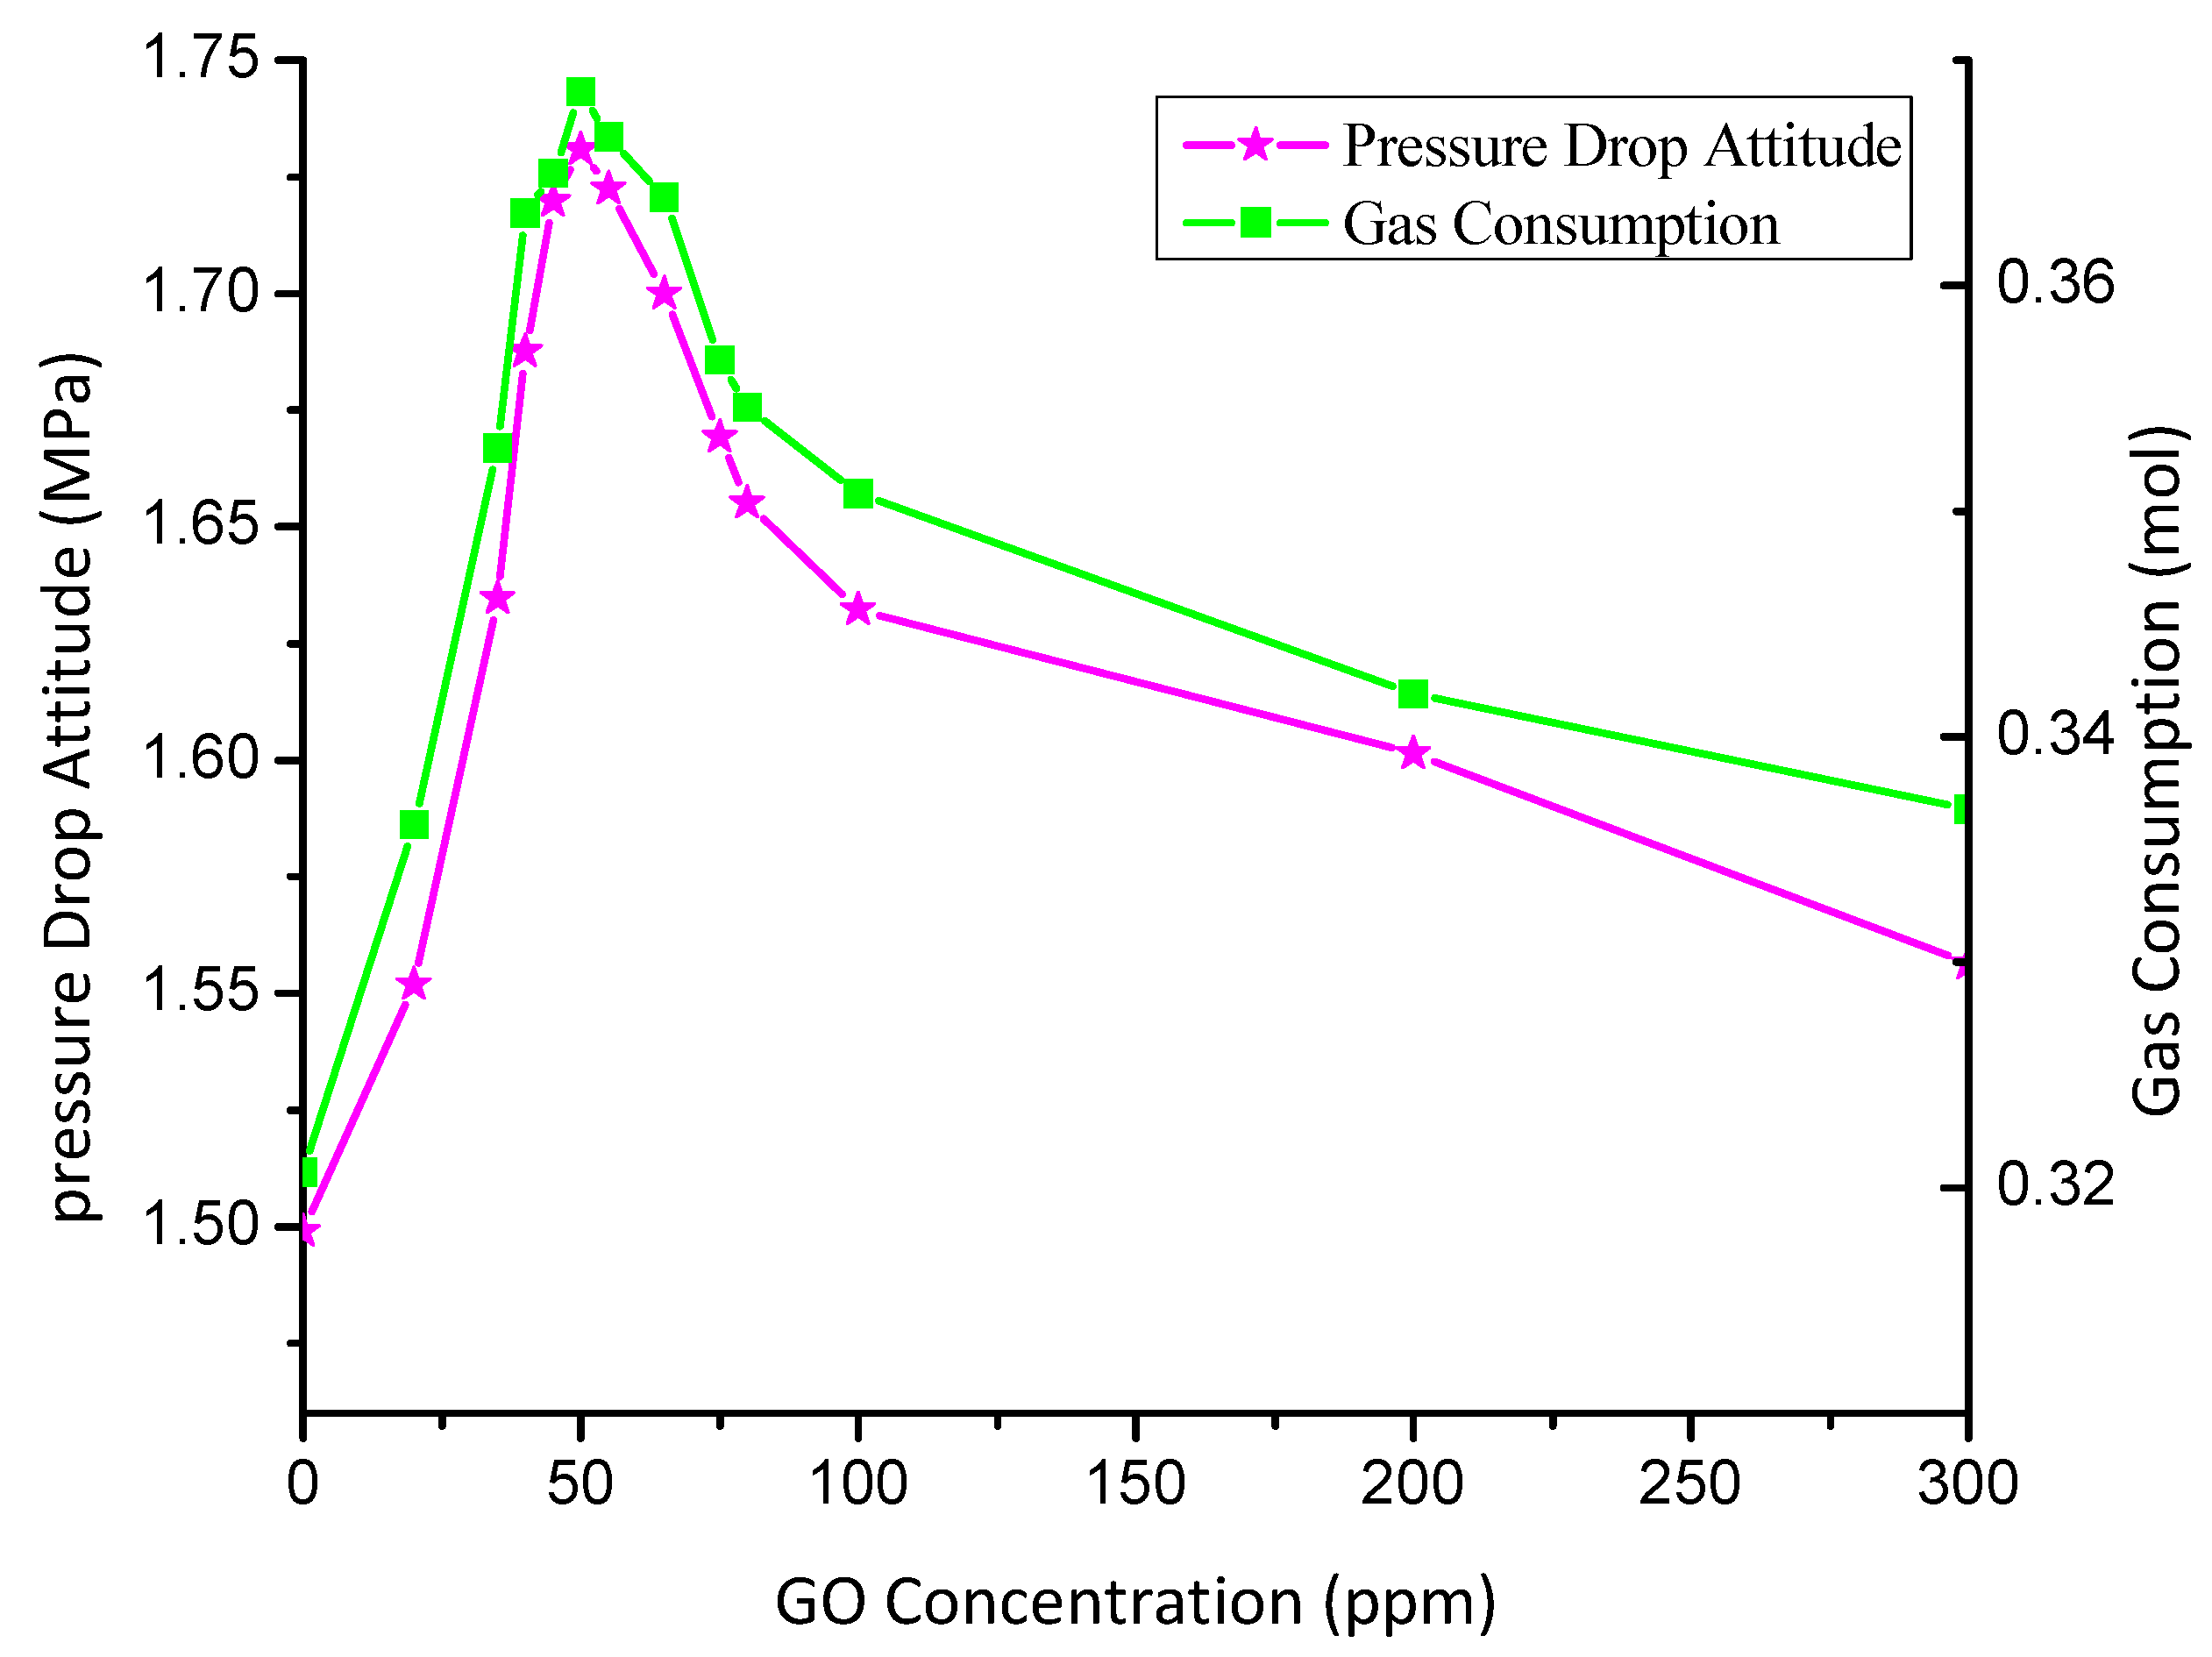
Combining Figure 4, Figure 5, Figure 6 and Figure 7, the change curves of the four parameters of CO2 hydrate formation process in different concentrations of the GO suspension were obtained, including the induction time, the formation time, the pressure drop amplitude, and the gas consumption. Figure 8 and Figure 9 show that, compared to pure water, the induction time and formation time were significantly shortened, and the pressure drop amplitude as well as gas consumption were evidently larger at different GO concentrations. Along with the change of the concentration, the change trend of the parameter curve is approximately the same. Induction time and formation time reached the minimum, which were 15 min and 270 min, respectively, at 50 ppm concentration, while the corresponding data were 70 min and 480 min in pure water. It is clearly seen that induction time was shortened by 77.14%, the formation time was reduced by nearly 1/2, and the reaction efficiency was almost doubled. The pressure drop and the gas consumption also reached the maximum in this concentration (1.731 MPa and 0.372 mol). Compared with pure water when the pressure drop achieved 1.555 MPa and the gas consumption was 0.321 mol, the pressure drop amplitude in the graphene system increased by 11.32%, whereas the gas consumption increased by 10.7%. A comprehensive analysis in the effects of GO on the four parameters during hydrate formation concluded that the concentration of 50 ppm was the optimum promotion concentration, where the hydrate nucleation rate and growth rate were the fastest and the gas consumption was also the largest.
3.5. Promotion Mechanism
From the experimental results s, it can be concluded that GO played a positive role in gas hydrate formation, and could dramatically shorten the induction time and improve gas storage capacity. The promoting characteristics of GO are determined by its microstructure. From the experimental results and analyses, the promotion mechanisms are summarized as follows:
- (1)
- GO can improve the efficiency of gas hydrate nucleation. The molecular structure of GO is characterized as an oxidized graphite monolayer, whose structure generally maintains a planar structure. It is composed of a similar aromatic ring structure formed by carbon-carbon double bonds. There are abundant hydroxyl and epoxy groups on its surface, and substantial carboxyl groups at the edge of the plane structure. These functional groups help form hydrogen bonds with water molecules, so it can promote the hydration of the gas, and can provide a lot of nucleation sites for the gas molecules. The crystal nucleation involves heterogeneous nucleation and homogeneous nucleation. The former forms the hydrate crystal nuclei more easily, because the requirements for the super-saturation and super-cooling are fairly reduced in heterogeneous nucleation system. GO nanoparticles increase the inhomogeneity of the hydrate formation system, thus providing an environment for heterogeneous nucleation, which makes it easier for hydrate nucleation.
- (2)
- GO can effectively enhance the heat transfer. Gas hydrate formation is an exothermic process, thus if reaction heat can be removed in time and effectively then the hydrate formation rate will be accelerated. The thickness of monolayer GO is about 0.7–1.6 nm [34]. Compared with the traditional surfactants and the other nanoparticles, GO has excellent features such as a great specific surface area and thermal conductivity, so the heat-transfer performance increases with the addition of GO nanoparticles. The heat generated during hydrate formation can be removed in a timely way so as to form a more uniform and more suitable temperature field. In this way, GO promotes the growth of hydrate crystal nuclei and shortens the generation period.
- (3)
- GO can enhance the mass transfer dramatically. GO is an amphipathic compound, in other words, it presents a range of hydrophilic to hydrophobic properties from the edge of graphene sheet to the center. Therefore, it can act like a surfactant to reduce the energy between the interfaces, enlarge the contact area between phases, increase the gas solubility in the liquid phase, and accelerate the hydrate growth rate. In addition, due to the large surface area, GO can better carry molecules from the gas phase into the liquid phase so as to form the hydrate crystal nucleus.
- (4)
- The diameter of a GO particle is extremely small. The tinier the particle size is, the greater the micromotion intensity will be, thus, heat and mass transfer efficiency are improved. According to the experimental results, the additive concentration also significantly influences the promoting effect in gas hydrate formation. The promotion effect of a low GO concentration was better than that of a high concentration. This could be interpreted as due to the fact that when the concentration of GO reached a certain degree, the dissolved gas and GO particles easily form micelles which would be absorbed onto the hydrate surface, leading to a reduction of the surface energy, and then it was very difficult for the gas to disperse into the liquid phase [27]. Besides, a high GO suspension concentration means that the number of particles in a unit volume of solution increased. The intermolecular interaction became stronger due to the smaller molecular spacing and the quite lower molecular weight of GO, which leads to an increased concentration and viscosity of the solution, and even contributes to the phenomena of agglomeration and precipitation. In the end, the heat and mass transfer efficiency of the interfaces were severely reduced. However, a high concentration of GO suspension was not conducive to enhanced gas solubility and promotion of crystal nucleus growth, therefore, there exists an optimal GO concentration that best promotes gas hydrate formation.
4. Conclusions
In this research, the use of nanosized GO to promoting CO2 hydrate formation was proposed. The effects of GO concentration on CO2 hydrate formation rate and the changes in temperature, pressure, induction time, gas consumption were thoroughly investigated. Through detailed analysis, a conclusion was drawn that GO can effectively promote CO2 hydrate formation.
In comparison with the pure water system, the induction time in GO nanofluids was shortened by 53–74.3%, and the maximum gas consumption increased by 5.1–15.9%. GO has a double promoting effect on the gas hydrate formation as both a nanoparticle and surfactant. However, because of the extremely small size of GO, when the concentration of the GO suspension exceeds a certain value, the intermolecular interactions become larger, which lead to an increased concentration and viscosity of the solution, and results in a decrease in the efficiency of the heat and mass transfer between the interfaces. Thereby, the optimum promotion concentration of 50 ppm was determined by comparison for the conditions where induction time and formation time were the minimum, and the pressure drop as well as the gas consumption reached their maximum values. As a hydrate formation promoter, GO with its huge specific surface area and excellent heat and mass transfer characteristics not only can accelerate the heat transfer efficiency, but also balance the system temperature during the reaction. The heat generated in the hydrate formation can be transferred out in a timely way so as not to influence the hydrate growth. There are abundant oxygen-containing functional groups, such as hydroxyl, carboxyl and epoxy groups on the surface of the GO molecules. They have excellent hydrophilic properties and can increase the dissolution rate of the gas into the liquid phase. These functional groups also help to form hydrogen bonds with water molecules, which can decrease the induction time and formation time of gas hydrates, increase gas consumption and the gas storage capacity.
Compared with the traditional kinetic promoters and the thermodynamic promoters, GO has many advantages in promoting the formation of gas hydrates, its promotion effect is remarkable and the dosage required is very small. Nowadays, SDS and SDBS are popularly used to promote hydrate formation, but SDS and SDBS are both toxic to humans and the environment, but GO is considered harmless to human beings and the environment, so it has the advantage of environmental friendliness. As the experimental results showed, the optimum concentration of GO was 50 ppm, which was 6–14 times lower than that of SDBS (0.3–0.7 g/L) [35]. Compared with the metal nanoparticles and metal oxide particles, the molecular weight of GO is small, which can reduce the load of experimental equipment in practical applications and GO nanofluids can hence be applied to promote effective, economic and environmentally friendly hydrate formation.
Author Contributions
All the authors contributed to publish this paper. S.Y., W.D., S.W., Y.R. and S.Z. conceived and designed the experiments; S.Y., W.D. and S.W. performed the experiments and wrote the paper; S.Y., W.D., S.W., Y.R. and S.Z. prepared for the experiments and analyzed the data.
Acknowledgments
This research was financially supported by the National Natural Science Foundation of China [grant numbers 51574045].
Conflicts of Interest
The authors declare no conflict of interest.
References
- Rodrigues, C.F.A.; Dinis, M.A.P.; de Sousa, M.J.L. Review of European energy policies regarding the recent “carbon capture, utilization and storage” technologies scenario and the role of coal seams. Environ. Earth Sci. 2015, 74, 2553–2561. [Google Scholar] [CrossRef]
- Park, S.; Lee, S.; Lee, Y.; Lee, Y.; Seo, Y. Hydrate-based pre-combustion capture of carbon dioxide in the presence of a thermodynamic promoter and porous silica gels. Int. J. Greenh. Gas Control 2013, 14, 193–199. [Google Scholar] [CrossRef]
- Ricaurte, M.; Dicharry, C.; Broseta, D.; Renaud, X.; Torré, J.P. CO2 removal from a CO2–CH4 gas mixture by clathrate hydrate formation using THF and SDS as water-soluble hydrate promoters. Ind. Eng. Chem. Res. 2013, 52, 899–910. [Google Scholar] [CrossRef]
- Li, A.; Jiang, L.; Tang, S. An experimental study on carbon dioxide hydrate formation using a gas-inducing agitated reactor. Energy 2017, 134, 629–637. [Google Scholar] [CrossRef]
- Lv, Q.N.; Li, X.S.; Xu, C.G.; Chen, Z.Y. Experimental investigation of the formation of cyclopentane-methane hydrate in a novel and large-size bubble column reactor. Ind. Eng. Chem. Res. 2012, 51, 5967–5975. [Google Scholar] [CrossRef]
- Rossi, F.; Filipponi, M.; Castellani, B. Investigation on a novel reactor for gas hydrate production. Appl. Energy 2012, 99, 167–172. [Google Scholar] [CrossRef]
- Moeini, H.; Bonyadi, M.; Esmaeilzadeh, F.; Rasoolzadeh, A. Experimental study of sodium chloride aqueous solution effect on the kinetic parameters of carbon dioxide hydrate formation in the presence/absence of magnetic field. J. Nat. Gas Sci. Eng. 2018, 150, 231–239. [Google Scholar] [CrossRef]
- Park, S.S.; Kim, N.J. Study on methane hydrate formation using ultrasonic waves. J. Ind. Eng. Chem. 2013, 19, 1668–1672. [Google Scholar] [CrossRef]
- Da Silva Lirio, C.F.; Pessoa, F.L.P.; Uller, A.M.C. Storage capacity of carbon dioxide hydrates in the presence of sodium dodecyl sulfate (SDS) and tetrahydrofuran (THF). Chem. Eng. Sci. 2013, 96, 118–123. [Google Scholar] [CrossRef]
- Li, R.; Li, X.S.; Chen, Z.Y.; Zhang, Y.; Xu, C.G.; Xia, Z.M. Anti-Agglomerator of Tetra-n-Butyl Ammonium Bromide Hydrate and Its Effect on Hydrate-Based CO2 Capture. Energies 2018, 11, 399. [Google Scholar] [CrossRef]
- Wang, F.; Jia, Z.Z.; Luo, S.J.; Fu, S.F.; Wang, L.; Shi, X.S.; Guo, R.B. Effects of different anionic surfactants on methane hydrate formation. Chem. Eng. Sci. 2015, 137, 896–903. [Google Scholar] [CrossRef]
- Zhu, D.; Li, X.; Wang, N.; Wang, X.; Gao, J.; Li, H. Dispersion behavior and thermal conductivity characteristics of Al2O3–H2O nanofluids. Curr. Appl. Phys. 2009, 9, 131–139. [Google Scholar] [CrossRef]
- Fotukian, S.M.; Esfahany, M.N. Experimental study of turbulent convective heat transfer and pressure drop of dilute CuO/water nanofluid inside a circular tube. Int. Commun. Heat Mass 2010, 37, 214–219. [Google Scholar] [CrossRef]
- Pineda, I.T.; Lee, J.W.; Jung, I.; Kang, Y.T. CO2 absorption enhancement by methanol-based Al2O3, and SiO2 nanofluids in a tray column absorber. Int. J. Refri. 2012, 35, 1402–1409. [Google Scholar] [CrossRef]
- Jung, J.Y.; Lee, J.W.; Kang, Y.T. CO2 absorption characteristics of nanoparticle suspensions in methanol. J. Mech. Sci. Technol. 2012, 26, 2285–2290. [Google Scholar] [CrossRef]
- Lee, J.W.; Kang, Y.T. CO2 absorption enhancement by Al2O3 nanoparticles in NaCl aqueous solution. Energy 2013, 53, 206–211. [Google Scholar] [CrossRef]
- Haghtalab, A.; Mohammadi, M.; Fakhroueian, Z. Absorption and solubility measurement of CO2 in water-based ZnO and SiO2 nanofluids. Fluid Phase Equilib. 2015, 392, 33–42. [Google Scholar] [CrossRef]
- Prasad, P.S.; Chari, V.D.; Sharma, D.V.; Murthy, S.R. Effect of silica particles on the stability of methane hydrates. Fluid Phase Equilib. 2012, 318, 110–114. [Google Scholar] [CrossRef]
- Li, J.; Liang, D.; Guo, K.; Wang, R.; Fan, S. Formation and dissociation of HFC134a gas hydrate in nano-copper suspension. Energy Convers. Manag. 2006, 47, 201–210. [Google Scholar] [CrossRef]
- Najibi, H.; Shayegan, M.M.; Heidary, H. Experimental investigation of methane hydrate formation in the presence of copper oxide nanoparticles and SDS. J. Nat. Gas Sci. Eng. 2015, 23, 315–323. [Google Scholar] [CrossRef]
- Aliabadi, M.; Rasoolzadeh, A.; Esmaeilzadeh, F.; Alamdari, A. Experimental Study of Using CuO Nanoparticles as a Methane Hydrate Promoter. J. Nat. Gas Sci. Eng. 2015, 27, 1518–1522. [Google Scholar] [CrossRef]
- Arjang, S.; Manteghian, M.; Mohammadi, A. Effect of synthesized silver nanoparticles in promoting methane hydrate formation at 4.7 MPa and 5.7 MPa. Chem. Eng. Res. Des. 2013, 91, 1050–1054. [Google Scholar] [CrossRef]
- Chari, V.D.; Sharma, D.V.; Prasad, P.S.; Murthy, S.R. Methane hydrates formation and dissociation in nano silica suspension. J. Nat. Gas Sci. Eng. 2013, 11, 7–11. [Google Scholar] [CrossRef]
- Mohammadi, A.; Manteghian, M.; Haghtalab, A.; Mohammadi, A.H.; Rahmati-Abkenar, M. Kinetic study of carbon dioxide hydrate formation in presence of silver nanoparticles and SDS. Chem. Eng. J. 2014, 237, 387–395. [Google Scholar] [CrossRef]
- Park, S.S.; An, E.J.; Lee, S.B.; Chun, W.G.; Kim, N.J. Characteristics of methane hydrate formation in carbon nanofluids. J. Ind. Eng. Chem. 2012, 18, 443–448. [Google Scholar] [CrossRef]
- Nesterov, A.N.; Reshetnikov, A.M.; Manakov, A.Y.; Rodionova, T.V.; Paukshtis, E.A.; Asanov, I.P.; Bulavchenko, A.I. Promotion and inhibition of gas hydrate formation by oxide powders. J. Mol. Liq. 2015, 204, 118–125. [Google Scholar] [CrossRef]
- Choi, J.W.; Chung, J.T.; Kang, Y.T. CO2 hydrate formation at atmospheric pressure using high efficiency absorbent and surfactants. Energy 2014, 78, 869–876. [Google Scholar] [CrossRef]
- Mohammadi, M.; Haghtalab, A.; Fakhroueian, Z. Experimental study and thermodynamic modeling of CO2 gas hydrate formation in presence of zinc oxide nanoparticles. J. Chem. Thermodyn. 2016, 96, 24–33. [Google Scholar] [CrossRef]
- Kakati, H.; Mandal, A.; Laik, S. Promoting effect of Al2O3/ZnO based nanofluids stabilized by SDS surfactant on CH4+C2H6+C3H8 hydrate formation. J. Ind. Eng. Chem. 2016, 35, 357–368. [Google Scholar] [CrossRef]
- Zhang, F.; Wang, L.; Yu, S.; Mao, L.; Wang, G. Preparation and properties of graphene oxide and theirthermal conductivity nanofluids. Func. Mater. 2015, 46, 16138–16141. [Google Scholar] [CrossRef]
- Peng, D.Y.; Robinson, D.B. A new two-constant equation of state. Ind. Eng. Chem. Fundam. 1976, 15, 92–94. [Google Scholar] [CrossRef]
- Yaodi, M. Method for determining gas compression factor in engineering design. Chem. Eng. Des. 2006, 16, 17–18. [Google Scholar]
- Ye, P.; Liu, D.P.; Shi, J.J. Study on driving force for carbon dioxide hydrate formation. Nat. Gas. Chem. Ind. 2013, 2, 38–41. [Google Scholar] [CrossRef]
- Lai, Q.; Luo, X. Qualitative and Quantitative Analysis of Graphene Oxides by UV Spectroscopy. Chin. J. Mater. Res. 2015, 2, 155–160. [Google Scholar]
- Li, Y.; Zhu, C.; Wang, W. Promoting Effects of Surfactants on Carbon Dioxide Hydrate Formation and Kinetics. Petrochem. Technol. 2012, 41, 699–703. [Google Scholar]
Figure 1.
Schematic diagram of experimental apparatus.
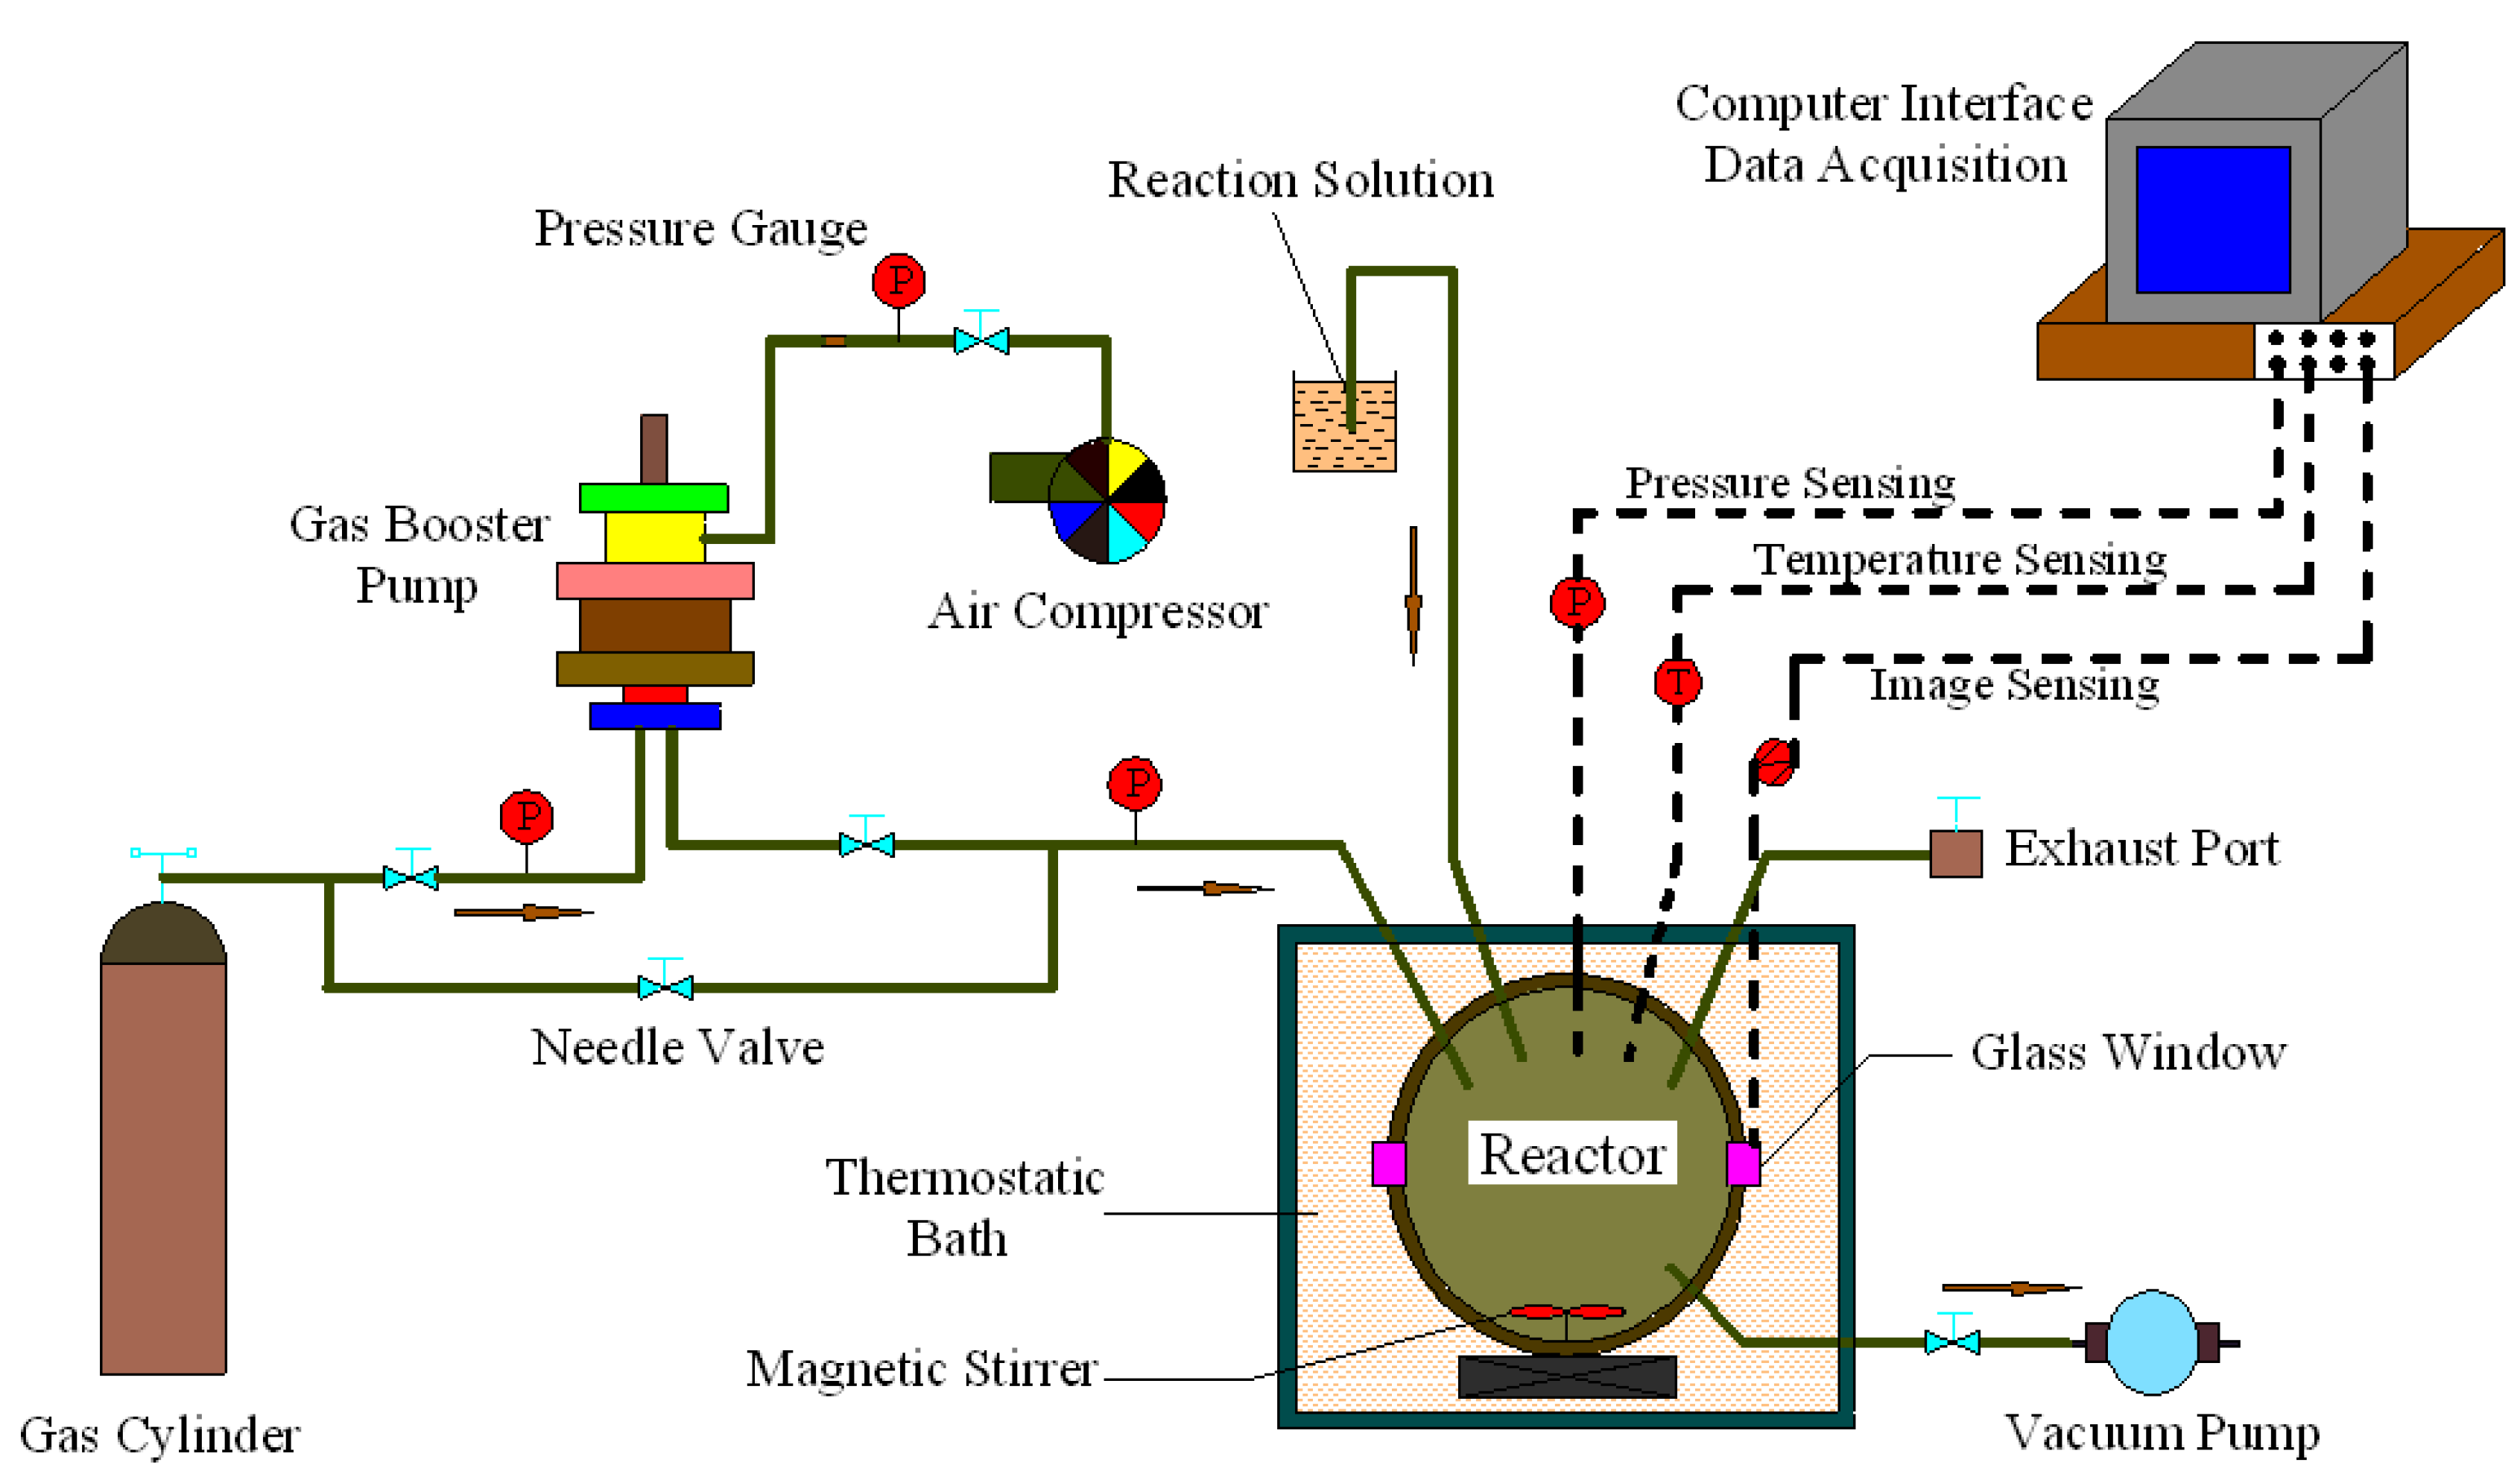
Figure 2.
Temperature-pressure-time variation for CO2 hydrate formation with GO.

Figure 3.
Macroscopic observation of CO2 hydrate formation with GO at 279 K and 3.8 MPa, (a) the initial stage; (b) the nucleation stage; (c) the growth stage; (d) the final stage.
Figure 3.
Macroscopic observation of CO2 hydrate formation with GO at 279 K and 3.8 MPa, (a) the initial stage; (b) the nucleation stage; (c) the growth stage; (d) the final stage.
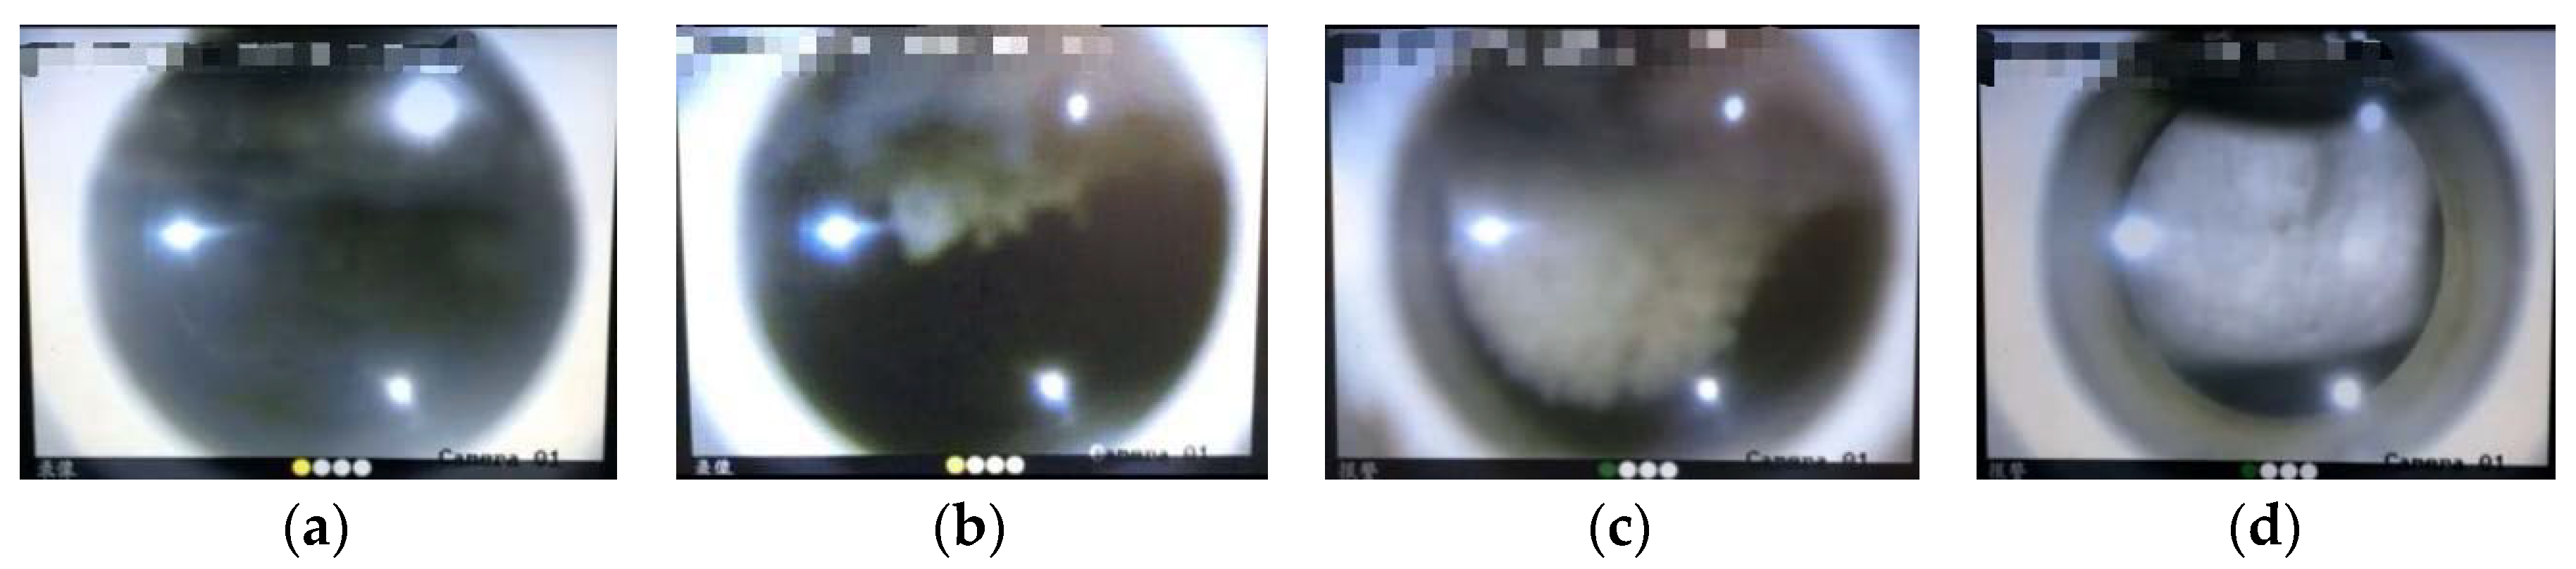
Figure 4.
Observed pressure versus time trajectories showing CO2 hydrate formation within initial 75 min.
Figure 4.
Observed pressure versus time trajectories showing CO2 hydrate formation within initial 75 min.

Figure 5.
Induction time in different initial pressures with GO or pure water at 279 K.

Figure 6.
Gas consumption in the GO or pure water system at 279 K and different pressures.

Figure 7.
Pressure change curves of CO2 hydrate formation in the different concentrations of GO.

Figure 8.
The effect of GO concentrations on pressure drop attitude and gas consumption.

Figure 9.
The effect of GO concentrations on introduction time and formation time.

© 2018 by the authors. Licensee MDPI, Basel, Switzerland. This article is an open access article distributed under the terms and conditions of the Creative Commons Attribution (CC BY) license (http://creativecommons.org/licenses/by/4.0/).
Share and Cite
MDPI and ACS Style
Yan, S.; Dai, W.; Wang, S.; Rao, Y.; Zhou, S. Graphene Oxide: An Effective Promoter for CO2 Hydrate Formation. Energies 2018, 11, 1756. https://doi.org/10.3390/en11071756
AMA Style
Yan S, Dai W, Wang S, Rao Y, Zhou S. Graphene Oxide: An Effective Promoter for CO2 Hydrate Formation. Energies. 2018; 11(7):1756. https://doi.org/10.3390/en11071756
Chicago/Turabian StyleYan, Shuo, Wenjie Dai, Shuli Wang, Yongchao Rao, and Shidong Zhou. 2018. "Graphene Oxide: An Effective Promoter for CO2 Hydrate Formation" Energies 11, no. 7: 1756. https://doi.org/10.3390/en11071756
Note that from the first issue of 2016, this journal uses article numbers instead of page numbers. See further details here.