An Investment Feasibility Analysis of CCS Retrofit Based on a Two-Stage Compound Real Options Model


Department of Economics and Management, North China Electric Power University, Huadian Road No. 689, Baoding 071003, China
*
Author to whom correspondence should be addressed.
Energies 2018, 11(7), 1711; https://doi.org/10.3390/en11071711
Submission received: 7 May 2018
/
Revised: 27 June 2018
/
Accepted: 28 June 2018
/
Published: 1 July 2018
Abstract
:Carbon capture and storage (CCS) technology is an attractive technique to help power enterprises with carbon emission reduction. In this paper, a two-stage CCS retrofit investment in an existing coal-fired power plant in China including the first stage (demonstration project) and second stage (commercial operation) is taken as a case to decide when and whether to invest. Distinguished from previous models, a binomial lattice compound real options model including the options to defer and expand is established. Further, the accounting approaches to certified emission reductions (CERs) based on the thermodynamics principle are first proposed concerning this model. We find the total invest value under compound options model is less than zero, although greater than that by NPV method. The results indicate carbon prices and subsidy policy, respectively, play a dominating role in initiating the CCS investment at the first and second stage. The growth in government subsidy at the first stage has obviously greater effects on decreasing critical carbon trading prices. Besides, the minimum critical carbon price is 87.09 RMB/ton with full subsidy, greater than the current price (56 RMB/ton). This also illustrates it is not the optimal occasion to invest in a CCS retrofit project for power enterprises.
1. Introduction
China has now become the largest CO2 emitter in the world [1]. Based on the International Energy Agency (IEA), CO2 emissions caused by fuel combustion in China increased to 9134.9 Mt in 2014, 333% growth compared with 1990. Especially, power generation from coal combustion was responsible for 47% total CO2 emissions. Referring to the China Electricity Council, the generation capacity of coal-fired power plants in 2016 was 4288.6 TWh, accounting for 71.6% of the whole generation capacity [2]. In general, the development tendency of coal-fired power is still steadily rising. It is believed that this trend is expected to last owing to increasing energy consumption [3,4,5,6].
Currently, developing renewable energy is the mainstream method for achieving emission reduction. Most renewable energy could be considered clean because of no direct carbon emissions during its using process. According to statistics by National Energy Administration, while using renewable energy generates electricity instead of coal, each 1 kWh can reduce CO2 emissions by 0.7–0.85 kg. During 12th Five-Year period, there are 7 billion tons of emission reduction achieved by renewable energy power generation, which is expected to be 14 billion tons with generating totally 1.9 trillion kWh electricity by renewable energy (hydro, wind, solar and biomass energy) during the 13th Five-Year period [7]. Although the carbon reduction effect with renewable energy is obvious, they fail to substitute for fossil energy absolutely due to technical limitation, resource endowment and large energy demand: development of new energy resources such as solar energy, wind energy and biomass energy are always restricted by technology and environmental conditions as well as low efficiency and high cost; the scale of hydropower is limited by environmental conditions and safety issues [8]. Given the potential huge power energy demand, Intergovernmental Panel on Climate Change (IPCC) and IEA both consider carbon capture and storage (CCS) technology as the critical mitigation measure in both developed and developing countries that highly depend on fossil fuels [9]. CCS technology has the advantage because of its non-intricate business relationship and almost zero emission compared with contract energy management and electric vehicles [8]. With the coal share of electricity mix being 60% in 2020, CCS retrofit has been deemed as an attractive emission mitigation alternative for coal-fired power industry [10]. There is great potential for CCS implementation in China including immense government support [3,11], coal-dominated energy structure [12] and large geological storage capacity [13].
Many scholars have paid attention to the overall circumstances for development tendency, benefits and problems of CCS implementation. Ming et al. [8] used SWOT (Strengths, Weaknesses, Opportunities and Threats) method to demonstrate that CCS technology was a sound and workable way to curtail CO2 emissions with the huge market and imperfect policy. Huaman and Jun [14] analyzed global CCS technology activities such as Large Scale Integrated Projects (LSIP) and showed the urgency of CCS demonstration in the world. Li et al. [15] elaborated on technology maturity and sustainability, and external factors of carbon capture, utilization, and storage (CCUS) in China. Lai et al. [16] studied the CCS innovation system, demonstrating knowledge development of CCS performed well in China, but technology diffusion and market creation were relatively weak.
Considering strengths and weaknesses, power enterprises are faced with irreversibility, uncertainty and flexibility of CCS investment [17]. The irreversibility means the CCS project will be transferred into huge sunk cost once carried out. As CCS is still in the early stage of technological development, the investment in it possesses considerable uncertainties. The high uncertainty from the CCS investment denotes volatile CO2 prices and fuel prices, electricity tariff, power plant lifetime, investment cost, operation and maintenance (O&M) cost, government incentive, technological feasibility, etc., all of which affect investment to different degrees [18,19]. Flexibility means the timing of CCS retrofit investment is flexible, which has an economic value during the decision-making period [3]. Therefore, it is crucial to have a thorough grasp of investment condition and select an appropriate decision-making approach to reduce risk.
There exist many traditional methods to assess renewable energy projects, including net present value (NPV), internal rate of return (IRR), return on investment, payback period, benefit–cost ratio, etc., of which the NPV method is commonly used to evaluate these investments [20]. Specifically, many scholars used net present value (NPV) method to evaluate CCS retrofit investment previously [9,21,22,23,24,25,26,27]. The NPV means the sum of the present value of all cash flows produced by the project, and the decision criterion to implement the project is NPV>0. Nevertheless, it could be non-profitable under NPV rules when neglecting the irreversibility of sunk-cost, the uncertainty related to future cash flows, and the flexible opportunity of CCS retrofit timing, which would underrate the investment value based on static information [17,28]. Thus, traditional valuation methods are unsuitable for evaluating power generation investments [20]. Different from above methods, real options approach (ROA) remedies intrinsic deficiencies of NPV method and is appropriate for various energy projects with the following characteristics: (1) high uncertainty; (2) great managerial flexibility; and (3) NPV near zero [29]. The ROA reformulates the NPV so that the scenarios of great uncertainty, which compose the investments, are considered. The total investment value (TIV) considering real options is the sum of the static NPV and the value caused by management flexibility. The decision criterion of ROA is TIV > 0.
ROA considers investors’ choice subject to flexibility when uncertainty and irreversibility exist. Enterprises have the right to decide whether to invest CCS, so reducing risk and obtaining additional value of uncertainty [20]. Heydari et al. [30] developed a real options model in either full CCS or partial CCS retrofits taking uncertain electricity, CO2 and coal prices into account and concluded the optimum stopping boundaries were dramatically sensitive to carbon price volatility. Eckhause and Herold [31] employed a stochastic dynamic programming to obtain optimal funding schemes for project option of full-scale carbon capture plants in EU. By using dynamic programming and Monte Carlo simulation, Zhou et al. [3] discussed policy uncertainty described by stochastic carbon price under three representative types of technology to determine the best strategy for investing CCS in China. Chen et al. [4] obtained impacts of subsidy for electricity on CCS investment and coactions between carbon market and subsidy policy under uncertainties of carbon, coal and electricity prices based on Monte Carlo simulation. The investment irreversibility in CCS retrofit implies an option to defer, similar to an American financial call option. On this occasion, discrete real options model, i.e., binomial or multinomial lattice model has an advantage over continuous model due to its greater application for American options and other more complex types of options, and is usually employed to assess CCS investment [17,19,32,33].
Reviewing existing literature, research on CCS retrofit valuation under ROA has been mainly conducted on the single option model for the carbon capture phase and only considered as a call option. In reality, CCS retrofit is a series of investment decision-making processes including initial demonstration project stage and subsequent commercial operation stage, with obvious multi-stage characteristics [34,35,36,37]. Each stage contains diverse kinds of options, with each option having a certain spatial and temporal structure of dynamic correlation and mutual influence [38,39,40]. Sequential investment decisions consist of a series of real options with embedded managerial flexibility. These multi-stage compound real options are comprised of mutually related investment opportunities: the early upstream investment engenders potential downstream investment opportunity; meanwhile, the downstream investment opportunity demands the acceptance of the upstream investment [41]. Each option in different stages is interrelated, and the total value of the project investment cannot be equal to the simple addition of the individual option values [42].
Specifically, the CCS investment decision-making is a dynamic sequential process [43]. These two stages of CCS retrofit investment are independent and interrelated. The power enterprise should decide whether to continue or change the scale of investment after each stage of investment is completed [44]. It is apparent that CCS retrofit investment project has strong characteristics of compound real options. Therefore, it is beneficial and necessary to assess CCS retrofit project with compound ROA to conduct a more comprehensive evaluation. However, to the authors’ best knowledge, there is no previous work employing a compound real options model to evaluate CCS retrofit investment.
Moreover, all of the previous studies use different emission factors to estimate certified emission reductions (CERs), critical data in the evaluation model, based on different power generation unit types (for example, 900 g/kWh [4,18], 893 g/kWh [10,17], and 762 g/kWh [19]). However, this will fail to consider discrepancies in CO2 emissions caused by a specific coal-fired power plant using different kinds of fuel and accounting ways, and CO2 emissions generated from desulfurization process may be neglected. Therefore, it is necessary to use special calculation method of CERs considering specific power plants, to make the whole investment feasibility analysis results more accurate.
To contribute to filling the gaps in the existing studies, we conducted this study from the following aspects. Firstly, a sequential two-stage compound real options model using binomial lattice method was established to value the CCS retrofit investment in an existing coal-fired power plant in China. Three types of CO2 emission accounting approaches based on diverse conditions were proposed to calculate CERs instead of estimate, which make the options model more realistic and results obtained more precise. Secondly, we considered the uncertainties not only from external factors but also from technology itself including: government subsidy, carbon price, coal price, investment and O&M cost. Finally, the model considered the value of total options. Here, we discuss the impacts of government subsidy under different scenarios at each stage on the critical carbon price to invest in CCS project, which is helpful to the determination of when and whether to invest. Moreover, the focus was on determining respective decisive influential factors of initiating the CCS investment at each period. This can be instructive to formulate corresponding policy to offer an incentive to invest.
Therefore, this paper sheds light on the current research in following points. It is the first try to establish a compound real options model to evaluate CCS investment feasibility for power plants, which has the typical two-stage investment characteristics, to conduct a more comprehensive and suitable evaluation than previous single option models. Second, by exploring the relationship between two options and their mutual influence on investment decision-making, we first determine respective decisive factors of initiating CCS retrofit investment at each stage. Then, we discuss the impact of subsidy policy on total investment value and critical carbon prices in different scenarios of government subsidies. Third, we present a brief flue gas treatment process equipped with a post-combustion CCS system in a coal-fired power unit. The highlight is that calculation approaches of CERs under different conditions using the thermodynamics principle are distinguished from previous estimation methods for CERs to make analysis results more accurate. The results obtained would be particularly useful in providing appropriate timing for investment decisions under uncertainty as well as information for power enterprises’ CCS technology evaluation and related policy-making.
2. Method
CCS investment process is dynamic sequential and can be divided into two stages: (1) demonstration project stage; and (2) commercial operation stage. Four kinds of uncertainties are considered: government subsidy, carbon price, coal price, investment and O&M cost. At the first stage, CCS technology is not yet mature, with carbon trading market inefficient and government policy not clear. Thus, large uncertainties exist in the carbon prices, investment cost, government subsidies, etc. Thus, this stage of CCS investment can be regarded as a call option to delay. At the second stage, CCS technology becomes more mature manifested by increasing capture rate, declining O&M cost, and additional commercial utility income. Thus, the power plant will gain the future growth of the option value. These two stages of CCS retrofit investment are independent as well as interrelated: the early investment determines the investment time and scale in the post-stage decision-making; and the existence of the latter can exert an influence on the value of previous investment.
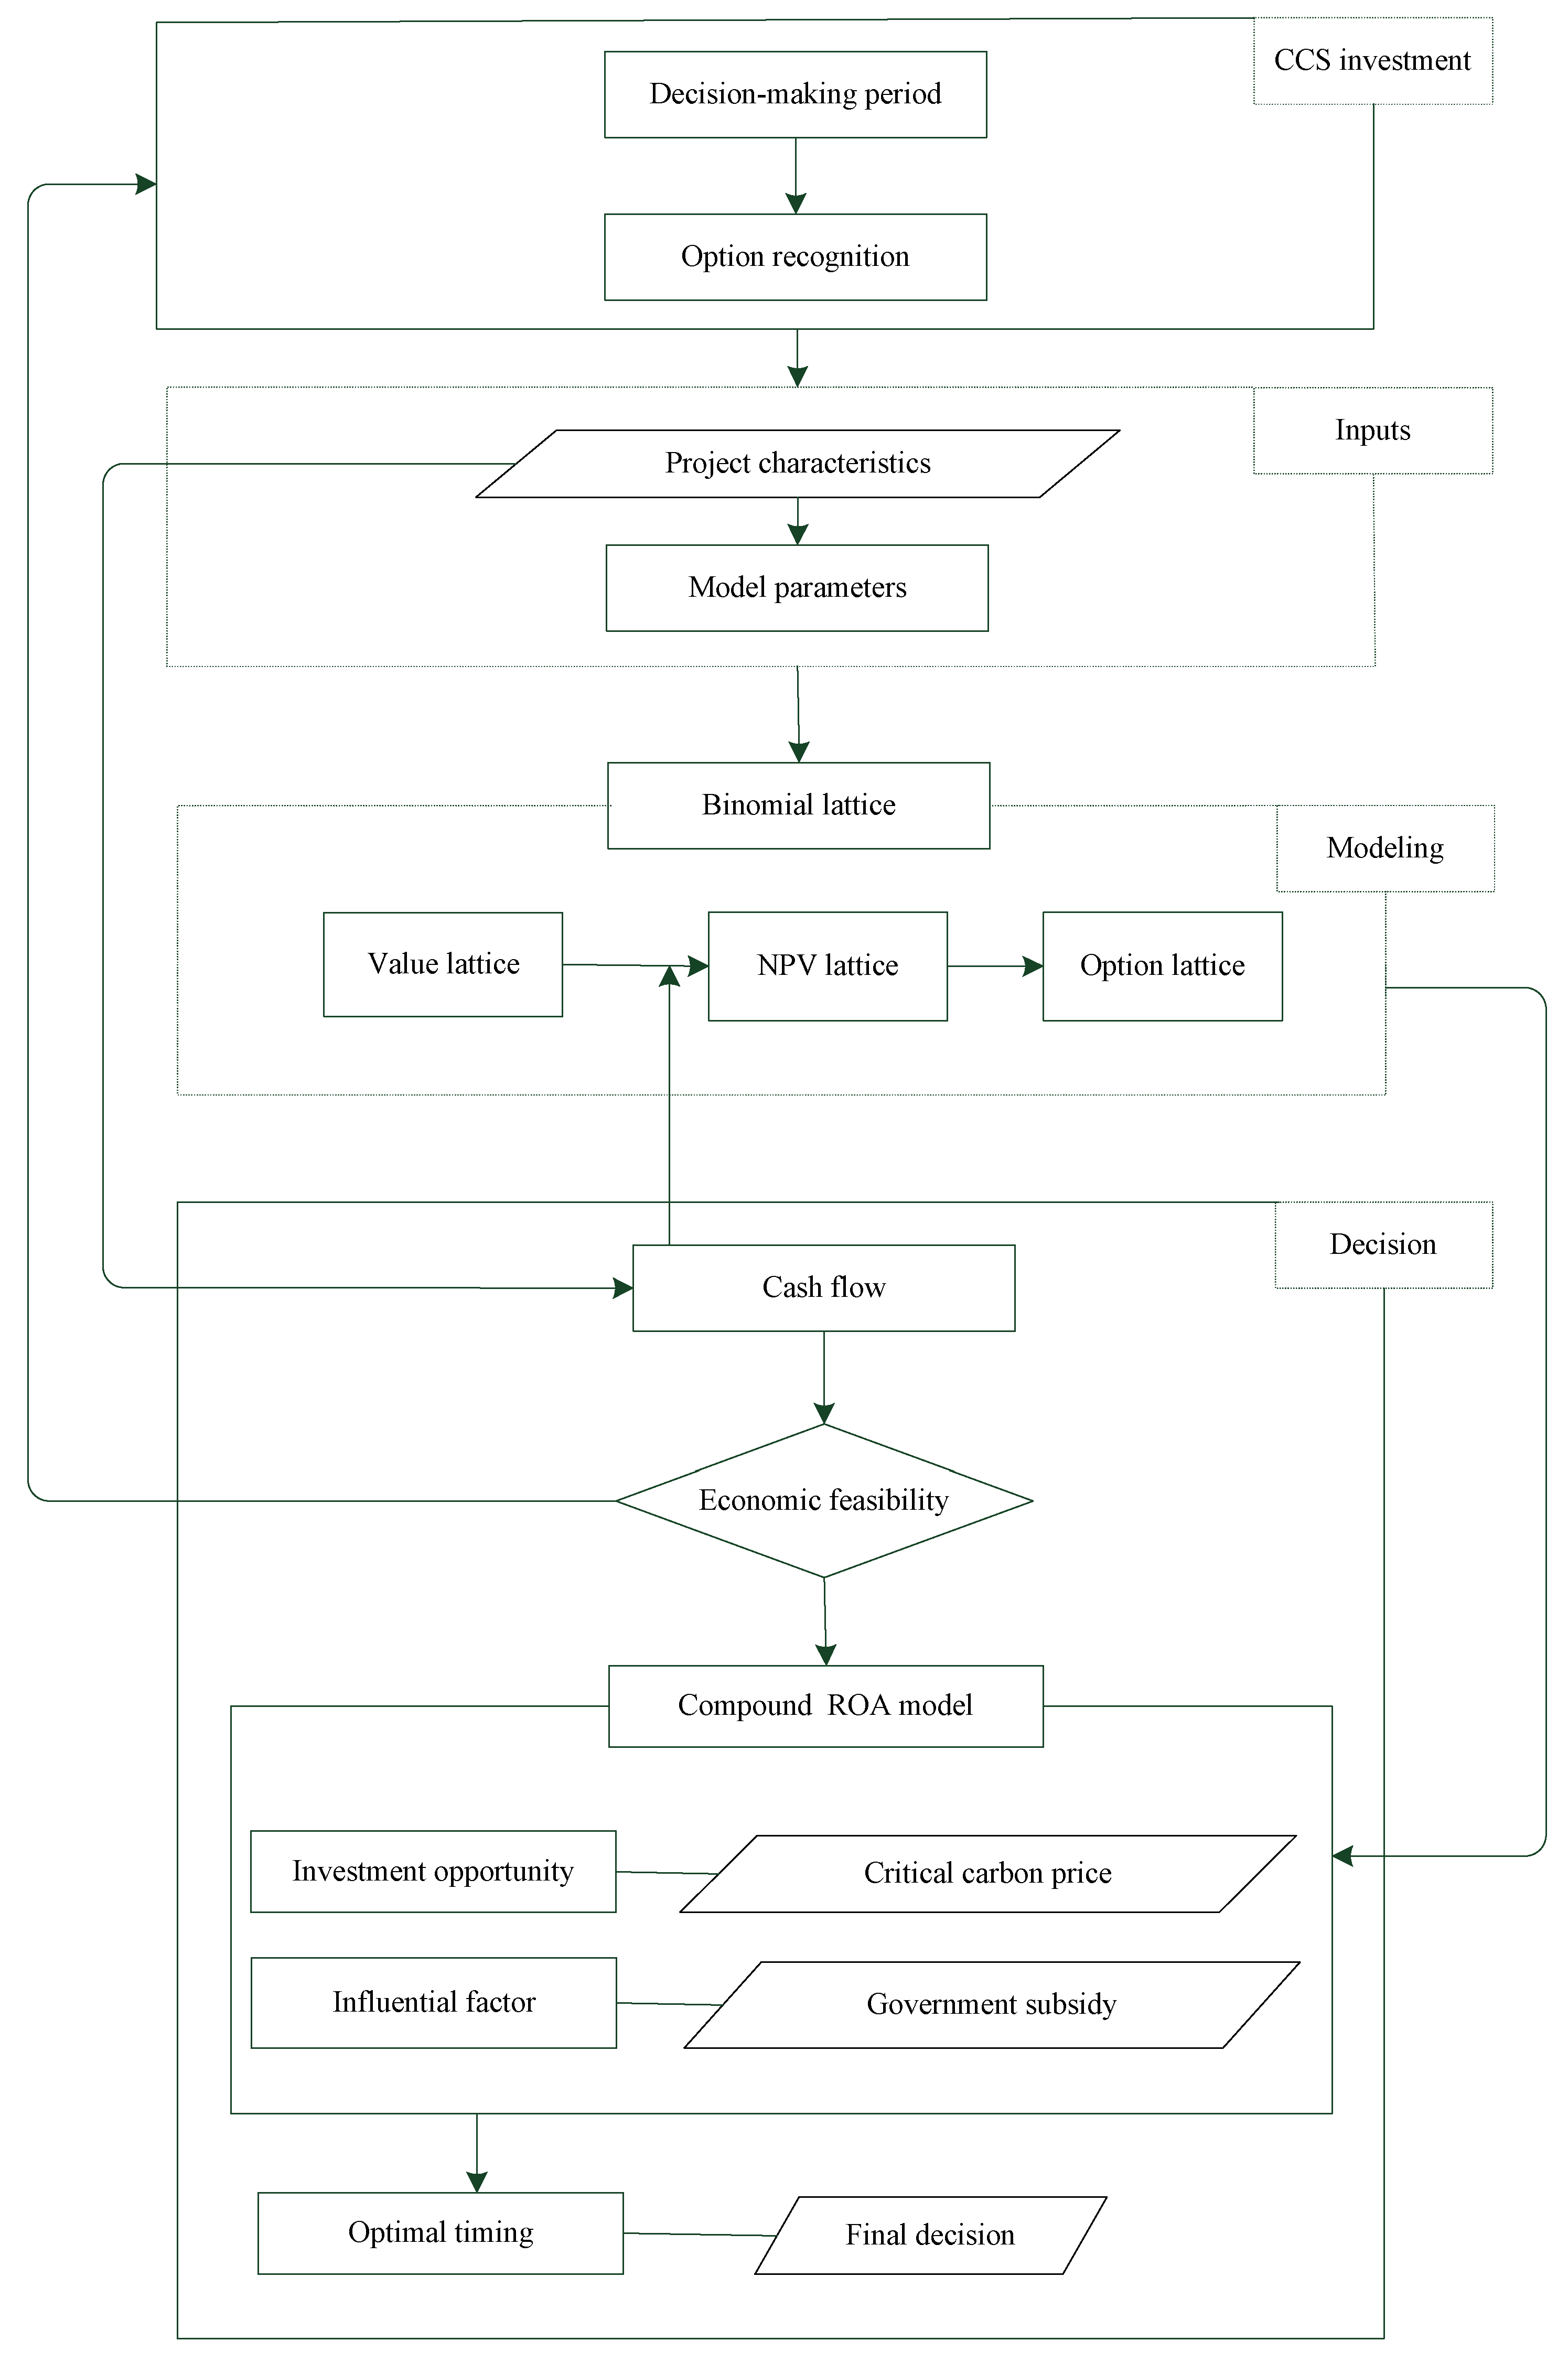
CCS retrofit projects will be accepted if and only if they are profitable for investors. The power enterprise should decide whether to continue or change the scale of investment after each stage of investment completed [44]. It is apparent to see the CCS retrofit investment has strong characteristics of compound real options. The framework for the whole investment decision-making is shown in Figure 1.
2.1. CCS Technique Readiness and CO2 Emissions Accounting
A typical CCS system captures CO2 from industrial production, and transports compressed CO2 to the storage location [45]. The stored CO2 can be utilized in enhanced oil recovery (EOR) technology, enhanced coal bed methane recovery (ECBM), geological storage, gas fields, and saline formations [15]. The capture part accounts for 70–80% of total investment cost. It consists of chemical devices such as absorber and desorber which can be in-built when a new plant is established or added to an existing plant at higher cost. When an existing power plant is retrofitted with CO2 capture, major new technological units added to the original system are: (1) the absorption process: the flue gas exiting the flue gas desulfurization (FGD) system is introduced into an inhibited chemical or physical absorber–stripper system; and (2) the CO2 compression process: to facilitate the transport of CO2 captured from flue gas, gaseous CO2 needs to be compressed by the compression unit, which would cause extra electric power consumption [3].
The CO2 capture has already been applied as the standard course in some industries, including natural gas processing, coal gasification, and hydrogen production. However, as for coal-fired power plants, some specific techniques have to be utilized to capture CO2 because their flue gases have low carbon contents. Up till now, post-combustion carbon capture has been the most mature and widely performed capture process, containing separation and removal of the CO2 diluted in the flue gas from the combustion of fossil fuels. Several options including chemical absorption, cryogenic separation, calcium looping and adsorption are available. Installed downstream, the post-combustion capture system can be added to existing power plants [9].
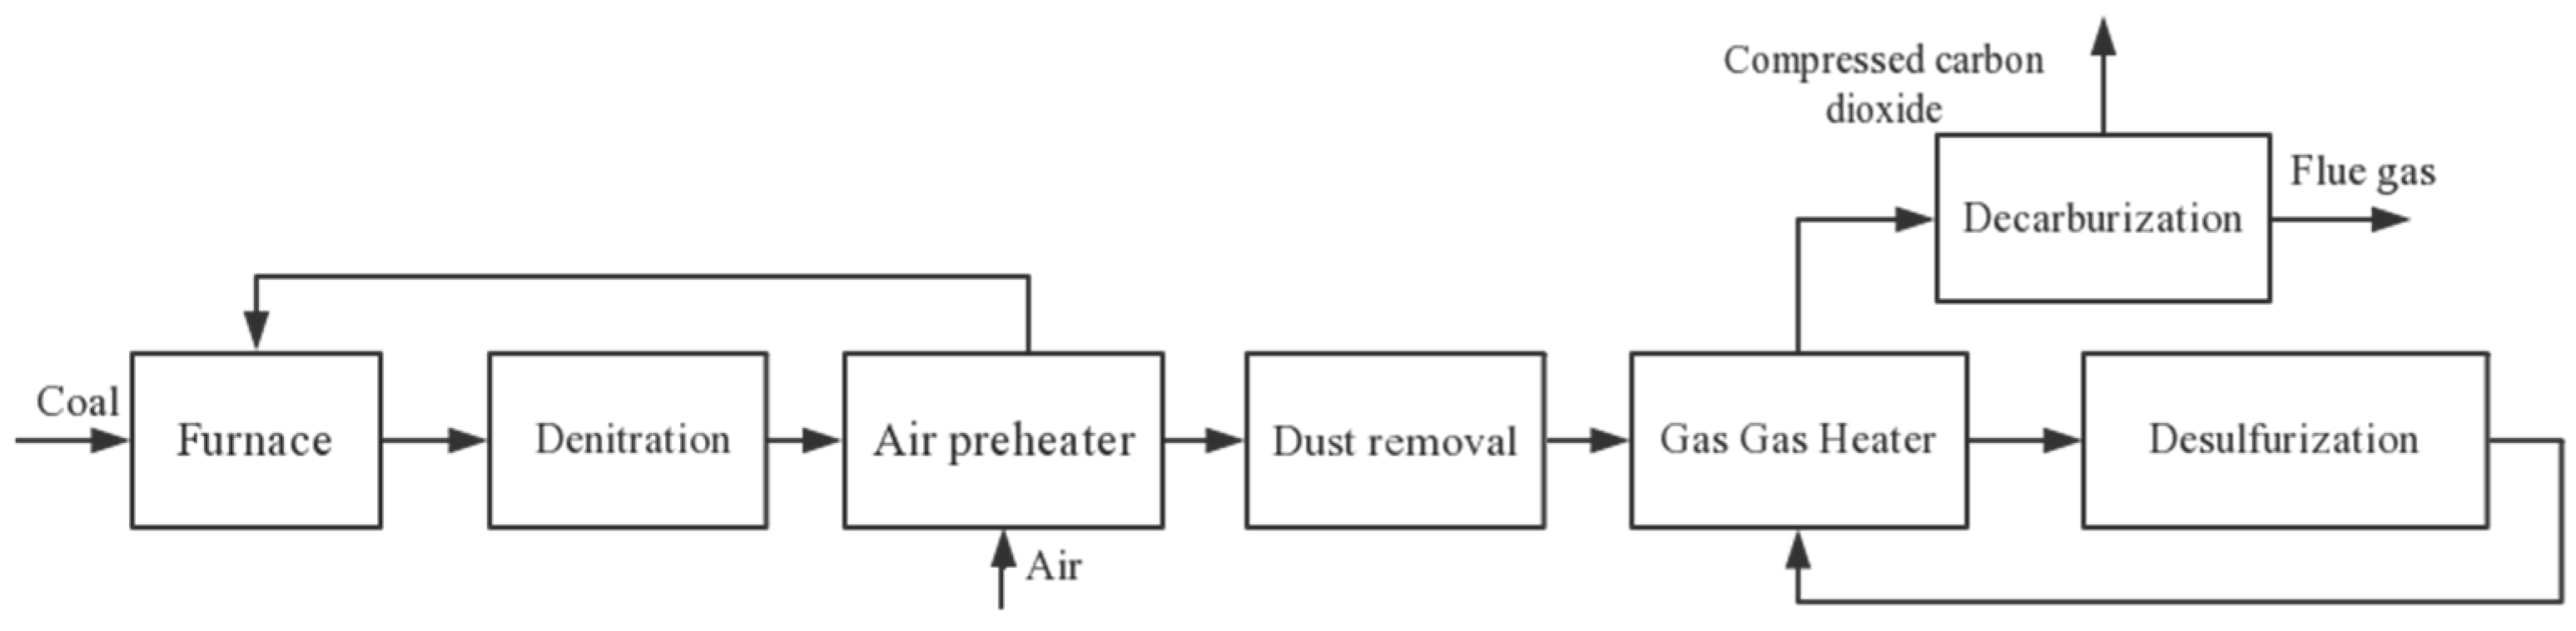
More specifically, the flue gas treatment process of a coal-fired power unit with post-combustion carbon capture is shown in Figure 2. As can been seen, CO2 emissions pertaining to CCS contain two parts: coal combustion and desulfurization.
In terms of CO2 emissions from the coal combustion, different calculation approaches can be selected according to different conditions, which is expressed explicitly in Figure 3 [46] and related equations [47] are shown as follows.
where represents CO2 emissions from the coal combustion; refers to consumption of the raw coal; refers to the weighted average carbon content of coal; stands for the proportion of ash to coal; is the average carbon content of ash; denotes the incomplete combustion heat loss (the following reference values can be used without statistics: bituminous coal or lignite, 1%; lean coal, 1.5%; anthracite, 2.5%; and low-grade anthracite, 4%); represents the received low calorific value; is the carbon content of unit calorific value; R is the carbon oxidation rate (Based on Provincial GHG Inventory Compilation Guidelines [48], the average of carbon oxidation rate for power boiler is 98%); and 44/12 is the ratio of the molecular weights of carbon dioxide and carbon.
Desulfurization is a necessary process for coal-fired power plants, in which widely used wet desulfurization through calcium carbonate will produce CO2 emissions. The CO2 emissions from desulfurization can be expressed by Equation (4):
where stands for CO2 emissions from limestone consumption by wet desulfurization; denotes the calcium carbonate consumption; represents the limestone consumption; and is the calcium carbonate content in limestone (the coefficient is 92% when there is no statistical value).
Therefore, by determining the calculation method of CO2 emissions in coal-fired power plants according to relevant data obtained, the total CO2 emissions correlated with CCS are shown in Equation (5):
2.2. Compound Real Options Model
Based on [29], an extended binomial lattice is employed to appraise CCS investment assuming variables in this model are uncorrelated. This model has a good applicability for solving this complex multi-stage real options value. A two-stage CCS retrofit investment decision framework is shown in Figure 4.
Vk (k = 1, 2) represents the present value of the cash flow at the end of the stage k; Ik denotes the investment at the stage k (i.e., the exercise price in the financial option); Ck is the value of the real options of the stage k; and ti (i = 0, 1) is the investment decision point. In Figure 4, the effective date of the real options C1 is t0, and the expiry date is t1, so the execution of C1 at t1 will produce a cash flow increment of V1 and the real options C2. Further, at the t2 moment, the execution of C2 will generate cash flow increment V2 and the next real options.
In the binomial lattice framework, Vk is assumed to follow a geometric Brownian motion (GBM):
where and , respectively, stand for the rate of return and volatility of the stage k; is the independent increment of a Wiener process designated by , where is standard normally distributed random variable with .
To estimate the volatility parameter in implementing a real options model is much tougher than financial assets [41]. The method using Monte Carlo simulation is established by means of a hypothetical distribution of one-period returns to estimate the volatility parameter in compound real options [29,41,49], as described in Appendix A.
After the first investment, the cash flow discounts to the time t0 resulting V1. After a time step of t1, the initial V1 increases to V1+ with risk-neutral probability p1 and rising range u1, or decreases to V1− with probability (1 − p1) and dropping range d1. Similarly, during the second investment period, V2 will be obtained when expected cash flow discounts to the time t1, and after a time step of t2, V2 rises to V2+ with the risk-neutral probability p2, or drops to V2− with probability (1 − p2), with V1 remaining unchanged. Figure 5 shows changes in the asset value of the two-stage CCS retrofit investment.
After calculating the volatility (), the following equations are used to get the risk-neutral probability pk and changing range at each stage:
where denotes the risk-free interest rate; is the time step in year.
2.3. Options Value and Investment Value of the Model
Based on previous research [4,10,17,18,19] and the actual situation, four main uncertainty factors are considered: carbon price, coal price, investment and O&M cost, subsidy policy. The uncertainty factors modeling can be seen in Appendix B.
At the second stage (T2), power enterprises are responsible for the capture, transportation and storage of CO2. The returns V2 can be expressed as follows:
where represents the carbon price; is CERs at period T2; represents clean electricity tariff due to decarbonization; represents clean electricity generation; stands for returns on EOR (here, we donot consider returns from ECBM, because, at present, ECBM is in research stage in China and not being demonstrated [8]); represents the coal price; represents the additional fuel consumption responsive to efficiency penalty; denotes O&M cost; and and are transportation and storage cost, respectively.
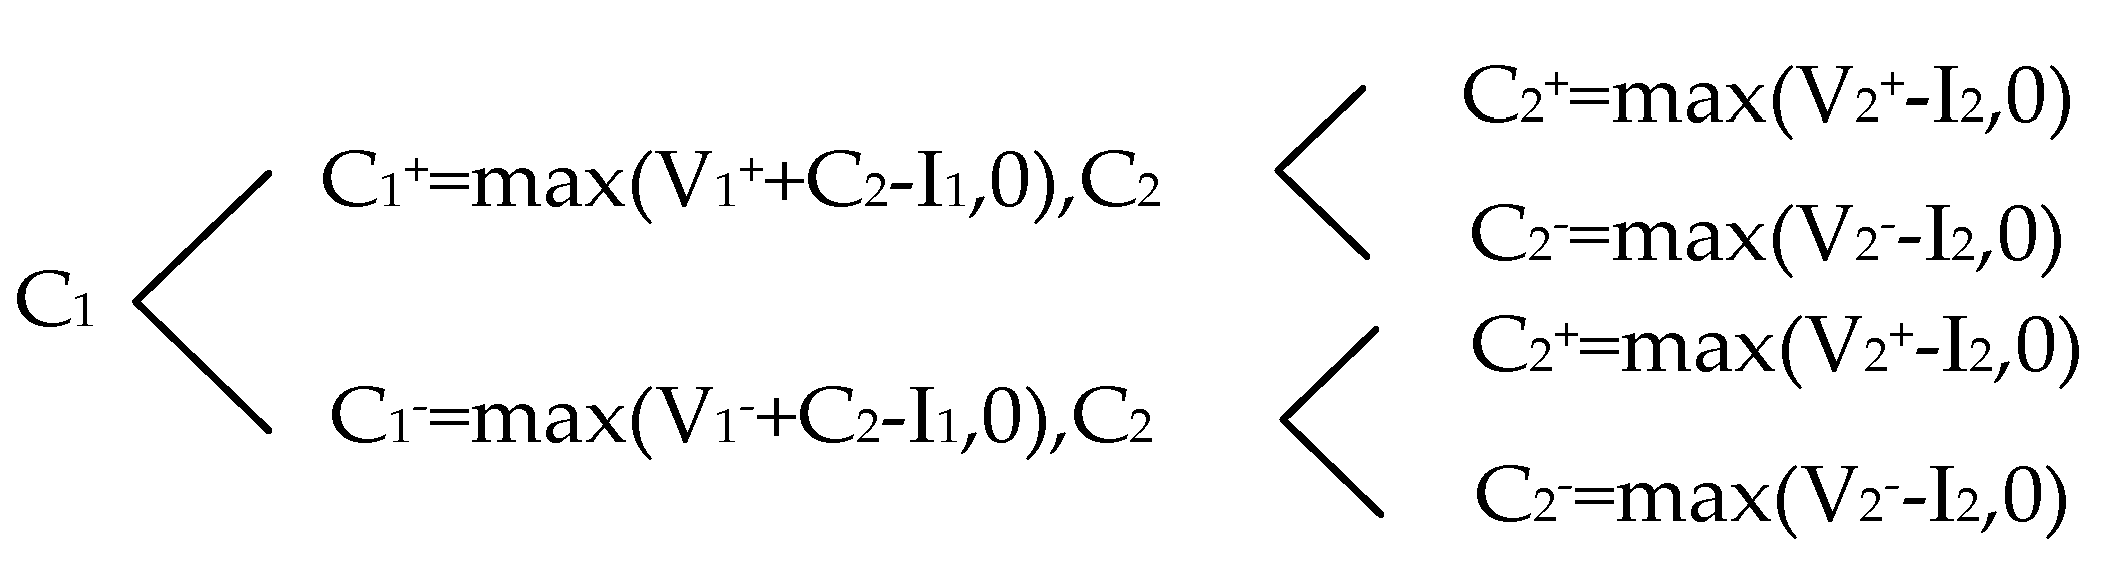
Combined with the binomial lattice model of options value and the backward induction method (see Figure 6), the second real options C2 value should be solved firstly. The investment I2 at time t1 (the execution of C2) will generate the cash inflow increment, which is discounted to time t1 obtaining V2. The underlying asset value of C2 is V2. Based on binomial lattice pricing method and risk-neutral pricing principle, the value of C2 can be obtained by Equation (11):
where r represents the discount rate.
Then, solve the value of the option to defer (C1). In the demonstration phase (T1), the exercise of C1 will produce the cash inflow increment value V1 and the real options C2 at time t1, and the underlying asset value of C1 is the sum of V1 and C2. The calculation of C1 can be expressed as follows:
It is assumed that power enterprises with CCS system will only be responsible for CO2 capture in the demonstration phase [19]. The cash inflows of this stage are mainly from CERs revenue under CDM mechanism and clean electricity returns. The cash outflows mainly incorporate O&M cost and additional coal consumption due to the efficiency penalty. The returns V1 can be shown as follows:
where denotes CERs at period T1.
Accordingly, the options value of the two-stage project can be obtained by Equation (14):
The TIV based on ROA includes two parts: the NPV and the real options value (ROV). As a result, the decision rules of CCS investment under ROA are illustrated in Table 1. TIV and NPV can be calculated by Equations (15) and (16):
where and represent cash inflows and outflows, respectively.
3. Data Collection and Case Study
Currently, diverse power generation techniques exist among pulverized coal (PC) plants in China. Ultra-supercritical PC and supercritical PC plants are strategically selected by the power sector for new capacity additions coupled with pollution control technologies. Based on the national industry policy, 600 MW and larger-capacity units are required for thermal power generation in the future. A developing trend of clean and high-efficiency power generation technologies is inevitable [50]. Therefore, we choose supercritical PC as the representative technology for the conventional coal-fired power plant.
An existing 630 MW supercritical coal-fired power generation unit located in China with post-combustion capture technology was an applied case of CCS retrofitting evaluation. Technological parameters of power generation for accounting CO2 emissions and performance of CCS system were from internal observed data and experimental results of this power plant. Other critical data such as carbon and coal prices, investment cost and returns and the rest necessary parameters, were obtained from previous research or set by this paper. The investor considers retrofitting the CCS system in 2017, with the time step being one year. Meanwhile, the lifetime of the power plant is assumed to be 40 years, 15 years for the demonstration phase and the remaining 25 years for the commercial phase [4]. To simplify the analysis, it was assumed that emission reductions obtained from CCS system are CERs [17,19]. In addition, the electric production was assumed unchanged after CCS retrofit [10].
According to the parameters provided (Table 2), the volatile content of coal and other industrial data are not measured by the power plant except for the low calorific value of coal, so Equation (3) can be applied to calculate CO2 emissions from coal combustion. Table 3 shows the accounting results of the CO2 emissions from one power unit in 2016.
Since 2013, China has opened seven carbon trading pilot cities, and the nation-wide carbon trading market was formed at the end of 2017 [51]. However, China’s carbon trading market is not yet mature, with existing deficiencies: the exchange platform between these seven cities are independent of each other, with no unified market pricing mechanism; and the scale of the pilot market is unbalanced [46]. For this reason, the CERs from power plants due to CCS retrofit are mainly traded at European Climate Exchange, the largest carbon trading market over the world, through the CDM under the Kyoto Protocol. That is, if the CO2 emissions of power plants are below the required level, the CERs can be sold to the international market [19]. Here, the European carbon prices are used to estimate relevant parameters. As for another uncertainty, fuel prices, Bohai-rim steam-coal prices are known as “coal price wind vane” in China. Thus, this kind of steam coal with calorific value of 5500 kcal/kg, having great transit and trading volume in the Bohai Sea ports, is representative of countrywide coal price [19]. Based on equations calculating the drift and volatility [17], the concerning parameters of carbon prices and coal prices are obtained: = 47.978 (the daily average price of 6.222 €/ton from 30 August 2012 to 25 August 2017 was used as the initial carbon price; here, 1 € is equal to 7.711 RMB according to the average exchange rate of the euro to the RMB during this period, i.e., 47.978 RMB/ton) RMB/ton, = −0.087965, and = 0.6359663; = 479.592 (we considered the weekly average price of Bohai-rim steam-coal with calorific value of 5500 kcal/kg during the period from 22 March 2015 to 12 September 2017 as the initial coal price) RMB/ton, = −0.079779353, and = 0.092909373.
We collected technological data from related techno-economic assessment literature. These parameters are shown in Table 4, showing the fundamental parameters of the model in this paper.
4. Results and Discussion
4.1. NPV Method
Firstly, the situation without government subsidies was considered, i.e., subsidy coefficient η = 0. The annual cash flow can be obtained during two investment stages (Table 5 and Table 6). Based on Equation (15), the total NPV of two stages is −360,904 × 104 RMB, which is far less than zero, thus not available under traditional DCF rules.
4.2. Compound Real Options Models Analysis
Based on Equations (A1)–(A5), Crystal Ball software was used for calculating the volatility of rate of return after 50,000 Monte Carlo simulation trials. We obtained the standard deviation of in Equation (A5) and the result is σ1 = 0.19 in demonstration phase and σ2 = 0.2 in commercial operation phase. Consequently, the fluctuation range and risk-neutral probability are: in demonstration phase, u1 = 1.2092, d1 = 0.8269, and p1 = 0.5661; and, in commercial operation phase, u2 = 1.2214, d2 = 0.8187, and p2 = 0.5578.
As aforementioned, we assumed the CCS retrofit is supported without government subsidy. Next, the scenario that government subsidy changes with the gradient of 10%, as the government would diminish subsidy with the rising of CCS installed capacity, was considered [19]. Therefore, we set government subsidy for the first stage being η1, the subsidy for the second phase being η2. According to Equation (11), the options to expand (C2) based on diverse scenarios of subsidy are shown in Table 7.
The results in Table 7 indicate that C2 is more than zero as the subsidy coefficient η2 changes from 70% to 100%, reflecting the increase in government subsidy is beneficial to CCS investment. Therefore, the government subsidy plays a dominating role in determining whether to expand the investment in commercial operation phase. Then, the backward induction method was employed to solve the value of C1, indicating the cash flow of demonstration project stage are always negative. Based on Equation (12), the value of C1 is always zero under different C2 values no matter how η1 and η2 change. The results reveal that the current carbon prices and high cost are not supportive to invest CCS, so, at this stage, volatile carbon prices may play a leading role on whether to invest CCS retrofit or not. (as coal prices in China are relatively stable recently [61], we do not consider its influence on investment decision-making of CCS investment).
Under different scenarios of government subsidy that η1 and η2 change with the same gradient of 10% at both two stages, the NPV, ROV and TIV considering real options are shown in Table 8.
Table 8 indicates that the TIV considering options value are larger than that under NPV standard when compound ROV are greater than zero. This illustrates compound ROA considers uncertainties of the CCS project and improves the investment value by managerial flexibility, which has obvious superiority over the traditional DCF method. It also reflects when evaluating the CCS investment with ROA, even if the government gives the full subsidy, the TIV is still negative. Therefore, the investor should consider deferring the investment. Under the current carbon trading market and CCS technology level, full investment subsidies are not enough to stimulate power enterprises to invest in CCS, unless carbon prices increase to a high critical value to offset great cost.
The above analyses show that, under the current carbon price level, the government will face with a high cost pressure to promote CCS technology through providing subsidies. If the government gives no subsidy and forces the CCS retrofit, power plants will suffer serious economic losses. Therefore, it is necessary to analyze the influence of carbon price on CCS investment decision. Learning from the quadrinomial model of CCS investment decision-making study in [19], we can obtain that only when the government subsidy coefficients in the demonstration phase (η1) are 90% and 100%, the CCS investment is available. The results in Table 8 also demonstrate C2 is positive as the government subsidy coefficient is greater than 70%. Thus, we can only consider the case that η1 changes from 90% to 100% and η2 changes from 70% to 100%, to study the effects of government subsidy on critical carbon price. Based on [52], the carbon prices that meet values of C1 and C2 are both greater than zero are critical carbon prices. Given this condition, critical carbon prices under different government subsidy coefficients are shown in Table 9.
In Table 9, when η1 = 100%, no matter how η2 changes, the critical carbon prices are stable at around 90 RMB/ton, with minor decrease as η2 increases. However, when η1 drops to 90%, the critical carbon prices are almost twice as much as that when η1 = 100%. Meanwhile, the growth in η2 also causes much more minor reduction in the critical carbon price. It reflects that the reduction range of critical carbon price with 100% subsidy at the demonstration stage is a little bigger than that with 90% subsidy.
This changing trend is very illuminating. Specifically, on the one hand, in the first phase when CCS technology is not yet mature, capture efficiency is relatively low and relevant cost are strongly high. The subsidy from the government may provide great benefit at this stage, so only 10% decline of it can induce approximately double increase of critical carbon price. On the other hand, in the second phase, CCS technology will be increasingly mature, with capture efficiency higher and investment and O&M cost lower. This will encourage power enterprises to be willing to expand the scale of investment and responsible for the transportation and storage of CO2, forming economies of scale and achieving good economic returns. Hence, the rise in the government subsidy at the second stage may have a relatively small impact on the critical carbon price.
More specifically, the current carbon price is 56 RMB/ton, less than the critical carbon price of 87.09 RMB/ton with full government subsidy at both two stages. That is, even if the government renders full subsidy, the power plants will not invest CCS project under real options decision rules.
5. Conclusions
This paper presents an investment feasibility study on the CCS retrofit project in an existing 630 MW supercritical coal-fired power generation unit, considering the overall investment environment in China. This paper takes uncertainties of carbon price, coal price, investment and O&M cost and government subsidy into consideration. The compound real options model applied in two investment stages was developed to help power enterprises with optimal decision-making on CCS investment. A combination of traditional NPV method and binomial lattice of ROA was employed to improve the whole research framework. The relationship between critical carbon price and government subsidy was analyzed as a price measure. According to above analyses, several instructive conclusions emerged.
- (1)
- The two-stage compound real options model includes a call option to delay at the demonstration project stage, and an option to expand at the commercial operation stage. This model considers the irreversibility, uncertainty and flexibility of CCS retrofit investment remedying intrinsic deficiencies of NPV method, and explored interrelated mutual connection between two investment stages which is more suitable than the single real options model. However, the investment value including options value is still far less than zero. It proved that now this is not the optimum moment to invest CCS retrofit project.
- (2)
- In the commercial operation phase, the power plant should expand investment by undertaking CO2 transportation, storage and EOR project, to achieve additional income if the government provides enough fund incentive. However, in the demonstration project phase, the government subsidy makes no sense to CCS investment. The current carbon price and high construction sunk-cost may play a significant part in deferring CCS investment.
- (3)
- The critical carbon price will diminish as the government increases subsidy proportion at both two stages. Furthermore, reduction in the subsidy at the demonstration project stage can cause greater growth in critical carbon price than that at the second stage.
These conclusions are illuminating to attract attention from policy-makers in China. Specific implications are summarized as follows in aspects of policy, capital, and technology to slash cost, enhance efficient investment, and perfect laws and regulations regarding CCS investment.
6. Policy Implications
First, the development of CCS technology should be vigorously promoted for the purpose of reducing investment cost. Currently, the main obstacle to the application of CCS technology is the high cost. The introduction of foreign advanced technology, equipment and operational experience can accelerate the CCS advance in promotion and application process of China’s coal-fired power plants, but inevitably will bring additional considerable cost. Hence, both the government and the power enterprises should pay attention to independent research and development of CCS technology, to implement independent intellectual property rights and truly drive a significant reduction in carbon capture cost.
Second, because of great cost and low current carbon prices, investment in CCS can mainly be achieved with strong financial support from government including: investment subsidy and clean electricity tariff. However, investment subsidy will bring high financial expenses for the government, which can be decreased by tax transfer strategy. Currently, there has been no carbon tax mechanism in China. The tax charged can be used as subsidy for CCS investment. As for clean electricity tariff for decarbonization in power plants, it has not existed in China until now. Consequently, the government should formulate an efficacious subsidy policy, a reasonable clean electricity price system, and an effective carbon tax mechanism to improve the enthusiasm from power enterprises.
Third, carbon trading scheme should be perfected. Investment in CCS project will produce many CERs, which can bring substantial benefits offsetting part of investment cost. Meanwhile, high volatility of carbon prices can also cause investment postponement under large investment uncertainty. Hence, the government should develop efficacious carbon trading market, improving bargaining power at the market to enhance carbon prices for power enterprises, while lessening the volatility of carbon prices to alleviate investment pressure. Given the nation-wide carbon trading market has been formed recently, in the future, the investment environment for CCS project will be improved in China.
Author Contributions
All authors contributed equally to this work. T.Z. wrote the initial manuscript draft; and H.C. and R.W. performed several significant revisions.
Funding
Innovation Capacity Improvement Program of Hebei Provincial Department of Science and Technology (18456214D), the National Social Science Foundation of China (No. 15BGL145) and the National Natural Science Foundation of China (No. 71471061).
Acknowledgments
This work was supported by the Innovation Capacity Improvement Program of Hebei Provincial Department of Science and Technology (18456214D), the National Social Science Foundation of China (No. 15BGL145) and the National Natural Science Foundation of China (No. 71471061).
Conflicts of Interest
The authors declare no conflict of interest.
Abbreviations
| CCS | carbon capture and storage |
| CDM | clean development mechanism |
| CERs | certified emission reductions |
| DCF | discounted cash flow |
| ECBM | enhanced coal bed methane recovery |
| EOR | enhanced oil recovery |
| FGD | flue gas desulfurization |
| GBM | geometric Brownian motion |
| IEA | International Energy Agency |
| IPCC | Intergovernmental Panel on Climate Change |
| IRR | internal rate of return |
| LSIP | large scale integrated projects |
| NPV | net present value |
| O&M | operating and maintenance |
| PC | pulverized coal |
| ROA | real options approach |
| ROV | real options value |
| TIV | total investment value |
Appendix A. Estimating the Volatility Parameter of the Model
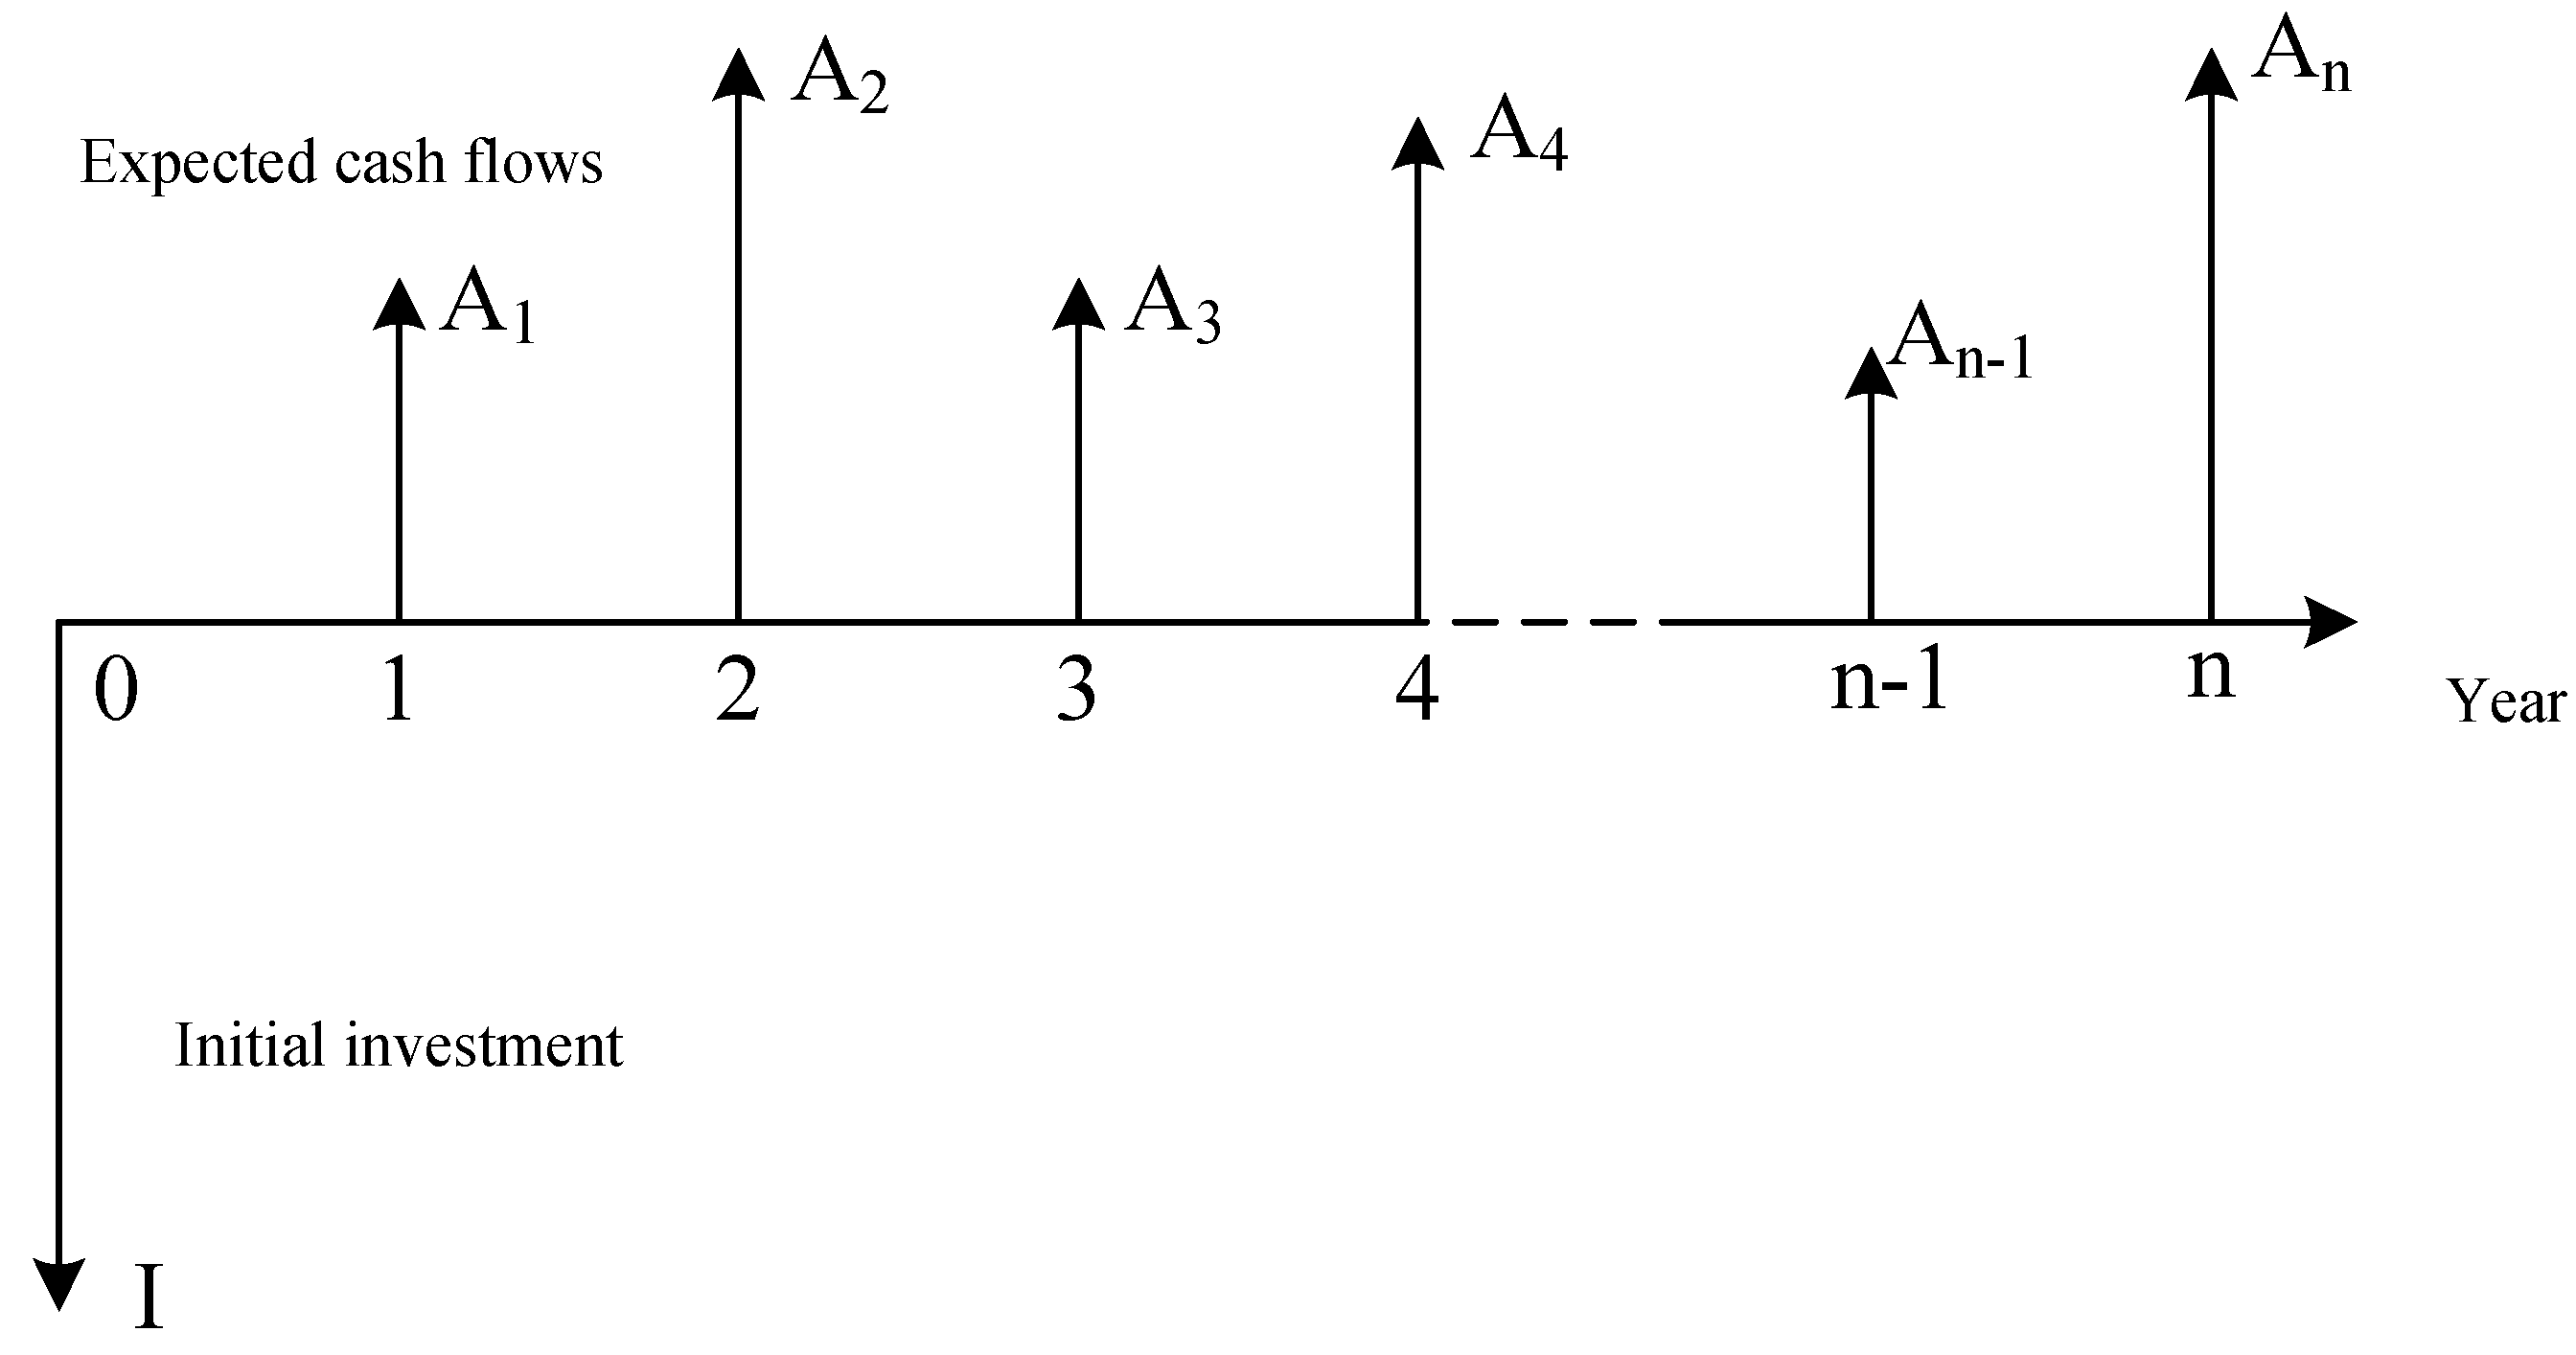
Hypothesize an investment process (see Figure A1), including an initial investment cost (I) and series of expected cash flows (An), n = 1, 2, …, T. The present value of future cash flows from period n to T and from period n + 1 to T are denoted as PWn and MVn, which can also define as present worth at time n and market value at time n, respectively. The gross worth at period n (PWn) should contain the current cash flow An. The relation between present value and market value can be presented as follows:
where n = 0, PW0 = MV0 and A0 = 0.
For n = 0, the present value can be expressed as Equation (A2) using continuously compounded interest:
which can also be shown as:
in this case, the rate of return is indicated as a random variable which is distributed as r~N(µr,σr2), the selection of types of distribution being arbitrary here. Parameter r can be estimated by Equation (A4):
To get the volatility relevant to the full investment cycle, the equation for the rate of return with n = 1 is shown as follows:
Therefore, the standard deviation of the simulated return distribution represents the estimate of the volatility parameter in a compound real options model. This method is generally applicable because any type of input distribution can be assumed for random variables in the simulation.
Figure A1.
The investment process.

Appendix B. Uncertainty Factors Modeling
The carbon price is assumed to behave in the light of Geometric Brownian motion (GBM) as in Equation (A6) [10,18,30,62,63]:
where and , respectively, denote the drift and volatility of carbon price. The expected value of carbon price is:
where refers to the expected price of CO2 at time t; and is the initial carbon price.
Based on research in the past [19,64,65], GBM can perform well for simulating the changing process of coal price in China, which is expressed as Equation (A8):
where and , respectively, denote the drift and volatility of coal price. The expected value of coal price is shown as follows:
where represents the expected price of coal at time t; and denotes the initial coal price.
The drift and volatility of carbon price and coal price can be obtained by the historical volatility calculation method due to its full historical data [17].
Before CCS technology achieves large-scale promotion, technological advances will reduce the investment cost and O&M cost [12,17,19,27]. Meanwhile, it is supposed that the government provides investment subsidy for CCS retrofit, with the subsidy coefficient being set as η (0 ≤ η ≤ 1). Thus, the investment cost and O&M cost can be expressed as follows:
where represents capital cost of CCS retrofit at time t; is the base year’s capital cost; is the influencing parameter for technology advance in capital cost; denotes O&M cost at time t; refers to O&M cost at initial time fulfilling CCS retrofit; and is the parameter reflecting technology improvement on O&M cost.
References
- International Energy Agency (IEA). CO2 Emissions from Fuel Combustion 2016; IEA: Paris, France, 2016; ISBN 9789264258556. [Google Scholar]
- Council, C.E. National Electric Power Industry Statistics Express 2017. Available online: http://www.cec.org.cn/guihuayutongji/tongjxinxi/niandushuju/2017-01-20/164007.html (accessed on 19 March 2018).
- Zhou, W.; Zhu, B.; Fuss, S.; Szolgayová, J.; Obersteiner, M.; Fei, W. Uncertainty modeling of CCS investment strategy in China’s power sector. Appl. Energy 2010, 87, 2392–2400. [Google Scholar] [CrossRef]
- Chen, H.; Wang, C.; Ye, M. An uncertainty analysis of subsidy for carbon capture and storage (CCS) retrofitting investment in China’s coal power plants using a real-options approach. J. Clean. Prod. 2016, 137, 200–212. [Google Scholar] [CrossRef]
- Wang, J.; Zhao, J.; Wang, Y.; Deng, S.; Sun, T.; Li, K. Application potential of solar-assisted post-combustion carbon capture and storage (CCS) in China: A life cycle approach. J. Clean. Prod. 2017, 154, 541–552. [Google Scholar] [CrossRef]
- Hu, B.; Zhai, H. The cost of carbon capture and storage for coal-fired power plants in China. Int. J. Greenh. Gas Control 2017, 65, 23–31. [Google Scholar] [CrossRef]
- National Development and Reform Commission Renewable Energy Development & 13th Five-Year Plan. Available online: http://www.ndrc.gov.cn/fzgggz/fzgh/ghwb/gjjgh/201706/t20170614_850910.html (accessed on 25 May 2018).
- Zeng, M.; Ouyang, S.J.; Zhang, Y.J.; Shi, H. CCS technology development in China: Status, problems and countermeasures—Based on SWOT analysis. Renew. Sustain. Energy Rev. 2014, 39, 604–616. [Google Scholar] [CrossRef]
- Renner, M. Carbon prices and CCS investment: A comparative study between the European Union and China. Energy Policy 2014, 75, 327–340. [Google Scholar] [CrossRef]
- Zhu, L.; Fan, Y. A real options-based CCS investment evaluation model: Case study of China’s power generation sector. Appl. Energy 2011, 88, 4320–4333. [Google Scholar] [CrossRef]
- Ministry of Science and Technology. The “Twelfth Five-Year” National Carbon Capture Use and Storage Technology Development Special Planning. Available online: http://www.gov.cn/zwgk/2013-03/11/content_2351242.htm (accessed on 1 September 2017).
- Wu, X.D.; Yang, Q.; Chen, G.Q.; Hayat, T.; Alsaedi, A. Progress and prospect of CCS in China: Using learning curve to assess the cost-viability of a 2 × 600 MW retrofitted oxyfuel power plant as a case study. Renew. Sustain. Energy Rev. 2016, 60, 1274–1285. [Google Scholar] [CrossRef]
- Li, X.; Wei, N.; Liu, Y.; Fang, Z.; Dahowski, R.T.; Davidson, C.L. CO2 point emission and geological storage capacity in China. Energy Procedia 2009, 1, 2793–2800. [Google Scholar] [CrossRef]
- Huaman, R.N.; Jun, T.X. Energy related CO2 emissions and the progress on CCS projects: A review. Renew. Sustain. Energy Rev. 2014, 31, 368–385. [Google Scholar] [CrossRef]
- Li, Q.; Chen, Z.A.; Zhang, J.T.; Liu, L.C.; Li, X.C.; Jia, L. Positioning and revision of CCUS technology development in China. Int. J. Greenh. Gas Control 2016, 46, 282–293. [Google Scholar] [CrossRef]
- Lai, X.; Ye, Z.; Xu, Z.; Husar Holmes, M.; Henry Lambright, W. Carbon capture and sequestration (CCS) technological innovation system in China: Structure, function evaluation and policy implication. Energy Policy 2012, 50, 635–646. [Google Scholar] [CrossRef]
- Zhang, X.; Wang, X.; Chen, J.; Xie, X.; Wang, K.; Wei, Y. A novel modeling based real option approach for CCS investment evaluation under multiple uncertainties. Appl. Energy 2014, 113, 1059–1067. [Google Scholar] [CrossRef]
- Zhu, L.; Fan, Y. Modelling the investment in carbon capture retrofits of pulverized coal-fired plants. Energy 2013, 57, 66–75. [Google Scholar] [CrossRef]
- Wang, X.; Du, L. Study on carbon capture and storage (CCS) investment decision-making based on real options for China’s coal-fired power plants. J. Clean. Prod. 2016, 112, 4123–4131. [Google Scholar] [CrossRef]
- Santos, L.; Soares, I.; Mendes, C.; Ferreira, P. Real Options versus Traditional Methods to assess Renewable Energy Projects. Renew. Energy 2014, 68, 588–594. [Google Scholar] [CrossRef]
- Dahowski, R.T.; Davidson, C.L.; Li, X.C.; Wei, N. A $70/tCO2 greenhouse gas mitigation backstop for China’s industrial and electric power sectors: Insights from a comprehensive CCS cost curve. Int. J. Greenh. Gas Control 2012, 11, 73–85. [Google Scholar] [CrossRef]
- Liang, X.; Reiner, D.; Gibbins, J.; Li, J. Assessing the value of CO2 capture ready in new-build pulverised coal-fired power plants in China. Int. J. Greenh. Gas Control 2009, 3, 787–792. [Google Scholar] [CrossRef]
- Bohm, M.C.; Herzog, H.J.; Parsons, J.E.; Sekar, R.C. Capture-ready coal plants—Options, technologies and economics. Int. J. Greenh. Gas Control 2007, 1, 113–120. [Google Scholar] [CrossRef] [Green Version]
- Senior, B.; Chen, W.; Gibbins, J.; Haydock, H.; Li, M.; Pearce, J.; Su, W.; Ulanowsky, D. Carbon capture and storage in China—Main findings from China-UK Near Zero Emissions Coal (NZEC) initiative. Energy Procedia 2011, 4, 5956–5965. [Google Scholar] [CrossRef]
- Wu, N.; Parsons, J.E.; Polenske, K.R. The impact of future carbon prices on CCS investment for power generation in China. Energy Policy 2013, 54, 160–172. [Google Scholar] [CrossRef]
- Koelbl, B.S.; van den Broek, M.A.; van Ruijven, B.J.; Faaij, A.P.C.; van Vuuren, D.P. Uncertainty in the deployment of Carbon Capture and Storage (CCS): A sensitivity analysis to techno-economic parameter uncertainty. Int. J. Greenh. Gas Control 2014, 27, 81–102. [Google Scholar] [CrossRef]
- Van den Broek, M.; Hoefnagels, R.; Rubin, E.; Turkenburg, W.; Faaij, A. Effects of technological learning on future cost and performance of power plants with CO2 capture. Prog. Energy Combust. Sci. 2009, 35, 457–480. [Google Scholar] [CrossRef]
- Zambujal-Oliveira, J. Investments in combined cycle natural gas-fired systems: A real options analysis. Int. J. Electr. Power Energy Syst. 2013, 49, 1–7. [Google Scholar] [CrossRef]
- Copeland, T.; Antikarov, V. Real Options: A Practitioner’s Guide; TEXERE Publishing Limited: Knutsford, UK, 2001. [Google Scholar]
- Heydari, S.; Ovenden, N.; Siddiqui, A. Real options analysis of investment in carbon capture and sequestration technology. Comput. Manag. Sci. 2012, 9, 109–138. [Google Scholar] [CrossRef]
- Eckhause, J.; Herold, J. Using real options to determine optimal funding strategies for CO2 capture, transport and storage projects in the European Union. Energy Policy 2014, 66, 115–134. [Google Scholar] [CrossRef]
- Loncar, D.; Milovanovic, I.; Rakic, B.; Radjenovic, T. Compound real options valuation of renewable energy projects : The case of a wind farm in Serbia. Renew. Sustain. Energy Rev. 2017, 75, 354–367. [Google Scholar] [CrossRef]
- Kato, M.; Zhou, Y. A basic study of optimal investment of power sources considering environmental measures: Economic evaluation of CCS through a real options approach. Electr. Eng. Japan (Engl. Transl. Denki Gakkai Ronbunshi) 2011, 174, 9–17. [Google Scholar] [CrossRef]
- Davies, L.L.; Uchitel, K.; Ruple, J. Understanding barriers to commercial-scale carbon capture and sequestration in the United States: An empirical assessment. Energy Policy 2013, 59, 745–761. [Google Scholar] [CrossRef]
- Liang, X.; Reiner, D.; Li, J. Perceptions of opinion leaders towards CCS demonstration projects in China. Appl. Energy 2011, 88, 1873–1885. [Google Scholar] [CrossRef]
- Lee, J.H.; Kwak, N.S.; Lee, I.Y.; Jang, K.R.; Lee, D.W.; Jang, S.G.; Kim, B.K.; Shim, J.-G. Performance and economic analysis of commercial-scale coal-fired power plant with post-combustion CO2 capture. Korean J. Chem. Eng. 2015, 32, 800–807. [Google Scholar] [CrossRef]
- Zheng, L.; Dongjie, Z.; Linwei, M.; West, L.; Weidou, N. The necessity of and policy suggestions for implementing a limited number of large scale, fully integrated CCS demonstrations in China. Energy Policy 2011, 39, 5347–5355. [Google Scholar] [CrossRef]
- Brosch, R. Portfolios of Real Options; Springer: Berlin/Heidelberg, Germany, 2008; Volume 7, ISBN 9783642021466. [Google Scholar]
- Pennings, E.; Lint, O. Market entry, phased rollout or abandonment? A real option approach. Eur. J. Oper. Res. 2000, 124, 125–138. [Google Scholar] [CrossRef]
- Trigeorgis, L. The Nature of Option Interactions and the Valuation of Investments with Multiple Real Options. J. Financ. Quant. Anal. 1993, 28, 1–20. [Google Scholar] [CrossRef]
- Herath, H.S.B.; Park, C.S. Multi-stage capital investment opportunities as compound real options. Eng. Econ. 2002, 47, 1–27. [Google Scholar] [CrossRef]
- Han, R. De Application of Compound Real Option Method in Decision-Making of the Wind Power Investment. Power Syst. Clean Energy 2012, 28, 69–74. [Google Scholar]
- Chang, K.; Wang, W.H.; Meng, Z. Investment Evaluation in Carbon Capture and Sequestration Technology of Coal-fired Power Plant Based on Compound Real Options. Sci. Technol. Manag. Res. 2012, 39–42. [Google Scholar] [CrossRef]
- Chen, T.; Shao, Y.F.; Tang, X.W. Coal-fired Power and CCS Investment Decision-making Issue Based on a Two Stage Investment Model under Multiple Uncertain Conditions. Syst. Eng. 2012, 3, 37–44. [Google Scholar]
- Intergovernmental Panel on Climate Change Summary for Policymakers. Assessment 2007, 3, 151–200. [CrossRef]
- Liu, R.; Zhai, X.B.; Chua, V. Carbon emission calculation of thermal power plant—An overview. In Proceedings of the 3rd International Conference on Energy and Environmental Protection, Xi’an, China, 26–27 April 2014; pp. 1368–1372. [Google Scholar]
- Liu, R.; Zhai, X. Bin Calculation of Carbon Emissions from China Coal Plants and the Reduction Suggestion. Ecol. Environ. Sci. 2014, 23, 1164–1169. [Google Scholar] [CrossRef]
- National Development and Reform Commission Provincial GHG Inventory Compilation Guidelines. Available online: https://wenku.baidu.com/view/7ae95325f111f18583d05a67.html (accessed on 22 May 2018).
- Cobb, B.R.; Charnes, J.M. Real Options Volatility Estimation with Correlated Inputs. Eng. Econ. 2004, 49, 119–137. [Google Scholar] [CrossRef]
- Zhao, L.; Xiao, Y.; Gallagher, K.S.; Wang, B.; Xu, X. Technical, environmental, and economic assessment of deploying advanced coal power technologies in the Chinese context. Energy Policy 2008, 36, 2709–2718. [Google Scholar] [CrossRef]
- People’s Network National Development and Reform Commission: China Has Officially Launched the National Carbon Emissions Trading System. Available online: http://finance.people.com.cn/n1/2017/1219/c1004-29716952.html (accessed on 13 January 2018).
- Wang, X.; Du, L. Study on CCS Investment Decision-Making Based on Compound Real Options for Coal-Fired Power Plant. Electr. Power 2016, 49, 179–184. [Google Scholar]
- People’s Bank of China RMB Deposit Benchmark Interest Rate. Available online: http://www.pbc.gov.cn/zhengcehuobisi/125207/125213/125440/125838/125888/2968982/index.html (accessed on 22 September 2017).
- Nemet, G.F.; Jakob, M.; Steckel, J.C.; Edenhofer, O. Addressing policy credibility problems for low-carbon investment. Glob. Environ. Chang. 2017, 42, 47–57. [Google Scholar] [CrossRef]
- Sun, L.; Chen, W. The improved ChinaCCS decision support system: A case study for Beijing-Tianjin-Hebei Region of China. Appl. Energy 2013, 112, 793–799. [Google Scholar] [CrossRef]
- Rubin, E.S.; Yeh, S.; Antes, M.; Berkenpas, M.; Davison, J. Use of experience curves to estimate the future cost of power plants with CO2 capture. Int. J. Greenh. Gas Control 2007, 1, 188–197. [Google Scholar] [CrossRef]
- Abadie, L.M.; Chamorro, J.M. European CO2 prices and carbon capture investments. Energy Econ. 2008, 30, 2992–3015. [Google Scholar] [CrossRef]
- Zhang, X.; Fan, J.L.; Wei, Y.M. Technology roadmap study on carbon capture, utilization and storage in China. Energy Policy 2013, 59, 536–550. [Google Scholar] [CrossRef]
- Cai, W.; Singham, D.I. A principal–agent problem with heterogeneous demand distributions for a carbon capture and storage system. Eur. J. Oper. Res. 2018, 264, 239–256. [Google Scholar] [CrossRef]
- Lee, S.Y.; Lee, J.U.; Lee, I.B.; Han, J. Design under uncertainty of carbon capture and storage infrastructure considering cost, environmental impact, and preference on risk. Appl. Energy 2017, 189, 725–738. [Google Scholar] [CrossRef]
- The Priceassociation of China Bohai-Rim Steam-Coal Price Index. Available online: http://www.cqcoal.com/exp/exponent.jsp (accessed on 7 October 2017).
- Zhou, W.; Zhu, B.; Chen, D.; Zhao, F.; Fei, W. How policy choice affects investment in low-carbon technology: The case of CO2 capture in indirect coal liquefaction in China. Energy 2014, 73, 670–679. [Google Scholar] [CrossRef]
- Rammerstorfer, M.; Eisl, R. Carbon capture and storage-Investment strategies for the future? Energy Policy 2011, 39, 7103–7111. [Google Scholar] [CrossRef]
- Detert, N.; Kotani, K. Real options approach to renewable energy investments in Mongolia. Energy Policy 2013, 56, 136–150. [Google Scholar] [CrossRef] [Green Version]
- Fuss, S.; Szolgayová, J. Fuel price and technological uncertainty in a real options model for electricity planning. Appl. Energy 2010, 87, 2938–2944. [Google Scholar] [CrossRef]
Figure 1.
Framework for investment opportunity in CCS retrofit.

Figure 2.
Flue gas treatment process in a coal-fired power plant.

Figure 3.
Calculation methods of coal combustion emissions under different conditions.

Figure 4.
Two-stage compound real options framework.

Figure 5.
Changes in the increased value at two stages.

Figure 6.
The binomial lattice of real options value.


Table 1.
The investment decision rules under ROA.
| TIV | Decision Rules | |
|---|---|---|
| TIV > 0 | TIV > NPV (ROV > 0) | To defer |
| TIV = NPV (ROV = 0) | To invest | |
| TIV = 0 | NPV < 0 | To abandon theoretically |
Table 2.
Parameters of CO2 emissions.
| Coal Consumption/(Ton) | Limestone Consumption/(Ton) | On-Grid Energy/(Million kWh/year) | Received Low Calorific Value/(MJ/kg) |
|---|---|---|---|
| 1,564,171.13 | 32,134.58 | 3278.77 | 18.406 |
Table 3.
CO2 emissions of one power generation unit (ton).
| Coal Combustion | Desulfurization | Total |
|---|---|---|
| 2,893,568 | 13,008 | 2,906,576 |
Table 4.
Fundamental parameters used in this model.
| Parameter | Description | Values | Notes |
|---|---|---|---|
| T1 | Demonstration project stage | 15/years | Set by this paper. |
| T2 | Commercial operation stage | 25/years | Set by this paper. |
| QE | Annual power generation | 3278.77/million kWh | Observed data. |
| Qc | CO2 emissions | 2,906,576/t | Calculation result. |
| ρ1 | Capture efficiency at period T1 | 90% | This capture efficiency is based on [4,19]. |
| ρ2 | Capture efficiency at period T2 | 95% | IPCC [45]. |
| ξ | Storage efficiency | 85% | IPCC [45]. |
| UI1 | Unit investment at initial time of T1 | 4395.77 RMB/kW | Set by [19]. |
| I2 | Investment at initial time of T2 | 138,516/104 RMB | Set by [52]. |
| RE | Returns on EOR project | 39,399/104 RMB | Set by [52]. |
| Fc | coal consumption | 1,564,171.13/t | Observed data. |
| rf | Risk-free rate | 4.24% | The average of benchmark one-year fixed deposit rate from 1990 to 2015 [53]. |
| r | Discount rate | 8% | Set by the general construction project investment rate of return [30,54,55]. |
| α | Technology uncertainty about investment cost | 0.05 | Referring to [27]. |
| β | Technology uncertainty about O&M cost | 0.057 | Set by [56]. |
| UT | Unit transportation cost | 100/RMB 1 | Set by [17]. |
| UO&M | Unit O&M cost | 13.78 RMB/MWh | Based on [57]. |
| US | Unit CO2 storage cost | 50/RMB 2 | Set by [17]. |
| ω | Energy consumption ratio (%) | 32% 3 | IPCC [45]. |
| Pe | Clean electricity tariff | 0.015/RMB | Refering to desulfurization electricity price [17,19]. |
1 In this study, we assumed that the power plant site is adjacent to the oil-field. Based on [58,59], the transport cost will be almost 80 RMB/ton for every 100 km by 2020. Considering the thickness of the pipe steel or other technical limitations, the transport cost is also believed to be almost 20€/per ton (120 RMB/ton) [26,60]. In this case, referring to [17], the average 100 RMB/ton is set as the transportation cost in our paper; 2 According to [58], the storage cost is slightly less than 50 RMB/ton by 2020. Indeed, storage costs were assumed to be higher because the search for a site is more complex and longer than envisaged, and the requirements in terms of surveillance are rather on the rise. Therefore, based on [17], we set this cost as 50 RMB/ton to be more realistic; 3 Based on IPCC [45], a power plant equipped with a CCS system (with access to geological or ocean storage) would need roughly 10–40% more energy than a plant of equivalent output without CCS, of which most is for capture and compression. Specifically, the range reflects three types of power plants: for Natural Gas Combined Cycle plants, the range is 11–22%; for Pulverized Coal plants, 24–40%; and for Integrated Gasification Combined Cycle plants, 14–25%. We used the average of 24% and 40% to represent energy consumption ratio, i.e., 32%.
Table 5.
The cash flow statement of the demonstration project phase.
| Capital Flows | 2017 | 2018 | 2019 | 2020 | 2021 | 2022–2029 | 2030 | 2031 | 2032 |
|---|---|---|---|---|---|---|---|---|---|
| Cash inflows/104 RMB | 0 | 16,412 | 15,444 | 14,558 | 13,746 | …… | 8918 | 8581 | 8273 |
| Cash outflows/104 RMB | 276,934 | 26,432 | 24,496 | 22,704 | 21,044 | …… | 10,663 | 9891 | 9176 |
| Net income/104 RMB | −276,934 | −10,020 | −9052 | −8146 | −7298 | …… | −1745 | −1310 | −903 |
Table 6.
The cash flow statement of the commercial operation phase.
| Capital Flows | 2033 | 2034 | 2035 | 2036 | 2037 | 2038 | 2039–2054 | 2055 | 2056 | 2057 |
|---|---|---|---|---|---|---|---|---|---|---|
| Cash inflows/104 RMB | 8161 | 47,287 | 47,037 | 46,808 | 46,598 | 46,406 | …… | 44,785 | 44,746 | 44,710 |
| Cash outflows/104 RMB | 147,029 | 47,247 | 46,677 | 46,150 | 45,661 | 45,207 | …… | 41,024 | 40,906 | 40,797 |
| Net income/104 RMB | −138,868 | 40 | 360 | 658 | 937 | 1199 | …… | 3761 | 3840 | 3913 |
Table 7.
Values of C2 under different subsidies.
| η2/% | 0 | 10 | 20 | 30 | 40 | 50 | 60 | 70 | 80 | 90 | 100 |
|---|---|---|---|---|---|---|---|---|---|---|---|
| C2/104 RMB | 0 | 0 | 0 | 0 | 0 | 0 | 0 | 375 | 1048 | 1890 | 2733 |
Table 8.
Investment values under different government subsidies.
| η1, η2/% | 0 | 10 | 20 | 30 | 40 | 50 | 60 | 70 | 80 | 90 | 100 |
|---|---|---|---|---|---|---|---|---|---|---|---|
| NPV/104 RMB | −360,904 | −328,305 | −295,706 | −263,107 | −230,508 | −197,909 | −165,310 | −132,711 | −100,112 | −67,513 | −34,914 |
| C/104 RMB | 0 | 0 | 0 | 0 | 0 | 0 | 0 | 113 | 316 | 569 | 823 |
| TIV/104 RMB | −360,904 | −328,305 | −295,706 | −263,107 | −230,508 | −197,909 | −165,310 | −132,598 | −99,796 | −66,944 | −34,091 |
Table 9.
Critical carbon prices under different government subsidy coefficients.
| Pc/(RMB/ton) | η2/% | 70 | 80 | 90 | 100 |
| η1= 90% | 195.67 | 194.89 | 193.92 | 192.95 | |
| η1= 100% | 89.81 | 89.03 | 88.06 | 87.09 |
© 2018 by the authors. Licensee MDPI, Basel, Switzerland. This article is an open access article distributed under the terms and conditions of the Creative Commons Attribution (CC BY) license (http://creativecommons.org/licenses/by/4.0/).
Share and Cite
MDPI and ACS Style
Cui, H.; Zhao, T.; Wu, R. An Investment Feasibility Analysis of CCS Retrofit Based on a Two-Stage Compound Real Options Model. Energies 2018, 11, 1711. https://doi.org/10.3390/en11071711
AMA Style
Cui H, Zhao T, Wu R. An Investment Feasibility Analysis of CCS Retrofit Based on a Two-Stage Compound Real Options Model. Energies. 2018; 11(7):1711. https://doi.org/10.3390/en11071711
Chicago/Turabian StyleCui, Herui, Tian Zhao, and Ruirui Wu. 2018. "An Investment Feasibility Analysis of CCS Retrofit Based on a Two-Stage Compound Real Options Model" Energies 11, no. 7: 1711. https://doi.org/10.3390/en11071711
Note that from the first issue of 2016, this journal uses article numbers instead of page numbers. See further details here.