Article

Spatial Site Selection for Solar Power Plants Using a GIS-Based Boolean-Fuzzy Logic Model: A Case Study of Markazi Province, Iran

by
Hossein Yousefi
1,
Hamed Hafeznia
1 and
Amin Yousefi-Sahzabi
2,3,*
1
Department of Renewable Energies and Environmental Engineering, Faculty of New Sciences and Technologies, University of Tehran, Tehran, Iran
2
Department for Management of Science and Technology Development, Ton Duc Thang University, Ho Chi Minh City, Vietnam
3
Faculty of Environment and Labour Safety, Ton Duc Thang University, Ho Chi Minh City, Vietnam
*
Author to whom correspondence should be addressed.
Energies 2018, 11(7), 1648; https://doi.org/10.3390/en11071648
Submission received: 15 March 2018 / Revised: 25 April 2018 / Accepted: 7 May 2018 / Published: 25 June 2018
(This article belongs to the Section A: Sustainable Energy)

Abstract

:
Selection of suitable sites for solar power plants requires spatial evaluation taking technical, economic, and environmental considerations into account. This research has applied a fuzzy logic model to carry out spatial site selection for solar power plants in Markazi Province of Iran. Geographical Information System (GIS) capabilities have been used for spatial analysis and visualization of the research results. The suitable areas for solar power plants installation were identified by employing Boolean logic and defining a range of selection criteria all of which were evaluated by fuzzy functions. The raster layers of Boolean and fuzzy logic have been combined to come up with suitable sites with solar energy potential. The results identified some areas in the vicinity of Mahalat and Zarandineh cities as suitable for solar energy utilization. The research also validated the employed combined method as a suitable site selection approach for solar power plants.

1. Introduction

Solar energy is one of the most promising renewables because it is considered a consistent source of energy that is not significantly vulnerable to seasonal weather patterns changes [1]. In addition, the output efficiency of solar technologies has been increasing in recent years and the ability to utilize them in a variety of locations is very favorable [2]. The demand for solar energy is increasing worldwide as countries are following steps for sustainable development and CO2 emissions reduction [3]. Solar energy can be exploited through the solar photovoltaic (PV) and solar thermal technologies for various applications. Solar radiation can be converted directly into electricity by using photovoltaic (PV) technology, which is one of the potential methods that offer clean and renewable energy. Compared to CO2 emissions from coal combustion which amounts to 975 g per kilowatt-hour (kWh), the emissions from using PV is about 50 g per kWh [4]. It offers ongoing free energy and the life expectancy of solar products can be up to 30 years [4]. In recent years extensive studies were conducted on the optimal use of solar energy [5,6,7,8,9,10,11,12,13,14,15,16]. Studies have demonstrated that solar energy can roughly fulfill 1000 times the global energy requirement; although, nowadays only 0.02% of this energy is utilized [17]. Such estimations are generally based on the physically available solar radiation on the Earth’s surface [18]. Although the global utilization level of solar energy has been a small fraction of its actual capacity, in recent years the investments in solar energy have grown significantly [19].
Europe, China, and the United States are the main investors in this field. A recent report by Renewable Energy Policy Network for the 21st Century (REN21), however, revealed that developing world invested more in renewable energy than rich countries for the first time in 2015 [20]. Devabhaktuni et al. [2] believe solar energy is a beneficial utility, especially for developing countries, for several reasons, including the locations of most developing countries in regions with high solar radiation.
Large-scale PV systems provide significant environmental advantages when compared to conventional energy sources. In addition, it facilitates the reuse of marginal lands [21]. However, the required area for implementing large PV systems may cause undesirable impacts on landscape, land use, and biodiversity [22]. Preferably, these implementations should be located on unused, low productivity lands to minimize such impacts [23]. Non-ideal locations are forests, extreme remote areas, and the areas with instability and a high degree of existing development [24]. In order to identify a suitable location for solar PV installation, spatial analysis with multi-criteria function and decision support system is required. In recent years, spatial analyses of renewable energy suitability became a popular research area [25].
Massimo et al. [26] developed a geographical information database system (GIS DB) for the integration of solar energy in the energy planning of a wide area of central Italy to evaluate the productive potential of the land use, estimate residential energy consumptions and assess the renewable energy sources. De Simón-Martín et al. [27] developed an innovative Geographic Information System (GIS) application to locate and supervise the operation of a large PV plant of 108 kWp and a small PV plant of 9 kWp installed on a home rooftop. Their developed tool could increase control of the PV plant performance and could help to “evaluate several PV module replacement strategies in a preventive maintenance program”. Huld et al. [28] developed a GIS-based tool to perform geospatial analysis and mapping of the energy output and reliability of PV mini-grid system for estimating the performance of photovoltaic (PV) mini-grid system over large geographical areas. Carrion et al. [29] conducted a study aimed to determine the electricity generation capacity of solar photovoltaic power plants and to select solar energy site in Andalusia (Spain). They defined criteria with considering national parks, land use, urban planning, slope, shadows, accessibility, radiation, sunshine hours and temperature. Hofierka and Kanuk [30] presented a method for evaluation of photovoltaic potential in urban areas using open source solar tools and three-dimensional modeling in an urban environment using GIS. This radiation tool provided R.Sun solar radiation model, which was estimated using PVGIS application. Janke [31] identified the sites with high potential for solar and wind fields in Colorado and found suitable areas for development of solar and wind fields using multi-criteria modeling and such criteria as wind potential, solar potential, distance to transportation lines, distance to the city, population density, distance from heavy roads and state lands acquired using the GIS. Aragonés-Beltrán et al. [32] selected the best variable among four variables using analytic network process (ANP) by minimizing the risk for photovoltaic power plant projects. They used twelve criteria for implementation of the decision-making process.
In order to select the most optimal sites for new development plans including solar power plants, it is necessary to develop a set of criteria and factors to facilitate the decision-making process. To assess the suitability of land for the construction of photovoltaic fields, Charabi and Gastli [33] used technical criteria including solar radiation indices, access to land and land use; economic criteria including proximity to the distribution network and slope; and environmental criteria including sensitive areas, hydraulic lines, and risk of dunes. Sánchez-Lozano et al. [34] categorized the criteria as environmental including agrological capacity; geomorphological including slope, orientation, and area; location including distance to roads, distance to power lines, distance to villages, distance to substations; and climatic including solar irradiation potential and average temperature. In another categorization of the criteria for photovoltaic site selection, Uyan [35] suggested environmental criteria including distance from residential areas and land use; and economic criteria including distance from roads, slope and distance from transmission lines. Weights can be assigned to the above criteria according to their importance and each of the variable and their weights may have more or less favorability in the final decision than another [33].
To facilitate the flow of environmental information from data sources to decision-makers there is a growing need for well-developed environmental information systems [36]. In recent years, ArcGIS software has transformed the environmental decision-making process. It has significantly changed the organization and management of geographical data and has improved the spatial modeling and assessment capabilities across a range of disciplines [37,38,39,40,41,42]. The application of GIS software in the selection of the suitable sites for new development plans can highly accelerate the decision-making with combining different data layers in the form of different conceptual models. Based on the type of combination strategy in these models, the type, value, and the number of data layers will be different [43].
The majority of GIS-based site suitability studies are built upon multi-criteria analysis (MCA) to synthesize complex problems with multiple variables [44]. According to Hermann et al. [45] MCA is “a decision-making tool used in environmental systems analysis to evaluate a problem by giving an order of preference for multiple alternatives on the basis of several criteria that may have different units” (p. 1788). Some methods for multi-criteria analysis include analytic hierarchical process (AHP), analytic network process (ANP), Boolean logic, weighted linear combination (WLC), and fuzzy logic. These methods have been used for identifying optimal sites for solar PV installation (e.g., [33,34,35,46,47,48]). AHP is one of the most comprehensive systems designed for multi-criteria decision-making developed by Saaty [49]. Using this method, it is possible to formulate problems in a hierarchical fashion [38]. AHP’s main characteristic is based on paired comparisons [43]. Complex problems with multiple criteria can be broken down into a number of one-to-one comparisons [50]. ANP, however, is a more general form of the AHP which considers the interdependence of the included criteria [51]. “It takes the dependence and feedback among elements into account based on the actual situation which expands and improves AHP so that it can simulate the complex interrelationships of reality better” [52] (p. 42). In Boolean logic, all values attributed to the criteria are reduced to either TRUE (1) or FALSE (0) meaning that in each criterion the land is either suitable or unsuitable [53] for a particular development plan such as solar power plant installation. In WLC, instead of absolute values of 0 or 1, importance weights are assigned to criteria. Both Boolean and WLC methods employ discrete thresholds to define suitability, and the values and weights are usually defined by a group of experts [54]. In both methods, many assumptions and uncertainties are involved, while no sensitivity analysis is performed [44]. In contrast, fuzzy logic provides the possibility of more flexible analyses where there are no certain boundaries between suitable and non-suitable [55]. The fuzzy concept in site selection studies involves classes with continuous grades of membership ranging from 0 to 1, with 0 as the indication of absolute falsehood showing that an area is not suitable for intended plan; 1 as the indication of the absolute truth showing that the area is suitable, and values between 0 and 1 showing “partial membership of suitability” [44].
Although the use of fuzzy logic for geospatial analysis offers more realistic results for decision-making than the Boolean method [56], combining these two methods would utilize the capabilities of both of them to provide a strong analytical tool for site selection studies using GIS. This research intends to develop a comprehensive GIS-based Boolean-fuzzy model for site selection of solar power plant in semi-arid regions of central Iran. Using such approach for PV siting has not been widely studied and a research gap is lying there. Therefore, this research can shed some light on the way the Boolean and fuzzy logics can be utilized together for solar power plant site selection.
There are great potentials for PV utilization in central and southern regions of Iran. Some studies have investigated and quantified these potentials. Khorasanizadeh and Mohammadi [57] predicted daily global solar radiation in four cities of Iran: Tabass, Isfahan, Kerman, and Bandarabass, which are located in sunny regions. To assess the potential of solar energy in Iran, another study has been carried out by Besarati et al. [58] through which they generated several solar maps of Iran and also, they investigated the viability of PV power plants in 50 Iranian cities. Based on the results of their work, Arak, the capital of Markazi Province, was identified as a suitable place for the installation of PV power plants. Estimated solar radiation in Iran is about 1800–2200 kWh/m2 which is higher than global average [59]. In terms of receiving solar radiation, Iran is a good area for deployment of solar power plants. Thus, it is essential to identify zones where are optimal locations for the PV development by considering economic, environmental, and technical criteria. The comprehensive framework used in this research may be helpful for solar energy planning and policy making in other semi-arid regions.

2. Materials and Methods
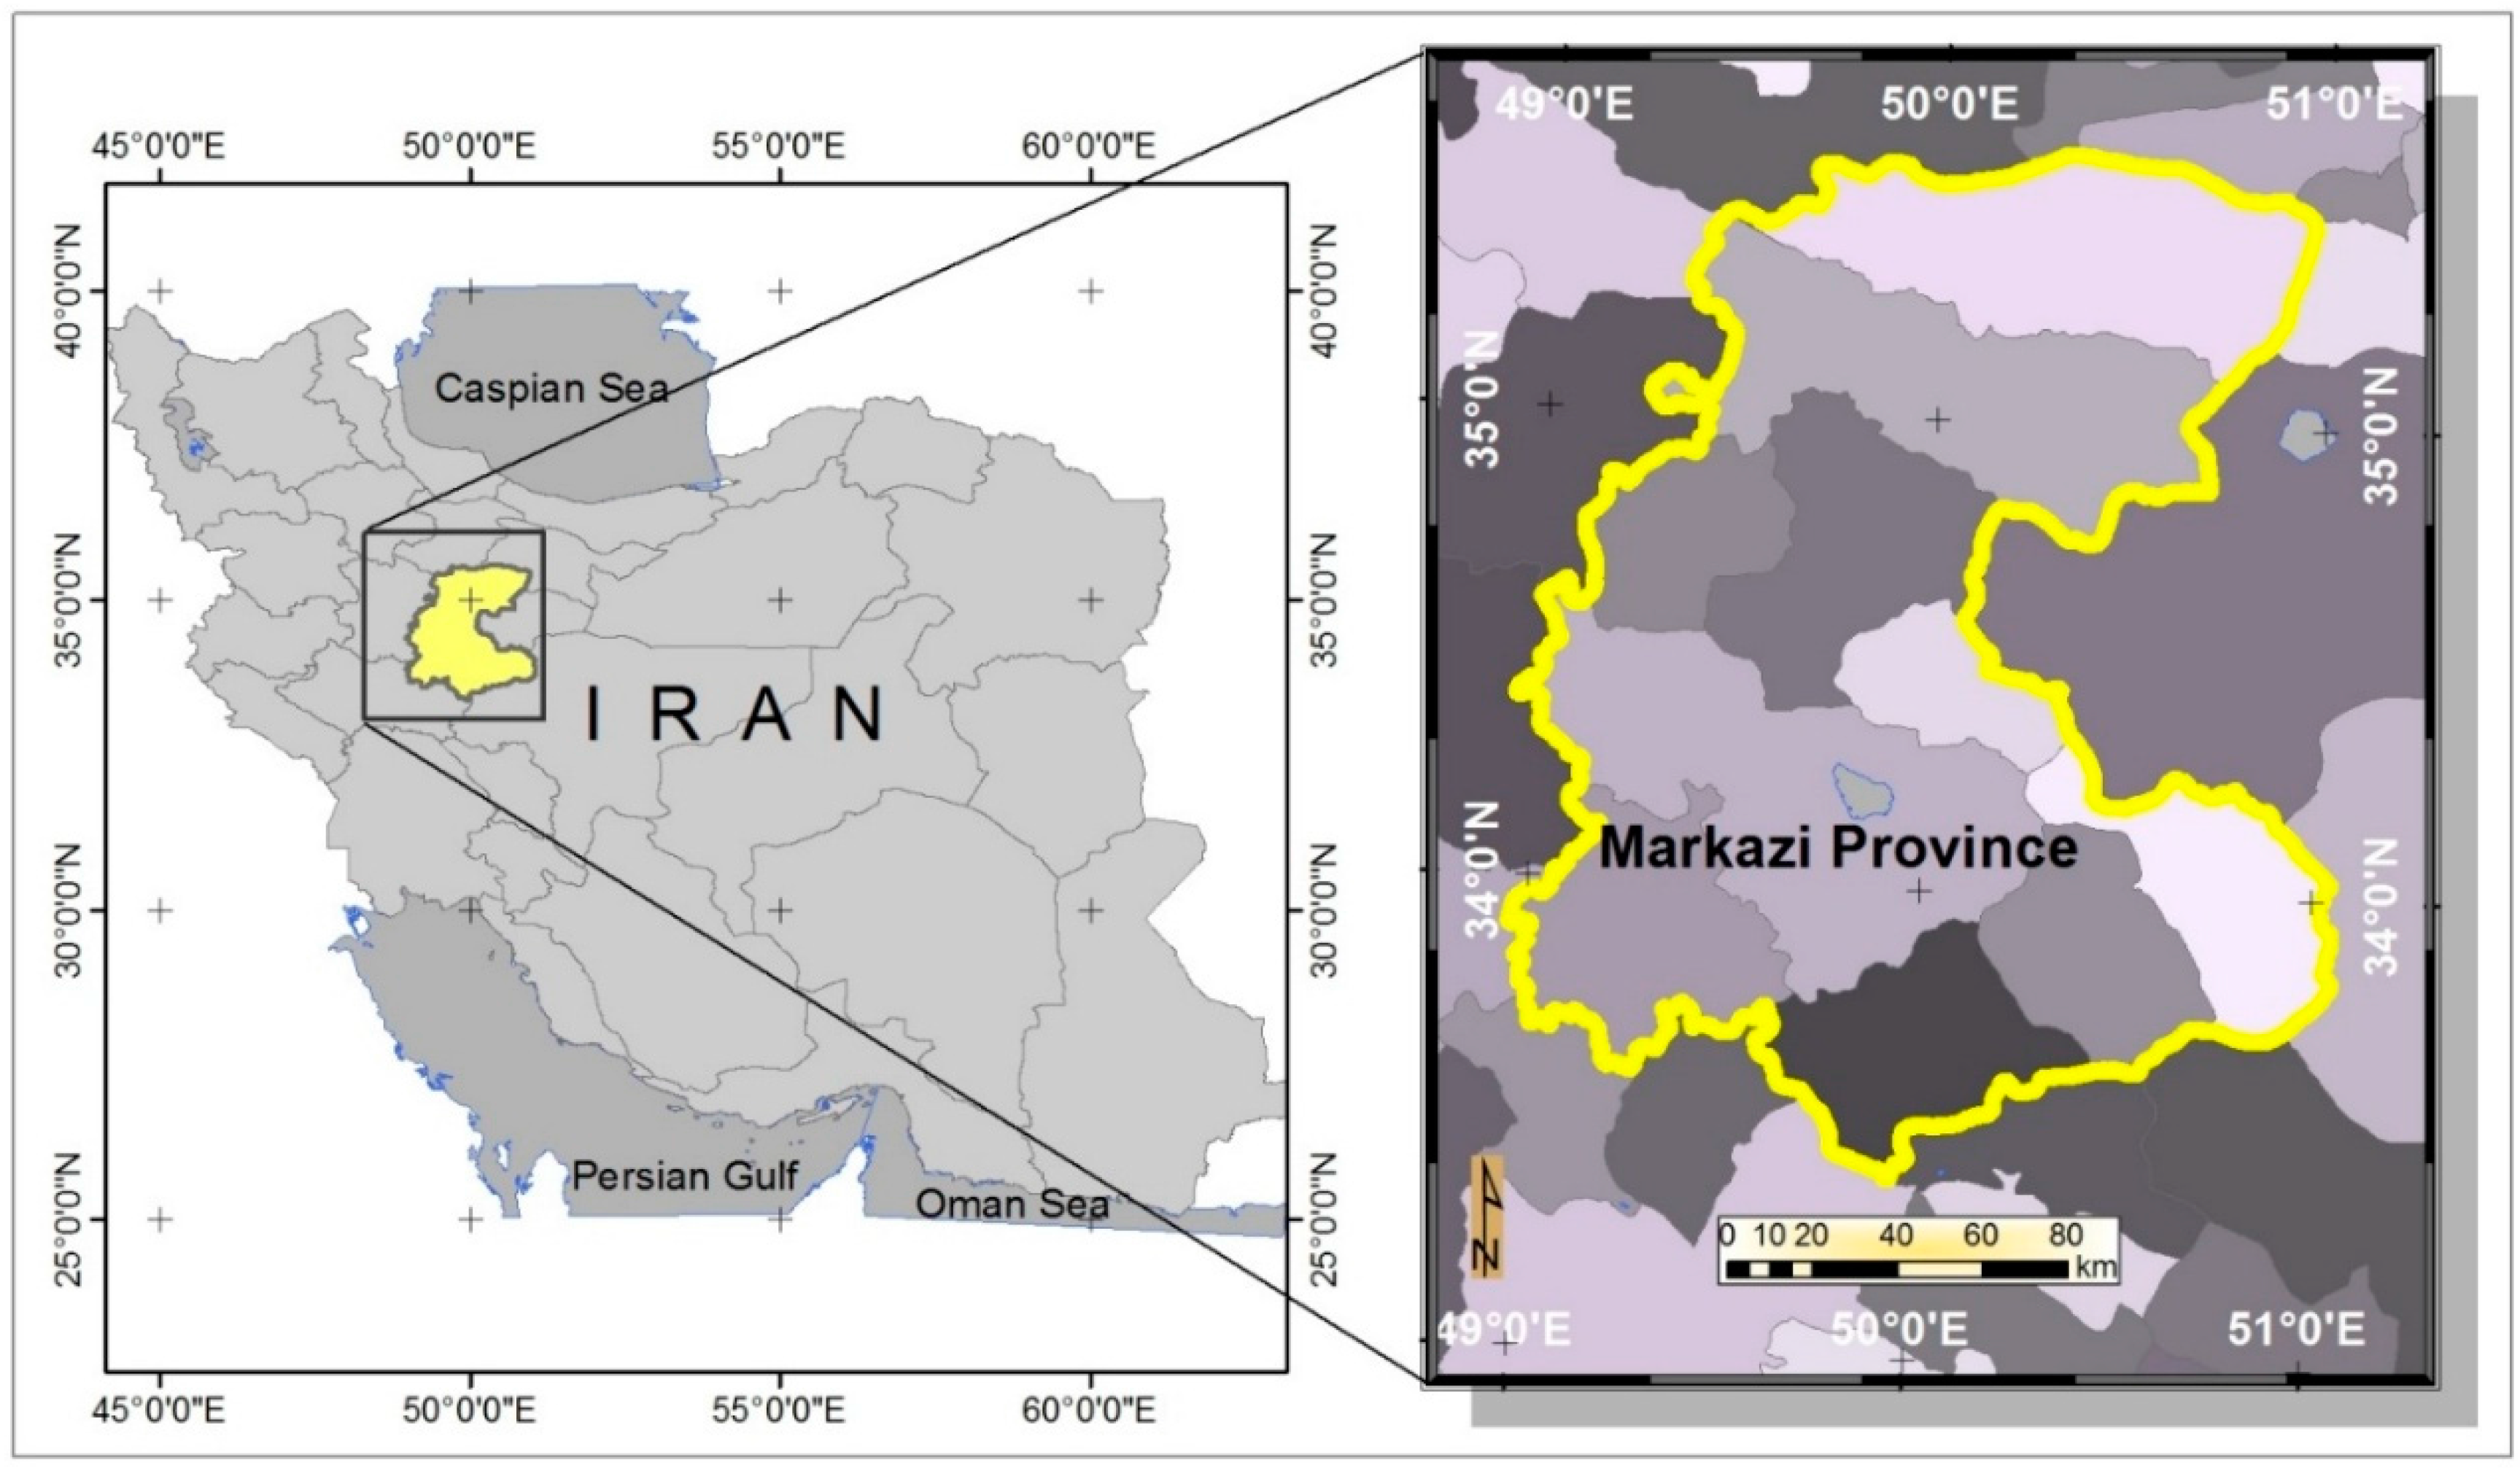
2.1. Case Study

Markazi Province has an area of 29,530 square kilometers and a population over 1,413,959 people in the latitude from 33 degrees and 30 min to 35 degrees and 35 min and a longitude from 48 degrees and 57 min to 51 degrees in east longitude (Greenwich meridian) (Figure 1). The lowest part of the province is the Saveh plain with a height less than 1200 above sea level and the highest point is Shobaz Mountain (in the Rasund mountain range) with an altitude of 3388 m above sea level. Fifty percent of the total area of the province has a temperate mountainous climate, 38% has a semi-desert climate and 12% mountainous climate. Average annual temperature is 13.7 °C, average precipitation is 209.5 mm and average relative humidity is 46% based on 12 years annual reports of Arak station. The province has a semi-arid climate.

2.2. Criteria Selection and Data Acquisition

To select suitable sites for solar energy utilization in the study area it is required to determine effective spatial criteria and factors on the viability of solar power plants (SPPs). The selected factors of this research were extracted from expert opinions and previous research studies. The approaches for GIS-based multi-criteria evaluation (MCE) traditionally utilize discrete criteria to outline suitability and are usually defined by the opinion of anonymous expert panels [44,54] consisting university professors, researchers, business professionals, decision-makers, authorities and stakeholders [43,60,61]. Having a diverse panel of experts will ensure that the defined criteria are not only based on the economic, environmental and technical principals but also meet the legal and regulatory frameworks.
The criteria used in this study are categorized into three groups: economic, environmental and technical (Figure 2). For data acquisition, multiple data sources have been used. The required data have been collected from different sources such as previous studies, field studies, questionnaires, satellite images, maps and statistical data. The utilized spatial data were 1:25,000 topographic maps obtained from National Cartographic Center and 1:100,000 maps of the Geological Survey of Iran. ASTER satellite image of Digital Elevation Model (DEM), land use and synoptic meteorological data from 2010 to 2011 have also been used for the stations in desired areas.

2.2.1. Economic Criteria

The economic criteria selected for this research are distance to faults, distance to roads, distance to urban and rural areas, slope, and elevation. The proximity of power plants to urban and industrial areas plays a crucial role in the viability of SPPs because the transmission and distribution cost of generated electricity and the network losses has a direct relation with the distance to the consumers. On the other hand, accessibility to the transport network minimizes the operational costs of SPPs, because proximity to the roads will reduce the transportation costs of power plants [48]. To reduce wasting energy from the electrical grid, it is necessary to build power stations near the residential areas and transmission lines. Developing new transmission lines increases the capital investment of SPPs as well as destructs the environment. In this research, it is assumed that the proximity to residential areas will ensure a shorter distance to power transmission lines. In the final selection of suitable sites, the managers and decision-makers can select locations closer to transmission lines when deciding between the sites with similar suitability score.
Slope and elevation are other economic criteria. Slope shows the gradient of Earth’s surface, which can be an important factor in civil issues relevant to construction and deployment of solar plants. Consideration of the slopes is also effective on the reducing the civil costs of SPPs. Elevation was considered using the topographic map showing the mountains and paved areas which are mainly in the urban areas of Markazi Province. It is more challenging and costly to built SPPs in mountainous and high altitude lands.

2.2.2. Environmental Criteria

Land use, distance to protected areas, and distance to rivers and water resources are among the environmental criteria selected for this research. Land availability is a basic part of the site selection process [35,62]. PV power plants usually need large areas that may adversely affect the environment and the communities around it. Some areas are inappropriate for SPPs construction such as forests, protected areas, wetlands and water resources like rivers and lakes. Land use map should be utilized for the management and modification of natural environment into built environment such as urban settlement, power stations, industrial zone and etc. in a sustainable way. Since the present study aims to preserve environmental resources and reduce damage to the environment, it excludes the protected areas and sensitive plant species from the selected sites for SPPs. The land use map was prepared and entered into GIS environment using satellite images.

2.2.3. Technical Criteria

Several technical criteria mainly related to climatic factors could be considered for SPP site selection. Climatic factors include temperature, precipitation, humidity, and sunshine hours. To increase the reliability and optimize the performance efficiency of large-scale PV power plants the temperature effect should be integrated within the process of SPPs site assessment [63]. Rainfall characteristics such as rainy and snowy days show the amount of particular matters in the atmosphere. So, areas with high precipitation have higher PMs which absorb and reflect shortwave radiation [48]. Relative humidity is a measure of moisture factor such as the amount of water vapor in the atmosphere. Water vapor and CO2 are gases absorbing solar shortwave radiation. Regions with high relative humidity are not proper to generate electricity from solar energy, due to the reduction of the rate of absorbing solar radiation by water vapor in the air.
Various climatic factors could be considered when deciding between the candidate locations; however, in this research, the main technical factor included in the spatial analysis is sunshine hours. The number of sunshine hours is the most critical parameter to select the sites with enough solar radiation for the power plant [34]. The interpolated map shows the distribution of sunshine hours and average sunshine hours throughout the year. The areas receiving greater solar radiation throughout the year can be identified by this generated map.

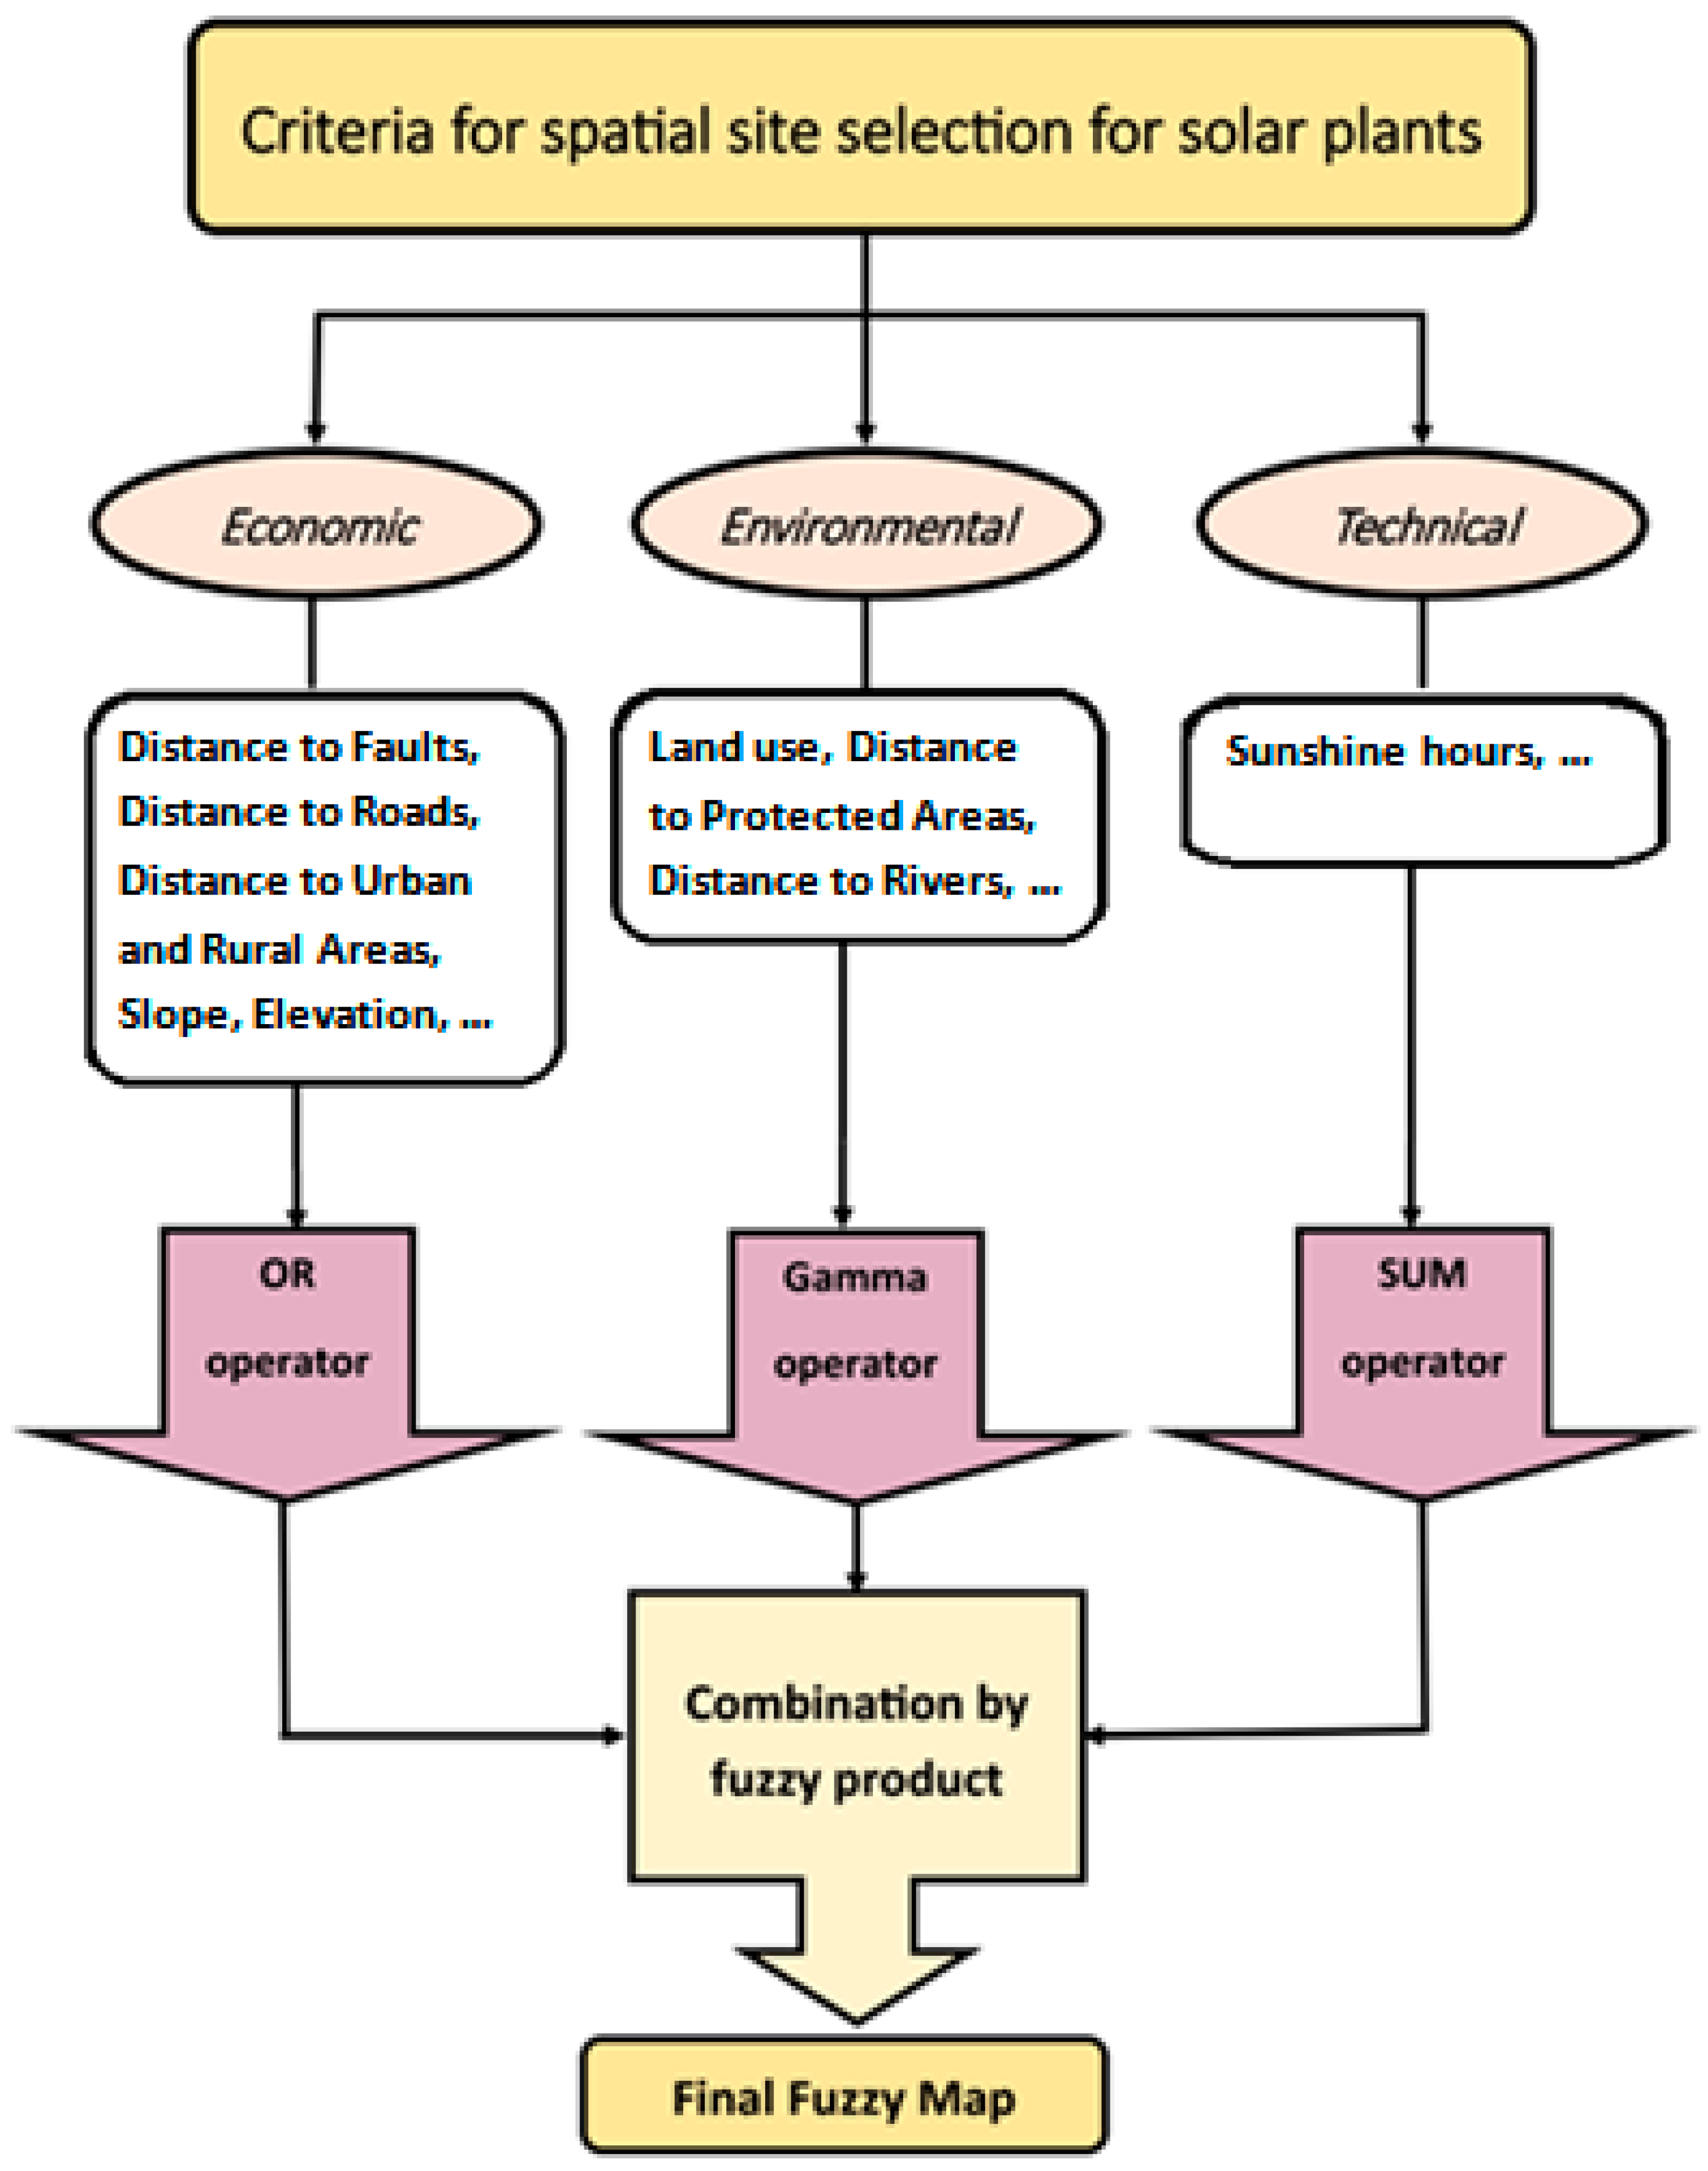
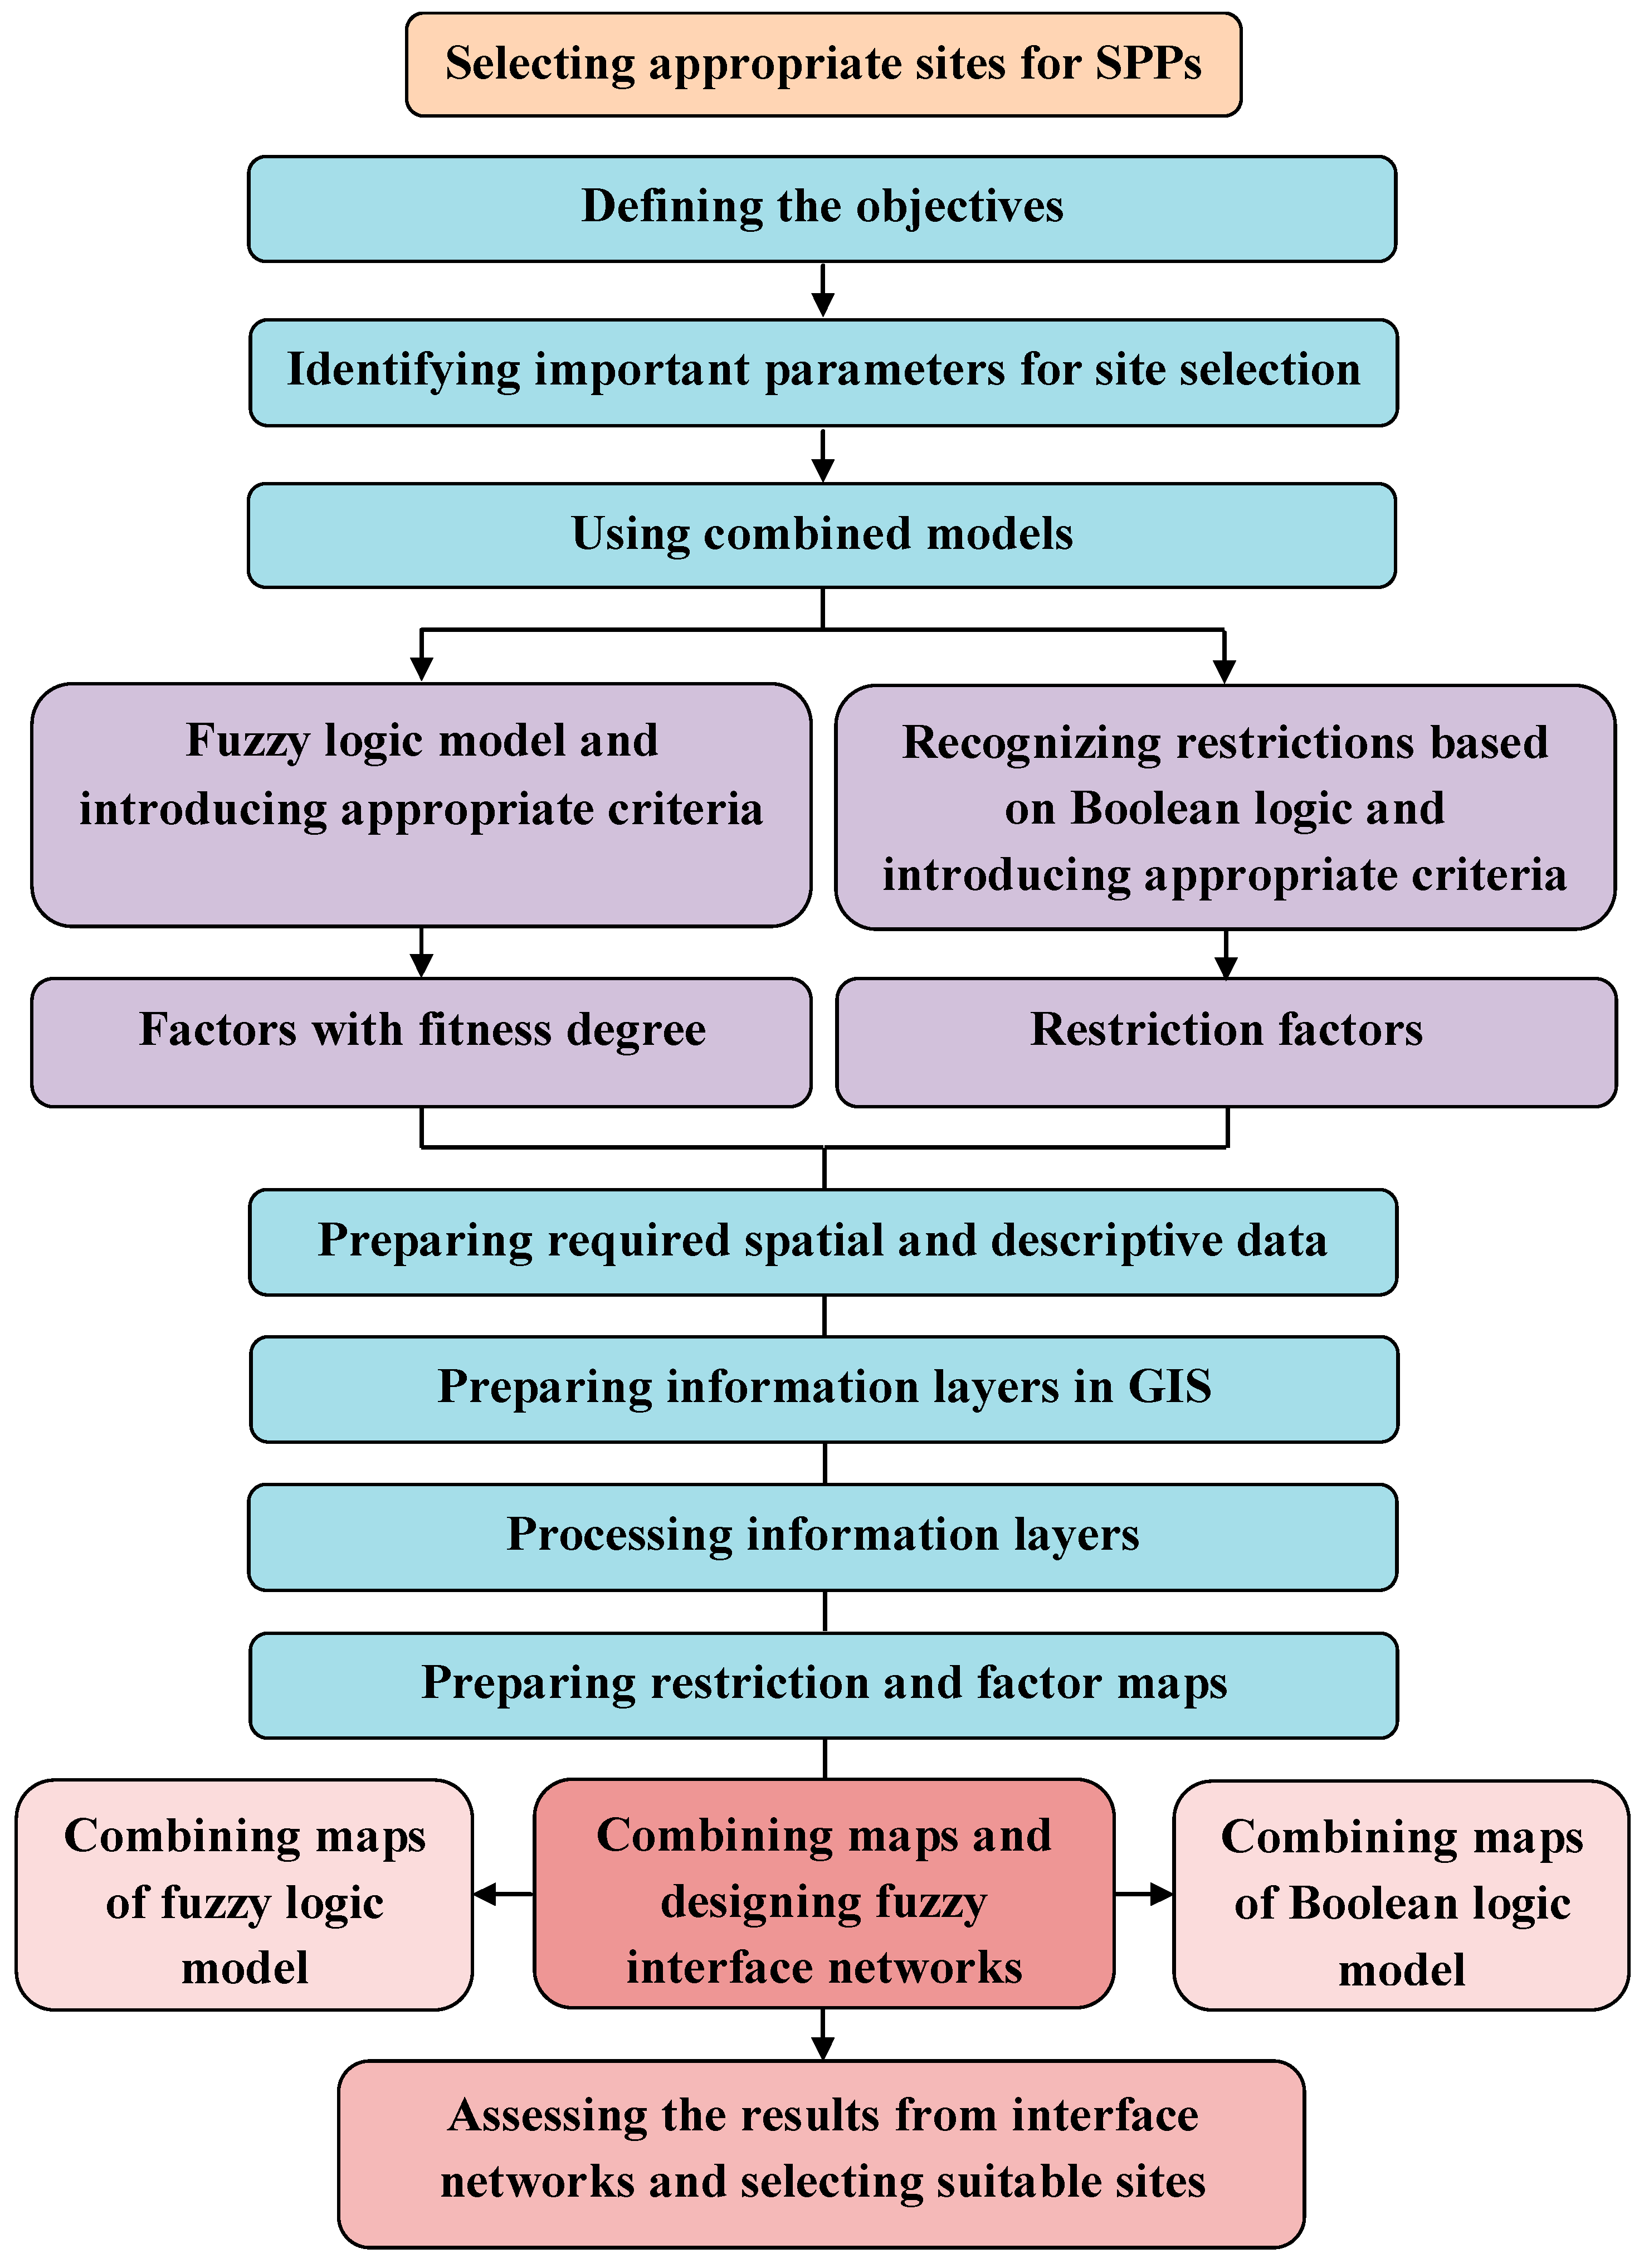
2.3. Conceptual Framework

For the spatial site selection of solar power plants, it is required to assess all points of the study area based on the set of selected criteria. According to the conceptual framework of this research (Figure 3), the evaluation process has two steps. At first step, by using Boolean logic and spatial data layers, restricted areas are excluded from the Markazi Province map. For the selection of suitable locations, the remaining areas are evaluated by fuzzy logic to have a standardized valuation of the entire province. Regions which have more value are selected as the suitable sites for SPPs.

3. Data Processing

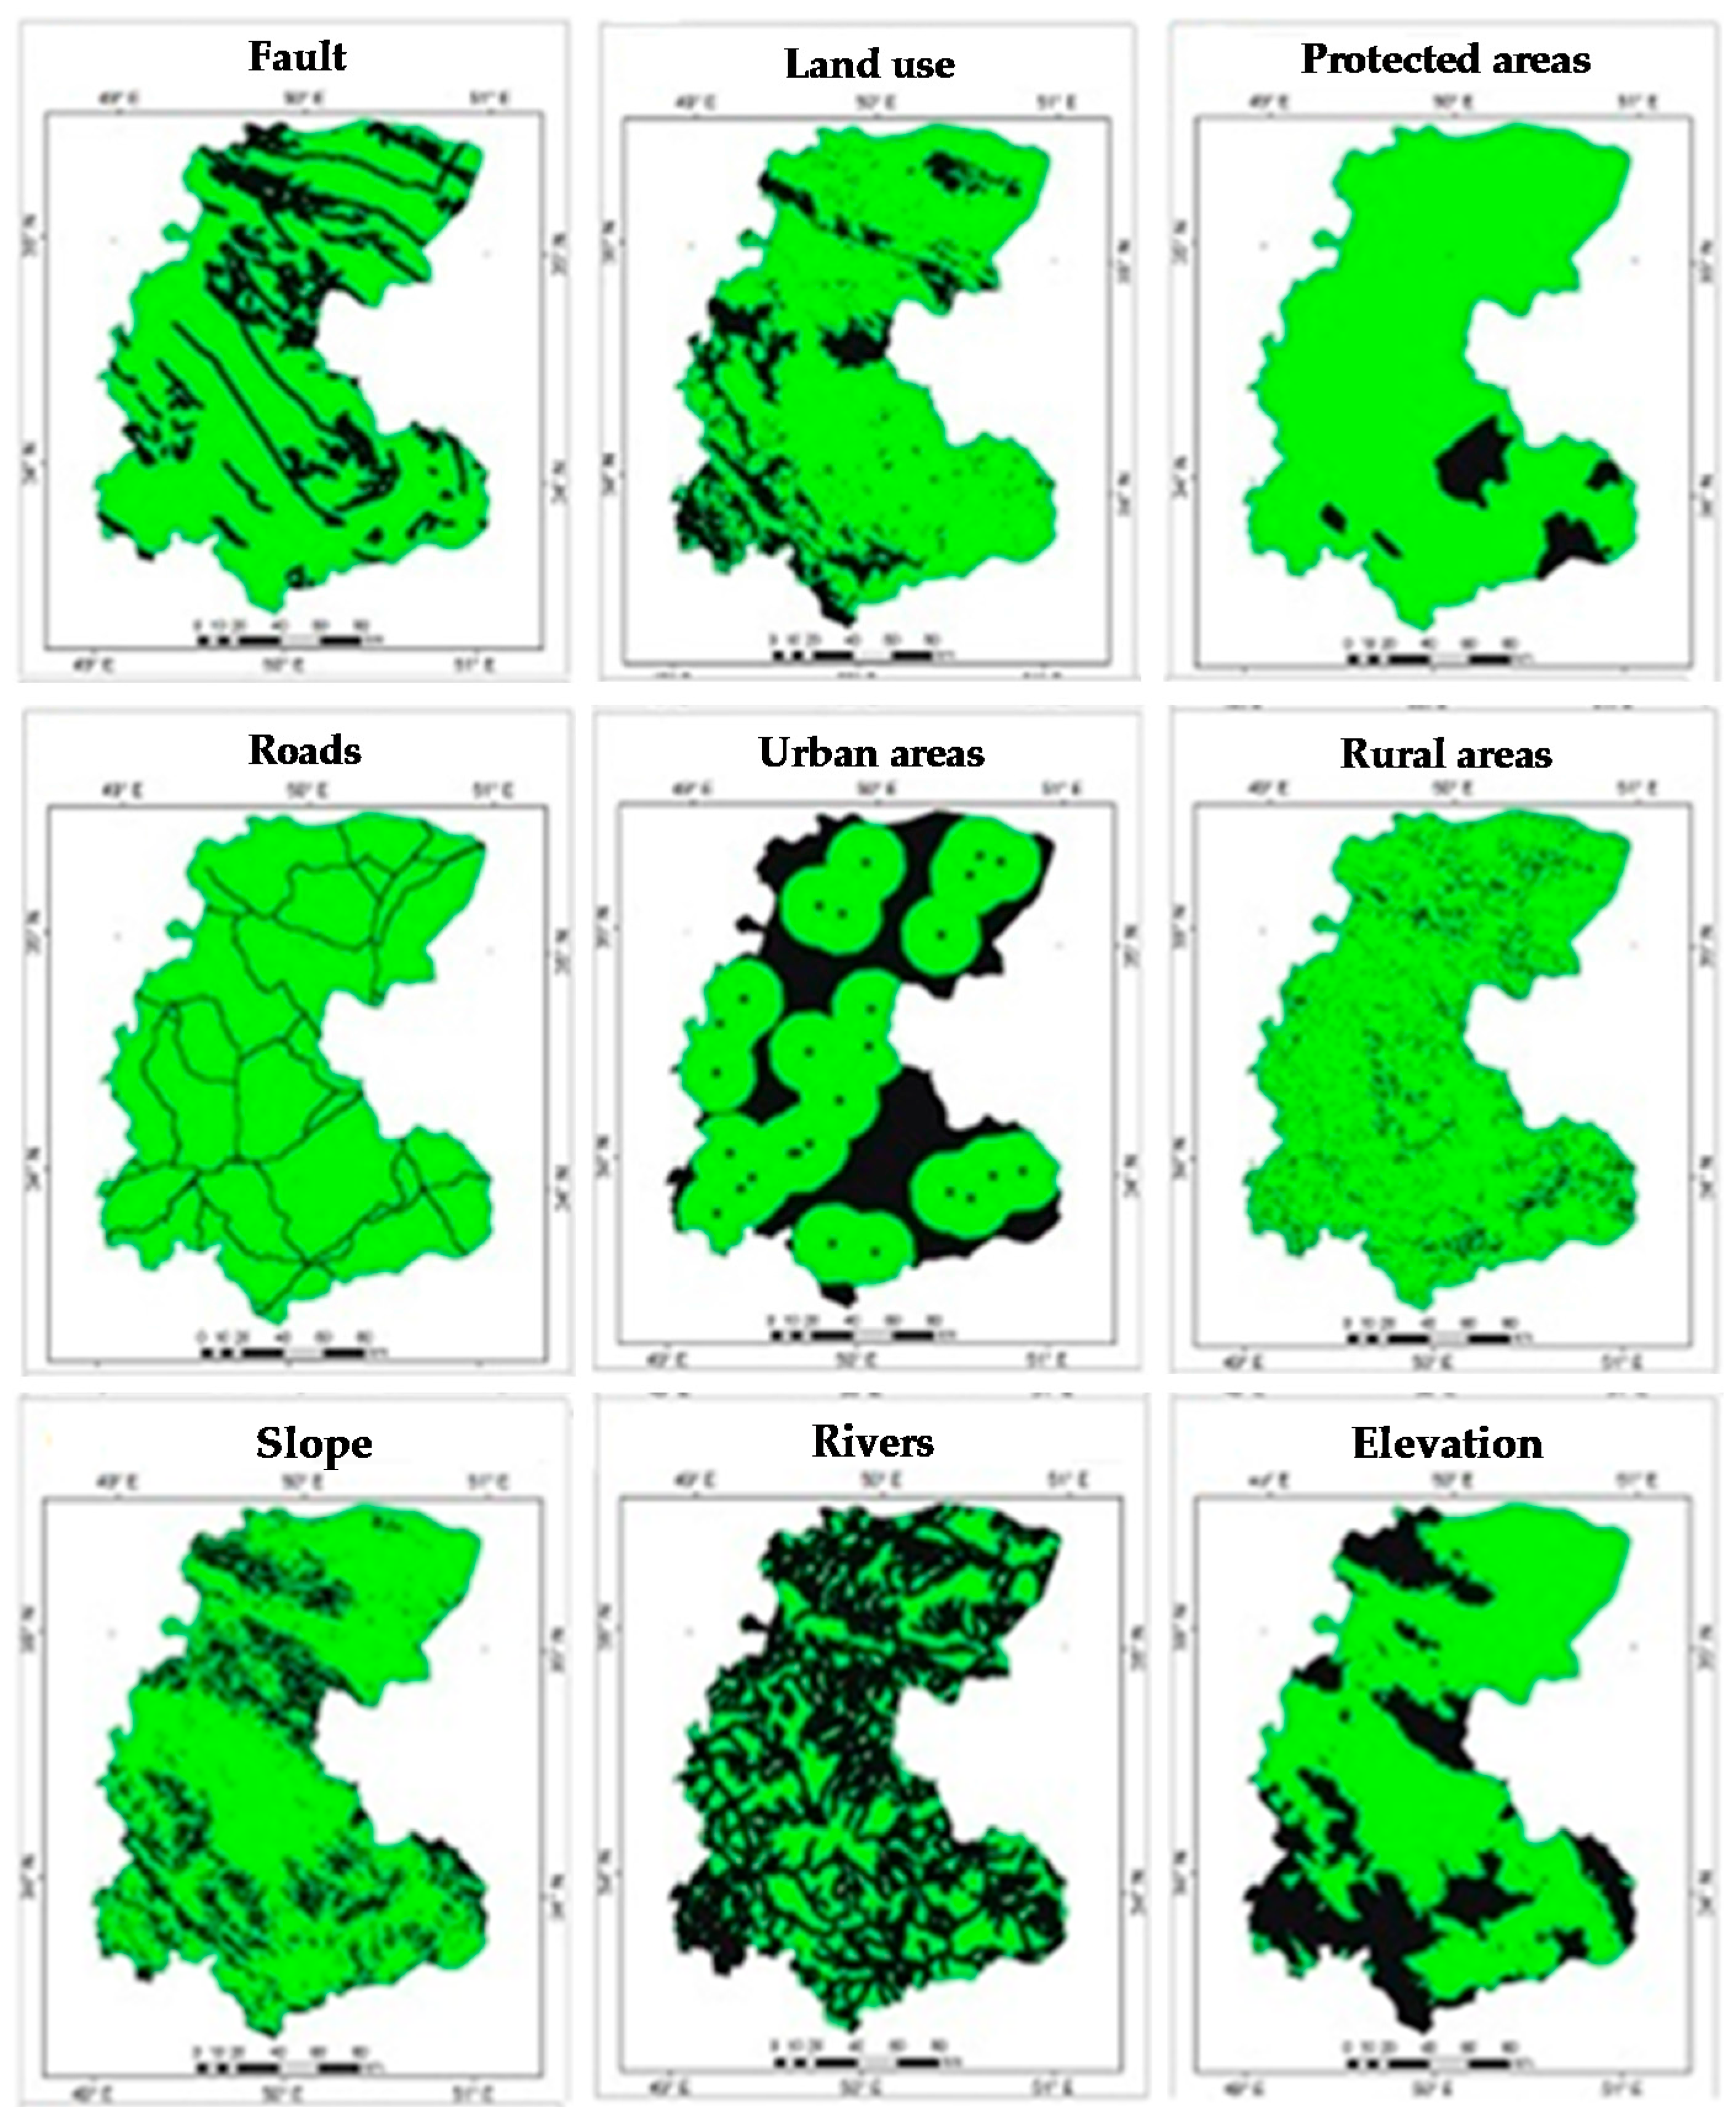
3.1. Generation of Boolean Maps

The selected criteria and factors represent restrictions on the establishment of SPPs. As one of the important steps shown in the conceptual framework (Figure 3), the areas with some restrictions for SPP installation have been eliminated from the evaluation process. This was accomplished by the Boolean method based on the information presented in Table 1.
Boolean logic coverts information from each input raster map into binary form 0 and 1 (true or false). The excluded areas (restricted areas) were assigned a value of 0 while other areas (suitable areas) are assigned a value of 1 [64]. The resulting map is a binary map because each location is either satisfactory or not [65]. In the end, in order to prepare final Boolean suitability map, AND operator would be used to combine all layers to render the final potential sites [66].

3.2. Generation of Fuzzy Maps

After generating Boolean maps, they have been combined with AND operators. Based on the conceptual framework presented in Figure 3, for further evaluating the areas identified as suitable in the Boolean model, it is essential to compute the values of pixels based on the economic, environmental, and technical criteria relying on fuzzy logic. Fuzzy sets refer to those sets in which memberships of some or all members are not entirely clear. The elements are partially owned by the set. Various methods are used to determine the membership function. In this study, numerical display method was used. The membership degree μA(x) represents membership of x element in the fuzzy set. If membership degree of an element in the set is equal to zero, that member is not owned by the set. If the degree of membership of a member is equal to one, that member is owned by the set. If the degree of membership of a member is a number between zero and one, that number represents the gradual degree of membership.
For fuzzification of map pixels, various fuzzy membership functions were applied. The membership functions for this study are given in Table 2. These fuzzy functions have some variables that were determined for each criterion separately. The values of variables for different criteria are given in Table 3. In order to calculate the fuzzy membership for each pixel of the study area, the spatial data of each criterion are plugged into the formulas (Table 2). In factor maps, the score of each pixel shows the degree of suitability with respect to that criterion.

4. Data Integration and Analysis

Fuzzy model maps have been prepared for combination. The maps were combined using fuzzy operators. A fuzzy operator for combining different layers was selected according to the relationship and interaction between factors in a layer. It is not necessary to combine all the layers required for a particular goal with a single operator. For this purpose, fuzzy inference network with different operators is used instead of a singular operator in order to combine different layers of information.
Gamma operator is defined based on fuzzy algebraic product and fuzzy algebraic sum as follows:
μ c   =   ( i = 1 n μ ( x ) ) γ × ( 1 i = 1 n ( 1 μ ( x ) ) ) 1 γ
Gamma operator with 0.5 Lambda was used to combine the environmental layers including protected areas, distance to the river, land use, distance to water zones.
Layers of technical factors which are mainly related to climatic parameters such as sunshine hours and the number of days with smooth air have been combined using SUM operator in which the values of layers are increased and approximated to 1. The layers of elevation, slope, distance to faults, distance to population centers and the distance to available routes have been combined using OR operator in order not to eliminate the areas that have lesser fuzzy values from the output map. In the end, the results of inference network have been examined and the best sites for solar power plant have been selected.

5. Results and Discussion

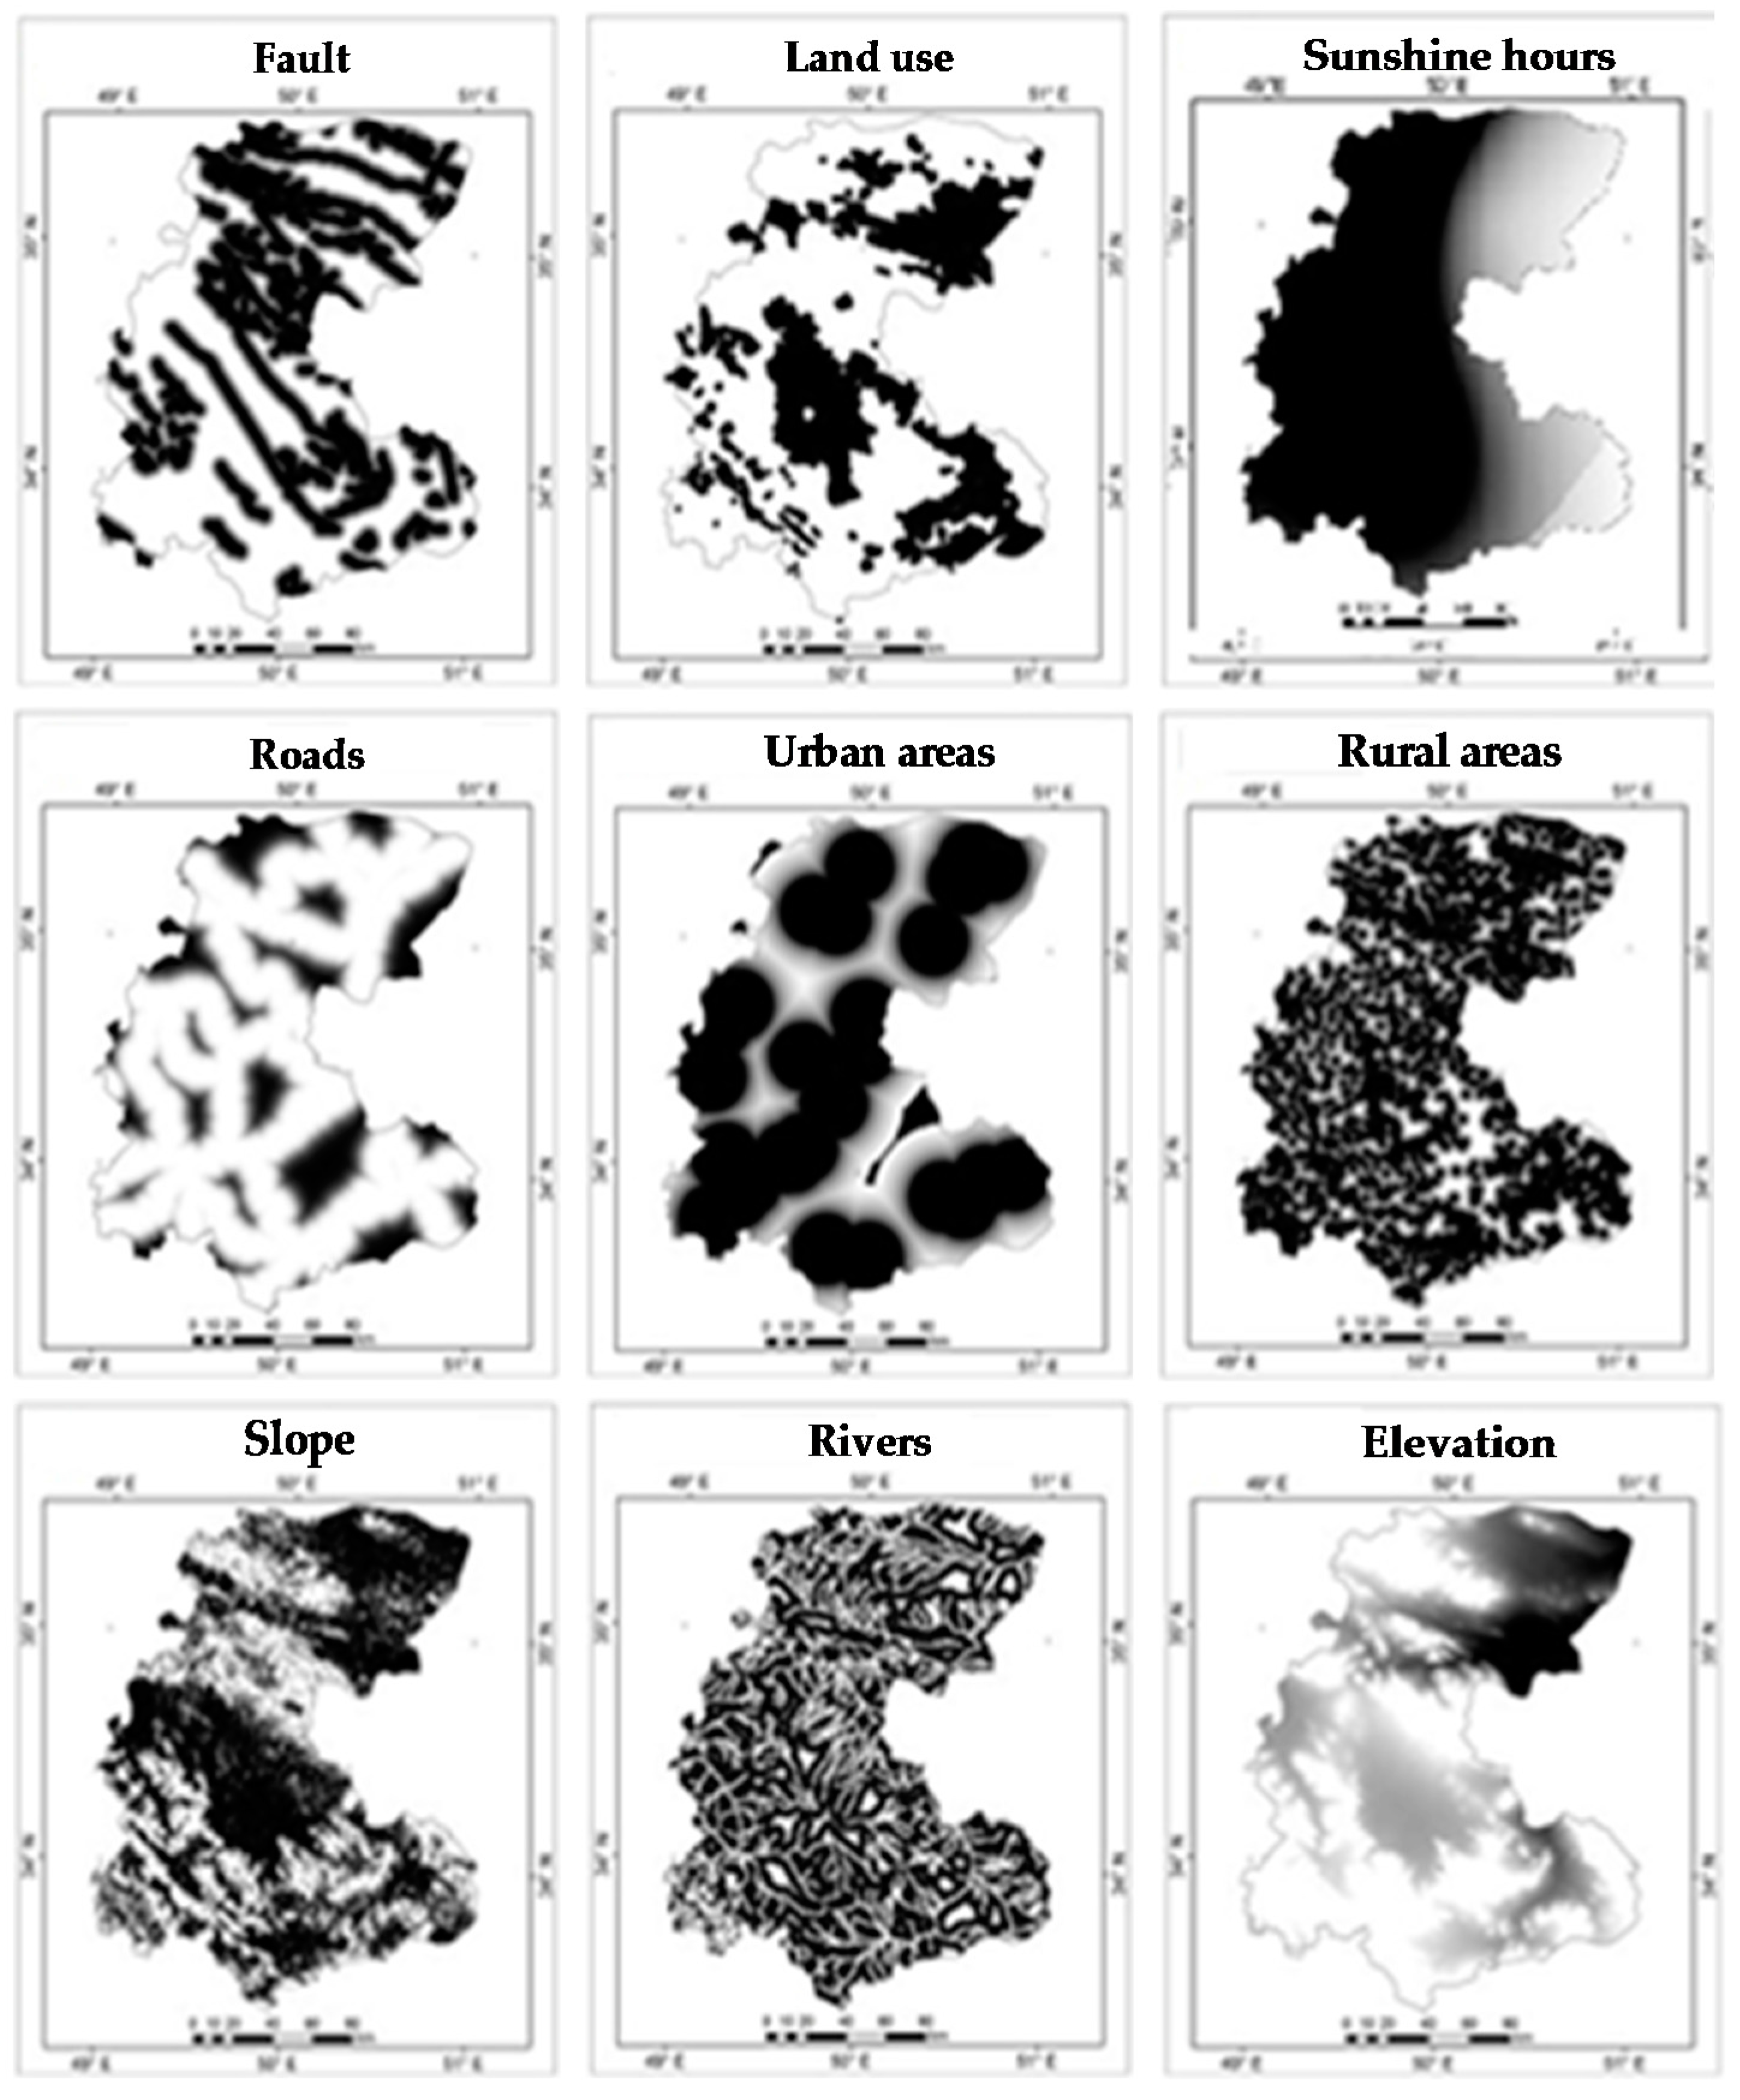
5.1. Boolean and Fuzzy Results

In the Boolean method, each pixel meeting the criteria listed in Table 1 was assigned a value of 1 in the raster map, while the pixels not meeting the criteria were assigned the value of 0 as shown in Figure 4. The unfavorable areas have been eliminated from the total area of the province. According to Table 1, the possible areas for power plant sites have been determined in the criteria layers using Boolean logic. Based on the criteria indicated by each layer, some areas identified as unsuitable to be selected for the SPPs installation have been excluded because of the elevation restriction. The full description of the selection criteria are given in Table 1 and the produced maps are illustrated in Figure 4.
In fuzzy method ascending and descending linear, triangular and trapezoidal models have been applied to specify the membership of each pixel in the area (Table 3). This method has been used according to Table 2 in order to evaluate the areas of each criterion. The results of fuzzification process for each criterion as raster layers are illustrated in Figure 5. The suitability of the pixels of the study area has been arranged from low score in black color to high score in white color areas in the maps.
Overall, based on the nature of selected criteria, availability of data, and the specifications of the study area, some factors were considered only in each of Boolean or fuzzy models while the majority of factors were considered in both models. Finally, all factors analyzed in both methods were considered in the final suitability map through the Boolean-fuzzy integration.

5.1.1. Distance to Faults

The distance to faults is a factor that should be taken into account when selecting suitable sites for SPPs. A site closer to a fault line is prone to higher risk of an earthquake and consequent damage. It may pose potential or actual threats to the project activities and thus must be taken into consideration. Although the importance of this criterion is lower than the factors such as distances to transmission lines or roads, it still should be considered when selecting between sites [68]. Based on Table 1, the areas closer than 1 km to the fault lines are eliminated from the suitability map using Boolean logic. Also as shown in Table 3, in fuzzy model two values of 1 km and 6 km distance from the fault were considered.

5.1.2. Distance to Roads

Transport is one of the most important criteria for placing industries. SPPs should not be built in the areas with difficult access [69]. Proximity to transport lines will reduce the costs of operational supports, equipment loading, and personnel transport [48]. Therefore, distance to roads is considered an important factor among economic criteria because transportation cost is a common variable in estimating economic benefits [70]. The map layer related to this factor was created using the transport map of the study area. The lands with a distance between 1 and 10 km from the roads were assumed as suitable using Boolean model (Table 1). In the fuzzy model, depending on the transport type several values were considered as shown in Table 3.

5.1.3. Distance to Urban and Rural Areas

Building SPPs near urban and rural areas can cause environmental problems and negative impacts on the future development of the residential areas [35]. On the other hand, the areas with a long distance to residential areas are not economically favorable, because for supplying the residents’ electricity needs, the proximity to residential areas could be important [48]. Therefore, the areas with a distance more than 20 km and less than 2 km to urban areas and more than 7 km and less than 500 m to rural areas were assessed as unsuitable for placing SPPs through the Boolean logic (Table 1). In the fuzzy analysis, four values were considered for distance to urban areas as 2 km, 6 km, 10 km, and 20 km; and four values for distance to rural areas as 500 m, 1.5 km, 2 km, and 7 km (Table 3).

5.1.4. Slope

The slope is another main factor in selecting the optimal location for SPPs. The reason is that by an increasing slope the land potential for industrial use will be reduced [48]. The higher slope of surface leads to higher investment and operational costs. In the Boolean analysis, the lands with a slope less than 10% were classified as suitable (Table 1); while in the fuzzy model two values of 2% and 10% were considered for the slope (Table 3).

5.1.5. Elevation

The elevation is one of the important factors in SPPs site selection. There is a strong correlation between the elevation and meteorological parameters such as precipitation and temperature [71]. On the other hand, the higher regions have more potential than lowlands for solar energy because of the receiving higher solar radiation [48]. Nevertheless, the staff and equipment transportation and construction of SPPs get more difficult by increasing altitude above sea level; and therefore the project costs increase [72]. For this reason, the construction of SPPs at high altitudes is not recommended. In the Boolean model, some areas in the northwest and south of the province have been excluded because of the elevation restriction. The areas which are less than 2000 m above sea level are considered as suitable for SPP construction. In the fuzzy model, two values of 1 km and 2 km were defined for the elevation.

5.1.6. Land Use

One of the most important factors for energy investment is “land use” [73] which is categorized as an environmental factor. Land use is the main foundation of development planning, and the distribution of diverse land use types leads to considerable constraints in the planning process [74]. Land use is a major constraint in almost every site selection project [75]. For example, a land with excellent climate conditions for solar energy may have a lower value if the land use factor is taken into account [76]. In this research, the land use map was used as a restriction map to avoid agricultural and forest area with a buffer of 1 km in the Boolean model (Table 1). In the fuzzy model, two values of 500 m and 2 km were used as the distances from land uses of forest, garden, and fields (Table 3).

5.1.7. Distance to Protected Areas

There are many protected areas that can possibly be affected by human activities such as renewable energy development. Whatever type of protection these areas need, this should be considered before placing new projects in their vicinities and until a certain distance around them should be excluded from the suitability maps [77]. Because of their high risk of vulnerability and their ecological values, protected areas are considered as entirely unsuitable for building SPPs [48]. The protected areas and a distance of less than 300 m to them were excluded from the suitability map by using Boolean Logic (Table 1). As a result, the protected areas in the southeast parts of the province were excluded for environmental considerations.

5.1.8. Distance to Rivers

The distance to rivers is important because of the high river density in the study area. Distance to rivers map was built by buffering 1 to 10 km from the rivers as suitable areas using the Boolean model. Likewise, four values were considered in the fuzzy model for the distance from rivers as 500 m, 2 km, 10 km, and 20 km; and four values for the distance from lakes as 1 km, 5 km, 10 km, and 20 km (Table 3). These factors will ensure environmentally safe while economically favorable power generation. In distance to rivers, only small areas are recognized as suitable for SPP installation.

5.1.9. Sunshine Hours

The number of sunny hours is an important factor that represents the amount of energy received from the sun [48]. This factor was considered using fuzzy method for analyzing the solar radiation (GHI) with two values of 4.5 kW h/m2/day and 6 kW h/m2/day (Table 3).

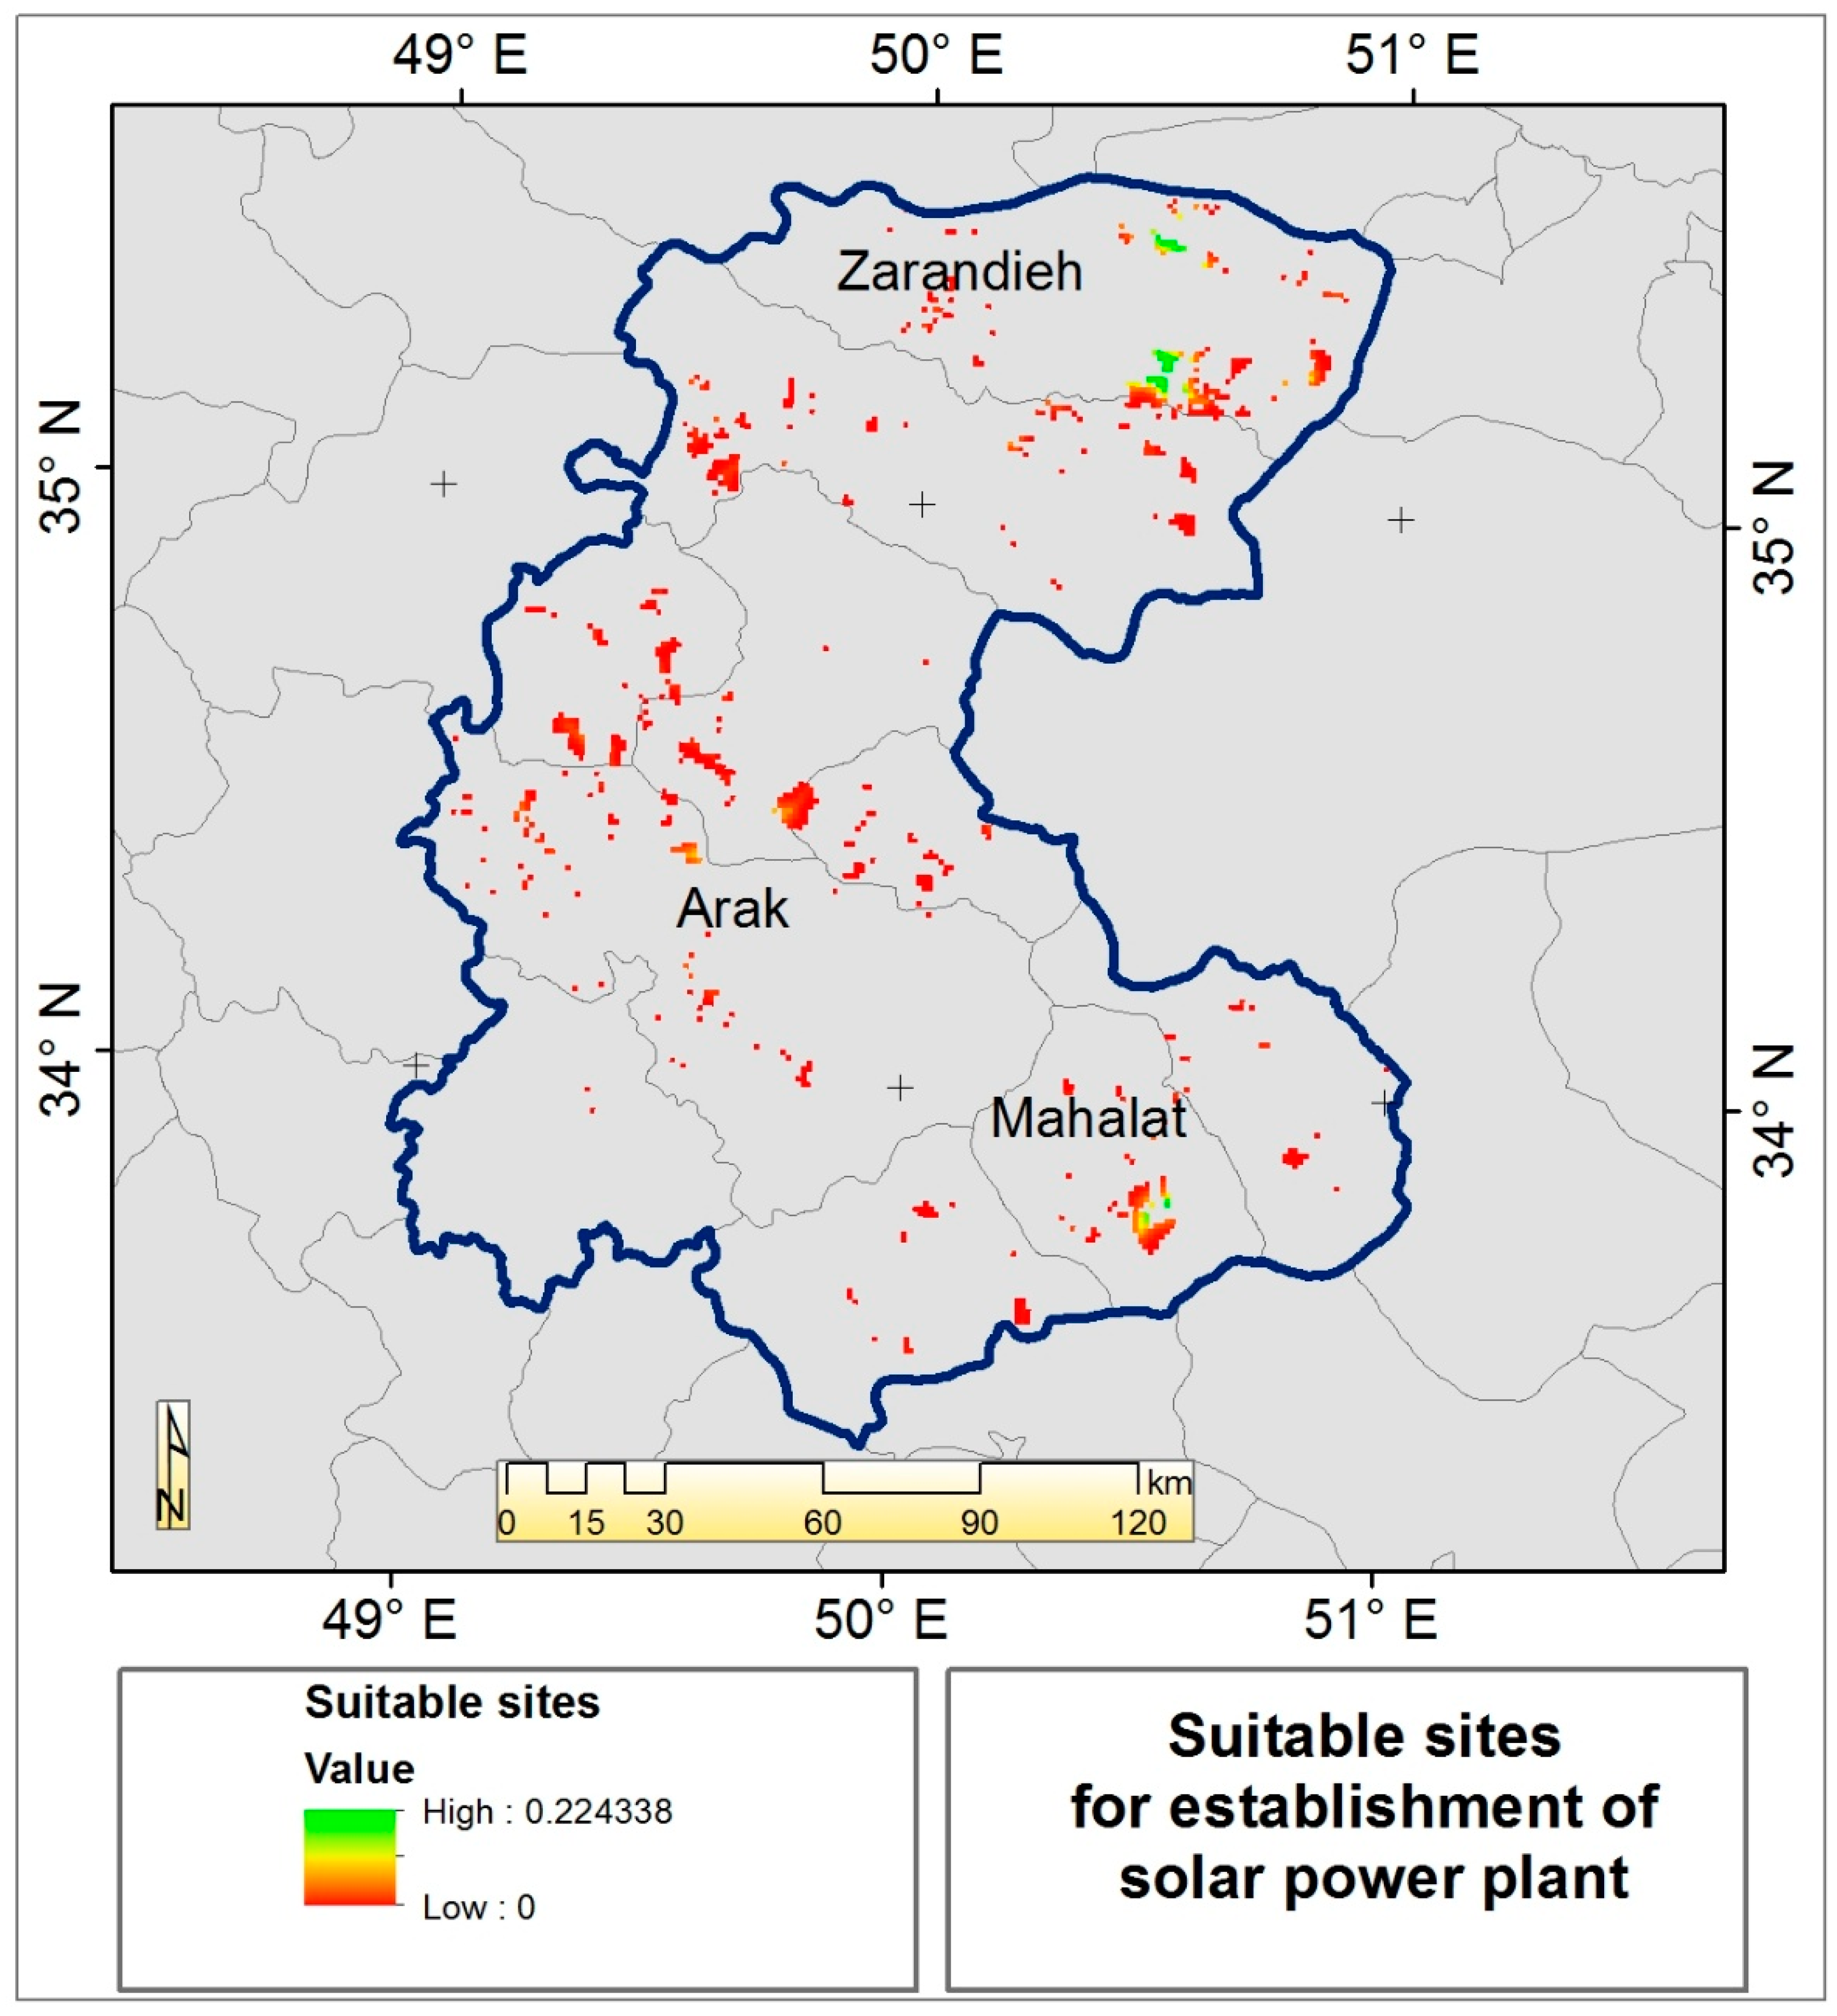
5.2. Boolean-Fuzzy Integration

The suitable areas extracted from the combination of Boolean maps have been placed on the raster layers of fuzzy maps. Therefore, the unrestricted areas determined by Boolean overlay were evaluated by fuzzy functions. The final map is presented in Figure 6. The map suggests best spots inside the suitable areas in the study area. The best sites for the installation of a solar power plant in Markazi Province are located on the border between the cities of Saveh and Zarandieh, as several sites are identified as suitable with the maximum values of suitability in this area. Also, several sites have been located in the western part of Saveh. These areas have proper positions in terms of fuzzy values and proximity to the center of the province. Another appropriate site is located in the central part of Mahalat County. This site has high fuzzy value and also, it is in the best position due to proximity to Arak City, the capital of the province where many industrial activities requiring electrical power are concentrated. However, the site located at the boundary between Saveh and Zarandieh has the highest degree of suitability based on the desired criteria and fuzzy method. Other cities such as Khomein, Ashtian, Tafresh and Komijan have some suitable sites for SPPs. Overall, two sites can be proposed with higher priority for SPP development in the northern and southern parts of the province including the site located in the eastern border of Saveh and Zarandieh cities and the site located in the central part of Mahalat County.

6. Conclusions

Site selection is a decision-making process to determine the optimal coordinates for a set of new equipment within a given set of circumstances. This research proposed a comprehensive model for spatial site selection of solar power plants in semi-arid regions. The model was designed to utilize effective spatial factors on future performance of SPPs such as economic, environmental, and technical ones. All required data were obtained from various resources and were processed and analyzed in a GIS environment. The selection of sites for SPPs in Markazi Province was achieved by using Boolean and fuzzy logic. The fuzzy logic applied in the present study is an efficient method to evaluate the score of map pixels based on the selected criteria. Using different fuzzy operators to overlay raster layers leads to accurate results. Similar approach is suggested in future studies to develop models for the site selection of hybrid renewable energy plants for diverse climates. It is also suggested to estimate the energy output potential of the selected sites and to investigate the extent to which this potential can meet the energy demand in the study area.

Author Contributions

H.Y. and H.H. designed the research, conducted the case study and contributed to data analysis. A.Y.-S. contributed to the introduction, results interpretation, discussions, and conclusions.

Conflicts of Interest

The authors declare no conflict of interest.

References

  1. Solangi, K.H.; Islam, M.R.; Saidur, R.; Rahim, N.A.; Fayaz, H. A review on global solar energy policy. Renew. Sustain. Energy Rev. 2011, 15, 2149–2163. [Google Scholar] [CrossRef]
  2. Devabhaktuni, V.; Alam, M.; Depuru, S.S.R.; Green, R.C., II; Nims, D.; Near, C. Solar energy: Trends and enabling technologies. Renew. Sustain. Energy Rev. 2013, 19, 555–564. [Google Scholar] [CrossRef]
  3. Hosenuzzaman, M.; Rahim, N.A.; Selvaraj, J.; Hasanuzzaman, M.; Malek, A.B.M.A.; Nahar, A. Global prospects, progress, policies, and environmental impact of solar photovoltaic power generation. Renew. Sustain. Energy Rev. 2015, 41, 284–297. [Google Scholar] [CrossRef]
  4. Burkart, K. How Much CO2 Does One Solar Panel Create? Available online: http://www.mnn.com/green-tech/research-innovations/blogs/how-much-co2-doesone-solar-panel-create/ (accessed on 10 May 2016).
  5. Joshi, A.S.; Tiwari, A.; Tiwari, G.N.; Dincer, I.; Reddy, B.V. Performance evaluation of a hybrid photovoltaic thermal (PV/T) (glass-to-glass) system. Int. J. Therm. Sci. 2009, 48, 154–164. [Google Scholar] [CrossRef]
  6. Kimball, J.W.; Kuhn, B.T.; Balog, R.S. A system design approach for unattended solar energy harvesting supply. IEEE Trans. Power Electron. 2009, 24, 952–962. [Google Scholar] [CrossRef]
  7. Wang, X.; Zhao, L.; Wang, J.; Zhang, W.; Zhao, X.; Wu, W. Performance evaluation of a low-temperature solar Rankine cycle system utilizing R245fa. Sol. Energy 2010, 84, 353–364. [Google Scholar] [CrossRef]
  8. Zhou, W.; Lou, C.; Li, Z.; Lu, L.; Yang, H. Current status of research on optimum sizing of stand-alone hybrid solar-wind power generation systems. Appl. Energy 2010, 87, 380–389. [Google Scholar] [CrossRef]
  9. Coskun, C.; Oktay, Z.; Dincer, I. Estimation of monthly solar radiation distribution for solar energy system analysis. Energy 2011, 36, 1319–1323. [Google Scholar] [CrossRef]
  10. Chong, W.T.; Naghavi, M.S.; Poh, S.C.; Mahlia, T.M.I.; Pan, K.C. Techno-economic analysis of a wind-solar hybrid renewable energy system with rainwater collection feature for urban high-rise application. Appl. Energy 2011, 88, 4067–4077. [Google Scholar] [CrossRef]
  11. Yumrutas, R.; Ünsal, M. Energy analysis and modeling of a solar assisted house heating system with a heat pump and an underground energy storage tank. Sol. Energy 2012, 86, 983–993. [Google Scholar] [CrossRef]
  12. Pillot, B.; Muselli, M.; Poggi, P.; Haurant, P.; Hared, I. Solar energy potential atlas for planning energy system off-grid electrification in the Republic of Djibouti. Energy Convers. Manag. 2013, 69, 131–147. [Google Scholar] [CrossRef] [Green Version]
  13. Ahmadi, P.; Dincer, I.; Rosen, M.A. Multi-objective optimization of a novel solar-based multigeneration energy system. Sol. Energy 2014, 108, 576–591. [Google Scholar] [CrossRef]
  14. Acton, N.; Bernazani, M.; Hill, J.; Hinton, M.; Vazquez, A.; Gipson, K.; Nagel, J. Design of a Climate Adaptable Solar Energy system using biomimetic inspiration from a lichen symbiosis. In Proceedings of the IEEE Systems and Information Engineering Design Symposium (SIEDS), Charlottesville, VA, USA, 25 April 2014; pp. 177–182. [Google Scholar]
  15. El-Damak, D.; Chandrakasan, A.P. Solar energy harvesting system with integrated battery management and startup using single inductor and 3.2 nW quiescent power. In Proceedings of the IEEE Symposium on VLSI Circuits (VLSI Circuits), Kyoto, Japan, 17–19 June 2015; pp. C280–C281. [Google Scholar]
  16. Bayrak, Z.U.; Bayrak, G.; Ozdemir, M.T.; Gencoglu, M.T.; Cebeci, M. A low-cost power management system design for residential hydrogen & solar energy based power plants. Int. J. Hydrog. Energy 2016, 41, 12569–12581. [Google Scholar]
  17. Xia, X.; Xia, J. Evaluation of potential for developing renewable sources of energy to facilitate development in developing countries. In Proceedings of the Asia-Pacific Power and Energy Engineering Conference, Chengdu, China, 28–31 March 2010; pp. 1–3. [Google Scholar]
  18. Angelis-Dimakis, A.; Biberacher, M.; Dominguez, J.; Fiorese, G.; Gadocha, S.; Gnansounou, E.; Guariso, G.; Kartalidis, A.; Panichelli, L.; Pinedo, I.; et al. Methods and tools to evaluate the availability of renewable energy sources. Renew. Sustain. Energy Rev. 2011, 15, 1182–1200. [Google Scholar] [CrossRef] [Green Version]
  19. Frankfort School, FS-UNEP Collaborating Centre for Climate and Sustainable Energy Finance. Global Trends in Renewable Energy Investment. Available online: http://fs-unep-centre.org/sites/default/files/publications/globaltrendsinrenewableenergyinvestment2016lowres_0.pdf (accessed on 15 January 2018).
  20. Johnston, I. Developing World Invests More in Renewable Energy than Rich Countries For First Time, New Study Says. Available online: http://www.independent.co.uk/environment/climate-change/renewable-energy-investment-developed-world-developing-world-ren21-report-a7058436.html (accessed on 10 May 2016).
  21. Intergovernmental Panel on Climate Change (IPCC). Special Report on Renewable Energy Sources and Climate Change Mitigation; Cambridge University Press: Cambridge, UK; New York, NY, USA, 2011. [Google Scholar]
  22. Graebig, M.; Bringezu, S.; Fenner, R. Comparative Analysis of Environmental Impacts of Maize-Biogas and Photovoltaics on a Land Use Basis. Sol. Energy 2010, 84, 1255–1263. [Google Scholar] [CrossRef]
  23. Turney, D.; Fthenakis, V. Environmental impacts from the installation and operation of large-scale solar power plants. Renew. Sustain. Energy Rev. 2011, 15, 3261–3270. [Google Scholar] [CrossRef]
  24. Perpiña Castillo, C.; Batista e Silva, F.; Lavalle, C. An assessment of the regional potential for solar power generation in EU-28. Energy Policy 2016, 88, 86–99. [Google Scholar] [CrossRef]
  25. Aydin, N.Y.; Kentel, E.; SebnemDuzgun, H. GIS-based site selection methodology for hybrid renewable energy systems: A case study from western Turkey. Energy Convers. Manag. 2013, 70, 90–106. [Google Scholar] [CrossRef]
  26. Massimo, A.; Dell’Isola, M.; Frattolillo, A.; Ficco, G. Development of a Geographical Information System (GIS) for the integration of solar energy in the energy planning of a wide area. Sustainability 2014, 6, 5730–5744. [Google Scholar] [CrossRef]
  27. De Simón-Martín, M.; Diez-Suárez, A.-M.; Álvarez-de Prado, L.; González-Martínez, A.; de la Puente-Gil, Á.; Blanes-Peiró, J. Development of a GIS Tool for High Precision PV Degradation Monitoring and Supervision: Feasibility Analysis in Large and Small PV Plants. Sustainability 2017, 9, 965. [Google Scholar] [CrossRef]
  28. Huld, T.; Moner-Girona, M.; Kriston, A. Geospatial Analysis of Photovoltaic Mini-Grid System Performance. Energies 2017, 10, 218. [Google Scholar] [CrossRef]
  29. Carrion, J.A.; Estrella, A.E.; Dols, F.A.; Ridao, A.R. The Electricity Production Capacity of Photovoltaic Power Plants and the Selection of Solar Energy Sites in Andalusia (Spain). Renew. Energy 2008, 33, 545–552. [Google Scholar] [CrossRef]
  30. Hofierka, J.; Kaňuk, J. Assessment of photovoltaic potential in urban areas using open-source solar radiation tools. Renew. Energy 2009, 34, 2206–2214. [Google Scholar] [CrossRef]
  31. Janke, J.R. Multicriteria GIS modeling of wind and solar farms in Colorado. Renew. Energy 2010, 35, 2228–2234. [Google Scholar] [CrossRef]
  32. Aragonés-Beltrán, P.; Chaparro-González, F.; Pastor-Ferrando, J.P.; Rodríguez-Pozo, F. An ANP-based approach for the selection of photovoltaic solar power plant investment projects. Renew. Sustain. Energy Rev. 2010, 14, 249–264. [Google Scholar] [CrossRef]
  33. Charabi, Y.; Gastli, A. PV site suitability analysis using GIS-based spatial fuzzy multi-criteria evaluation. Renew. Energy 2011, 36, 2554–2561. [Google Scholar] [CrossRef]
  34. Sánchez-Lozano, J.M.; Teruel-Solano, J.; Soto-Elvira, P.L.; Socorro García-Cascales, M. Geographical Information Systems (GIS) and Multi-Criteria Decision Making (MCDM) methods for the evaluation of solar farms locations: Case study in south-eastern Spain. Renew. Sustain. Energy Rev. 2013, 24, 544–556. [Google Scholar] [CrossRef]
  35. Uyan, M. GIS-based solar farms site selection using analytic hierarchy process (AHP) in Karapinar region Konya/Turkey. Renew. Sustain. Energy Rev. 2013, 28, 11–17. [Google Scholar] [CrossRef]
  36. Yousefi-Sahzabi, A.; Sasaki, K.; Yousefi, H. Some Thoughts on the Notion of Environmental Information Science. Electron. Green J. 2014, 1, 1–16. [Google Scholar]
  37. Yousefi, H.; Noorollahi, Y.; Hajinezhad, A.; Alimohammadi, A. GIS-based spatially integrated bioenergy resources assessment in Kurdistan Province-Northwest Iran. Sustain. Energy Technol. Assess. 2017, 23, 11–20. [Google Scholar] [CrossRef]
  38. Noorollahi, Y.; Yousefi, H.; Mohammadi, M. Multi-criteria decision support system for wind farm site selection using GIS. Sustain. Energy Technol. Assess. 2016, 13, 38–50. [Google Scholar] [CrossRef]
  39. Yousefi-Sahzabi, A.; Sasaki, K.; Yousefi, H.; Pirasteh, S.; Sugai, Y. GIS aided prediction of CO2 emission dispersion from geothermal electricity production. J. Clean. Prod. 2011, 19, 982–1993. [Google Scholar] [CrossRef]
  40. Yousefi-Sahzabi, A.; Sasaki, K.; Djamaluddin, I.; Yousefi, H.; Sugai, Y. GIS modeling of CO2 emission sources and storage possibilities. Energy Procedia 2011, 4, 2831–2838. [Google Scholar] [CrossRef]
  41. Yousefi, H.; Zahedi, S.; Niksokhan, M.H. Modifying the analysis made by water quality index using multi-criteria decision making methods. J. Afr. Ear. Sci. 2018, 138, 309–318. [Google Scholar] [CrossRef]
  42. Yousefi, H.; Yousefi-Sahzabi, A.; Masih, M.; Ghaleh, S.; Mirzaaghabeik, M. Urban Parks Prioritization Concerning the Age-friendly Criteria in Sari, Northern Iran. Int. J. Occup. Hyg. 2017, 8, 116–123. [Google Scholar]
  43. Yousefi, H.; Javadzadeh, Z.; Noorollahi, Y.; Yousefi-Sahzabi, A. Landfill Site Selection Using a Multi-Criteria Decision-Making Method: A Case Study of the Salafcheghan Special Economic Zone, Iran. Sustainability 2018, 10, 1107. [Google Scholar] [CrossRef]
  44. Lewis, S.M.; Gross, S.; Visel, A.; Kelly, M.; Morrow, W. Fuzzy gis-based multi-criteria evaluation for us agave production as a bioenergy feedstock. GCB Bioenergy 2015, 7, 84–99. [Google Scholar] [CrossRef]
  45. Hermann, B.G.; Kroeze, C.; Jawjit, W. Assessing environmental performance by combining life cycle assessment, multi-criteria analysis and environmental performance indicators. J. Clean. Prod. 2007, 15, 1787–1796. [Google Scholar] [CrossRef] [Green Version]
  46. Aragonés-Beltrán, P.; Chaparro-González, F.; Pastor-Ferrando, J.P.; Pla-Rubio, A. An AHP (Analytic Hierarchy Process)/ANP (Analytic Network Process)-based multi-criteria decision approach for the selection of solar-thermal power plant investment projects. Energy 2014, 66, 222–238. [Google Scholar] [CrossRef] [Green Version]
  47. Sánchez-Lozano, J.M.; Henggeler Antunes, C.; García-Cascales, M.S.; Dias, L.C. GIS-based photovoltaic solar farms site selection using ELECTRE-TRI: Evaluating the case for Torre Pacheco, Murcia, Southeast of Spain. Renew. Energy 2014, 66, 478–494. [Google Scholar] [CrossRef]
  48. Zoghi, M.; Ehsani, A.H.; Sadat, M.; Javad Amiri, M.; Karimi, S. Optimization solar site selection by fuzzy logic model and weighted linear combination method in arid and semi-arid region: A case study Isfahan-IRAN. Renew. Sustain. Energy Rev. 2015, 68, 986–996. [Google Scholar] [CrossRef]
  49. Saaty, T.L. The Analytic Hierarchy Process; McGraw-Hill International: New York, NY, USA, 1980. [Google Scholar]
  50. Ali, S.; Lee, S.-M.; Jang, C.-M. Determination of the Most Optimal On-Shore Wind Farm Site Location Using a GIS-MCDM Methodology: Evaluating the Case of South Korea. Energies 2017, 10, 2072. [Google Scholar] [CrossRef]
  51. Saaty, T.L. Theory and Applications of the Analytic Network Process: Decision Making with Benefits, Opportunities, Costs, and Risks; RWS Publications: Pittsburgh, PA, USA, 2005. [Google Scholar]
  52. Sun, H.; Cheng, X.; Dai, M. Regional flood disaster resilience evaluation based on analytic network process: A case study of the Chaohu Lake Basin, Anhui Province, China. Nat. Hazards 2016, 82, 39–58. [Google Scholar] [CrossRef]
  53. Cheng, C.; Thompson, R.G. Application of boolean logic and gis for determining suitable locations for temporary disaster waste management sites. Int. J. Disaster Risk Reduct. 2016, 20, 78–92. [Google Scholar] [CrossRef]
  54. Jiang, H.; Eastman, J.R. Application of fuzzy measures in multi-criteria evaluation in GIS. Int. J. Geogr. Inf. Sci. 2000, 14, 173–184. [Google Scholar] [CrossRef] [Green Version]
  55. Zadeh, L.A. Fuzzy sets. Inf. Control 1965, 8, 338–353. [Google Scholar] [CrossRef] [Green Version]
  56. Hall, G.B.; Wang, F.; Subaryono. Comparison of Boolean and fuzzy classification methods in land suitability analysis by using geographical information systems. Environ. Plan. A 1992, 24, 497–516. [Google Scholar] [CrossRef]
  57. Khorasanizadeh, H.; Mohammadi, K. Prediction of daily global solar radiation by day of the year in four cities located in the sunny regions of Iran. Energy Convers. Manag. 2013, 76, 385–392. [Google Scholar] [CrossRef]
  58. Besarati, S.M.; Padilla, R.V.; Goswami, D.Y.; Stefanakos, E. The potential of harnessing solar radiation in Iran: Generating solar maps and viability study of PV power plants. Renew. Energy 2013, 53, 193–199. [Google Scholar] [CrossRef]
  59. Alamdari, P.; Nematollahi, O.; Alemrajabi, A.A. Solar energy potentials in Iran: A review. Renew. Sustain. Energy Rev. 2013, 21, 778–788. [Google Scholar] [CrossRef]
  60. Little, S. A Delphi Study on Risk and Uncertainty Decision Making for Renewable Energy Green Supply Chain Management. Ph.D. Thesis, Northcentral University, Scottsdale, AZ, USA, 2017. [Google Scholar]
  61. Lingga, M.M. Developing a Hierarchical Decision Model to Evaluate Nuclear Power Plant Alternative Siting Technologies. Ph.D. Thesis, Portland State University, Portland, OH, USA, 2016. [Google Scholar]
  62. Şener, S.; Şener, E.; Nas, B.; Karagüzel, R. Combining AHP with GIS for landfill site selection: A case study in the Lake Beyşehir catchment area (Konya, Turkey). Waste Manag. 2010, 30, 2037–2046. [Google Scholar] [CrossRef] [PubMed]
  63. Charabi, Y.; Gastli, A. Integration of temperature and dust effects in siting large PV power plant in hot arid area. Renew. Energy 2013, 57, 635–644. [Google Scholar] [CrossRef]
  64. Barakat, A.; Hilali, A.; El Baghdadi, M.; Touhami, F. Landfill site selection with GIS-based multi-criteria evaluation technique. A case study in Béni Mellal-Khouribga Region, Morocco. Environ. Earth Sci. 2017, 76, 413. [Google Scholar] [CrossRef]
  65. Shahabi, H.; Keihanfard, S.; Bin Ahmad, B.; Amiri, M.J.T. Evaluating boolean, AHP and WLC methods for the selection of waste landfill sites using GIS and satellite images. Environ. Earth Sci. 2014, 71, 4221–4233. [Google Scholar] [CrossRef]
  66. Zaidi, F.K.; Nazzal, Y.; Ahmed, I.; Naeem, M.; Jafri, M.K. Identification of potential artificial groundwater recharge zones in Northwestern Saudi Arabia using GIS and Boolean logic. J. Afr. Ear. Sci. 2015, 111, 156–169. [Google Scholar] [CrossRef]
  67. Makhdoom, M.; Darvish Sefat, A.A.; Jafar Zadeh, H.; Makhdoom, A. Environmental Assessment and Planning with GIS; Tehran University Publication: Tehran, Iran, 2007. [Google Scholar]
  68. Atici, K.B.; Simsek, A.B.; Ulucan, A.; Tosun, M.U. A GIS-based Multiple Criteria Decision Analysis approach for wind power plant site selection. Util. Policy 2015, 37, 86–96. [Google Scholar] [CrossRef]
  69. Asakereh, A.; Omid, M.; Alimardani, R.; Sarmadian, F. Developing a GIS-based fuzzy AHP model for selecting solar energy sites in Shodirwan region in Iran. Int. J. Adv. Sci. Technol. 2014, 68, 37–48. [Google Scholar] [CrossRef]
  70. Ma, J.; Scott, N.R.; DeGloria, S.D.; Lembo, A.J. Siting analysis of farm-based centralized anaerobic digester systems for distributed generation using GIS. Biomass Bioenergy 2005, 28, 591–600. [Google Scholar] [CrossRef]
  71. Bunruamkaew, K.; Murayama, Y. Site suitability evaluation for ecotourism using GIS & AHP: A case study of Surat Thani province, Thailand. Procedia Soc. Behav. Sci. 2011, 21, 269–278. [Google Scholar]
  72. Hafeznia, H.; Yousefi, H.; Astaraei, F.R. A novel framework for the potential assessment of utility-scale photovoltaic solar energy, application to eastern Iran. Energy Convers. Manag. 2017, 151, 240–258. [Google Scholar] [CrossRef]
  73. Kahraman, C.; Kaya, İ.; Cebi, S. A comparative analysis for multiattribute selection among renewable energy alternatives using fuzzy axiomatic design and fuzzy analytic hierarchy process. Energy 2009, 34, 1603–1616. [Google Scholar] [CrossRef]
  74. Tahri, M.; Hakdaoui, M.; Maanan, M. The evaluation of solar farm locations applying geographic information system and multi-criteria decision-making methods: Case study in southern Morocco. Renew. Sustain. Energy Rev. 2015, 51, 1354–1362. [Google Scholar] [CrossRef]
  75. Brewer, J.; Ames, D.P.; Solan, D.; Lee, R.; Carlisle, J. Using GIS analytics and social preference data to evaluate utility-scale solar power site suitability. Renew. Energy 2015, 81, 825–836. [Google Scholar] [CrossRef]
  76. Carrión, J.A.; Estrella, A.E.; Dols, F.A.; Toro, M.Z.; Rodríguez, M.; Ridao, A.R. Environmental decision-support systems for evaluating the carrying capacity of land areas: Optimal site selection for grid-connected photovoltaic power plants. Renew. Sustain. Energy Rev. 2008, 9, 2358–2380. [Google Scholar] [CrossRef]
  77. Lungu, I.; Velicanu, A.; Bara, A.; Botha, I.; Mocanu, A.M.; Tudor, A. Spatial Databases for Wind Parks. Econ. Comput. Econ. Cybern. Stud. Res. J. 2012, 2, 5–23. [Google Scholar]
Figure 1. Location map of Markazi Province.
Energies 11 01648 g001
Figure 2. Diagram of the integration of criteria.
Energies 11 01648 g002
Figure 3. Conceptual framework of the research.
Energies 11 01648 g003
Figure 4. The restricted areas eliminated by Boolean model.
Energies 11 01648 g004
Figure 5. Fuzzy membership values of pixels for different criteria.
Energies 11 01648 g005
Figure 6. The final map resulting from integration of fuzzy and Boolean maps.
Energies 11 01648 g006
Table 1. The restriction factors for the site selection of SPPs by using Boolean Model (The suitability of the areas for each factor was defined using previous studies such as [25,34,67] and anonymous expert opinions as explained by [44,54]). Factor maps of this table are illustrated in Figure 4.
ParameterRestriction LayerUnsuitable Areas (Value = 0)Suitable Areas (Value = 1)
Distance to faultsRestriction map of distance to major faultsx < 1000 mx > 1000 m
Distance to roadsRestriction map of distance to sideways1 km > x > 10 km1 km < x < 10 km
Distance to urban and rural areaRestriction map of distance to urban areas2 km > x > 20 km2 km < x < 20 km
Restriction map of distance to rural areas500 m > x > 7 km500 m < x < 7 km
SlopeRestriction map of slope percentagex > 10%x < 10%
ElevationRestriction map of altitudex > 2000 mx < 2000 m
Land useRestriction map of agricultural and forest area buffersx < 1000 mx > 1000 m
Distance to protected areaRestriction map of distance to protected areasx < 300 mx > 300 m
Distance to urban and rural areaRestriction map of distance to urban areas2 km > x > 20 km2 km < x < 20 km
Restriction map of distance to rural areas500 m > x > 7 km500 m < x < 7 km
Distance to rivesRestriction map of distance to seasonal and permanent rivers500 m > x > 20 km500 m < x < 20 km
Table 2. Fuzzy membership functions used in the study.
Ascending linear   ( a , b ) = { 0                               x a x a b a       a < x < b 1                             x b
linear   ( a , b ) = max [ min ( x a b a , 1 ) , 0 ]
Descending linear   ( a , b ) = { 1                               x a x b a b       a < x < b 0                             x b
linear   ( a , b ) = max [ min ( x b a b , 1 ) , 0 ]
Triangular Triangular   ( a , b , c ) = { 0 x a x a b a a < x < b c x c b b x c 0 x c
Triangular   ( a , b , c ) = max [ min ( x a b a , c x c b ) , 0 ]
Trapezoidal Trapezoidal   ( a , b , c , d ) = { 0 x a x a b a a < x < b 1 b x c d x d c c < x < d 0 x d
Trapezoidal   ( a , b , c , d ) = max [ min ( x a b a , 1 , d x d c ) , 0 ]
Table 3. Determined values to specify the required variables of fuzzy membership functions (the factor maps of this table are illustrated in Figure 5).
CriteriaSub-ClassChart Typeabcd
Distance to faultsFault and mineLinear (ascending)1 km6 km--
Distance to roadsFreewayTrapezoidal2 km4 km6 km11 km
HighwayTrapezoidal1 km3 km5 km10 km
Asphalted roadTriangular500 m1000 m6000 m-
Distance to urban and rural areaUrban areasTrapezoidal2 km6 km10 km20 km
Rural areasTrapezoidal500 m1500 m2000 m7000 m
SlopeSlopeLinear (descending)2%10%--
ElevationElevationLinear (descending)1 km2 km--
Land useForest, garden and fieldsLinear (ascending)500 m2000 m--
Distance to rivers and lakesRiversTrapezoidal500 m2000 m10 km20 km
LakesTrapezoidal1 km5 km10 km20 km
Sunshine hoursSolar radiation (GHI)Linear (ascending)4.5 kW h/m2/day6 kW h/m2/day

