Combustion of Poplar and Pine Pellet Blends in a 50 kW Domestic Boiler: Emissions and Combustion Efficiency


1
Instituto de Investigación en Energías Renovables, Universidad de Castilla-La Mancha, Albacete 02006, Spain
2
Escuela Técnica Superior de Ingenieros Industriales, Universidad de Castilla-La Mancha, Ciudad Real 13071, Spain
*
Author to whom correspondence should be addressed.
Energies 2018, 11(6), 1580; https://doi.org/10.3390/en11061580
Submission received: 21 May 2018
/
Revised: 12 June 2018
/
Accepted: 13 June 2018
/
Published: 15 June 2018
(This article belongs to the Section I: Energy Fundamentals and Conversion)
Abstract
:Poplar pellets with and without Ca, Mg-lignosulphonate and three poplar and pine pellet blends (with three different percentages of pine—5, 45 and 95 wt.%) were burned in a 50 kW domestic boiler in order to evaluate their suitability as fuels. The boiler efficiency and emissions were analyzed and compared with those from tests with poplar pellet. It was found that the adequate adjustment of excess air and of flowrate of secondary air according to the fuel properties improve the combustion efficiency. The results show an improvement in CO and NOx emissions and combustion efficiency when either Ca, Mg-lignosulphonate or pine were blended with poplar. However, the use of Ca, Mg-lignosulphonate is discouraged due to the observed increase in SOx emissions. No operational problems related with unburned matter or ash were observed for any of the pellet blends tested.
1. Introduction
Nowadays, wood chips and softwood pellet are the main fuels used in domestic boilers, due its high heating value, low ash content and because they usually fulfill EN ISO 17225-2 standard [1]. However, in order to satisfy the biomass demand, the use of alternative biomass such as energy crops and agricultural residues (as hardwood and herbaceous species) have also turned out as necessary. It has been proved that pellet from hardwood, such as poplar, has lower durability than softwood due its low lignin and high ash contents. Besides, the high content of nitrogen, sulphur, chlorine and ash of herbaceous species leads to fouling and corrosion problems and to NOx, SO2, HCl and unburned hydrocarbon emissions [2]. Therefore, the direct use of these types of biomass in domestic boilers is not appropriate and then, mixtures with other biomass feedstocks or the use of additives is recommended to improve their physical and chemical properties and to avoid any negative influence on the combustion process.
Additives are generally classified attending to their composition (according to the silicates, calcium or sulphur content). Tissari et al., Carroll et al., and Xiong et al., observed that in combustion of agricultural residues, additives with aluminum silicates as kaolin decrease particle emissions and ash sinterization [3,4,5]. Bostrom et al. obtained similar results when calcite was used as additive with calcium [6]. Moreover, additives with some sulphur content increase the ash fusion temperature [7] and the SO2 emissions. Fournel et al., [8] observed a decrease in particle emissions and an increase in SO2 emissions when red canary grass with lignosulphonate was burned. However, lignosulphonate (with sulphur content) is often used as additive in the pelletization process because it improves the pellet quality [9,10].
The combustion behavior of different blends of woody materials has been revised in various studies. Miranda et al. [11], studied the combustion of blends of olive pomace and forest residues in a 5.8 kW boiler and no improvement in the combustion efficiency was observed. Gonzalez et al. [12] burned blends of sorghum and reed and observed some improvement in comparison with the combustion of this biomass samples separately. Mediavilla et al. [13] analysed the combustion of blends of vine shoots and cork in a 17.5 kW domestic boiler and indicated that the best blend, attending to CO and particle emissions, where those with 30 wt.% and 70 wt.%, respectively. Lajili et al. [14] studied blends of olive mill solid waste and pine and observed a decrease in CO emissions and an improvement in combustion efficiency when higher pine proportion was added. Also, blends of pine with other materials such as spent coffee [15], sunflower and hay husks [16], wheat straw and miscanthus [17], or leaves [18] have been investigated. In general, all authors agree that the higher the proportion of wood in the fuel mixture, the lower the carbon monoxide and particle emissions. Besides, they observed that blending pine and herbaceous raw materials (blends with at least 50 wt.% of pine) reduces the NOx, SO2 and HCl emissions levels and slagging risk in the bottom ash. Other authors have also studied the combustion behavior of peat and biomass (both woody and herbaceous) [19,20,21]. They observed a decrease in particle emissions (especially with biomass with high alkali content) and ash-derived problems due to the lower ash content. However, an increase in the NOx, SO2 and HCl was also observed. Moreover, theoretical calculations and the determination of different index to predict NOx emissions or ash-related problems in the combustion process of biomass blends have been also investigated [22].
Nowadays, the high pine sawdust demand in pellet-plant companies makes necessary to look for other alternative raw materials [9,10]. Poplar shows advantages such as wide knowledge of its varieties, short rotation energy crops, low need of fertilizers and high yields [23,24,25]. The pelletization process of poplar and poplar and pine sawdust has been optimized in previous works [9,10]. Moreover, since poplar and its blends with pine sawdust can be classified according to the European standard EN 17225-2 [1], these raw materials were suggested as alternative feedstock for pellet production companies in a previous study [9]. However, there are no studies about the combustion behavior of these fuels and thus, albeit their properties fulfilling the standard limits, their evaluation during the combustion process is necessary.
The aim of this work is to evaluate the combustion process of poplar pellet (with and without Ca, Mg-lignolsulphonate additives) and poplar and pine pellet blends (with three different percentages of pine, 5, 45 and 95 wt.%) to determine the emissions and combustion efficiency as well as the suitability of use of these fuels in domestic boilers. Moreover, the combustion of pellet blends was optimized to obtain lowest emissions and highest combustion efficiency.
2. Materials and Methods
2.1. Pellet Fuels
Five different types of pellets was considered for the study: poplar pellets, three blends of poplar and pine, and poplar additive with Ca, Mg-lignosulphonate (LS). Table 1 shows the composition and the nomenclature for the each type of pellet and their quality according to UNE EN 17225-2 [1]. The pellets studied were previously produced in a pellet pilot plant [9,26]. The description of the pilot plant and the pelletization conditions can be found in [9].
The physico-chemical characterization of the pellets is shown in Table 2. Analyses were based on EN standards for solid fuels: EN 18134-2 [27] and EN 18134-3 [28] for moisture content; EN 18122 [29] for ash content; EN 18123 [30] for volatile matter; EN 16948 [31] for carbon, hydrogen and nitrogen content; EN 16994 [32] for chlorine and sulphur content; EN 18125 [33] for heating value; EN 17829 [34] for length and diameter; EN 17827 [35] for particle density; EN 17831 [36] for durability; EN 17828 [37] for bulk density and EN 14780 [38] for sample preparation.
2.2. Boiler Description
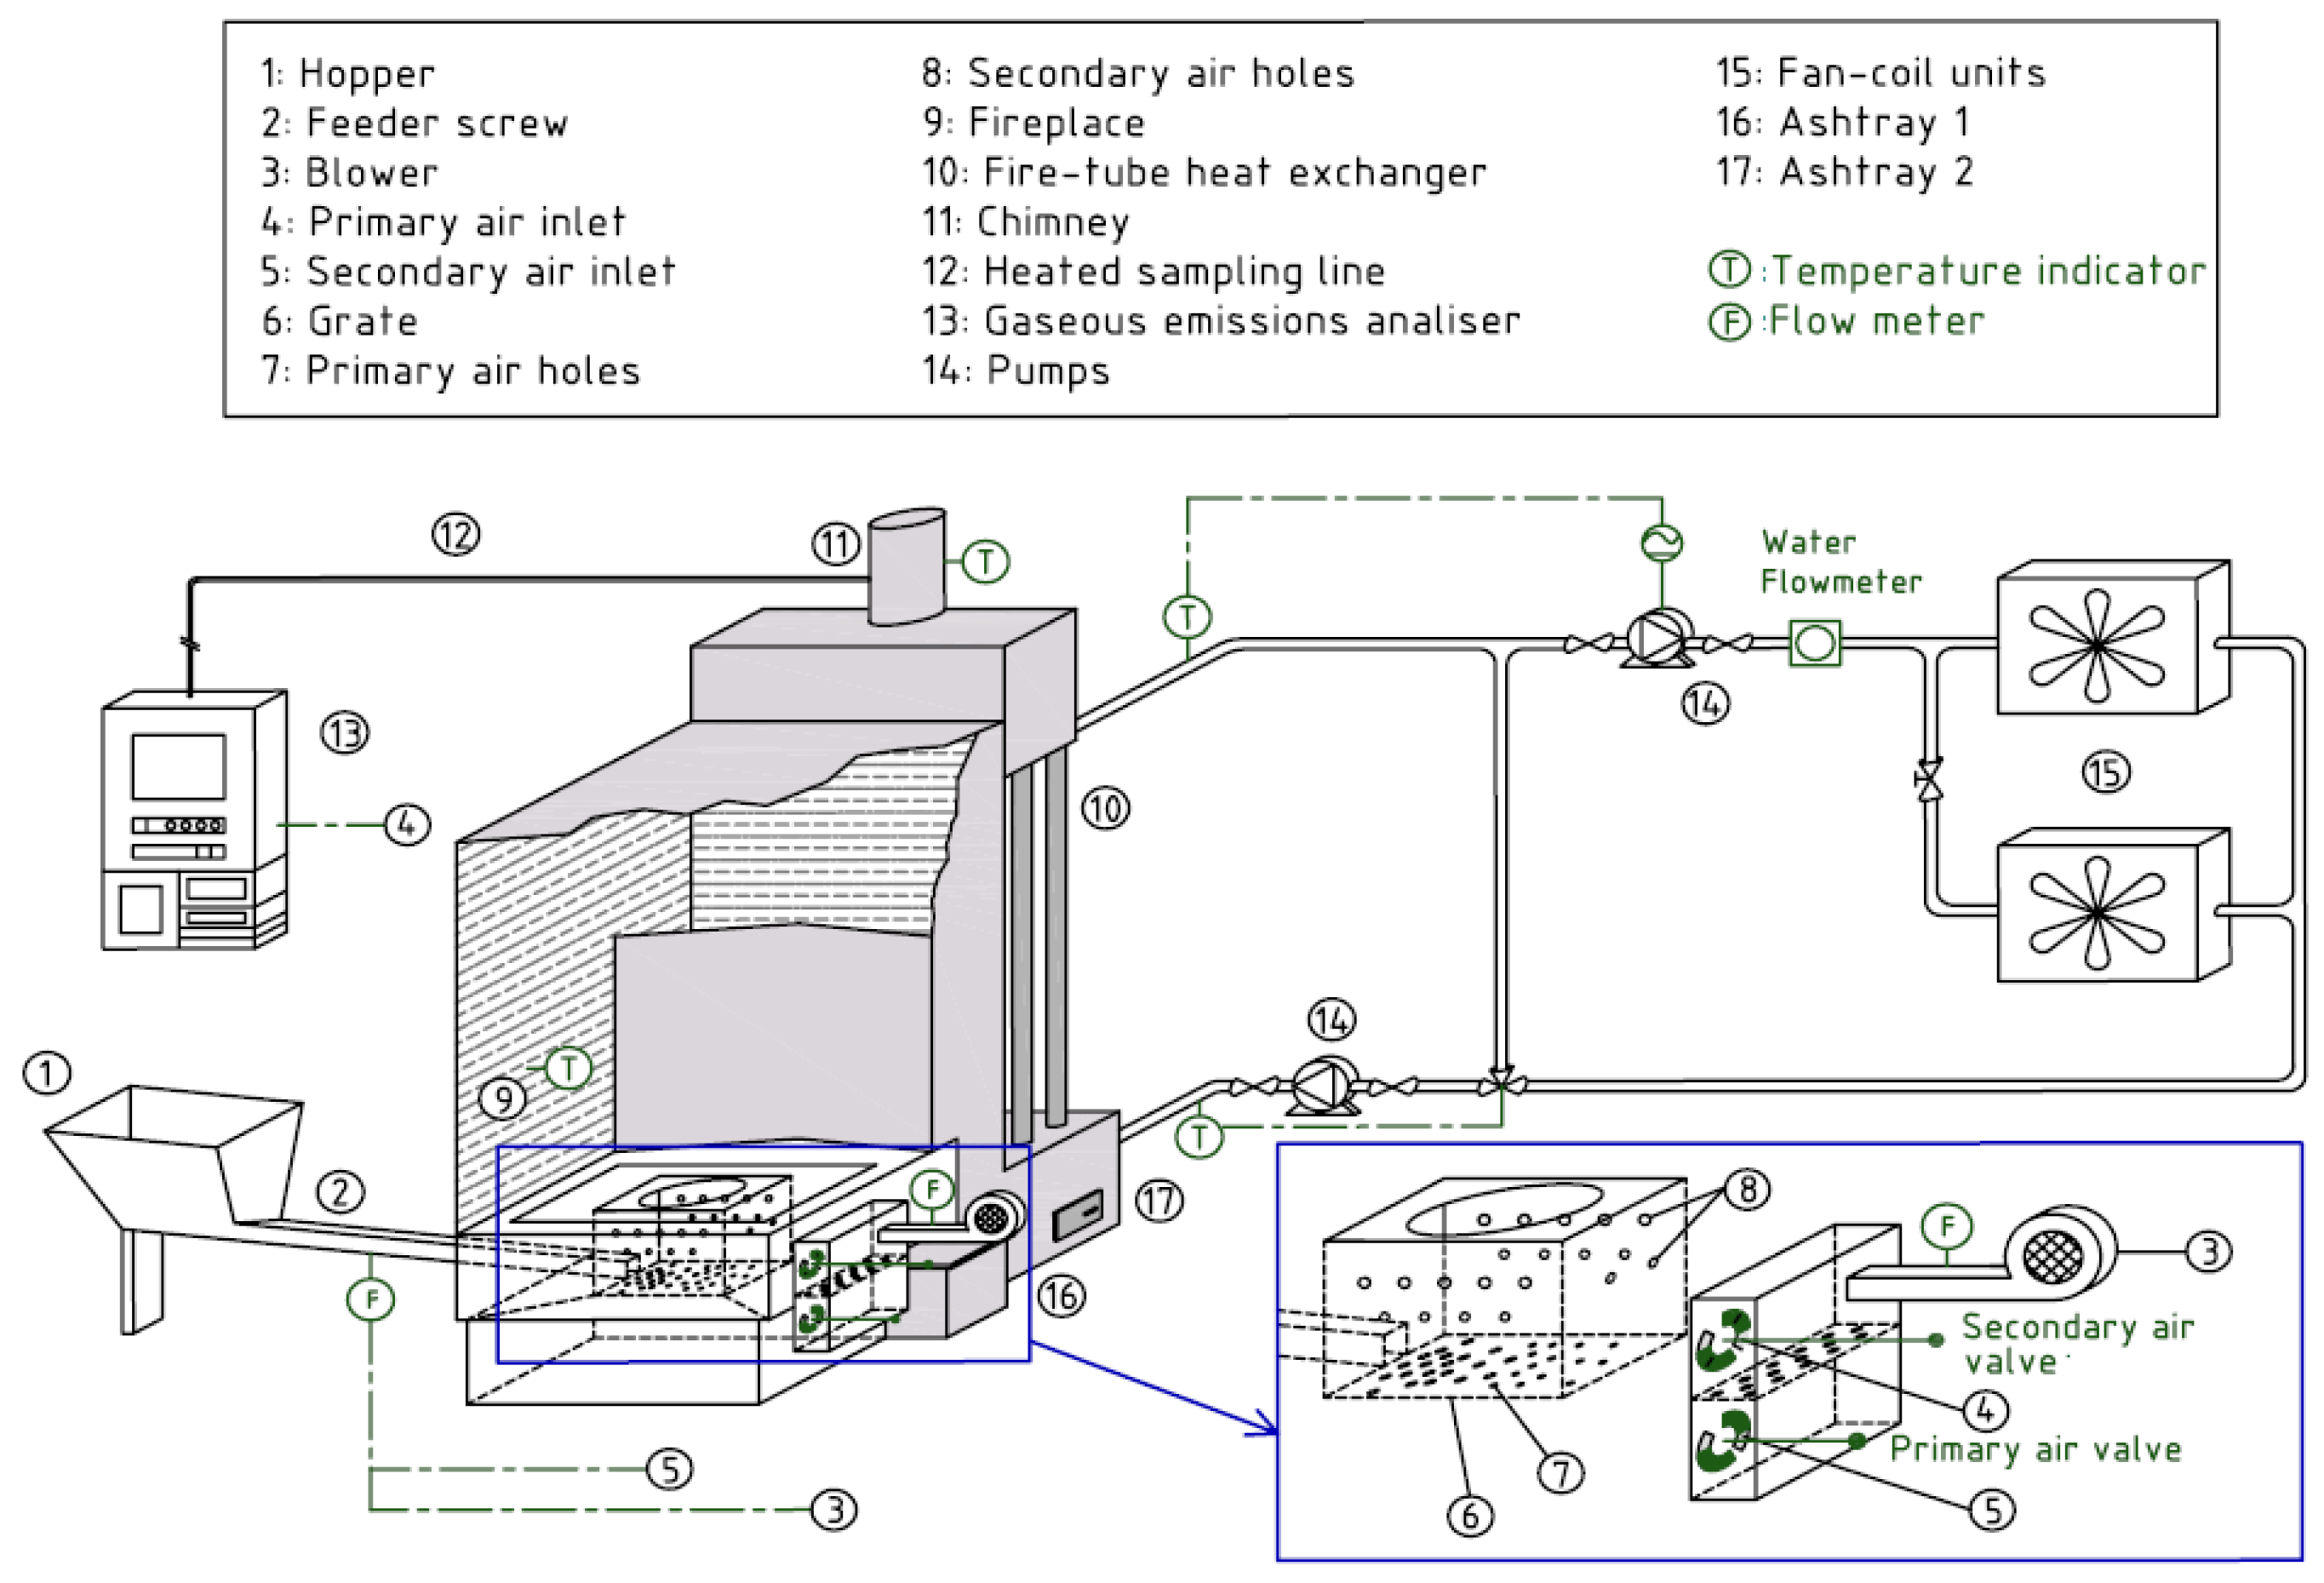
A completely monitored three pass fire tube, fixed bed boiler, with a thermal capacity of 50 kW was used in the experiments. It can be operated with pellet and chips. It is a domestic heating boiler with air staging and automatic ash removal. Biomass is loaded manually on a hopper and it is conveyed to the boiler through two synchronized screwdrivers separated by a protective back-fire flap that isolates the hopper from the combustion chamber, which is provided with a refractory lining. The fireplace fume temperature (measured just above the combustion chamber) ranges from 600–800 °C, depending on the experimental conditions. Most of the air blown was preheated in contact with the outer side of the refractory bricks and enters the combustion chamber through small openings of the bricks (secondary air, %, SA). Primary air (%, PA) passes upwards through the char bed, being PA (%) + SA (%) = 100. Two damper actuators operate primary and secondary air valves, whose open area can be limited to a maximum to set the desired primary to secondary air split ratio. The grate vibrates sporadically to remove ash, which falls down through the grate holes and is conveyed to an external ash container (ashtray 1). Inside the tubes of the heat exchanger, flying ashes collide with turbulence generators and fall into a second ashtray (ashtray 2).
The two feeding screws work in synchronicity at a constant rotating speed, and the fuel flowrate is set as a percentage of time in which the feeding system is active. This depends on the thermal power needed and on the biomass type.
The boiler has two built-in control circuits, load and combustion controls. The load control works with the hot water temperature as set point and is regulated by fuel and primary air supplies. The combustion control works with oxygen in the flue gas as the set point and with secondary air feed as the regulatory factor.
The heat dissipation in two fan-coil units was controlled by means of the water flowrate (ṁw) with a variable speed centrifugal pump, allowing for a steady state combustion regime, whichever is the temperature outside the building. The heat output to the water was obtained from the temperatures before and after the fan-coils and the water flowrate, measured with two Pt100 sensors and an electromagnetic flowmeter, respectively.
The air flowrate from the blower was set up through the blower speed and was measured with a thermal mass flowmeter and varies with the fuel flowrate (ṁbio) which progressively increases during the preparatory stage after ignition. A built-in boiler control introduces small corrections in the air flow rate to keep the excess of air around the set point value, this variable being monitored with a Bosch Lambda probe.
The temperature of gases was measured at three points: close to the flame in the combustion chamber (Tff), after the second pass (Tsf,1) and at the exit, after the fire-tube heat exchanger (Tsf,2) of the boiler. The concentration of O2, CO, CO2, SOx, NOx, and aliphatic hydrocarbons (methane and hydrocarbons, named as TOC) was on-line monitorized by an Environnment medium infrared (MIR) analyzer, which was calibrated before each run with certificated gases mixtures. Concentration of CO is corrected at 10% O2 to avoid dilution effect in tests at different values of excess air according to EN 303-5:2015 [39].
2.3. Combustion and Boiler Efficiencies
Combustion efficiency was calculated using an indirect method according to EN 14785:2007 standard [41]. This standard is relative to small biomass appliances up to 50 kW. So, combustion efficiency (%) is calculated by means of the efficiency losses as:
where ηi (%) is the combustion efficiency, ϕa (%) is the heat losses due to the thermal losses in the flue gas, ϕg (%) is the heat losses due to the unburned gases in the flue gas and ϕr (%) is the heat losses due to the unburned matter in the solid residue. Instead of using the heat losses equations given in EN 14785:2007, mass and energy balances were used. The full calculation method to determine ϕa, ϕg, and ϕr was described in detail in [40].
Standard EN 303-5 [39] applies to boilers up to 300 kW burning either bio- or fossil solid fuels. This standard was also use to determine the boiler efficiency using a direct method as follows:
where ηd is the boiler efficiency (%), is the heat transferred to the water (kJ/h), , the thermal input of biomass (kJ/h), ṁw is the water mass flow (kg/s), Cpw is the heat capacity of water (kJ/kgK), ΔTw is the difference of temperature of water exchange (K), is the rate of fuel mass flow (kg/h) and LHV (MJ/kg) is the lower heating value.
The stack fume temperature (Tsf,1 and Tsf,2), the fireplace fume temperature (Tff), and the gas concentration of CO, CO2, O2, NOx, SO2, and TOC were registered at a data sampling rate of min−1. According to EN 303-5:2015 [39] the concentrations in the flue gas were referred to 10 vol. % of O2 in dry fume. Emissions and efficiency losses were obtained after reaching the steady state. Steady state was defined fifteen minutes after the flue gas temperature values achieved a standard deviation from the mean value lower than five degrees.
2.4. Test Description
Two different types of tests were performed during the study, an optimization test and a standard test. The purpose of the optimization tests was to evaluate the effect of different combustion conditions for each type of blended pellets and to decide which were the most suitable ones (leading to lowest emissions and highest combustion efficiency). In these experiments three different values of the excess air, λ high (1.6), medium (1.4) and low (1.2), were tested and, for the each one, secondary air SA was changed three times, 85%, 70% and 55% (and so it was the corresponding PA = 100 − SA). Nine different conditions in total were tested for each pellet sample during the experiment. Once the steady state was achieved for each condition, it was kept at least 20 min. The total experiment lasted around nine hours in total. Gaseous emissions and efficiency were determined only when steady state was reached. The thermal power input (), water temperature gradient (ΔTw = Thw − Tcw) and water flow rate (ṁw) were kept constant within each test, being 54.6 ± 2.1, 9.0 ± 0.8, 4.3 ± 0.5, respectively, to make results comparable.
On the other hand, the main goal of the standard tests was to compare the differences in emission, efficiency losses and combustion efficiency produced when pellet of poplar alone or with additive) and poplar and pine pellet blends (with three different proportions of pine) are fired in a domestic pellet-fired boiler, as well as to study the suitability of these fuels in a domestic boiler. Operating variables (excess air, secondary air, thermal boiler input, water flow rate, water temperature gradient) were maintained at stable conditions in the tests to obtain reliable emission measurements and representative ash samples for a subsequent study. These tests lasted at least six hours each. Table 3 summarizes the main operating conditions used in the experiments. These conditions were selected as the optimum for the lowest unburned gaseous emissions in the optimization tests.
When the boiler was cooled down the solid residue generated at each test was collected, and the rate of unburned matter (ṁunb) was obtained, as well as ϕr. Similarly as in [40], the parts of the boiler at which the residue was collected are (Figure 1): the walls and surfaces of the fireplaces, astray 1 (below the grate) and astray 2 (under the heat exchanger). Fly ashes in the stack were not measured because they were considered negligible. Representative subsamples of these residues were fine grounded and analysed to determine the percentage of ash and unburned matter at each part of the boiler. In both types of tests (optimization and standard), concentrations of O2, CO2, TOC, NOx, CO and SO2 were on-line measured during the experiments.
3. Results and Discussion
3.1. Physico-Chemical Analysis of Biomass
The physico–chemical properties of the pellet studied are shown in Table 2. Compared to the limits given in standard UNE EN ISO 17225-2 [1], PO5PI95 could be classified as A1 and PO45PI55 and PO25PI75 as B. PO98LS2 and PO100, due to their slightly lower durability and bulk density and to their high ash content (with respect to the limits given by UNE EN ISO 17225-2 [1]), could not be classified in any category.
The moisture content is an important parameter because it could be related to the combustion efficiency. The moisture content was between 9 and 10 wt.% for PO100, PO98LS2, PO45PI55, PO5PI95 and 12 wt.% for PO25PI75. Except for PO98LS2, the pellet blends have shown high durability, bulk density and particle density, higher than 97.5 wt.%, 600 kg/m3 and 1000 kg/m3, respectively. This indicates the good physical state of the pellets used. Diameters have constant values in every pellet sample, around 6/SD0.2 mm. Pellets PO25PI75 and PO5PI95 are shorter (14–15/SD 8.2–5.8 mm) than PO100, PO98LS2, PO45PI55 (20.4–27.2/SD 0.7–5.7 mm). However, all values fullfil standard limits.
The major difference in the composition of biomass is the ash content. PO5PI95 showed the lowest ash content, 0.7 wt.%, while PO98LS2 showed the highest ash content, 3.35 wt.%, due to the additive added, followed by PO100 (2.52 wt.%). The ash content in pellets blends decrease with the increasing of pine content in the blend. With regard to volatile matter, pellets with additive showed the lowest content, 79.30 wt.% followed by PO100, 80.8 wt.%. Contrary to ash trend, volatile matter is higher for increasing pine percentage in the blend.
PO100 had the highest carbon content (58.89 wt.%). Nevertheless, carbon content varied little with the pine or the additive content in the pellet blends. Similar trend was observed with the high heating value (HHV) and low heating value (LHV). The HHV values are in the range of 20.37 MJ/kg (PO100) to 19.6 MJ/kg (PO100 and PO98A2) and the LHV are within 18.33 MJ/kg to 18.67 MJ/kg.
Sulphur and nitrogen content in the fuel are related to SOx and NOx emissions during biomass combustion [42]. Sulphur content in the samples was low, ≤0.03 wt.%, except for PO98LS2 which was higher, 0.17 wt.%, due to the high sulphur content of the additive. The nitrogen content was below 0.5 wt.% in the biomass pellets. PO100 showed the highest content 0.46 wt.% followed by PO98LS2, 0.23 wt.%. A decrease in nitrogen content was observed when higher percentage of pine was added to the blend.
3.2. Optimization Tests
3.2.1. Effect of Excess Air and Primary/Second Air Ratio in Gas Emissions
The excess air is the ratio between the air insert to the combustion chamber and the stoichiometric air needed for the complete combustion. Normally, an excess of air is added to the combustion to reduce the unburned (gas and solid) material after combustion. However, an excessive excess air could lead to yield losses. The adequate excess air for the combustion of each type of biomass is different, thus a correct adjustment (depending on the biomass type) is necessary [43]. Moreover, an adequate relation of primary air (PA) and secondary air (SA) during combustion led to minimize the gas emissions and to improve the combustion yield [44].
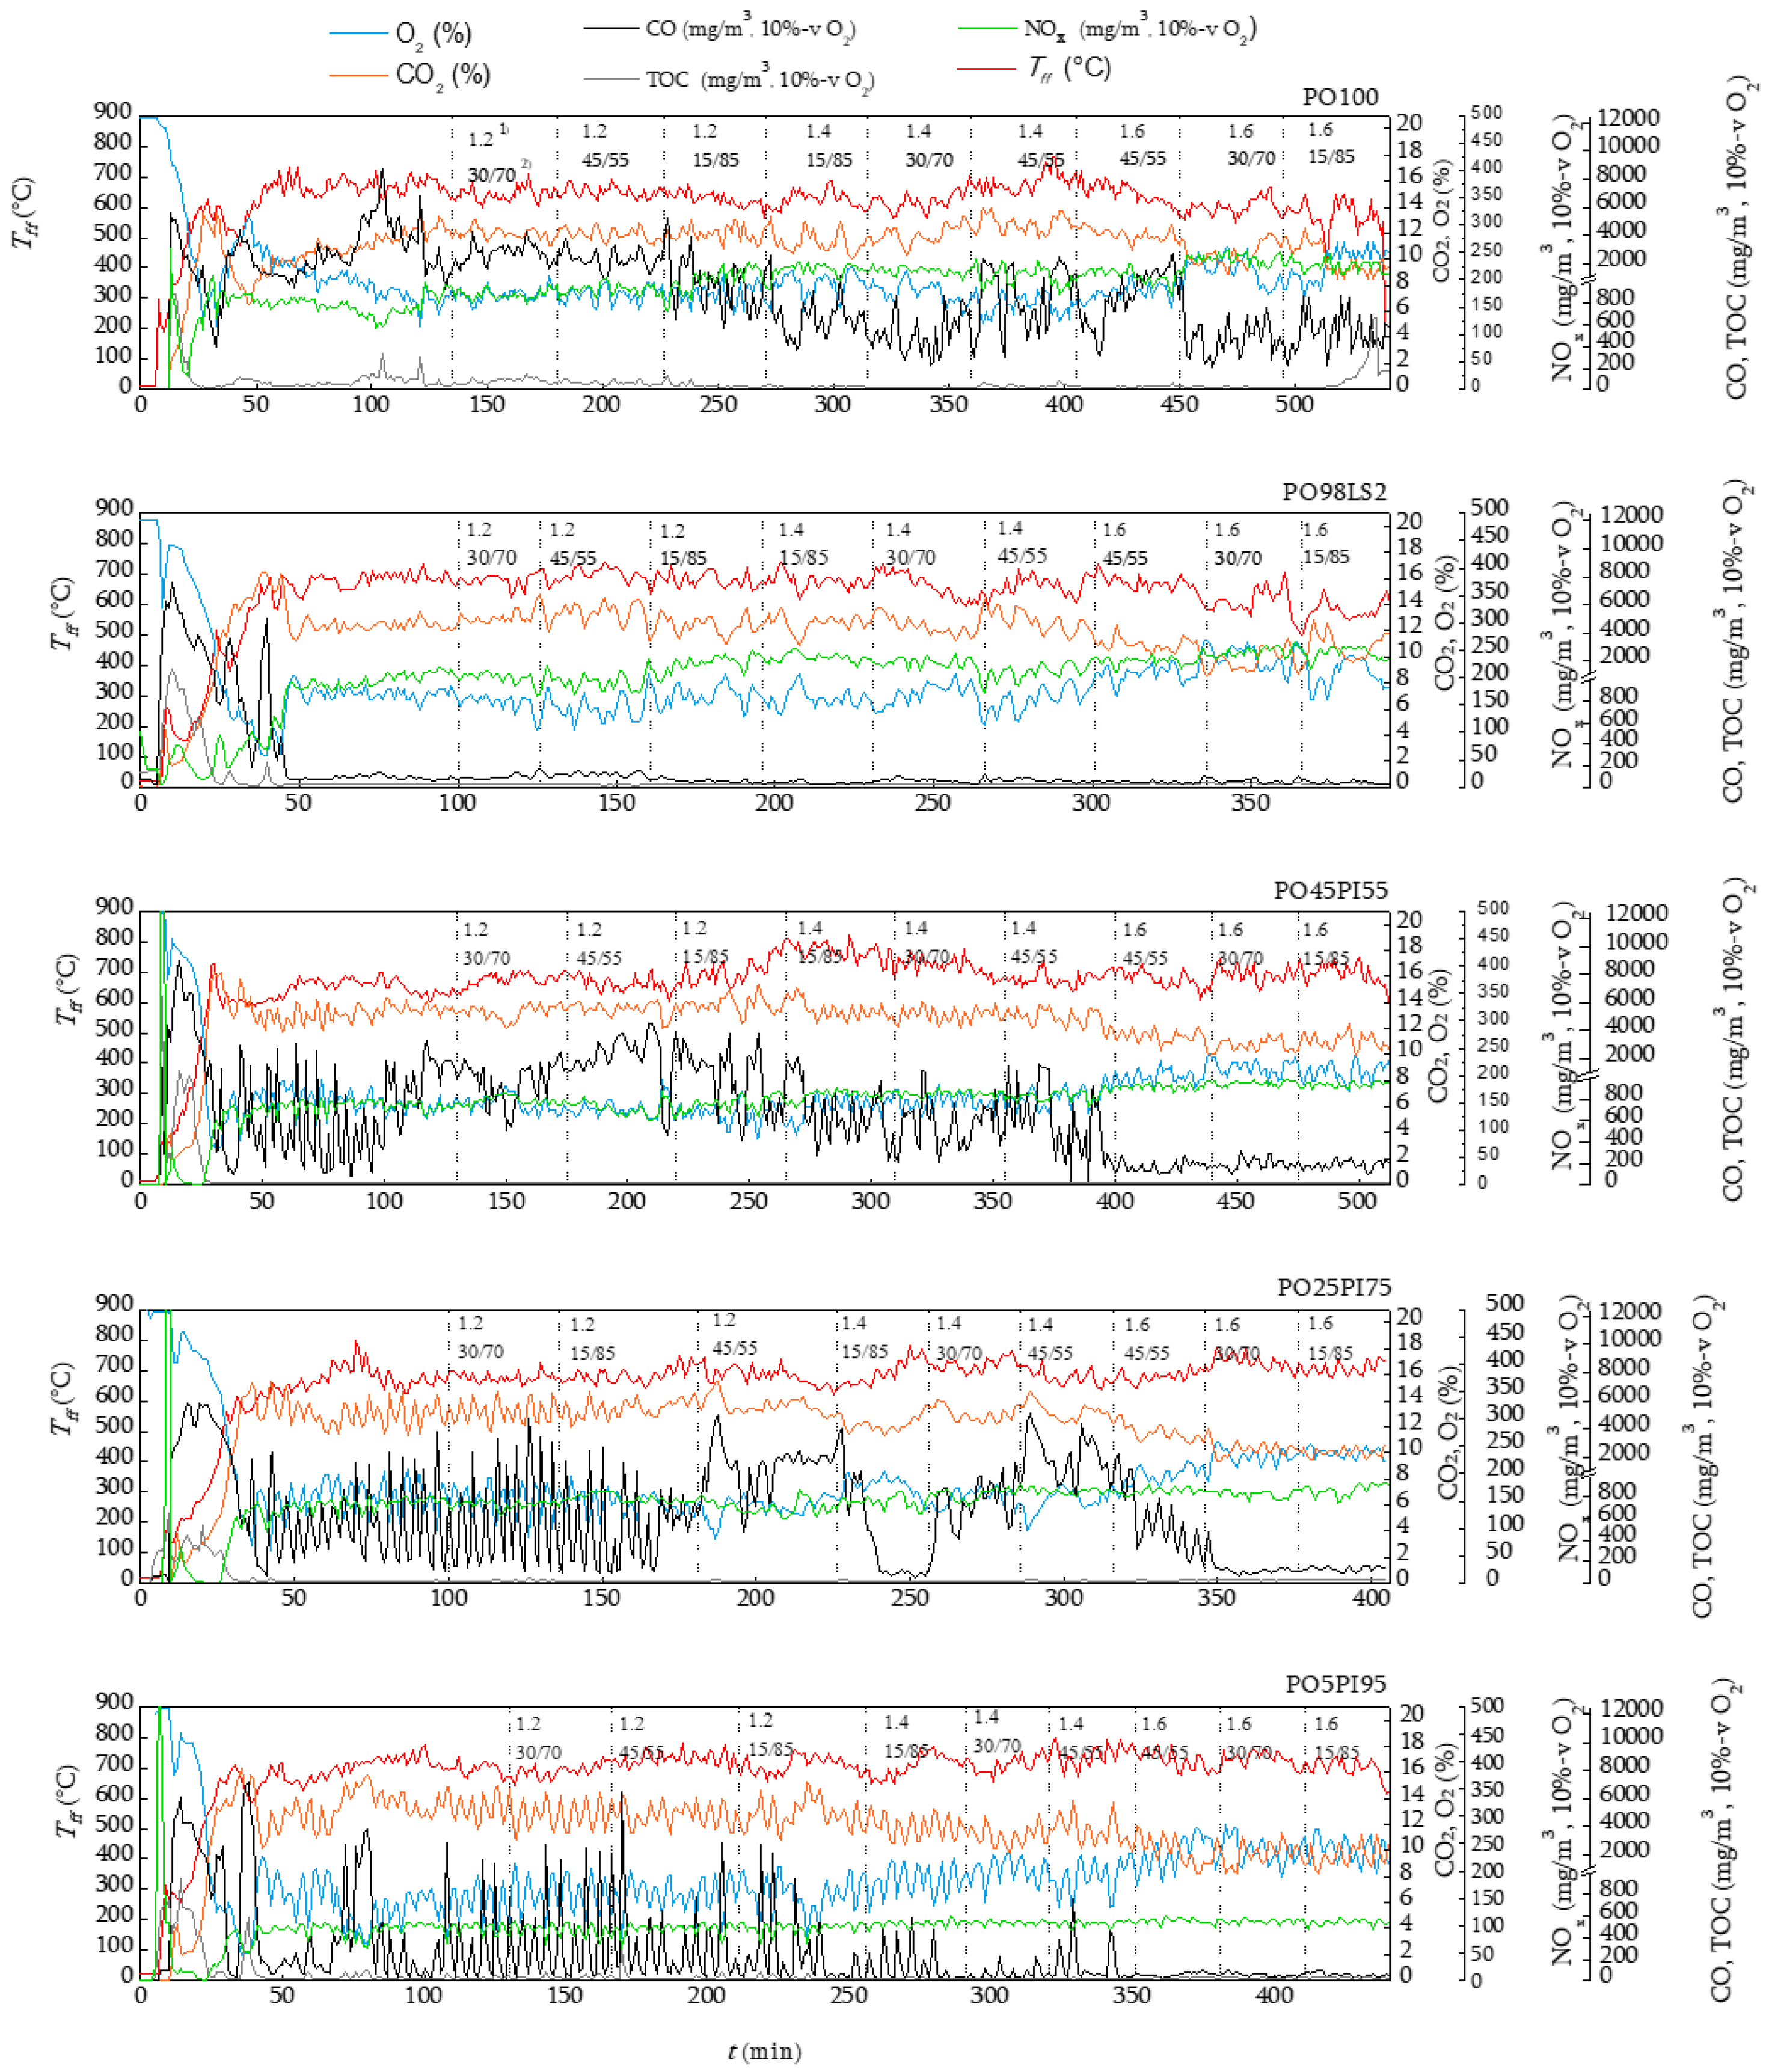
Figure 2 shows time traces for O2, CO2, CO, TOC and NOx emissions together with fireplace fume temperature (Tff) for the five pellets samples. The oscillations observed are due to feeding in small batches. At the beginning of the test, the O2 concentration decreased and the Tff and the emissions of CO2, CO and TOC increased due to the pellet ignition. The stationary condition was reached after two hours. The CO concentration is the main parameter in efficiency losses, together with the fume stack temperature. Due to the air cooling effect, the fireplace fume temperature decreased with the λ increase, as expected [45]. This effect was observed when poplar or poplar and LS was added while for poplar and pine blends, a slight increase in fireplace fume temperature with λ (regardless of the air ratio) was observed. This effect was most noticeable when moving λ from 1.4 to 1.6. In general, in tests with poplar and poplar-pine blends, the higher excess air and secondary air, the lower CO concentration was detected, since combustion in the freeboard was enhanced under these conditions [40]. PO5PI95 is the sample with lowest CO emissions in all the conditions studied. The same applies to the total organic compounds (TOC). For all samples, the NOx concentration remained roughly constant for all the conditions. However, a slight increase with the excess air was noticed probably due to the better oxidation of the fuel. Again, sample PO5PI95 showed the lowest NOx emissions. Regarding SOx emissions, the concentration detected was below the detection limit of the analyzer, since biomass has almost no sulphur.
Regarding tests with PO98LS2, again the higher λ and SA, the lower CO and TOC emission were measured. Due the high concentration of sulphur in the additive, this sample shows highest SO2 emissions. NOx and SO2 emissions slightly increased with the excess air (better oxidation of the fuel) but no clear trend with the air ratio was observed.
3.2.2. Heat Losses: ϕa and ϕg
Figure 3 and Table 4 shows heat losses ϕa and ϕg together with stack fume-2 temperature. As observed in all tests, heat loss ϕa was much higher than ϕg. An increase of stack fume temperature with λ was observed. This is probably due to the increase in the fume velocity that decrease their residence time, thus reducing their heat exchange with water [40,46]. The heat loss ϕa increased with λ, due to the increase of the stack fume flowrate and the stack fume temperature with λ. For poplar and pine samples, the heat loss ϕa seems to decrease when secondary air increases due to the decrease of stack fume temperature with secondary air. However, this effect was not significant, since it remains within the range of standard deviations. The heat loss ϕg depends on the unburned gaseous species and thus for all fuels it is explained as the variation of CO and TOC, the higher λ and secondary air, the lower ϕg.
The heat loss ϕr could not be obtained from the optimization tests, since conditions were changed without any stop between them, with no chance to take any unburned sample, and thus, the combustion efficiency could not be calculated. Consequently, the conditions for each standard combustion test were selected as the optimal ones for unburned gaseous emissions (CO and COT emissions) complying with EN 303-5:2015 standard and the ϕ (a and g) losses. The optimal excess air for poplar and poplar and pine blends was λ = 1.4, while the LS addition led to used lower optimal excess air (λ = 1.2). Regarding ṁpa/ṁsa ratio, the optimal was 30/70 for all blends except for the medium pine addition (PO25PI75) for which lowest emissions were obtained with the highest SA percentage (85%).
3.3. Standard Tests: Influence of the Pellets Type on Boiler Performance
3.3.1. Gaseous Emissions
Standard test were carried out with poplar, poplar and LS and different blends of poplar and pine as is indicated in Section 2.1. As in optimization test, the thermal power input (), water temperature gradient (ΔTw = Thw − Tcw) and water flow rate (ṁw) were kept constant within each test (Table 3). The excess air and ṁpa/ṁsa used during the test were those determined as optimal in the previous section for all samples, except for PO25PI75 and PO5SP95, for which λ = 1.3 was used instead of λ = 1.4 due to experimental problems. Figure 4 and Table 5 shows the fireplace, stack-1 and stack-2 fume temperatures, the fume mass flow and the heat losses ϕa. All the fume temperatures were lower with PO98LS2 than with PO100. However, with poplar and pine blends, the pine addition led to higher fireplace fume temperatures. The reason is the higher heating value of the pine. However, the same differences were not observed in the stacks (1 and 2) fume temperatures after heat exchange with the water circuit. A decrease in Tsf,1 and Tsf,2 was observed when both, LS and pine, were added to the blend, so the use of LS and poplar improved the heat exchange by decreasing ϕa. Since the test with PO98LS2 and pellets blends with 75 and 95 wt.%-pine use low λ, lower efficiency losses (ϕa) were observed.
Table 6 shows the standard deviations and mean values for gaseous emissions in mg/m3 considering a 10 vol.% O2 (b.s), together with heat losses ϕg. PO100 shows 746.6 mg/m3 (corrected to 10 vol.% O2) of CO. This concentration is 200 mg/m3 (10 vol.% O2) higher than those in the optimization test. The reason can be some experimental changes in the pellet flowrate (modifying the thermal power input, () and longer test time (six hours versus 30 min, making test condition more stable). As a result of LS addition, a considerable reduction in CO emissions was observed, possibly because the increase of the gas-phase reactions, led to improving the combustion process [42]. Similar results were observed with the pine addition. In this case, although a trend with the pine percentage was not detected, a reduction in CO emissions close to 50% was observed. Some authors indicate that the addition of pine to herbaceous or energy crops leads to a reduction in CO emissions due to the lower ash content in the blend [14,16].
The total organic compounds (TOC) emission were similar in all test. The differences observed are within the standard deviations.
An important NOx emissions reduction was obtained when LS or pine were added to poplar. NOx emissions from poplar combustion were 229 mg/m3 (10 vol.% O2). NOx emissions in PO95LS2 (199.5 mg/m3) were slightly lower than those from PO100 probably because of the lower nitrogen content of the pellets and the higher thermal capacity of the blend (due to LS addition). Regarding poplar and pine blends, lowest NOx emissions were observed (168, 140, 96.7 mg/m3 (10 vol.% O2) for PO45PI55, PO25PI75, PO5PI95, respectively) consistently with the highest pine content (and consequently, lower nitrogen content) in the blends. Figure 5 shows a relation between the nitrogen content in the biomass blend and its NOx emissions. An increase in NOx formation rate can be observed when the nitrogen content in biomass increases. Moreover, extrapolating the resulting function to the ordinate axis, some NOx emission would be observed even when the biomass does not contain any nitrogen. This proves that the main contribution to the NOx emissions is the fuel-nitrogen mechanism. This is consistent with the low flame temperature reached in boilers, indicating that the contribution of the thermal NO mechanisms is not expected to be important [47].
Regarding SO2 emissions, since poplar and pine have a very low sulphur content, emissions were not detected when these biomass samples (alone or mixed) were burned. However, the addition of LS leads to pellets with 0.32 wt.% of sulphur and consistently, 132.7 mg/m3 (10 vol.%) of SO2 was registered. Fournel et al. [8] agrees to indicate an increase in SO2 emissions when LS is used as additive. Small efficiency losses (ϕg) were observed when PO100 was burned (0.4%). Moreover, a decrease in ϕg was observed with the addition of LS and pine due to the decrease in CO emissions.
3.3.2. Unburned Matter and Combustion Efficiency
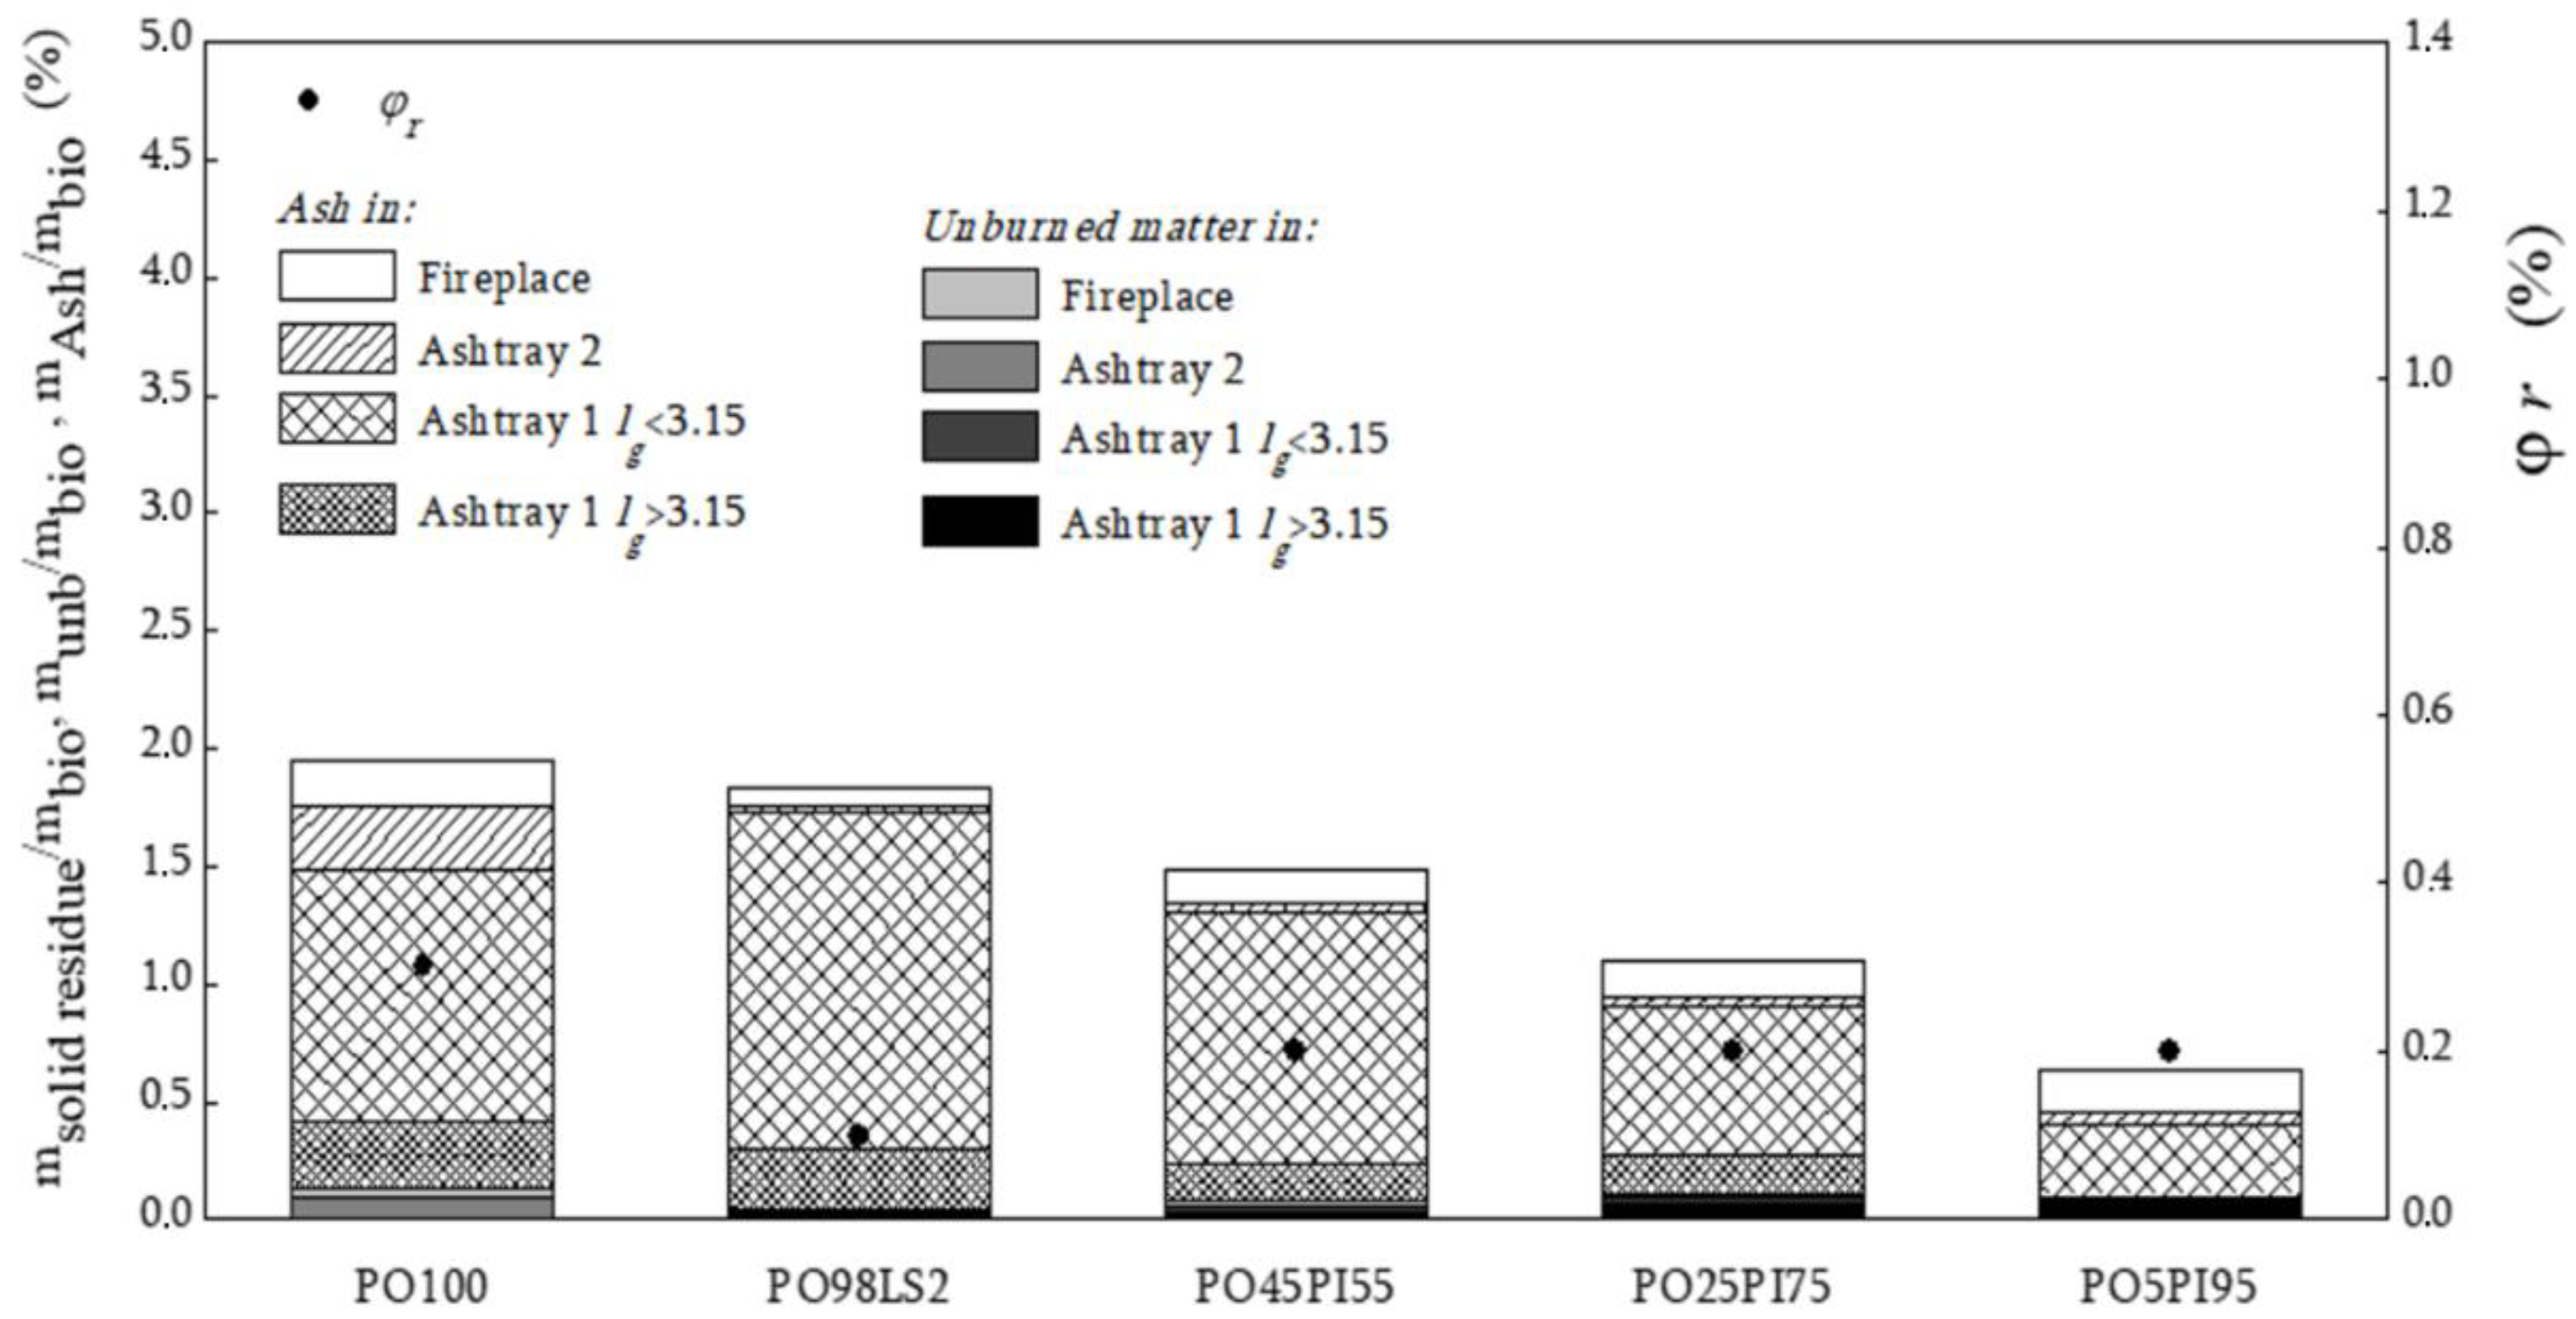
Solid residues from the standard combustion test were collected in order to evaluate their burnout degree, the distribution of the solid residues in the different parts of the boiler and the combustion efficiency. Figure 6 shows the unburned matter and efficiency losses in the solid residue (ϕr).
The ratio ṁsolid residue/ṁb in PO100 standard combustion test was close to 2%. Moreover, low ϕr was registered, 0.3%, and the residues obtained were mainly ash. The residues was mainly located in ashtray 1 with particle sizes below 3.15 mm.
Regarding pine and poplar blends, a decrease in the ratio ṁsolid residue/ṁb and ϕr was detected with the addition of pine, with ṁsolid residue/ṁb being 0.64 when 95% pine is added and ϕr = 0.2 independently of the percentage of pine addition. The results are in accordance with previous findings [14] where a decrease in the solid residue and unburned matter, when mixtures of agricultural residues and pine were burned, was observed. The reason is that pine improves the combustion process by decreasing the ash content of the biomass pellet blend.
For PO98LS2, the LS addition leads to pellets with a slightly lower ratio ṁsolid residue/ṁb than those without it (PO100) and with the lowest ϕr. Concerning the distribution of ash and unburned matter was located, in all tests, mainly in astray 1, with a particle size below 3.15 mm.
Therefore, no unburned matter-related problem during the combustion of the pellet tested (with and without pine or LS) was observed. Moreover, due to the low content of potassium, sodium and chlorine in the pellet tested, as it is normal in woody biomass [48,49], sintering problems were not observed and thus, easy ash cleaning was possible for ashtray 1 with the standard cleaning systems.
As commented before, the addition of LS or pine to the poplar pellets led to decreasing ϕr. However, the differences observed with PO100 were not significant in combustion efficiency. Figure 7 shows the efficiency losses ϕa, ϕg and ϕr, the combustion and boiler efficiency (ηi and ηd, respectively) together with the limits given in standard EN 303-5 [39] for classifying boilers.
Since boiler efficiency takes into account the heat transferred to the room and the experiments were performed in different months, the efficiency calculated with the direct method was not used to compare the combustion efficiency. Therefore, the combustion efficiency was only compared using the indirect method, where heat losses ϕa, ϕg, ϕr were considered.
Both the use of LS or pine contribute to increase the combustion efficiency (ηi). The combustion of PO98LS2 allowed the use of lower excess air than in the case of PO100 combustion and thus, the fume flow and ϕa were smaller. Moreover, since minor unburned gaseous and solid matter were observed, ϕg and ϕr were also lower. As similar excess air was used (given similar flow and fume temperature), non-important differences in combustion efficiency were observed when 55 wt.% pine was added to the poplar pellets. However, ϕg and ϕr were slightly lower. The increase of pine to the blends PO25P75 and PO5SP95 also allowed the use of lower excess air and thus ϕa, ϕg and ϕr were lower and combustion efficiency (ηi) higher than with PO100 combustion.
Concerning gas emissions and combustion efficiency (ηi), Table 7 shows the test classification according to EN 303-5 [39]. PO100, PO25PI75 and PO45PI55 test can be classified as Class 4 and PO5PI95 and PO98LS2 as Class 3. However, PO98LS2 despite complying with the efficiency and gas emissions limits established in EN 303-5 [39], is not an appropriate fuel for domestic biomass boilers. Although SO2 emissions are not regulated in domestic boilers, the PO98LS2 sulphur content determined was eight times higher than allowed in the mandatory standard EN 17225-2 [1] and consequently, significant emissions of SO2 were measured.
On the other hand, NOx emissions are not regulated in EN 303-5 [39] standard. However, regulation (UE) 2015/1189 [50] (to new boilers from 2020) indicates NOx emission limits below 200 mg/m3. According to this, and considering the result obtained, PO100 combustion could only be burned in domestic boilers when it is blended with pine. Therefore, poplar and pine blends are adequate as fuels for domestic heating.
4. Conclusions
The present study evaluates the suitability of used poplar pellet, alone or added with Ca, Mg-lignosulphonate, or poplar and pine pellets (blended at three different proportions) as fuels. The work has been focused on the gaseous emissions and the combustion efficiency obtained when these fuels are used in domestic boilers.
It was observed that the addition of LS or pine reduced the CO and NOx emissions (mainly because pine addition reduces the nitrogen content in the blend) while TOC emissions remained similar. The LS additivities leads to pellets with higher sulfur content and thus, higher SO2 emissions were registered than when PO100 was burned. The unburned matter was not a problem with any of the fuels tested. Sintering problems were not observed and thus, easy ash cleaning of the unburned matter was possible with standard cleaning systems. High combustion efficiency (>90%) was observed when PO100 was burned. However, when LS, 75 or 95 wt.% of pine was added to the blend a lower excess air was used, providing a decrease in ϕg and ϕr, and thus, higher combustion efficiency was achieved.
Therefore, the blends of poplar and pine were proved to be appropriate because they contribute to improving the properties of the fuel and thus, their combustion process. On the one hand, the pellet ash content decreases, making that PO45PI55 and PO25PI95 can be classified as B and PO5PI95 as A1 according to EN 17225-2, and on the other hand, a reduction in CO and NOx emissions and an increase in the combustion efficiency were observed.
The use of LS decrease CO and NOx emissions but increase SO2 emissions and combustion efficiency. However, the sulphur content determined in PO98LS2 was eight times higher than allowed in the mandatory standard EN 17225-2 and thus, the use of LS as an additive is discouraged.
On the other hand, NOx emissions are not regulated in EN 303-5 [39] standard. However, regulation (UE) 2015/1189 [50] (to new boilers from 2020) indicates NOx emission limits below 200 mg/m3. According to this and considering the result obtained, PO100 combustion only could be burned in domestic boilers when it is blended with pine. Therefore, poplar and pine blends are adequate as fuel to the domestic heating generation.
Author Contributions
E.M. and M.L conceived and designed the experimental testing strategy while H.P. carried out the experimental tests. E.M. wrote the manuscript and M.L contributed for the analysis and interpretation of the results.
Funding
This research received no external funding.
Acknowledgments
The authors gratefully acknowledge the support from Energías Renovables de Tarazona, S.A, through the PEGASO project. The authors would like to thank the UCLM for financing Monedero within the UCLM’s Own Research Plan.
Conflicts of Interest
The authors declare no conflicts of interest.
References
- European Committee for Standarization. Solid Biofuels—Fuel Specifications and Classes—Part 2: Graded Wood Pellets; EN ISO 17225-2: 2014; European Committee for Standarization: Brussels, Belgium, 2014. [Google Scholar]
- Obernberger, I.; Thek, G. The Pellet Handbook—The Production and Thermal Utilization of Biomass Pellets; Routledge: Abingdon, UK, 2010. [Google Scholar]
- Tissari, J.; Sippula, O.; Kouki, J.; Vuorio, K.; Jokeniemi, J. Fine particle and gas emissions from the combustión of agricultural fuels fired in a 20 kW burner. Energy Fuel 2008, 22, 2033–2042. [Google Scholar] [CrossRef]
- Carroll, J.P.; Finnan, J.M. The use of additives and fuel blending to reduce emissions from the combustion of agricultural fuels in small-scale boilers. Biosyst. Eng. 2015, 129, 127–133. [Google Scholar] [CrossRef]
- Xiong, S.; Burvall, J.; Orberg, H.; Kalen, G.; Thyrel, M.; Ohman, M.; Bostrom, D. Slagging characteristics during combustion of corn stoves with and without kaolin and calcite. Energy Fuels 2008, 22, 3465–3470. [Google Scholar] [CrossRef]
- Bostrom, D.; Grimm, A.; Boman, C.; Bjornbom, E.; Ohman, M. Influence of kaolin and Calcite Additives on Ash Transformation in Small-Scale Combustion of Oat. Energy Fuels 2009, 23, 5184–5190. [Google Scholar] [CrossRef]
- Wang, L.; Hustad, J.E.; Skreiberg, O.; Skjevrak, G.; Gronli, M. A critical review on additives to reduce ash related operation problems in biomass combustion applications. Energy Procedia 2012, 20, 20–29. [Google Scholar] [CrossRef]
- Fournel, S.; Palacios, J.H.; Godbput, S.; Heitz, M. Effects of Additives and Fuel Blending on Emissions and Ash-related Problems from Small-Scale Combustion of Reed Canary Grass. Agriculture (Basel) 2015, 5, 561–576. [Google Scholar] [CrossRef]
- Monedero, E.; Portero, H.; Lapuerta, M. Pellet blends of poplar and pine sawdust: Effects of material composition, additive, moisture content and compression die on pellet quality. Fuel Process. Technol. 2015, 132, 15–23. [Google Scholar] [CrossRef]
- Mediavilla, I.; Esteban, L.S.; Fernández, M.J. Optimization of pelletisation conditions for poplar energy crop. Fuel Process. Technol. 2012, 104, 7–15. [Google Scholar] [CrossRef]
- Miranda, T.; Arranza, J.I.; Montero, I.; Roman, S.; Rojas, C.V.; Nogales, S. Characterization and combustion of olive pomace and forest residues pellets. Fuel Process. Technol. 2012, 103, 91–96. [Google Scholar] [CrossRef]
- González, J.F.; González-García, C.M.; Ramiro, A.; Gañán, J.; Ayuso, A.; Turegano, J. Use of energy crops for domestic heating with a mural boiler. Fuel Process. Technol. 2006, 87, 717–726. [Google Scholar] [CrossRef]
- Mediavilla, I.; Fernández, M.J.; Esteban, L.S. Optimization of pelletization and combustion in a boiler of 17.5 kWth for vine shoots and industrial cork residue. Fuel Process. Technol. 2009, 90, 621–628. [Google Scholar] [CrossRef]
- Lajili, M.; Jeguirim, M.; Kraiem, N.; Limousy, L. Performance of a household boiler fed with agropellets blended from olive mil solid waste and pine sawdust. Fuel 2015, 153, 431–436. [Google Scholar] [CrossRef]
- Limousy, L.; Jeguirim, M.; Labbe, S.; Labbe, F.; Balay, F.; Fossard, E. Performance and emission characteristics of compressed spent coffee ground/wood chips logs in a residential stove. Energy Sustain. Dev. 2015, 28, 52–59. [Google Scholar] [CrossRef]
- Juszczak, M.; Lossy, K. Pollutant emission from a heat station supplied with agriculture biomass and wood pellet mixture. Chem. Process Eng.-Inzynieria Chem. Proces. 2012, 33, 231–242. [Google Scholar] [CrossRef] [Green Version]
- Zeng, T.; Weller, N.; Pollex, A.; Lenz, V. Blended biomass pellet as fuel for small scale combustion appliances: Influence on gaseous and total particulate matter emissions and applicability of fuel indices. Fuel 2016, 184, 689–700. [Google Scholar] [CrossRef]
- Regueiro, A.; Jezerská, L.; Patiño, D.; Pérez-Orozco, R.; Nečas, J.; Žídek, M. Experimental Study of the Viability of Low-Grade Biofuels in Small-Scale Appliances. Sustainability 2017, 9, 1823. [Google Scholar] [CrossRef]
- Fagerström, J.; Näzelius, I.L.; Dan, B.; Öhman, M.; Boman, C. Reduction of fine particle and deposit forming alkali by co-combustion of peat with wheat straw and forest residues. In Proceedings of the International Conference on Impact of Fuel Quality on Power production and the Environment, Saariselkä, Lapland, Finland, 29 September–3 October 2010. [Google Scholar]
- Fagerström, J.; Näzelius, I.L.; Gilbe, C.; Bostrom, D.; Öhman, M.; Boman, C. Influence of Peat Ash Composition of Particle Emissions and Slag Formation in Biomass Grate Co-combustion. Energy Fuels 2014, 28, 3403–3411. [Google Scholar] [CrossRef]
- Sippula, O.; Lamberg, H.; Leskinen, J.; Tissari, J.; Jokiniemi, J. Emissions and ash behavior in a 500 kW pellet boiled operated with various blends of woody biomass and peat. Fuel 2017, 202, 144–153. [Google Scholar] [CrossRef]
- Sommersacher, P.; Brunner, T.; Obernberger, I.; Kienzl, N.; Kanzian, W. Combustion related characterization of Miscanthus peat blends applying novel fuel characterization tools. Fuels 2015, 158, 253–262. [Google Scholar] [CrossRef]
- Ciria, M.P. Efecto del Turno de Corta y de la Densidad de Plantación Sobe la Productividad de Diversos Clones de Chopo en Condiciones de Corta Rotación. Ph.D. Thesis, Universidad Politécnica de Madrid, Madrid, Spain, 2000. [Google Scholar]
- Ciria, M.P.; González, E.; Carrasco, J.E. The effect of fertilization and planting density on biomass productivity of poplar harvested after three years rotation. In Proceeding of the 12th European Conference in Biomass for Energy, Industry and Climate Protection, Amsterdam, The Netherlands, 17–21 June 2002; pp. 283–286. [Google Scholar]
- Monedero, E.; Hernández, J.J.; Collado, R. Combustion-Related Properties of Poplar, Willow and Black Locust to be used as Fuels in Power Plants. Energies 2017, 10, 997. [Google Scholar] [CrossRef]
- Serrano, C.; Monedero, E.; Lapuerta, M. Effect of moisture content, particle size and pine addition on quality parameters of barley straw pellets. Fuel Process. Technol. 2011, 92, 73–77. [Google Scholar] [CrossRef]
- European Committee for Standarization. Solid Biofuels—Determination of Moisture Content—Oven Dry Method—Part 2: Total Moisture—Simplified Method; EN ISO 18134-2: 2017; European Committee for Standarization: Brussels, Belgium, 2017. [Google Scholar]
- European Committee for Standarization. Solid Biofuels—Determination of Moisture Content—Oven Dry Method—Part 3: Moisture in General Analysis Sample; EN ISO 18134-3: 2015; European Committee for Standarization: Brussels, Belgium, 2015. [Google Scholar]
- European Committee for Standarization. Solid Biofuels—Determination of Ash Content; EN ISO 18122: 2015; European Committee for Standarization: Brussels, Belgium, 2015. [Google Scholar]
- European Committee for Standarization. Solid Biofuels—Determination of the Content of Volatile Matter; EN ISO 18123: 2015; European Committee for Standarization: Brussels, Belgium, 2015. [Google Scholar]
- European Committee for Standarization. Solid Biofuels—Determination of Total Content of Carbon, Hydrogen and Nitrogen; EN ISO 16948: 2015; European Committee for Standarization: Brussels, Belgium, 2015. [Google Scholar]
- European Committee for Standarization. Solid Biofuels—Determination of Total Content of Sulfur and Chlorine; EN ISO 16994: 2016; European Committee for Standarization: Brussels, Belgium, 2016. [Google Scholar]
- European Committee for Standarization. Solid Biofuels—Determination of Calorific Value; EN ISO 18125: 2017; European Committee for Standarization: Brussels, Belgium, 2017. [Google Scholar]
- European Committee for Standarization. Solid Biofuels—Determination of Length and Diameter of Pellets; EN ISO 17829: 2015; European Committee for Standarization: Brussels, Belgium, 2015. [Google Scholar]
- European Committee for Standarization. Solid Biofuels—Determination of Particle Size Distribution for Uncompressed Fuels—Part 1: Oscillating Screen Method Using Sieves with Apertures of 3.15 mm and Above; EN ISO 17827-1: 2016; European Committee for Standarization: Brussels, Belgium, 2016. [Google Scholar]
- European Committee for Standarization. Solid Biofuels—Determination of Mechanical Durability of Pellets and Briquettes—Part 1: Pellets; EN ISO 17831-1: 2015; European Committee for Standarization: Brussels, Belgium, 2015. [Google Scholar]
- European Committee for Standarization. Solid Biofuels—Determination of Bulk Density; EN ISO 17828: 2015; European Committee for Standarization: Brussels, Belgium, 2015. [Google Scholar]
- European Committee for Standarization. Solid Biofuels—Sample Preparation; EN ISO 14780: 2017; European Committee for Standarization: Brussels, Belgium, 2017. [Google Scholar]
- European Committee for Standarization. Heating Boilers—Part 5: Heating Boilers for Solid Fuels, Manually and Automatically Stoked, Nominal Heat Output of up to 500 kW—Terminology, Requirements, Testing and Marking; EN 303-5: 2012; European Committee for Standarization: Brussels, Belgium, 2012. [Google Scholar]
- Serrano, C.; Portero, H.; Monedero, E. Pine chips combustion in a 50 kW domestic biomass boiler. Fuel 2013, 111, 564–573. [Google Scholar] [CrossRef]
- European Committee for Standarization. Residential Space Heating Appliances Fired by Wood Pellets—Requirements and Test Methods; EN 14785: 2006; European Committee for Standarization: Brussels, Belgium, 2006. [Google Scholar]
- Van Loo, S.; Koppejan, J. The Handbook of Biomass Combustion and Co-Firing; Van Loo, S., Koppejan, J., Eds.; Earthscan: London, UK, 2008. [Google Scholar]
- Moran, J.C.; Miguez, J.L; Porteiro, J.; Patiño, D.; Granada, E. Low quality fuels for small-scale combustion Boilers: An experimental study. Energy Fuels 2015, 29, 3064–3081. [Google Scholar] [CrossRef]
- Regueiro, A.; Patiño, D.; Porteiro, J.; Granada, E.; Míguez, J.L. Effect of Air Staging Ratios on the Burning Rate and Emissions in an Underfeed Fixed-Bed Biomass Combustor. Energies 2016, 9, 940. [Google Scholar] [CrossRef]
- Verma, V.K.; Bram, S.; Delattin, F.; De Tuyck, J. Real life performance of domestic pellet boiler technologies as a function of operational loads: A case of study of Belgium. Appl. Energy 2013, 101, 357–362. [Google Scholar] [CrossRef]
- González, J.F.; González-García, C.M.; Ramiro, A.; González, J.; Sabio, E.; Gañan, J.; Rodríguez, M.A. Combustion optimization of biomass residue pellet for domestic heating with a mural boiler. Biomass Bioenergy 2014, 27, 145–154. [Google Scholar] [CrossRef]
- Miller, J.A.; Bowman, C.T. Mechanism and modeling of nitrogen chemistry in combustión. Prog. Energy Combust. Sci. 1989, 15, 287–338. [Google Scholar] [CrossRef]
- Vassilev, S.V.; Baxter, D.; Vassileva, C.G. An overview of the behavior of biomass during combustion: Part I. Phase-mineral transformations of organic and inorganic matter. Fuel 2013, 112, 391–449. [Google Scholar] [CrossRef]
- Vega, D.J.; Dopazo, R.; Ortiz, L. Manual of Energy Crops; Ed. Gamesal: Pontevedra, Spain, 2010. [Google Scholar]
- Commission Regulation (EU) 2015/1185 Implementing Directive 2009/125/EC of the European Parliament and of the Council with Regard to Ecodesign Requirements for Solid Fuel Local Space Heaters; Official Journal of the European Union: Brussel, Belgium, 2015.
Figure 1.
Combustion test stand.

Figure 2.
Time evolution gas emissions and fireplace fume temperature for optimization tests.

Figure 3.
Heat losses ϕa and ϕg and stack-2 fume (Tsf,2) temperature.

Figure 4.
Fume temperatures and fume mass flow and heat losses ϕa.

Figure 5.
Biomass nitrogen content vs. NOx emissions.

Figure 6.
Total residues and ash distribution (% referred to the biomass feed to the boiler) and efficiency losses ϕr.
Figure 6.
Total residues and ash distribution (% referred to the biomass feed to the boiler) and efficiency losses ϕr.

Figure 7.
Heat losses ϕa, ϕg and ϕr and combustion efficiency (ηd and ηi).


Table 1.
Compositions, nomenclature and quality of the pellets.
| Nomenclature | Pine | Poplar | LS | EN ISO17225-2 Quality |
|---|---|---|---|---|
| PO100 | 0 | 100 | 0 | - |
| PO98LS2 | 0 | 98 | 2 | - |
| PO45PI55 | 55 | 45 | 0 | B |
| PO25PI75 | 75 | 25 | 0 | B |
| PO5PI95 | 95 | 5 | 0 | A1 |
Table 2.
Physico-chemical properties of the pellets (dry basis).
| Properties | PO100 | PO98LS2 | PO45PI55 | PO25PI75 | PO5PI95 | Unit |
|---|---|---|---|---|---|---|
| Moisture content | 9.0 | 10.0 | 10.0 | 12.0 | 9.6 | wt.% d.b. |
| Durability | 96.1 | 96.9 | 97.5 | 97.9 | 97.8 | wt.% d.b. |
| Bulk density | 556 | 560 | 668 | 665 | 709 | kg/m3 |
| Particle density | 950 | 990 | 1020 | 1040 | 1120 | kg/m3 |
| Length | 26.7/SD = 5.7 | 27.2/SD = 4.2 | 20.4/SD = 0.7 | 14.0/SD = 8.2 | 15.5/SD = 5.8 | mm |
| Diameter | 6.5/SD = 0.2 | 6.4/SD = 0.1 | 6.3/SD = 0.2 | 6.2/SD = 0.2 | 6.1/SD = 0.1 | mm |
| Proximate analysis | ||||||
| Ash | 2.52 | 3.35 | 1.5 | 1.5 | 0.7 | wt.% d.b. |
| Volatile matter | 80.38 | 79.30 | 87.71 | 82.58 | 84.06 | wt.% d.b. |
| Ultimate analysis | ||||||
| Carbon | 51.23 | 50.09 | 51.03 | 50.84 | 51.42 | wt.% d.b. |
| Hydrogen | 5.77 | 5.73 | 5.94 | 5.93 | 6.03 | wt.% d.b. |
| Nitrogen | 0.46 | 0.23 | 0.11 | 0.11 | 0.06 | wt.% d.b. |
| Sulphur | 0.02 | 0.17 | 0.03 | 0.03 | 0.02 | wt.% d.b. |
| Chlorine | 0.01 | 0.01 | 0.01 | 0.01 | 0.01 | wt.% d.b. |
| Calorific Values | ||||||
| HHV | 19.58 | 19.60 | 19.66 | 19.97 | 19.82 | MJ/kg d.b. |
| LHV | 18.33 | 18.35 | 18.37 | 18.67 | 18.50 | MJ/kg d.b. |
Notes: wt.%: weight %; d.b.: dry basis; HHV: High heating value; LHV: lower heating value; SD: Standard deviation.
Table 3.
Operative conditions for standard test.
| Biomass | (kW) | λ | ΔTw (°C) | (m3/h) | |
|---|---|---|---|---|---|
| PO100 | 54 | 1.4 | 30/70 | 8.9 ± 0.7 | 4.5 ± 0.1 |
| PO98LS2 | 55 | 1.2 | 30/70 | 8.4 ± 0.7 | 4.7 ± 0.1 |
| PO45PI55 | 53 | 1.4 | 30/70 | 8.2 ± 0.5 | 4.8 ± 0.1 |
| PO25PI75 | 57 | 1.3 | 15/85 | 10.5 ± 0.8 | 4.1 ± 0.1 |
| PO5PI95 | 55 | 1.3 | 30/70 | 10.2 ± 1.1 | 3.8 ± 0.2 |
Table 4.
Heat losses ϕa and ϕb and sdtack-2 fume (Tsf,2) temperature.
| Biomass | λ | SA (%) | ϕa (%) | ϕb (%) | Tsf,2 (°C) |
|---|---|---|---|---|---|
| PO100 | 1.2 | 85 | 7.3 | 0.6 | 154.0 ± 4.8 |
| 70 | 6.7 | 1.3 | 148.5 ± 1.1 | ||
| 55 | 6.8 | 0.9 | 149.7 ± 3.1 | ||
| 1.4 | 85 | 8.4 | 0.4 | 160.3 ± 2.5 | |
| 70 | 8.3 | 0.4 | 161.4 ± 2.0 | ||
| 55 | 8.4 | 0.6 | 164.1 ± 2.2 | ||
| 1.6 | 85 | 10.0 | 0.4 | 174.8 ± 2.3 | |
| 70 | 9.9 | 0.3 | 172.5 ± 3.3 | ||
| 55 | 9.5 | 0.7 | 169.5 ± 1.7 | ||
| PO98LS2 | 1.2 | 85 | 7.5 | 0.1 | 158.3 ± 3.2 |
| 70 | 7.2 | 0.2 | 157.1 ± 1.3 | ||
| 55 | 7.2 | 0.2 | 157.7 ± 1.6 | ||
| 1.4 | 85 | 8.7 | 0.2 | 168.9 ± 1.7 | |
| 70 | 8.5 | 0.2 | 166.4 ± 2.1 | ||
| 55 | 8.9 | 0.1 | 167.9 ± 2.0 | ||
| 1.6 | 85 | 10.1 | 0.2 | 174.8 ± 1.9 | |
| 70 | 9.8 | 0.2 | 171.2 ± 2.7 | ||
| 55 | 10.0 | 0.2 | 172.2 ± 0.8 | ||
| PO45PI55 | 1.2 | 85 | 7.1 | 0.9 | 158.6 ± 2.2 |
| 70 | 7.0 | 0.5 | 158.0 ± 1.5 | ||
| 55 | 7.0 | 1.1 | 158.9 ± 2.3 | ||
| 1.4 | 85 | 8.2 | 0.5 | 165.3 ± 1.4 | |
| 70 | 8.1 | 0.4 | 164.0 ± 1.4 | ||
| 55 | 8.1 | 0.4 | 163.3 ± 1.9 | ||
| 1.6 | 85 | 8.8 | 0.2 | 165.9 ± 1.2 | |
| 70 | 9.0 | 0.2 | 166.1 ± 1.2 | ||
| 55 | 8.8 | 0.2 | 167.2 ± 1.3 | ||
| PO25PI75 | 1.2 | 85 | 7.2 | 0.4 | 161.9 ± 1.6 |
| 70 | 7.1 | 0.5 | 158.8 ± 1.6 | ||
| 55 | 7.2 | 0.7 | 162.8 ± 1.7 | ||
| 1.4 | 85 | 8.0 | 0.2 | 164.5 ± 2.4 | |
| 70 | 8.1 | 0.5 | 167.7 ± 1.2 | ||
| 55 | 8.0 | 1.0 | 166.0 ± 2.0 | ||
| 1.6 | 85 | 9.5 | 0.2 | 172.2 ± 0.8 | |
| 70 | 9.8 | 0.2 | 175.0 ± 1.2 | ||
| 55 | 9.2 | 0.4 | 172.9 ± 0.8 | ||
| PO5PI95 | 1.2 | 85 | 7.2 | 0.2 | 157.2 ± 3.0 |
| 70 | 6.8 | 0.3 | 156.3 ± 2.2 | ||
| 55 | 7.1 | 0.2 | 158.6 ± 3.0 | ||
| 1.4 | 85 | 8.1 | 0.2 | 163.0 ± 4.7 | |
| 70 | 8.2 | 0.2 | 165.7 ± 2.3 | ||
| 55 | 8.7 | 0.2 | 167.1 ± 2.0 | ||
| 1.6 | 85 | 9.1 | 0.2 | 167.8 ± 1.8 | |
| 70 | 9.4 | 0.2 | 169.6 ± 1.7 | ||
| 55 | 9.6 | 0.2 | 173.3 ± 2.3 |
Table 5.
Fume temperatures and fume mass flow and heat losses ϕa.
| Biomass | Tff (°C) | Tsf,1 (°C) | Tsf,2 (°C) | ṁGC (kg/h) | ϕa (%) |
|---|---|---|---|---|---|
| PO100 | 627.1 ± 23.8 | 298.7 ± 5.8 | 169.1 ± 3.3 | 91.2 | 8.6 |
| PO98LS2 | 624.9 ± 21.7 | 284.4 ± 6.7 | 161.3 ± 2.8 | 83.8 | 7.2 |
| PO45PI55 | 700.5 ± 29.5 | 290.3 ± 4.6 | 163.8 ± 1.3 | 93.6 | 8.6 |
| PO25PI75 | 674.6 ± 30.4 | 295.8 ± 4.5 | 164.8 ± 2.9 | 85.3 | 7.3 |
| PO5PI95 | 659.9 ± 29.5 | 267.6 ± 9.0 | 156.8 ± 3.4 | 83.2 | 7.1 |
Table 6.
Gas emissions and ϕg.
| Biomass | O2 (%) | CO2 (%) | CO (mg/m3, 10%-v O2) | COT (mg/m3, 10%-v O2) | NOx (mg/m3, 10%-v O2) | SO2 (mg/m3, 10%-v O2) | ϕg (%) |
|---|---|---|---|---|---|---|---|
| PO100 | 8.2 ± 0.8 | 11.8 ± 0.7 | 746.6 ± 382.5 | 23.2 ± 4.7 | 229.0 ± 11.4 | 0.0 ± 0.0 | 0.3 |
| PO98LS2 | 5.8 ± 0.8 | 13.7 ± 0.7 | 80.2 ± 38.7 | 20.0 ± 1.8 | 199.5 ± 17.4 | 132.7 ± 24.3 | 0.1 |
| PO45IP55 | 7.5 ± 0.7 | 12.2 ± 0.6 | 359.1 ± 255.1 | 22.6 ± 2.9 | 168.1 ± 6.3 | 0.0 ± 0.0 | 0.2 |
| PO25PI75 | 6.9 ± 0.6 | 12.6 ± 0.5 | 369.7 ± 297.6 | 23.3 ± 6.5 | 140.4 ± 6.5 | 0.0 ± 0.0 | 0.2 |
| PO5PI95 | 7.1 ± 1.3 | 12.0 ± 1.0 | 331.1 ± 399.7 | 27.7 ± 11.4 | 96.7 ± 7.5 | 0.0 ± 0.0 | 0.2 |
Table 7.
Test classification according to EN 303-5 [39].
Table 7.
Test classification according to EN 303-5 [39].
| Biomass | CO (mg/m3, 10%-v O2) | COT (mg/m3, 10%-v O2) | ηd (%) | Clasification UNE EN 303-5 | ||||||
|---|---|---|---|---|---|---|---|---|---|---|
| Class 3 | Class 4 | Class 5 | Class 3 | Class 4 | Class 5 | Class 3 | Class 4 | Class 5 | ||
| ≤2500 >1000 | ≤1000 >500 | ≤500 | ≤80 >30 | ≤30 >20 | ≤20 | ≥77.4 <83.5 | ≥83.5 <88.7 | ≥88.7 | ||
| PO100 | □ | □ | □ | Class 4 | ||||||
| PO98LS2 | □ | □ | □ | Class 3 | ||||||
| PO45PI55 | □ | □ | □ | Class 4 | ||||||
| PO25PI75 | □ | □ | □ | Class 4 | ||||||
| PO5PI95 | □ | □ | □ | Class 3 | ||||||
© 2018 by the authors. Licensee MDPI, Basel, Switzerland. This article is an open access article distributed under the terms and conditions of the Creative Commons Attribution (CC BY) license (http://creativecommons.org/licenses/by/4.0/).
Share and Cite
MDPI and ACS Style
Monedero, E.; Portero, H.; Lapuerta, M. Combustion of Poplar and Pine Pellet Blends in a 50 kW Domestic Boiler: Emissions and Combustion Efficiency. Energies 2018, 11, 1580. https://doi.org/10.3390/en11061580
AMA Style
Monedero E, Portero H, Lapuerta M. Combustion of Poplar and Pine Pellet Blends in a 50 kW Domestic Boiler: Emissions and Combustion Efficiency. Energies. 2018; 11(6):1580. https://doi.org/10.3390/en11061580
Chicago/Turabian StyleMonedero, Esperanza, Henar Portero, and Magín Lapuerta. 2018. "Combustion of Poplar and Pine Pellet Blends in a 50 kW Domestic Boiler: Emissions and Combustion Efficiency" Energies 11, no. 6: 1580. https://doi.org/10.3390/en11061580
Note that from the first issue of 2016, this journal uses article numbers instead of page numbers. See further details here.