A Simplified Physical Model Construction Method and Gas-Water Micro Scale Flow Simulation in Tight Sandstone Gas Reservoirs


Abstract
:1. Introduction
2. The Construction Idea of the Simplified Model
3. Construction Method of the Simplified Model
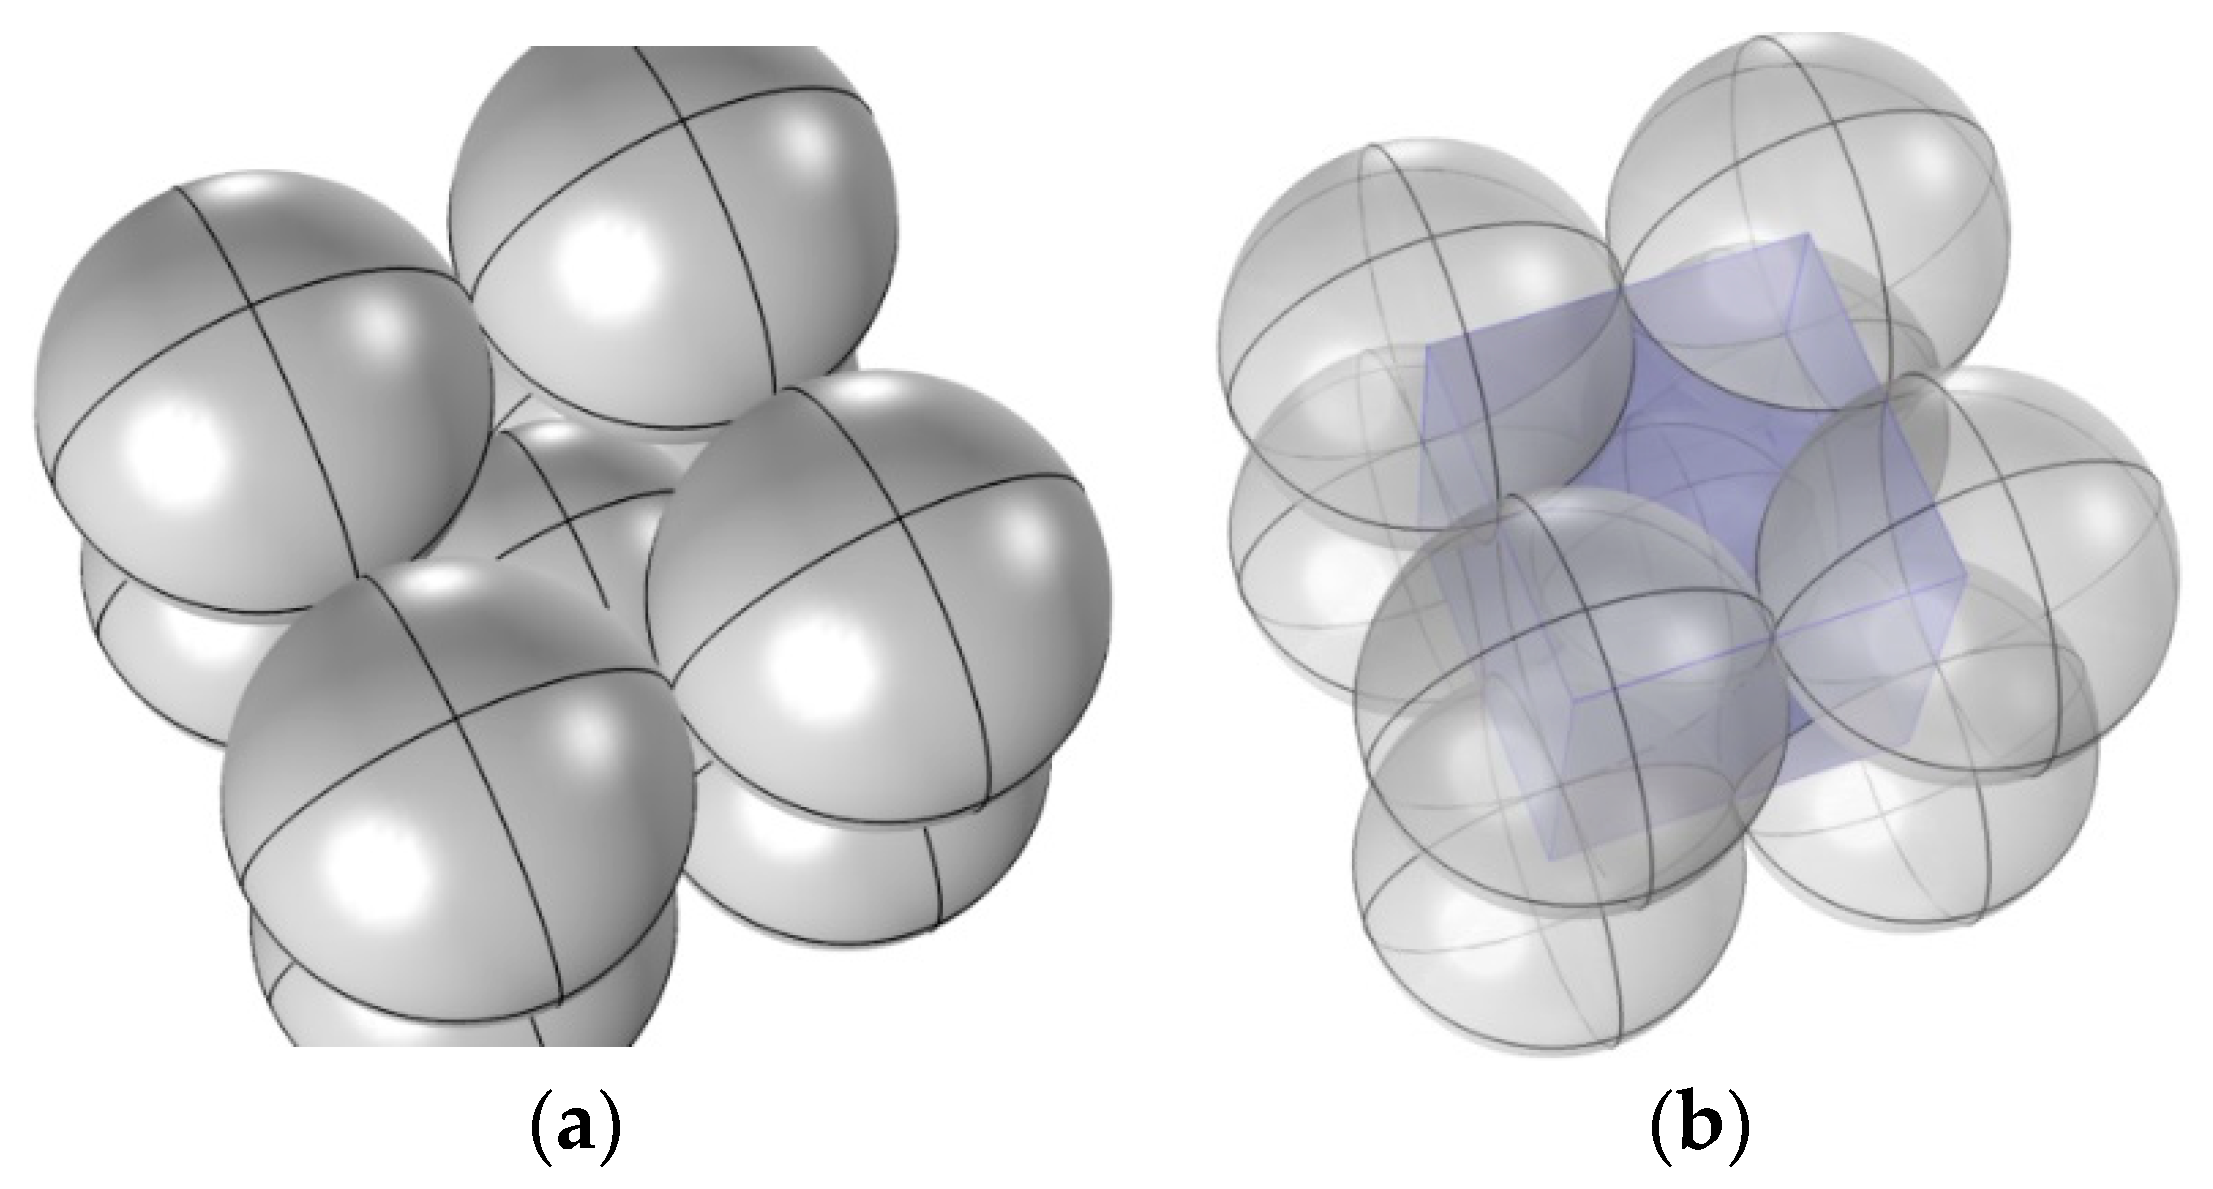
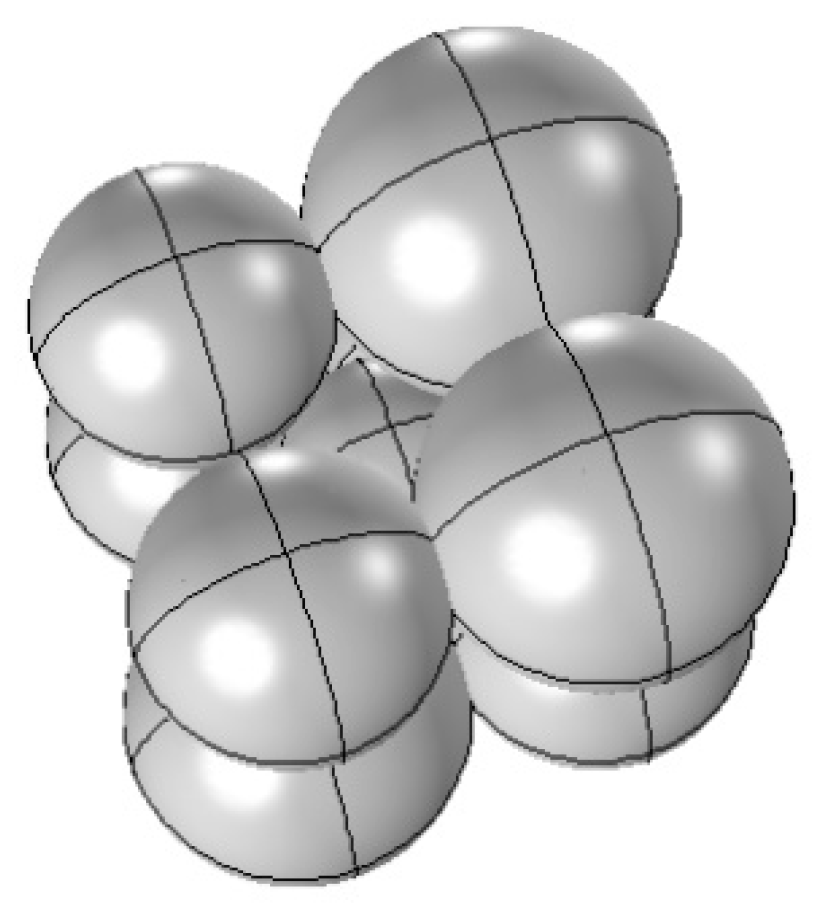
3.1. The Tangent Spheres Model
3.2. The Spheres Model Following the Rayleigh Frequency Distribution
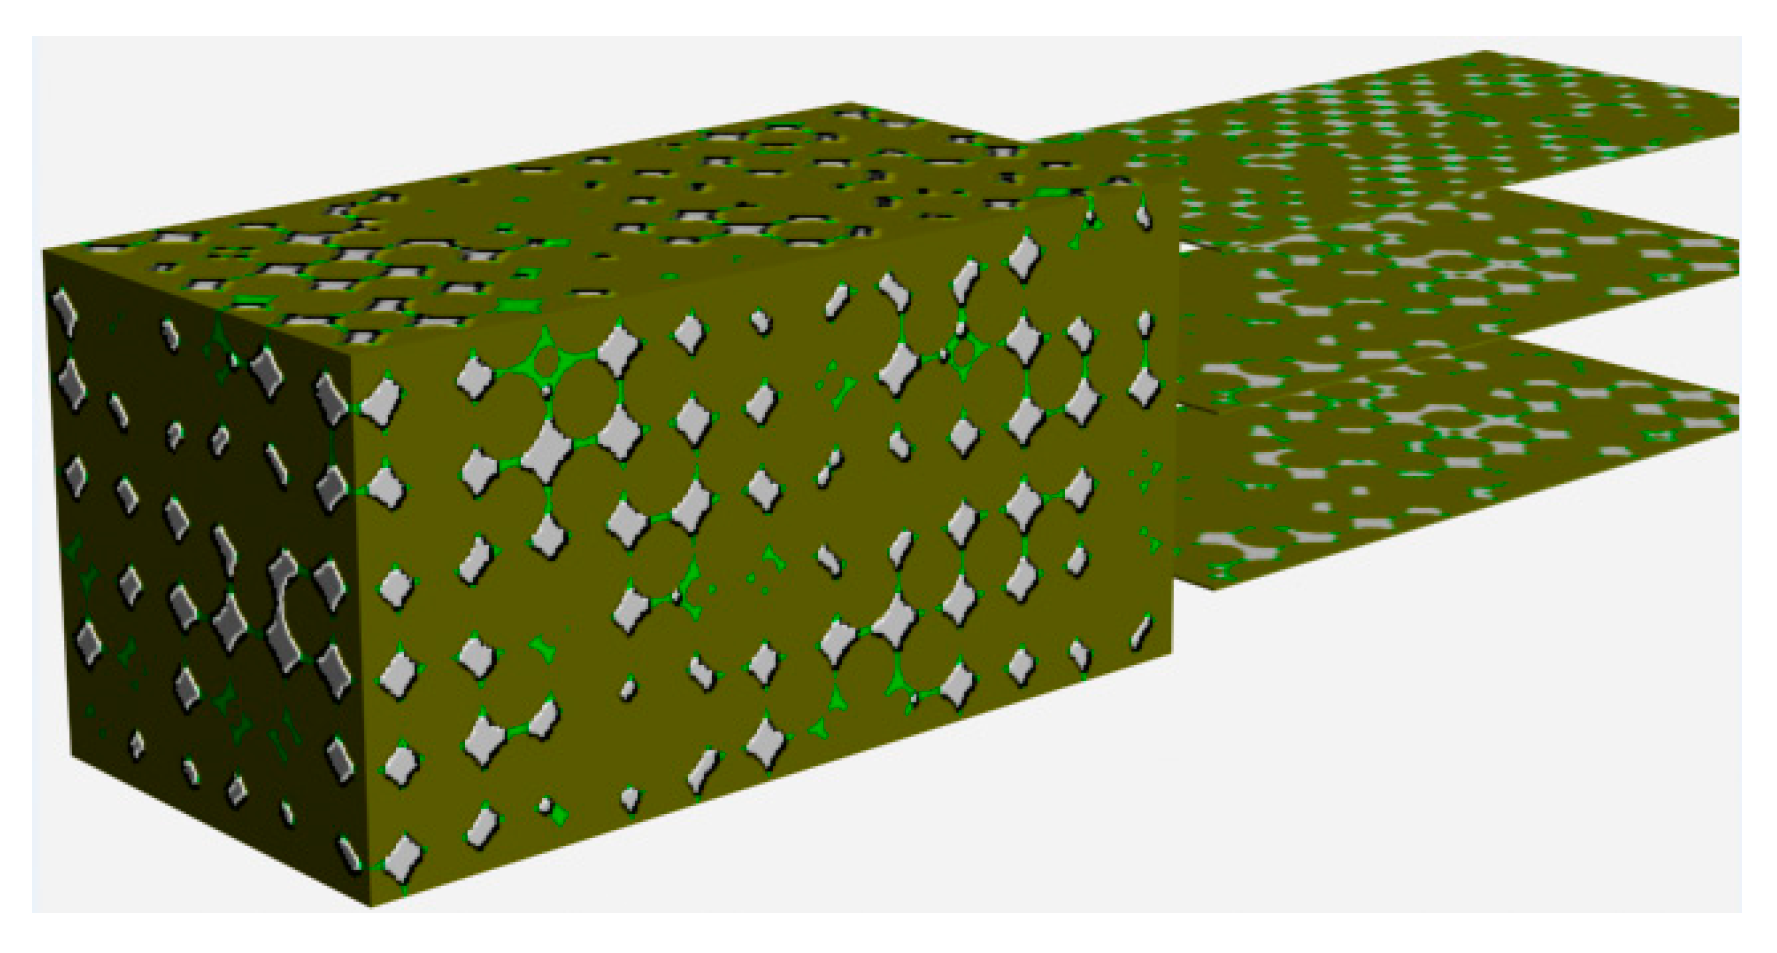
3.3. The Embedded Spheres Model under the Synergy Effect of Compaction and Cementation
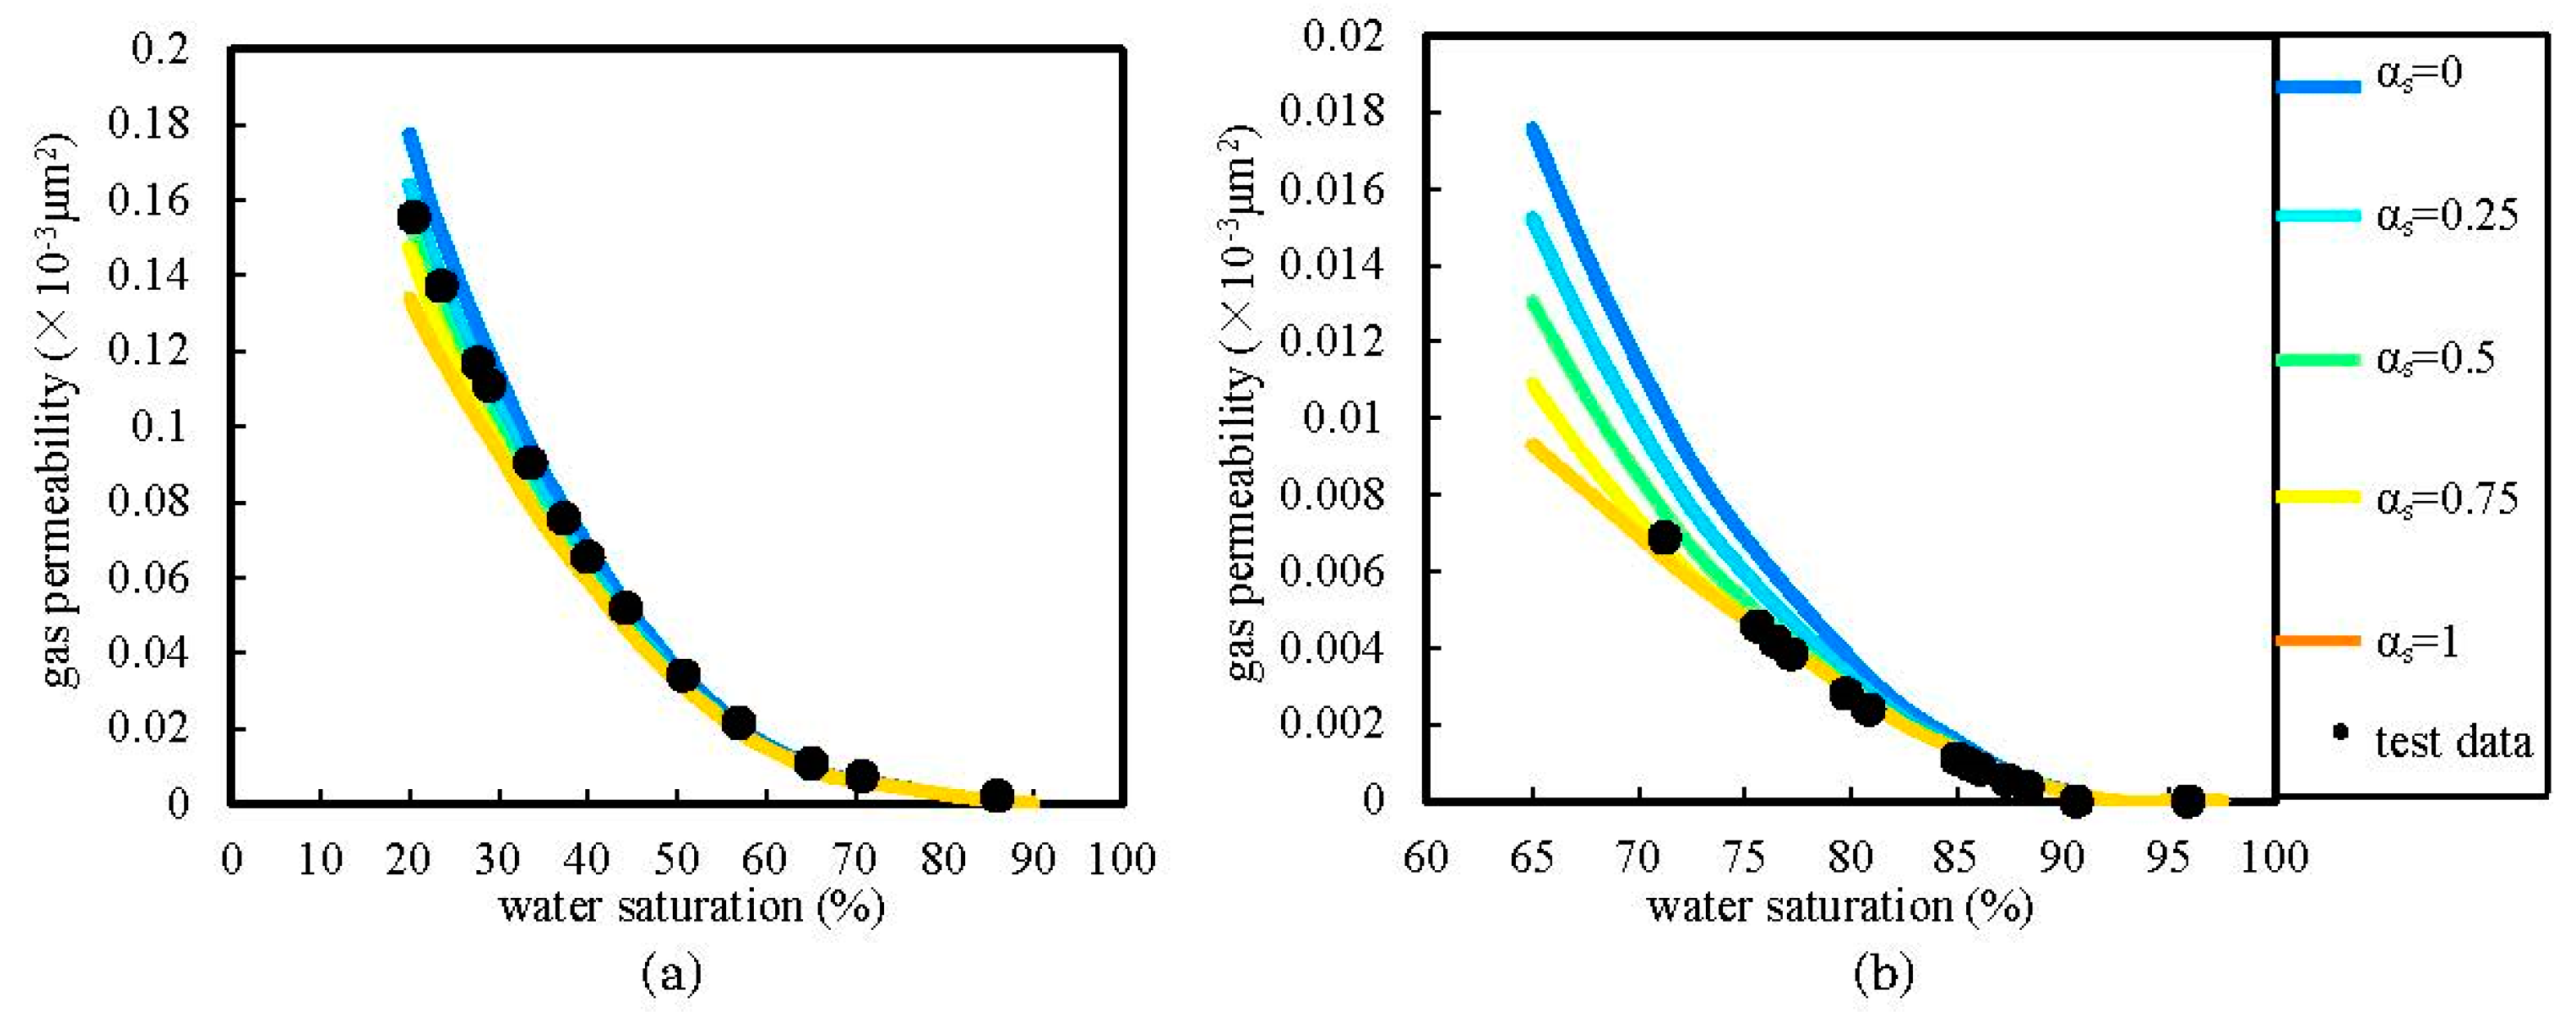
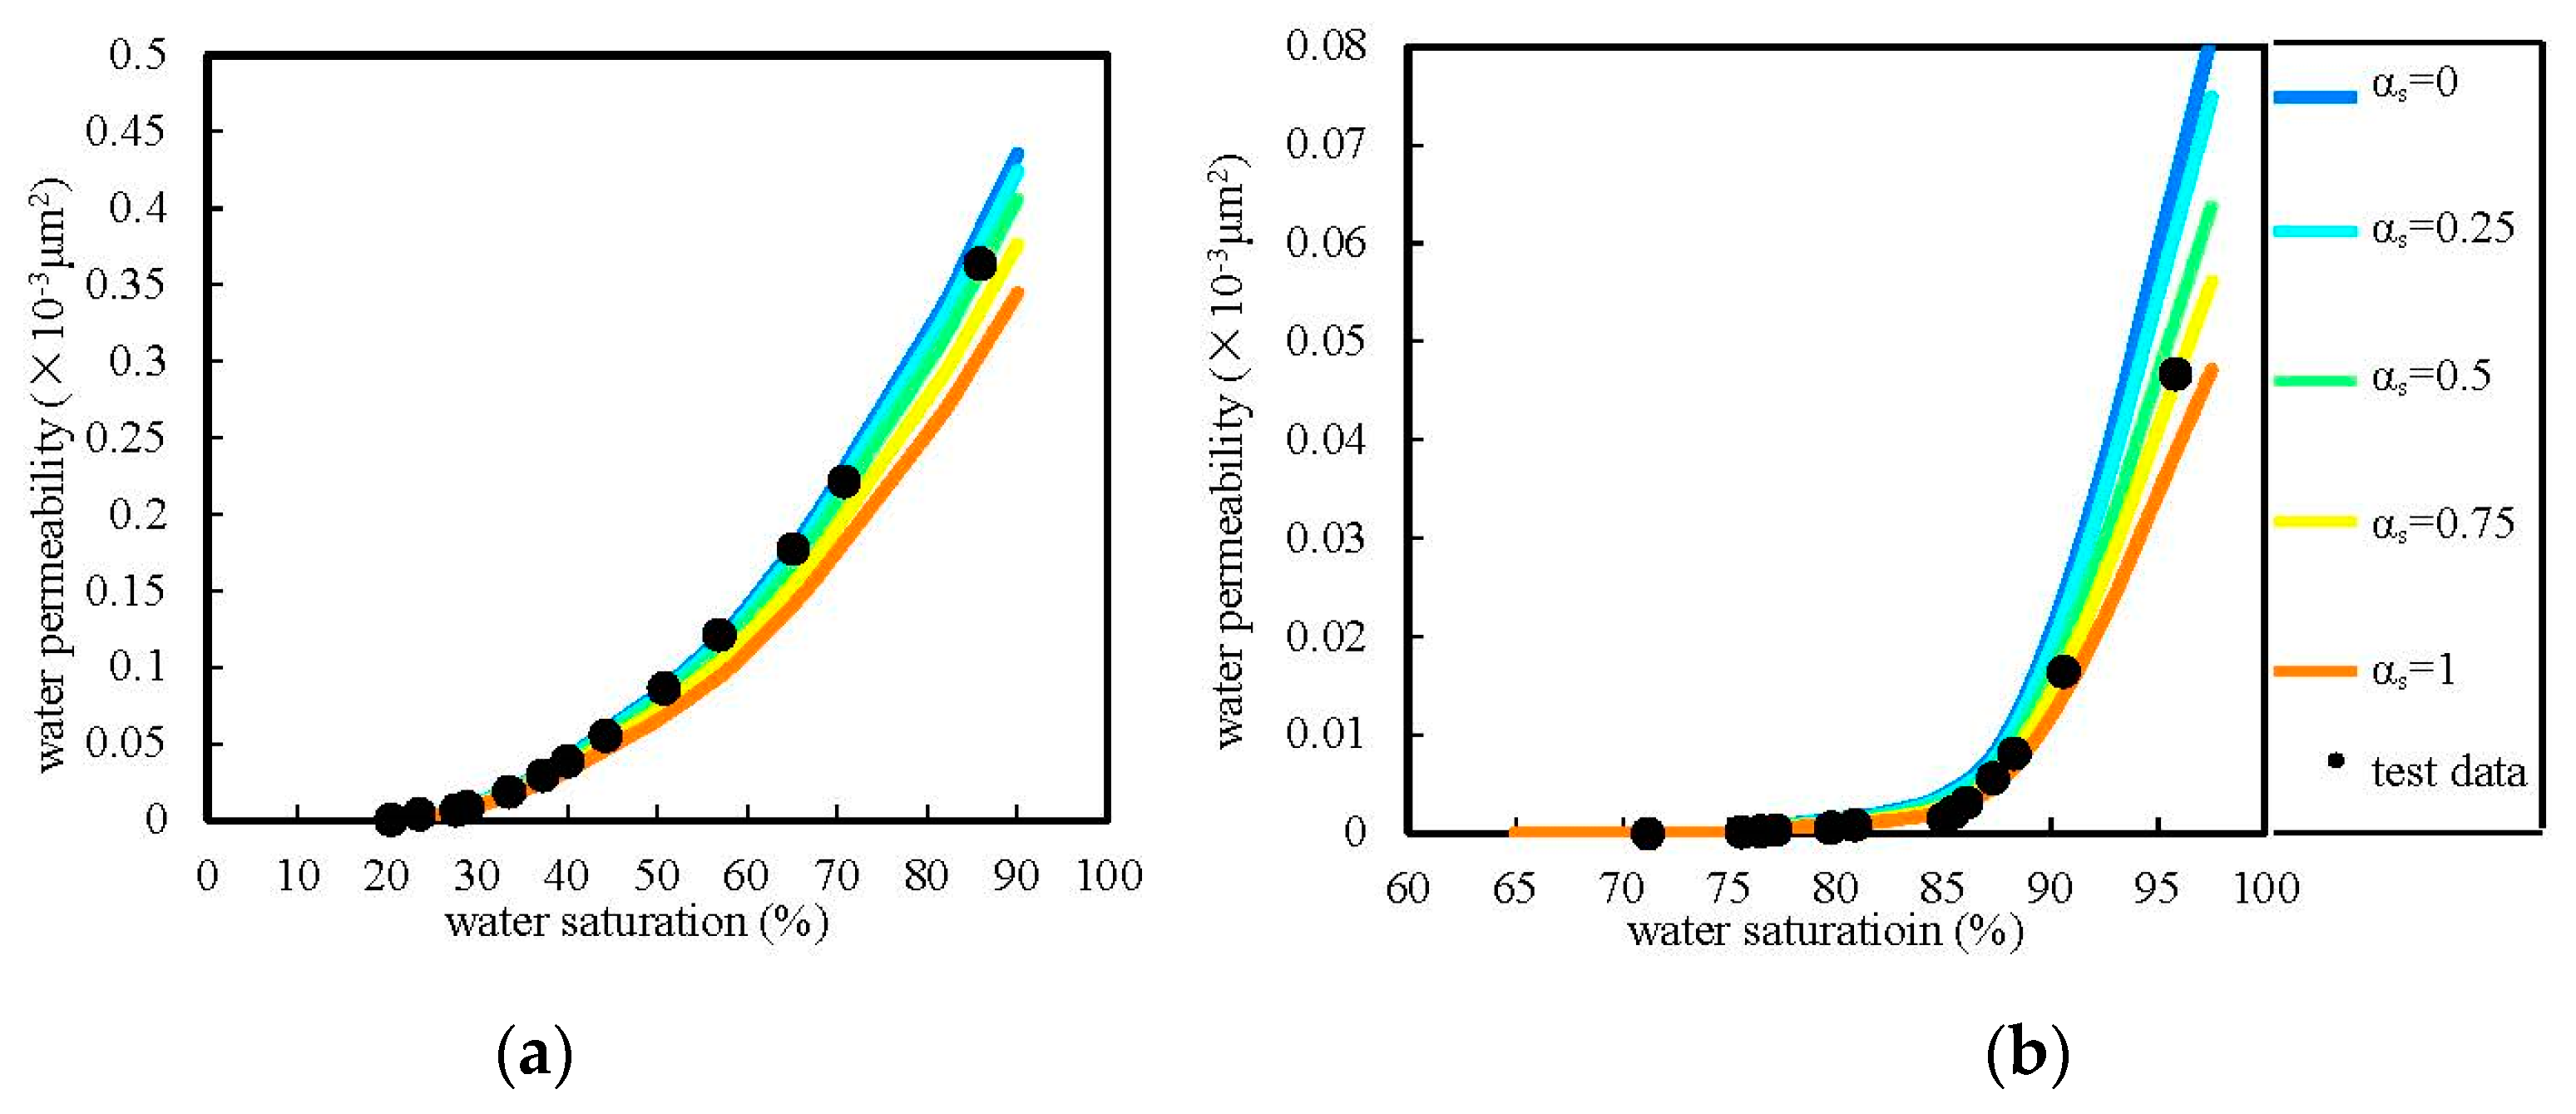
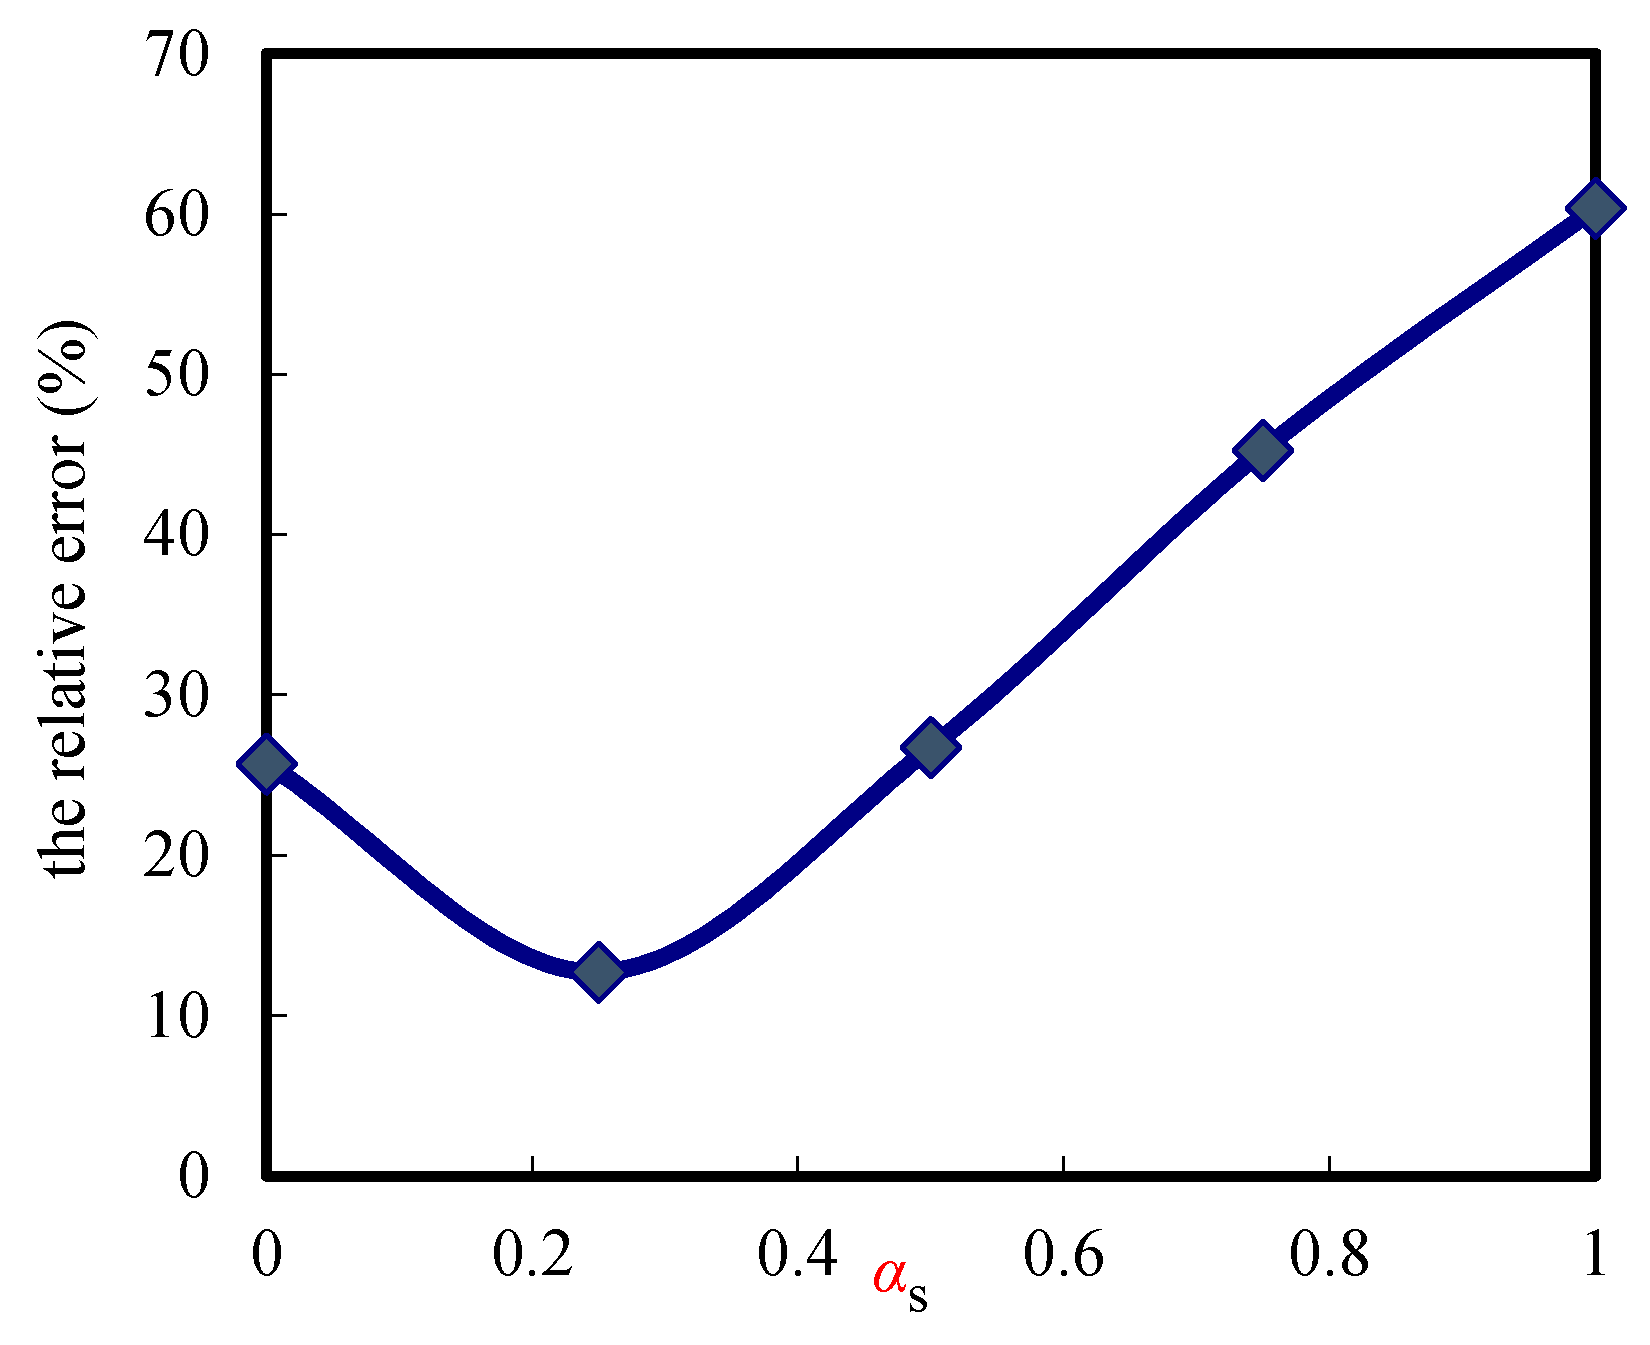
4. The Fitting Method of the Synergetic Coefficient
5. Applications
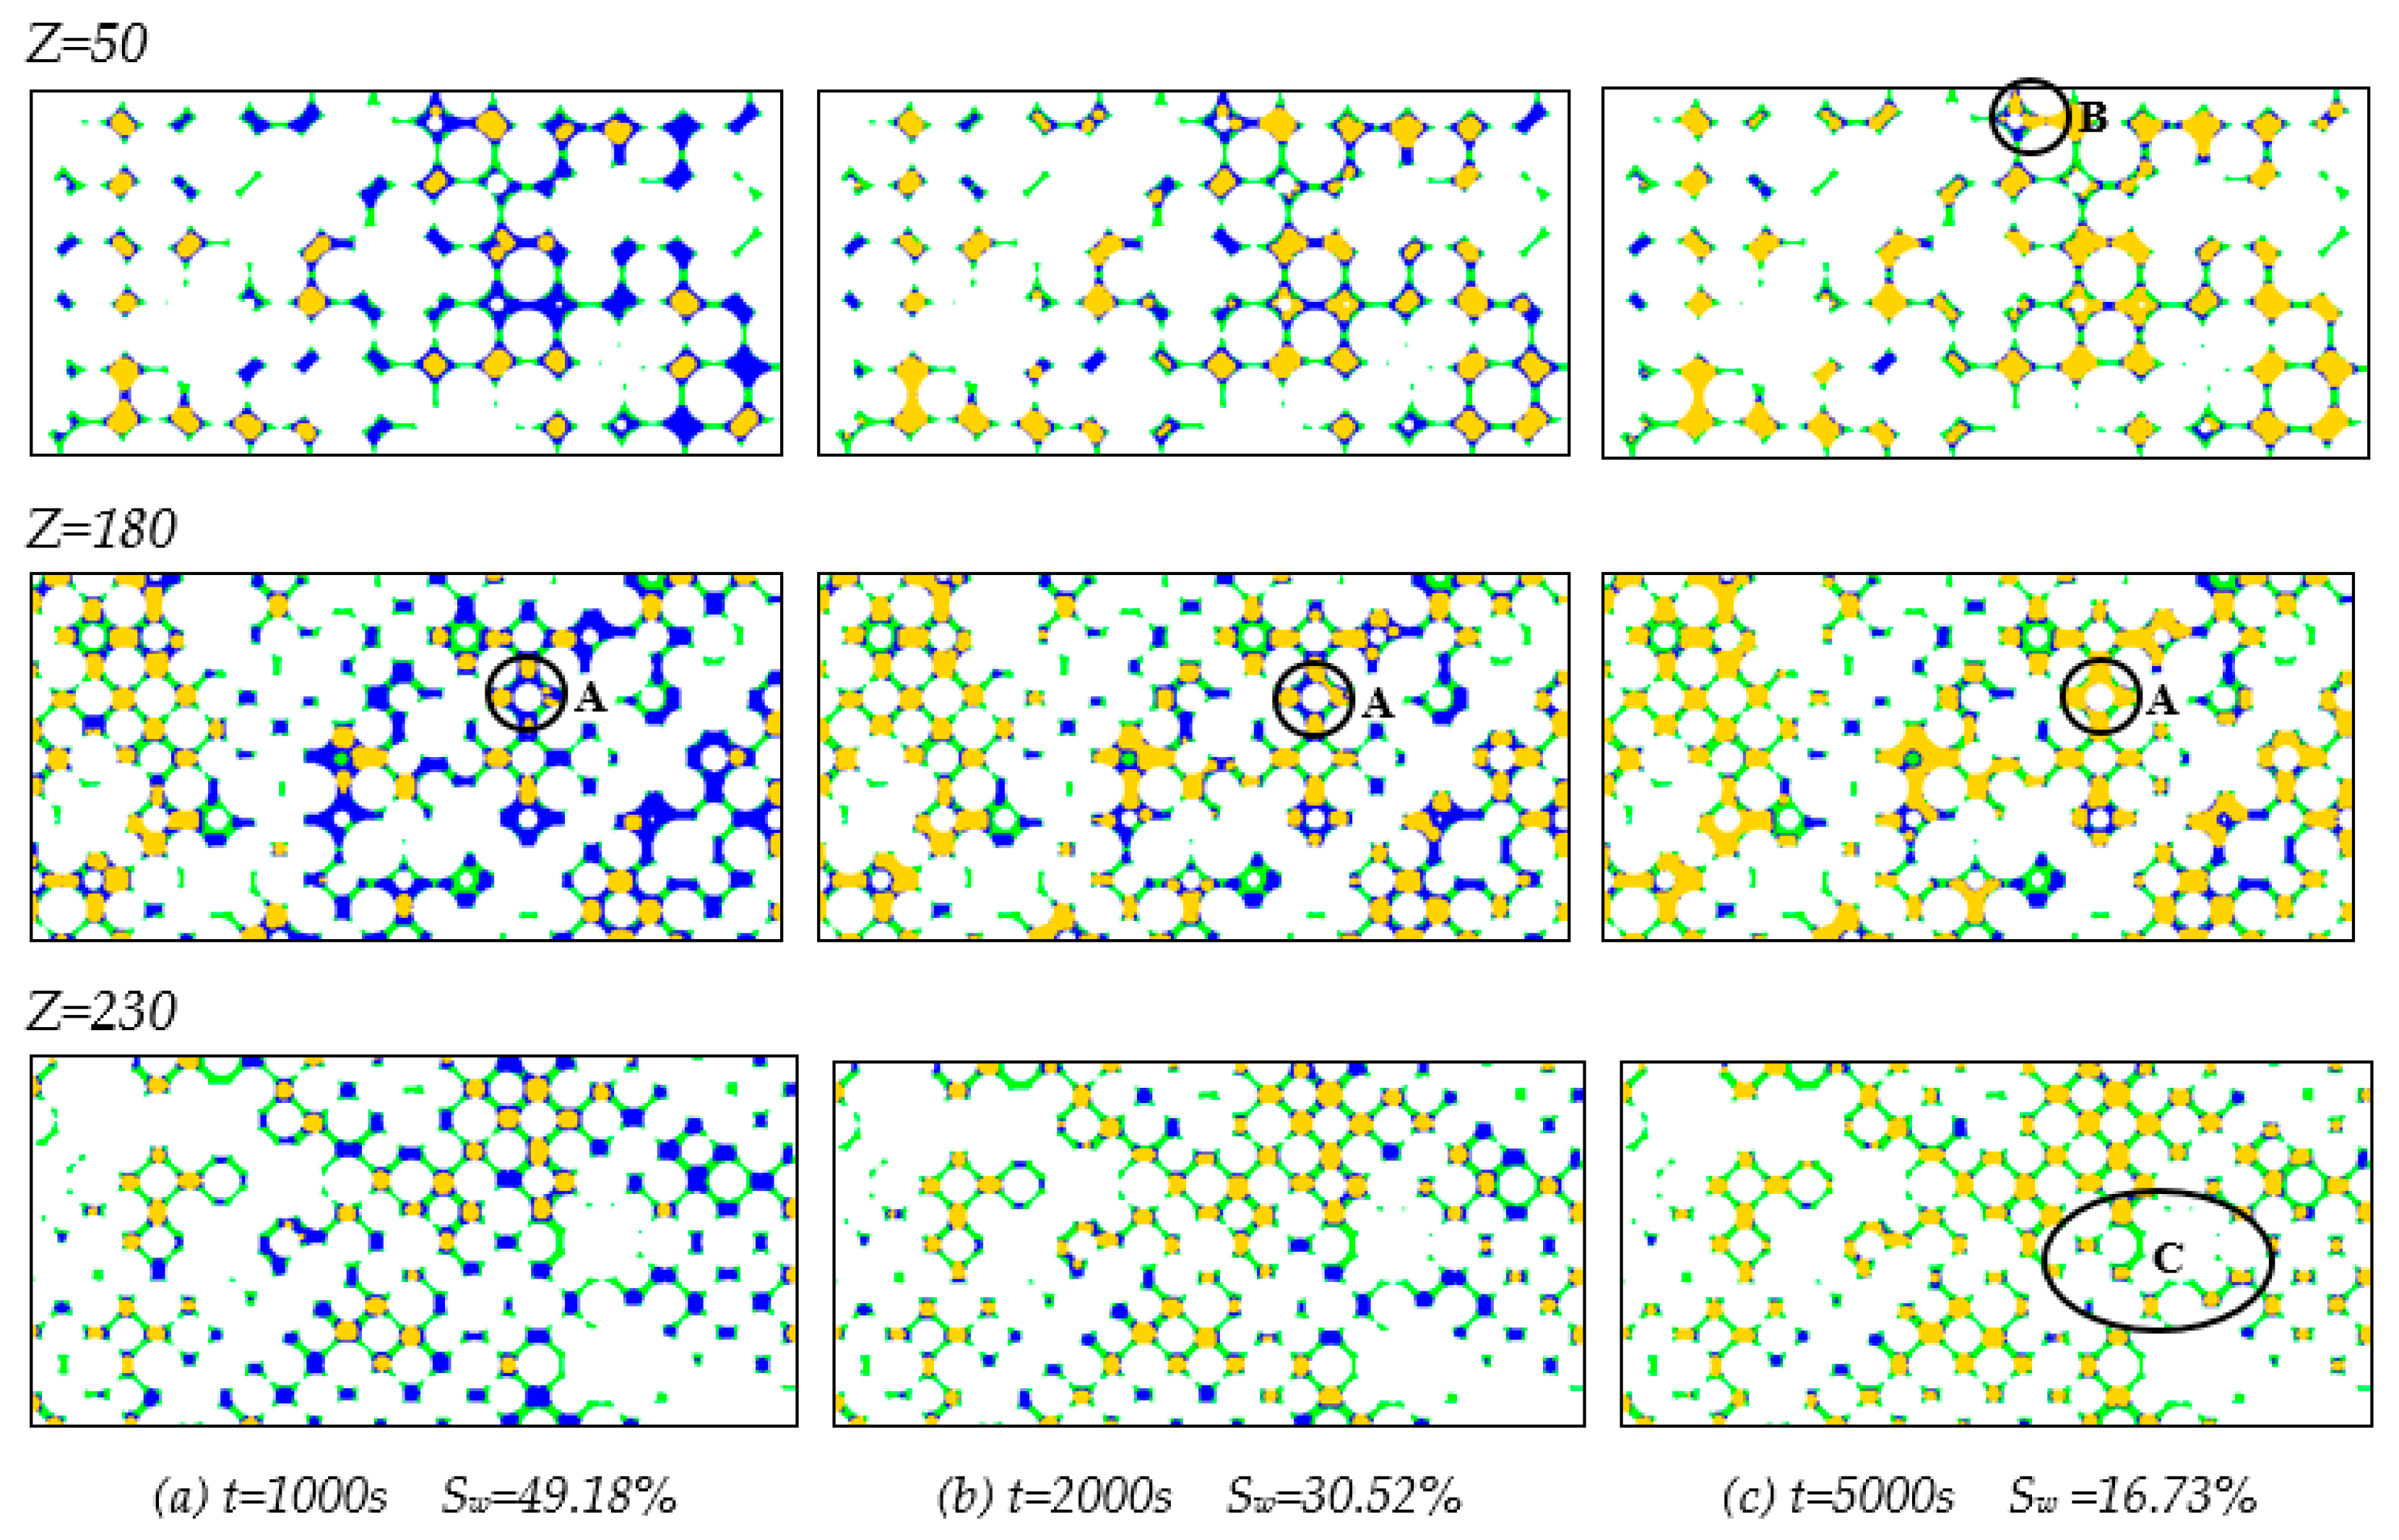
5.1. Seepage Mechanism in Micro Scale
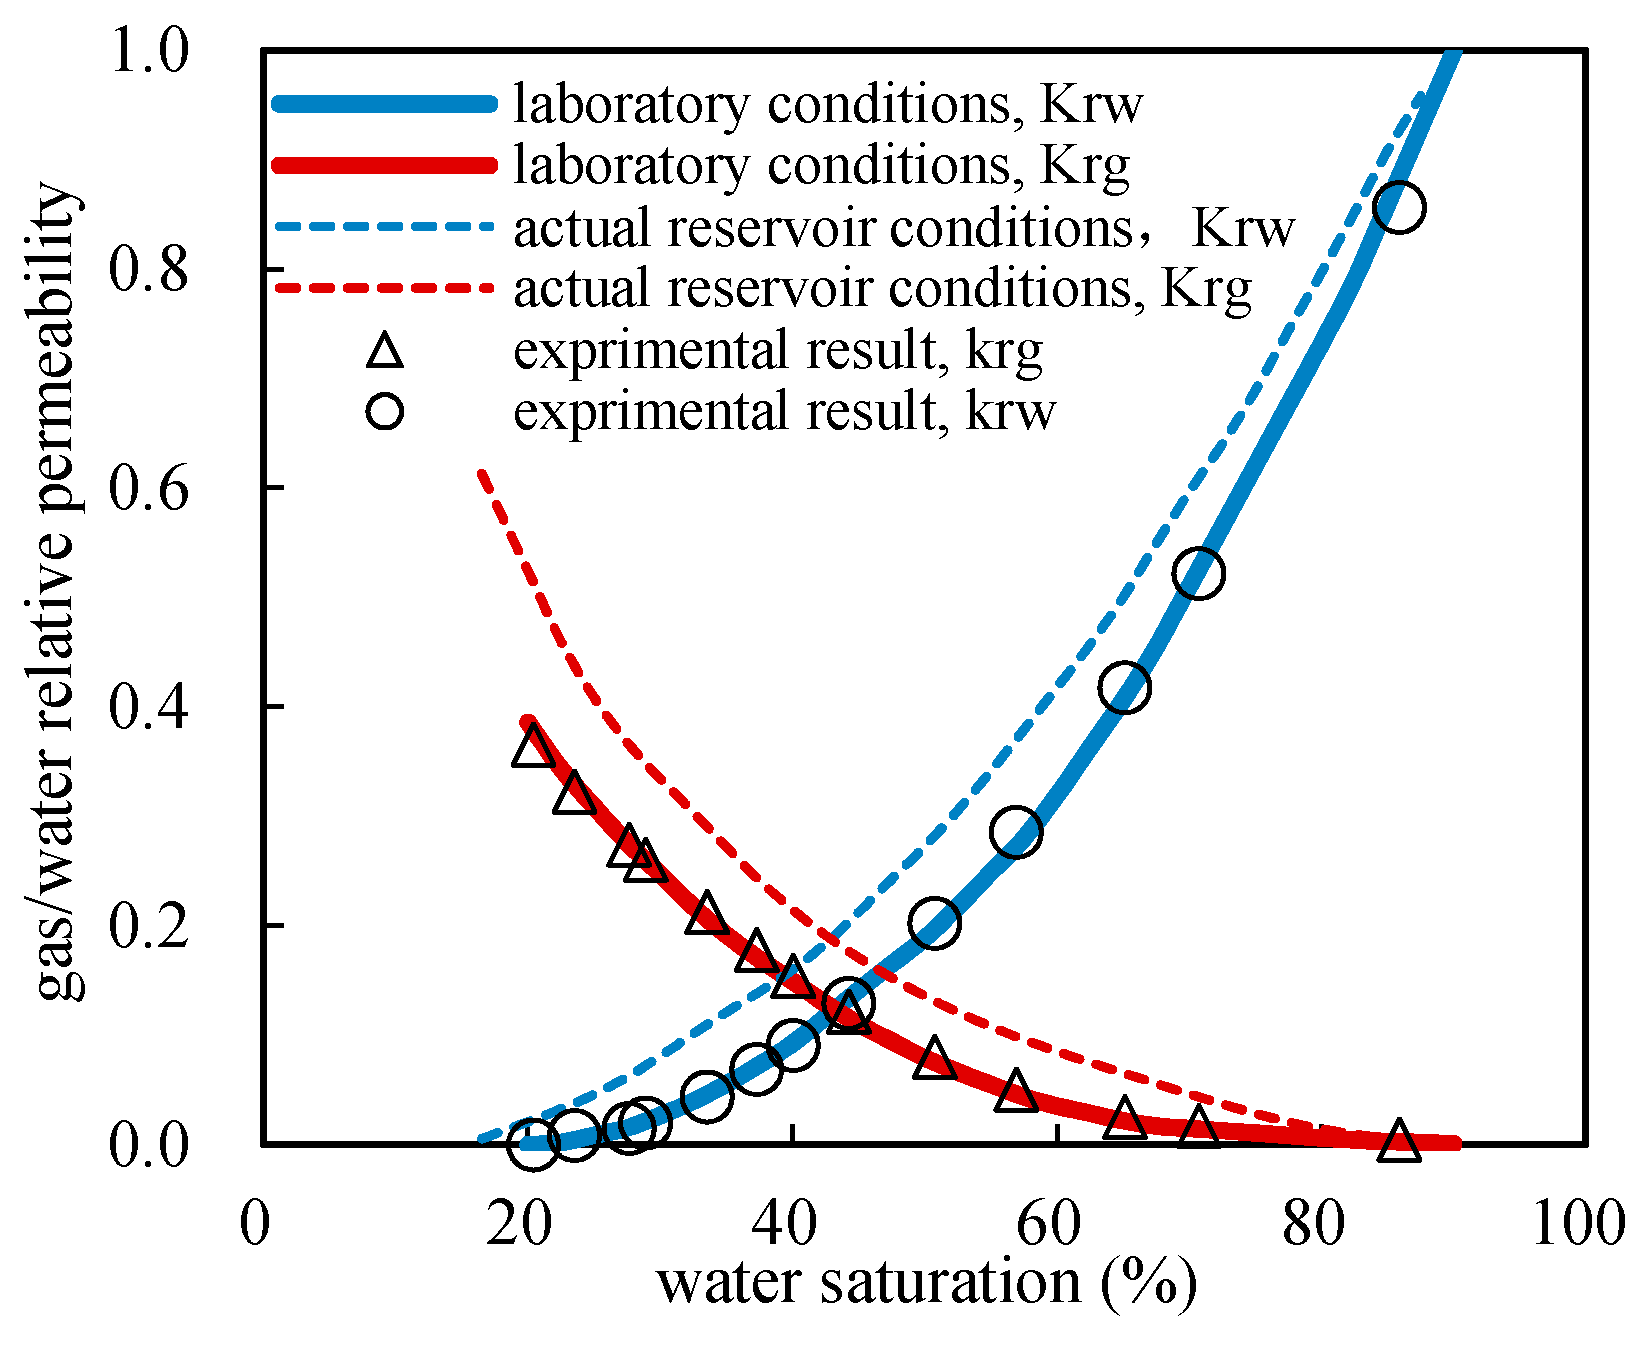
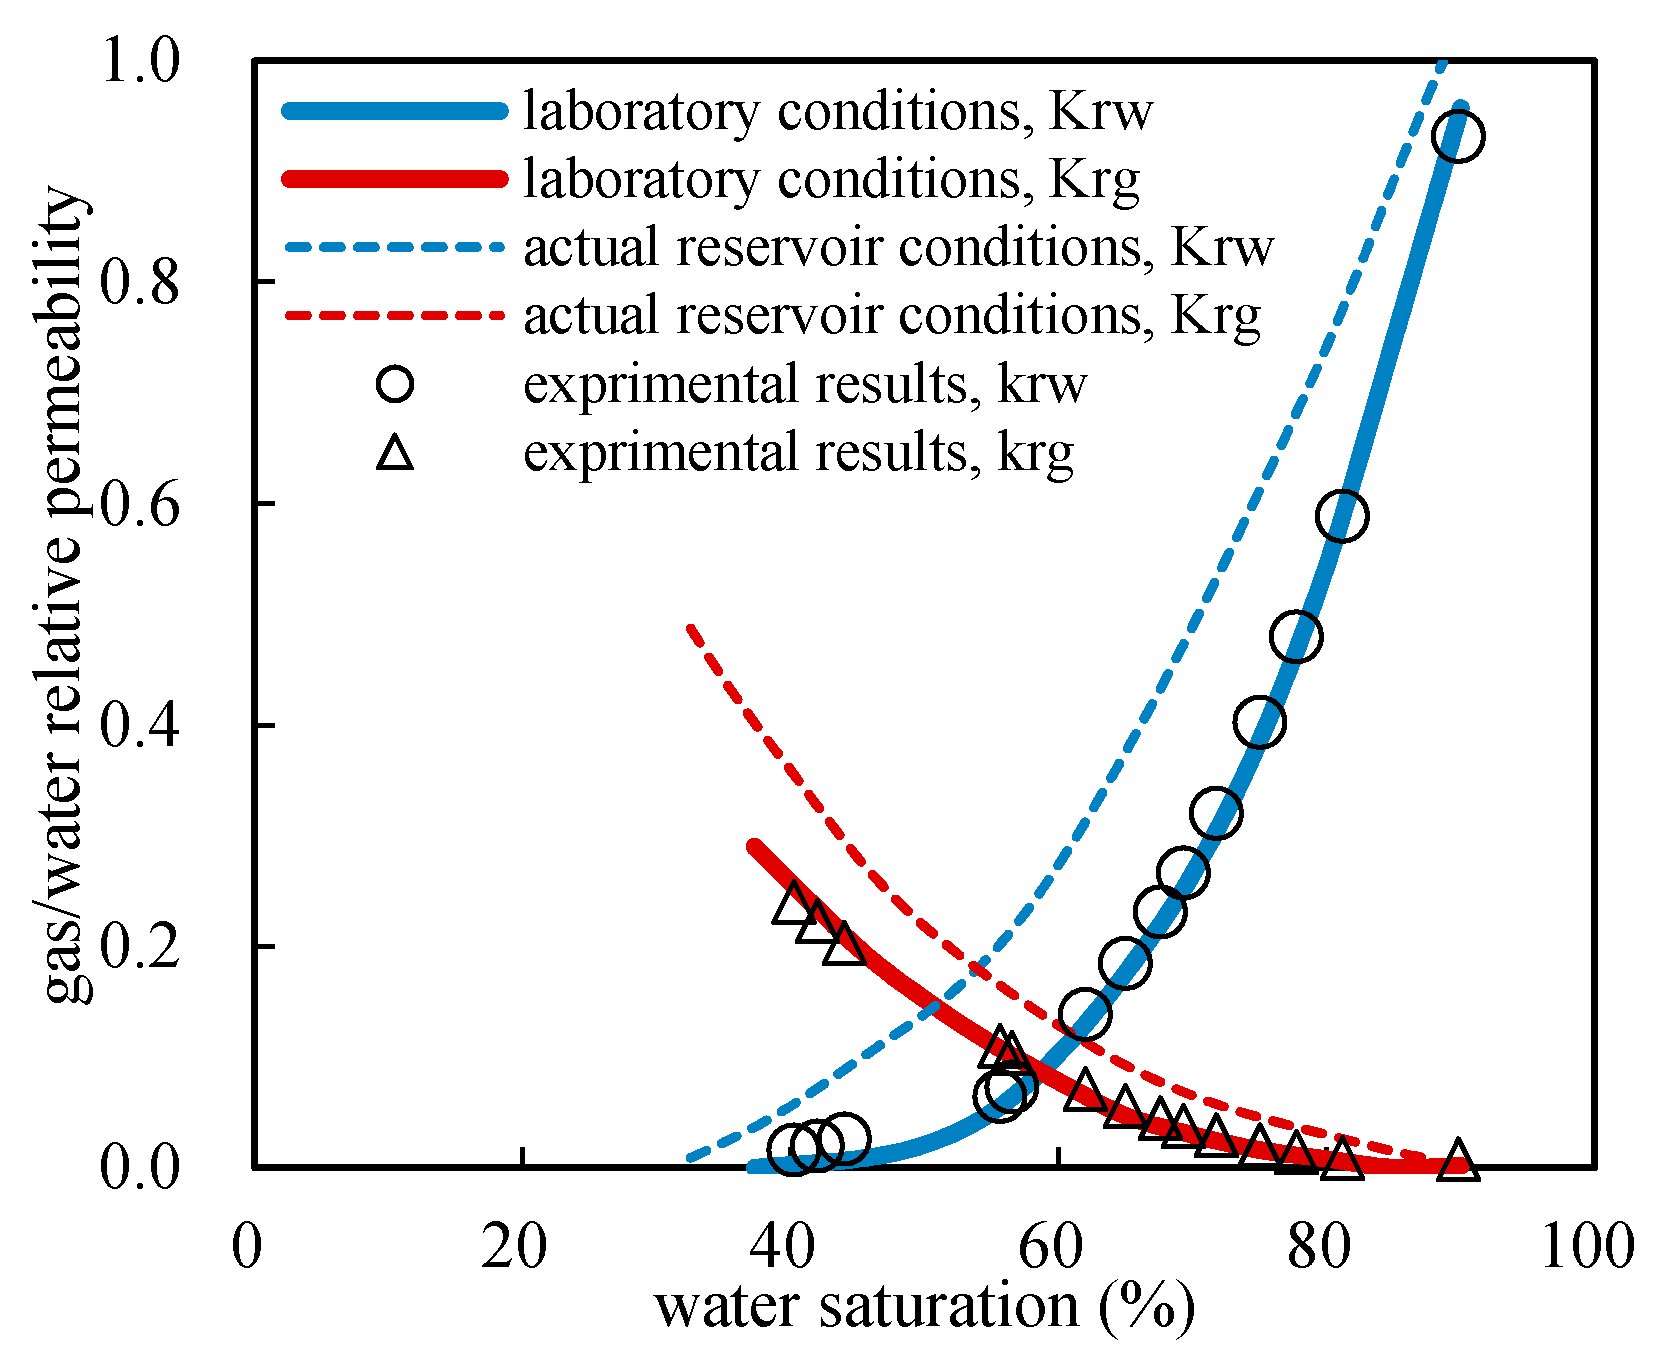
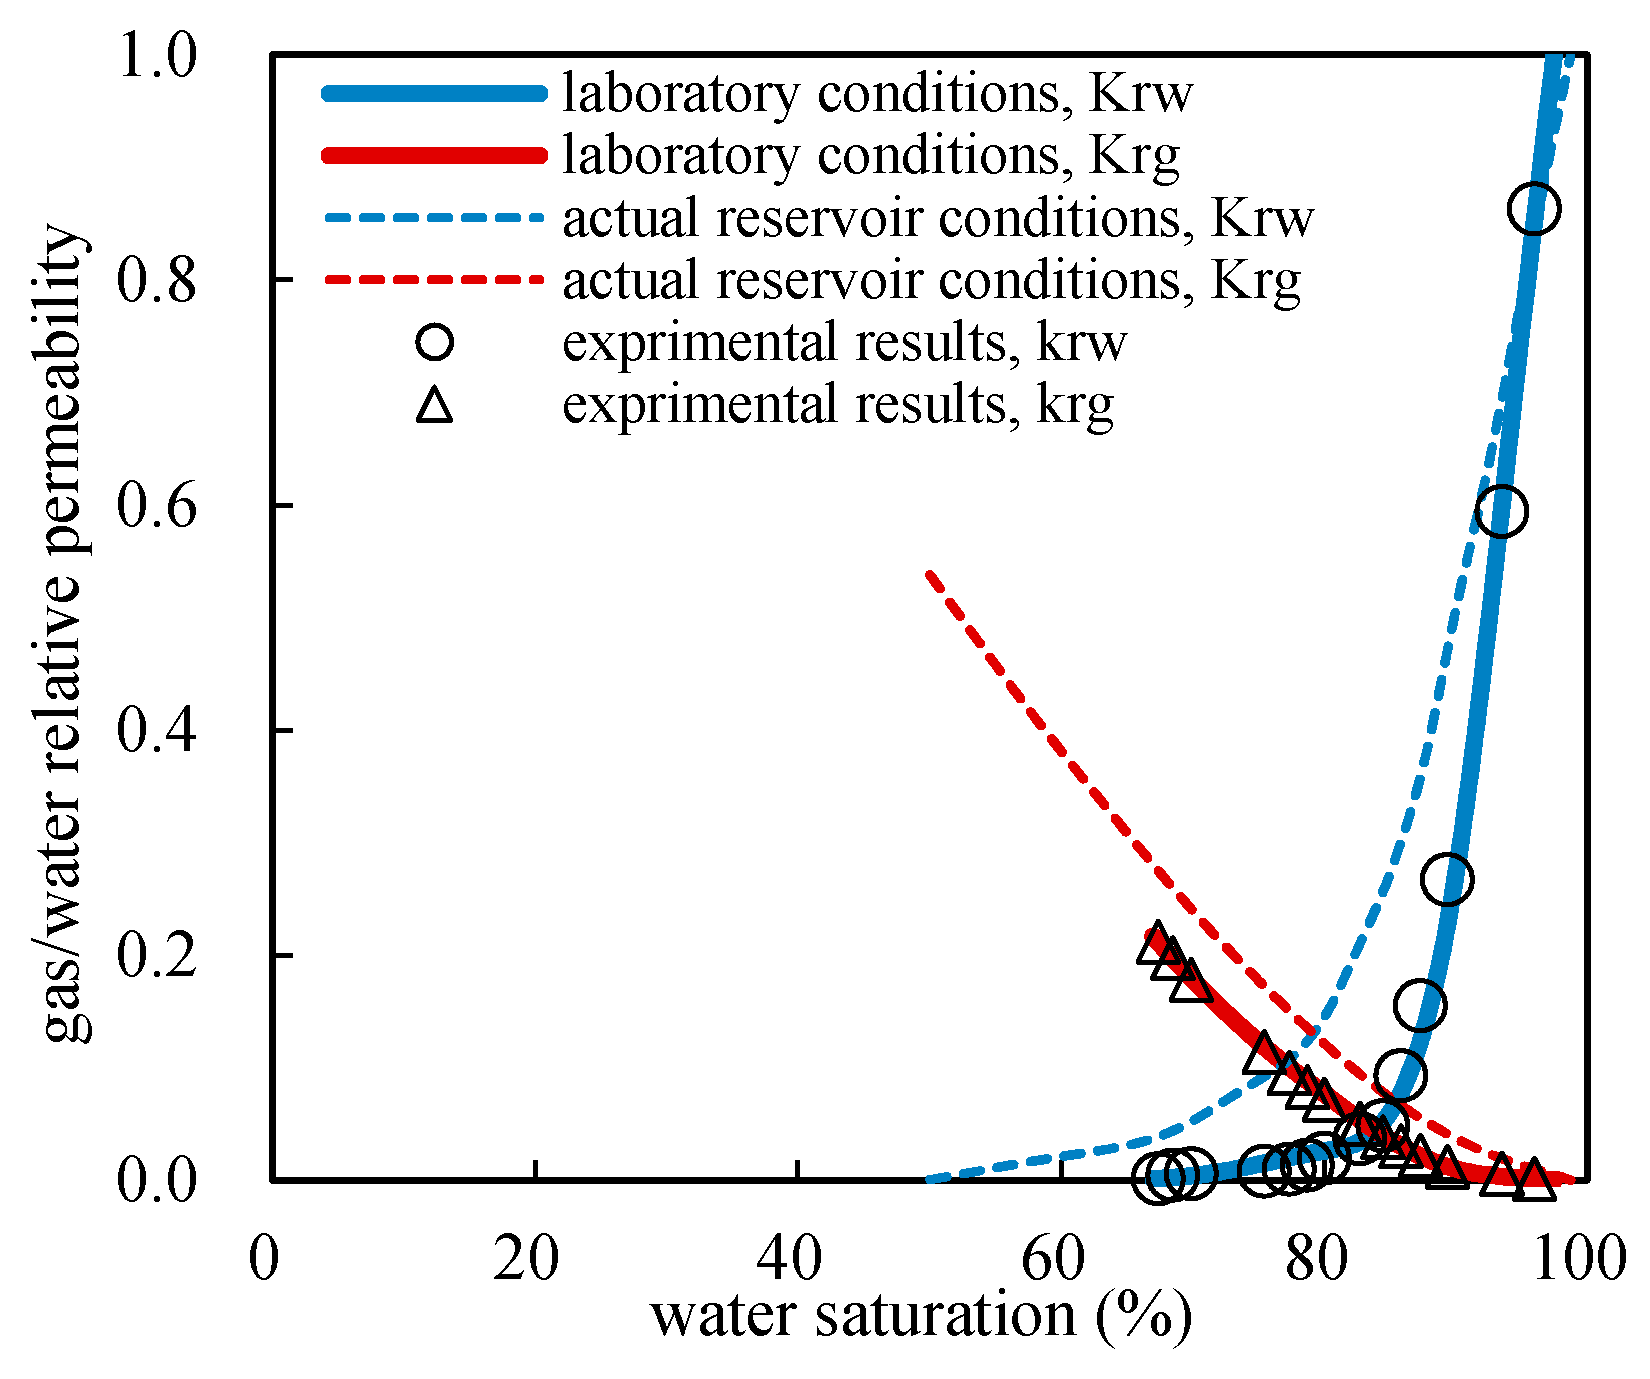
5.2. Gas and Water Relative Permeability Curves under Various Conditions
6. Conclusions
- (1)
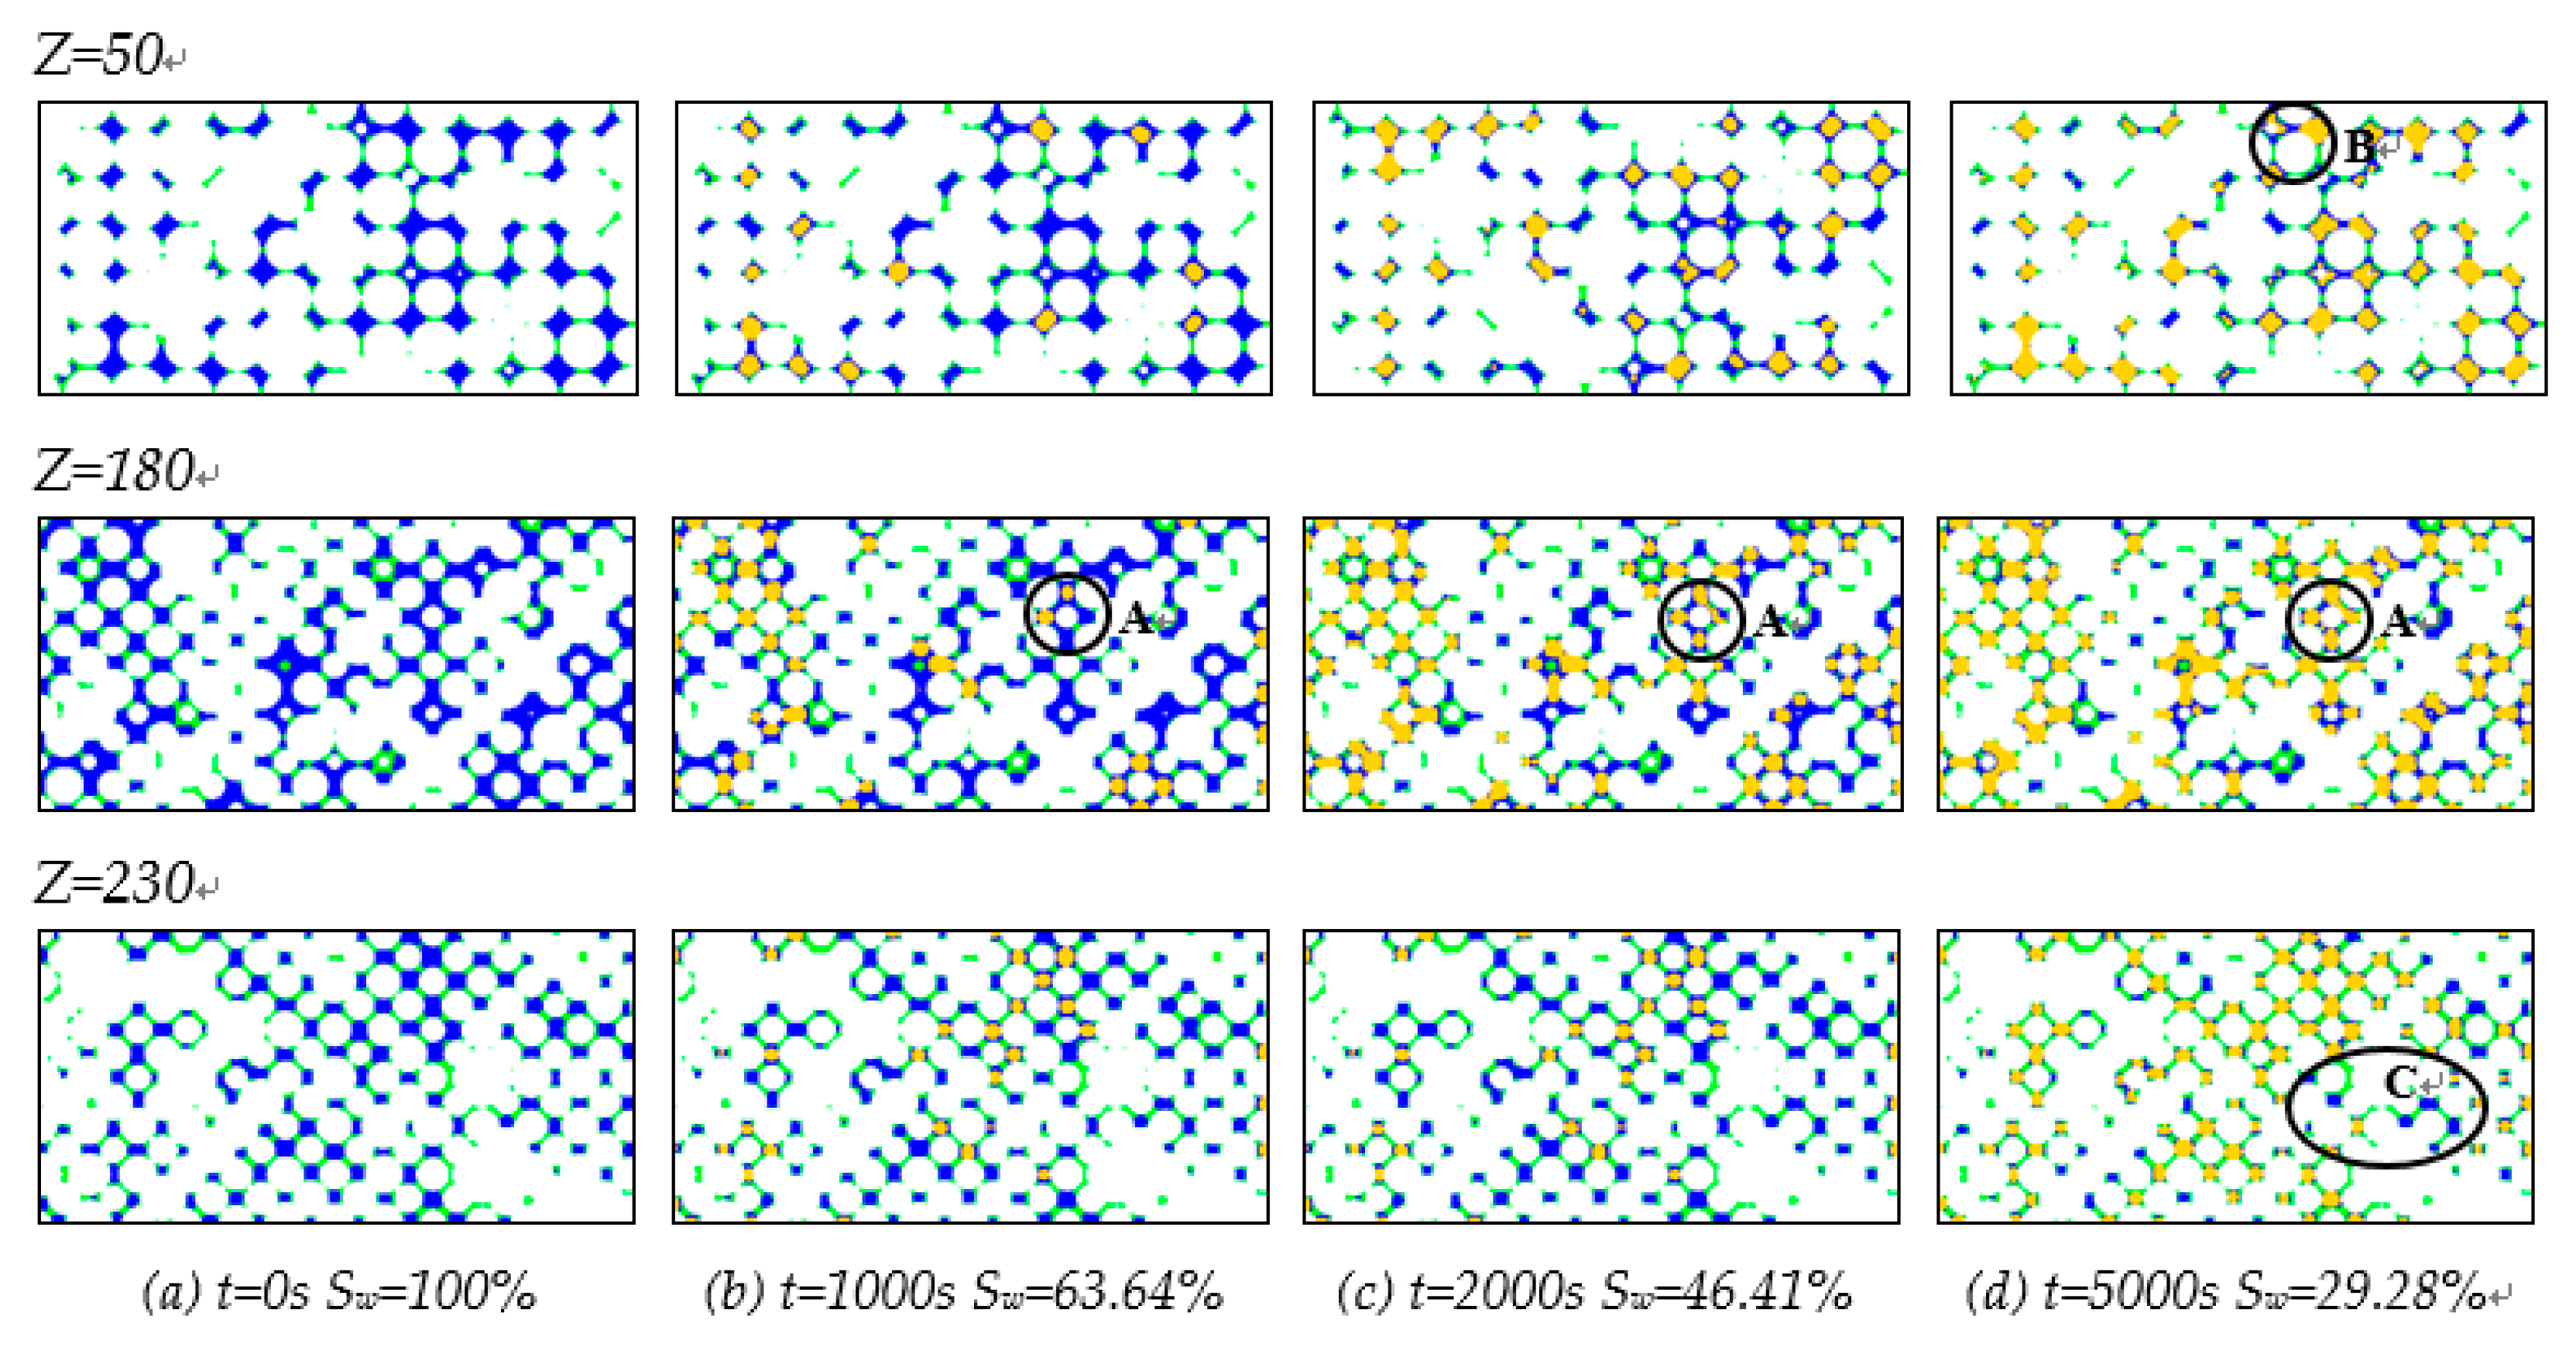
- During the displacement, as the interfacial tension between gas and water gets lower and the swept volume gets larger, both gas and water have stronger seepage ability under actual tight sandstone gas reservoir conditions.
- (2)
- Under high temperature and high pressure, the diffused double layer between the rock surface and the formation water would be stabilized in a new equilibrium state where the water film adhered to the rock surface was poorer in stability. Consequently, the bound water film gets thinner.
- (3)
- Compared with the simulation results under laboratory temperature and pressure conditions, some gas bubbles confined at the narrow originally were broken into smaller gas bubbles under actual reservoir temperature and pressure conditions which reduced their interfacial free energy, therefore, more gas continuous flow occurred.
- (4)
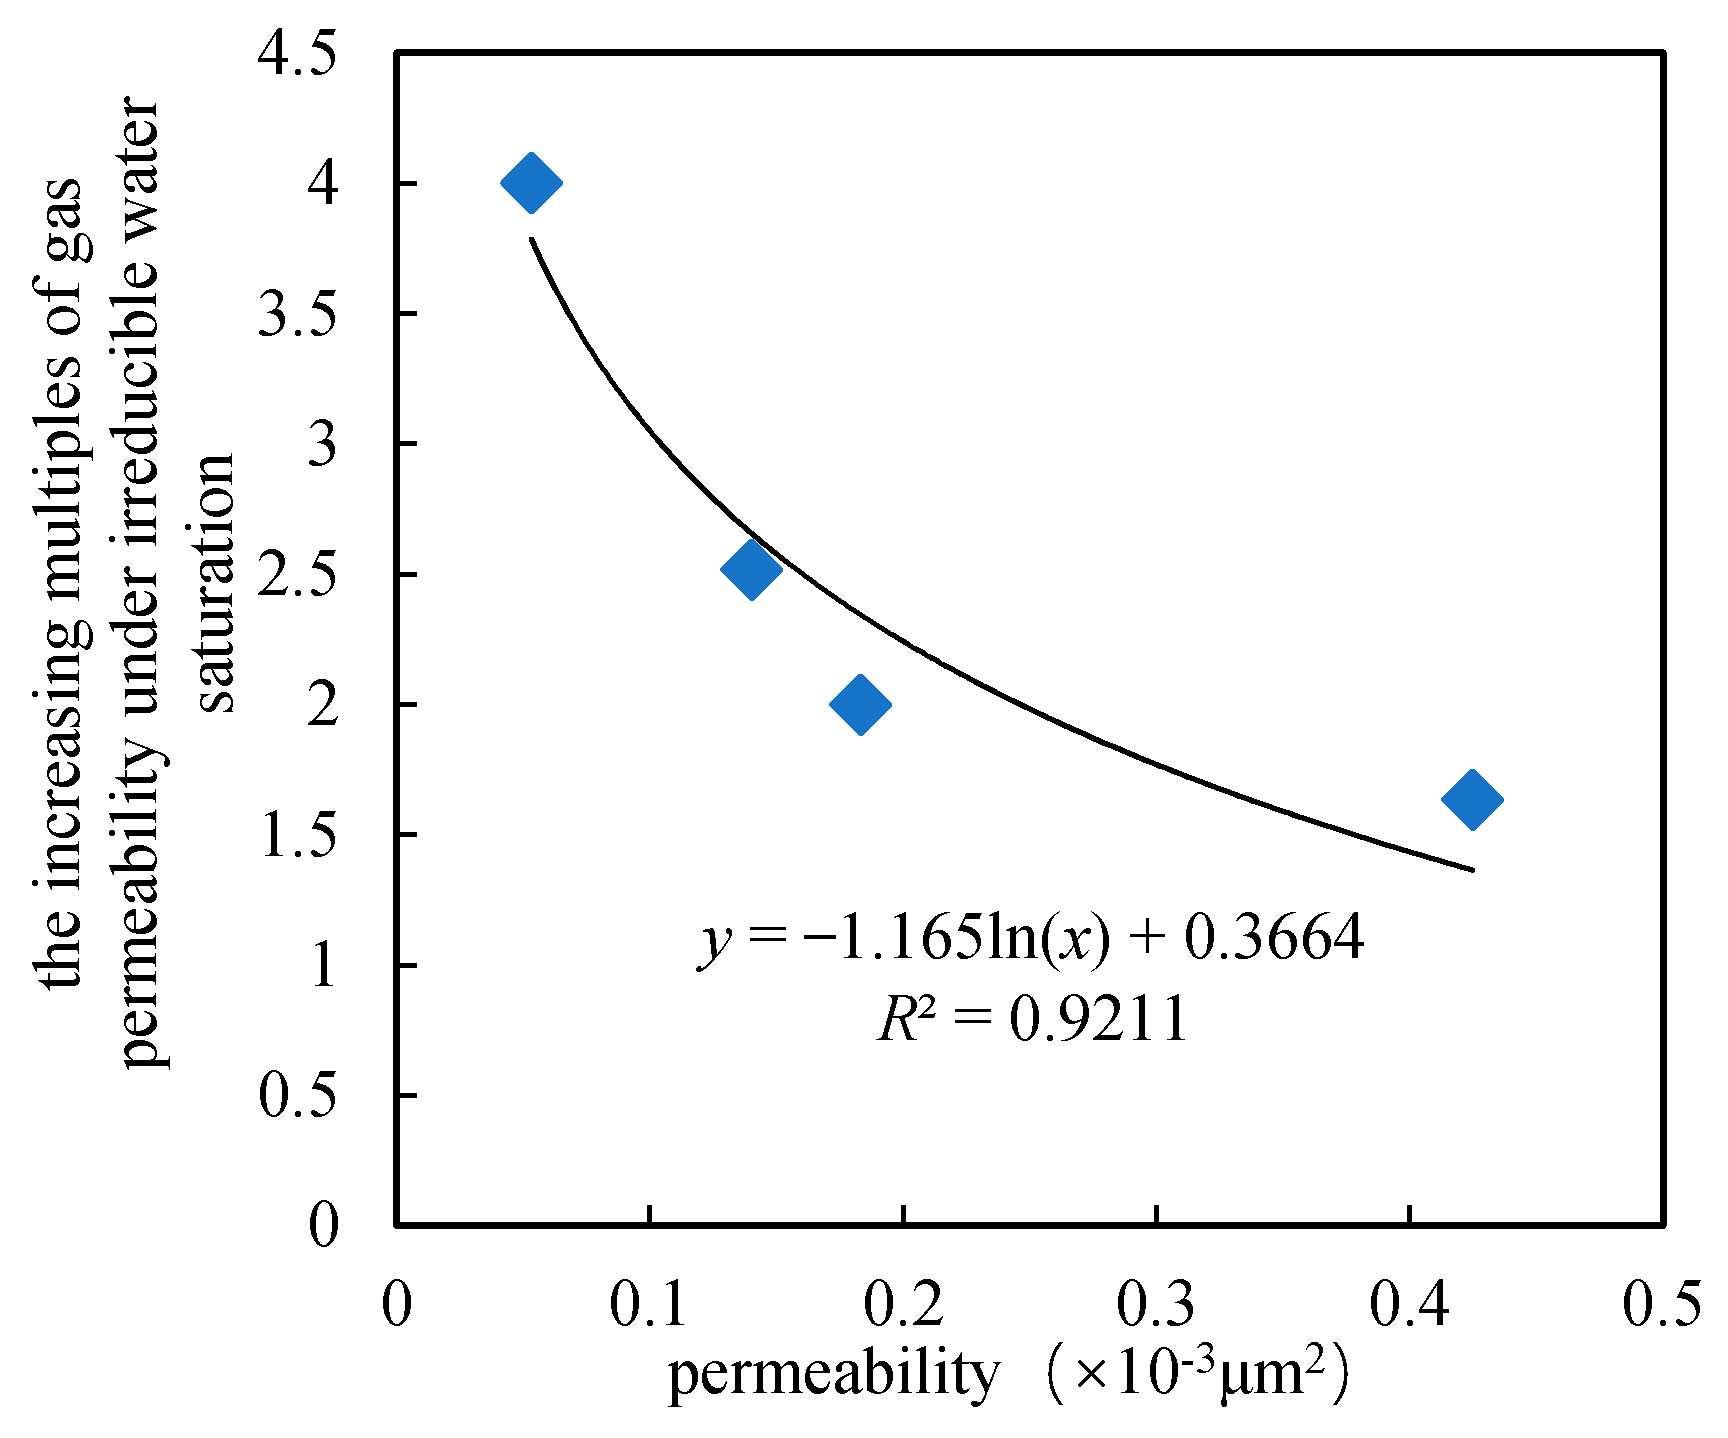
- The irreducible water saturation got decreased and the co-seepage region of gas and water got larger under actual tight sandstone gas reservoir conditions. Moreover, the lower the permeability of the tight core was, the greater the differences would be.
Author Contributions
Funding
Conflicts of Interest
Nomenclature
| r | the radius of rock particle, nm |
| rmin | the minimum radius of rock particles, nm |
| rmax | the maximum radius of rock particles, nm |
| f (r) | the particle sizes distribution function of any tight sandstone particles |
| σ | the peak value on the Rayleigh frequency distribution curve |
| rc | the sealing radius of the clay minerals, nm |
| r1,r2 | the minimum and the maximum radius of rock particles in any particle sizes range, nm |
| g(r1,r2) | the probability density of the Rayleigh distribution function of particle sizes in the range of r1 |
| R | the sphere radius of the ideal physical model, nm |
| the equivalent radius of the flow space in the ideal physical model, nm | |
| ϕs | the porosity reduction caused by compaction |
| ϕc | the porosity reduction caused by cementation |
| αs | the synergy coefficient |
| p | pressure, Pa |
| T | reservoir temperature, K |
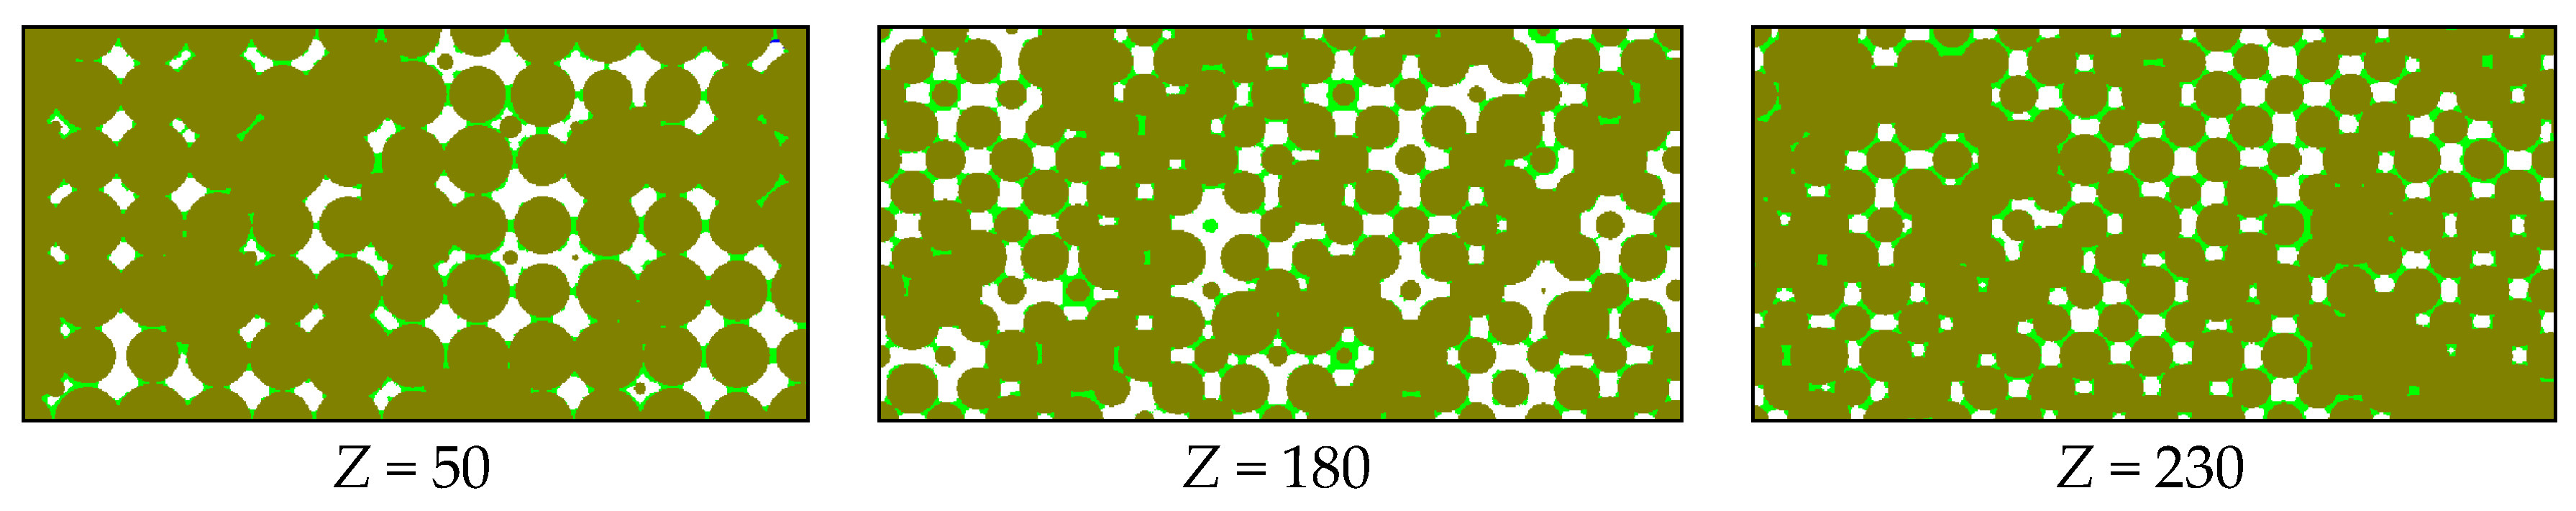
| Z | the cross-section position of the lattice model from the left side |
| Sw | water saturation, % |
References
- Muccino, J.C.; Gray, W.G.; Lin, A.F. Toward an improved understanding of multiphase flow in porous media. Rev. Geophys. 1998, 36, 401–422. [Google Scholar] [CrossRef] [Green Version]
- Porter, M.L.; Schaap, M.G.; Wildenschild, D. Lattice-Boltzmann simulations of the capillary pressure-saturation-interfacial area relationship for porous media. Adv. Water Resour. 2009, 32, 1632–1640. [Google Scholar] [CrossRef]
- Zuo, L.H.; Weijermars, R. Rules for Flight Paths and Time of Flight for Flows in Porous Media with Heterogeneous Permeability and Porosity. Geofluids 2018, 3, 1–18. [Google Scholar] [CrossRef]
- Li, Y.W.; Jia, D.; Liu, J.; Fu, C.K.; Ai, C. The calculation method based on the equivalent continuum for the fracture initiation pressure of fracturing of coalbed methane well. J. Petrol. Sci. Eng. 2016, 146, 909–920. [Google Scholar] [CrossRef]
- Liu, Y.K.; Wang, F.J.; Tang, H.M.; Liang, S. Well type and pattern optimization method based on fine numerical simulation in coal-bed methane reservoir. Environ. Earth Sci. 2015, 73, 5877–5890. [Google Scholar] [CrossRef]
- Kim, C.; Jang, H.; Lee, Y. Diffusion characteristics of nanoscale gas flow in shale matrix from Haenam basin, Korea. Environ. Earth Sci. 2016, 75, 1–8. [Google Scholar] [CrossRef]
- Brown, S.R. Fluid flow through rock joints: The effect of surface roughness. J. Geophys. Res. Solid Earth 1987, 92, 1337–1347. [Google Scholar] [CrossRef]
- Zhao, Z.; Li, B.; Jiang, Y. Effects of Fracture Surface Roughness on Macroscopic Fluid Flow and Solute Transport in Fracture Networks. Rock Mech. Rock Eng. 2014, 47, 2279–2286. [Google Scholar] [CrossRef]
- Yu, W.; Sepehrnoori, K.; Patzek, T.W. Evaluation of Gas Adsorption in Marcellus Shale. In Proceedings of the SPE Technical Conference and Exhibition, Amsterdam, The Netherlands, 27–29 October 2014. [Google Scholar]
- Li, Y.W.; Zuo, L.; Yu, W.; Chen, Y.G. A Fully Three Dimensional Semianalytical Model for Shale Gas Reservoirs with Hydraulic Fractures. Energies 2018, 11, 436. [Google Scholar] [CrossRef]
- Zhao, H.Q.; Macdonald, I.F.; Kwiecien, M.J. Multi-Orientation Scanning: A Necessity in the Identification of Pore Necks in Porous Media by 3-D Computer Reconstruction from Serial Section Data. J. Colloid Interface Sci. 1994, 162, 390–401. [Google Scholar] [CrossRef]
- Shin, H.; Lindquist, W.B.; Sahagian, D.L. Analysis of the vesicular structure of basalts. Comput. Geosci. 2005, 31, 473–487. [Google Scholar] [CrossRef]
- Al-Kharusi, A.S.; Blunt, M.J. Network extraction from sandstone and carbonate pore space images. J. Petrol. Sci. Eng. 2007, 56, 219–231. [Google Scholar] [CrossRef]
- Martys, N.S.; Chen, H. Simulation of multicomponent fluids in complex three-dimensional geometries by the lattice Boltzmann method. Phys. Rev. E 1996, 53, 743. [Google Scholar] [CrossRef]
- Ahrenholz, B.; Tölke, J.; Lehmann, P. Prediction of capillary hysteresis in a porous material using lattice-Boltzmann methods and comparison to experimental data and a morphological pore network model. Adv. Water Resour. 2008, 31, 1151–1173. [Google Scholar] [CrossRef]
- Joekar-Niasar, V.; Prodanović, M.; Wildenschild, D. Network model investigation of interfacial area, capillary pressure and saturation relationships in granular porous media. Water Resour. Res. 2010, 17, 370–374. [Google Scholar] [CrossRef]
- Kim, K.N.; Kang, J.H.; Sang, G.L. Lattice Boltzmann simulation of liquid water transport in microporous and gas diffusion layers of polymer electrolyte membrane fuel cells. J. Power Sources 2015, 278, 703–717. [Google Scholar] [CrossRef]
- Lei, Z.; Yao, J.; Hai, S. Lattice Boltzmann simulation of gas desorption and diffusion based on digital core technology. Acta Petrol. Sin. 2015, 36, 361–365. [Google Scholar]
- Ji, L.; Lin, M.; Jiang, W. An Improved Method for Reconstructing the Digital Core Model of Heterogeneous Porous Media. Transp. Porous Media 2018, 121, 389–406. [Google Scholar] [CrossRef]
- Spencer, A.J. A theory kinematics or ideal soils under plane strain conditions. J. Mech. Phys. Solids. 1976, 43, 49–53. [Google Scholar] [CrossRef]
- Morrison, H.L.; Richmond, O. Application of Spencer’s Ideal Soil Model to Granular Materials Flow. J. Appl. Mech. 1976, 43, 49–53. [Google Scholar] [CrossRef]
- Zou, C.N.; Yang, Z.; Tao, S.Z.; Li, W.; Wu, S.T.; Hou, L.H.; Zhu, R.K.; Yuan, X.J.; Wang, L.; Gao, X.H.; et al. Nano-hydrocarbon and the accumulation in coexisting source and reservoir. Petrol. Explor. Dev. 2012, 39, 13–26. [Google Scholar] [CrossRef]
- Wang, Z.; Guo, Y.; Wang, M. Permeability of high-Kn real gas flow in shale and production prediction by pore-scale modeling. J. Nat. Gas Sci. Eng. 2016, 28, 328–337. [Google Scholar] [CrossRef] [Green Version]
- Pan, J.G.; Wang, H.B.; Li, C.; Zhao, J.G. Effect of pore structure on seismic rock-physics characteristics of dense carbonates. Appl. Geophys. 2015, 12, 1–10. [Google Scholar] [CrossRef]
- Zhu, H.H.; Zhong, D.K.; Zhang, Y.X.; Sun, H.T.; Du, B.Q.; Meng, H.; Zhang, C.W.; Yang, Z. Pore types and controlling factors on porosity and permeability of Upper Triassic Xujiahe tight sandstone reservoir in Southern Sichuan Basin. Oil Gas Geol. 2014, 35, 65–76. [Google Scholar]
- Mcbride, E.F. Quartz cement in sandstones: A review. Earth-Sci. Rev. 1989, 26, 69–112. [Google Scholar] [CrossRef]
- De, V.J.; Poesen, J.; Bazzoffi, P.; Rompaey, A.V.; Verstraeten, G. Predicting catchment sediment yield in Mediterranean environments: The importance of sediment sources and connectivity in Italian drainage basins. Earth Surf. Process. Landf. 2010, 31, 1017–1034. [Google Scholar]
- Li, Y.; Jia, A.; He, D. Control factors on the formation of effective reservoirs in tight sands: Examples from Guang’an and Sulige gasfields. Acta Petrol. Sin. 2013, 34, 71–82. [Google Scholar]
- Jing, Z.; Shuangwen, L.I.; Wang, S.; Ji, H.S.; Rao, M. Deep diagenetic evolution and formation mechanisms of secondary porosity in Qinan ramp, Qikou sag. J. China Univ. Min. Technol. 2014, 43, 1070–1077. [Google Scholar]
- Ren, J.J.; Guo, P.; Guo, Z.L.; Wang, Z. A Lattice Boltzmann Model for Simulating Gas Flow in Kerogen Pores. Transp. Porous Media 2015, 106, 285–301. [Google Scholar] [CrossRef]
- Zhang, X.L.; Xiao, L.Z.; Guo, L.; Xie, Q.M. Investigation of shale gas microflow with the Lattice Boltzmann method. Petrol. Sci. 2015, 12, 96–103. [Google Scholar] [CrossRef] [Green Version]
- Krastev, V.; Falcucci, G. Simulating Engineering Flows through Complex Porous Media via the Lattice Boltzmann Method. Energies 2018, 11, 715. [Google Scholar] [CrossRef]
- Daniel, L.B.; Luo, K.H. Improved forcing scheme in pseudopotential lattice Boltzmann methods for multiphase flow at arbitrarily high density ratios. Phys. Rev. E 2015, 91, 1–12. [Google Scholar]
- Hu, A.J.; Li, L.; Chen, S.; Liao, Q.; Zeng, J. On equations of state in pseudo-potential multiphase lattice Boltzmann model with large density ratio. Int. J. Heat Mass Transf. 2013, 67, 159–163. [Google Scholar] [CrossRef]


| Number | Depth (m) | Porosity (%) | Permeability (×10−3 μm2) | The Median Value of the Pore Throat Radius (nm) | Smaller Sandstone Particles σ (nm) | The Fitting Value of Rayleigh Distribution σ |
|---|---|---|---|---|---|---|
| 24 | 3137.23 | 12.15 | 0.4247 | 197.2 | 340.23 | 1.080 |
| 35 | 2955.31 | 7.88 | 0.1832 | 116.1 | 200.31 | 0.268 |
| 43 | 3014.08 | 6.72 | 0.1401 | 54.8 | 94.55 | 0.232 |
| 69 | 2960.59 | 4.16 | 0.0531 | 24.2 | 41.75 | 0.227 |
© 2018 by the authors. Licensee MDPI, Basel, Switzerland. This article is an open access article distributed under the terms and conditions of the Creative Commons Attribution (CC BY) license (http://creativecommons.org/licenses/by/4.0/).
Share and Cite
Wang, F.; Liu, Y.; Hu, C.; Shen, A.; Liang, S.; Cai, B. A Simplified Physical Model Construction Method and Gas-Water Micro Scale Flow Simulation in Tight Sandstone Gas Reservoirs. Energies 2018, 11, 1559. https://doi.org/10.3390/en11061559
Wang F, Liu Y, Hu C, Shen A, Liang S, Cai B. A Simplified Physical Model Construction Method and Gas-Water Micro Scale Flow Simulation in Tight Sandstone Gas Reservoirs. Energies. 2018; 11(6):1559. https://doi.org/10.3390/en11061559
Chicago/Turabian StyleWang, Fengjiao, Yikun Liu, Chaoyang Hu, Anqi Shen, Shuang Liang, and Bo Cai. 2018. "A Simplified Physical Model Construction Method and Gas-Water Micro Scale Flow Simulation in Tight Sandstone Gas Reservoirs" Energies 11, no. 6: 1559. https://doi.org/10.3390/en11061559