The Impact of Financial Development on Energy Consumption: Evidence from an Oil-Rich Economy


1
Department of Economics and Management, Khazar University, 41 Mehseti Str., Baku AZ1096, Azerbaijan
2
Department of Economics and Management, Azerbaijan State University of Economics (UNEC), Istiqlaliyyat Str. 6, Baku AZ1141, Azerbaijan
3
King Abdullah Petroleum Studies and Research Center, P.O. Box 88550, Riyadh 11672, Saudi Arabia
4
Department of Statistics and Econometrics, Azerbaijan State University of Economics, Istiqlaliyyat Str., 6, Baku AZ1001, Azerbaijan
5
Institute for Scientific Research on Economic Reforms, 88a, Hasan Bey Zardabi Avenue, Baku AZ1011, Azerbaijan
6
School of Business, Azerbaijan State University of Economics (UNEC), Istiqlaliyyat Str. 6, Baku AZ1141, Azerbaijan
*
Author to whom correspondence should be addressed.
Energies 2018, 11(6), 1536; https://doi.org/10.3390/en11061536
Submission received: 5 May 2018
/
Revised: 9 June 2018
/
Accepted: 11 June 2018
/
Published: 13 June 2018
Abstract
:This paper examines the relationship between energy consumption, financial development, and economic growth in an oil-rich economy—Azerbaijan—employing cointegration techniques to the data ranging from 1992 to 2015. The results confirm the existence of a long-run relationship among the variables. Also, we find that there is a positive and statistically significant impact of financial development and economic growth on energy consumption in the long-run. The positive and statistically significant coefficient of financial development and decreasing volatility in the proxy for financial development over time can be considered as improvements in the financial system. Estimation results show that a 1% increase in financial development, proxied by the private credit indicator, and economic development increases energy consumption by 0.19% and 0.12%, respectively. The positive and significant impact of financial development on energy consumption on the backdrop of relatively cheaper energy prices due to rich oil and gas resources, should be considered by policymakers in their energy use, financial development, and economic growth related decisions.
1. Introduction
The relationship between energy consumption and economic growth has been the subject of theoretical and empirical research in the last decades. Energy is an important source for the economic growth and development of an economy. In its turn, escalating economic growth requires more energy as a driving force of the production of goods and services. Due to the diverse characteristics of economies, the direction of this relationship is not always clear. Recently, this topic has fueled much interest in case studies of oil-rich economies. Being both energy consumers and exporters, these economies face not only supply but also demand challenges on the way to sustainable economic growth with their vulnerability to commodity price volatility. However, there is a lack of research conducted for resource-rich post-Soviet countries.
Hence, as a first step in this direction, we start by scrutinizing the demands of the production sector for energy input as a driving force of productivity and sustainable economic growth. Starting in 2015, the negative oil price shock (and declining oil revenue) caused a recession in oil-rich post-Soviet countries. Negative growth rates of GDP in Russia (from 0.70% in 2014 to −2.80% in 2015 and −0.20% in 2016) and Azerbaijan (from 2% in 2014 to 1.10% in 2015 and −3.10% in 2016), and declining rates in Kazakhstan (from 4.20% in 2014 to 1.20% in 2015 and 1.10% in 2016) and Turkmenistan (from 10.30% in 2014 to 6.50% in 2015 and 6.20% in 2016) were observed [1]. It was a vivid manifestation that these countries have less diversified economies, and factors of production (including energy input) have seemingly not played a vital role in non-oil sectors either because of inadequate and inefficient utilization or less demand for them in these sectors due to Dutch disease forces (The loss of competitiveness of the manufacturing sector or deindustrialization occurring when a natural resource-based boom raises the value of national currency).
Stemming from this, we deem it is necessary to have a glance at its theoretical framework and define the main macroeconomic determinants of energy consumption, which are believed to have a facilitating role in promoting economic growth in an oil rich economy.
In the theoretical literature, growth models augmented with natural resources use non-renewable energy input in a Cobb–Douglas production function, which is assumed to exhibit constant returns to scale in energy input taken together with capital and labor. As the economy uses the amount of energy in production, the resource stock is depleted over time. Therefore, under the presence of natural resources, the production is expected to exhibit diminishing returns to capital and labor and result in the reduction of the long-run rate of economic growth. Meanwhile, “as population growth puts pressure on the finite resources, the effect of exogenous technological progress loses its value, as some of the technological change must go simply to overcome diminishing returns” [2]. In the absence of endogenous technological progress, resource depletion will surely result in welfare loss because “a narrowing of the resource base or a rise in resource costs will have a drastic effect on the level and growth of final output if nonrenewable resources play a very large role in production, if renewable resources and labor cannot easily be substituted for them, and if the course of resource- saving technological progress is slow” [3]. Thus, the situation is worsened by over-specialization (over-dependent on one particular commodity) followed by macroeconomic and financial instability caused by negative externalities associated with fluctuations in commodity prices.
In order to prevent growth drag and welfare loss from happening, one of the main goals of resource-rich economies is to use energy inputs efficiently, invest revenues from energy export for the purpose of accumulating physical capital—human capital—and to achieve economic diversification (including the diversification of energy mix in the country). “The process of economic development is in effect the process of utilizing more energy to increase the productivity and efficiency of human labor” [4]. Efficient use of energy input and an increasing share of renewable energy in the energy mix of a country can help meet the growing demand for energy and influence economic growth and sustainable development.
Energy consumption, being one of the widely investigated hot topics due to its importance, needs to be analyzed from different perspectives, such as other unconventional potential drivers of energy use, in parallel to the changing economic structure, world/countries energy potentials, economic and political interests of the countries, etc. As suggested by Karanfil [5] there might be other potential drivers of energy consumption, such as the level of financial development of a country.
Economic growth as a key determinant of energy demand is promoted by financial development. However, the impact of financial development on the demand for energy has received very little attention in the literature. Financial development improves the financial efficiency of a country, allows foreign direct investment, reduces financial risk and borrowing constraints, increases transparency between lenders and borrowers, thereby affecting demand for energy by increasing consumption and fixed investment [6].
It is of great importance to examine the validity of these assumptions by long-term consequences in a resource-rich country. Since, in the case of resource-rich developing country there is still a long way to go (to some extent depending of the countries development stage), financial development might have a crucial role in the shaping of the energy demand. If the financial environment, in terms of funding potential, is eligible to find “easy” money then companies and individuals, being entities prone to spend, will take advantage of it, borrowing money and spending it for their eventually increasing needs, such as buying new cars, houses, services etc. Since, cars use energy products, houses need to be heated and cooled by energy products, these factors in their turn will increase the demand for energy. In this regard, the investigation of the energy demand and financial development phenomenon in the case of a resource-rich developing economy using country-specific data gains special importance to clarify this relationship in that specific country case in order to shed light on the relevant impacts and make proper policy decisions. In the current study, we identify and estimate the main macroeconomic factors that determine the demand for energy consumption in Azerbaijan, which is one of the most-oil dependent countries yet blessed with abundant renewable energy resources, making it a particularly interesting case for this research. Using the Johansen cointegration technique [7,8] and the Vector Error Correction Model (VECM), Gregory–Hansen (GH) cointegration method for models with regime shifts [9] and Pesaran’s Bounds Testing approach to Autoregressive Distributed Lagged model (ARDL) [10,11], a long-run relationship between energy consumption and economic growth (with particular emphasis on financial development) is explored using annual time series data covering the period ranging from 1992 to 2015. The results of the study are crucial for economic policymakers to formulate policies in favor of sustainable economic growth. The paper contributes to the current literature in different ways. First, it investigates one of the hot topics, the long-run impacts of financial development and economic growth on energy demand. Second, the study investigates the issue in the case of a resource-rich economy, which is of special importance from the similar economies perspective, considering the trinity of energy use-economic development-financial development. Since the result of a well-organized financial infrastructure and cheaper energy prices might have negative impacts on the environment, it is necessary to solidify the need for balanced growth policies (If the energy prices are cheaper and the financial environment is good enough then it becomes easier to find funds to start or improve a business. As the profit maximization is the main goal of companies, they might harm their environment in their activities by increasing social costs. Hence, balanced and solid policies are needed to prevent them from doing so). Third, this is the first study investigating this relationship in the case of Azerbaijan by employing time-series data, which enables to see the country-specific features of this relationship. In addition, the findings of the paper can be considered as a tool for comparison or similarly, policy measurement purposes.
The remainder of the paper is organized as follows: Section 2 presents an overview of the existing literature and the formulation of the hypothesis. Section 3 presents the description of the data and an overview and description of the research methodology. Section 4 presents the obtained empirical results of the study and discusses the findings. Section 5 presents the conclusion and policy implications.
2. Theoretical and Empirical Literature Review
The impact of financial development and economic growth on energy consumption is a complex issue in the theoretical and empirical literature. From a theoretical perspective, one view argues that financial development boosts economic growth [12,13,14,15,16,17,18,19,20,21,22,23] and as a result, by attracting more foreign direct investment (FDI), this may drive up energy consumption via economic growth [6]. Furthermore, Mishkin [24] theoretically indicated that the development of the financial system leads to reforms, improving institutional quality, a reduction in borrowing and information costs, and technological progress, thereby guaranteeing the capacity of savings and investments. All these factors increase economic activities and this, in turn, leads to the larger demand of households for energy-consuming goods in their daily life. Moreover, stock market development increases financial activities and thus positively impacts economic growth and energy consumption.
Despite the importance of the topic, there has been a shortage of empirical studies exploring the impact of financial development and economic growth on energy consumption in a systematic manner until very recent times. And generally, the existing empirical literature focused on the economic growth and energy consumption context and indicators of financial development are used as control variables due to the omitted variable bias.
In the context of finance and energy, many empirical studies, like Sadorsky [6] for 22 emerging countries, Xu [25] for China, Shahbaz et al. [26] for Indonesia, Coban and Topcu [27] for EU countries, Islam et al. [28] for Malaysia, Ozturk and Acaravci [29] for Turkey, Tang and Tan [30] for Malaysia, Salah et al. [31] for Lebanon found the positive impact of financial development on energy consumption.
On the energy and growth framework, a significant relationship from economic growth to energy consumption was revealed in a pioneer study by J. Kraft and A. Kraft [32] for the USA, then by Lise and van Montfort [33] for Turkey, by Huang and Hwang [34] for 82 countries, by Mallick [35] for India, by Sa’ad [36] for Nigeria, by Binh [37] for Vietnam, by Narayan et al. [38] for 93 countries, by Qazi et al. [39] for Pakistan, by Soile [40] for Indonesia, by Kasman and Duman [41] for EU member and candidate countries, inter alia.
While considering these studies, it can be seen that different econometric approaches such as Autoregressive Distributed Lags Bounds Testing (ARDL), Vector Autoregressive Regression (VAR), Granger Causality, Toda Yamamoto causality test, Nonlinear Autoregressive Distributed Lags Bounds Testing (NARDL), Generalized Method of Moments (GMM), and multivariate cointegration, correlation analysis, etc., were used in these investigations.
The above-quoted studies do not completely show the large body of empirical literature on the financial development, economic growth, and energy consumption nexus. Indeed, the results can differ based on econometric approaches, countries, time periods or methods used. Table 1, summarizes the findings on this framework and highlights the nexus among them in the case of different countries. The table includes only studies conducted after 2010, and we tried only to review the country cases similar to Azerbaijan.
In the case of Azerbaijan, prior research conducted by Mukhtarov et al. [55] investigated only the causality relationship between energy consumption and economic growth while Hasanov and Mikayilov [56], Hasanov et al. [57], and Mikayilov et al. [58] studied the impact of economic growth on electricity consumption not on energy consumption. Hasanov et al. [59] examined the impact of economic growth on energy consumption and did not use financial development in their study. As can be seen from the literature review, no research has been conducted on the impact of financial development and economic growth on energy consumption in the case of Azerbaijan. Therefore, the objective of the current study is to fill in this gap by investigating the long-run relationship among these variables, employing cointegration techniques. We employed VECM, since it allows to investigate the possibility of cointegration vectors among the variables in the case of more than two variables. In addition, under the VECM framework, one can examine the relationship as a system, rather than a single equation. The GH cointegration approach is used to see if there is a break in the long-run relationship, while ARDL is employed to investigate the long-run relationship in the final step, due to its outperformance in the case of a small sample size. The findings will suggest that policy makers should take into account the financial development, economic growth, and energy consumption nexus for the purpose of macro-prudential regulation and sustainable development in Azerbaijan, and also contribute to the empirical literature for further studies in the case of similar countries.
3. Model and Data
3.1. Data
We use annual data for the period of 1992–2015 for empirical analysis. All data set have been taken from the World Development Indicators of the World Bank [1]. Energy consumption (EC) is measured in kg of oil equivalent. Economic growth (Y) is measured by real GDP (2010 US $). Moreover, this paper uses a private credit indicator as a proxy for financial development. Private credit (Crd) is measured by domestic credit as percentage of GDP. This variable was used in various previous papers, such as Sadorsky [6], Mehrara and Musai [47], Chang [60], Polat et al. [61], Shahbaz et al. [62], Mahalik et al. [53] and Kahouli [63]. In empirical estimations, all the variables were used in logarithmic form.
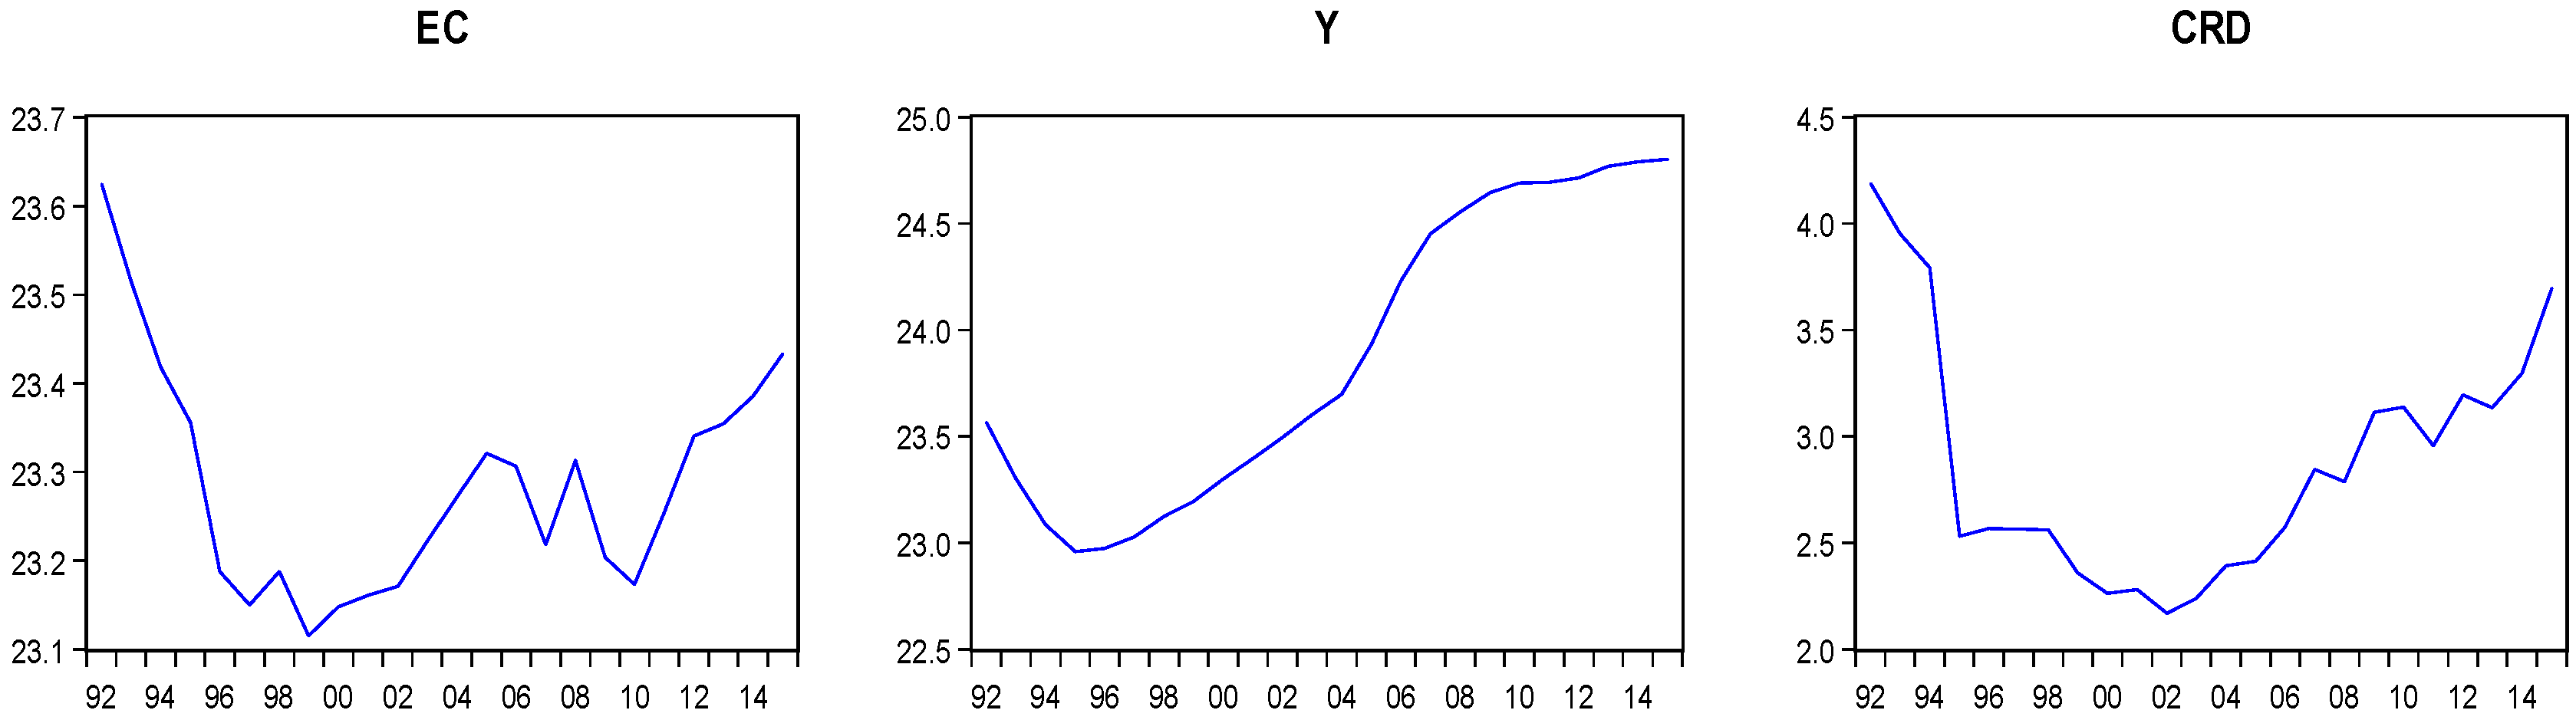
Figure 1 below shows the time profile of the above variables, all in the natural logarithm levels over the period 1992–2015.
As demonstrated in Figure 1, all variables sharply decreased in the period of 1992–1996. Different factors, such as the collapse of the Soviet system, where Azerbaijan was a part of it, the worsening of the industrial and banking sectors, as well as a war situation after independence, are the determinants of this decline. Energy consumption relatively increased during the 1996–2010 period with some fluctuations, and close to the end of the investigation period, 2010–2015, it started to increase. These patterns with increasing trends and some fluctuations are a result of adopted energy-related policies.
GDP has increased since 1998. Before 1998, GDP was decreasing due to the collapse of the previous economic system and only after that time did the economy start to recover. GDP was decreasing in 1998 due to the negative impact of the 1998 Russian crisis on the economy of Azerbaijan. The jump of GDP in 2006 was most likely due to the effect of oil revenues following the completion of the Baku-Tbilisi-Ceyhan main export oil pipeline. GDP growth has slowed down since 2008, as worsening global economic conditions have resulted in lower oil and commodity prices leading, to a decline in foreign exchange revenues. As it can be seen from Figure 1, there was a significant increase in the amount of credit between 2003–2015. The main reason behind this situation is the economic growth in Azerbaijan during this period.
As it can be seen from Table 2, the volatility in all variables demonstrates the decreasing nature in comparison with the previous/longer periods, indicating a more stable behavior over time. For the last five years of the period of investigation, the measure of financial development exhibits relatively smaller volatility in comparison with the entire period and especially the last ten-year period, which can be thought of as an improvement in the financial environment. But this fact needs clarification and approval as a result of examining the objective of the current study.
3.2. Econometric Methodology
We analyze the relationship between energy consumption, economic growth and financial development using the cointegration and vector error correction modeling framework. First, we will check the non-stationarity characteristics of the variables. We will use the Augmented Dickey Fuller (ADF) unit root test [64], Phillips–Perron (PP) test [65], and Zivot and Andrew (ZA) [66] unit root test with a structural break for this exercise.
Next, if the variables are integrated on the same order, then we can test whether they move together in the long-run, using a cointegration test. In order to be on the safe side, we will follow the latter option and use the Johansen test [7], as it is the only test that can produce proper results in the case where more than two variables are tested for cointegration. Because of the evolution of the variables despite some important fluctuations over the studied period, there might be breaks in the behaviors of the variables as well as in the cointegration relationship. In other words, there might be different cointegration relationships (with break) before and after some time-point. The change might be due to constant, in slope parameter, or in both. Hence, we will also employ Gregory and Hansen [9] residual based cointegration tests for models with regime shifts to investigate all these possible cases. After confirming the presence of cointegration between the variables, one can apply the different cointegration methods to investigate the long-run relationship among the variables. We also employ Pesaran’s Bounds cointegration test and finally, the long-run relationship will be estimated using the ARDL approach, since it outperforms other methods in the small sample case [67].
Since the above mentioned unit root tests as well as the cointegration methods are widely used techniques in similar studies, we do not describe them here. Interested readers can refer to Dickey and Fuller [64], inter alia, for the ADF test, Zivot and Andrew [66] for the ZA test, Johansen [7] and Johansen and Juselius [8] for the VECM approach, and Gregory and Hansen [9] for the cointegration tests for models with regime shifts, inter alia.
4. Empirical Results and Discussion
As a starting point, first we test the variables for a unit root. For this purpose, we use the ADF, PP, and ZA unit root tests. The results of the unit root testing procedure are presented in Table 3. We find that the variables are non-stationary at their levels but they are stationary at first difference, being integrated of order one, I(1). We thus conclude that our variables are non-stationary in levels but stationary in their first differences. In other words, they follow the integration of order one, I(1), processes. Our conclusion that the variables are I(1) allows us to proceed to the cointegration test.
Since we have more than two variables as a next step we employ the Johansen cointegration test to see if there is one or more than one cointegration relationships. If there is only one cointegration relationship one can employ one of the cointegration methods as a single equation, otherwise, an additional investigation is needed to analyze the proper relationship among the variables of interest. To apply the Johansen procedure, the optimal lag number should first be identified. A Vector Auto Regressive (VAR) model was initially specified with the endogenous variables of EC, Y and Crd, and the exogenous variable of the energy price. Considering that energy price data is not available for Azerbaijan, we use the consumer price index as a proxy for energy prices followingthe previous studies by Mahadevan and Asafu-Adjaye [69] and Sadorsky [6], Chang [60], Komal et al. [70]. The details of this test are presented in Table 4. A maximum of two lags was initially considered and both the lag selection criteria and lag exclusion test statistics propose that a lag of order two is optimal, which is intuitively applicable given the small number of observations.
Panels A through D in Table 5 report that the VAR has worthy features as it is stable, the residuals do not demonstrate serial correlation and heteroscedasticity issues, and they are normally distributed. After obtaining the VAR model with required features, as a next step we perform Johansen cointegration tests. The Johansen cointegration test results are presented in Panels E and F of Table 5.
Both the trace and the max-eigenvalue test statistics indicate one cointegration relationship among the variables. Therefore, we conclude that there is a cointegrating relationship among the variables. From the Johansen cointegration test results, we could not reject the hypothesis of one cointegration relationship, the long-run relationship is preferable to investigate with a single equation method. Therefore, we will continue our investigation with single equation techniques.
As mentioned in the methodology section, to investigate if there are changes/regime shifts in the cointegration relationship we employ the GH cointegration test in addition to the Johansen test. The results of the GH cointegration tests are given in Table 6. We follow the same procedure as in the Gregory and Hansen [9] paper, classifying the possible cases to three: level shift (C), level shift with trend (C/T) and regime shift (C/S). The corresponding Gregory–Hansen ADF, Za and Zt test statistics are reported in Panel A of Table 6.
The model outputs of the Gregory–Hansen type long-run equations are given in panel B of Table 6. As can be seen from Panel A of the table, column GH, in all cases the tests failed to reject the null hypothesis with no cointegration relationship. In order to see if the breaks in the long-run relationship are significant one should have a look on the significance of the coefficients of the corresponding equations. The last specification of the GH test, the regime shift, was found to be irrelevant for our analyses since it concludes the break point to be 1995, which does not seem reasonable based on the graphical inspection of the variables. Moreover, the model cannot be estimated with three data points before 1995, and starting the estimations from 1995 does not change the results significantly in comparison with the results with the whole period. Hence, we continue our discussion with only C and C/T cases. As can be seen from Panel B of Table 6, in both cases (C and C/T) the additional constant term (c1) corresponding to the time-interval after the break point is insignificant. In the C case the coefficients of GDP and Crd are insignificant, and in the C/T case the GDP, price and trend variables are insignificant. The insignificance of c1 means that there is not a statistically significant break in the long-run relationship among the variables of interest. Based on these results we conclude that the long-run relationship among energy consumption, financial development, and economic growth does not demonstrate statistically significant time-variant nature with changes/breaks. Hence, the conventional cointegration methods are applicable. As a robustness check we also employed the ARDL Bounds cointegration test and the test result is given in Panel D of Table 6, which concludes a cointegration relationship for any significance level. Since the variables share a common trend in the long-run, we can estimate the long-run relationship among them. For this purpose, we use Pesaran’s ARDL approach. The residuals of the model passed all the diagnostic tests and the model passed the misspecification test, the results of which are given in Panel D of Table 6. Since the model passed the diagnostic checks, the results are interpretable. The results of estimations are given in Panel C of Table 6. As can be seen from Panel C, all the coefficients are statistically significant.
The long-run coefficients are given in Table 6. Results show that Crd has a positive and statistically significant impact on energy consumption. The results reveal that energy consumption responses by 0.19% increase to a 1% increase in real domestic credit to the private sector. In addition, it worth noting that as a proxy for financial development we also used FDI in our estimations, and it is found to be insignificant. In the case of insignificant FDI, one reason might be the sector where the FDI is invested. Based on the annual reports of the Central Bank of Azerbaijan (CBAR) [72] for the last 16 years and ending in 2015, each year on average 85% of the FDI invested in to the oil and gas sector, which increases the export of oil and gas products, did not create a significant increase in domestic energy consumption. In addition, FDI in the form of innovative technology, or knowledge based assets that increase energy efficiency in terms of more efficient processes, created more effective technology to compensate for the extra energy consumption, which again makes insignificant the impact of FDI on energy consumption. Nevertheless, the positive and significant impact of financial development proxied by the private credit ratio to GDP can also be considered as an improvement and demonstrate the potential of continuing the related policies necessary to achieve the required standards for sustainable development. Moreover, the decreasing volatility in the credit rate, based on the information provided in Table 2, also “speaks out” about the relative improvements in financial development that occur as a result. Sign wise, and to consider the significance of the financial development proxy, our finding is consistent with the results of Sadorsky [6], in the case of developing countries, Sadorsky [42] for Central and Eastern Europe, Shahbaz and Lean [46] in the Tunisian case, Coban and Topcu [27] in the case of European countries, Tang and Tan [30] and Islam et al. [28] in Malaysia, Mallick and Mahalik [73] in the Indian case, and Mahalik et al. [53] for the Kingdom of Saudi Arabia. The impact of economic growth on energy consumption is found to be positive and statistically significant at the 1% level. This shows that a 1% increase in economic growth results in 0.12% increase in energy consumption. This implies that an increase in economic growth raises energy consumption. The impact of the price variable is also found to be statistically significant with a negative sign, which is in line with the theory.
5. Conclusions and Policy Implications
The study analyses the impact of economic growth and financial development on energy consumption. After testing variables for unit root, the results showed their stationarity at first differenced form. Hence, the variables can be tested for a common long-run trend. The Johansen trace and maximum eigenvalue tests concluded one cointegration relationship among the variables. In addition, Pesaran’s Bounds test also resulted in the existence of a long-run relationship. This implies that there is a long run relationship between energy consumption, economic growth, and financial development in Azerbaijan. The Gregory–Hansen test results showed that there is not a statistically significant change in the long-run relationship. Estimation results show that economic growth increases energy consumption in the long-run, namely, a 1% increase in economic growth increases energy consumption by 0.12%. Moreover, the coefficient of the financial development proxy is found to be positive and statistically significant, numerically being equal to 0.19%. The positive and statistically significant impact of financial development on energy demand can be considered as one of the signs of improvements in a business friendly environment. Considering the fact that Azerbaijan was placed in 57th out of 190 countries in World Bank Doing Business Indicators, based on the 2018 ranking by the World Bank [74], we can conclude that there is a remarkable improvement in terms of starting and doing business in Azerbaijan. This fact supports the finding based on the discussion of volatility in financial development according to the coefficient of variation in Table 2, which is 30% for the last five-year period in comparison with the 33% for the last ten-year period, and 71% for the entire sample. The obtained positive impact of financial development, proxied by domestic credit as a percentage of GDP, shows that the financial atmosphere allows businesses and individuals to borrow money from financial entities easily (to some extent) and improve their production potential and also set-up new firms. In the same token, households are able to get credits and buy or renew their houses, appliances such as fridges, air conditioners and washing machines, as well as automobiles. In both cases, just mentioned above, these activities cause an increase in energy consumption. Since either economic or financial development has a positive impact on energy demand, it gains a special importance in taking the appropriate energy policies that consider cheaper oil/energy prices. One might expect that relatively easier money will favor efficient energy use, being invested in know-how technology, less energy intensive modern electrical households or industrial appliances, automobiles, etc., but this fact needs to be investigated in terms of historical behaviors and responses of energy mix to financial development. If the impact of financial development results in a decrease of fossil fuel mix energy use, one can conclude this case as an energy efficient and environmentally friendly financial development path. From another point of view, “keeping” the balance among energy use-economic growth-financial development is important from the sustainable development perspective. That is, easier funding opportunities that might cause entrepreneurs to find “easy” money and to widen their anti-environment production or other activities, or households to enjoy cheaper energy prices and use energy compliances carelessly and cause environmental degradation. The last two points are directions of future research to be investigated. In this regard, Azerbaijani policymakers and related authorities in similar economies should consider a balanced approach to economic growth, financial development, and energy-related measures policies.
Author Contributions
All authors contributed equally to all aspects of the research reported in this paper.
Funding
This research received no external funding.
Acknowledgments
We are grateful to four anonymous referees, and the editors for their comments and suggestions that have helped to improve considerably the paper; nonetheless, we are of course responsible for all errors and omissions. Finally, the views expressed in this paper are those of the authors and do not necessarily represent the views of their affiliated institutions.
Conflicts of Interest
The authors declare no conflict of interest.
References
- World Bank. Available online: http://databank.worldbank.org/data (accessed on 28 April 2018).
- Jones, C.I.; Vollrath, D. Introduction to Economic Growth; W.W. Norton and Company, Inc.: New York, NY, USA, 2013. [Google Scholar]
- Solow, R.M. Resources and Economic Growth. Am. Econ. 2016, 61, 52–60. [Google Scholar] [CrossRef] [Green Version]
- Meadows, D.H.; Meadows, D.L.; Randers, J.; Behrens, W. The Limits to Growth; Universe Books: New York, NY, USA, 1972. [Google Scholar]
- Karanfil, F. How many times again will we examine the energy–income nexus using a limited range of traditional econometric tools? Energy Policy 2009, 37, 1191–1194. [Google Scholar] [CrossRef]
- Sadorsky, P. The impact of financial development on energy consumption in emerging economies. Energy Policy 2010, 38, 2528–2535. [Google Scholar] [CrossRef]
- Johansen, S. Statistical analysis of cointegration vectors. J. Econ. Dyn. Control 1988, 12, 231–254. [Google Scholar] [CrossRef]
- Johansen, S.; Juselius, K. Maximum likelihood estimation and inference on cointegration with applications to the demand for money. Oxf. Bull. Econ. Stat. 1990, 52, 169–210. [Google Scholar] [CrossRef]
- Gregory, A.W.; Hansen, B.E. Residual-Based Tests for Cointegration in Models with Regime Shifts. J. Econom. 1996, 70, 99–126. [Google Scholar] [CrossRef]
- Pesaran, M.; Shin, Y. An autoregressive distributed lag modeling approach to cointegration analysis. In Econometrics and Economic Theory in the 20th Century: The Ragnar Frisch centennial Symposium; Strom, S., Ed.; Cambridge University Press: Cambridge, UK, 1996. [Google Scholar]
- Pesaran, M.H.; Shin, Y.; Smith, R.J. Bounds testing approaches to the analysis of level relationships. J. Appl. Econom. 2001, 16, 289–326. [Google Scholar] [CrossRef] [Green Version]
- Schumpeter, J.A. The Theory of Economic Development; Harvard University Press: Cambridge, MA, USA, 1911. [Google Scholar]
- Goldsmith, R.W. Financial Structure and Development; Yale University Press: New Haven, CT, USA, 1969. [Google Scholar]
- McKinnon, R.I. Money and Capital in Economic Development; Brookings Institution: Washington, DC, USA, 1973. [Google Scholar]
- Shaw, E.S. Financial Deepening in Economic Development; Oxford University Press: New York, NY, USA, 1973. [Google Scholar]
- King, R.G.; Levine, R. Finance and Growth: Schumpeter Might Be Right. Q. J. Econ. 1993, 108, 713–737. [Google Scholar] [CrossRef]
- Ang, J.B. What are the mechanisms linking financial development and economic growth in Malaysia? Econ. Model. 2005, 25, 38–53. [Google Scholar] [CrossRef]
- Adjasi, C.K.D.; Biekpe, N.B. Stock Market Development and Economic Growth: The Case of Selected African Countries. Afr. Dev. Rev. 2006, 18, 144–161. [Google Scholar] [CrossRef]
- Akinlo, A.E.; Akinlo, O.O. Stock Market Development and Economic Growth: Evidence from Seven Sub-Sahara African Countries. J. Econ. Bus. 2009, 61, 162–171. [Google Scholar]
- Wu, J.L.; Hou, H.; Cheng, S.Y. The dynamic impacts of financial institutions on economic growth: Evidence from the European Union. J. Macroecon. 2010, 32, 879–891. [Google Scholar] [CrossRef]
- Hassan, K.M.; Sanchez, B.; Yu, J. Financial Development and Economic Growth: New Evidence from Panel Data. Q. Rev. Econ. Financ. 2011, 51, 88–104. [Google Scholar] [CrossRef]
- Adu, G.; Marbuah, G.; Mensah, J.T. Financial Development and Economic Growth in Ghana: Does the Measure of Financial Development Matter? Rev. Dev. Financ. 2013, 3, 192–203. [Google Scholar] [CrossRef]
- Chortareas, G.; Magkonis, G.; Moschos, D.; Panagiotidis, T. Financial Development and Economic Activity in Advanced and Developing Open Economies: Evidence from Panel Cointegration. Rev. Dev. Econ. 2015, 19, 163–177. [Google Scholar] [CrossRef] [Green Version]
- Mishkin, F.S. Globalization and financial development. J. Dev. Econ. 2009, 89, 164–169. [Google Scholar] [CrossRef]
- Xu, S. The impact of financial development on energy consumption in China: Based on SYS-GMM estimation. Adv. Mater. Res. 2012, 524–527, 2977–2981. [Google Scholar] [CrossRef]
- Shahbaz, M.; Hye, Q.M.; Tiwari, A.; Leitão, N. Economic growth, energy consumption, financial development, international trade and CO2 emissions in Indonesia. Renew. Sustain. Energy Rev. 2013, 25, 109–121. [Google Scholar] [CrossRef] [Green Version]
- Coban, S.; Topcu, M. The nexus between financial development and energy consumption in the EU: A dynamic panel data analysis. Energy Econ. 2013, 39, 81–88. [Google Scholar] [CrossRef]
- Islam, F.; Shahbaz, M.; Ahmed, A.U.; Alam, M.M. Financial development and energy consumption nexus in Malaysia: A multivariate time series analysis. Econ. Model. 2013, 30, 435–441. [Google Scholar] [CrossRef] [Green Version]
- Ozturk, I.; Acaravci, A. The long-run and causal analysis of energy, growth, openness and financial development on carbon emissions in Turkey. Energy Econ. 2013, 36, 262–267. [Google Scholar] [CrossRef]
- Tang, C.F.; Tan, B.W. The linkages among energy consumption, economic growth, relative price, foreign direct investment, and financial development in Malaysia. Qual. Quant. 2014, 48, 781–797. [Google Scholar] [CrossRef]
- Salah, A.; Shahbaz, M.; Sbia, R. The links between energy consumption, financial development, and economic growth in Lebanon: Evidence from cointegration with unknown structural breaks. J. Energy 2015, 2015, 965825. [Google Scholar] [CrossRef]
- Kraft, J.; Kraft, A. On the relationship between energy and GNP. J. Energy Financ. Dev. 1978, 3, 401–403. [Google Scholar]
- Lise, W.; Montfort, K.V. Energy consumption and GDP in Turkey: Is there a co-integration relationship? Energy Econ. 2007, 29, 1166–1178. [Google Scholar] [CrossRef]
- Huang, B.N.; Hwang, M.J.; Yang, C.W. Does more energy consumption bolster economic growth? An application of the nonlinear threshold regression model. Energy Policy 2008, 36, 755–767. [Google Scholar] [CrossRef]
- Mallick, H. Examining the linkage between energy consumption and economic growth in India. J. Dev. Areas 2009, 43, 249–280. [Google Scholar] [CrossRef]
- Saad, S. Energy consumption and economic growth: Causality relationship for Nigeria. OPEC Energy Rev. 2010, 34, 15–24. [Google Scholar] [CrossRef]
- Binh, P.T. Energy consumption and economic growth in Vietnam: Threshold cointegration and causality analysis. Int. J. Energy Econ. Policy 2011, 1, 1–17. [Google Scholar]
- Narayan, P.K.; Popp, S. The energy consumption-real GDP nexus revisited: Empirical evidence from 93 countries. Econ. Model. 2012, 29, 303–308. [Google Scholar] [CrossRef]
- Qazi, A.Q.; Ahmed, K.; Mudassarm, M. Disaggregate energy consumption and industrial output in Pakistan: An empirical analysis. Econ. Discuss. Pap. 2012, 29, 1–14. [Google Scholar]
- Soile, I.O. Energy-economy nexus in Indonesia: A bivariate cointegration. Asian J. Empir. Res. 2012, 2, 205–218. [Google Scholar]
- Kasman, A.; Duman, Y.S. CO2 emissions, economic growth, energy consumption, trade and urbanization in new EU member and candidate countries: A panel data analysis. Econ. Model. 2015, 44, 97–103. [Google Scholar] [CrossRef]
- Sadorsky, P. Financial development and energy consumption in Central and Eastern European frontier economies. Energy Policy 2011, 39, 999–1006. [Google Scholar] [CrossRef]
- Kakaer, Z.K.; Khilji, B.A.; Khan, M.J. Financial Development and Energy Consumption: Empirical Evidence from Pakistan. Int. J. Trade Econ. Financ. 2011, 2, 469–471. [Google Scholar] [CrossRef]
- Al-Mulali, U.; Sab, C.N.B.C. The impact of energy consumption and CO2 emission on the economic growth and financial development in the Sub Saharan African countries. Energy 2012, 39, 180–186. [Google Scholar] [CrossRef]
- Al-Mulali, U.; Sab, C.N.B.C. The impact of energy consumption and CO2 emission on the economic and financial development in 19 selected countries. Renew. Sustain. Energy Rev. 2012, 16, 4365–4369. [Google Scholar] [CrossRef]
- Shahbaz, M.; Lean, H.H. Does financial development increase energy consumption? The role of industrialization and urbanization in Tunisia. Energy Policy 2012, 40, 473–479. [Google Scholar] [CrossRef] [Green Version]
- Mehrara, M.; Musai, M. Energy consumption, financial development and economic growth: An ARDL approach for the case of Iran. Int. J. Bus. Behav. Sci. 2012, 2, 92–99. [Google Scholar]
- Shahbaz, M.; Khan, S.; Tahir, M.I. The dynamic links between energy consumption, economic growth, financial development and trade in China: Fresh evidence from multivariate framework analysis. Energy Econ. 2013, 40, 8–21. [Google Scholar] [CrossRef] [Green Version]
- Khan, M.A.; Khan, Z.K.; Zaman, K.; Irfan, D.; Khatab, H. Questing the three key growth determinants: Energy consumption, foreign direct investment and financial development in South Asia. Renew. Energy 2014, 68, 203–215. [Google Scholar] [CrossRef]
- Omri, A.; Kahouli, B. Causal relationships between energy consumption, foreign direct investment and economic growth: Fresh evidence from dynamic simultaneous-equations models. Energy Policy 2014, 67, 913–922. [Google Scholar] [CrossRef] [Green Version]
- Alam, A.; Malik, I.A.; Abdullah, A.B.; Hassan, A.; Faridullah, A.U.; Ali, G.; Zaman, K.; Naseem, I. Does financial development contribute to SAARC’S energy demand? From energy crisis to energy reforms. Renew. Sustain. Energy Rev. 2015, 41, 818–829. [Google Scholar] [CrossRef]
- Paramati, S.R.; Mo, D.; Gupta, R. The effects of stock market growth and renewable energy use on CO2 emissions: Evidence from G20 countries. Energy Econ. 2017, 66, 360–371. [Google Scholar] [CrossRef]
- Mahalik, M.K.; Babub, M.S.; Loganathan, N.; Shahbaz, M. Does financial development intensify energy consumption in Saudi Arabia? Renew. Sustain. Energy Rev. 2017, 75, 1022–1034. [Google Scholar] [CrossRef] [Green Version]
- Bekhet, H.A.; Matar, A.; Yasmin, T. CO2 emissions, energy consumption, economic growth, and financial development in GCC countries: Dynamic simultaneous equation models. Renew. Sustain. Energy Rev. 2017, 70, 117–132. [Google Scholar] [CrossRef]
- Mukhtarov, S.; Mikayilov, J.I.; Ismayilov, V. The Relationship between Energy Consumption and Economic Growth: Evidence from Azerbaijan. Int. J. Energy Econ. Policy 2017, 7, 32–38. [Google Scholar]
- Hasanov, F.; Mikayilov, J. The impact of age groups on consumption of residential electricity in Azerbaijan. Communist Post-Communist Stud. 2017, 50, 157–244. [Google Scholar] [CrossRef]
- Hasanov, F.; Hunt, L.; Mikayilov, C. Modeling and forecasting electricity demand in Azerbaijan using Co-integration techniques. Energies 2016, 9, 1045. [Google Scholar] [CrossRef]
- Mikayilov, J.I.; Hasanov, F.J.; Bollino, C.A.; Mahmudlu, C. Modeling of Electricity Demand for Azerbaijan: Time-Varying Coefficient Cointegration Approach. Energies 2017, 10, 1918. [Google Scholar] [CrossRef]
- Hasanov, F.J.; Bulut, C.; Suleymanov, E. Do population age groups matter in the energy use of the oil-exporting countries? Econ. Model. 2016, 54, 82–99. [Google Scholar] [CrossRef]
- Chang, S.C. Effects of financial developments and income on energy consumption. Int. Rev. Econ. Financ. 2015, 35, 28–44. [Google Scholar] [CrossRef]
- Polat, A.; Shahbaz, M.; Rehman, I.; Satti, S.L. Revisiting linkages between financial development, trade openness and economic growth in South Africa: Fresh evidence from combined cointegration test. Qual. Quant. 2015, 49, 785–803. [Google Scholar] [CrossRef] [Green Version]
- Shahbaz, M.; Mallick, H.; Mahalick, M.K.; Sadorsky, P. The role of globalization on the recent evolution of energy demand in India: Implications for sustainable development. Energy Econ. 2016, 55, 52–68. [Google Scholar] [CrossRef] [Green Version]
- Kahouli, B. The short and long run causality relationship among economic growth, energy consumption and financial development: Evidence from South Mediterranean Countries (SMCs). Energy Econ. 2017, 68, 19–30. [Google Scholar] [CrossRef]
- Dickey, D.; Fuller, W. Likelihood Ratio Statistics for Autoregressive Time Series with a Unit Root. Econometrica 1981, 49, 1057–1072. [Google Scholar] [CrossRef]
- Phillips, P.B.; Perron, P. Testing for Unit Roots in Time Series Regression. Biometrika 1988, 75, 335–346. [Google Scholar] [CrossRef]
- Zivot, E.; Donald, W.K.A. Further Evidence on the Great Crash, the Oil-Price Shock, and the Unit-Root Hypothesis. J. Bus. Econ. Stat. 1992, 10, 251–270. [Google Scholar] [Green Version]
- Mikayilov, J.; Hasanov, F.; Yusifov, S. Residential electricity use effects of population in Kazakhstan. Int. J. Energy Technol. Policy 2018, 14, 114–132. [Google Scholar] [CrossRef]
- Mackinnon, J.G. Numerical Distribution Functions for Unit Root and Cointegration Test. J. Appl. Econom. 1996, 11, 601–618. [Google Scholar] [CrossRef]
- Mahadevan, R.; Asafu-Adjaye, J. Energy consumption, economic growth and prices: A reassessment using panel VECM for developed and developing countries. Energy Policy 2007, 35, 2481–2490. [Google Scholar] [CrossRef]
- Komal, R.; Abbas, F. Linking financial development, economic growth and energy consumption in Pakistan. Renew. Sustain. Energy Rev. 2015, 44, 211–220. [Google Scholar] [CrossRef]
- Urzua, C.M. Omnibus Test for Multivariate Normality Based on a Class of Maximum Entropy Distributions. Adv. Econom. 1997, 12, 341–358. [Google Scholar]
- CBAR, Central Bank of the Republic of Azerbaijan. Annual Reports 2000–2015. Available online: https://en.cbar.az/pages/publications-researches/annual-reports/ (accessed on 5 May 2018).
- Mallick, H.; Mahalik, M.K. Energy consumption, economic growth and financial development: A comparative perspective on India and China. Bull. Energy Econ. 2014, 2, 72–84. [Google Scholar]
- WB. Available online: http://www.doingbusiness.org/reports/~/media/WBG/DoingBusiness/Documents/Profiles/Regional/DB2018/ECA.pdf (accessed on 28 April 2018).
Figure 1.
Time profile of the variables (in logarithmic form).

Table 1.
Summary of similar empirical studies in the literature.
| Author(s) | Time Period | Country | Method(s) | Result |
|---|---|---|---|---|
| Sadorsky [42] | 1996–2006 | 9 CEE frontier economies | GMM | Strong and positive impact of FD on EC |
| Kakar et al. [43] | 1980–2009 | Pakistan | 1. CT 2. VECM, GCT | 1. CR between FD to EC. 2. UC from FD to EC |
| Al-Mulali and Sab [44] | 1980–2008 | 30 SSA countries | 1. Pedroni CT 2. VECM, GCT | 1. CR between FD, EG and EC 2. LRC between EC, FD and EG |
| Al-Mulali and Sab [45] | 1980–2008 | 19 countries | 1. Pedroni CT 2. VECM, GCT | 1. CR between FD, EG and EC 2. NC between FD and EC |
| Shahbaz and Lean [46] | 1971–2008 | Tunisia | 1. ARDL 2. VECM, GCT | 1. CR between FD, EG and EC 2. LRC between FD and EC |
| Mehrara and Musai [47] | 1970–2009 | Iran | ARDL | 1. CR between EC, EG and, FD |
| Islam et al. [28] | 1971–2009 | Malaysia | 1. ARDL 2. VECM, GCT | 1. CR between FD, EG and EC 2. SRC from FD to EC |
| Shahbaz et al. [48] | 1971–2011 | China | 1. ARDL 2. GCT | 1. CR between FD, EG and EC 2. NC between FD and EC |
| Çoban and Topcu [27] | 1990-2011 | EU countries | GMM | NC between FD and EC |
| Shahbaz et al. [26] | 1975–2011 | Indonesia | 1. ARDL bounds CT 2. VECM, GCT | 1. CR between FD, EG and EC 2. NC between FD and EC |
| Tang and Tan [30] | 1972–2009 | Malaysia | 1. ARDL 2. Johansen CT | 1. CR between FD, EG and EC 2. LRC between FD and EC |
| Khan et al. [49] | 1975–2011 | South Asia | 1. ARDL 2. GCT | 1. CR between FD, EG and EC 2. Bidirectional LRC between FD and EC |
| Omri and Kahouli [50] (2014) | 1990–2011 | 65 countries | GMM | UC from FD to EC |
| Alam et al. [51] | 1975–2011 | SAARC countries | Panel CT | Significant relationship between EC, EG and FD |
| Salah et al. [31] | 2000–2010 | Lebanon | 1. ARDL 2. VECM, GCT | 1. CR between FD, EG and EC 2. Bidirectional LRC between FD and EC |
| Paramati et al. [52] | 1991–2012 | 20 emerging market economies | 1. Westerlund panel CT 2. Dumitrescu and Hurlin heterogeneous panel causality test | 1. EG, FD positively impact on EC UC from FD to clean EC |
| Mahalik et al. [53] | 1971–2011 | Saudi Arabia | 1. CT 2. VECM | UC from FD to clean EC |
| Bekhet et al. [54] | 1980–2011 | GCC countries | 1. ARDL | CR between EC and FD |
| Legend: ARDL = Autoregressive Distributed Lags Bounds Testing, GMM = Generalized Method of Moments and VECM = Vector Error Correction Method. CT = cointegration test, GCT = Granger causality test, CR = cointegration relationship, UC = Unidirectional causality, NC = No causality, LRC = Long-run causality, SRC = Short-run causality. | ||||
| Notes: CEE = Central and Eastern Europe, SSA = Sub-Saharan Africa, EU = European Union, SAARC = South Asian Association for Regional Cooperation, GCC = Gulf Cooperation Council, FD = Financial Development, EG = Economic Growth, EC = Energy Consumption. | ||||
Table 2.
Descriptive Statistics of the variables for three time-periods.
| Mean | Standard Deviation | Coefficient of Variation, % | |||||||
|---|---|---|---|---|---|---|---|---|---|
| 1992–2015 | 2006–2015 | 2011–2015 | 1992–2015 | 2006–2015 | 2011–2015 | 1992–2015 | 2006–2015 | 2011–2015 | |
| EC | 13,053.8 ×106 | 13,167 × 106 | 13,895.8 × 106 | 1729.5 × 106 | 1052.9 × 106 | 809.5 × 10⁶ | 13 | 8 | 6 |
| Crd | 21.24 | 22.58 | 22.76 | 14.99 | 7.50 | 8.04 | 71 | 33 | 30 |
| GDP | 29,349.3 × 106 | 50,607.7 × 106 | 56,337.3 × 106 | 18,935.6 × 106 | 7738.9 × 106 | 2399 × 106 | 65 | 15 | 4 |
Notes: EC in kg of oil equivalent, Crd is domestic credit as % of GDP, GDP in 2010 US $.
Table 3.
Results of unit root tests.
| Variable | The ADF Test | The PP Test | The ZA Test | |||||||
|---|---|---|---|---|---|---|---|---|---|---|
| Level | k | First Difference | k | Level | First Difference | Level | k | First Difference | k | |
| EC | −2.941 | 0 | −6.786 *** | 0 | −2.859 | −3.629 ** | −2.253 | 0 | −5.387 *** | 0 |
| Crd | −2.938 | 0 | −4.692 *** | 0 | −2.141 | −3.890 *** | −2.581 | 0 | −5.649 *** | 0 |
| y | −2.212 | 1 | −3.240 ** | 1 | −0.268 | −2.921 * | −0.305 | 1 | −3.377 * | 0 |
Notes: ADF, PP and KPSS denote the Augmented Dickey-Fuller, Phillips–Perron test and ZA = Zivot and Andrew test with break points, respectively. Maximum lag order is set to two and optimal lag order (k) is selected based on the Schwarz criterion in the ADF test; ***, ** and * indicate rejection of the null hypotheses at the 1%, 5%, and 10% significance levels, respectively. The critical values are taken from MacKinnon [68] for the ADF and PP tests, respectively.
Table 4.
Lag Interval Tests.
| Information Criteria | ||||||
|---|---|---|---|---|---|---|
| Lag | LogL | LR | FPE | AIC | SC | HQ |
| 0 | 49.93246 | NA | 1.15 × 10⁻⁵ | −2.902951 | −2.010280 | −2.692664 |
| 1 | 103.2121 | 62.96688 | 2.29 × 10⁻⁷ | −6.928375 | −5.589368 | −6.612945 |
| 2 | 125.4650 | 20.22991 * | 8.78 × 10⁻⁸* | −8.133184 * | −6.347842 * | −7.712611 * |
* indicates lag order selected by the criterion, LR: sequential modified LR test statistic (each test at 5% level), FPE: Final prediction error, AIC: Akaike information criterion, SC: Schwarz information criterion, HQ: Hannan-Quinn information criterion.
Table 5.
VAR residual diagnostics, stability and cointegration tests results.
| Panel A: LM test for Serial Correlation a | Panel E: Johansen Cointegration Rank Test (Trace) | ||||||||
| Lags | LM-Statistic | P-value | Null hypothesis | Eigenvalue | Trace statistics | 0.05 Critical value | P-value | ||
| 1 | 14.576 | 0.103 | None * | 0.828983 | 48.91819 | 29.79707 | 0.0001 | ||
| 2 | 15.766 | 0.071 | At most 1 | 0.329521 | 10.06641 | 15.49471 | 0.2756 | ||
| 3 | 7.8435 | 0.550 | At most 2 | 0.056163 | 1.271634 | 3.841466 | 0.2595 | ||
| 4 | 11.096 | 0.26 | |||||||
| Panel B: Normality Test b | Panel F: Johansen Cointegration Rank Test (Maximum Eigenvalue) | ||||||||
| Statistic | d.f. | P-value | Null hypothesis: | Eigenvalue | Max-Eigen Statistic | 0.05 Critical value | P-value | ||
| Jarque-Bera | 12.065 | 6 | 0.060 | None * | 0.828983 | 38.85177 | 21.13162 | 0.0001 | |
| At most 1 | 0.329521 | 8.794780 | 14.26460 | 0.3036 | |||||
| At most 2 | 0.056163 | 1.271634 | 3.841466 | 0.2595 | |||||
| Panel C: Test for Heteroscedasticity c | |||||||||
| White | d.f. | P-value | |||||||
| Statistic | 112.16 | 114 | 0.531 | ||||||
| Panel D: Test for Stability d | |||||||||
| Modulus | Root | ||||||||
| 0.8784 | 0.856 − 0.196i | ||||||||
| 0.8784 | 0.856 + 0.196i | ||||||||
| 0.7198 | 0.610 − 0.381i | ||||||||
| 0.7198 | 0.610 + 0.381i | ||||||||
Notes: a The null of the LM Test is no serial correlation in residuals at lag of hth order; * denotes rejection of the hypothesis at the 0.05 level; b The Normality Test is the Urzua [71] system normality test, for this test the null states multivariate normality of the residuals; c The null for the White Heteroscedasticity Test claims that there is no cross terms of heteroscedasticity in the residuals; d VAR stability test results conclude that all roots of the characteristic polynomial are inside of the unit circle; stands for the Chi-square distribution; d.f. = degree of freedom.
Table 6.
Results of the long-run relationship.
| Panel: A | Panel: B | |||||||
|---|---|---|---|---|---|---|---|---|
| TT | MT | GH | GDP | Crd | Price | c | c1 | trend |
| ADF | C | −4.016 | 0.007 | 0.122 | −0.045 ** | 22.918 *** | 0.063 | |
| C/T | −4.734 | 0.037 | 0.113 * | −0.040 | 22.266 *** | 0.076 | −0.004 | |
| C/S | NA | Panel: C | ||||||
| Za | C | −20.374 | 0.115 *** | 0.188 *** | −0.286 *** | 21.140 *** | ||
| C/T | −21.225 | Panel: D | ||||||
| C/S | NA | F-stat | LM stat | White test | JB test | Ramsey RESET | ||
| Zt | C | −4.107 | 14.568 *** | 1.665 *** | 0.536 | 0.823 | 0.189 | |
| C/T | −4.269 | |||||||
Notes: C = model with level shift, C/T = model level shift with trend; C/S = model with regime shift; c = constant term, c1 = constant term after break point, trend is the coefficient of time trend; *, ** and *** stand for rejection of null at 10%, 5% and 1% significance level, respectively; TT = test type, MT = model type; F-stat = Pesaran’s F statistics for cointegration, LM stat = LM statistics for serial correlation; White test = p-value for White heteroscedasticity test, JB test = p-value for Jargue–Bera goodness of fit (normality) test, Ramsey RESET = p-value for Ramsey’s misspecification test.
© 2018 by the authors. Licensee MDPI, Basel, Switzerland. This article is an open access article distributed under the terms and conditions of the Creative Commons Attribution (CC BY) license (http://creativecommons.org/licenses/by/4.0/).
Share and Cite
MDPI and ACS Style
Mukhtarov, S.; Mikayilov, J.I.; Mammadov, J.; Mammadov, E. The Impact of Financial Development on Energy Consumption: Evidence from an Oil-Rich Economy. Energies 2018, 11, 1536. https://doi.org/10.3390/en11061536
AMA Style
Mukhtarov S, Mikayilov JI, Mammadov J, Mammadov E. The Impact of Financial Development on Energy Consumption: Evidence from an Oil-Rich Economy. Energies. 2018; 11(6):1536. https://doi.org/10.3390/en11061536
Chicago/Turabian StyleMukhtarov, Shahriyar, Jeyhun I. Mikayilov, Jeyhun Mammadov, and Elvin Mammadov. 2018. "The Impact of Financial Development on Energy Consumption: Evidence from an Oil-Rich Economy" Energies 11, no. 6: 1536. https://doi.org/10.3390/en11061536
Note that from the first issue of 2016, this journal uses article numbers instead of page numbers. See further details here.