An Assessment of the Sustainability of Lignocellulosic Bioethanol Production from Wastes in Iceland


Department of Industrial Engineering, Mechanical Engineering and Computer Science, University of Iceland, Hjardarhagi 6, 107 Reykjavik, Iceland
*
Authors to whom correspondence should be addressed.
Energies 2018, 11(6), 1493; https://doi.org/10.3390/en11061493
Submission received: 30 April 2018
/
Revised: 3 June 2018
/
Accepted: 4 June 2018
/
Published: 7 June 2018
(This article belongs to the Special Issue BioEnergy and BioChemicals Production from Biomass and Residual Resources)
Abstract
:This paper describes the development of a model to comprehensively assess the sustainability impacts of producing lignocellulosic bioethanol from various types of municipal organic wastes (MOWs) in Iceland: paper and paperboard, timber and wood and garden waste. The tool integrates significant economic, energy, environmental and technical aspects to analyse and rank twelve systems using the most common pretreatment technologies: dilute acid, dilute alkali, hot water and steam explosion. The results show that among the MOWs, paper and paperboard have higher positive rankings under most assessments. Steam explosion is also ranked at the top from the economic, energy and environmental perspectives, followed by the hot water method for paper and timber wastes. Finally, a potential evaluation of total wastes and bioethanol production in Iceland is carried out. The results show that the average production of lignocellulosic bioethanol in 2015 could be 12.5, 11 and 3 thousand tons from paper, timber and garden wastes, respectively, and that production could reach about 15.9, 13.7 and 3.7 thousand tons, respectively, by 2030.
1. Introduction
Negative social, political and environmental impacts of fossil fuels as well as energy security concerns have spurred interest in nonpetroleum energy sources [1]. Among the various alternative energy sources, biomass has garnered substantial interest because it is the only suitable and renewable primary energy resource that can provide alternative transportation fuels [2]. Bioethanol has long been put forward as the most promising biofuel used either as a sole fuel in cars with dedicated engines or as an additive in fuel blends, requiring no engine modifications until the mix reaches 30% [3].
The main feedstocks of bioethanol are sugar- and starch-based materials such as sugarcane and grains. However, there are considerable debates about the sustainability of such feedstocks. Lignocellulosic materials, a third group of feedstocks, represents the most viable option for bioethanol production. Increasing food demand and the need to feed an increasing global population could make conventional agricultural crops less competitive and more costly sources compared to lignocellulosic materials [4,5,6].
In this context, municipal organic wastes (MOWs) represent one of the most abundant lignocellulosic materials and acquires significant importance for bioethanol production. The replacement of biomass with MOW can provide environmental advantages, particularly with regard to waste management, carbon dioxide, quality and quantity control of water, land use and biodiversity [7]. However, the as yet immature technologies and challenging logistics for sourcing waste pose barriers to utilizing this potential source [4].
Based on these concepts, this paper focusses on bioethanol production from MOWs in Iceland. Iceland possesses no fossil energy resources, but in comparison to its population of 332,529, the country has huge amounts of hydroenergy and geothermal energy. Economic estimations of the country’s hydroelectric energy show that about 30 TWh/year may be harnessed, but only 15% is being used. Likewise, geothermal energy has been estimated at about 200 TWh/year, of which only 1% has been harnessed. Approximately 90% of buildings in Iceland are heated with geothermal water, and the aluminum and ferrosilicon industries are powered by hydroelectric energy, consuming 4.25 TWh/year. However, the transportation and fishing sectors are powered totally by imported fossil fuels [8]. Hence, utilization of biofuel can be useful as a sustainable mode for transitioning to green transportation and fishing infrastructure.
An overview of different Icelandic municipalities is shown in Figure 1a, the Capital area (pink), South peninsula (blue), South (yellow), West (purple), East (orange), Northeast (red), Eyjafjörður (turquoise), Northwest (brown) and Westfjords (green), [8]. Although Iceland is large by land mass, more than 60% of the population lives in the capital area and about 80% live in the capital and south regions combined (Figure 1b). However, the capital area occupies only 1% of the total area of Iceland (Figure 1c). This is due to the development of urbanization in this location, poor climate and geographical conditions in other regions and slow and expensive transportation.
Climate and weather conditions are more likely to limit farming in Iceland than soil type [9,10]. Even though arable land is available, vast portions of the areas with suitable soil type have climate and weather unsuitable for vegetation growth. In fact, the crop growth window in Iceland is 130 days in the summer (7 May to 15 September). Thus, the only products that can be developed must have a growing time within this period and the temperature required for growth must be compatible with the environment temperature (5–7 °C). This situation means that grasses turn green and tillage can be performed, but little else is grown [9,11].
Based on these conditions, biofuel production efforts in Iceland should focus on MOW as part of the second-generation biomasses. Despite lack of agricultural crops, waste is recognized as a continual source of biomass and is independent of climate conditions and other immutable factors. Furthermore, because the amounts of various wastes produced in different locations are fairly constant and measurable, reasonable estimation of biofuel production capacity should be possible.
To establish sustainable bioethanol production plans, they should be evaluated from different sustainable development perspectives and compared based on different initial feedstocks and applied conversion technologies. Sustainable production scenarios of bioethanol depend on economic, technical, environmental, social and political factors as well as energy balance and are essential elements of sustainable development [12]. The authors are not aware of any published studies assessing bioethanol production systems based on the sustainable development dimensions in Iceland. Therefore, the goals of this study are: (i) to assess 1-ton bioethanol production using three different Icelandic MOWs: paper and paperboard, timber and wood and garden waste; (ii) to develop a model based on energy and material flows to assess the economic (cost and benefit), energy (energy balance, total input/output energy and energy use efficiency) and environmental (GHG emissions, water consumption and supply rate) sustainability criteria; (iii) to analyse and compare the sustainable impacts of different biomass-derived bioethanol, pretreatments and conversion technologies; and (iv) to evaluate the potential of total waste and bioethanol production in Iceland between 2015 and 2030.
2. System Description
The system considered by the model including all the process steps from resources to end products (see Figure 2).
2.1. Resource Level
Paper and paperboard, timber and wood and garden waste are considered as the main input resources. According to Icelandic law, all municipalities are obligated to have a waste management plan to organize waste produced in the municipality. Thus, beginning in 2004, common project management groups were established to plan for waste produced in the main municipality parts of Iceland: Western Iceland (pink), Suðurnes (green), the Capital Area (purple) and Southern Iceland (orange) (Figure 1d) [13]. Waste collection and treatment in these places are mostly operated by four Icelandic companies (Table 1).
About 90% of the wastes generated are related to the capital area and are collected by the Íslenska Gámafélagið and Sorpa companies [14,15]. Due to the low number of inhabitants in Iceland, there is limited economic basis for recycling facilities like paper mills. Plastics and paper items are thus shipped abroad, as there is no facility in Iceland to recycle and reuse them. At present, landfilling and incineration are the dominant methods used for the disposal of municipal solid waste in Iceland, and most landfill sites are open dumping areas, which poses serious environmental and social threats. Moreover, the flue gas from waste incineration can contaminate the environment if not handled with appropriate technologies, such as using combined heat and power (CHP) [16] and flue gas cleaning systems. A small incinerator in Skutulsfjörður at Northwest Iceland resulted in the discovery of cancerous and toxic chemicals in Icelandic meat and milk in 2011 [17]. Dioxin levels in the fly-ash from the nearby incinerator were more than 20 times the EU limits [17]. Moreover, soil and incinerator emissions measurements at several sites in Iceland such as Kirkjubaejarklaustur revealed that emissions were 85 times the EU limits [6,18]. These problematic findings resulted in the widespread testing of soil across Iceland [17], shutdown of several incinerators [18], withdrawal of some Icelandic meat and milk from the markets and culling of all the livestock on the farms impacted [17]. In an attempt to reduce these problems, this study considers diverting paper and paperboard, timber and wood and garden waste as portions of MOW from the waste companies (mostly Sorpa) before they are burnt in incinerators. These materials could then be transferred to preprocessing units and conversion plants to produce bioethanol. Lignocellulosic bioethanol is proposed as a viable alternative to MOWs treatment, and may solve the problems of using huge amounts of land for landfill and high emissions from incineration.
In addition, energy, water, labor, chemicals and machinery are considered accessory inputs. Diesel fuel is used by trucks for transportation and electricity is consumed in driving force and heat generation in process units. It has been reported that 25% and 75% of electricity production in Iceland comes from geothermal and hydropower, respectively. Thus, hydro is currently Iceland’s main source of clean energy; however, the electricity required in the capital area, as the largest producer of waste, is supplied by geothermal power plants in Hellisheiði and Nesjavellir [19].
2.2. Transport Level
In this study, the transport step includes waste transport from waste operator companies to preprocessing units. As pretreatment plants and bioethanol production centres should be next to each other, transportation of the liquid containing cellulose from preparation facilities to bioethanol production units is not included.
2.3. Pretreatment Level
Lignocellulosic materials are composed of cellulose, hemicelluloses and lignin in an intricate structure which is resistant to decomposition. One of the best strategies to convert such biomass into sugars is enzymatic saccharification due to its low energy requirement and comparatively smaller environmental impact; however, the main problem is the low accessibility of cellulose because of the rigid association of cellulose with lignin [22,23]. Therefore, removal of lignin, making cellulose more accessible to enzymatic hydrolysis for conversion, is the primary pretreatment process investigated herein.
Pretreatment techniques are mainly classified as physical (e.g., grinding and milling), chemical (e.g., alkali, acid, ammonia percolation), physio-chemical (e.g., steam explosion, ammonia fiber expansion) and biological (e.g., fungi and Actinomycetes) [24,25]. Most of these technologies are not preferred for industrial applications due to high energy demand, inability to remove lignin and substantial chemical requirements. Among the pretreatment techniques, dilute acid (DA), dilute alkali (DAL), hot water (HW) and steam explosion (SE) are modeled in this study and are among the most effective and the most promising for industrial applications [23,25,26].
Dilute acid pretreatment is one of the most frequently employed methods of structurally breaking down lignocellulosic biomass and removing the hemicellulose [27]. During this method, biomass is treated at different combinations of temperatures (100–290 °C), at a pressure of 1.5 bar [28], with residence times ranging from a few seconds to several hours. During hydrothermal pretreatment, most of the hemicellulose is hydrolyzed to sugar monomers and becomes soluble, a fraction of cellulose is depolymerized into glucose and a fraction of lignin is dissolved and distributed.
Dilute alkali pretreatment refers to the application of alkaline solutions such as NaOH, Ca(OH)2 or ammonia to remove lignin and a part of the hemicellulose, increasing the accessibility of enzymes to the cellulose. Pretreatment can be performed at low temperatures but with a relatively long residence time and high base concentration [23,24,29].
In the hot water pretreatment method, water under high pressure penetrates the biomass, hydrating the cellulose and removing the hemicellulose and part of the lignin. The method’s major benefits are that is does not require chemicals or corrosion-resistant materials for the hydrolysis reactors. Moreover, feedstock size reduction is a highly energy demanding operation for the huge bulk of materials, while there is no need for size reduction in HW pretreatment [23,30].
Among the physico-chemical processes, steam explosion has received considerable attention as a pretreatment for ethanol production. In steam explosion, the pressure is suddenly reduced, causing the materials to undergo explosive decompression. High pressure and high temperature (160–260 °C) are used in steam explosion for a few seconds to several minutes [23,31]. The process has been used in lab and pilot-scale units by several research groups. Moreover, steam explosion has been found effective on feedstock with large particle sizes, thus reducing the energy required for size reduction, and it can satisfy all the requirements of the pretreatment process [24].
2.4. Bioethanol Production Level
After the pretreatment step, the hydrolyzed stream goes to the saccharification and fermentation plants. First, cellulase enzymes are formed in the fermentation reactor and then the cellulase enzymes are moved to the saccharification reactor, where sugars are formed. Nutrient loadings and the efficiencies of the fermentation sugar conversion (95% for glucose, 85% for xylose and arabinose) are based on the National Renewable Energy Laboratory (NREL) process [32]. At the next step, the enzymes are recycled back to the cellulose reactor and the sugars are sent to a fermentation reactor, where ethanol is produced. The ethanol is then purified by distillation and dehydration in the ethanol recovery unit and then sent to product storage. Bottom effluent from this column contains mostly lignin from biomass and can be combusted using a combined burner, boiler and turbo-generator to produce electricity; while this electricity can be used to supply the ethanol plant, selling this byproduct is considered in our study.
3. Model Description and Data
This paper assessed the lignocellulosic bioethanol supply chain (LBSC) shown schematically in Figure 2. The supply chain consists of five layers: resources, transport, pretreatment, bioethanol production and outputs. The model equations and constraints were structured based on the LBSC flow diagram and they represent the material and energy flows from resources to products. The constraints of the model were described from use sectors back to the resources. This approach reflects the basic concept of the model, which is based on a demand-oriented analytical tool. This approach stresses the point that balance of demand and supply ought to be ascertained [33,34,35].
3.1. Bioethanol Production Level
Supply and demand balance is a characteristic of the model and it is guaranteed through the demand constraint expressed by Equation (1) [35]:
where Dbe is demand for bioethanol and is exit bioethanol flow from the fermentation unit [36].
The following equation ensures the balance between inputs and outputs of the bioethanol production step:
Equation (2) is a constraint which shows that the total amount of bioethanol produced from technology τC equals the amount of liquid delivered to the refinery from the pretreatment step, multiplied by the associated energy conversion efficiencies of the fermentation and dehydration units,
and
[36].
The quantity of lignin as a byproduct of fermentation is based on inequity expressed by Equation (3):
However, in addition to the fermentation step, the amount of lignin production is dependent on the type of method used for pretreatment.
represents the lignin produced from cellulose to bioethanol conversion technology,
is the biomass type b delivered to the preparation unit, xb,bp is the percent lignin for different biomasses, and
,
are lignin removal efficiencies for different pretreatment techniques and conversion steps, respectively.
3.2. Pretreatment Level
The balance between the inputs and outputs of the preparation step is guaranteed by the constraint expressed by Equation (4):
This equation indicates that the total amount of liquid containing cellulose extracted under pretreatment processes should equal the amount of feedstock transported to the plant, multiplied by the performance efficiency associated with different pretreatment technologies (
) [36].
3.3. Transport Level
The mass balance of transportation level is given by Equation (5):
where XA,b is the amount of biomass type b shipped from the harvesting facility to the biorefinery plant via transportation mode τT; is the fraction of biomass type b lost through transportation; and
represents the total amount of delivered biomass type b entering the pretreatment units [37].
3.4. Resource Level
The mass balance for the feedstocks production step is given by Equation (6):
where XA,b is the amount of waste feedstock type b that is bought from waste operators; this amount must be equal to or lower than the total waste collected by various waste companies (XR,b), taking into account as the percentage availability of wastes.
Finally, the feasibility of biomass type b is ensured by the constraint expressed by Equation (7):
This equation states that the total amount of collected waste of type b (XR,b) must be lower than the total amount of generated resource type b (X0,R,b).
3.5. Total Material and Machinery Consumption
The total quantity of different required chemicals (CBb−be) and machinery (Mb−be) are calculated based on Equations (8) and (9):
where
is the flow to each level L.
is the specific consumption of chemical type i (sulphuric acid, Ca hydroxide, Diammonium phosphate (DAP), cellulose, yeast) and
is the specific consumption of machinery type i required for technology τL in level L. The specific consumption of different chemicals for various bioethanol production systems is shown in Table 2 [24].
3.6. Potential of Bioethanol Production
The total potential of bioethanol production from various types of waste () is calculated by using the total amount of produced waste type b (XA,b) and the yield of bioethanol for various feedstocks (yb−be) [8]:
3.7. Modeling of Sustainability Indicators
In this section, an assessment model is presented that evaluates the sustainability impacts in the bioethanol supply chain. In the initial stages of the study, we reviewed several primary indicators considered in [35,38,39], as well as reviewing other research works [40,41]. Finally, by consulting several studies on the energy sector, we organized five significant sustainability indicators by considering economic, energy, and environmental dimensions that cover most of the aspects mentioned by other literature on this topic.
3.7.1. Economic Indicators
Total production cost, which is the most significant economic impact for economic evaluation of bioethanol systems, is estimated by Equation (11) [35]:
This equation includes fixed and variable setup costs for biomass type b for different supply levels of biomass production, transportation, preparation and conversion costs.
Equation (12) presents the benefit per cost (BPC), which is the ratio between sales income (from produced bioethanol and lignin) and total production costs throughout the entire bioethanol supply chain. The input costs, including capital and operational costs, and output prices for bioethanol production are provided in Table 3 [24,42,43,44]:
3.7.2. Energy Indicators
All stages of the bioethanol production process are based on the consumption of specific sources; therefore, to properly assess energy inputs and outputs, it is necessary to convert all inputs and outputs into their energy equivalents. The energetic efficiency of the bioethanol system is evaluated by the energy ratio between outputs and inputs as shown in Equation (13) [35,45]:
where bioethanol and lignin are considered as output energies and water, fuel, power, chemicals and machinery demand energy input type in in supply level L for bioethanol production
). A comprehensive inventory of various inputs for the whole system, based on the studied pretreatment methods, is gathered with the energy coefficients for all inputs (ecin) in Table 4 [24,45].
3.7.3. Environmental Indicators
Greenhouse gas (GHG) emissions are one of the most significant environmental indicators, representing the emissions of the major greenhouse gases (CO2, CH4 and NO2) during the unit life cycle. In this study, total GHG emissions over the bioethanol production cycle is calculated by Equation (14) [35]:
where
is the required input type in for bioethanol production from biomass b in level L based on technology τL, and efin are the CO2 emission factors for different inputs; this factor is considered 2.76 kgCO2eq/L and 0.058 kgCO2eq/kWh for diesel fuel and electricity generated from geothermal, respectively. Moreover, during fermentation, sugars are converted to ethanol and carbon dioxide. Approximately, 720 kg CO2 is produced per ton of bioethanol produced [21,46,47]. Firstly, in hydrolysis the cellulose is converted into glucose sugars. Then, sugars are converted to ethanol and carbon dioxide [48].
To facilitate a fair comparison between bioethanol systems, water used over the entire system (Wb−be) is measured by the water consumption indicator expressed by Equation (15) [35]:
where
is the exit flow from level L based on technology type τL and is the specific water consumption for each level and technology (which are given in Table 2).
4. Results and Discussion
4.1. Economic Assessment
The model results for the 12 alternatives, ranked according to their contribution to production costs and benefit per cost for 1 ton of bioethanol produced, are shown in Figure 3. This ordering is based on total production cost, which is between 1300 and 2700 $/ton, which are the highest and lowest economically beneficial options, respectively. Moreover, the coloured portions of each bar on the chart indicate the percentage impact of each type of cost for different bioethanol supply levels (BC: biomass cost, TC: transportation cost, CC: conversion cost including pretreatment, fermentation and dehydration costs). Obviously, TC is much lower than the other levels and hence is not shown clearly in Figure 3.
Among the studied wastes, paper and paperboard rank the highest economically; the average total cost of bioethanol production from timber and wood and garden waste is 1.2 and 1.9 times that of paper, respectively. Actually, the higher cellulose percent in lignocellulosic materials means more bioethanol yield can be obtained. In contrast, for a specific amount of bioethanol production, a lower feedstock with a high percentage of cellulose is required. The cellulose percentage of paper, timber and garden wastes are approximately 55%, 45% and 30%, respectively [49,50]. Thus, paper waste is the richest in cellulose and thus has the minimum feedstock requirements for 1 ton of produced bioethanol (Figure 4). Subsequently, this option has the lowest percentage of costs from biomass and transportation due to the lower amount of required feedstock and the higher bioethanol yield. In this way, the costs of waste purchase and transportation for timbers and garden wastes are approximately 1.20 and 1.85 times that for paper.
As seen in Figure 4, the bioethanol system derived from paper via steam explosion (SE,P) significantly outranks all other systems from the viewpoint of BPC, owing to the favorable results obtained in the economic sector. Although the ethanol yields for steam explosion were relatively low (0.39, 0.32 and 0.21 Lbe/tonb for paper, timber and garden wastes, respectively) due to the comparatively low efficiency of cellulose hydrolysis, it has the lowest capital costs because of the high solid loading assumptions during pretreatment and hydrolysis processes. Furthermore, no chemicals are required for SE pretreatment and it requires the lowest amounts of steam and electricity for its various processes.
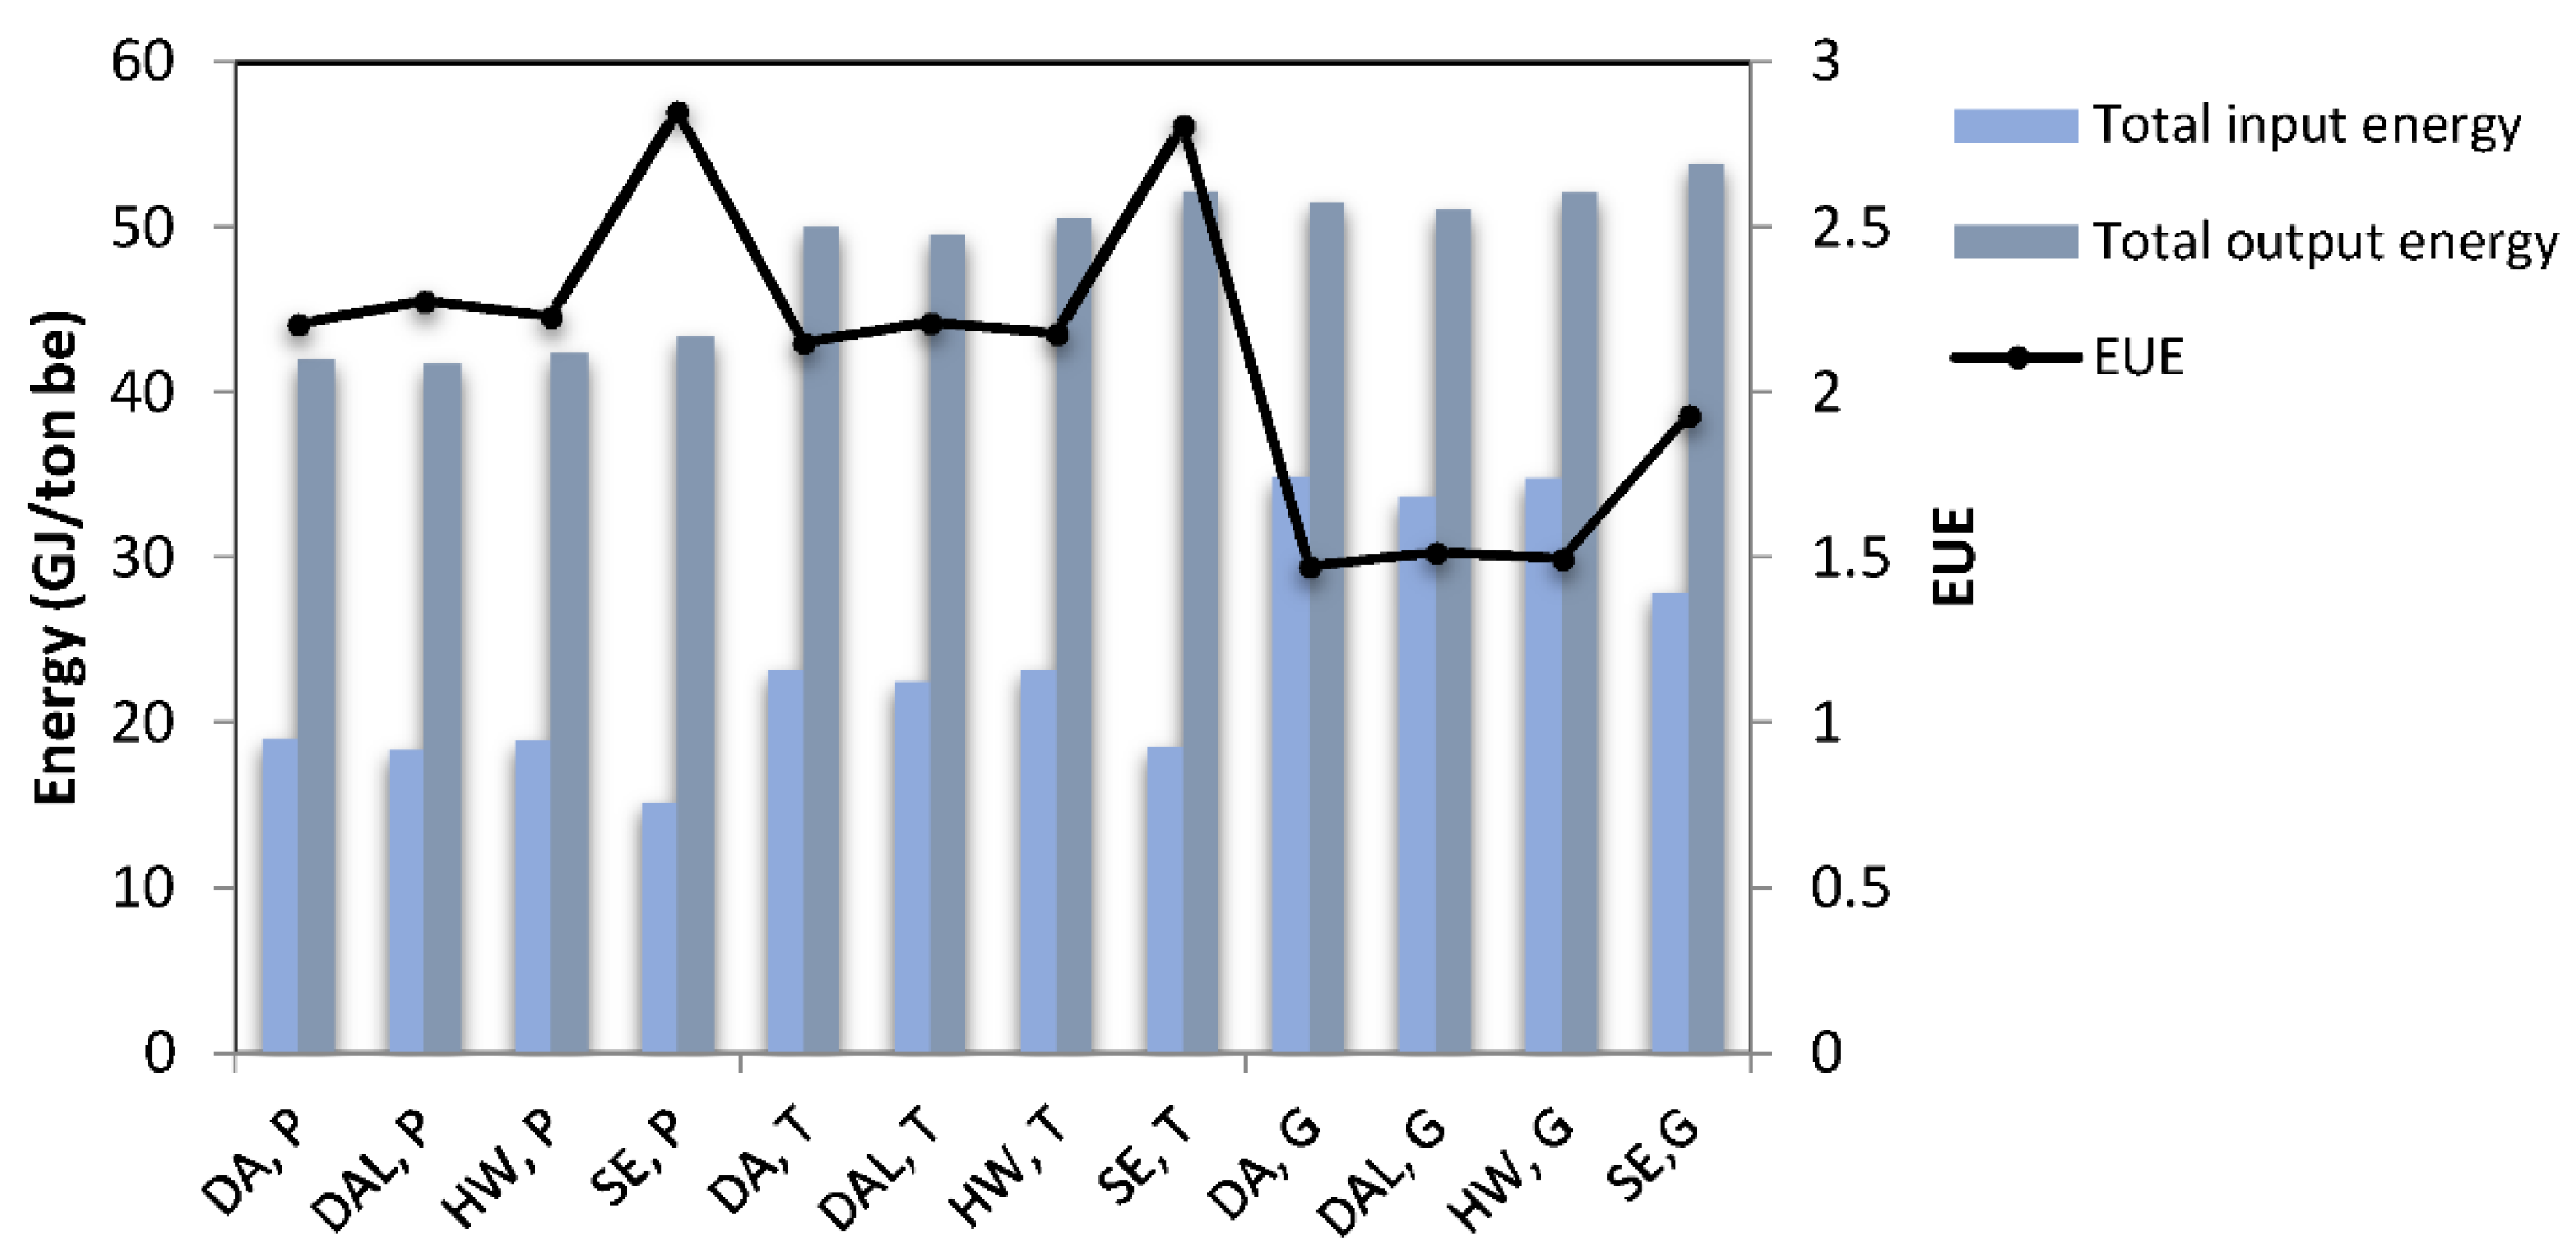
4.2. Energy Assessment
Total input energy, total output energy and energy ratio between outputs and inputs (EUE) for 1 ton of bioethanol produced are shown in Figure 5. The total output energy for various feedstocks includes the energy content in 1 ton of bioethanol and lignin production. Obviously, due to the higher required amount of timber and garden waste, more lignin is produced. Significantly, the system based on steam explosion and paper ranks the highest among all the systems in terms of energy. This is because no chemicals except water are required in SE and the smallest amount of steam is consumed during this process. On the contrary, the dilute acid method, which requires 1.08 and 1.6 times the amounts of heat and electricity required for SE, also has the highest usage of chemicals and is ranked lowest energetically.
4.3. Environmental Assessment
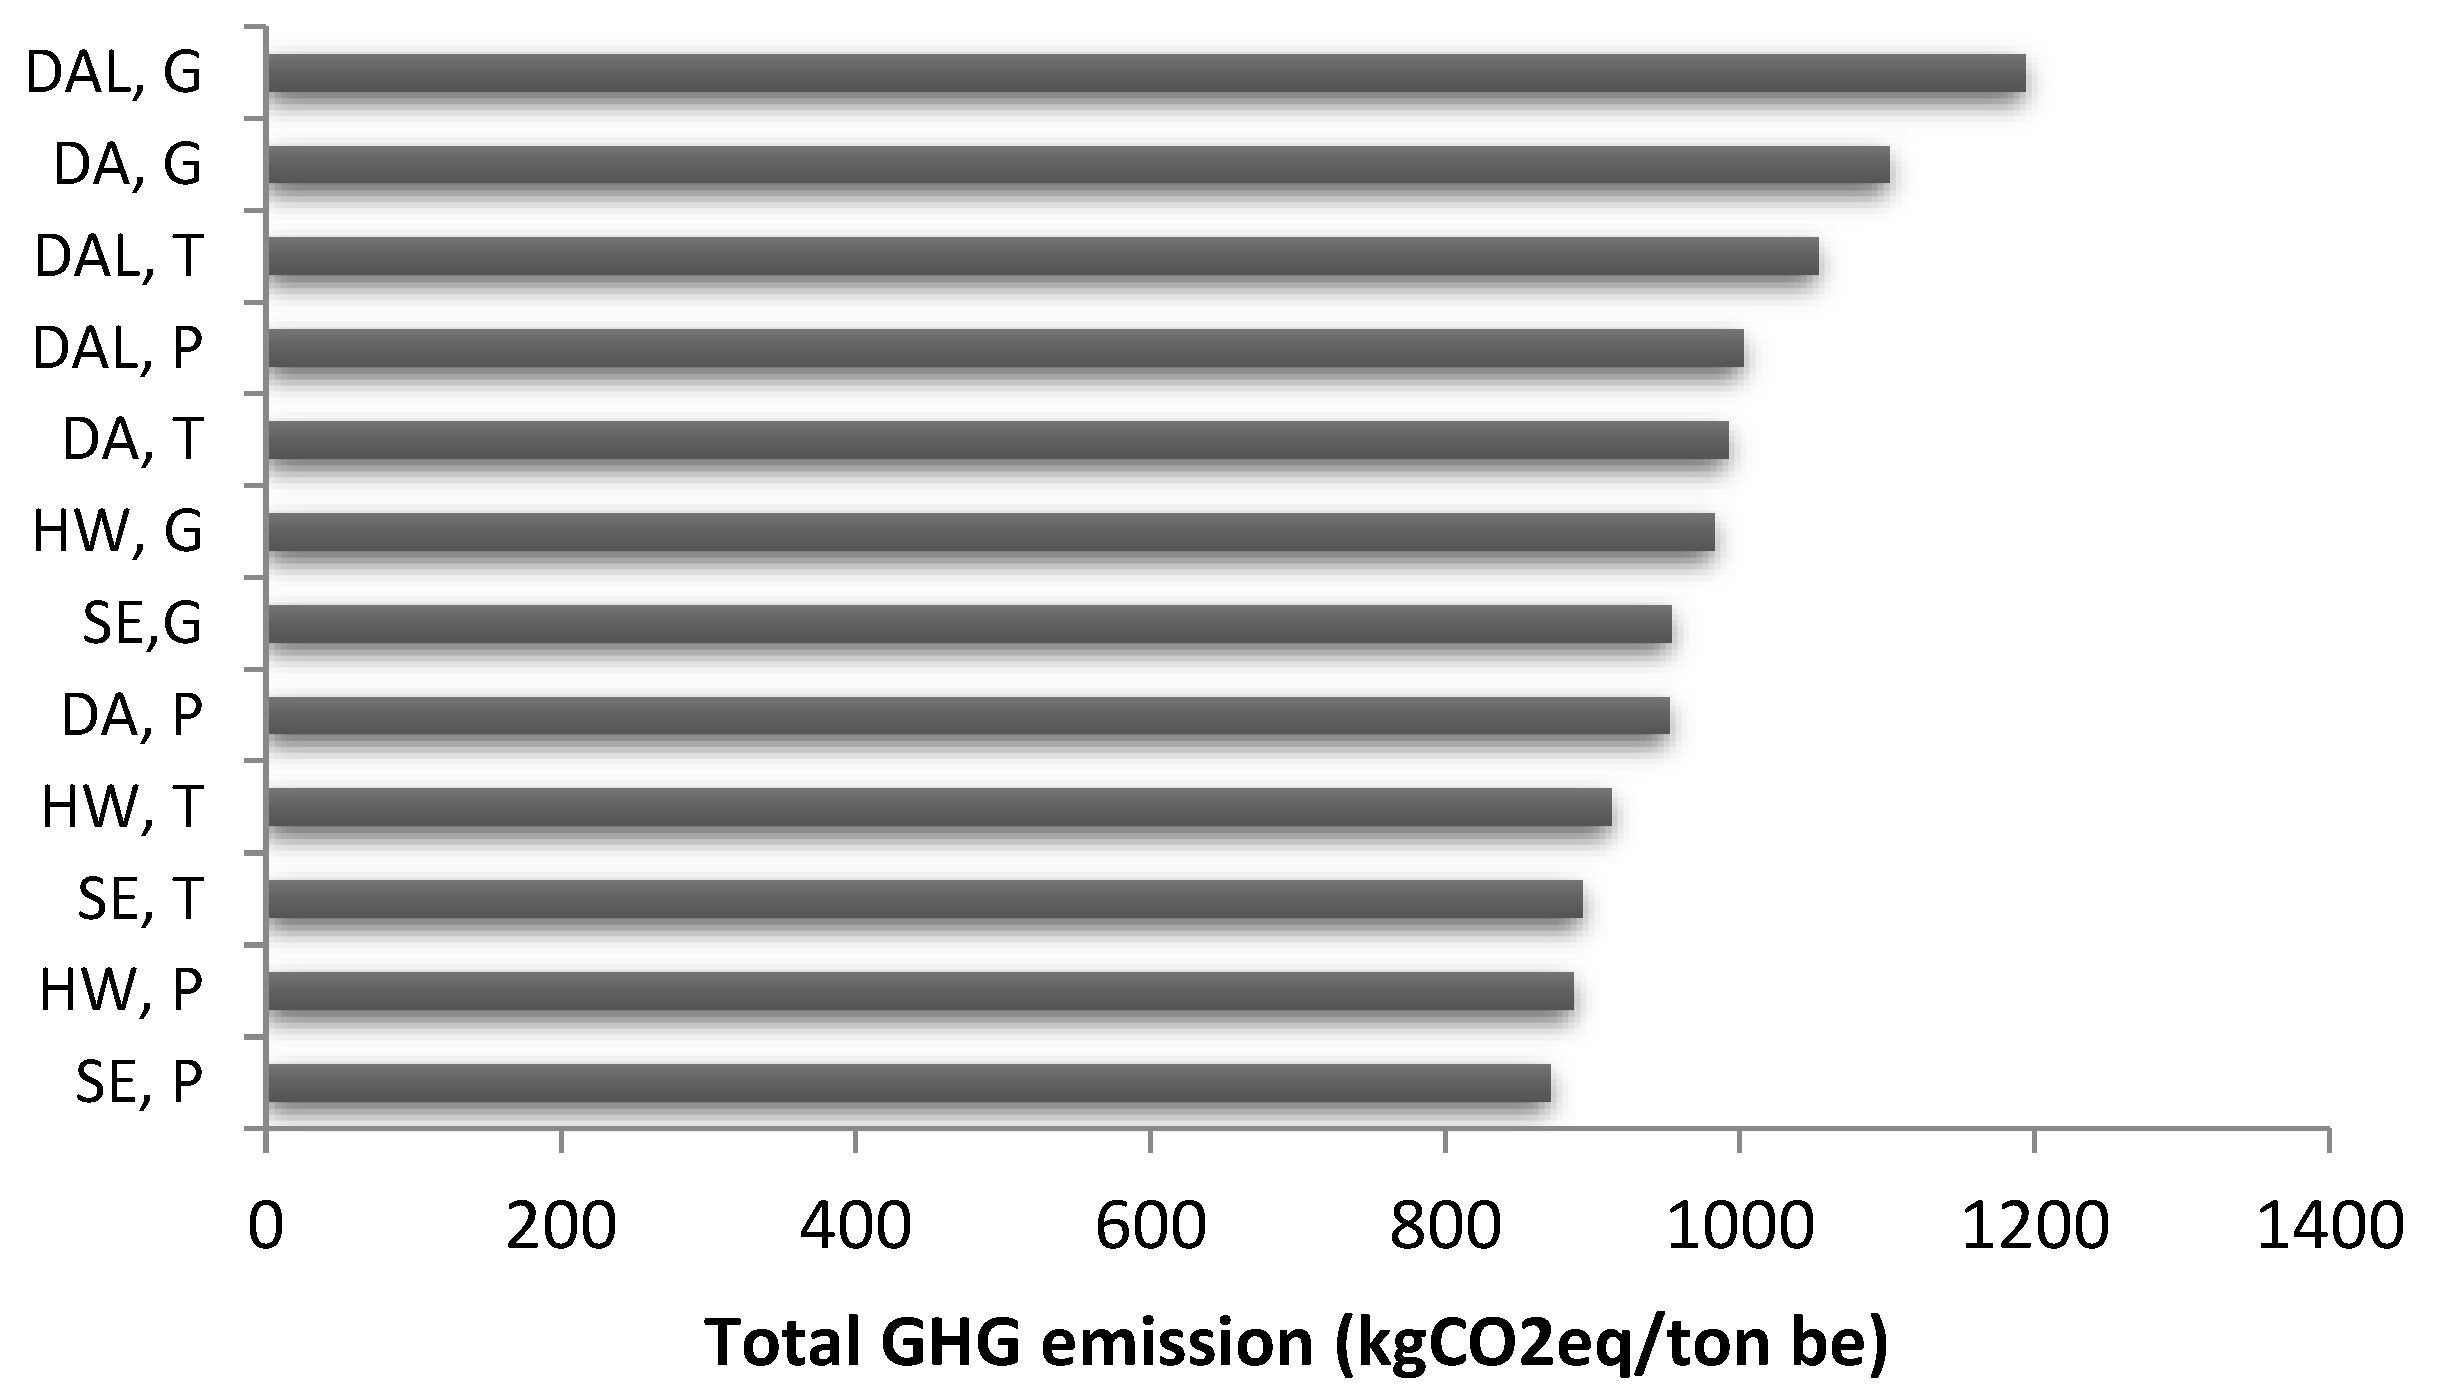
Figure 6 ranks all the studied bioethanol systems with regard to their contribution to environmental development. This ordering is based on total GHG emission, which is lowest for the steam explosion and hot water processes (about 880 kgCO2eq/ton). The environmental impact of SE and HW are additionally limited because few chemical agents are used in these methods.
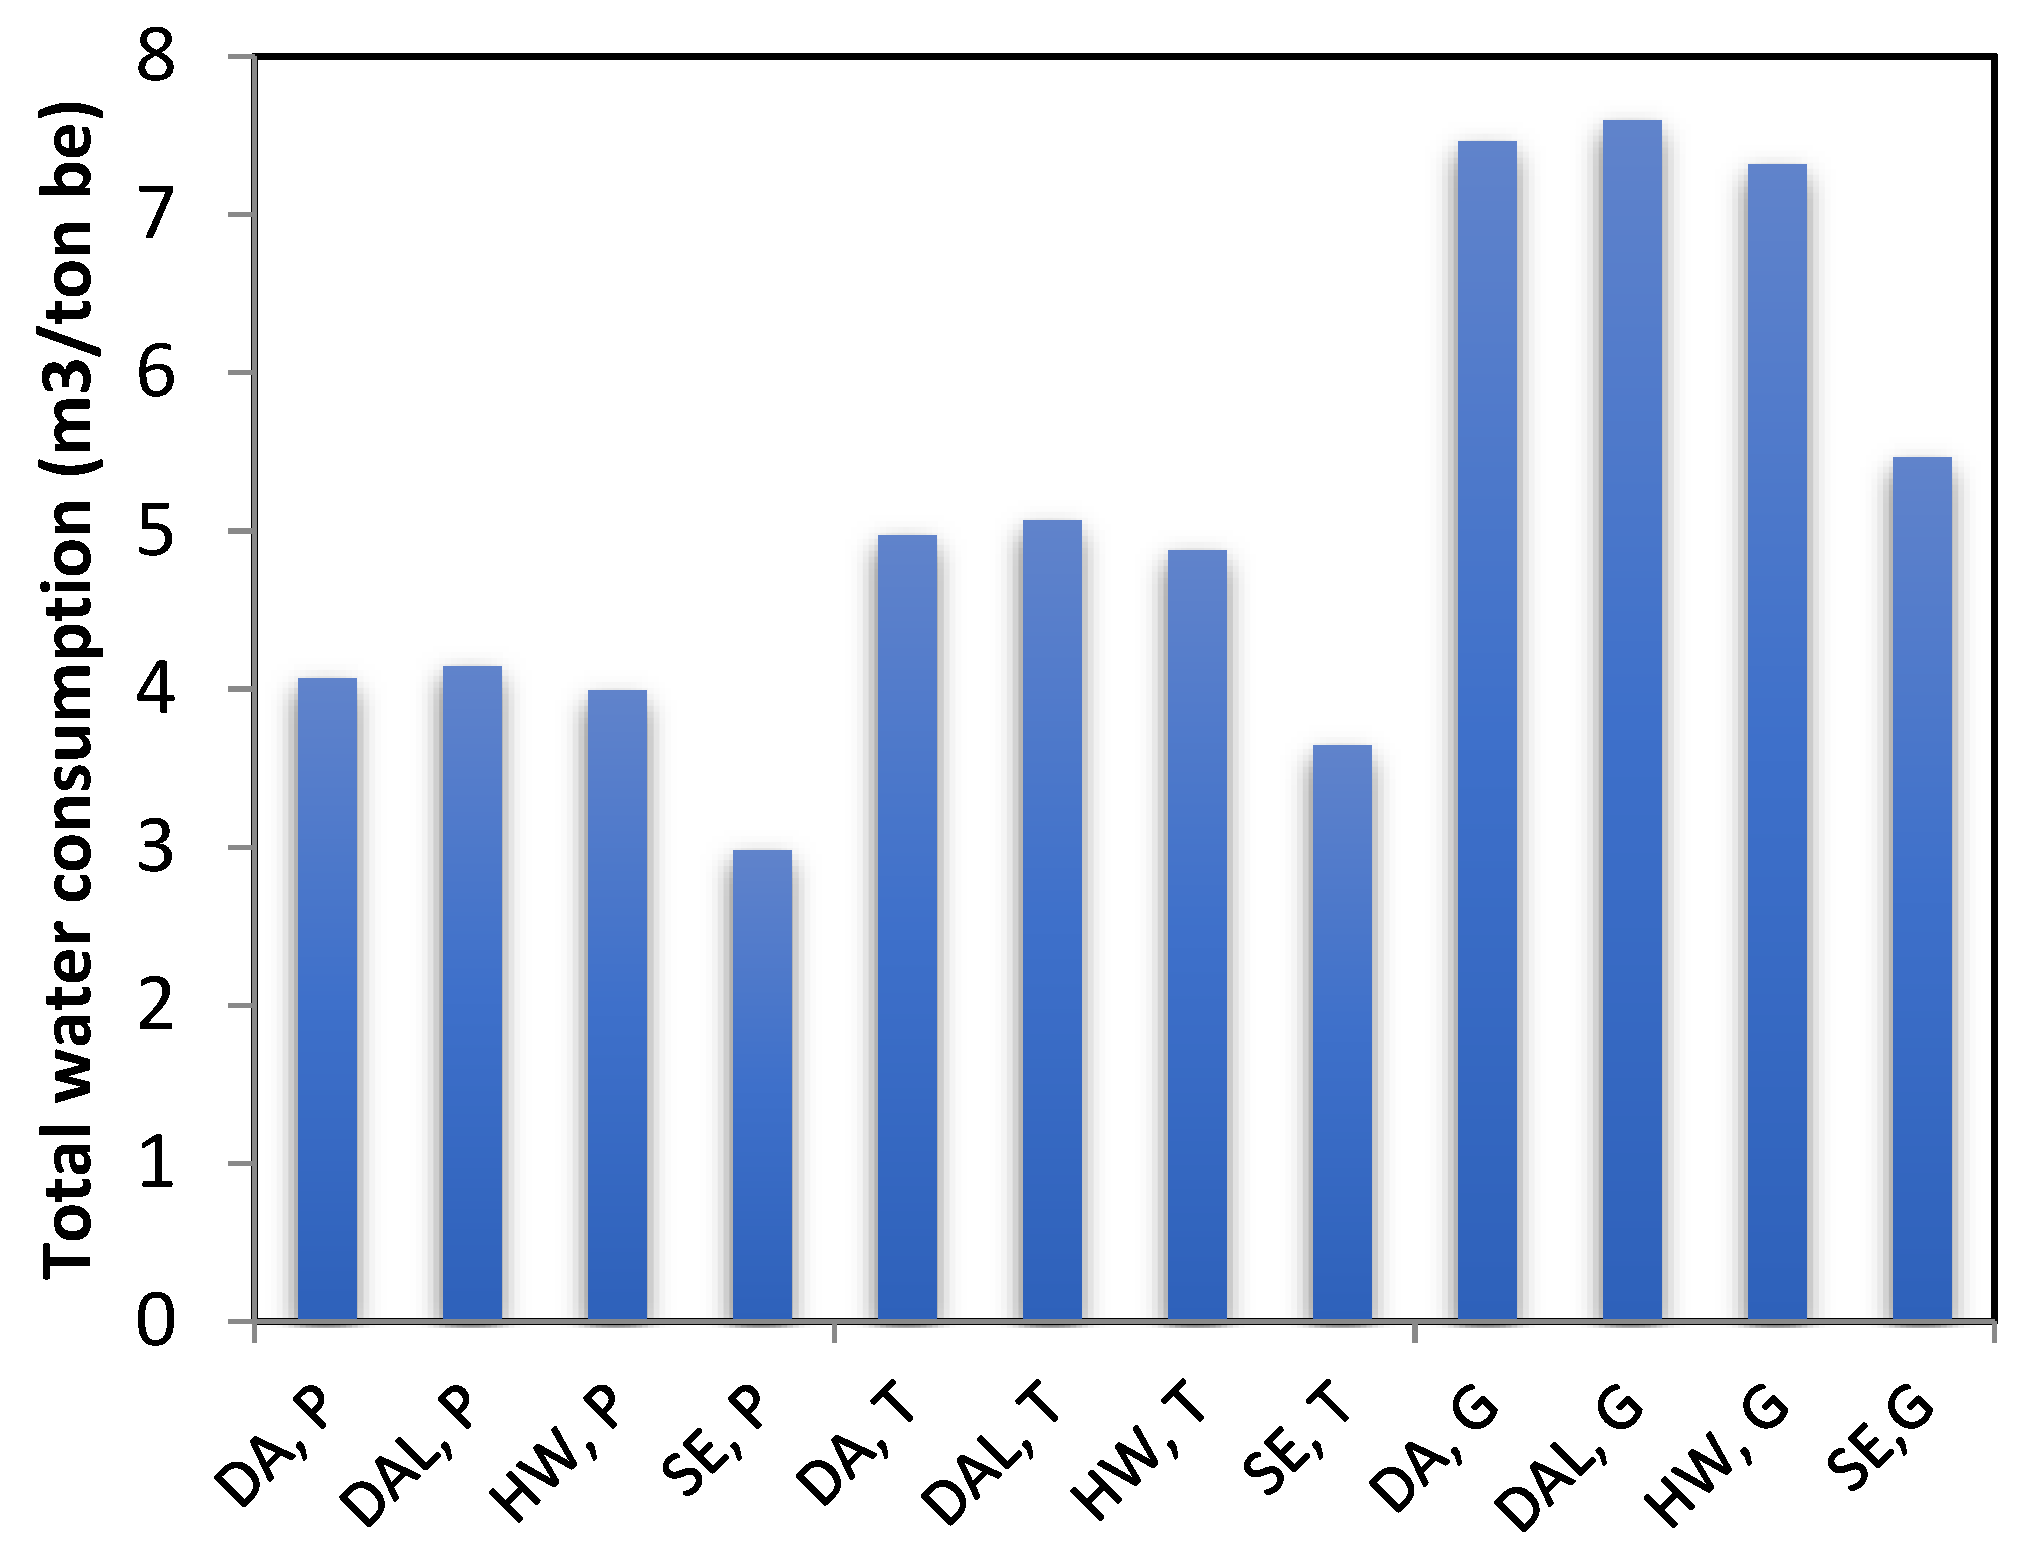
Figure 7 shows total water consumption over the entire waste-to-bioethanol process for all the production options. The systems based on steam explosion and paper and timber have the lowest water use, 2.98 and 3.64 m3/ton, respectively. According to Kumar and Murthy [24], the amount of water required for cooling is lowest for the steam explosion process (401.4 kg/L of ethanol) due to higher solid loading, which decreases the flow rates of streams and energy consumption for cooling. Moreover, bioethanol systems based on dilute alkali and dilute acid for garden wastes require the maximum amounts of water. Obviously these systems would not be practical for regions lacking sufficient available water resources.
4.4. Potential of Bioethanol Production
The potential of different wastes and bioethanol production between 2015 and 2030 are shown in Figure 8. The data presented here are drawn from [8]. The main sources of paper and paperboard waste that are suitable for bioethanol production are newspapers, magazines and packaging waste. In addition, the main sources of timber waste are timber from construction, demolition work, packaging waste and pallets. Garden waste can be also defined as grass, branches and other garden waste.
The total amount of paper, timber and garden wastes in Iceland in 2015 can be estimated as approximately 37, 40 and 16 thousand tons, respectively, and they can estimated to increase to about 47, 49 and 20 thousand tons by 2030 assuming 0.8%, 0.6% and 0.6% growth rate per capita, respectively.
Furthermore, Figure 8 shows predictions of ethanol production from various feedstocks. This calculation is based on the average yield of bioethanol production (Equation (10)) calculated as 339, 277 and 185 (kgbe/tonb) for paper, timber and garden wastes, respectively. The average potential of bioethanol production in Iceland in 2015 was thus approximately 12.5, 11 and 3 thousand tons from paper, timber and garden wastes, respectively, which may reach about 15.9, 13.7 and 3.7 thousand tons by 2030.
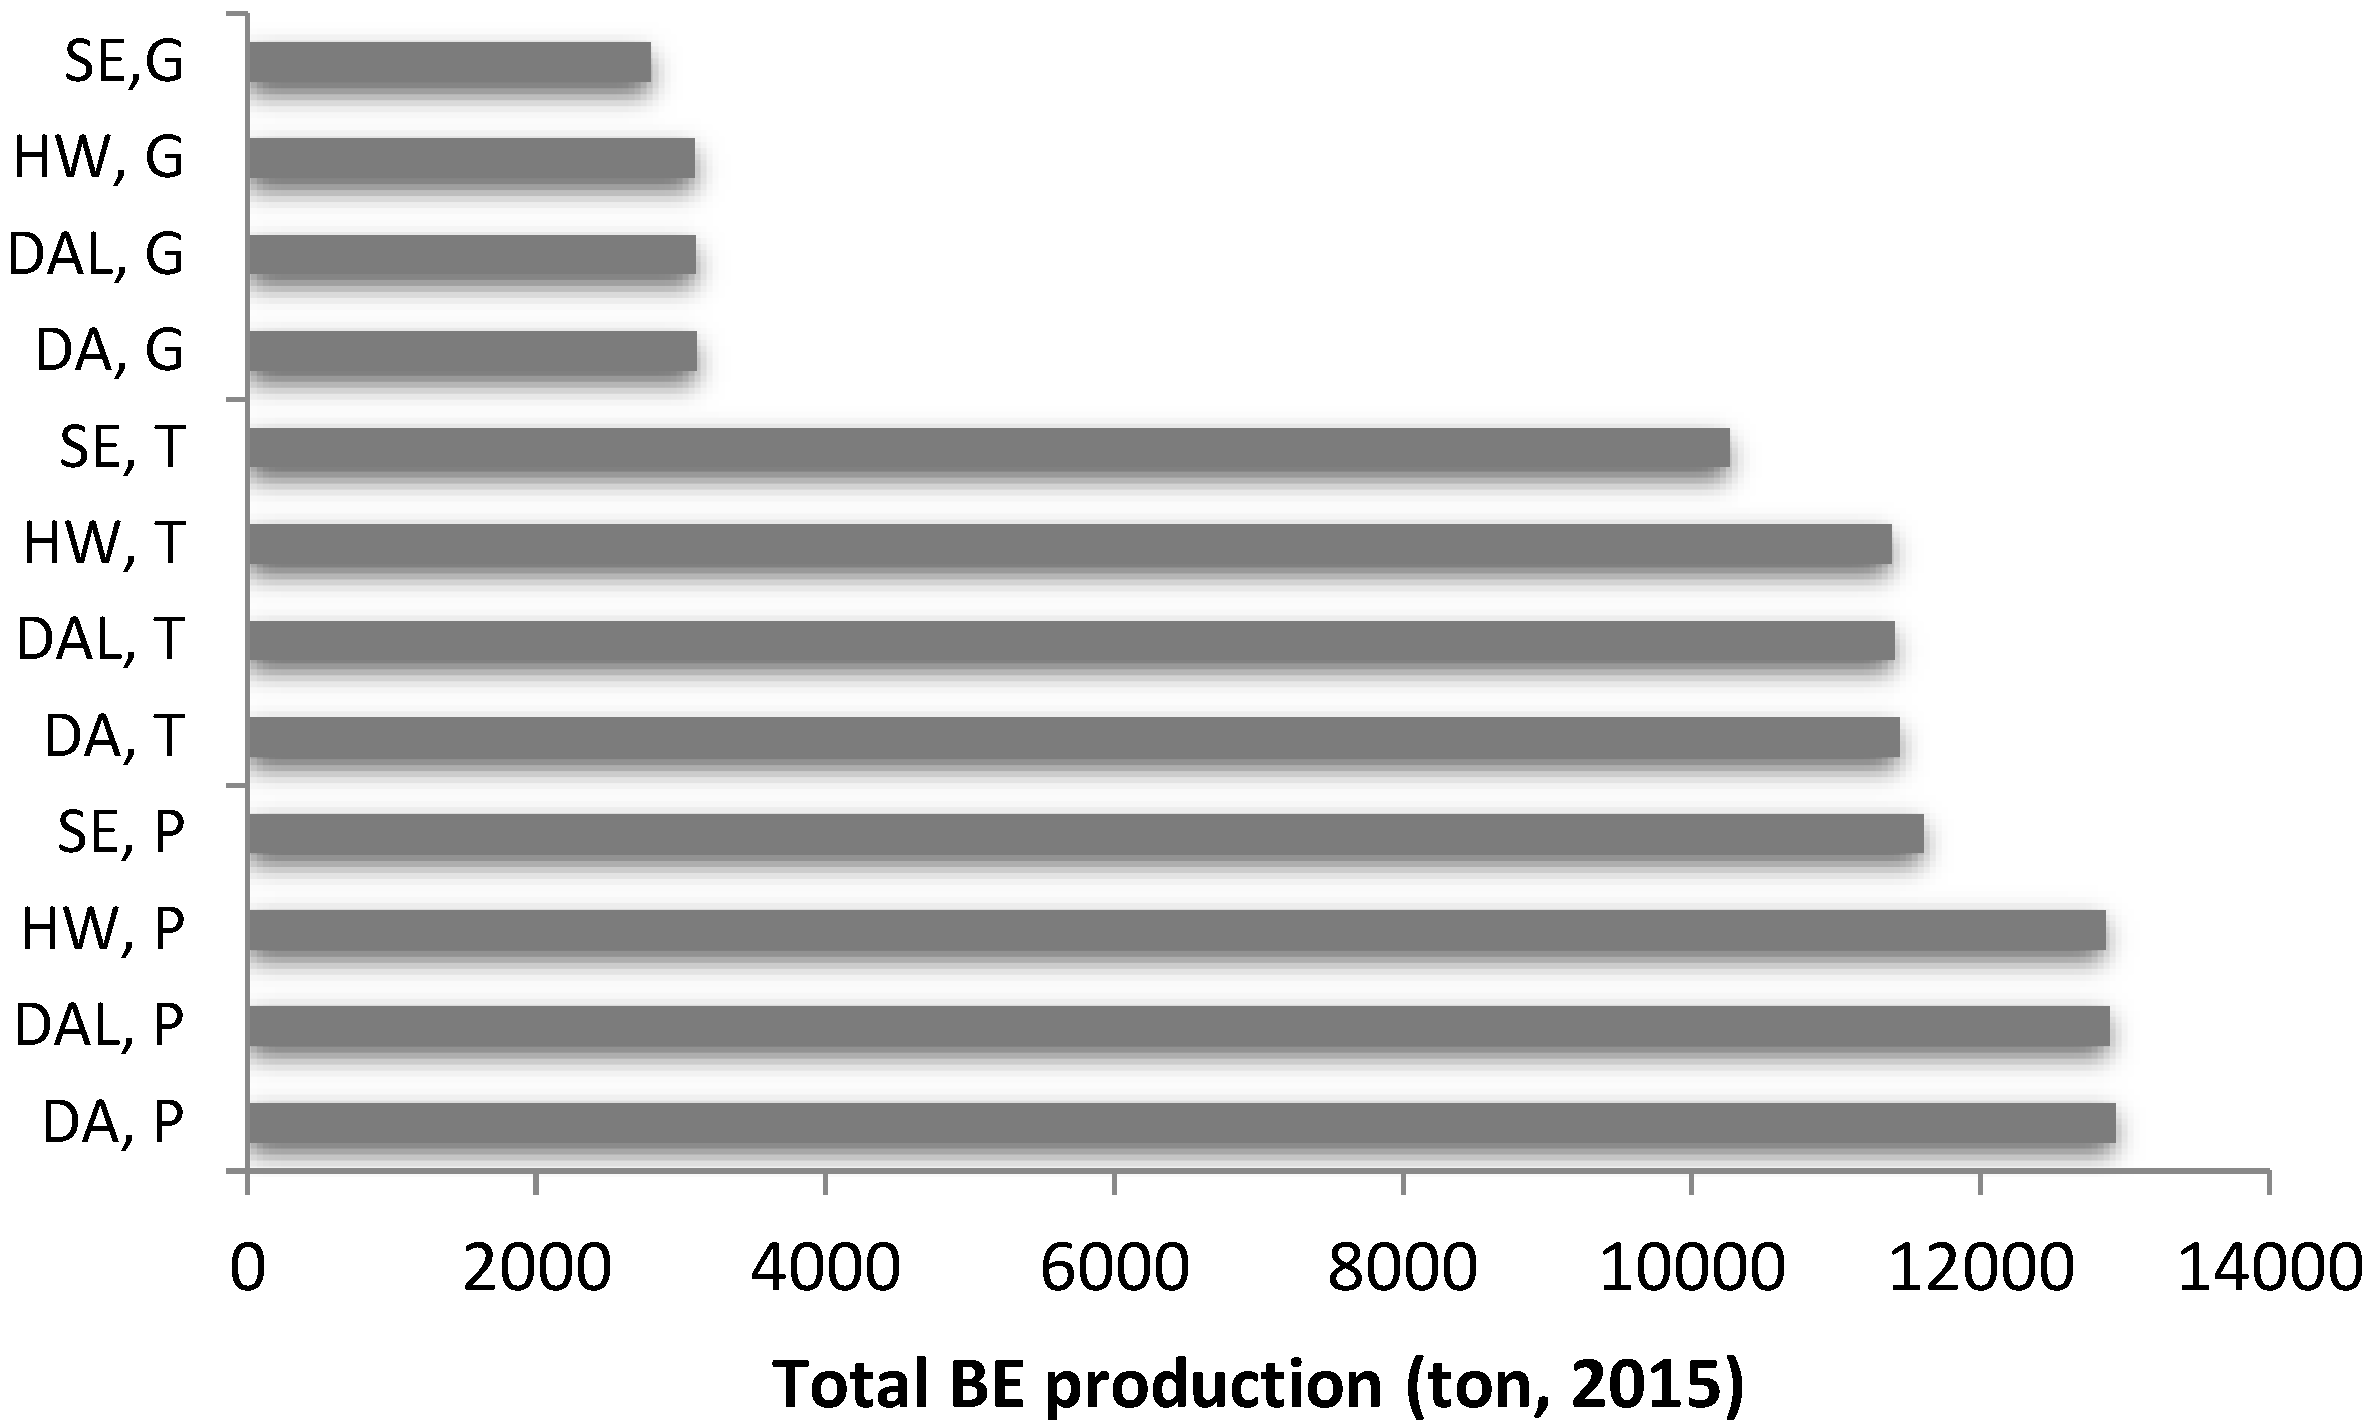
Moreover, the potential of bioethanol production employing different pretreatment technologies and various MOWs in 2015 is depicted in Figure 9. It is observed that maximum ethanol production is possible using dilute acid, dilute alkali, hot water and steam explosion. Ethanol yield is relatively low for the steam explosion system due to its comparatively low efficiency of cellulose hydrolysis.
4.5. Comparison of Alternatives
The rank orders for the 12 alternative bioethanol systems considered herein across the studied sustainability indicators are shown in Table 5.
SE,P is the top ranked system for nearly all impact indicators, except for production yield, for which it is in fourth place. DA, DAL and HW for garden wastes have the lowest ranks for almost all of the indicators. In addition to SE,P, more economic and environmentally oriented policies should favor HW,P and SE,T. Moreover, DAL,P ranks high for most indicators except for environmental, due to its high GHG emissions and moderate water consumption. DA,P has ranks low for most of the indicators, except for technically occupying the highest position for production yield. Finally, among the MOWs, paper and paperboard rank highest in most assessments.
5. Conclusions
This study presented a comprehensive sustainability assessment model covering the entire lifecycle of bioethanol production (resources, transport, pretreatment and production) to produce lignocellulosic bioethanol from various types of MOWs in Iceland: paper and paperboard, timber and wood and garden waste. Moreover, we carried out an analysis and comparison of the 12 systems based on sustainability impacts (economic, energy, environmental and technical) using the most common pretreatment technologies: dilute acid, dilute alkali, hot water and steam explosion. Based on the analysis conducted, the following conclusions can be reached:
- (1)
- Among the MOWs, paper and paperboard rank highest in most assessments. The steam explosion option is the most beneficial production technology from an economic, energy and environmental perspective; thus, it would be the most promising technique for producing bioethenal from the studied wastes.
- (2)
- The dilute acid method also ranks highly, technically; however, this it is not a desirable option due to its low energy performance, high production costs and high greenhouse gasses emission.
- (3)
- In addition to steam explosion, more economic and environmentally oriented policies should favor hot water technology, as no chemicals are required for treatment and the hydrolysis yield is similar to that of other pretreatment methods.
- (4)
- The dilute alkali technique for deriving bioethanol from paper also ranks highly for most of the indicators, except for environmental, due to its high GHG emissions and moderate water consumption.
- (5)
- Finally, estimates of the potential of different wastes and bioethanol production types in 2015 and 2030 were calculated. The total amount of paper, timber and garden wastes in Iceland in 2015 can be estimated as approximately 37, 40 and 16 thousand tons, respectively, which could increase to about 47, 49 and 20 thousand tons by 2030. Thus, the average potential of bioethanol production in 2015 was approximately 12.5, 11 and 3 thousand tons from paper, timber and garden wastes, which may likewise increase to about 15.9, 13.7 and 3.7 thousand tons in 2030.
Author Contributions
Data curation, S.S. and R.U.; Formal analysis, S.S.; Investigation, S.S.; Methodology, S.S.; Supervision, R.U.; Validation, S.S.; Writing—original draft, S.S.; Writing—review & editing, R.U.
Conflicts of Interest
The authors declare no conflicts of interest
References
- Rajaeifar, M.A.; Akram, A.; Ghobadian, B.; Rafiee, S.; Heijungs, R.; Tabatabaei, M. Environmental impact assessment of olive pomace oil biodiesel production and consumption: A comparative lifecycle assessment. Energy 2016, 106, 87–102. [Google Scholar] [CrossRef]
- Jahirul, M.I.; Rasul, M.G.; Chowdhury, A.A.; Ashwath, N. Biofuels production through biomass pyrolysis—A technological review. Energies 2012, 5, 4952–5001. [Google Scholar] [CrossRef]
- Talebnia, F.; Karakashev, D.; Angelidaki, I. Production of bioethanol from wheat straw: An overview on pretreatment, hydrolysis and fermentation. Bioresour.Technol. 2010, 101, 4744–4753. [Google Scholar] [CrossRef] [PubMed]
- Hirschnitz-Garbers, M.; Gosens, J. Producing bio-ethanol from residues and wastes. A technology with enormous potential in need of further research and development. Policy Brief 2015. Available online: http://ec.europa.eu/environment/integration/green_semester/pdf/Recreate_PB_2015_SEI.PDF (accessed on 2 December 2017).
- Michailos, S.; Parker, D.; Webb, C. Design, sustainability analysis and multiobjective optimisation of ethanol production via syngas fermentation. Waste Biomass Valoriz. 2017, 1–12. [Google Scholar] [CrossRef]
- Liguori, R.; Soccol, C.R.; Porto de Souza Vandenberghe, L.; Woiciechowski, A.L.; Faraco, V. Second generation ethanol production from brewers’ spent grain. Energies 2015, 8, 2575–2586. [Google Scholar] [CrossRef]
- Miezah, K.; Obiri-Danso, K.; Kádár, Z.; Heiske, S.; Fei-Baffoe, B.; Mensah, M.; Meyer, A.S. Municipal solid waste management in a low income economy through biogas and bioethanol production. Waste Biomass Valoriz. 2017, 8, 115–127. [Google Scholar] [CrossRef]
- Sundberg, M.; Guðmundsson, J.; Guðmundsson, M. Biofuel Production in Iceland: Survey of Potential Raw Materials and Yields to 2030; MANNVIT Engineering: Kópavogur, Iceland, 15 October 2010. Available online: http://www.lifeldsneyti.is/resources/Files/Lifeldsneyti/Lifeldsneyti-Arsskyrsla-2010/Fylgiskjal_1_Mannvit.pdf (accessed on 2 December 2017).
- Hálfdánarson, H.E. Ethanol Production from Timothy (Phleum pratense L.). Master’ Thesis, Agricultural University of Iceland, Hvanneyri, Island, June 2015. [Google Scholar]
- Snæbjörnsson, A.; Hjartardóttir, D.; Blöndal, E.; Pétursson, J.; Eggertsson, Ó.; Halldórsson, O. Skýrsla Nefndar um Landnotkun-Athugun á Notkun og Varðveislu Ræktanlegs Lands; Ministry of Fisheries and Agriculture: Reykjavık, Iceland, 2010.
- Dell, R.; Unnthorsson, R.; Wei, C.; Foley, W. Waste geothermal hot water for enhanced outdoor agricultural production. In Proceedings of the ASME 2013 Power Conference, Boston, MA, USA, 29 July–1 August 2013; American Society of Mechanical Engineers: New York, NY, USA, 2013; p. V002T009A013. [Google Scholar] [CrossRef]
- Lin, J.; Babbitt, C.W.; Trabold, T.A. Life cycle assessment integrated with thermodynamic analysis of bio-fuel options for solid oxide fuel cells. Bioresour. Technol. 2013, 128, 495–504. [Google Scholar] [CrossRef] [PubMed]
- Strategic Planning for the Management of Wastes 2009–2020; Mannvit Engineering: Reykjavik, Iceland, 2015.
- Íslenska Gámafélagið. Available online: http://www.gamur.is/ (accessed on 2 December 2017).
- Ng, S.Y.; Ong, S.Y.; Ng, Y.Y.; Liew, A.H.; Ng, D.K.; Chemmangattuvalappil, N.G. Optimal design and synthesis of sustainable integrated biorefinery for pharmaceutical products from palm-based biomass. Process Integr. Optim. Sustain. 2017, 1, 135–151. [Google Scholar] [CrossRef]
- Holmgren, K. Waste incineration in swedish municipal energy systems. WIT Trans. Ecol. Environ. 2006, 92. [Google Scholar] [CrossRef]
- Halldorsson, T.I.; Auðunsson, G.A.; Guicharnaud, R.; Dýrmundsson, Ó.R.; Hansson, S.Ö.; Hreinsson, K. Contamination of livestock due to the operation of a small waste incinerator: A case incident in skutulsfjörður, iceland, in 2010. Acta Vet. Scand. 2012, 54, S4. [Google Scholar] [CrossRef]
- Niðurstöður úr Mælingum á Díoxínum í jarðvegi; Umhverfisstofnun: Reykjavık, Iceland, 2011. Available online: https://www.ust.is/einstaklingar/frettir/frett/2011/07/06/Nidurstodur-ur-maelingum-a-dioxinum-i-jardvegi/ (accessed on 2 December 2017).
- Gunnarsson, A. Maintenance of the Steam Turbines at Hellisheiði Power Plant. Master’ Thesis, University of Iceland, Reykjavik, Iceland, May 2013. [Google Scholar]
- Rajaeifar, A.M.; Ghobadian, B.; Davoud Heidari, M.; Fayyazi, E. Energy consumption and greenhouse gas emissions of biodiesel production from rapeseed in iran. J. Renew. Sustain. Energy 2013, 5, 063134. [Google Scholar] [CrossRef]
- Mousavi-Avval, S.H.; Rafiee, S.; Jafari, A.; Mohammadi, A. Energy flow modeling and sensitivity analysis of inputs for canola production in iran. J. Clean. Prod. 2011, 19, 1464–1470. [Google Scholar] [CrossRef]
- Mood, S.H.; Golfeshan, A.H.; Tabatabaei, M.; Jouzani, G.S.; Najafi, G.H.; Gholami, M.; Ardjmand, M. Lignocellulosic biomass to bioethanol, a comprehensive review with a focus on pretreatment. Renew. Sustain. Energy Rev. 2013, 27, 77–93. [Google Scholar] [CrossRef]
- Taherzadeh, M.J.; Karimi, K. Pretreatment of lignocellulosic wastes to improve ethanol and biogas production: A review. Int. J. Mol. Sci. 2008, 9, 1621–1651. [Google Scholar] [CrossRef] [PubMed]
- Kumar, D.; Murthy, G.S. Impact of pretreatment and downstream processing technologies on economics and energy in cellulosic ethanol production. Biotechnol. Biofuels 2011, 4, 27. [Google Scholar] [CrossRef] [PubMed] [Green Version]
- Talebnia, F.; Bafrani, M.P.; Lundin, M.; Taherzadeh, M. Optimization study of citrus wastes saccharification by dilute acid hydrolysis. BioResources 2007, 3, 108–122. [Google Scholar]
- Behera, S.; Arora, R.; Nandhagopal, N.; Kumar, S. Importance of chemical pretreatment for bioconversion of lignocellulosic biomass. Renew. Sustain. Energy Rev. 2014, 36, 91–106. [Google Scholar] [CrossRef]
- Agbor, V.B.; Cicek, N.; Sparling, R.; Berlin, A.; Levin, D.B. Biomass pretreatment: Fundamentals toward application. Biotechnol. Adv. 2011, 29, 675–685. [Google Scholar] [CrossRef] [PubMed]
- Sritrakul, N.; Nitisinprasert, S.; Keawsompong, S. Evaluation of dilute acid pretreatment for bioethanol fermentation from sugarcane bagasse pith. Agric. Natl. Resour. 2018. [Google Scholar] [CrossRef]
- McIntosh, S.; Vancov, T. Enhanced enzyme saccharification of sorghum bicolor straw using dilute alkali pretreatment. Bioresour. Technol. 2010, 101, 6718–6727. [Google Scholar] [CrossRef] [PubMed]
- Hu, G.; Heitmann, J.A.; Rojas, O.J. Feedstock pretreatment strategies for producing ethanol from wood, bark, and forest residues. BioResources 2008, 3, 270–294. [Google Scholar]
- Viola, E.; Zimbardi, F.; Cardinale, M.; Cardinale, G.; Braccio, G.; Gambacorta, E. Processing cereal straws by steam explosion in a pilot plant to enhance digestibility in ruminants. Bioresour. Technol. 2008, 99, 681–689. [Google Scholar] [CrossRef] [PubMed]
- Wang, L.; Littlewood, J.; Murphy, R.J. Environmental sustainability of bioethanol production from wheat straw in the uk. Renew. Sustain. Energy Rev. 2013, 28, 715–725. [Google Scholar] [CrossRef]
- Safarian, S.; Khodaparast, P.; Kateb, M. Modeling and technical-economic optimization of electricity supply network by three photovoltaic systems. J. Sol. Energy Eng. 2014, 136, 024501. [Google Scholar] [CrossRef]
- Safarian, S.; Saboohi, Y.; Kateb, M. Evaluation of energy recovery and potential of hydrogen production in iranian natural gas transmission network. Energy Policy 2013, 61, 65–77. [Google Scholar] [CrossRef]
- Safarian, S.; Sattari, S.; Hamidzadeh, Z. Sustainability assessment of biodiesel supply chain from various biomasses and conversion technologies. Biophys. Econ. Resour. Qual. (BERQ) 2018, 3, 6. [Google Scholar] [CrossRef]
- Azadeh, A.; Arani, H.V.; Dashti, H. A stochastic programming approach towards optimization of biofuel supply chain. Energy 2014, 76, 513–525. [Google Scholar] [CrossRef]
- You, F.; Tao, L.; Graziano, D.J.; Snyder, S.W. Optimal design of sustainable cellulosic biofuel supply chains: Multiobjective optimization coupled with life cycle assessment and input–output analysis. AIChE J. 2012, 58, 1157–1180. [Google Scholar] [CrossRef]
- Sheinbaum-Pardo, C.; Ruiz-Mendoza, B.J.; Rodríguez-Padilla, V. Mexican energy policy and sustainability indicators. Energy Policy 2012, 46, 278–283. [Google Scholar] [CrossRef]
- Tsai, W.-T. Energy sustainability from analysis of sustainable development indicators: A case study in taiwan. Renew. Sustain. Energy Rev. 2010, 14, 2131–2138. [Google Scholar] [CrossRef]
- Angelis-Dimakis, A.; Arampatzis, G.; Assimacopoulos, D. Monitoring the sustainability of the greek energy system. Energy Sustain. Dev. 2012, 16, 51–56. [Google Scholar] [CrossRef]
- How, B.S.; Lam, H.L. Pca method for debottlenecking of sustainability performance in integrated biomass supply chain. Process Integr. Optim. Sustain. 2018, 1–22. [Google Scholar] [CrossRef]
- Atlantsolía ehf. Available online: https://www.atlantsolia.is/stodvaverd/ (accessed on 2 December 2017).
- Veitur ohf. Available online: https://www.veitur.is/verdskrar/vatnsveita (accessed on 2 December 2017).
- Foreign Big Company in Crash with Electricity Prices. Available online: https://kjarninn.is/skodun/erlent-storfyrirtaeki-i-feluleik-med-raforkuverd/ (accessed on 2 December 2017).
- Mousavi-Avval, S.H.; Rafiee, S.; Jafari, A.; Mohammadi, A. Optimization of energy consumption for soybean production using data envelopment analysis (dea) approach. Appl. Energy 2011, 88, 3765–3772. [Google Scholar] [CrossRef]
- Klein, S.J.; Whalley, S. Comparing the sustainability of us electricity options through multi-criteria decision analysis. Energy Policy 2015, 79, 127–149. [Google Scholar] [CrossRef]
- Rajaeifar, M.A.; Ghobadian, B.; Safa, M.; Heidari, M.D. Energy life-cycle assessment and co2 emissions analysis of soybean-based biodiesel: A case study. J. Clean. Prod. 2014, 66, 233–241. [Google Scholar] [CrossRef]
- Hamelinck, C.N.; Van Hooijdonk, G.; Faaij, A.P. Ethanol from lignocellulosic biomass: Techno-economic performance in short-, middle-and long-term. Biomass Bioenergy 2005, 28, 384–410. [Google Scholar] [CrossRef]
- Shahzadi, T.; Mehmood, S.; Irshad, M.; Anwar, Z.; Afroz, A.; Zeeshan, N.; Rashid, U.; Sughra, K. Advances in lignocellulosic biotechnology: A brief review on lignocellulosic biomass and cellulases. Adv. Biosci. Biotechnol. 2014, 5, 246–251. [Google Scholar] [CrossRef]
- Kumar, S.; Shukla, S. A review on recent gasification methods for biomethane gas production. Int. J. Energy Eng. 2016, 6, 32–43. [Google Scholar]
Figure 1.
Map and information of Iceland, (a) all municipalities, (b) population share, (c) area share and (d) major region.
Figure 1.
Map and information of Iceland, (a) all municipalities, (b) population share, (c) area share and (d) major region.
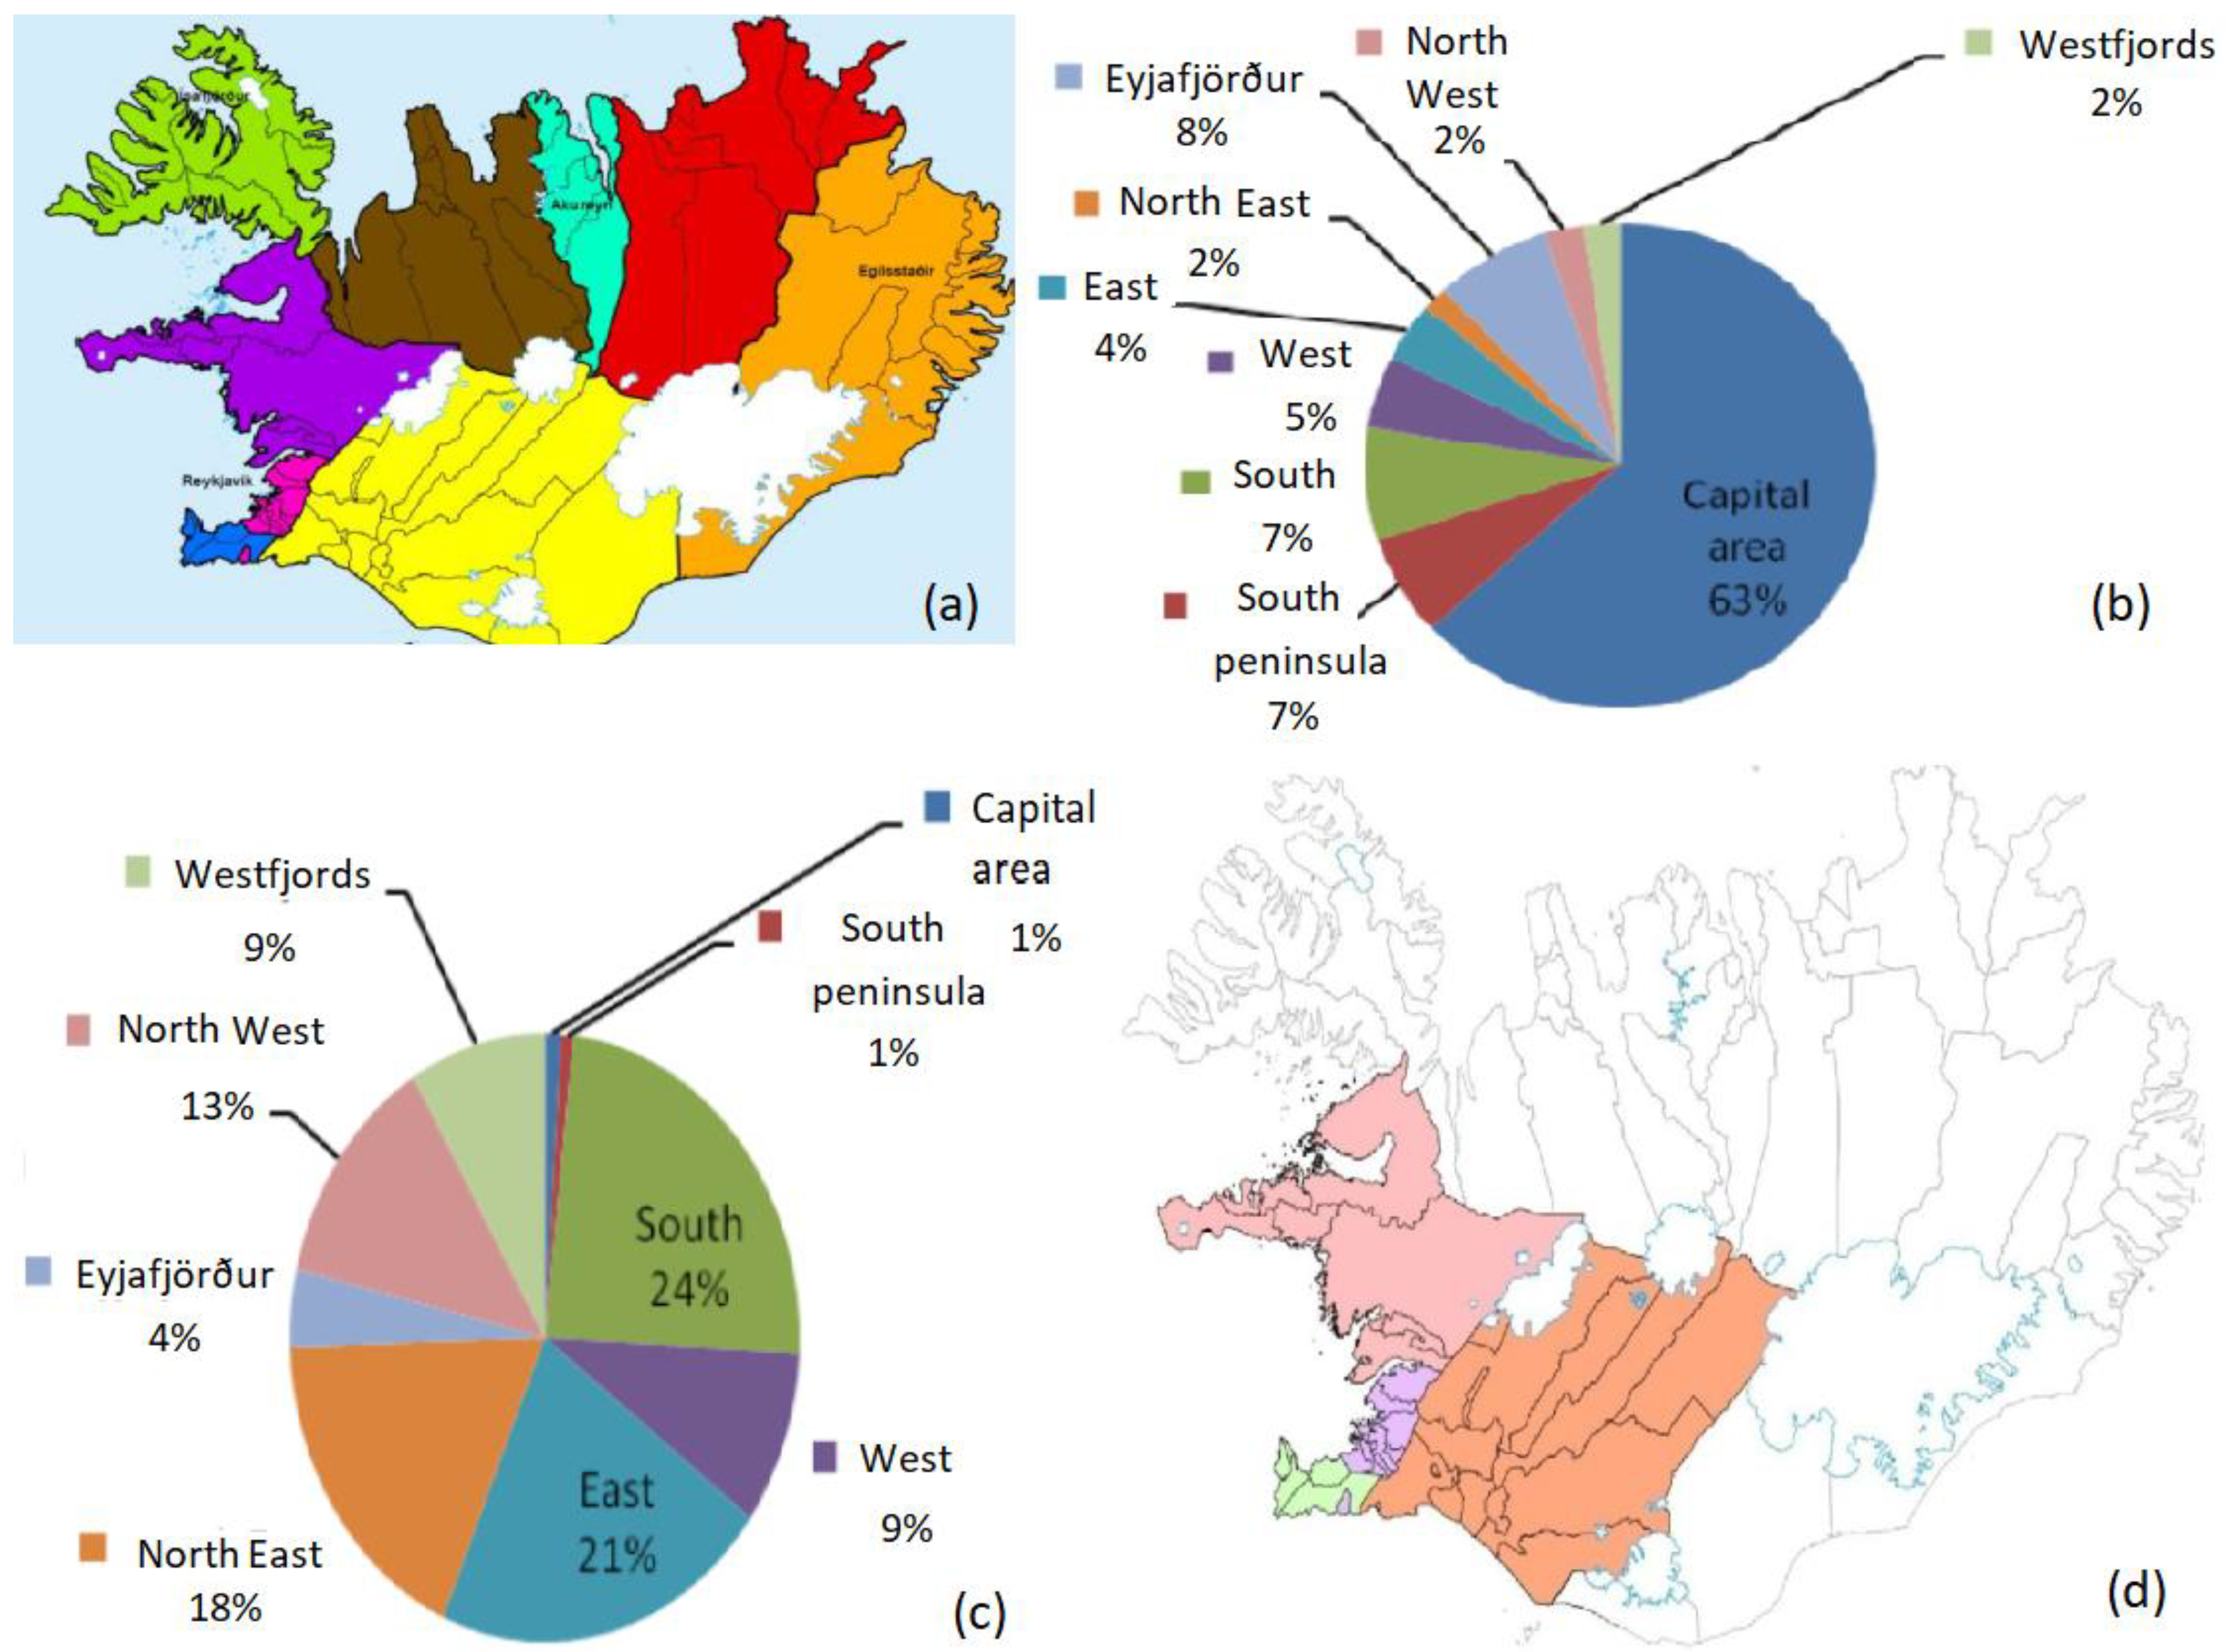
Figure 2.
System boundaries considered by in this study including five stages of processes, conversion technologies and associated inputs (energy and material).
Figure 2.
System boundaries considered by in this study including five stages of processes, conversion technologies and associated inputs (energy and material).
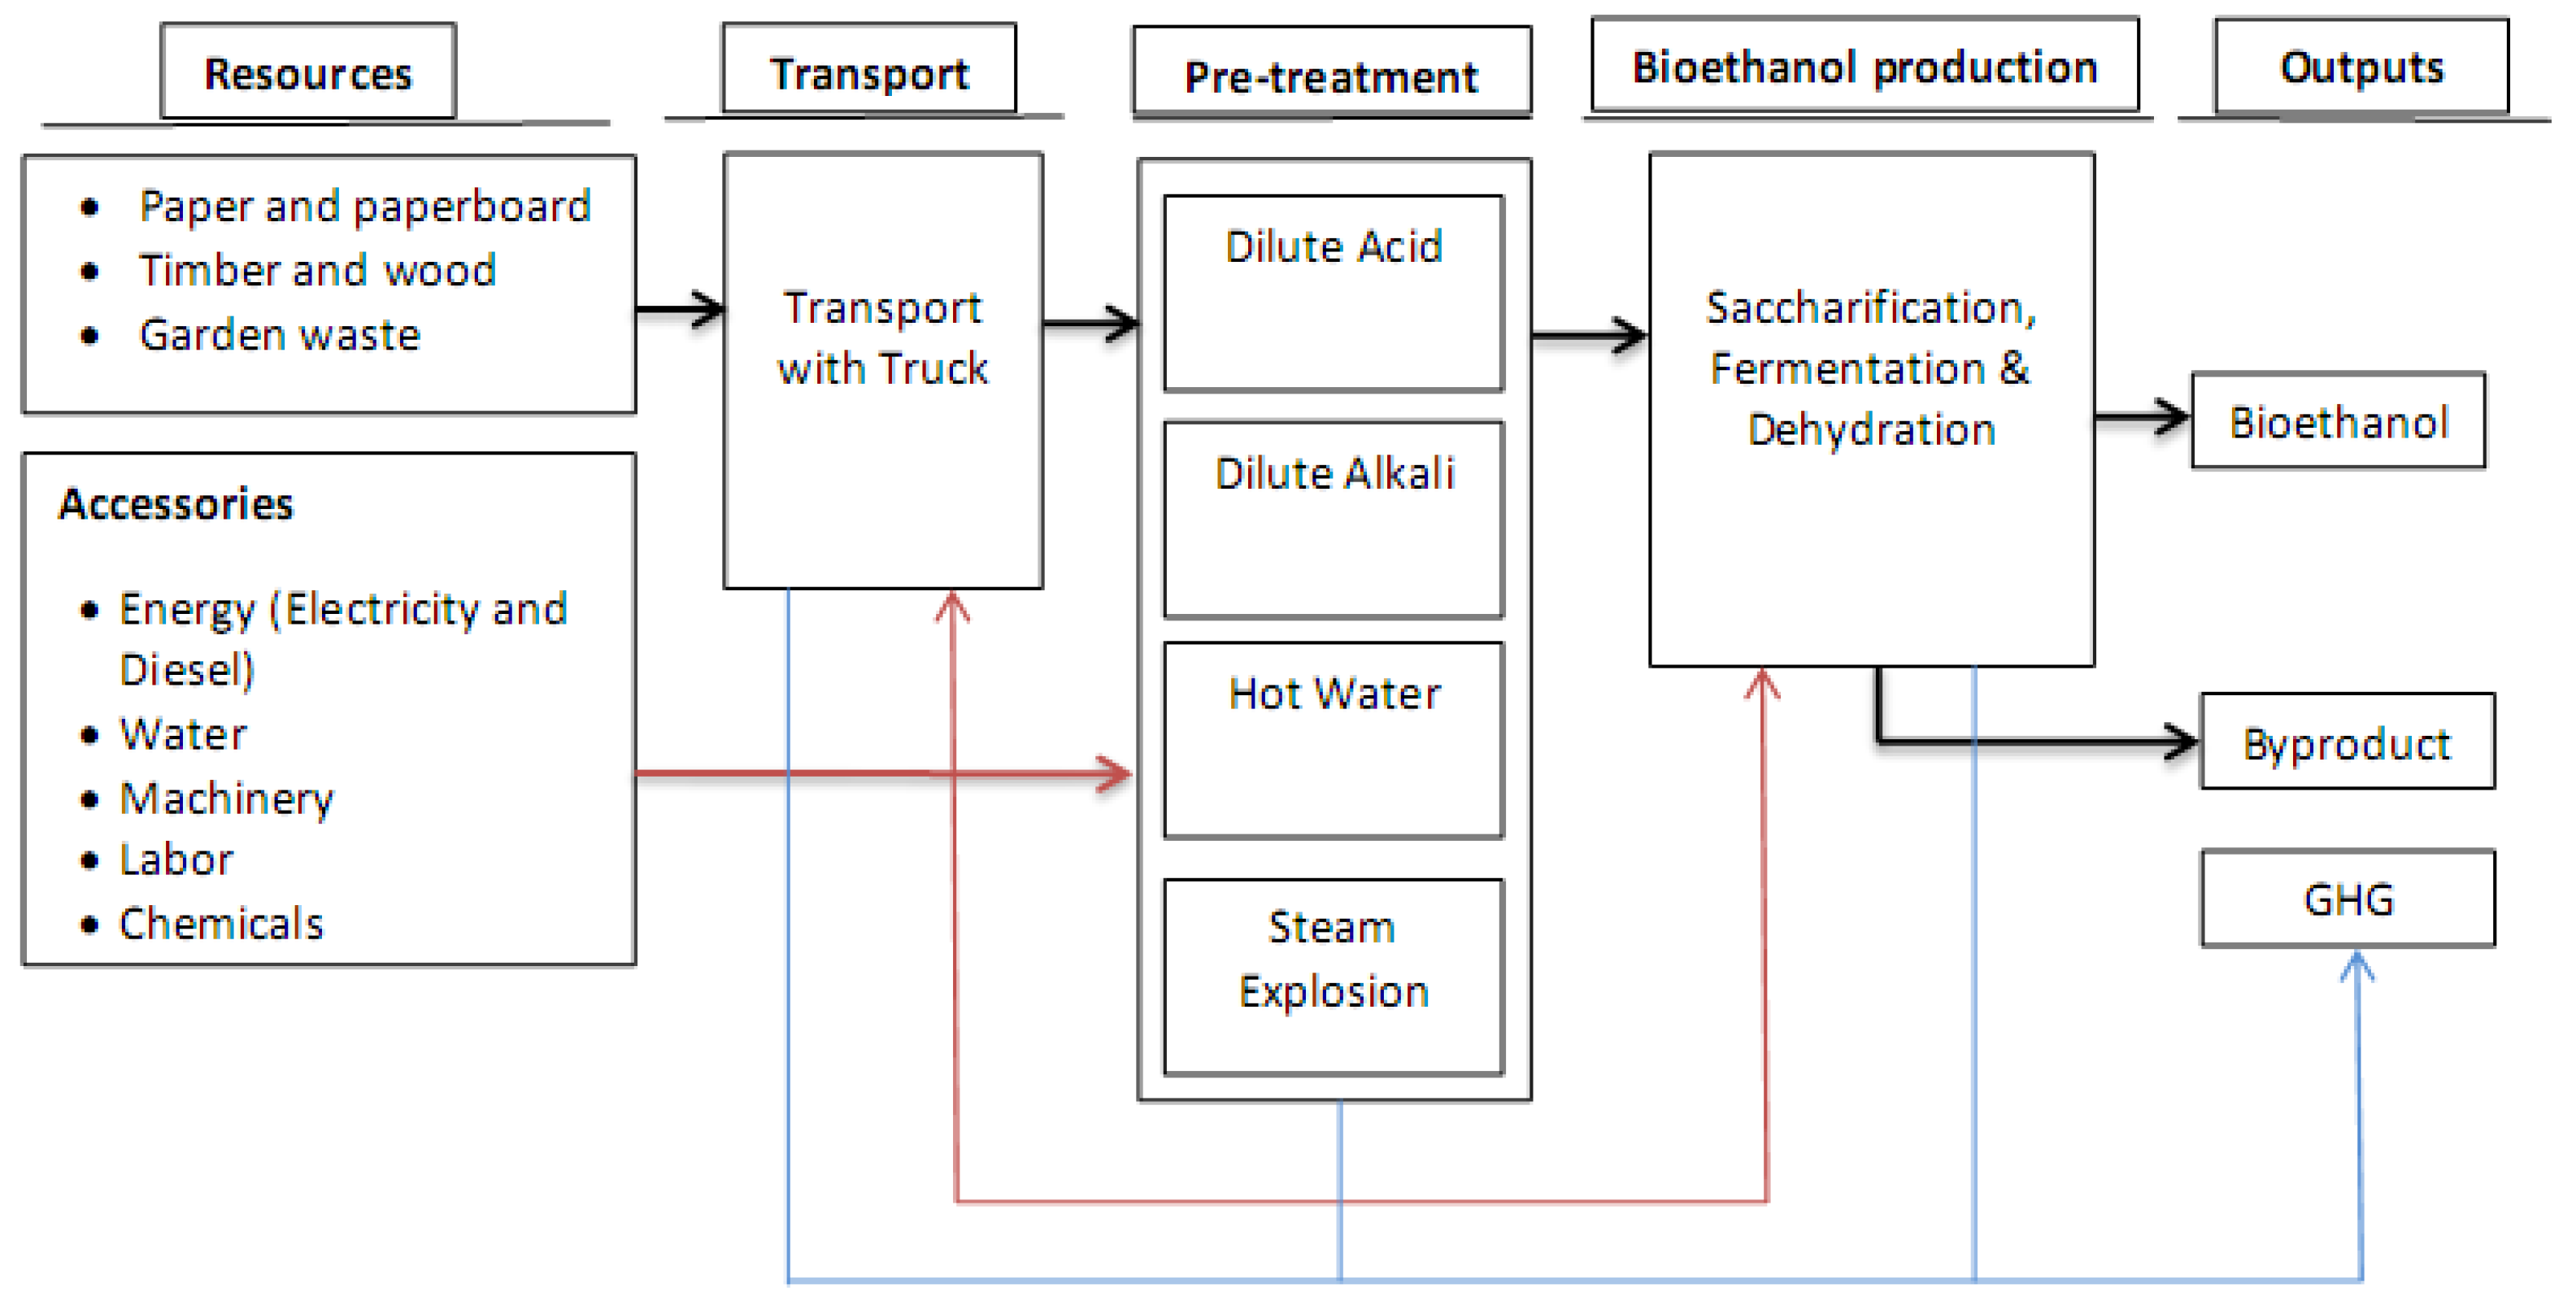
Figure 3.
Production costs and BPC for 1 ton bioethanol produced from different wastes; BPC: benefit per cost, BC: biomass cost, TC: transportation cost, CC: conversion cost.
Figure 3.
Production costs and BPC for 1 ton bioethanol produced from different wastes; BPC: benefit per cost, BC: biomass cost, TC: transportation cost, CC: conversion cost.
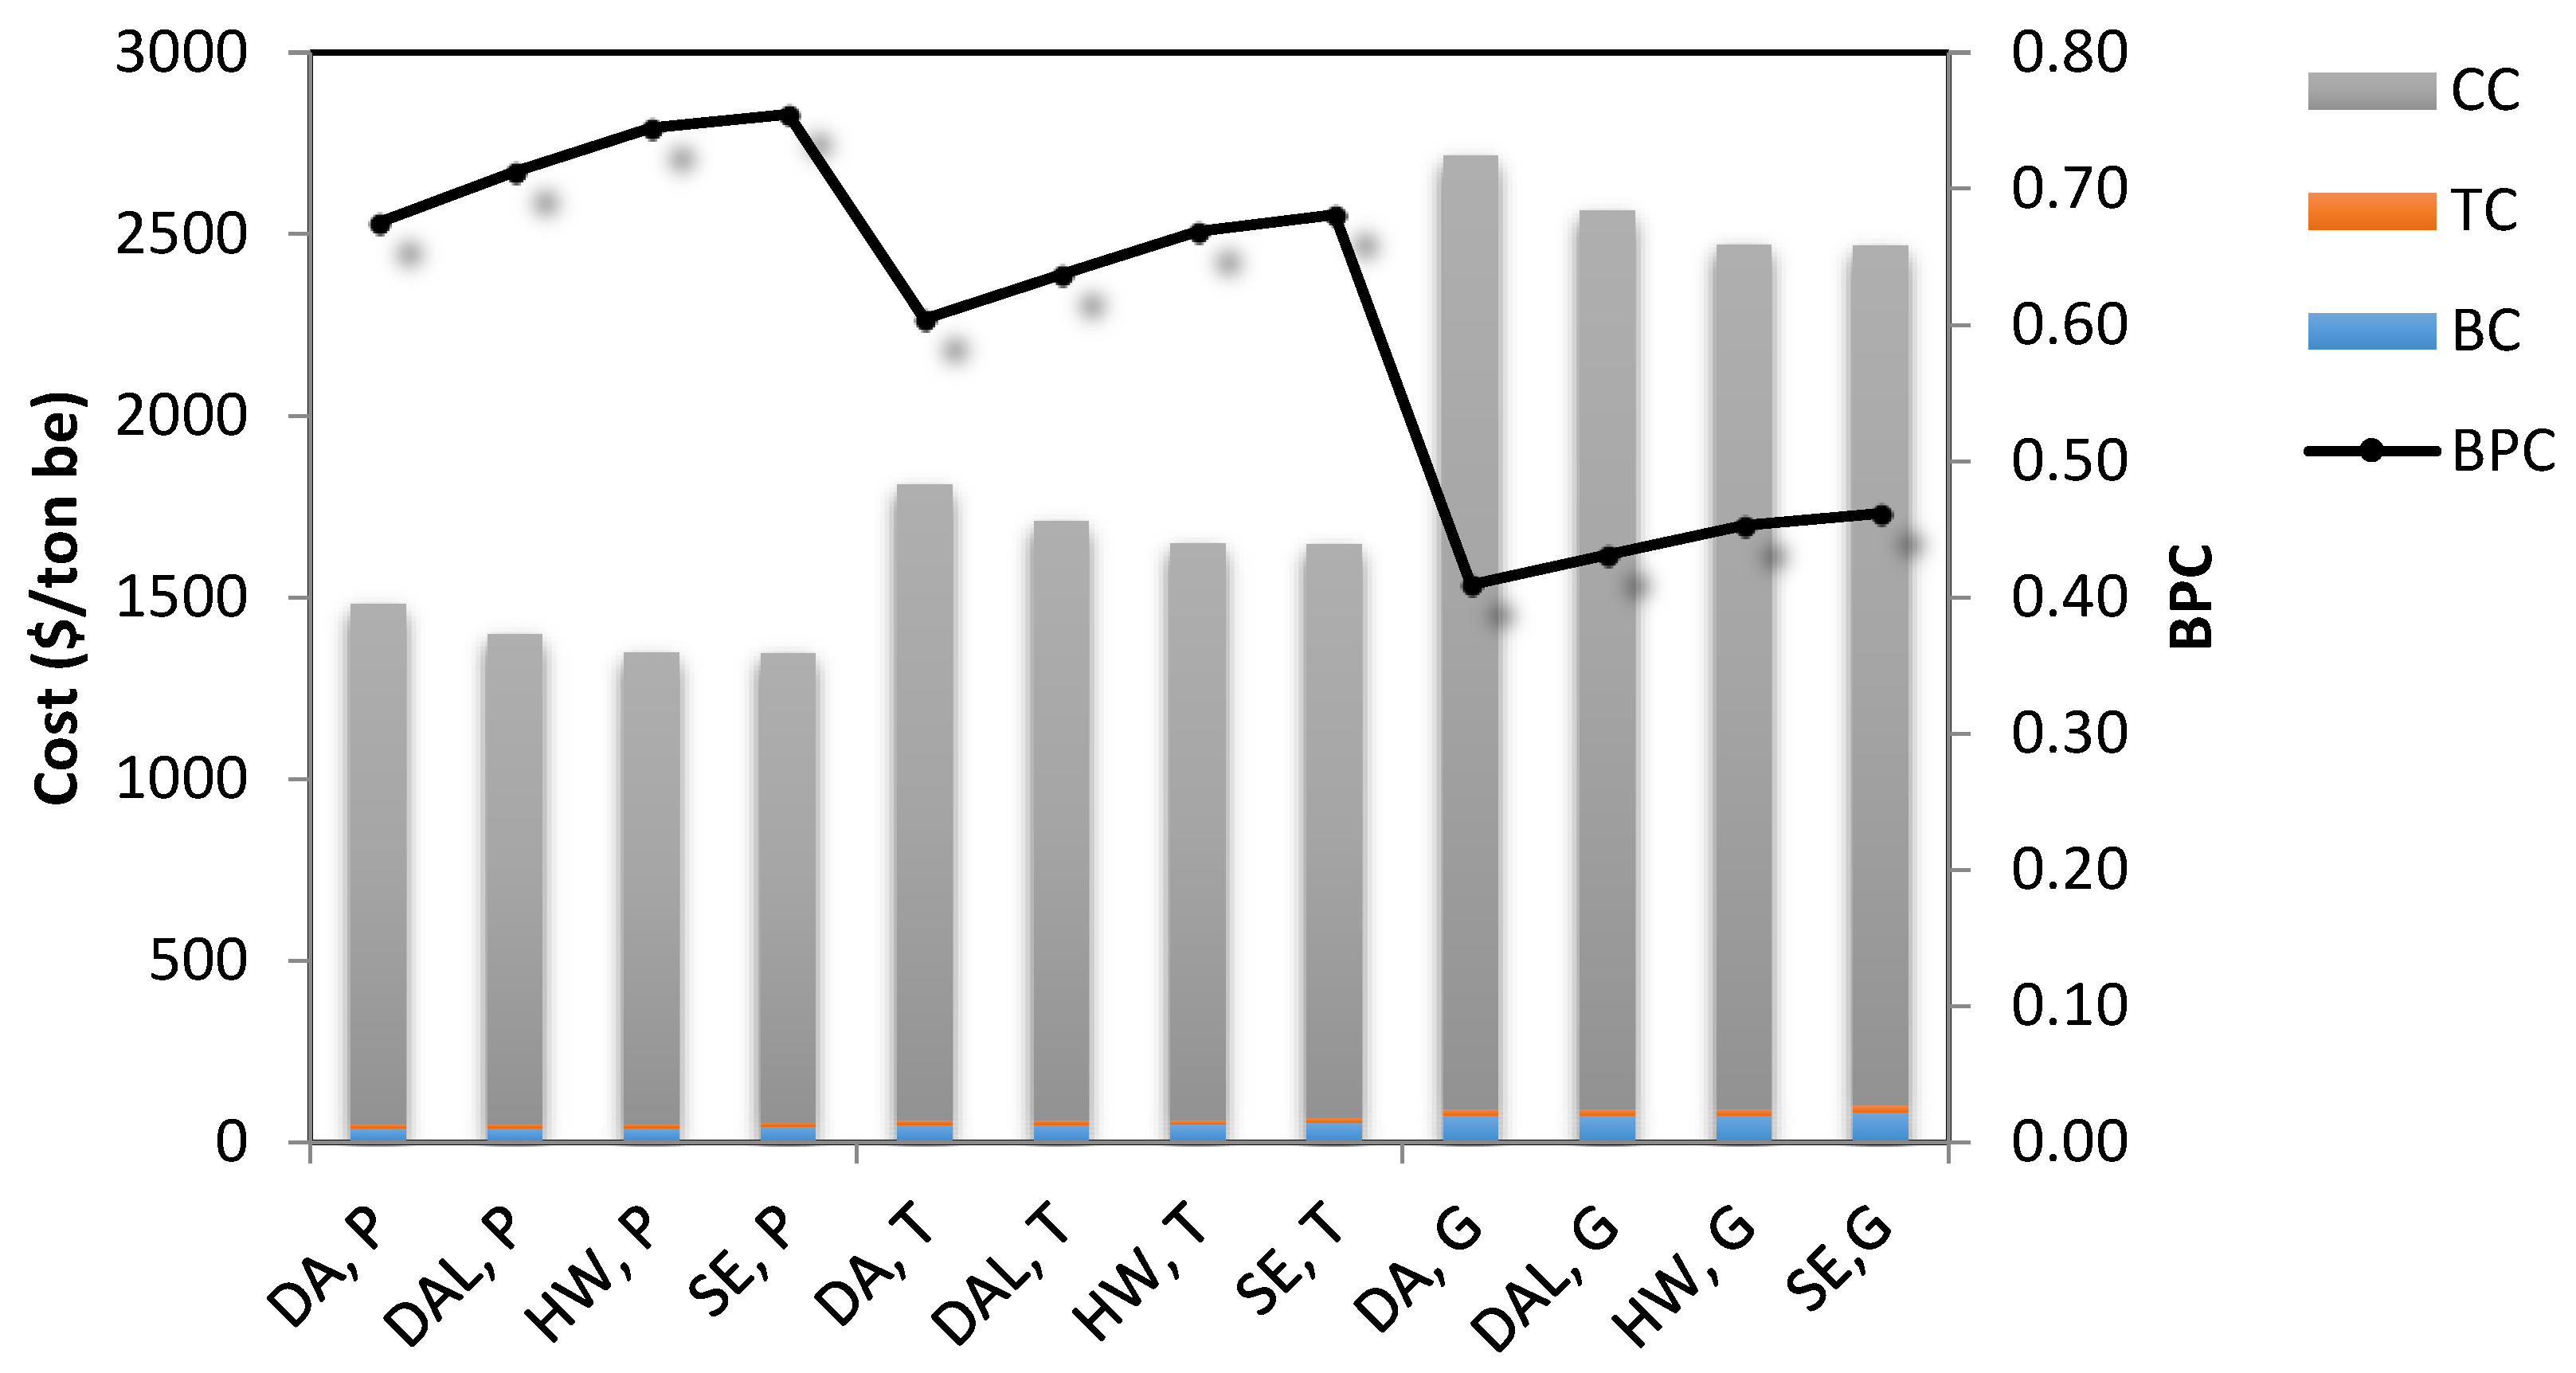
Figure 4.
Waste required to produce 1 ton bioethanol; P: paper and paperboard, T: timber and wood, G: garden waste, DA: dilute acid, DAL: dilute alkali, HW: hot water, SE: steam explosion.
Figure 4.
Waste required to produce 1 ton bioethanol; P: paper and paperboard, T: timber and wood, G: garden waste, DA: dilute acid, DAL: dilute alkali, HW: hot water, SE: steam explosion.
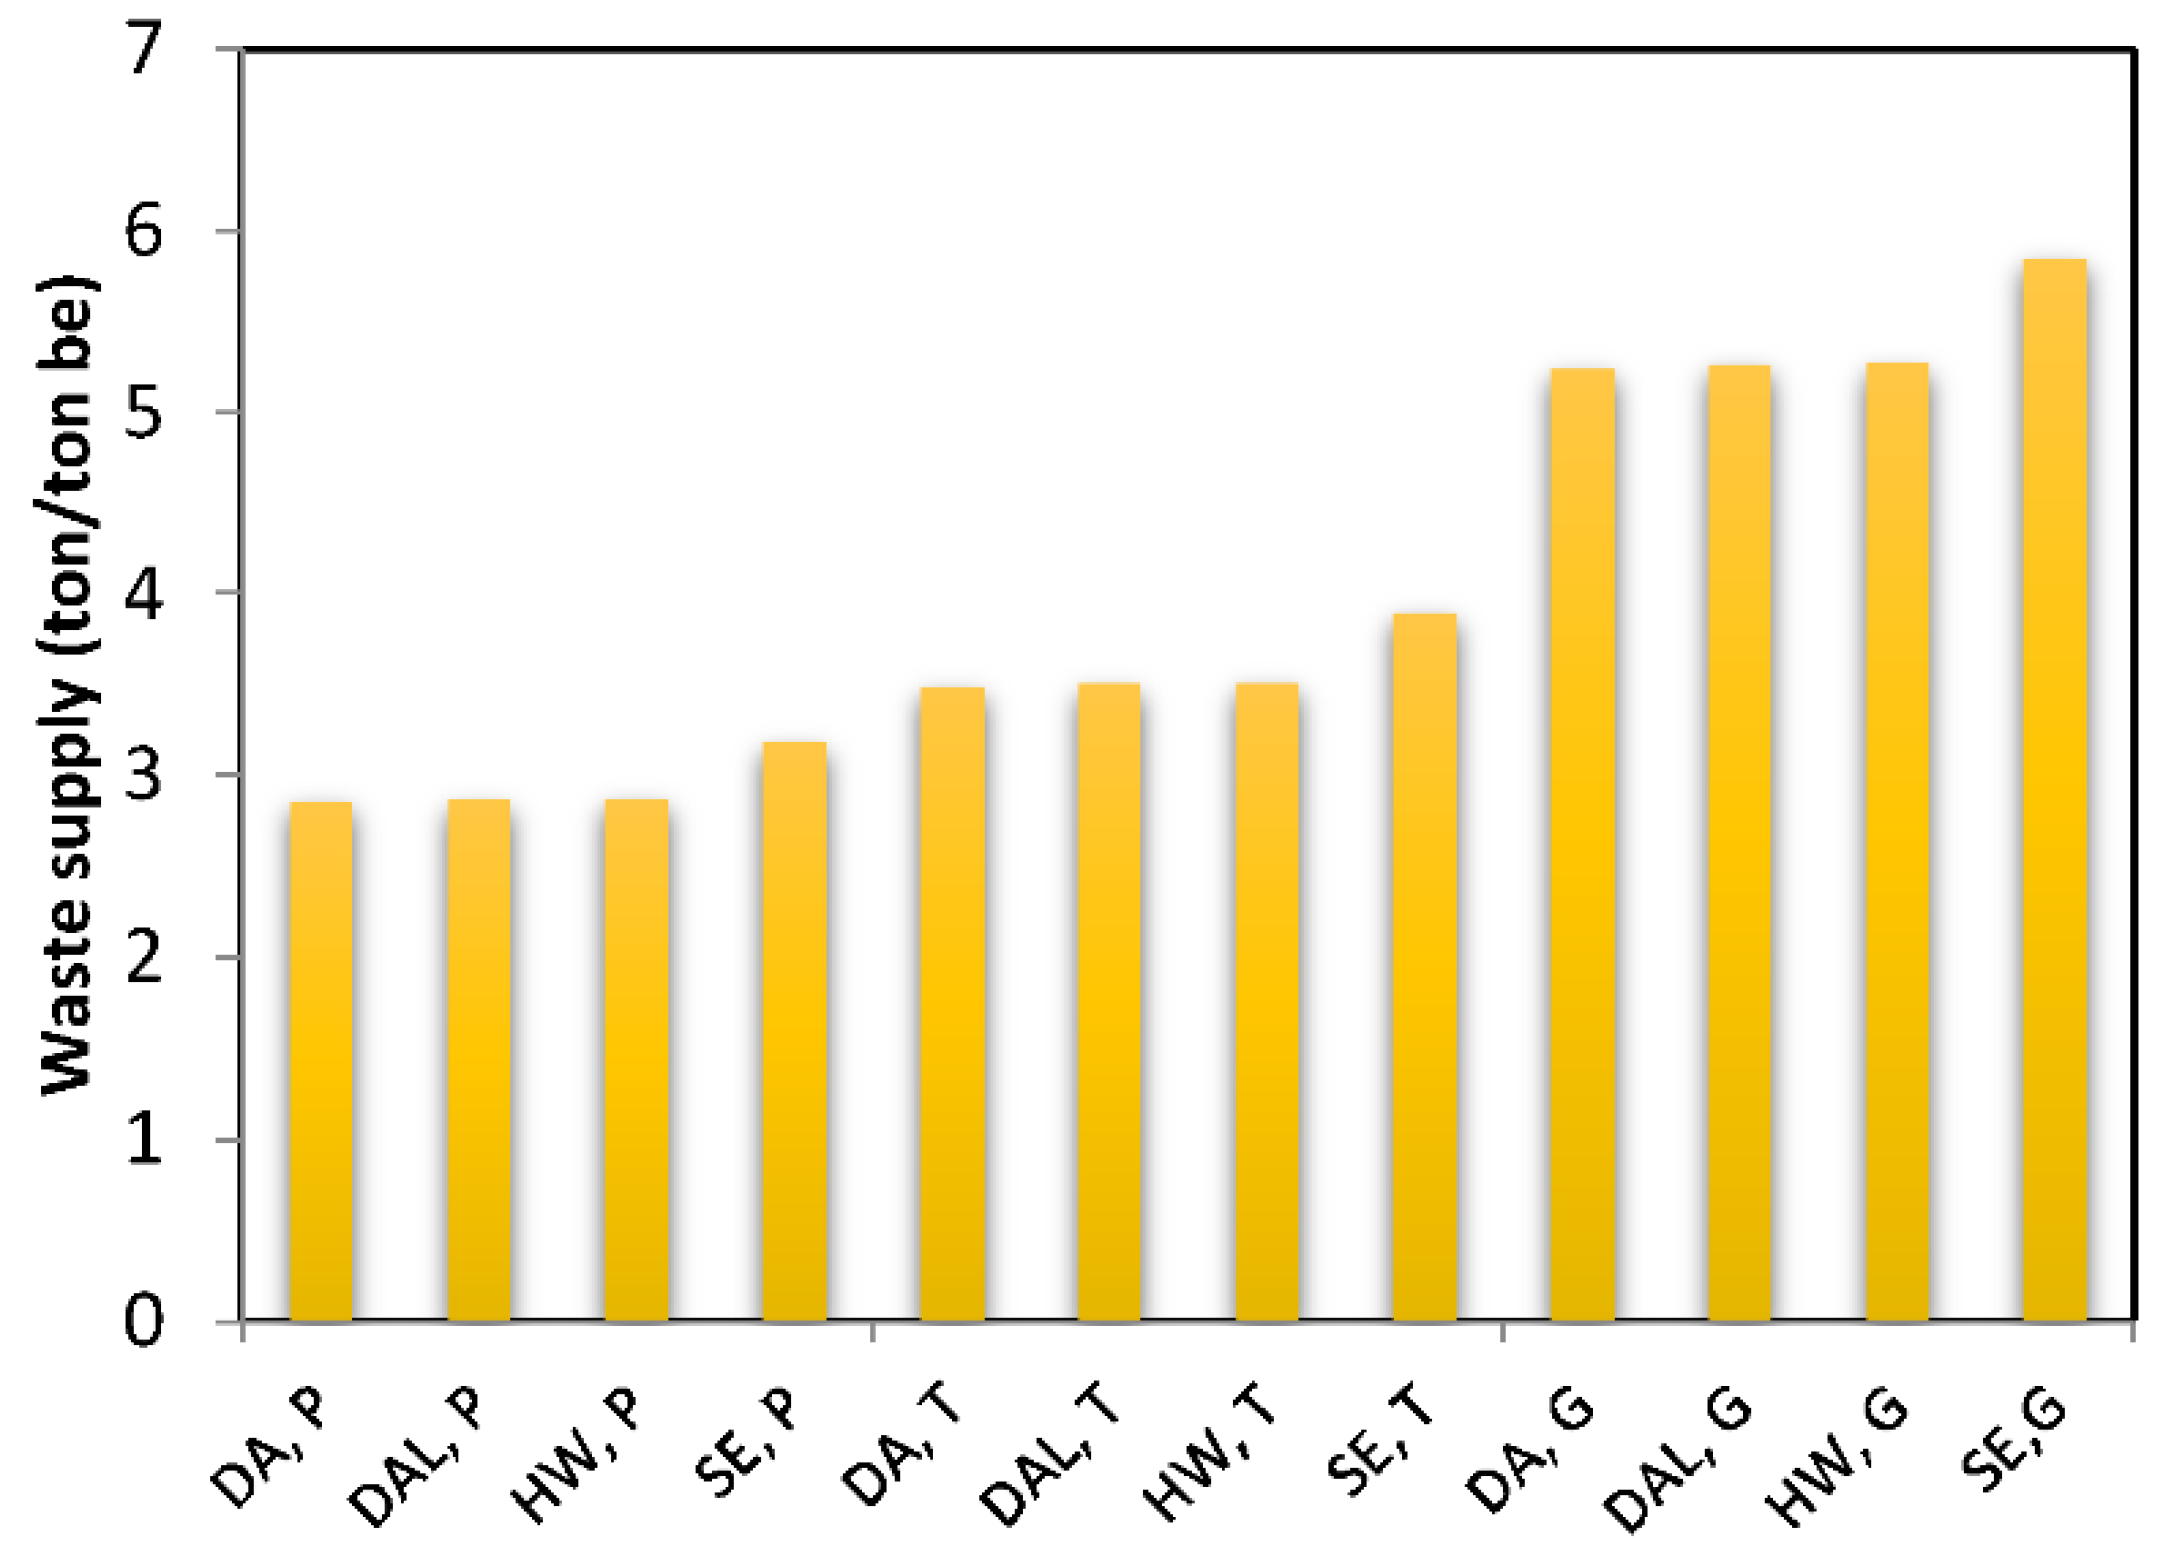
Figure 5.
Total input energy, total output energy and EUE for 1 ton bioethanol production from different wastes.
Figure 5.
Total input energy, total output energy and EUE for 1 ton bioethanol production from different wastes.

Figure 6.
Total GHG emission for 1 ton of bioethanol produced by using different wastes.

Figure 7.
Total water consumption for 1 ton of bioethanol produced by using different wastes.

Figure 8.
Total amount of various wastes and bioethanol production between 2015 and 2030.
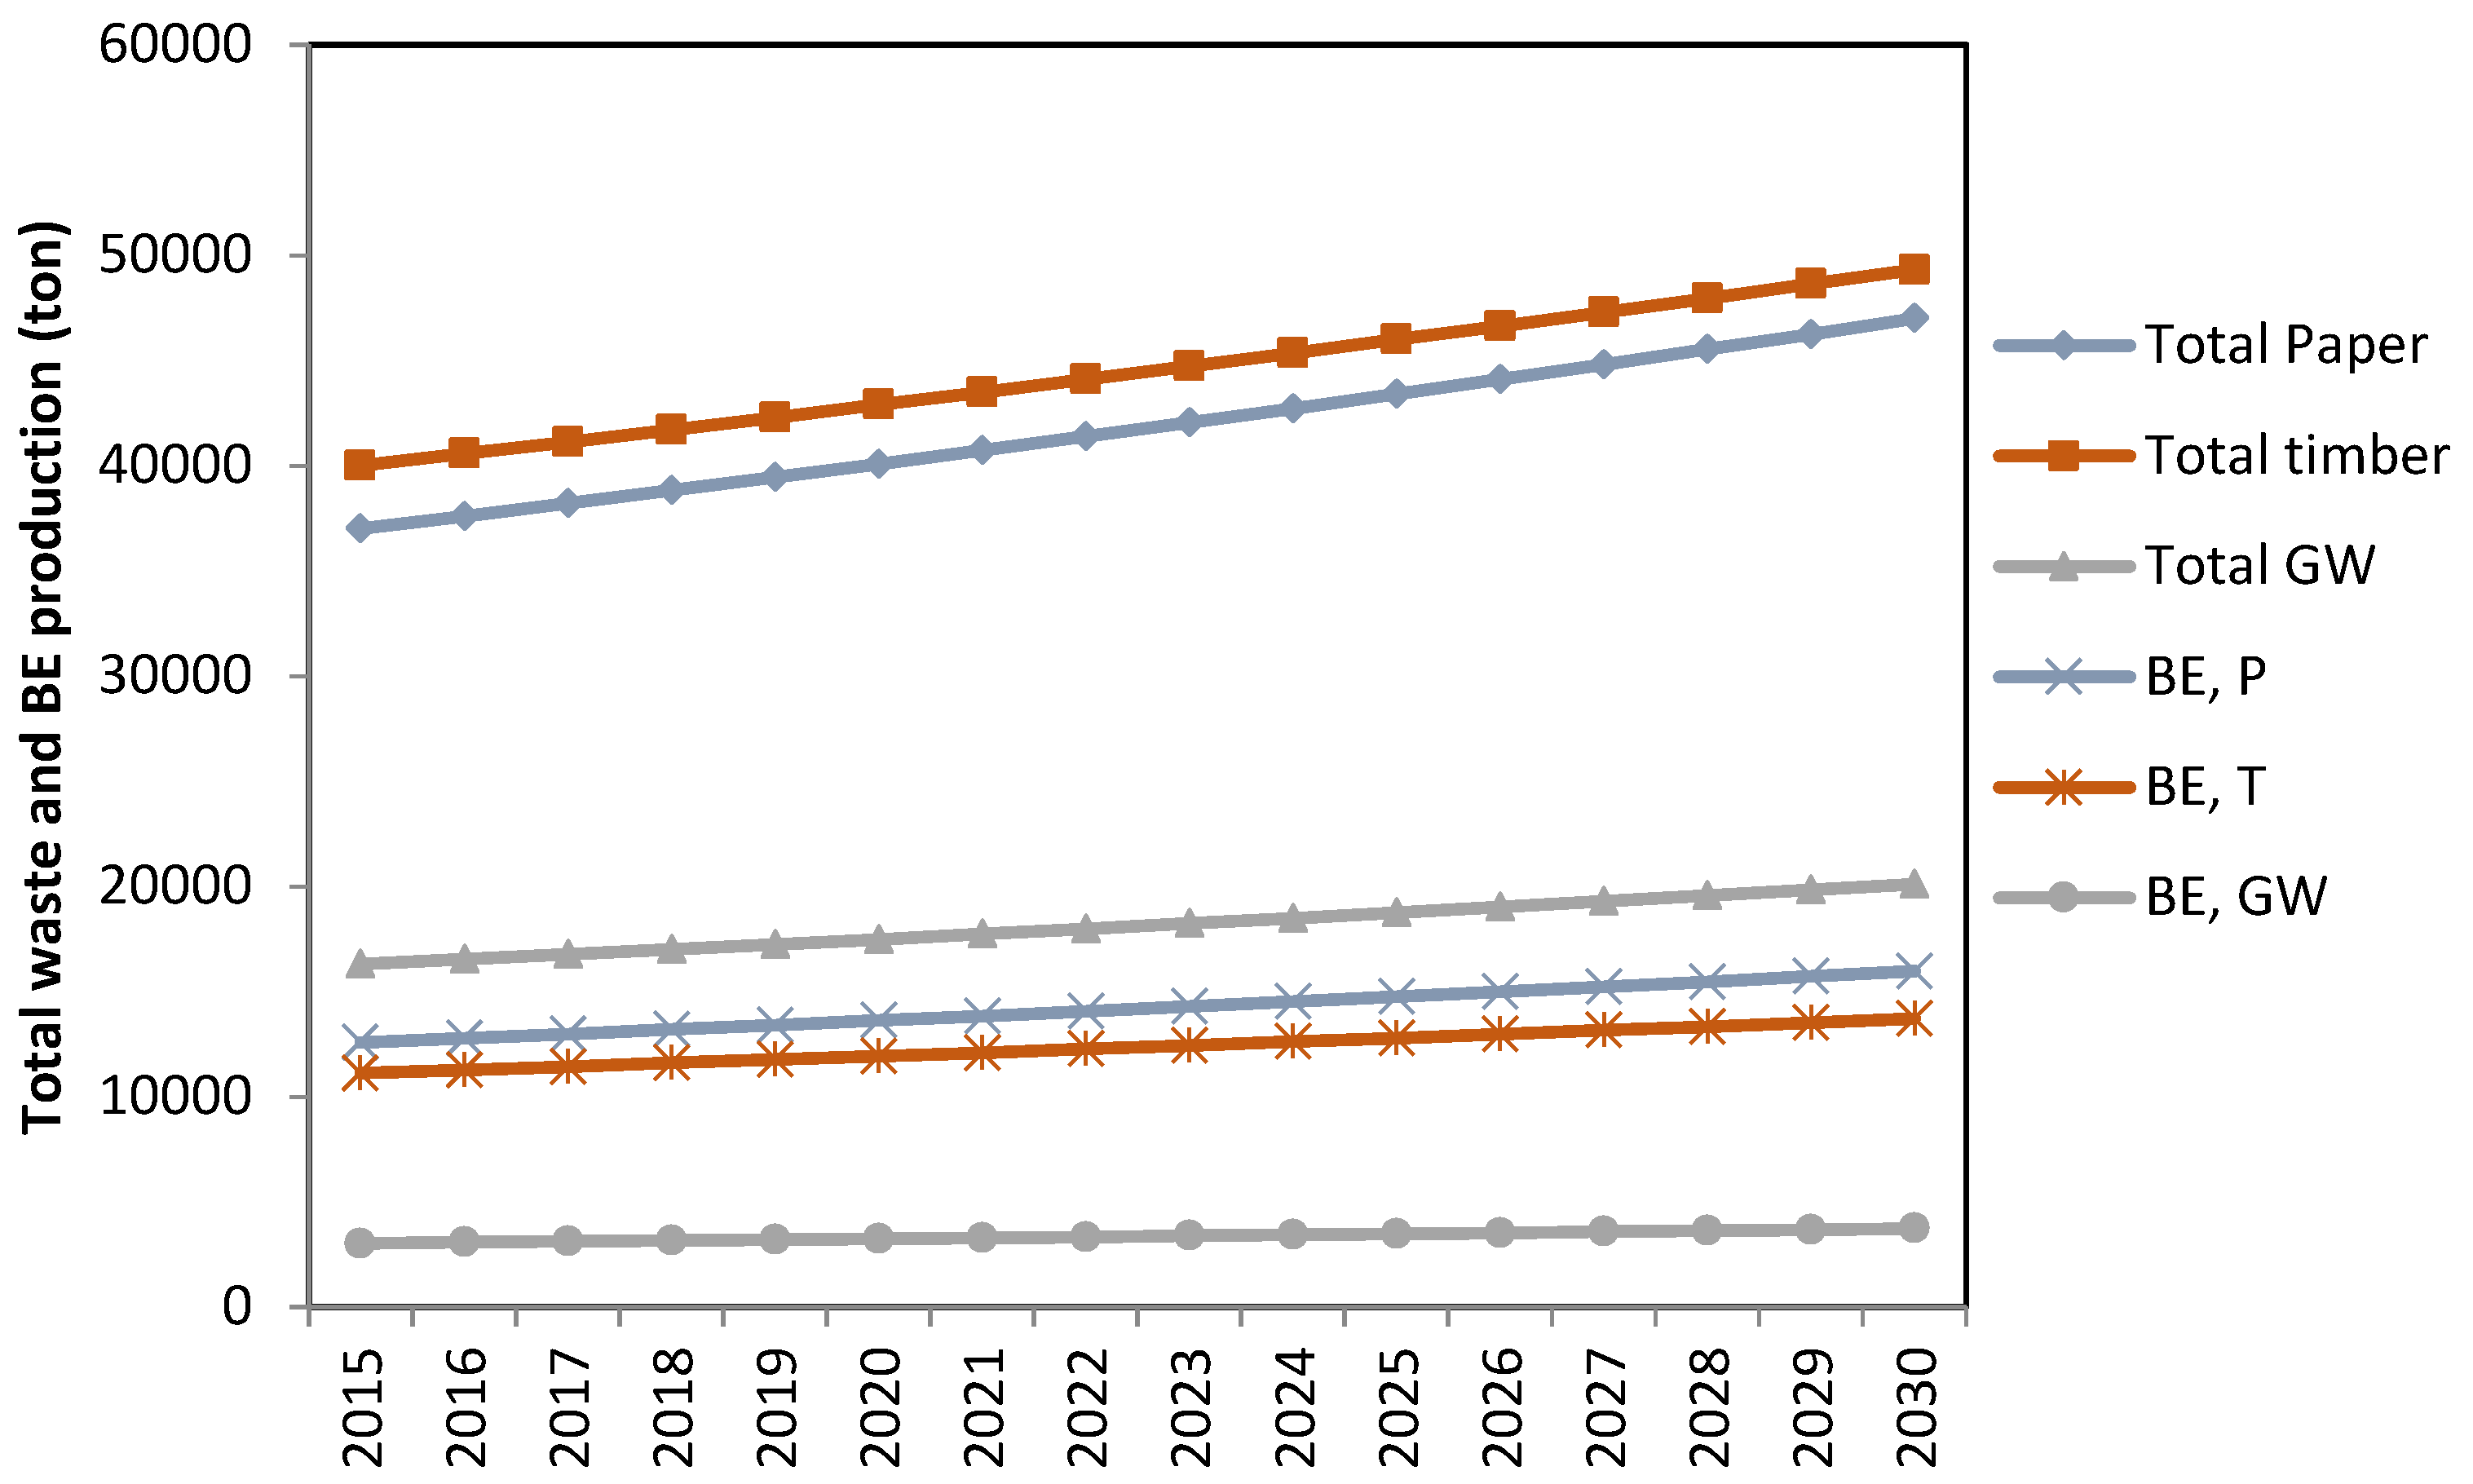
Figure 9.
Total bioethanol production in 2015.


Table 1.
Information regarding waste operation in the main parts of Iceland in 2006.
| Participating Areas | Operator Company | No Municipalities | Waste Quantity (1000 tons) |
|---|---|---|---|
| Western Iceland | Sorpurðun Vesturlands | 10 | 29 |
| Suðurnes | Kalka | 5 | 22 |
| Capital area | Sorpa | 8 | 272 |
| Southern Iceland | Sorpstöð Suðurlands | 11 | 33 |
Table 2.
Energy and chemicals consumption through the various bioethanol production systems.
| Chemicals | Units | Dilute Acid | Dilute Alkali | Hot Water | Steam Explosion |
|---|---|---|---|---|---|
| Water | m3/tonb | 1.422 | 1.44 | 1.387 | 0.934 |
| Sulphuric acid | kg/tonb | 49.04 | 11.40 | 0.00 | 0.00 |
| Ca hydroxide | kg/tonb | 23.88 | 0.00 | 0.00 | 0.00 |
| DAP | kg/tonb | 0.316 | 0.32 | 0.32 | 0.32 |
| Cellulase | kg/tonb | 62.40 | 72.00 | 72.00 | 68.00 |
| Yeast | kg/tonb | 0.79 | 0.79 | 0.79 | 0.79 |
| Sodium hydroxide | kg/tonb | 0.00 | 0.40 | 0.00 | 0.00 |
| Electricity | kwh/tonb | 133.44 | 123.50 | 123.28 | 124.00 |
| Steam | MJ/tonb | 4870.80 | 4731.60 | 4936.80 | 3102.00 |
Table 3.
Inputs costs and output prices in bioethanol production system.
| Items | Unit | Quantity |
|---|---|---|
| Waste cost | $/kg | 0.014 |
| Chemicals cost | ||
| a. Sulphuric acid | $/kg | 0.035 |
| b. Ca hydroxide | $/kg | 0.1 |
| c. DAP | $/kg | 0.21 |
| d. Cellulase | $/kg | 0.52 |
| e. Yeast | $/kg | 2.3 |
| f. Sodium hydroxide | $/kg | 0.45 |
| Water cost (usage fee) | $/m3 | 0.32 |
| Energy cost | ||
| a. Electricity | $/kwh | 0.03 |
| b. Truck diesel | $/L | 1.08 |
| Capital cost of bioethanol production by using: | ||
| a. Dilute acid | $/tonb | 457.52 |
| b. Dilute alkali | $/tonb | 410.93 |
| c. Hot water | $/tonb | 407.78 |
| d. Steam explosion | $/tonb | 363.45 |
| Product price | ||
| Bioethanol | $/kg | 0.85 |
| Lignin | $/kg | 0.25 |
Table 4.
Energy coefficients for different inputs and outputs to the bioethanol production system.
| Input | Unit | Energy Coefficient (MJ/unit) |
|---|---|---|
| Diesel fuel | L | 47.80 |
| Electricity | kWh | 11.93 |
| Chemicals and machinery in bioethanol production | tonb | 37.5 |
| Bioethanol | kg | 29.3 |
| Lignin | kg | 21.13 |
Table 5.
Rank order of bioethanol systems based on sustainability indicators.
| Systems | BPC | EUE | GHG Emission | Water Consumption | Production Yield |
|---|---|---|---|---|---|
| SE,P | 1 | 1 | 1 | 1 | 4 |
| HW,P | 2 | 4 | 2 | 3 | 3 |
| DAL,P | 3 | 2 | 9 | 5 | 2 |
| DA,P | 5 | 5 | 5 | 4 | 1 |
| SE,T | 4 | 3 | 3 | 2 | 8 |
| HW,T | 6 | 7 | 4 | 6 | 7 |
| DAL,T | 7 | 6 | 10 | 8 | 6 |
| DA,T | 8 | 8 | 8 | 7 | 5 |
| SE,G | 9 | 9 | 6 | 9 | 12 |
| HW,G | 10 | 11 | 7 | 10 | 11 |
| DAL,G | 11 | 10 | 12 | 12 | 10 |
| DA,G | 12 | 12 | 11 | 11 | 9 |
© 2018 by the authors. Licensee MDPI, Basel, Switzerland. This article is an open access article distributed under the terms and conditions of the Creative Commons Attribution (CC BY) license (http://creativecommons.org/licenses/by/4.0/).
Share and Cite
MDPI and ACS Style
Safarian, S.; Unnthorsson, R. An Assessment of the Sustainability of Lignocellulosic Bioethanol Production from Wastes in Iceland. Energies 2018, 11, 1493. https://doi.org/10.3390/en11061493
AMA Style
Safarian S, Unnthorsson R. An Assessment of the Sustainability of Lignocellulosic Bioethanol Production from Wastes in Iceland. Energies. 2018; 11(6):1493. https://doi.org/10.3390/en11061493
Chicago/Turabian StyleSafarian, Sahar, and Runar Unnthorsson. 2018. "An Assessment of the Sustainability of Lignocellulosic Bioethanol Production from Wastes in Iceland" Energies 11, no. 6: 1493. https://doi.org/10.3390/en11061493
Note that from the first issue of 2016, this journal uses article numbers instead of page numbers. See further details here.