1. Introduction
The relationship between economic growth and environmental pressure has been intensively discussed [
1,
2,
3]. In recent years, green economic growth has attracted worldwide attention as a way to maintain rapid economic development while limiting environmental degradation. Like the term “green economy,” “decoupling” refers to the ability of an economy to grow without a corresponding increase in environmental pressure [
4]. Today, decoupling environmental impacts from human well-being has been widely acknowledged by policy-makers, industry leaders, and civil society as a key issue to address in meeting sustainable development goals [
5]. In the field of sustainability studies, following the environmental Kuznets curve (EKC) hypothesis [
6], decoupling analysis has become increasingly popular, and there is a growing body of literature on the decoupling method and indicators of decoupling [
7,
8,
9,
10,
11,
12]. Indeed, as a policy goal, decoupling environmental impact from economic growth has been adopted by the European Union (EU) and the Green Economy Initiative of the United Nations Environment Program (UNEP) [
13].
Climate change is one of the greatest challenges to mankind today. The increases in anthropogenic greenhouse gases (GHGs), including carbon dioxide (CO
2), methane (CH
4), and nitrous oxide (N
2O), have important effects on global warming [
14,
15]. Many studies have empirically assessed the potential impact of human activities or production sectors on global warming by quantifying the carbon footprint (CF) [
16,
17,
18]. Modern agriculture is usually accompanied by high material inputs, high energy consumption, and high release of pollutants, which all play an important role in GHG emissions [
19]. Extensive studies have evaluated agricultural CFs associated with material inputs or based on life cycle assessment (LCA). LCA is a commonly used environmental management tool to assess a product or service from “cradle to grave” [
20]. The literature on evaluating the CFs of crop production generally quantified the GHG emissions from sowing to harvest, including the indirect emissions from agricultural material inputs and the direct emissions from energy consumption for farm mechanical operations, N
2O from N fertilizer use or the CH
4 emissions from rice paddies [
21,
22,
23,
24]. Studies of CFs for a diverse range of crops have been performed at different geographical scales using national statistical data or farm survey data [
17,
25,
26,
27,
28], and other studies have described a certain crop’s CF in more detail, such as for rice [
29,
30,
31], spring barley [
32], and wheat [
33]. In addition, GHG emissions under different cropping systems and farm management practices have been addressed in detail [
21,
22,
23,
34,
35], and the CFs of crop production have also been compared across countries [
27]. All these studies have helped to further explore measures to mitigate agricultural GHG emissions and have put forward potential solutions to develop low-carbon agriculture.
China is a major agricultural producer, and GHG emissions in the agricultural sector account for 17% of the national total [
36]. According to previous studies, the CFs of crop production in China [
37] were higher than those in the USA [
27] and the UK [
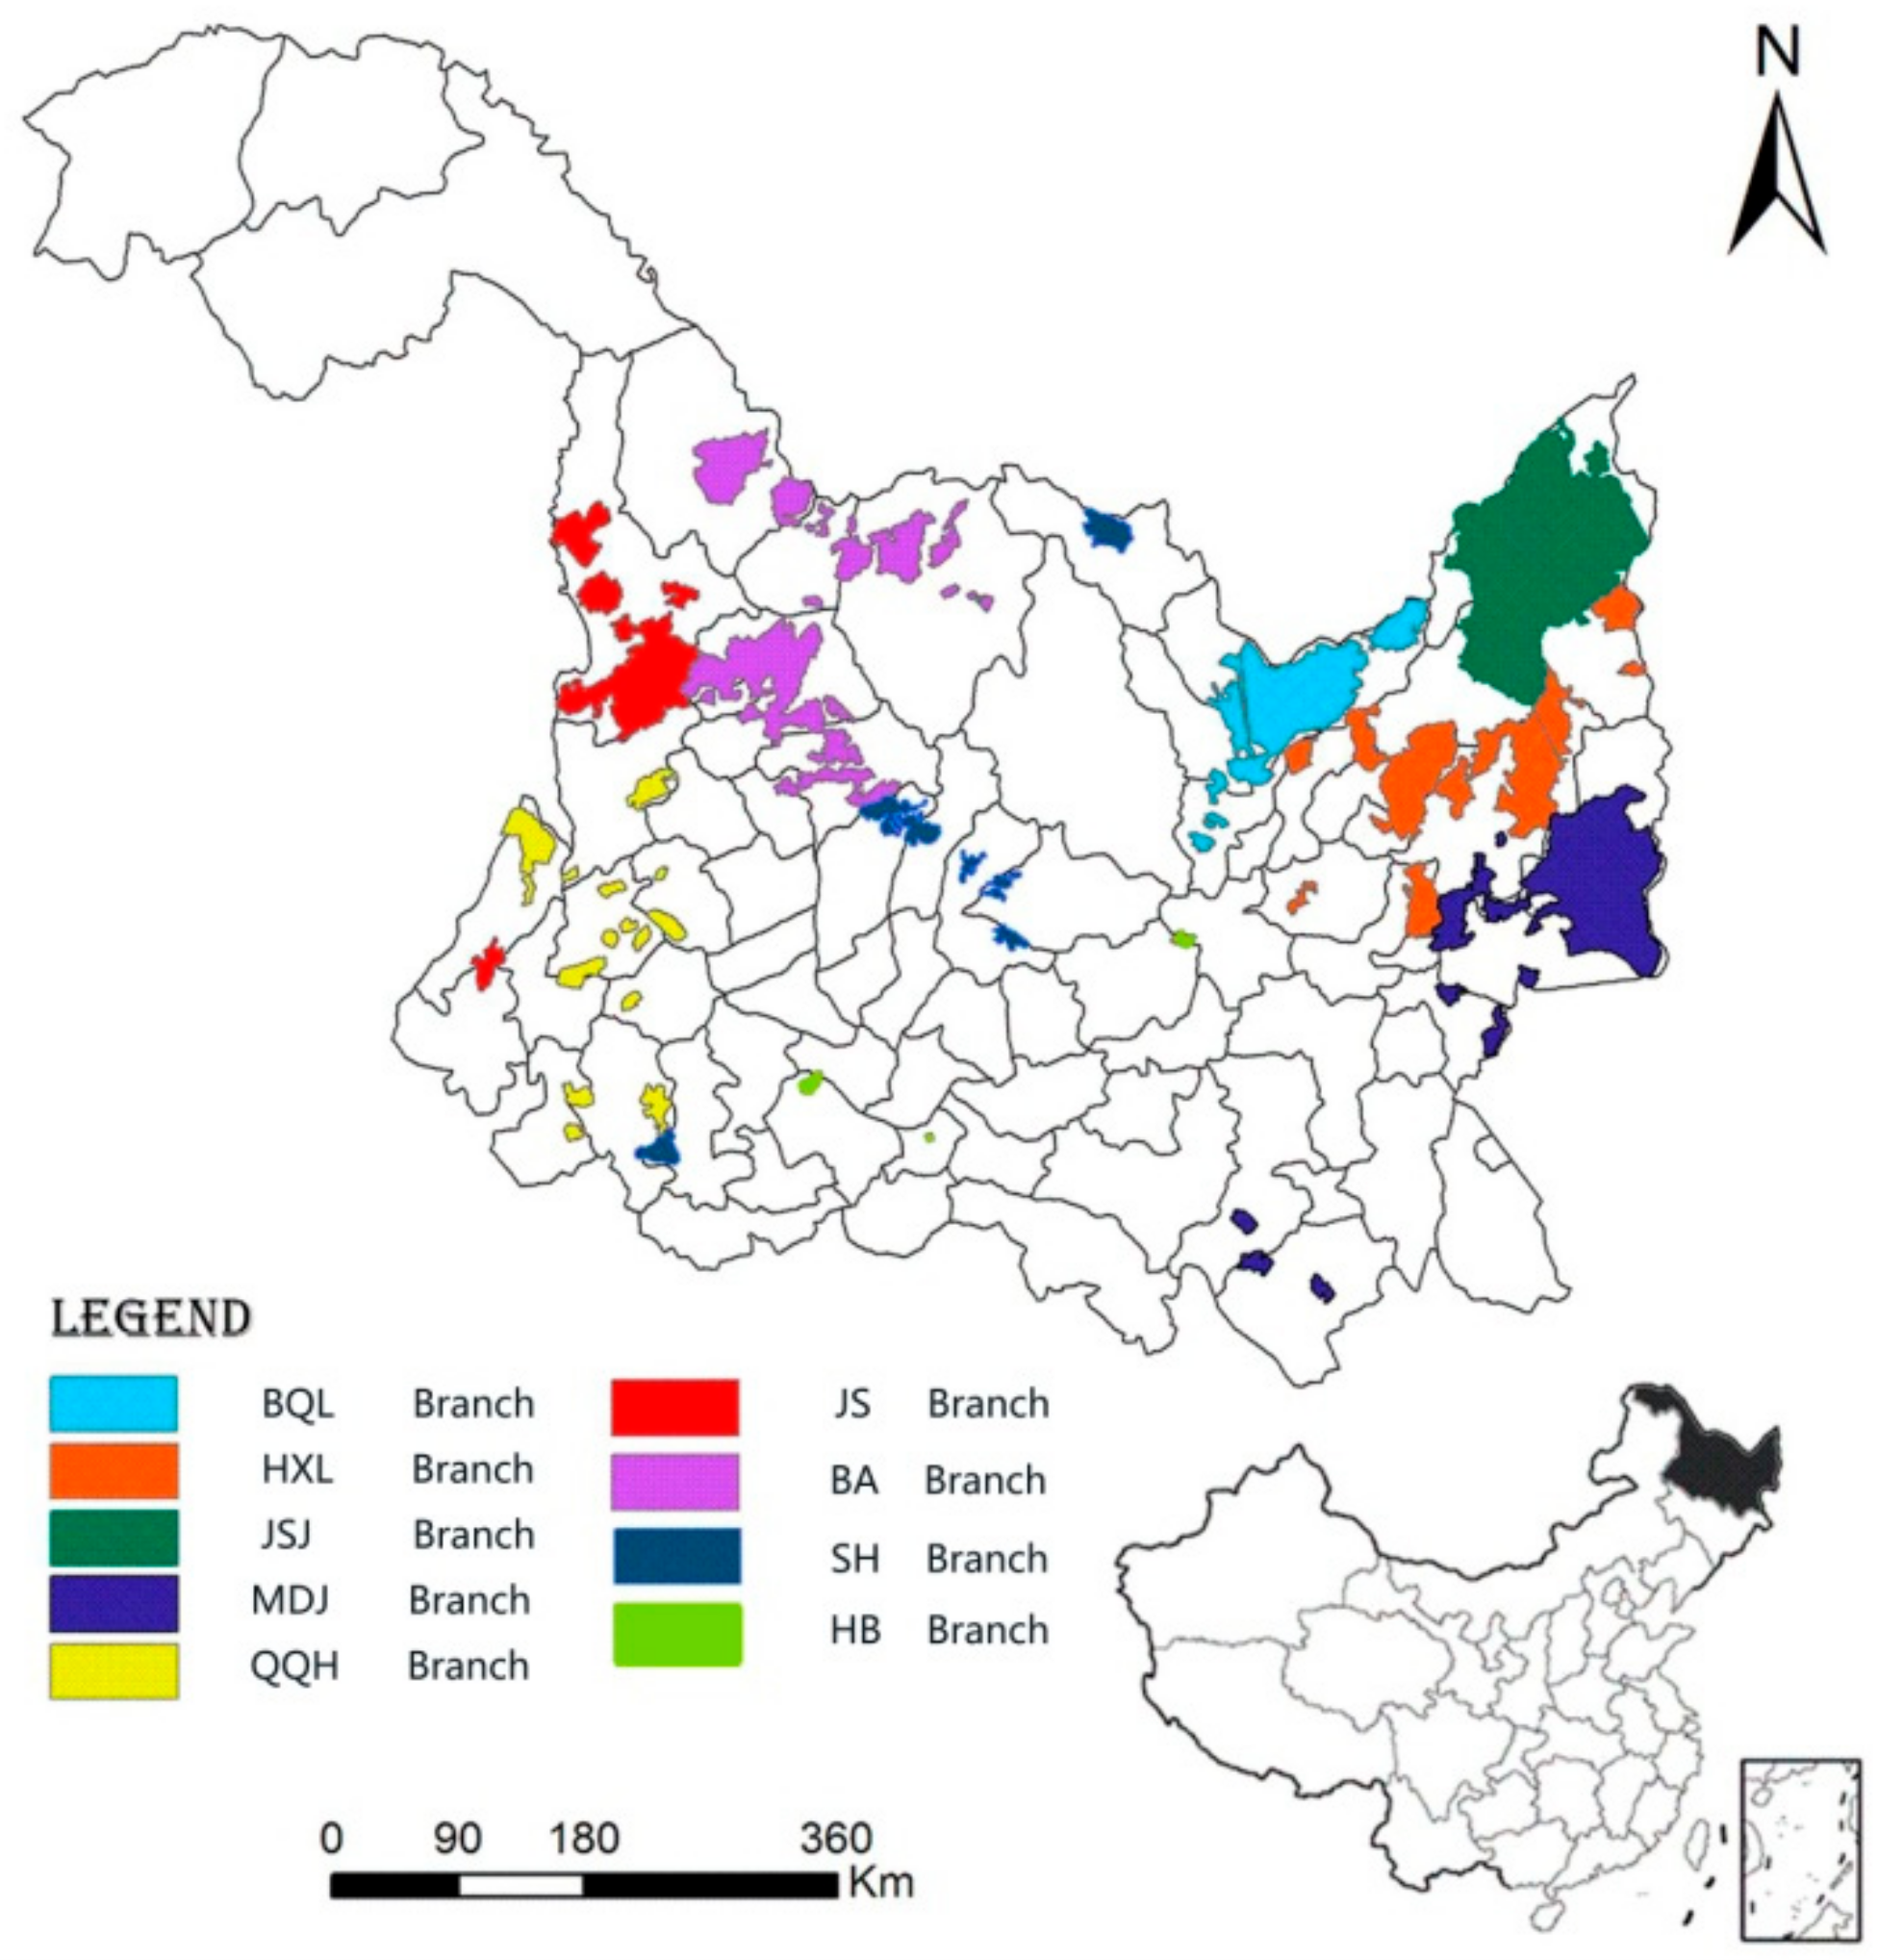
17] based on national statistical data. From the perspective of sustainability assessment, it is not enough to evaluate mitigation measures depending only on emissions reduction; similarly, it remains difficult to examine if one farming region has taken effective measures to reduce the carbon intensity of agriculture. The Heilongjiang land reclamation area (HLRA) is both the most modern grain production base and the largest green grain production base in China, the application of chemical fertilizers and pesticides in the HLRA is far below the national standard, and its crop yield per unit area exceeds that of the US [
38]. However, it is not clear if its high crop yield occurs at the expense of high GHG emissions. In this study, we use this area as an example to estimate the extent to which GHG emissions are decoupled from crop production.
The objectives of this study are, first, to quantify the CFs of crop production (including rice, maize, soybeans, and wheat) using the LCA approach in the HLRA during 2001–2015; second, to determine the relationship between crop production and GHG emissions based on a decoupling index; and, last, to analyze the composition of the CFs of crop production and further provide targeted suggestions for decision-making for low-carbon agriculture.
The flowchart for the decoupling analysis is shown in
Figure 1.
4. Discussion
Generally, we can evaluate GHG emissions based on the reduction in the carbon footprint; however, some indeterminacy remains when diagnosing the effective quantity of emissions reduction, and we thus need to link it with the economic development process. As a supplementary method, the frame of decoupling focuses on the relationship between economic growth and environmental pressure, which helps to create a better understanding of the nature of green growth, further remove barriers to decoupling, and encourage policies towards decoupling [
5]. Recently, many studies have used a panel VAR approach or a log mean division index (LMDI) decomposition method to analyze the factors that affect GHG emissions in the manufacturing or transport sector [
12,
42,
43,
44,
45]; however, these methods are addressed less in the decoupling of GHG emissions from the agricultural sector. In this discussion section, we compare the carbon footprint of crop production in the HLRA within different countries, analyze the composition of carbon footprint, and further focus on rice production.
4.1. Comparative Analysis of Carbon Footprint
According to Equation (7) for carbon intensity in crop yield, the CF
Y in the HLRA varied by crop. On average, rice production possessed the highest CF
Y (0.36 tCEt
−1), maize production possessed the lowest CF
Y (0.12 tCEt
−1), and the CF
Y for soybean and wheat production showed intermediate values of 0.19 tCEt
−1 and 0.21 tCEt
−1, respectively. Compared with existing research results (
Table 7), most CF
Y values of crop production in the HLRA were lower than the average value in China, except for soybeans (0.10 tCEt
−1), and the CF
Y of soybean and wheat production in the HLRA was close to that of the USA.
We observe a better relationship between crop production and GHG emissions in the HLRA than in other regions of the world. However, as various values of the decoupling index were observed, it did not appear that the carbon intensity of agriculture in the HLRA steadily decreased.
4.2. Composition Analysis of Carbon Footprint
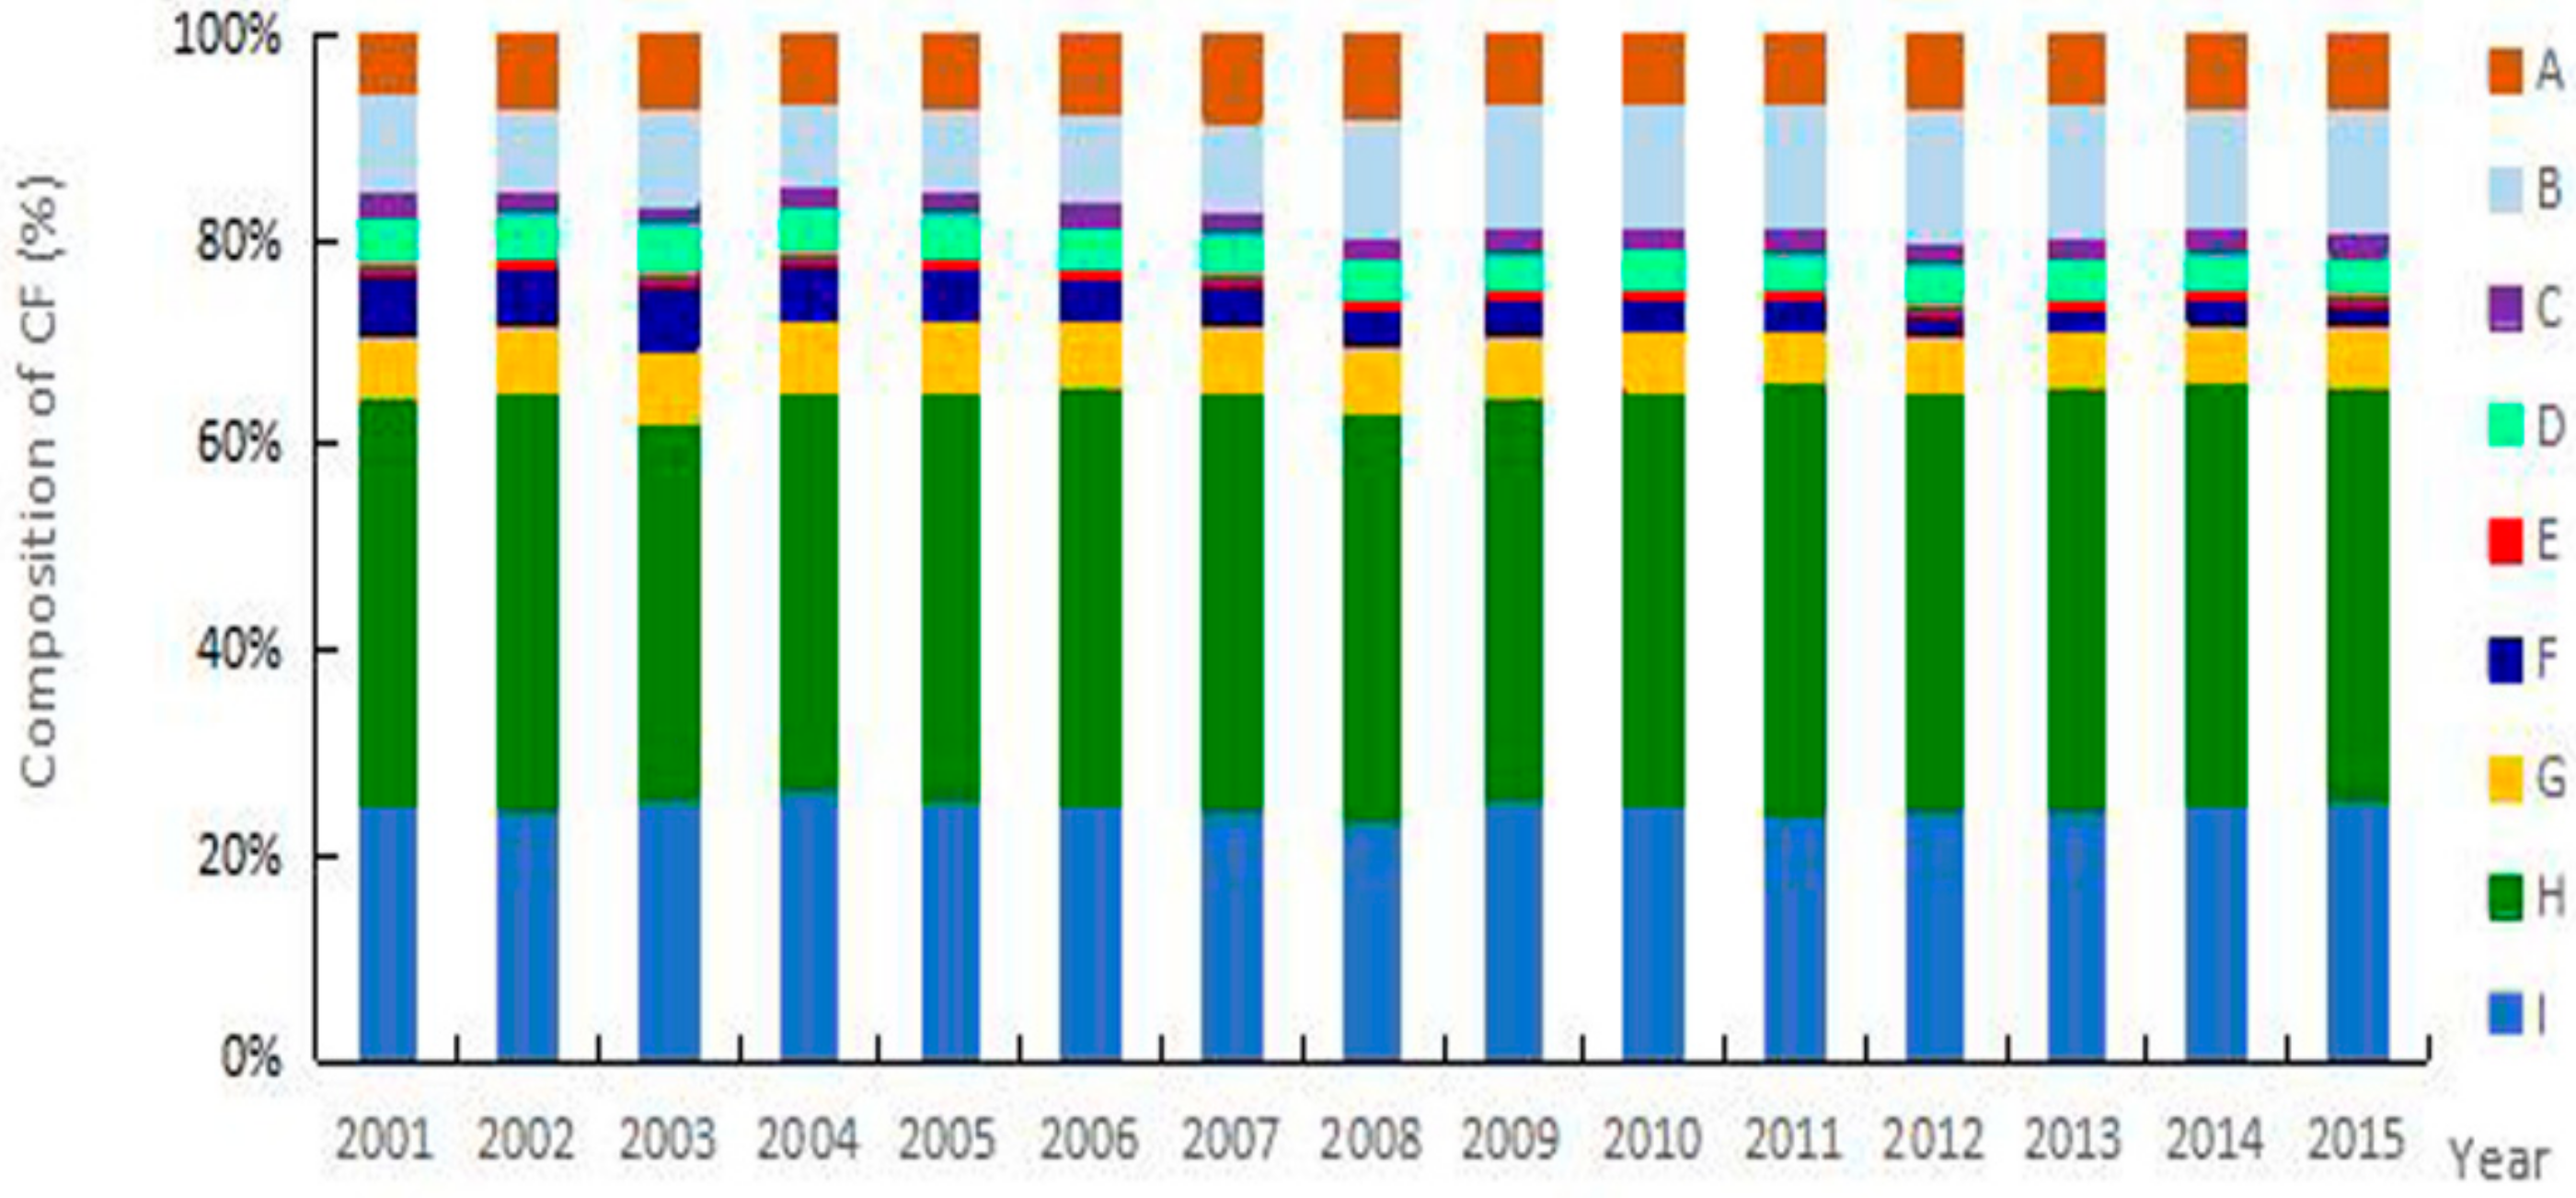
The compositions of the CFs for the four major crops in the HLRA during the period 2001–2015 are shown in
Figure 4. On average, CH
4 was the biggest contributor (41%) to the total CF, which indicated that rice production was the main source of GHG emissions in the HLRA. Direct N
2O emissions and indirect emissions from N fertilizer input together represented the second-biggest contributor (25%), with electricity for irrigation (11%) representing the third-largest contributor to the CF. All other sources, including P fertilizer (4%), seed (4%), plastic films (6%), diesel (7%), and K fertilizer and pesticides (1%), were minor contributors to the HLRA CF.
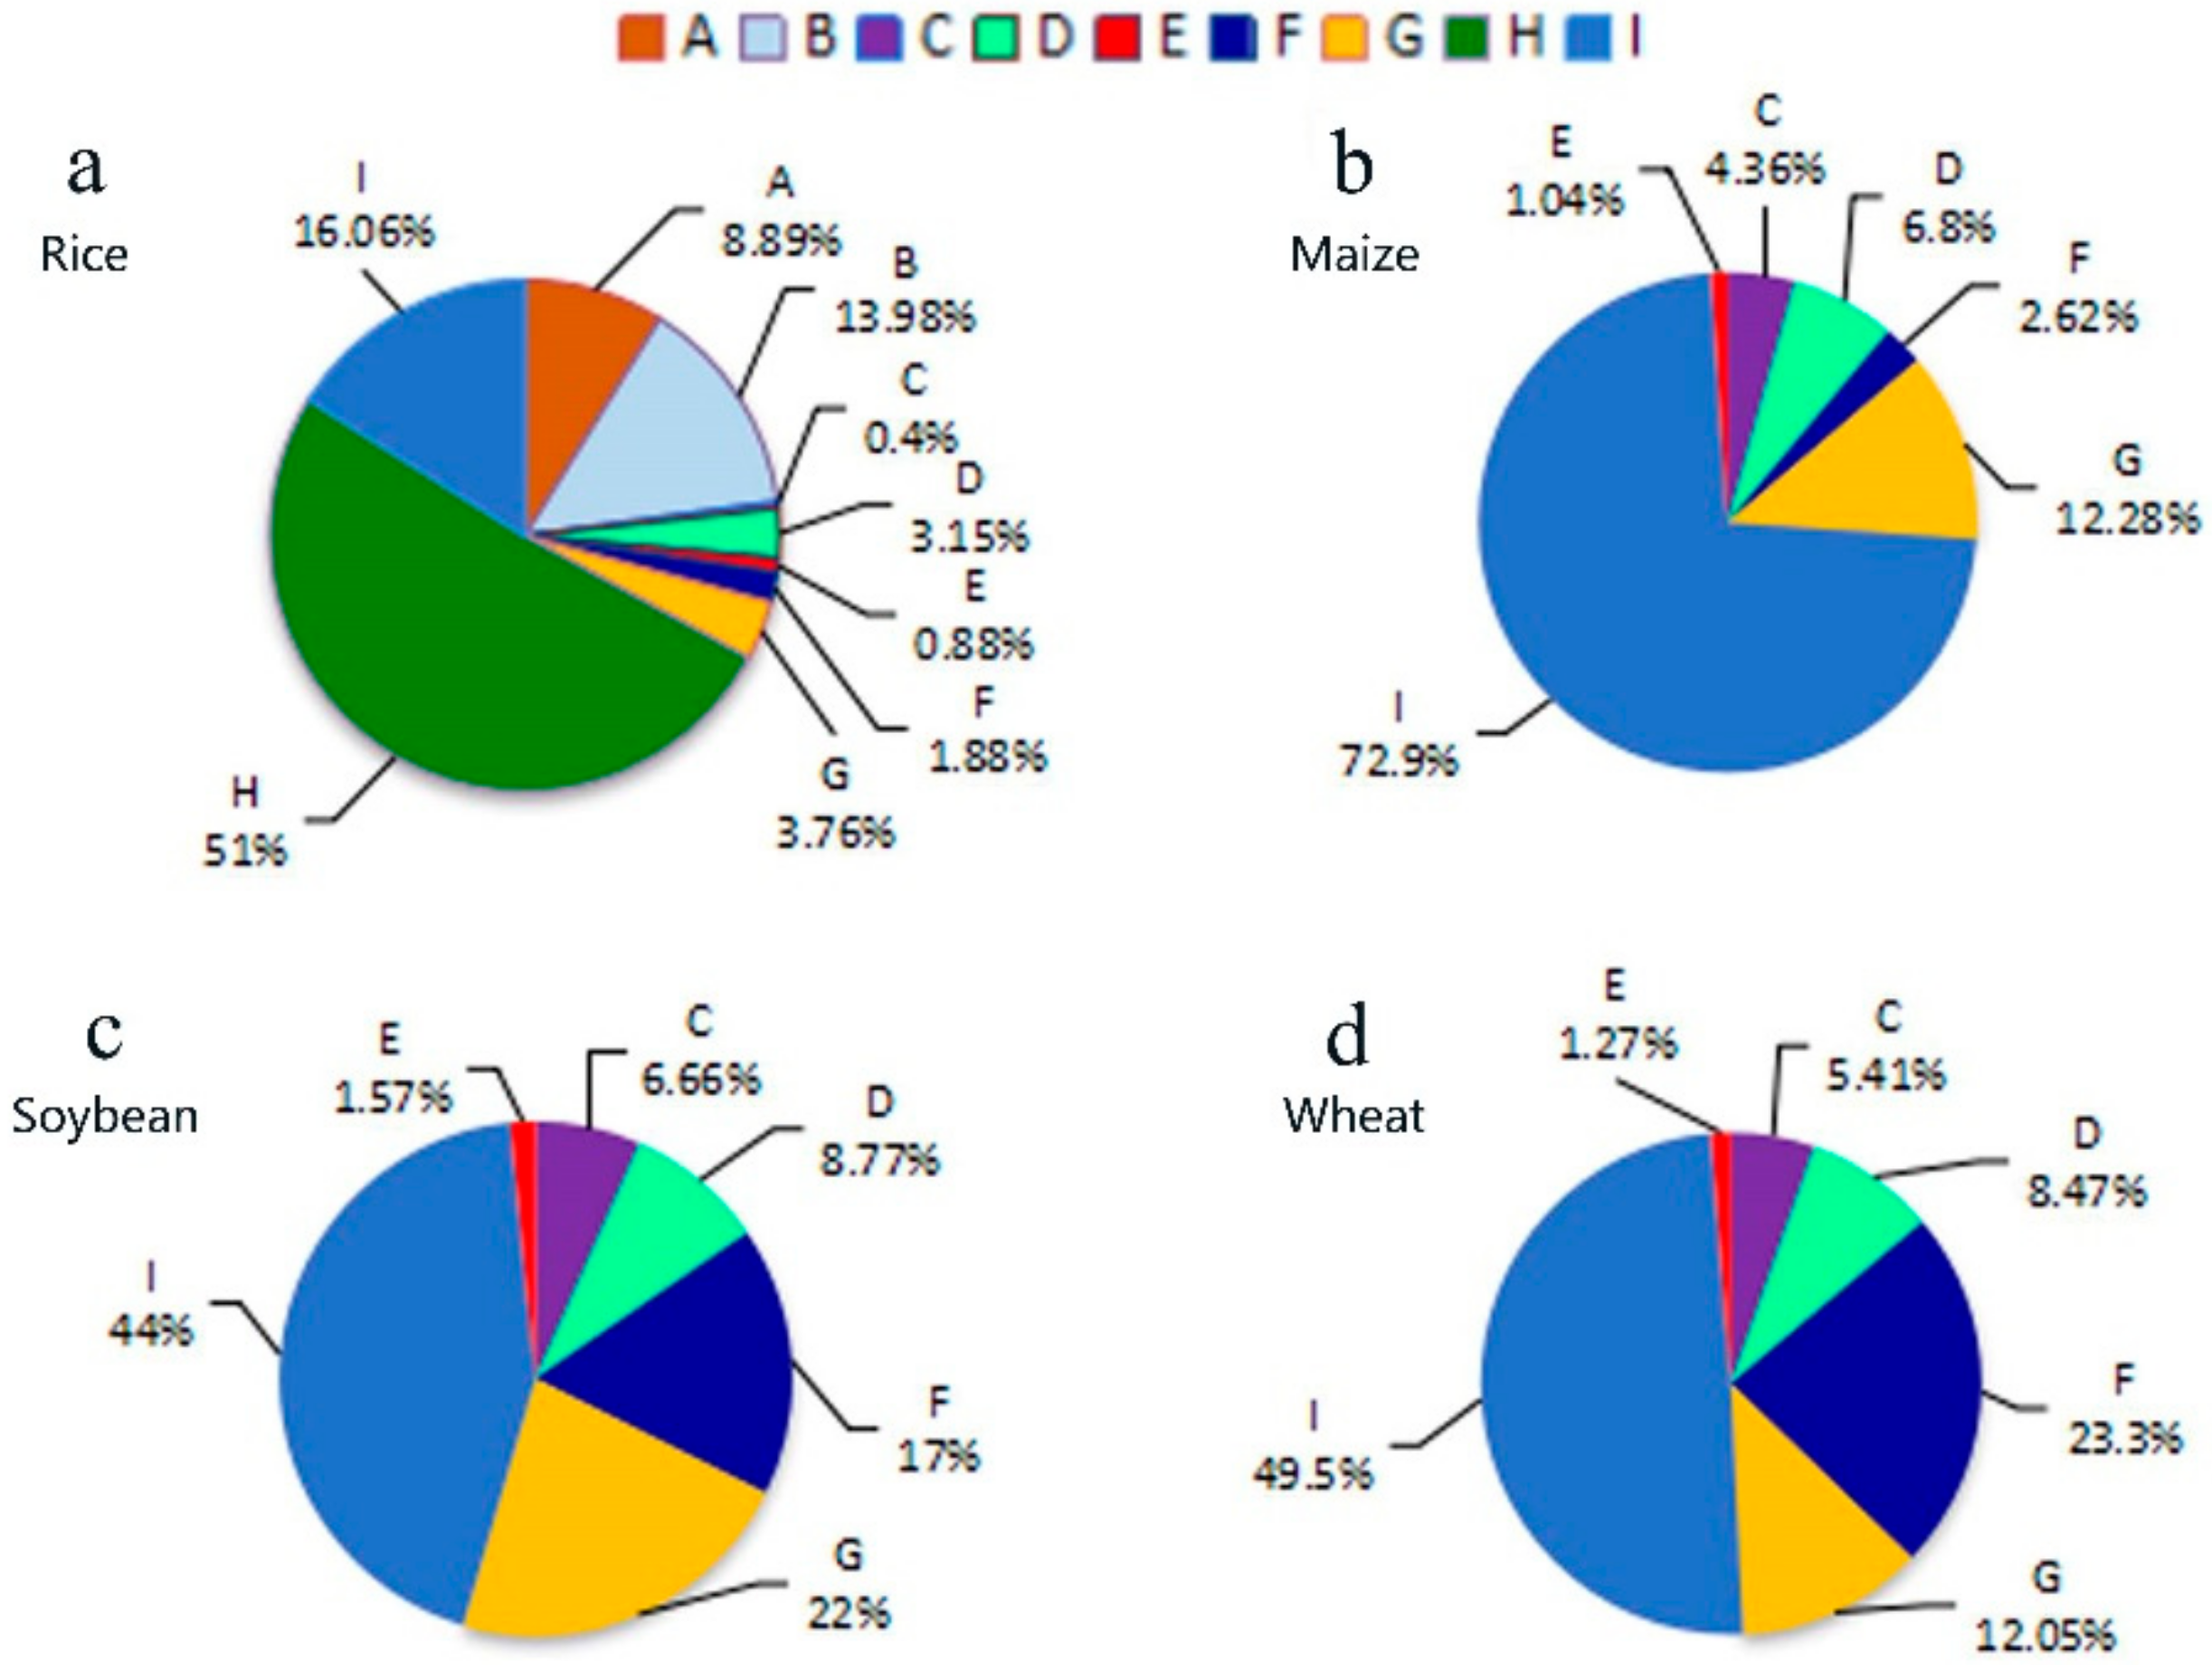
Agricultural material inputs or sources to the HLRA CF are shown in
Figure 5. For rice production, 51% of the CF was derived from CH
4 emissions, followed by the sum of direct N
2O emissions and indirect emissions from N fertilizer use (16.06%), electricity for irrigation (13.98%) and plastic film (8.89%). The remaining five inputs and farming operations amounted to 10.07% of the total CF.
In contrast, the sum of direct N2O emissions and indirect emissions from N fertilizer use was the largest contributor to the CFs of dry crops (maize, soybeans, and wheat), accounting for 72.9%, 44%, and 49.5% of the CF for maize, soybean, and wheat production, respectively. The second largest contributor to the total CFs for both maize and soybean production was diesel (12.28% and 22%, respectively), and seed was the second largest contributor for wheat production (23.3%), followed by diesel (12.05%). Overall, N fertilizer input and N2O from N fertilizer use were the dominant sources of GHG emissions in dry crop production, although CH4 was the dominant source of GHG emissions in rice production. In contrast, pesticides contributed a small amount to each crop’s CF, especially for rice production (0.4%).
4.3. Analysis of the CF of Rice Production
As reported above, rice production played an important role in the HLRA and constituted the vast majority of the CF in this region (80%). In recent decades, eight branches (except the SH branch) experienced a weak decoupling between crop production and GHG emissions (
Table 6). Here, we take the JSJ branch and the SH branch of the HLRA for comparative analysis (
Figure 6 and
Figure 7).
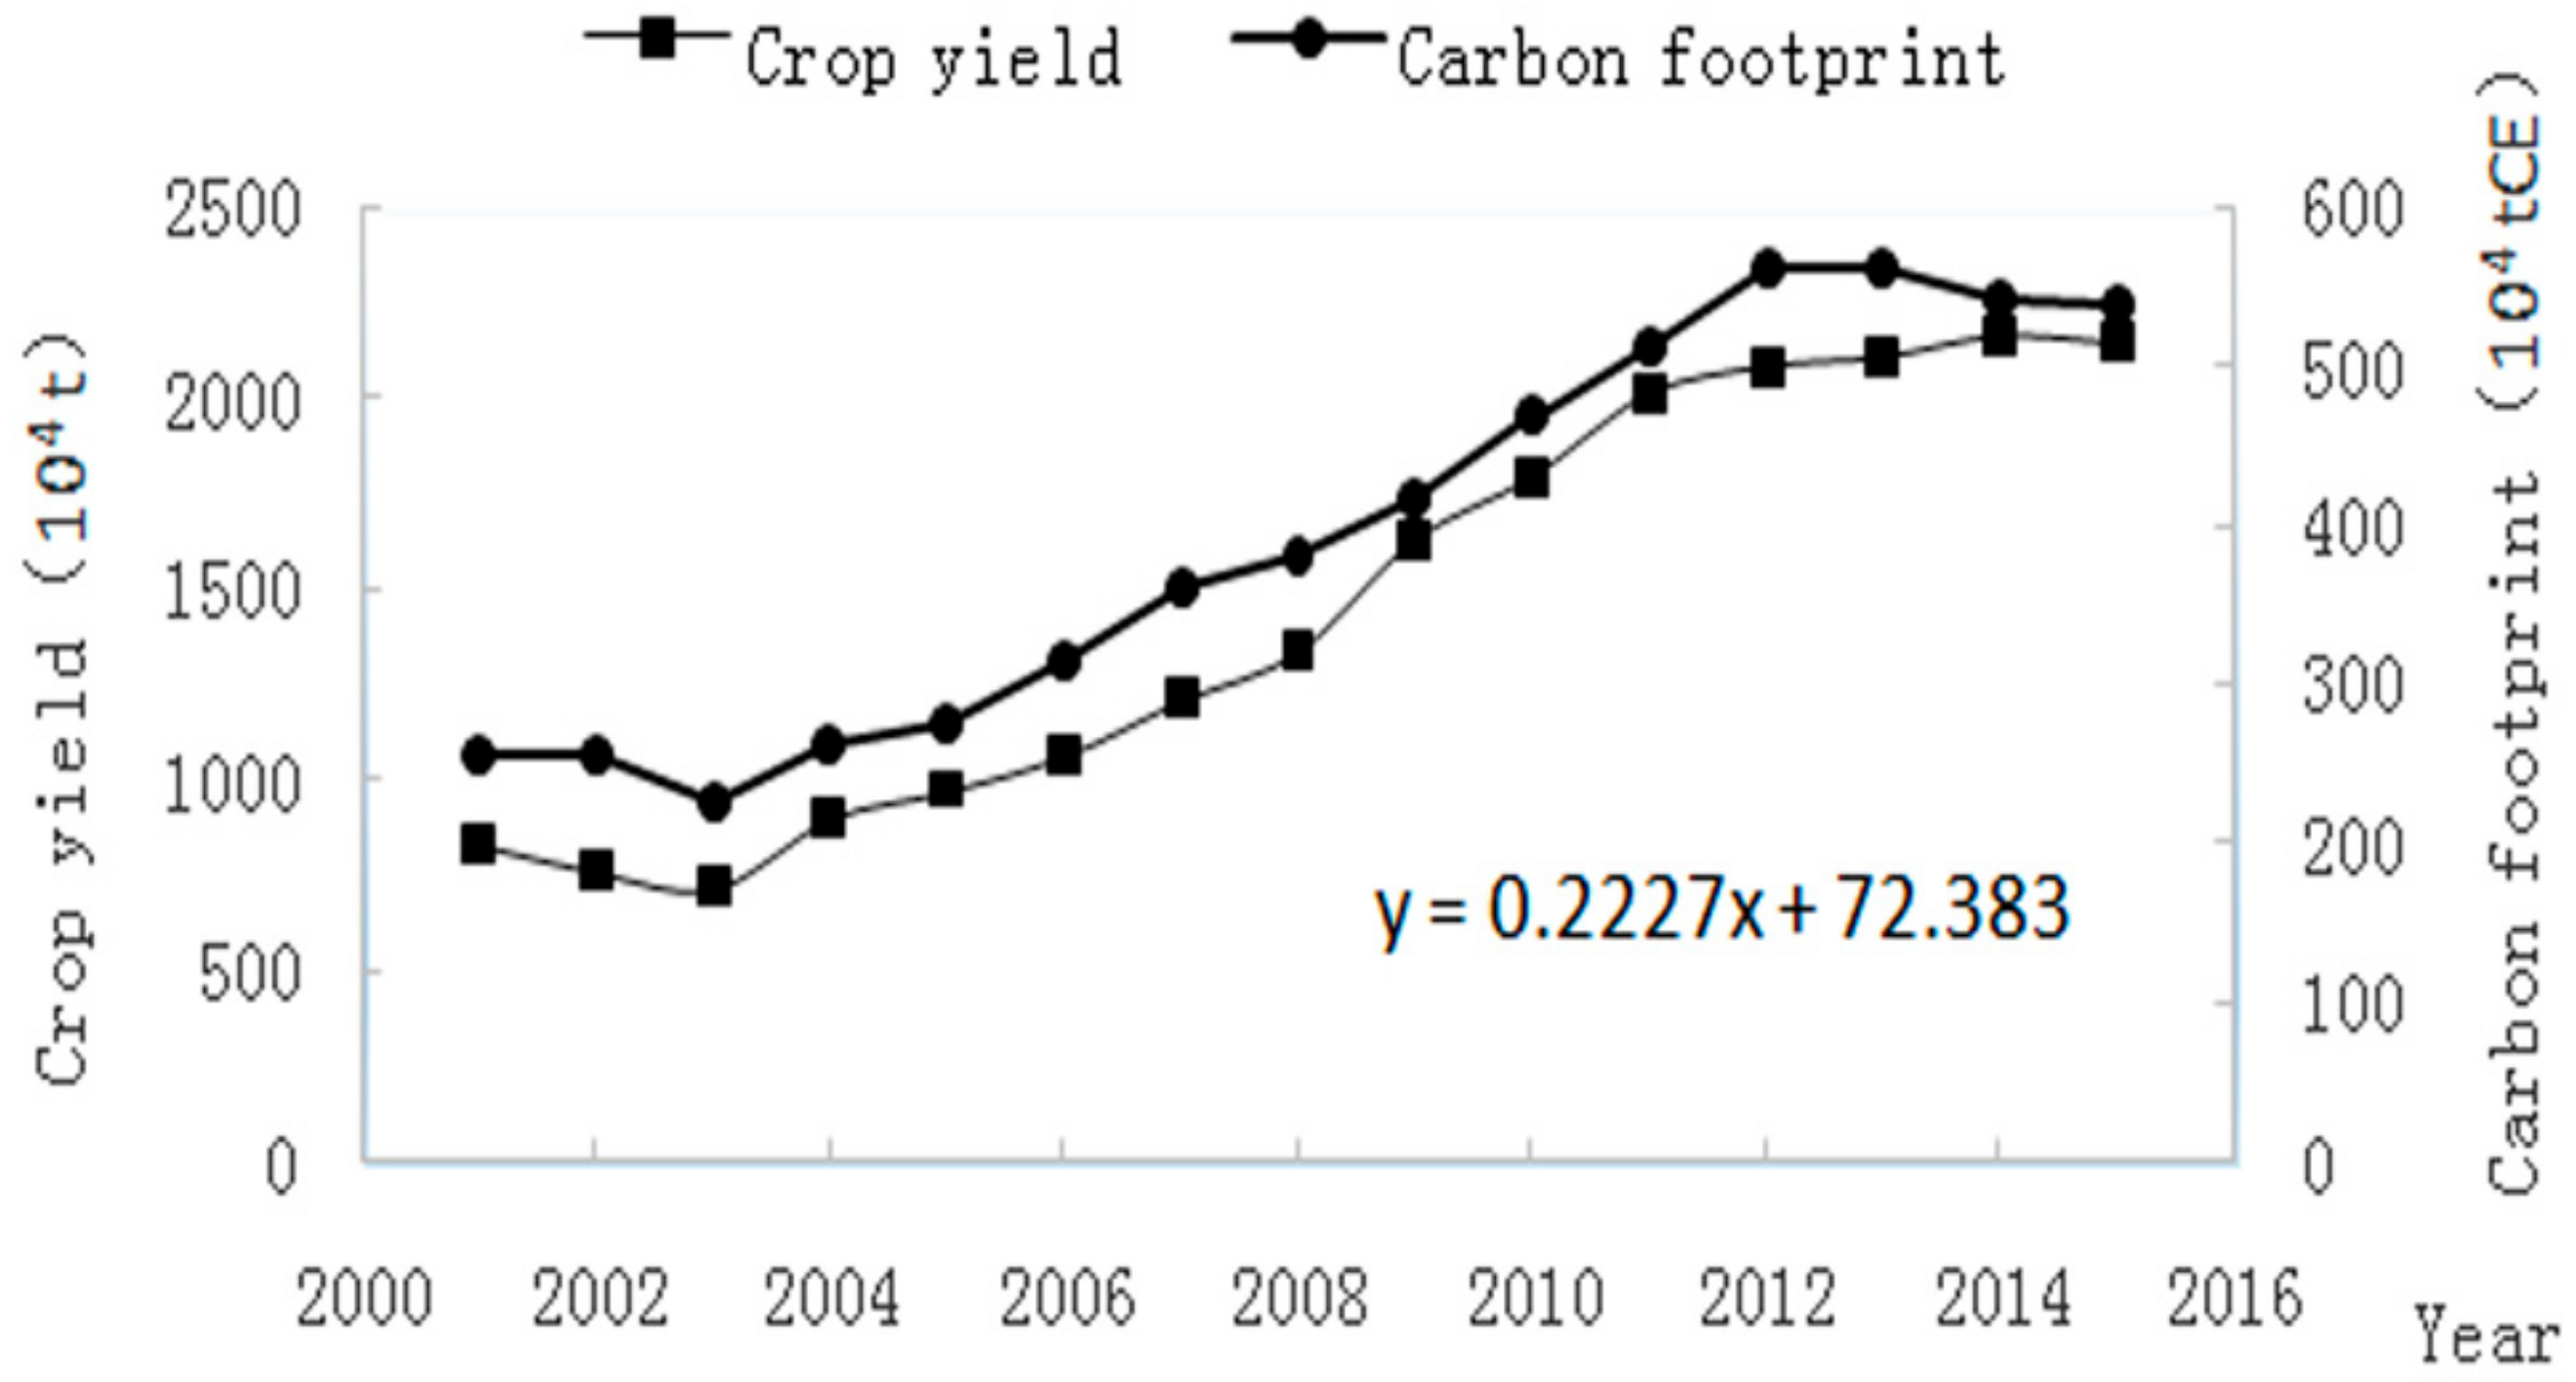
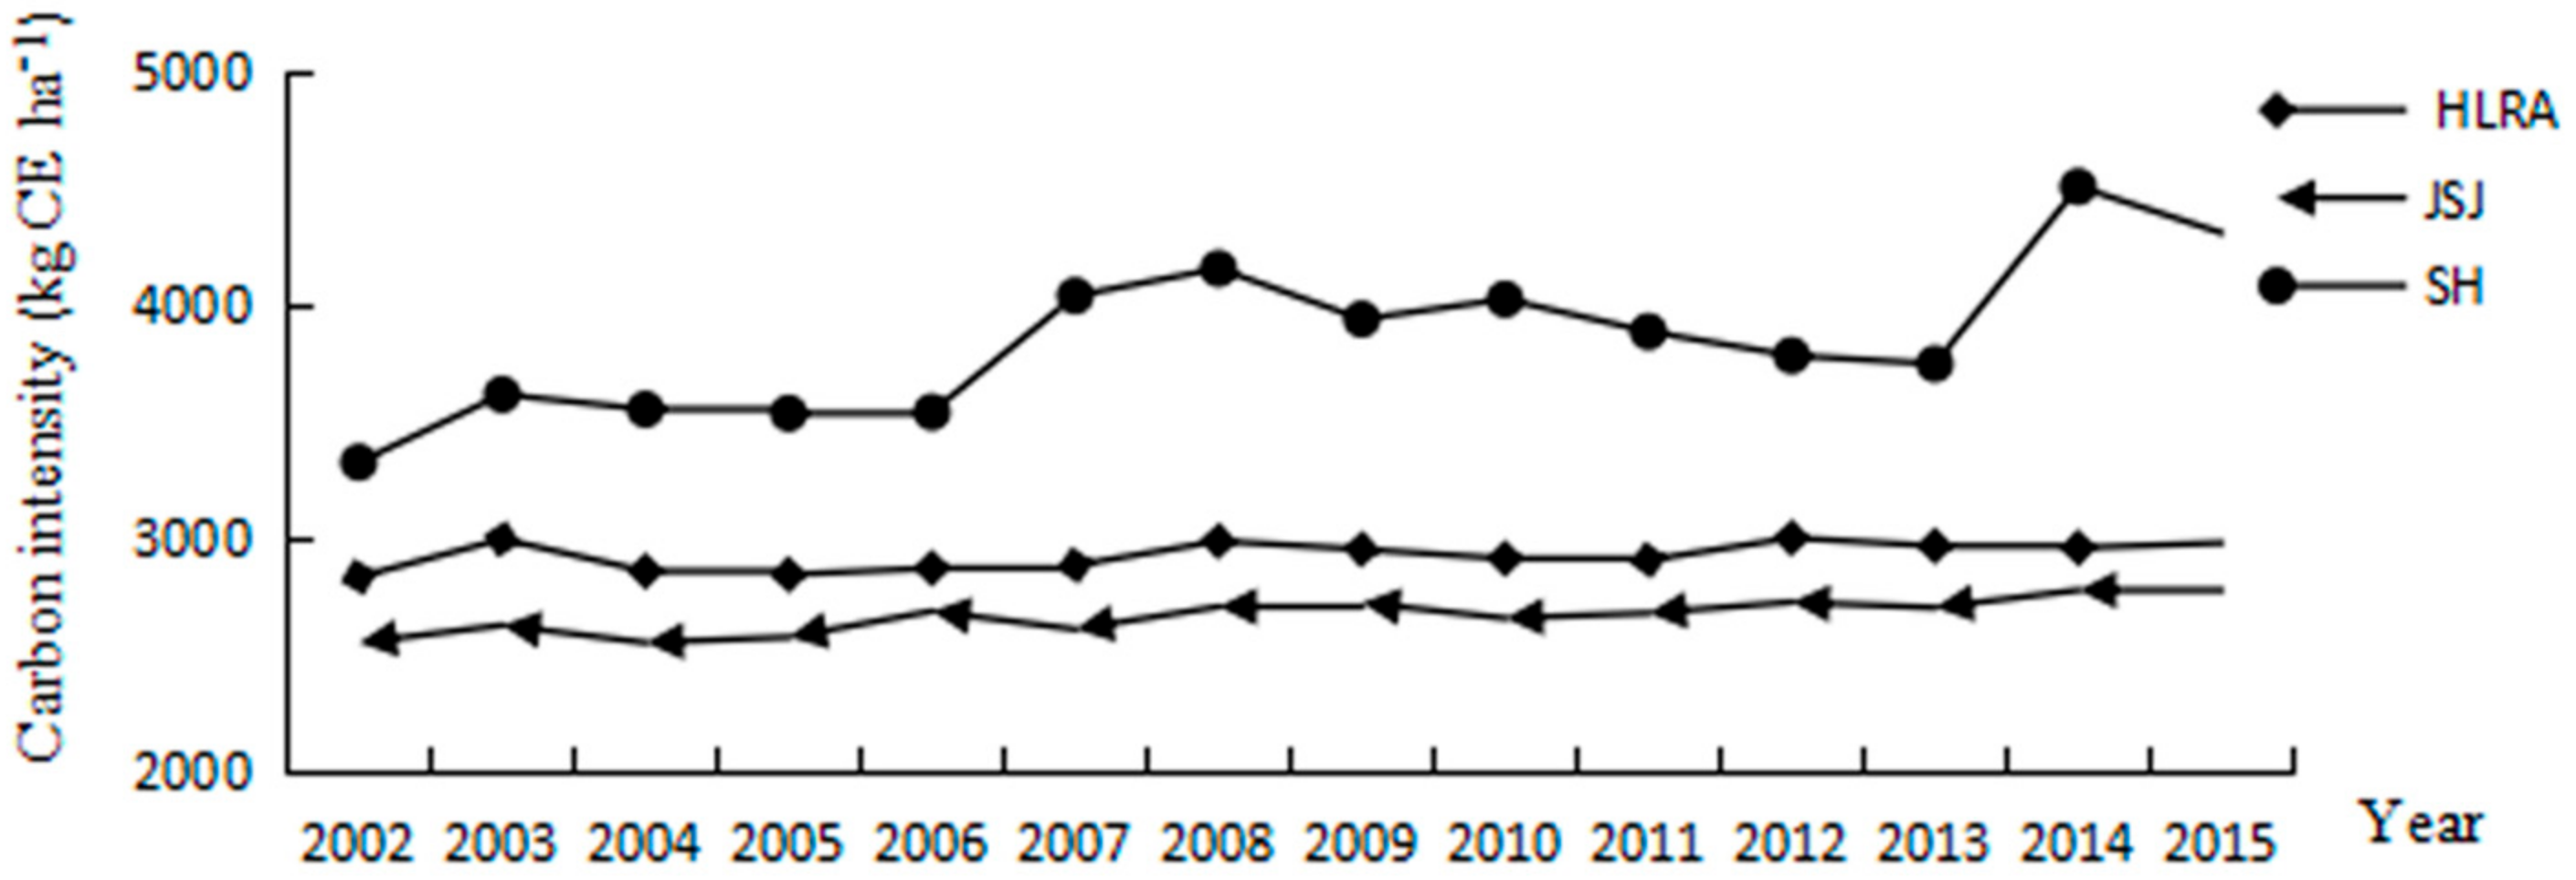
The JSJ branch is the largest branch in the HLRA, and its rice planting area and rice yield occupied 41% and 43% of the HLRA total. In contrast, the rice planting area and rice yield in the SH branch each occupied 2% of the HLRA total. There was a distinct difference in trends between CF and rice yield between these two branches (
Figure 6). According to Equation (8) for carbon intensity per area, the CF
A of rice production in the JSJ branch fluctuated from 2539 kgCEha
−1 to 2775 kgCEha
−1, which was below the average CF
A in the HLRA (2919 kgCEha
−1), whereas the CF
A of rice production in the SH branch fluctuated from 3323 kgCEha
−1 to 4503 kgCEha
−1.
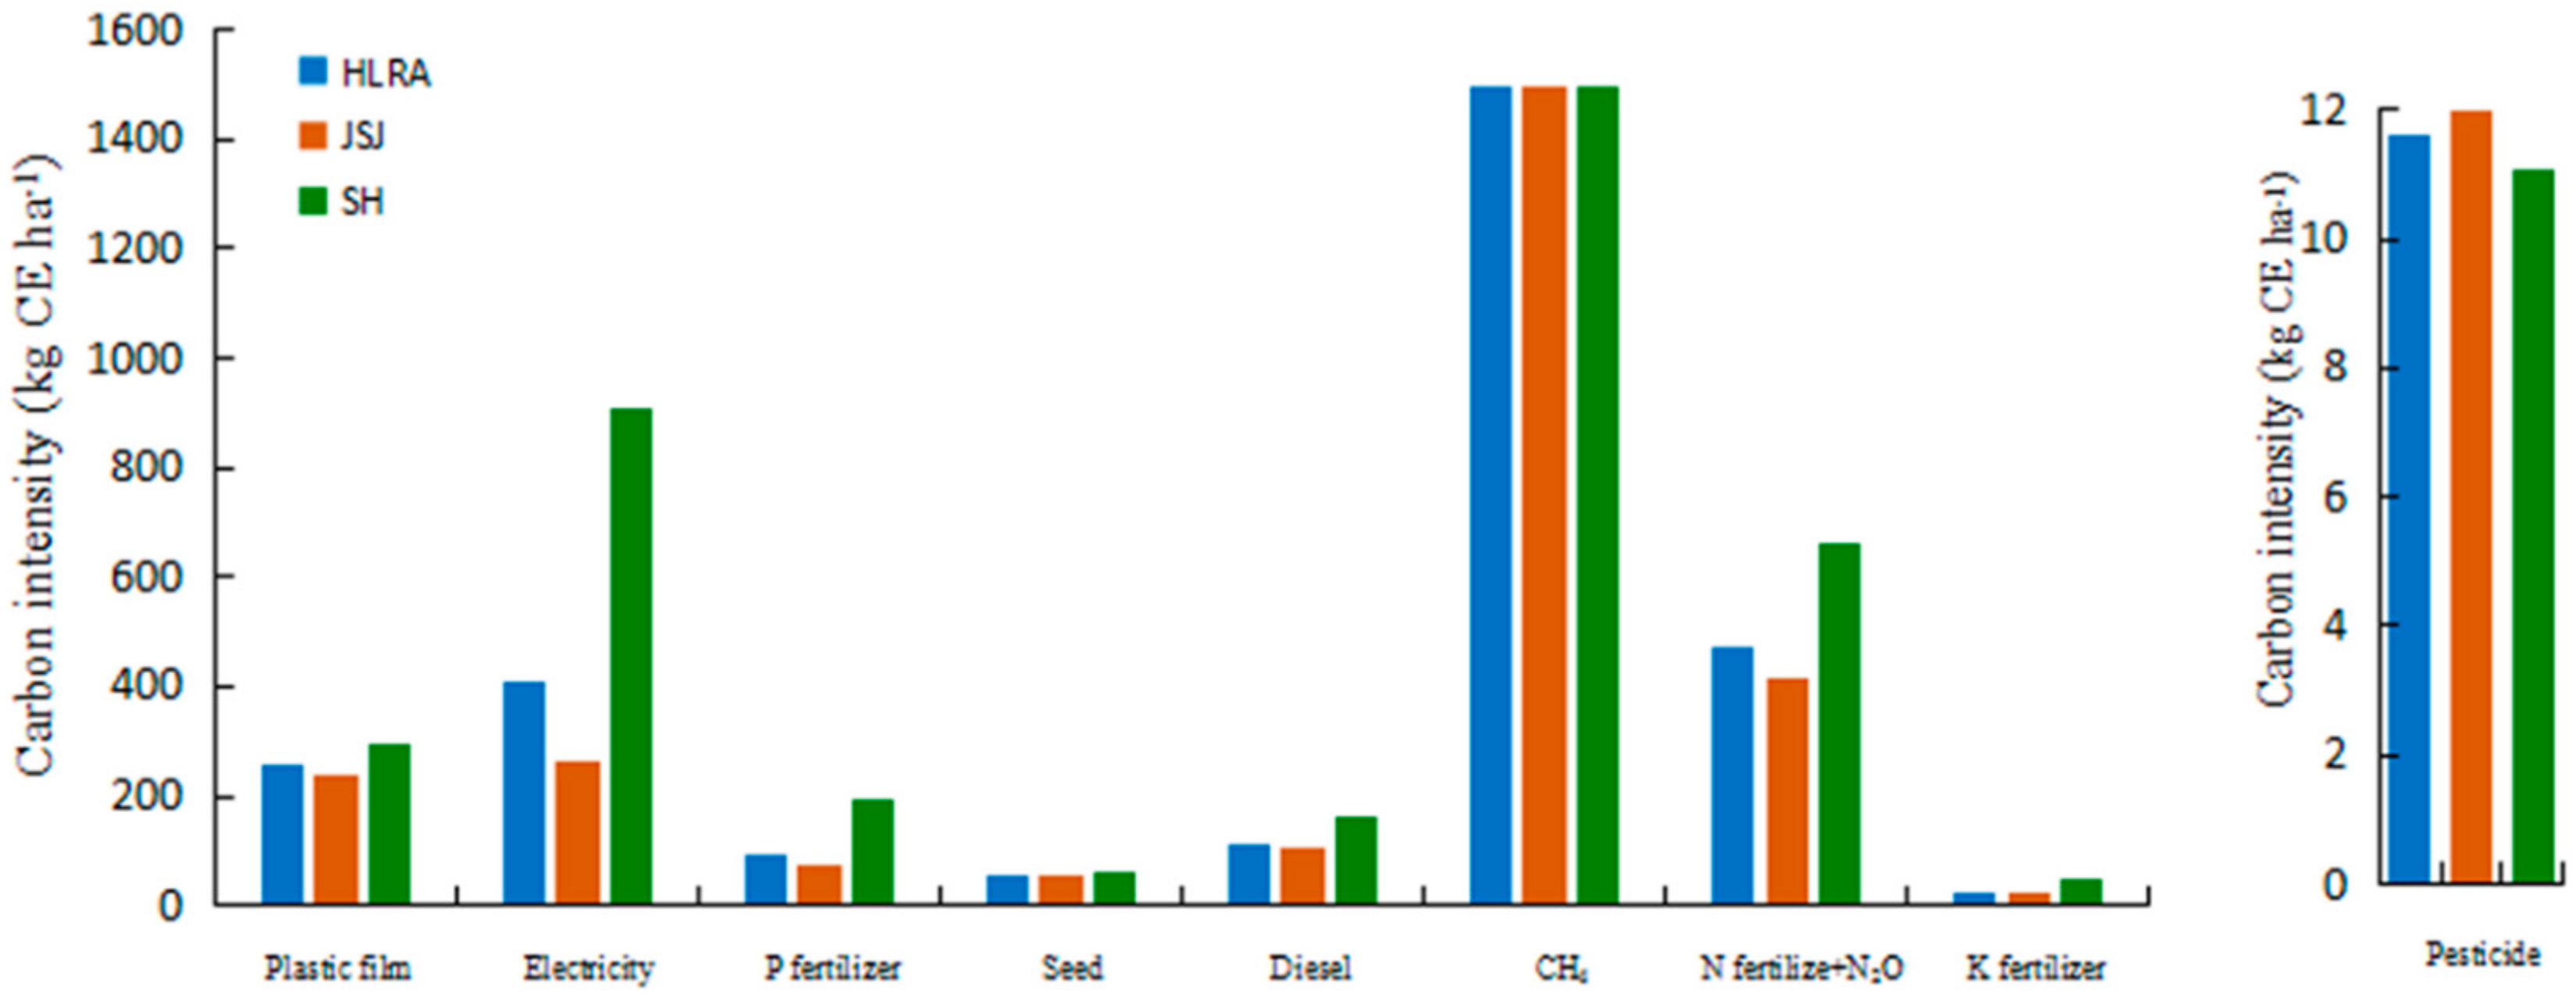
The SH branch required more electricity for irrigation, more fertilizer input (especially more N fertilizer), and more diesel input per unit area, all of which contributed to a higher CF
A for rice production (
Figure 7). It is clear that high material inputs with low utilization efficiency contributed to its degree of expansive coupling. Based on this result, we suggest targeted measures for the SH branch to mitigate GHG emissions from rice production, such as decreasing agricultural material inputs (including fertilizers, electricity for irrigation, diesel, and plastic films), improving the utilization efficiency of agricultural material inputs and increasing agricultural productivity.
5. Conclusions
In this paper, a decoupling index based on carbon footprint and crop yield was used to examine the relationship between crop production and GHG emissions in the HLRA during the years 2001–2015. The results indicated that various decoupling degrees (including strong decoupling, weak decoupling, and recessive decoupling) occurred during more than half of the study phase across the entire HLRA, although each branch showed weak decoupling based on the average value from 2001 to 2015. In addition, rice production constituted 80% of the total CF in the HLRA, and weak decoupling occurred more frequently at the scale of the entire study area and at the branch scale (except for the SH branch, which showed expansive coupling).
Seen from the results of the decoupling analysis, although a high appearance frequency of weak decoupling occurred during 2001–2015 in the HLRA, the status of weak decoupling was not steady, which highlights both pressures and challenges for the HLRA as it develops towards green growth. We also found that high material inputs with low utilization efficiency contributed to a poor relationship between crop production and GHG emissions and that fertilizer was an important contributor to the total CF of crop production. Since it is the major source of GHG emissions from agriculture in the HLRA, we should pay more attention to rice production, in particular for the SH branch.
The current work of decoupling analysis aims to examine the relationship between GHG emissions and crop production, using HLRA as an example. In fact, there is a limitation to the decoupling concept, which lacks a direct contact with the environmental process. Based on the results of decoupling analysis, next we will borrow from the experience of others and use the LMDI decomposition methodology to analyze factors that affect GHG emissions in crop production processes, in view of the activity effect, the structure effect, and the intensity effect. Further integrating more detailed information about GHG emissions from crop production processes could contribute to more targeted suggestions for low-carbon agriculture.


