Forecasting Electricity Market Price for End Users in EU28 until 2020—Main Factors of Influence


Abstract
:1. Introduction
- What future development of electricity prices for final users can be expected at EU28 level in the long term (up to 2020)?
- Can you assign a relative importance to the factors influencing the price?
- What are the implications of the expected price forecast?
2. Materials and Methods
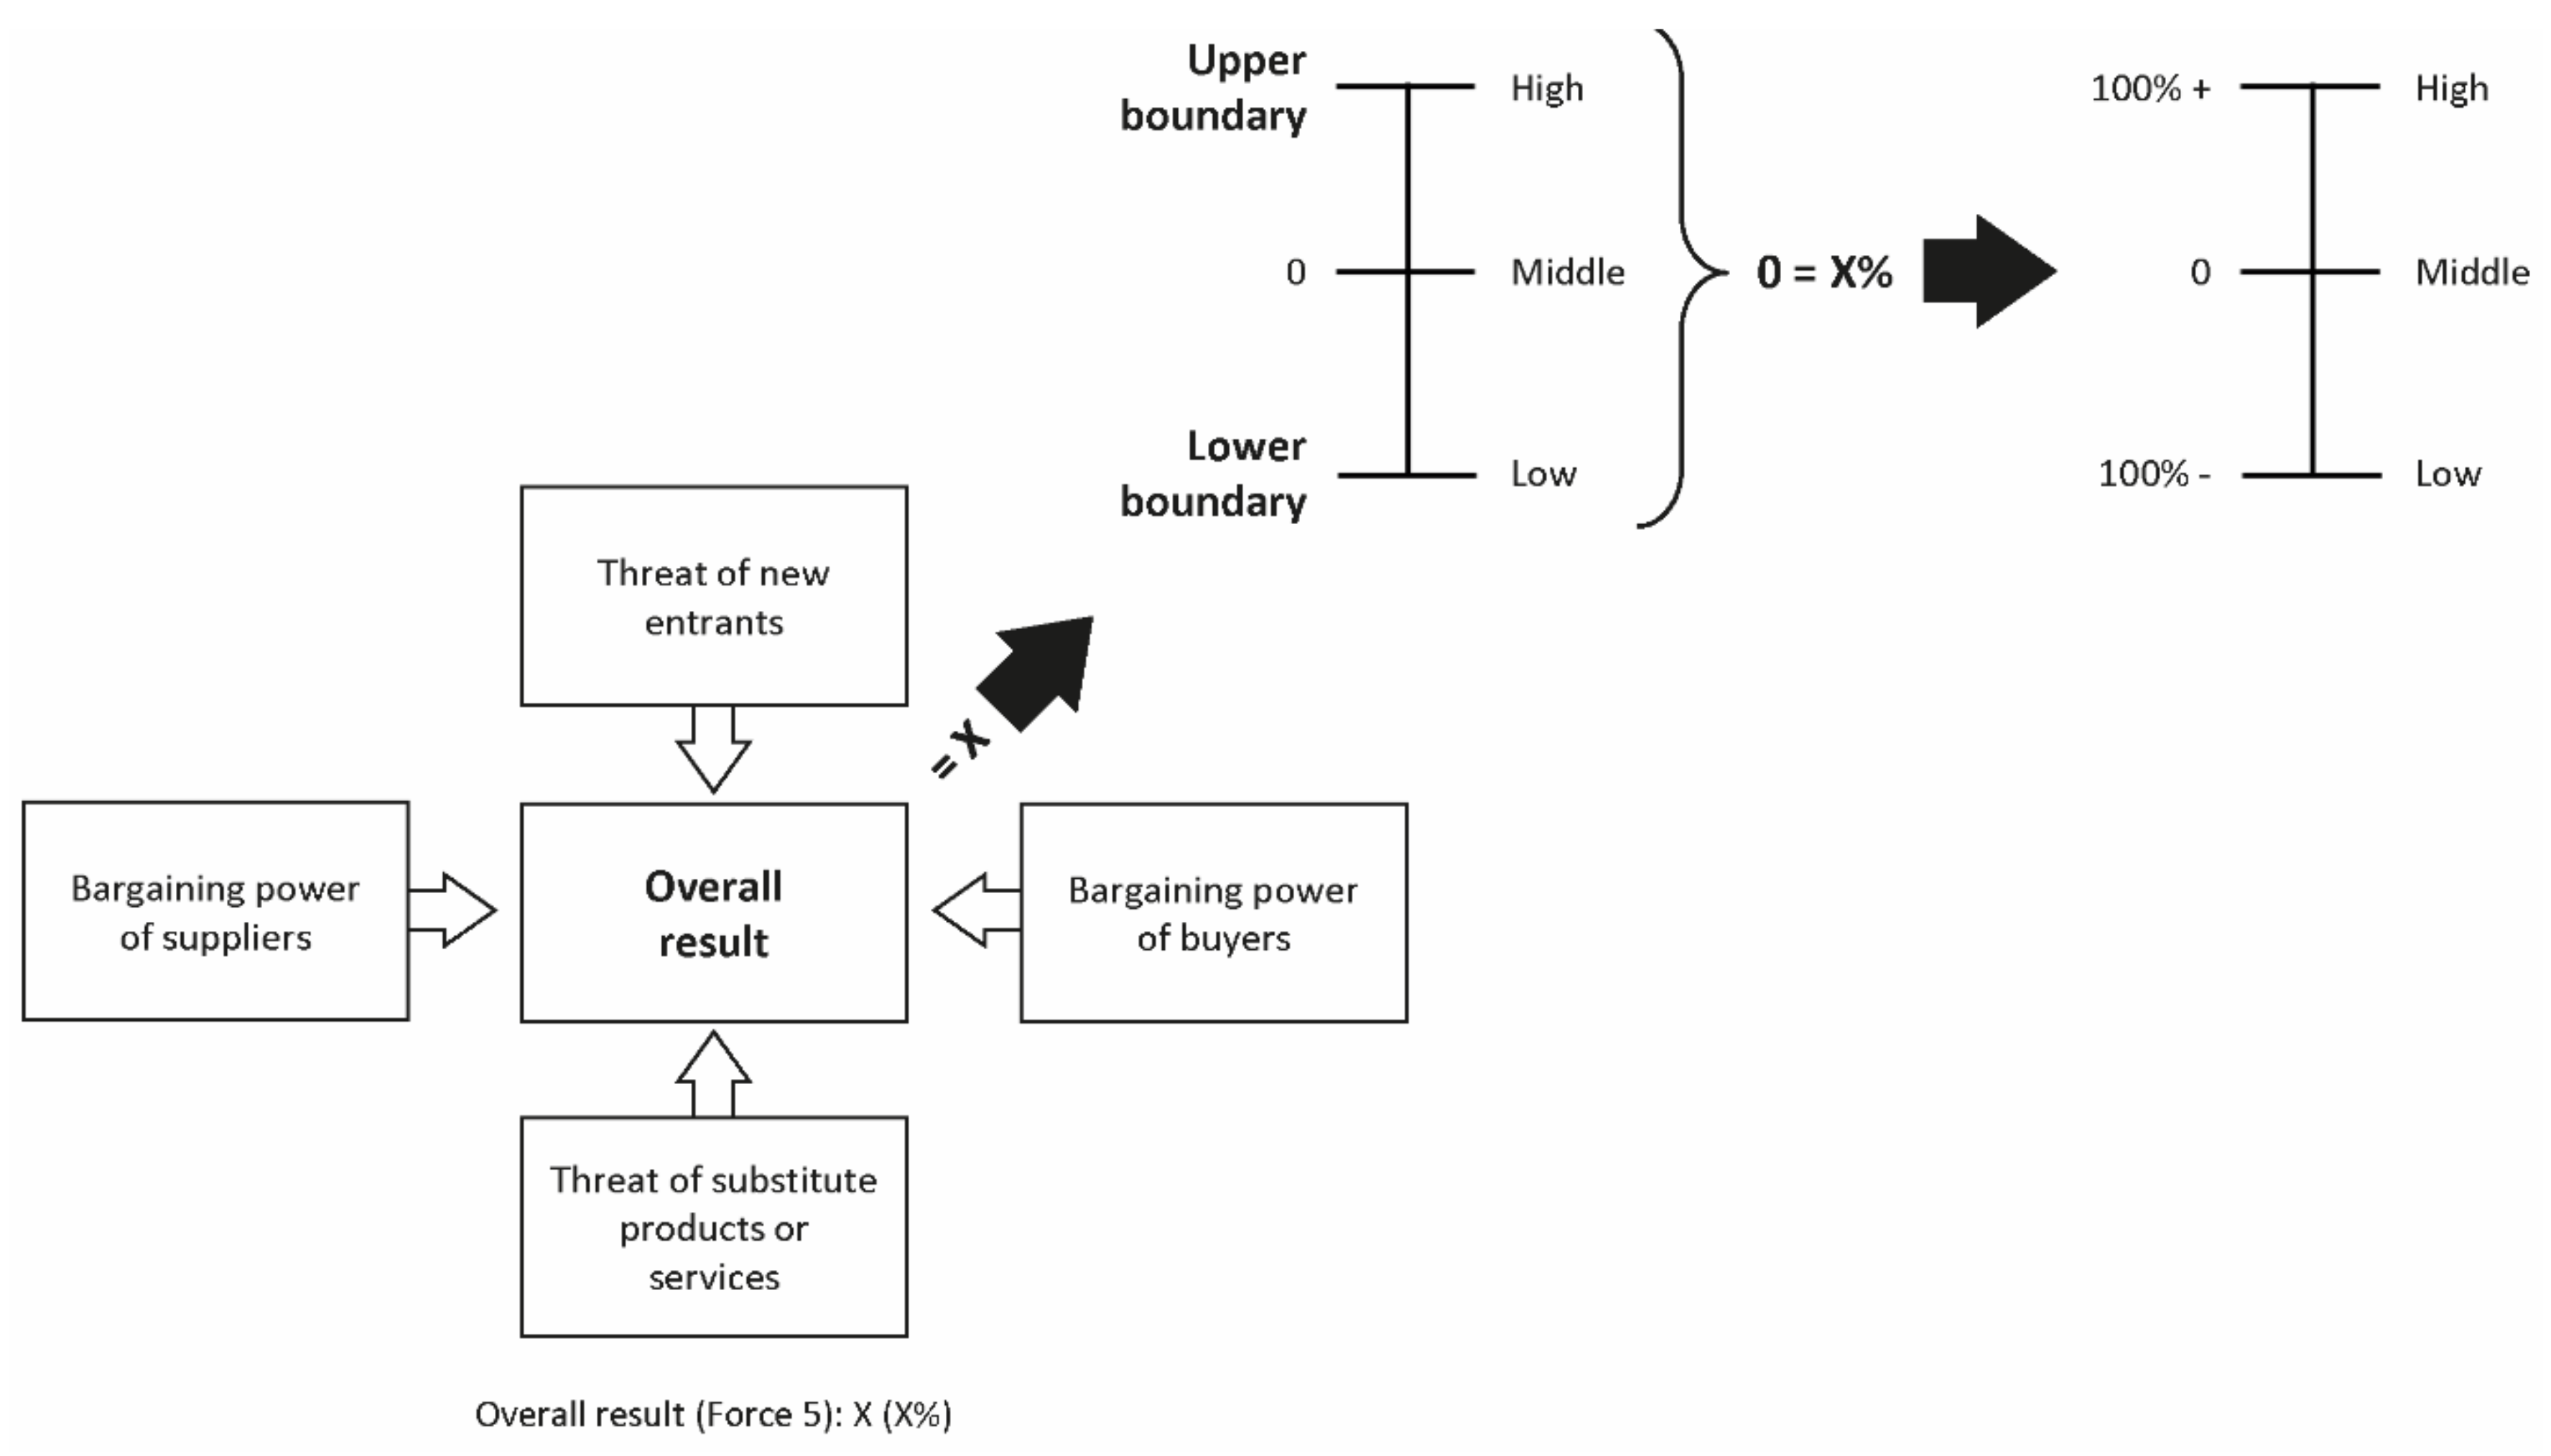
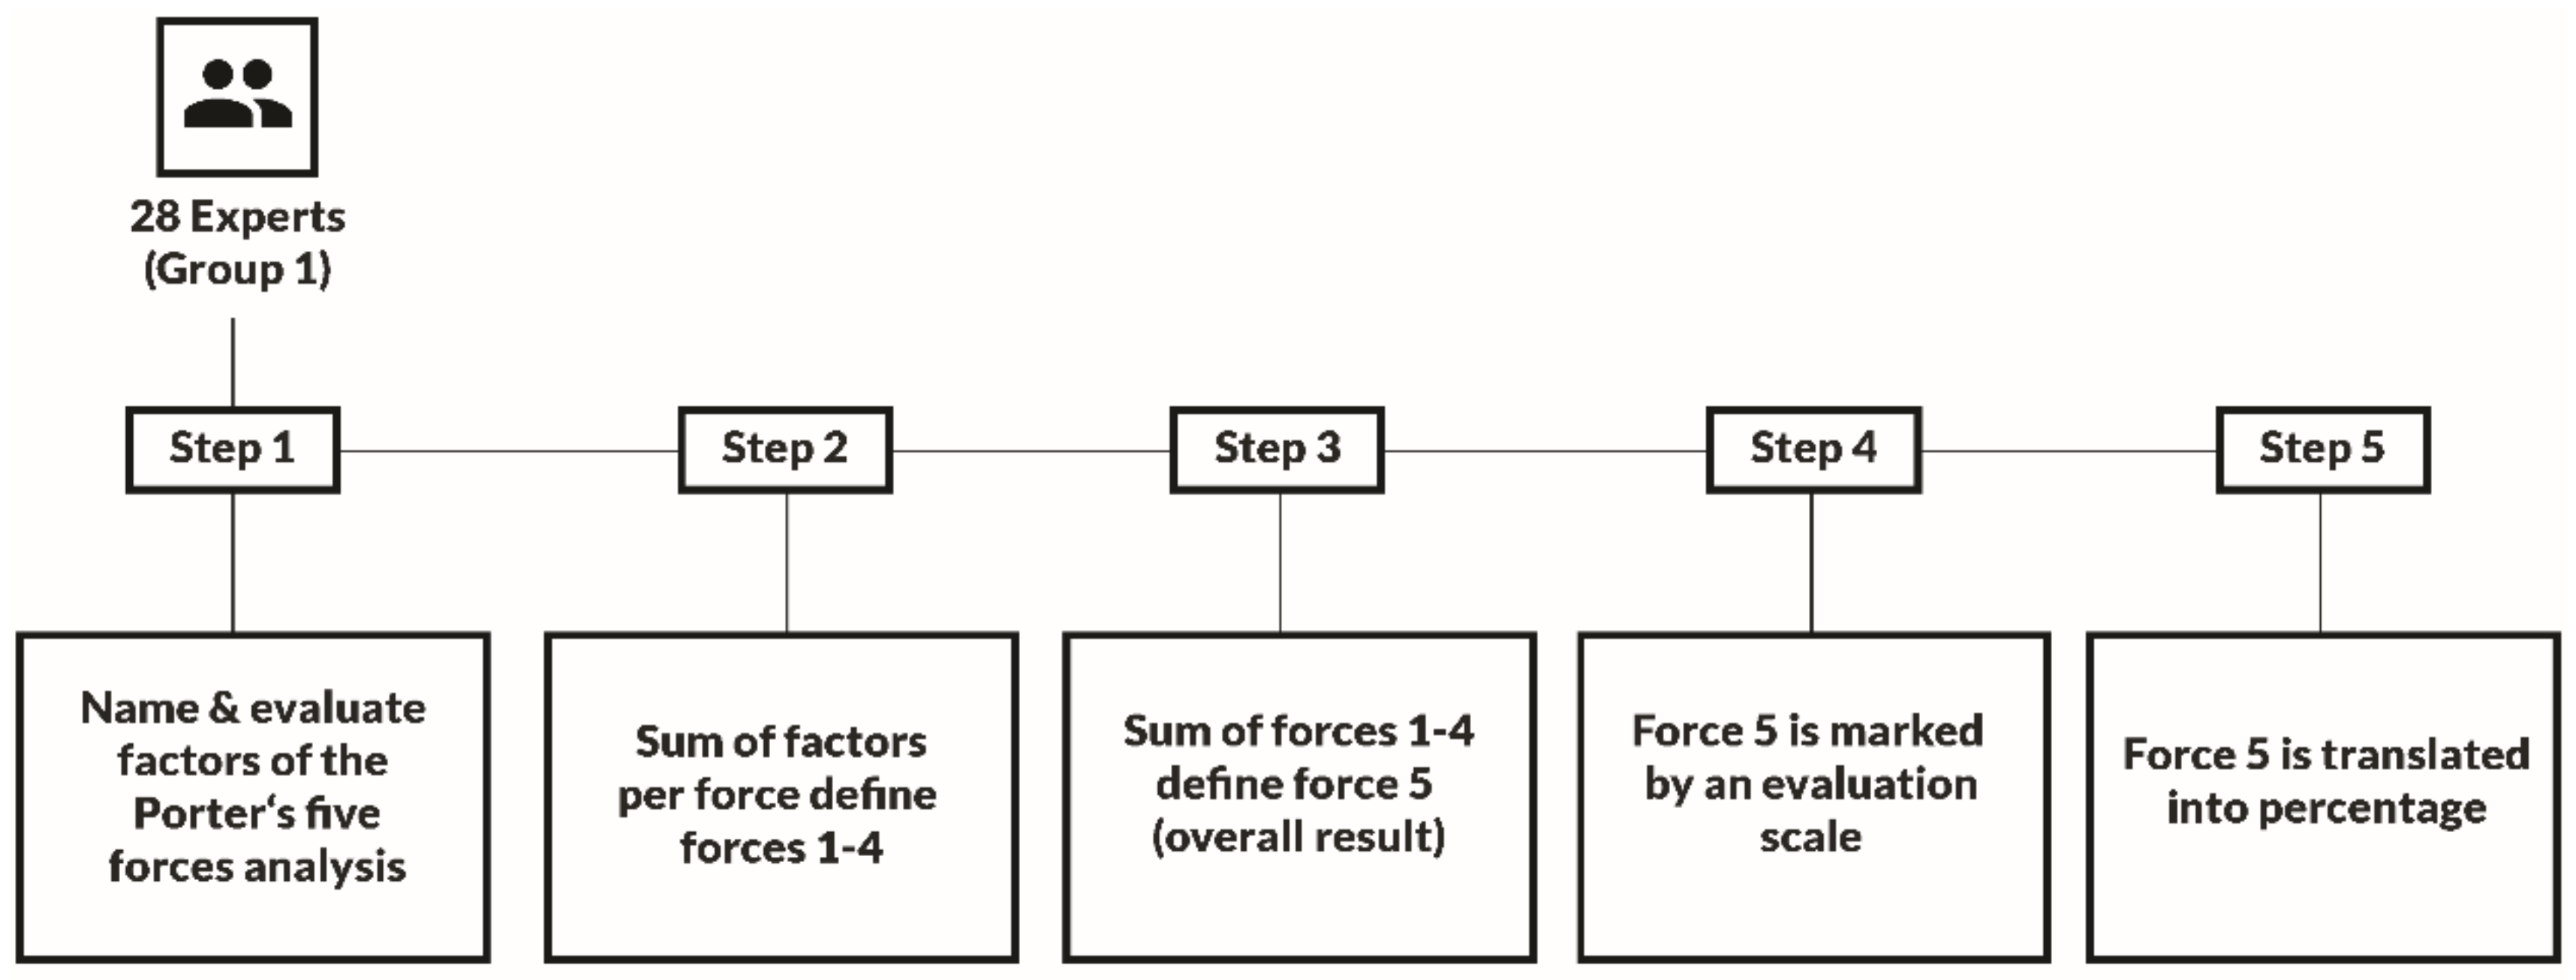
2.1. Porter’s Five Forces Analysis
- Force 1
- Threat of new entrants
- Force 2
- Threat of substitute products or services
- Force 3
- Bargaining power of suppliers
- Force 4
- Bargaining power of buyers
- Force 5
- Overall result.
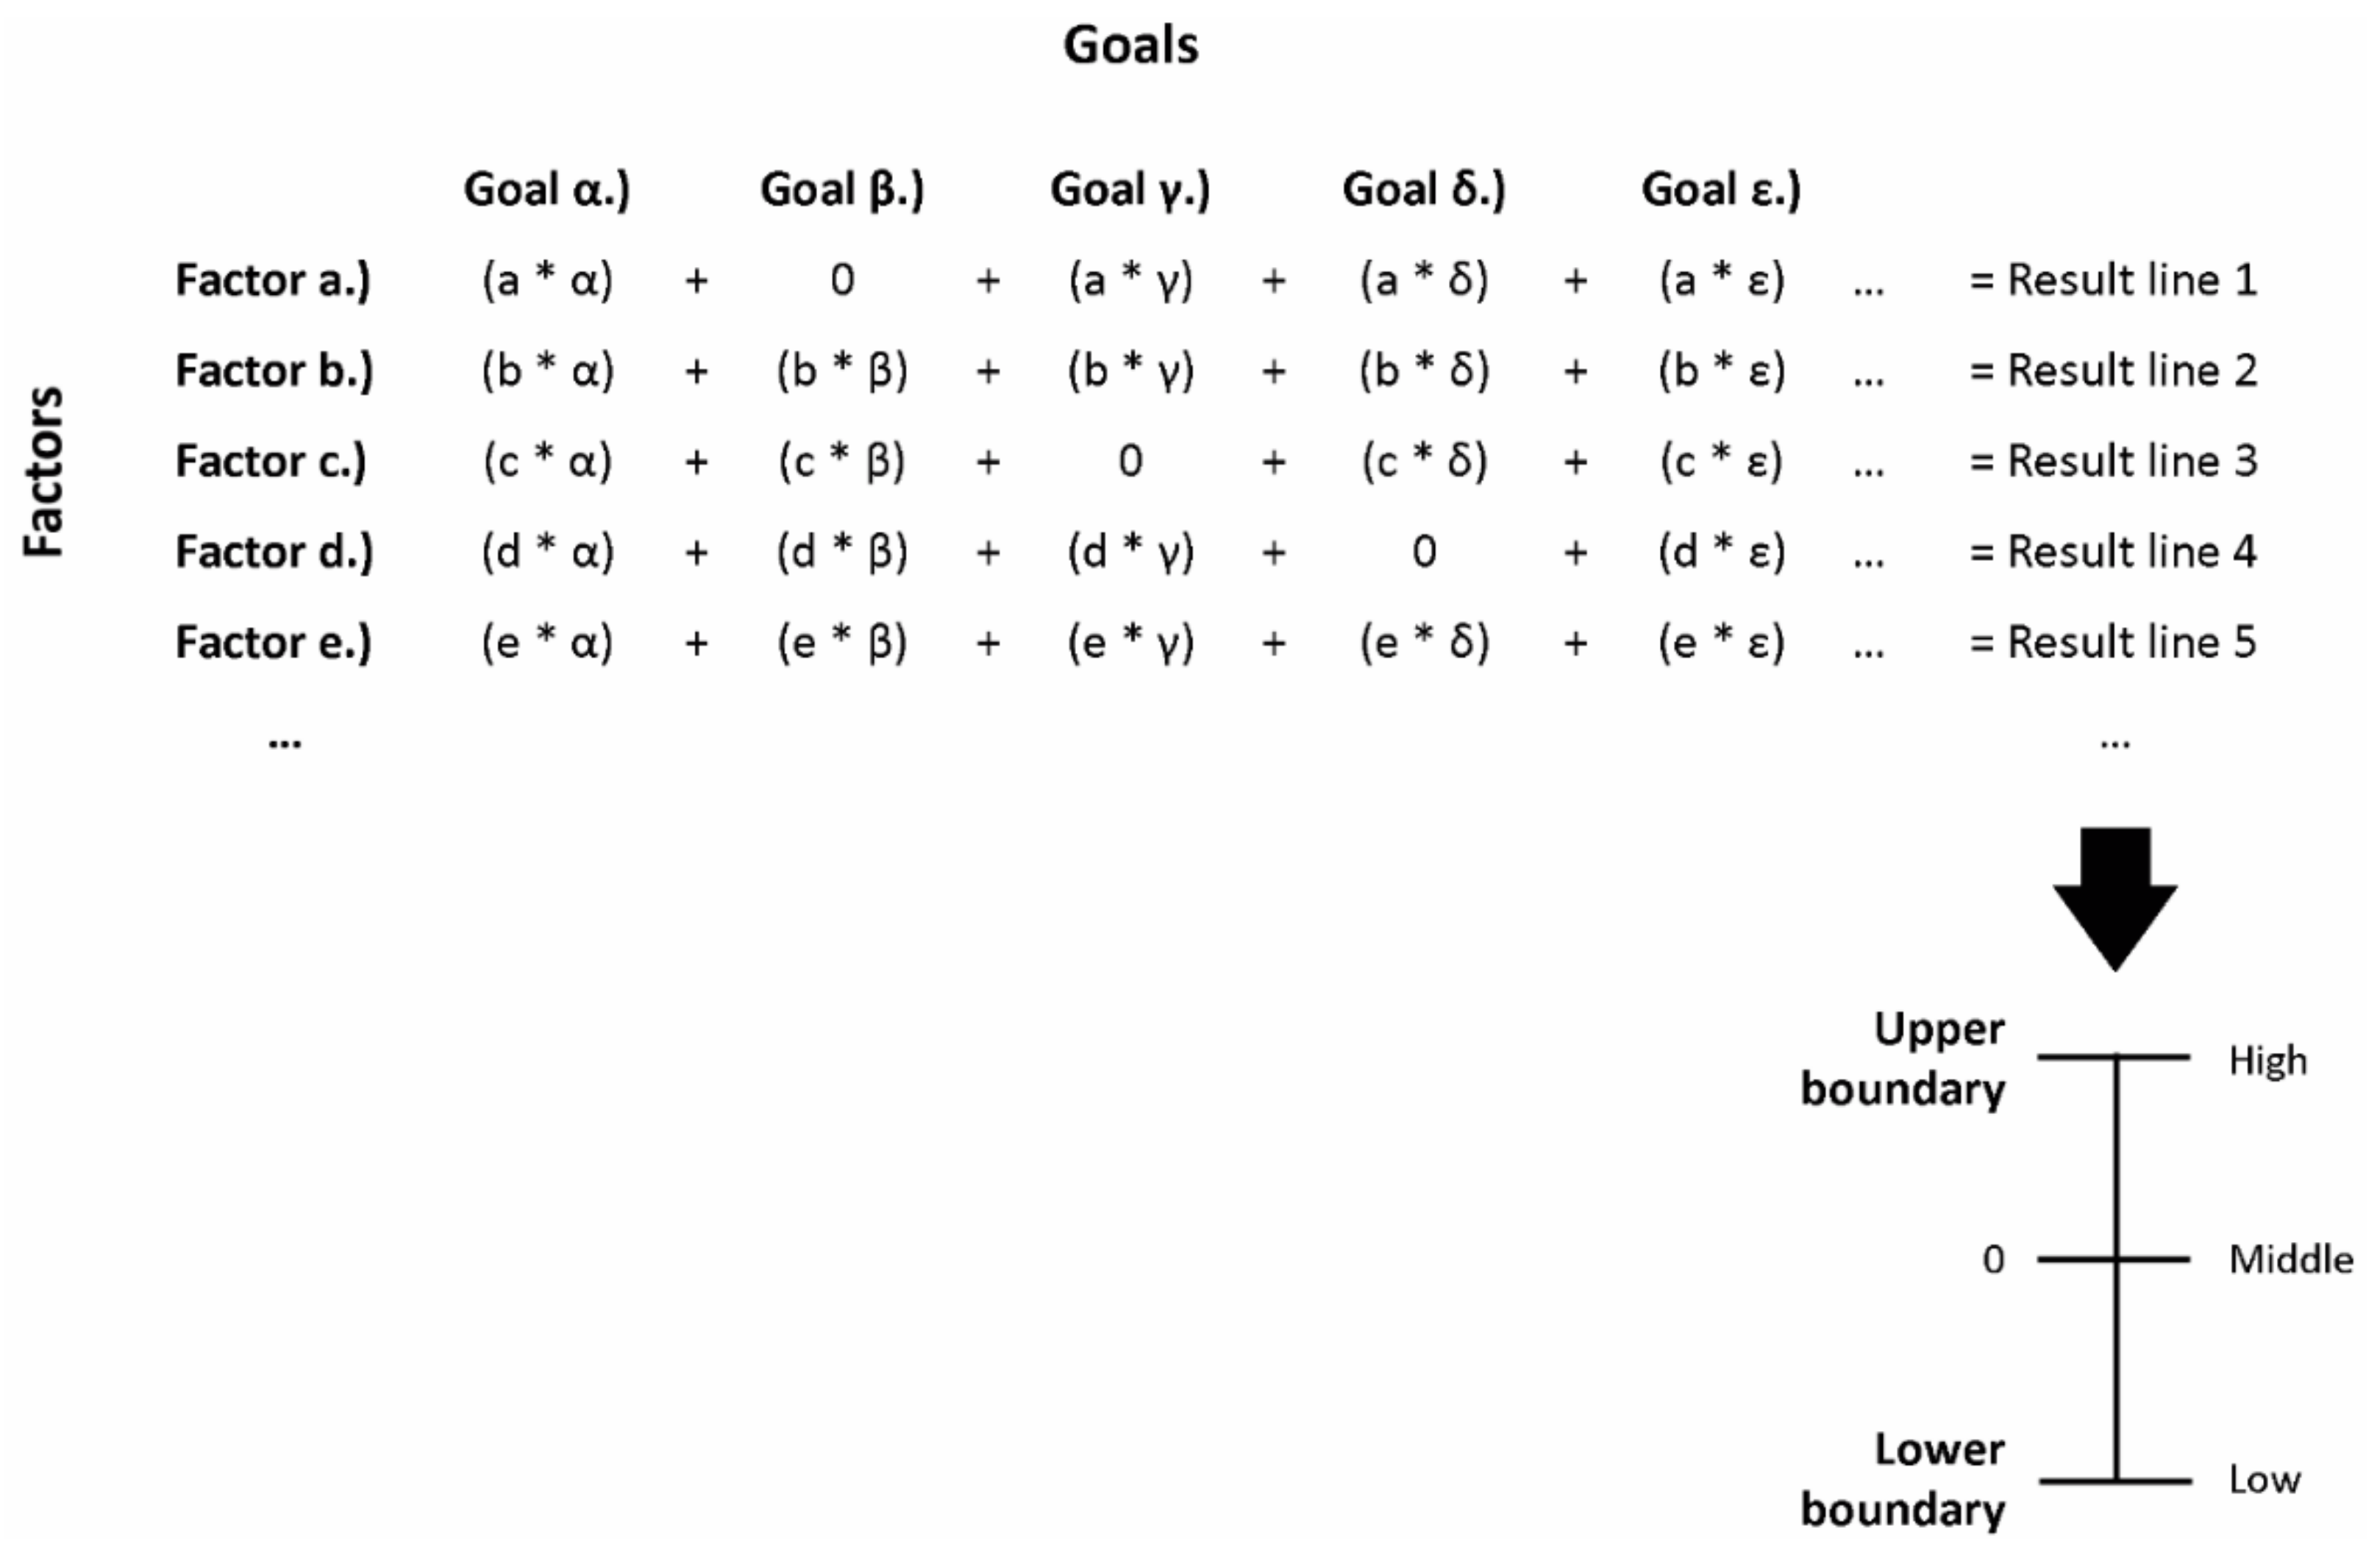
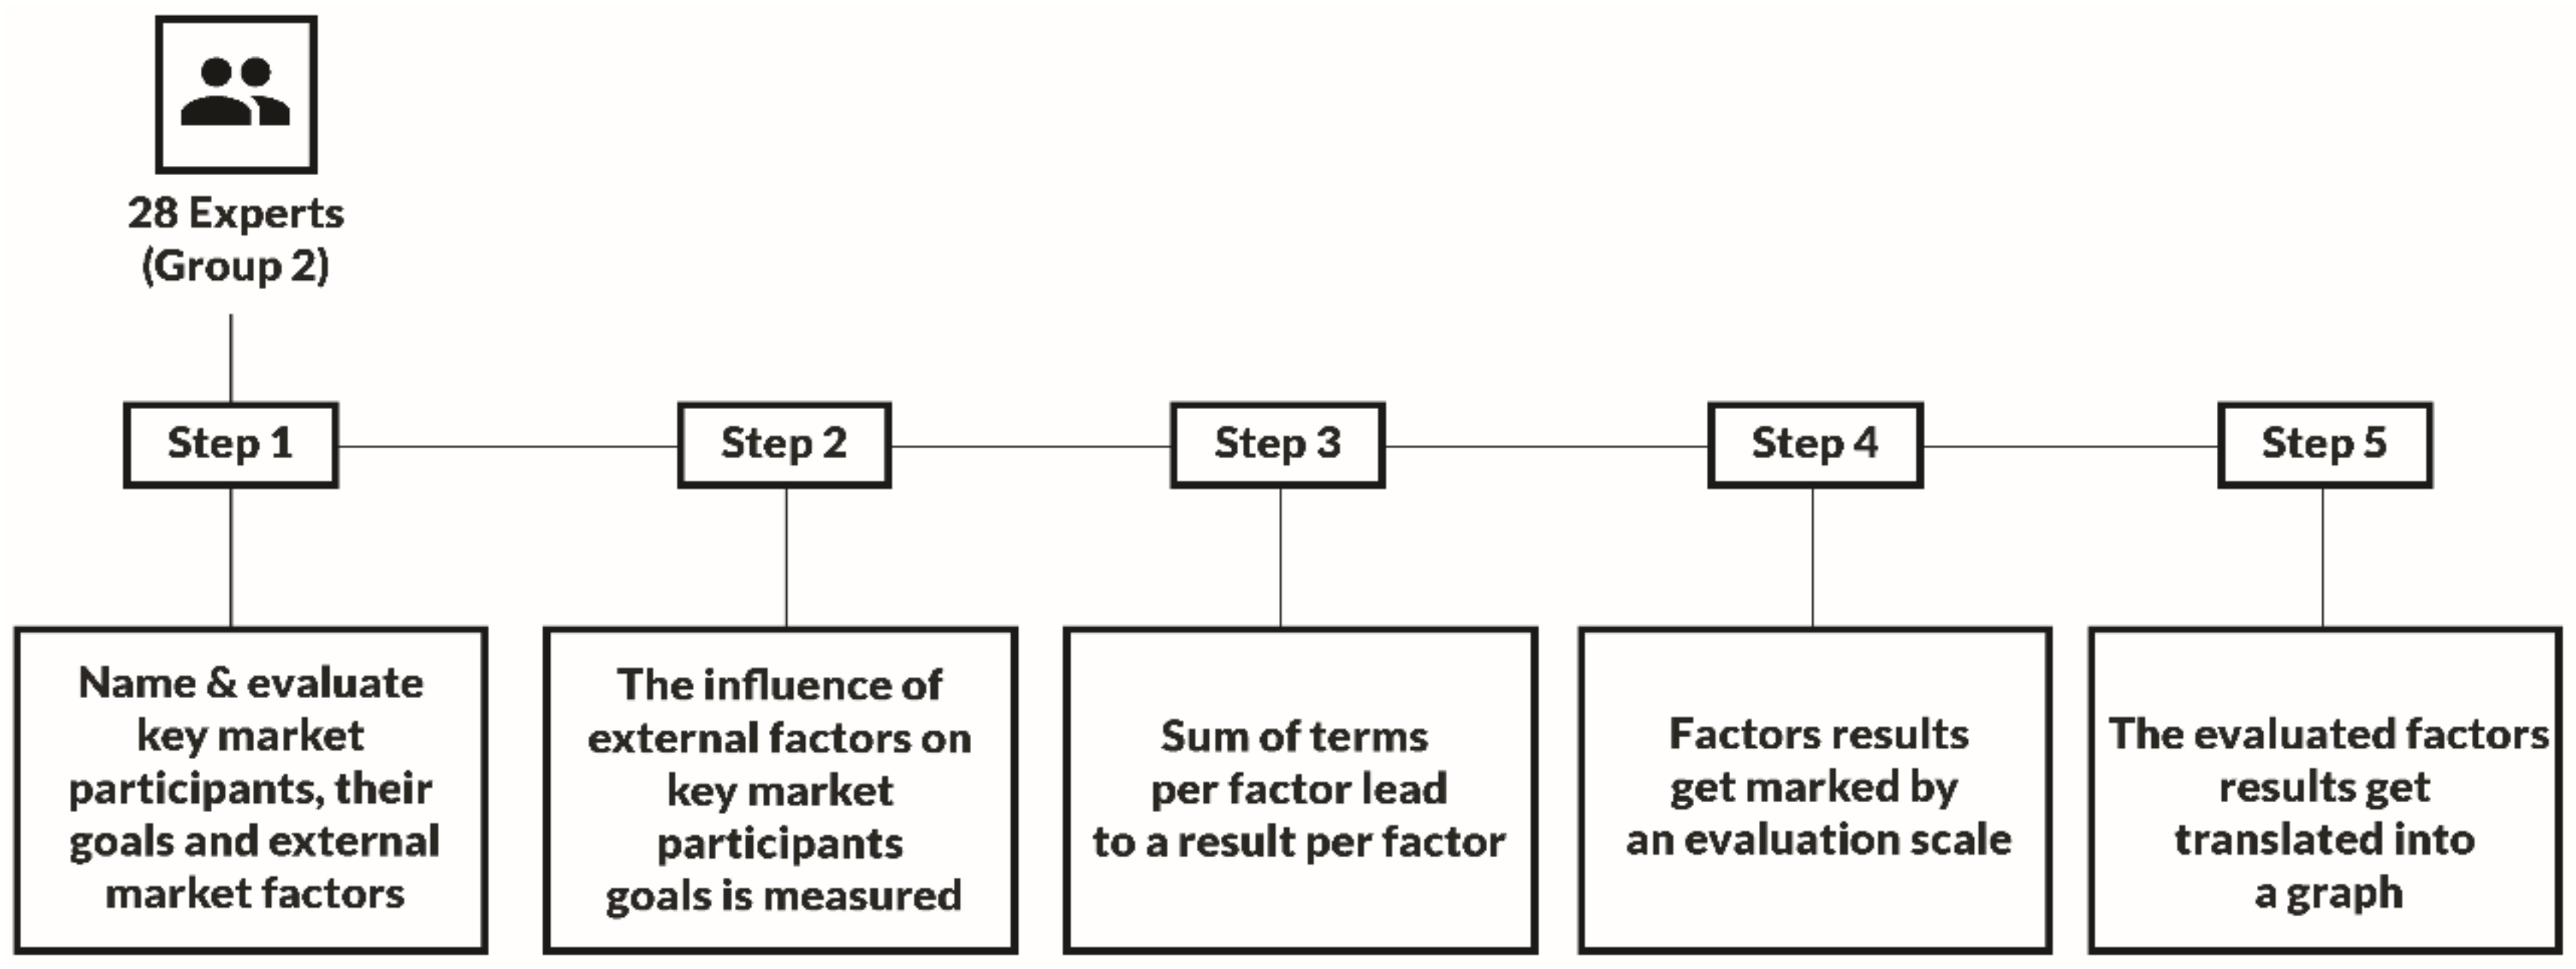
2.2. Multiple-Criteria Decision Analysis
3. Results
3.1. Porter’s Five Forces Analysis
3.2. Multiple-Criteria Decision Analysis
4. Discussion and Conclusions
Author Contributions
Acknowledgments
Conflicts of Interest
Appendix A

| Questionnaires | Factors-P5FA | ||||
|---|---|---|---|---|---|
| Uncertainty of Future Electricity Prices | Public Acceptance | Regulatory Complexity | Environmental Licenses | Generation Overcapacities | |
| 1 | 8+ | 9+ | 8+ | 9+ | 8+ |
| 2 | 9+ | 7+ | 9+ | 5+ | - |
| 3 | 9+ | 7+ | - | 7+ | 9+ |
| 4 | 8+ | 5+ | 8+ | 7+ | 8+ |
| 5 | 9+ | 7+ | 9+ | 8+ | 8+ |
| 6 | 8+ | - | 8+ | 10+ | 8+ |
| 7 | 9+ | 8+ | 9+ | 4+ | 9+ |
| 8 | 9+ | - | 9+ | 7+ | 8+ |
| 9 | 8+ | 7+ | 9+ | - | 6+ |
| 10 | 6+ | 7+ | 7+ | 6+ | 6+ |
| 11 | 8+ | 9+ | 7+ | 6+ | 6+ |
| 12 | 9+ | 7+ | 8+ | 6+ | 9+ |
| 13 | - | 7+ | 9+ | - | 9+ |
| 14 | 8+ | 5+ | 8+ | 5+ | 6+ |
| 15 | 9+ | 7+ | 8+ | 6+ | 6+ |
| 16 | 8+ | - | 9+ | 7+ | 8+ |
| 17 | 9+ | 8+ | 8+ | 6+ | 8+ |
| 18 | 9+ | - | 9+ | 8+ | 10+ |
| 19 | 8+ | 7+ | 7+ | 8+ | 8+ |
| 20 | 6+ | - | 7+ | 6+ | 8+ |
| 21 | 8+ | 9+ | 8+ | 7+ | 6+ |
| 22 | 9+ | 7+ | 9+ | 5+ | 8+ |
| 23 | 9+ | 7+ | - | 8+ | - |
| 24 | 9+ | 5+ | 8+ | 6+ | - |
| 25 | 8+ | 7+ | 9+ | 7+ | 9+ |
| 26 | 9+ | - | 8+ | 6+ | - |
| 27 | 9+ | 8+ | - | 8+ | 9+ |
| 28 | 9+ | - | - | 8+ | 8+ |
| Average | 8.38+ | 7.14+ | 8.25+ | 6.77+ | 7.83+ |
| Interquartile | 1.00 | 1.00 | 1.00 | 2.00 | 2.50 |
| Questionnaires | Factors-P5FA | ||||
|---|---|---|---|---|---|
| Grid Connection | Utilization of Fossil Fuels Driven Devices | Energy Efficiency Improvements | Rational Use of Energy | Amount of Competitors | |
| 1 | 7+ | 1− | 4− | 6− | - |
| 2 | 8+ | 2− | 4− | 5− | - |
| 3 | 8+ | 1− | 4− | 4− | 5− |
| 4 | 7+ | 2− | 6− | 3− | 8− |
| 5 | - | 1− | 4− | - | 9− |
| 6 | 7+ | 3− | 6− | - | - |
| 7 | 8+ | 1− | 4− | 4− | 6− |
| 8 | 8+ | 1− | 4− | 3− | - |
| 9 | 7+ | 2− | 2− | 3− | - |
| 10 | 5+ | 1− | 6− | 4− | 7− |
| 11 | - | 1− | 4− | 6− | 9− |
| 12 | 8+ | - | 4− | 5− | 7− |
| 13 | 8+ | 3− | 4− | 7− | |
| 14 | 7+ | 2− | 6− | 3− | 5− |
| 15 | 8+ | 1− | 4− | 4− | 7− |
| 16 | - | 1− | 6− | 4− | - |
| 17 | - | 1− | 4− | 4− | - |
| 18 | 8+ | 1− | 4− | 3− | - |
| 19 | 7+ | 2− | 2− | 3− | - |
| 20 | 5+ | - | 6− | 4− | - |
| 21 | 7+ | 1− | 4− | 6− | 8− |
| 22 | 8+ | 1− | 4− | 5− | 4− |
| 23 | 8+ | 1− | - | 4− | - |
| 24 | 7+ | 2− | 6− | 3− | 7− |
| 25 | 8+ | 1− | 4− | - | 8− |
| 26 | 7+ | 3− | 6− | - | - |
| 27 | 8+ | 1− | 4− | 4− | 7− |
| 28 | 8+ | 1− | 6− | 3− | |
| Average | 7.38+ | 1.46− | 4.52− | 4.04− | 6.93− |
| Interquartile | 1.00 | 1.00 | 2.00 | 2.00 | 2.00 |
| Questionnaires | Factors-P5FA | ||||
|---|---|---|---|---|---|
| Market Liberalization | Capital Accessibility for New Investments | Freedom in Choosing Supplier | Accessibility to Information | Easiness to Switch Supplier | |
| 1 | 7− | - | 9− | 10− | - |
| 2 | 8− | 7+ | 6− | - | 7− |
| 3 | 8− | 7+ | 6− | 8− | 8− |
| 4 | 7− | 4+ | 5− | 7− | 6− |
| 5 | 7− | 8+ | 7− | 8− | - |
| 6 | 7− | 6+ | 7− | 10− | 7− |
| 7 | 8− | 9+ | 8− | 5− | 8− |
| 8 | 8− | - | 7− | 7− | 7− |
| 9 | 7− | - | - | - | 7− |
| 10 | 7− | 7+ | 7− | 6− | 5− |
| 11 | 7− | 8+ | 8− | 6− | - |
| 12 | 8− | 7+ | 6− | 6− | 7− |
| 13 | - | 7+ | 6− | - | 8− |
| 14 | - | 5+ | - | 5− | 6− |
| 15 | 7− | 7+ | 7− | 6− | 8− |
| 16 | 7− | - | 7− | 7− | - |
| 17 | 7− | 9+ | 8− | 6− | - |
| 18 | 8− | - | 7− | 8− | 7− |
| 19 | 7− | 8+ | - | - | 7− |
| 20 | 7− | - | 7− | 6− | 4− |
| 21 | 7− | 9+ | 8− | 7− | 7− |
| 22 | 7− | 7+ | 6− | 5− | 7− |
| 23 | 8− | 7+ | 6− | 8− | 8− |
| 24 | 7− | 7+ | - | 6− | 7− |
| 25 | 7− | 7+ | 7− | 7− | 8− |
| 26 | 7− | - | 7− | 6− | 6− |
| 27 | 7− | 7+ | 7− | 8− | 8− |
| 28 | - | - | 8− | 9− | - |
| Average | 7.28− | 7.15+ | 6.96− | 6.96− | 6.95− |
| Interquartile | 1.00 | 1.00 | 1.75 | 2.00 | 1.25 |
| Questionnaires | Goals-MCDA | |||
|---|---|---|---|---|
| Environmental Policies | Feasibility in Changing Supplier | Income Max. | Benefit to Cost Max. | |
| 1 | 9+ | 4− | - | 3− |
| 2 | 8+ | 5− | 8+ | 4− |
| 3 | 8+ | 4− | 7+ | - |
| 4 | 6+ | 2− | 8+ | 3− |
| 5 | 8+ | 4− | 8+ | 2− |
| 6 | - | 6− | 9+ | 1− |
| 7 | 8+ | 4− | 8+ | 4− |
| 8 | - | 3− | 10+ | 3− |
| 9 | - | 3− | 8+ | 2− |
| 10 | 7+ | 3− | 10+ | 2− |
| 11 | 9+ | 4− | 8+ | 3− |
| 12 | 7+ | - | 8+ | 4− |
| 13 | 7+ | 4− | 7+ | - |
| 14 | 6+ | 2− | 8+ | 3− |
| 15 | - | 4− | - | 2− |
| 16 | - | 6− | 7+ | 1− |
| 17 | 9+ | 4− | 8+ | 4− |
| 18 | - | 3− | - | 3− |
| 19 | 8+ | 3− | 9+ | 2− |
| 20 | - | 3− | 10+ | 2− |
| 21 | 8+ | 4− | - | - |
| 22 | - | 5− | 8+ | 4− |
| 23 | 9+ | 4− | 10+ | - |
| 24 | 7+ | 2− | 8+ | 3− |
| 25 | 8+ | 4− | 9+ | 2− |
| 26 | - | - | 9+ | - |
| 27 | 9+ | 4− | - | 4− |
| 28 | - | 3− | 8+ | 3− |
| Average | 7.83+ | 3.73− | 8.39+ | 2.78− |
| Interquartile | 2.00 | 1.00 | 1.00 | 2.00 |
| Questionnaires | Factors-MCDA | |||
|---|---|---|---|---|
| Renewable Energy Production | Fossil Fuels’ Price | Extreme Weather Events | Social Unacceptance of Higher Electricity Prices Due to Incentives/Subsidies | |
| 1 | 2+ | 2+ | 1− | 1− |
| 2 | 5+ | - | 1− | 1− |
| 3 | 4+ | 4+ | - | 2− |
| 4 | 4+ | - | 2− | 2− |
| 5 | 3+ | 2+ | 2− | 1− |
| 6 | 3+ | - | 2− | 1− |
| 7 | 5+ | 2+ | - | 1− |
| 8 | 5+ | - | 1− | 1− |
| 9 | 4+ | 3+ | - | 1− |
| 10 | 4+ | 3+ | 1− | 3− |
| 11 | 2+ | 3+ | 1− | 1− |
| 12 | 5+ | - | - | 1− |
| 13 | 4+ | 3+ | 2− | 2− |
| 14 | 4+ | - | 1− | 2− |
| 15 | 3+ | 3+ | 1− | 1− |
| 16 | 3+ | - | 1− | 1− |
| 17 | 5+ | 4+ | 2− | 1− |
| 18 | 5+ | - | 1− | 1− |
| 19 | 9+ | 3+ | 1− | 1− |
| 20 | 4+ | 2+ | 1− | 3− |
| 21 | 2+ | 4+ | 1− | 1− |
| 22 | 5+ | - | 2− | 1− |
| 23 | 5+ | 3+ | 2− | 2− |
| 24 | 4+ | - | 2− | 2− |
| 25 | 3+ | 3+ | 2− | 1− |
| 26 | 3+ | - | 3− | 1− |
| 27 | 5+ | 3+ | 1− | 1− |
| 28 | 5+ | - | 1− | - |
| Average | 4.11+ | 2.94+ | 1.46− | 1.37− |
| Interquartile | 2.00 | 0.75 | 1.00 | 1.00 |
| Questionnaires | Factors-MCDA | |||
|---|---|---|---|---|
| Electricity Market Concentration | E−Mobility | Electricity Market Liberalization | EU Economy Growth | |
| 1 | 5+ | - | - | 3+ |
| 2 | 4+ | 1+ | 4− | 4+ |
| 3 | 5+ | 1+ | 6− | 3+ |
| 4 | 7+ | 2+ | 4− | 5+ |
| 5 | 4+ | 1+ | 4− | 4+ |
| 6 | 6+ | 1+ | 4− | 5+ |
| 7 | - | 1+ | 7− | 4+ |
| 8 | 4+ | 1+ | 7− | 4+ |
| 9 | - | 1+ | 6− | 2+ |
| 10 | 6+ | 2+ | - | 5+ |
| 11 | 4+ | 1+ | - | 4+ |
| 12 | 4+ | 1+ | 4− | 4+ |
| 13 | 4+ | 1+ | 4− | 4+ |
| 14 | 7+ | 2+ | 4− | 6+ |
| 15 | 4+ | 1+ | - | 4+ |
| 16 | 6+ | - | 4− | 5+ |
| 17 | 4+ | 1+ | 7− | 4+ |
| 18 | 4+ | 1+ | - | 4+ |
| 19 | 2+ | 1+ | 6− | 2+ |
| 20 | 6+ | 2+ | - | 4+ |
| 21 | 4+ | 1+ | - | 4+ |
| 22 | 4+ | 1+ | 4− | 4+ |
| 23 | - | 2+ | 4− | - |
| 24 | 7+ | 2+ | 4− | 6+ |
| 25 | 4+ | 1+ | 4− | 4+ |
| 26 | 7+ | 1+ | 5− | 5+ |
| 27 | 4+ | 1+ | - | 3+ |
| 28 | - | - | 6− | - |
| Average | 4.83+ | 1.24+ | 4.90− | 4.08+ |
| Interquartile | 2.00 | 0.50 | 2.00 | 1.00 |
References
- Sánchez de la Nieta, A.A.; González, V.; Contreras, J. Portfolio Decision of Short-Term Electricity Forecasted Prices through Stochastic Programming. Energies 2016, 9, 1069. [Google Scholar] [CrossRef]
- Larsen, E.R.; Bunn, D.W. Deregulation in electricity: Understanding strategic and regulatory risk. J. Oper. Res. Soc. 1999, 50, 337–344. [Google Scholar] [CrossRef]
- Rothwell, G.S.; Gómez, T. Electricity Economics: Regulation and Deregulation; Wiley-IEEE Press: Hoboken, NJ, USA, 2003; p. 12. [Google Scholar]
- Pinson, P.; Chevallier, C.; Kariniotakis, G.N. Trading wind generation from short-term probabilistic forecasts of wind power. IEEE Trans. Power Syst. 2007, 22, 1148–1156. [Google Scholar] [CrossRef] [Green Version]
- Guerrero-Mestre, V.; Sánchez de la Nieta, A.A.; Contreras, J.; Catalao, J.P.S. Optimal bidding of a group of wind farms in day ahead markets through an external agent. IEEE Trans. Power Syst. 2016, 31, 2688–2700. [Google Scholar] [CrossRef]
- Sánchez de la Nieta, A.A.; Contreras, J.; Munoz, J.I. Optimal coordinated wind-hydro bidding startegies in day-ahead markets. IEEE Trans. Power Syst. 2013, 28, 798–809. [Google Scholar] [CrossRef]
- Sánchez de la Nieta, A.A.; Tavares, T.A.M.; Martins, R.F.M. Optimal generic energy storage system offering in day-ahead electricity markets. In Proceedings of the IEEE PowerTech, Eindhoven, The Netherlands, 29 June–2 July 2015. [Google Scholar]
- Weron, R. Electricity price forecasting: A review of the state-of-the-art with a look into the future. Int. J. Forecast. 2014, 30, 1030–1081. [Google Scholar] [CrossRef]
- Weron, R. Modeling and Forecasting Electricity Loads and Prices: A Statistical Approach; John Wiley & Sons: Chichester, UK, 2007; p. 403. [Google Scholar]
- Changhao, X.; Wang, J.; Karen, M. Short, medium and long term load forecasting model and virtual load forecaster based on radial basis function neural networks. Int. J. Electr. Power Energy Syst. 2010, 32, 743–750. [Google Scholar] [Green Version]
- Cheng, C.; Luo, B.; Miao, S.; Wu, X. Mid-Term Electricity Market Clearing Price Forecasting with Sparse Data: A Case in Newly-Reformed Yunnan Electricity Market. Energies 2016, 9, 804. [Google Scholar] [CrossRef]
- Aggarwal, S.K.; Saini, L.M.; Kumar, A. Electricity price forecasting in deregulated markets: A review and evaluation. Int. J. Electr. Power Energy Syst. 2009, 31, 13–22. [Google Scholar] [CrossRef]
- Rubin, O.D.; Babcock, B.A. The impact of expansion of wind power capacity and pricing methods on the efficiency of deregulated electricity markets. Energy 2013, 59, 676–688. [Google Scholar] [CrossRef]
- Ruibal, C.M.; Mazumdar, M. Forecasting the mean and the variance of electricity prices in deregulated markets. IEEE Trans. Power Syst. 2008, 23, 25–32. [Google Scholar] [CrossRef]
- Wood, A.J.; Wollenberg, B.F. Power Generation, Operation and Control; Wiley: New York, NY, USA, 1996. [Google Scholar]
- Battle, C.; Barquin, J.A. A strategic production costing model for electricity market price analysis. IEEE Trans. Power Syst. 2005, 20, 67–74. [Google Scholar] [CrossRef]
- Kian, A.; Keyhani, A. Stochastic price modeling of electricity in deregulated energy markets. In Proceedings of the 34th Annual Hawaii International Conference on System Sciences, Maui, HI, USA, 6 January 2001; pp. 1–7. [Google Scholar]
- Robinson, T.A. Electricity pool prices: A case study in nonlinear time-series modelling. Appl. Econ. 2000, 32, 527–532. [Google Scholar] [CrossRef]
- Carpio, J.; Juan, J.; Lòpez, D. Multivariate exponential smoothing and dynamic factor model applied to hourly electricity price analysis. Technometrics 2014, 56, 494–503. [Google Scholar] [CrossRef]
- Nogales, F.J.; Contreras, J.; Conejo, A.J.; Epinola, R. Forecasting next-day electricity prices by time series models. IEEE Trans. Power Syst. 2002, 17, 342–348. [Google Scholar] [CrossRef]
- Obradovic, Z.; Tomsovic, K. Time series methods for forecasting electricity market pricing. In Proceedings of the IEEE Power Engineering Society Summer Meeting, Edmonton, AB, Canada, 18–22 July 1999; pp. 1264–1265. [Google Scholar]
- Cuaresma, J.C.; Hlouskova, J.; Kossmeier, S.; Obersteiner, M. Forecasting electricity spot-prices using linear univariate time-series models. Appl. Energy 2004, 77, 87–106. [Google Scholar] [CrossRef]
- Conejo, A.J.; Plazas, M.A.; Espinola, R.; Molina, A.B. Day-ahead electricity price forecasting using the Wavelet Transform and ARIMA Models. IEEE Trans. Power Syst. 2005, 20, 1035–1042. [Google Scholar] [CrossRef]
- Zhang, J.; Tan, Z. Day-ahead electricity price forecasting using WT, CLSSVM and EGARCH model. Int. J. Electr. Power Energy Syst. 2013, 45, 362–368. [Google Scholar] [CrossRef]
- Contreras, J.; Espinola, R.; Nogales, F.J.; Conejo, A.J. ARIMA models to predict next-day electricity prices. IEEE Trans. Power Syst. 2003, 18, 1014–1020. [Google Scholar] [CrossRef] [Green Version]
- Jakaša, T.; Andročec, I.; Sprčić, P. Electricity price forecasting—ARIMA model approach. In Proceedings of the 8th International Conference on the European Energy Market (EEM), Zagreb, Croatia, 25–27 May 2011; pp. 222–225. [Google Scholar]
- Xie, M.; Sandels, C.; Zhu, K. A seasonal ARIMA model with exogenous variables for elspot electricity prices in Sweden. In Proceedings of the 10th International Conference on the European Energy Market (EEM), Stockholm, Sweden, 1–4 May 2013; pp. 27–31. [Google Scholar]
- Szkuta, B.R.; Sanabria, L.A.; Dillon, T.S. Electricity price short-term forecasting using artificial neural networks. IEEE Trans. Power Syst. 1999, 14, 851–857. [Google Scholar] [CrossRef]
- Keles, D.; Scelle, J.; Paraschiv, F.; Fichtner, W. Extended forecast methods for day-ahead electricity spot prices applying artificial neural networks. Appl. Energy 2016, 162, 218–230. [Google Scholar] [CrossRef]
- Shrivastava, N.A.; Khosravi, A.; Panigrahi, B.K. Prediction interval estimation of electricity prices using PSO-Tuned Support Vector Machines. IEEE Trans. Ind. Inf. 2015, 11, 322–331. [Google Scholar] [CrossRef]
- Papadimitriou, T.; Gogas, P.; Stathakis, E. Forecasting energy markets using support vector machines. Energy Econ. 2014, 44, 135–142. [Google Scholar] [CrossRef]
- Zhao, J.H.; Dong, Z.; Li, X.; Wong, K. A framework for electricity price spike analysis with advanced data mining methods. IEEE Trans. Power Syst. 2007, 22, 376–385. [Google Scholar] [CrossRef]
- Huang, D.; Zareipour, H.; Rosehartet, W.D.; Amjady, N. Data mining for electricity price classification and the application to demand-side management. IEEE Trans. Smart Grid 2012, 3, 808–817. [Google Scholar] [CrossRef]
- Tan, Z.F.; Zhang, J.L.; Wang, J.H.; Xu, J. Day-ahead electricity price forecasting using wavelet transform combined with ARIMA and GARCH models. Appl. Energy 2010, 87, 3606–3610. [Google Scholar] [CrossRef]
- Gonzalez, V.; Contreras, J.; Bunn, D.W. Forecasting power prices using a hybrid Fundamental-Econometric model. IEEE Trans. Power Syst. 2012, 27, 363–372. [Google Scholar] [CrossRef]
- Cerjan, M.; Matijaš, M.; Delimar, M. Dynamic hybrid model for short-term electricity price forecasting. Energies 2014, 7, 3304–3318. [Google Scholar] [CrossRef]
- Garcia, R.; Contreras, C.J.; Van Akkeren, M.; Garcia, J.B.C. A GARCH forecasting model to predict day-ahead electricity prices. IEEE Trans. Power Syst. 2005, 20, 867–874. [Google Scholar] [CrossRef]
- Bowden, N.; Payne, J.E. Short term forecasting of electricity prices for MISO hubs: Evidence from ARIMA-EGARCH models. Energy Econ. 2008, 30, 3186–3197. [Google Scholar] [CrossRef]
- Catalão, J.P.D.S.; Mariano, S.J.P.S.; Mendes, V.M.F.; Ferreira, L.A.F.M. Short-term electricity prices forecasting in a competitive market: A neural network approach. Electr. Power Syst. Res. 2007, 77, 1297–1304. [Google Scholar] [CrossRef] [Green Version]
- Kyoung-jae, K. Financial time series forecasting using support vector machines. Neurocomputing 2003, 55, 307–319. [Google Scholar]
- Galli, R. The relationship between energy intensity and income levels: Forecasting long term energy demand in Asian emerging countries. Energy J. 1998, 19, 85–105. [Google Scholar] [CrossRef]
- Pindyck, R.S.; Pindyck, R.S. The long-run evolution of energy prices. Energy J. 1999, 20, 1–27. [Google Scholar] [CrossRef]
- Koritarov, V.S. Real-world market representation with agents. IEEE Power Energy Mag. 2004, 2, 39–46. [Google Scholar] [CrossRef]
- Yan, X.; Chowdhury, N.A. Mid-term electricity market clearing price forecasting: A hybrid LSSVM and ARMAX approach. Int. J. Electr. Power Energy Syst. 2013, 53, 20–26. [Google Scholar] [CrossRef]
- Torghaban, S.S.; Zareipour, H.; Tuan, L.A. Medium-term electricity market price forecasting: A data-driven approach. In Proceedings of the 2010 North American Power Symposium (NAPS 2010), Arlington, TX, USA, 26–28 September 2010. [Google Scholar]
- Torghaban, S.S.; Motamedi, A.; Zareipour, H.; Tuan, L.A. Medium-term electricity price forecasting. In Proceedings of the 2012 North American Power Symposium (NAPS 2012), Champaign, IL, USA, 9–11 September 2012; pp. 1–8. [Google Scholar]
- Bello, A.; Renses, J.; Munoz, A. Medium-term probabilistic forecasting of extremely low prices in electricity markets: Application to the Spanish case. Energies 2016, 9, 193. [Google Scholar] [CrossRef]
- Yan, X.; Chowdhury, N.A. Mid-term electricity market clearing price forecasting: A multiple SVM approach. Int. J. Electr. Power Energy Syst. 2014, 58, 206–214. [Google Scholar] [CrossRef]
- Sailor, D.J.; Pavlova, A. Air conditioning market saturation and long-term response of residential cooling energy demand to climate change. Energy 2003, 28, 941–951. [Google Scholar] [CrossRef]
- Suganthi, L.; Anand, A.S. Energy models for demand forecasting—A review. Renew. Sustain. Energy Rev. 2012, 16, 1223–1240. [Google Scholar] [CrossRef]
- Lijesen, M.G. The real-time price elasticity of electricity. Energy Econ. 2007, 29, 249–258. [Google Scholar] [CrossRef]
- Bianco, V.; Manca, O.; Nardini, S. Electricity consumption forecasting in Italy using linear regression models. Energy 2009, 34, 1413–1421. [Google Scholar] [CrossRef]
- Kumar, U.; Jain, V.K. Time series models (Grey-Markov, Grey Model with rolling mechanism and singular spectrum analysis) to forecast energy consumption in India. Energy 2010, 35, 1709–1716. [Google Scholar] [CrossRef]
- Hyndman, R.J.; Fan, S. Density forecasting for long-term peak electricity demand. IEEE Trans. Power Syst. 2010, 25, 1142–1153. [Google Scholar] [CrossRef]
- Kok, M.; Lootsma, F.A. Pairwise-comparison methods in multiple objective programming, with applications in a long-term energy-planning model. Eur. J. Oper. Res. 1985, 22, 44–55. [Google Scholar] [CrossRef]
- Porter, M.E. The Five Competitive Forces that Shape Strategy. Harv. Bus. Rev. 2008, 86, 25–40. [Google Scholar]
- Pezzutto, S. Analysis of the Space Heating and Cooling Market in Europe. Ph.D. Thesis, University of Natural Resources and Life Sciences, Vienna, Austria, 2014. [Google Scholar]
- Porter, E.M. How competitive forces shape industry. Harv. Bus. Rev. 1979, 57, 137–145. [Google Scholar]
- Pezzutto, S.; Fazeli, R.; De Felice, M.; Sparber, W. Future development of the air-conditioning market in Europe: An outlook until 2020. Wiley Interdiscip. Rev. Energy Environ. 2016, 5, 649–669. [Google Scholar] [CrossRef]
- New Energy Externalities Developments for Sustainability. Available online: https://cordis.europa.eu/result/rcn/49560_en.html (accessed on 26 February 2018).
- Some Initial Methodological Considerations in the Development and Design of Delphi Surveys. Available online: https://orca.cf.ac.uk/9949/1/Initial%20methodological%20considerations%20in%20the%20development%20and%20design%20of%20Delphi%20surveys.pdf (accessed on 20 February 2018).
- Malczweski, J. GIS and Multicriteria Decision Analysis; John Wiley & Sons: New York, NY, USA, 1999; p. 69. [Google Scholar]
- Percentiles. Available online: http://cnx.org/content/m10805/latest/ (accessed on 22 January 2018).
- Ehrgott, M.; Figueria, J.R.; Greco, S. Trends in Multiple Criteria Decision Analysis; Springer: Boston, MA, USA, 2010; p. 13. [Google Scholar]
- Rao, K.D. Multi-criteria spatial decision analysis for forecasting urban water requirements: A case study of Dehradun city, India. Landsc. Urban Plan. 2005, 71, 163–174. [Google Scholar]
- Onder, E.; Hepsen, A. Combining Time Series Analysis and Multi Criteria Decision Making Techniques for Forecasting Financial Performance of Banks in Turkey. Int. J. Latest Trends Financ. Econ. Sci. 2013, 3, 530–550. [Google Scholar]
- Euphemia Public Description. Available online: http://www.belpex.be/wp-content/ uploads/Euphemia-public-description-Nov-2013.pdf (accessed on 18 May 2018).
- Cosmos Public Description. Available online: http://www.belpex.be/wp-content/uploads/ COSMOS_public_description.pdf (accessed on 19 May 2018).
- EU Emissions Trading System. Available online: https://ec.europa.eu/clima/policies/ets_en (accessed on 18 May 2018).
- 2020 Climate & Energy Package. Available online: https://ec.europa.eu/clima/policies/strategies/2020_en (accessed on 18 May 2018).
- Directive of the European Parliament and of the Council on Common Rules for the Internal Market in Electricity (Recast). Available online: https://ec.europa.eu/energy/sites/ener/files/documents/1_en_act_part1_v7_864.pdf (accessed on 18 May 2018).
- Saaty, T.L. Decision making with the analytic hierarchy process. Int. J. Serv. Sci. 2008, 1, 83–98. [Google Scholar] [CrossRef]
- Haas, R.; Meixner, O. An Illustrated Guide to the Analytic Hierarchy Process; University of Natural Resources and Applied Life Sciences: Vienna, Austria, 2013. [Google Scholar]
- The Analytical Hierarchy Process: A New Tool for Complex Decision-Making in Public Health. Available online: https://medepi.files.wordpress.com/2012/02/phprep-summit-2012-ahp2.pdf (accessed on 10 January 2018).
- Global Marketing. Available online: http://proz-x.com/stephanlangdon/Library/USCore/Hollensen.Global_Marketing.pdf (accessed on 6 January 2018).
- Trends in Extreme Weather Events in Europe: Implications for National and European Union Adaptation Strategies. Available online: https://easac.eu/fileadmin/PDF_s/reports_statements/Extreme_Weather/EASAC_report_Extreme_Weather_in_Europe_Nov13.pdf (accessed on 1 March 2018).
- European Environment Agency Overview of Electricity Production and Use in Europe. Available online: https://www.eea.europa.eu/data-and-maps/indicators/overview-of-the-electricity-production-1/assessment (accessed on 2 October 2017).
- Market Analysis. Available online: https://ec.europa.eu/energy/en/data-analysis/market-analysis (accessed on 2 January 2018).
- Future Electricity Prices. Available online: https://www.ecn.nl/publicaties/PdfFetch.aspx?nr=ECN-E--08-044 (accessed on 28 March 2018).
- Long-Term Market Analysis, the Nordic Region and Europe 2016–2040. Available online: http://www.statnett.no/Documents/Nyheter_og_media/Nyhetsarkiv/2016/Long-term%20Market%20Analysis%20The%20Nordic%20Region%20and%20Europe%202016-2040.pdf (accessed on 2 March 2018).


| Force 1 Threat of New Entrants | Force 2 Treat of Substitute Products or Services |
|
|
| Force 3 Bargaining Power of Suppliers | Force 4 Bargaining Power of Buyers |
|
|
| Forces | Factors’ Evaluations | Results (Σ) | Evaluation Scale’s Range (±) |
|---|---|---|---|
| Force 1—Threat of new entrants | 8+ 7+ 8+ 7+ 8+ 7+ 1− 5− 4− 7− 7− 7+ 7− 7− 7− | 45+ | |
| Force 2—Threat of substitute products or services | 10− | ||
| Force 3—Bargaining power of suppliers | 7− | ||
| Force 4—Bargaining power of buyers | 21− | ||
| Force 5—Overall result | 7+ | 150 | |
| Force 5—Overall result (%) | 5%± | 100%± |
| Goals | ||||
|---|---|---|---|---|
| Field | Legislation | Regulation | Profitability | |
| Goals | Environmental policies | Feasibility in changing supplier | Income max. | Benefit to cost max. |
| 8+ | 4− | 8+ | 3− | |
| Factors | |||
|---|---|---|---|
| Evaluation | Renewable energy production | Fossil fuels’ price | Extreme weather events |
| 4+ | 3+ | 1− | |
| Social unacceptance of higher electricity prices due to incentives/subsidies | Electricity market concentration | E-mobility | |
| 1− | 5+ | 1+ | |
| Electricity market liberalization | EU economy growth | ||
| 6− | 4+ | ||
| Goals | ||||
|---|---|---|---|---|
| Factors | Environmental Policies | Feasibility in Changing Supplier | Income Max. | Benefit to Cost Max. |
| Renewable energy production | X | 0 | 0 | 0 |
| Fossil fuels’ price | X | 0 | 0 | X |
| Extreme weather events | X | 0 | 0 | X |
| Social unacceptance of higher electricity prices due to incentives/subsidies | X | 0 | X | 0 |
| Electricity market concentration | 0 | X | X | X |
| E-mobility | X | 0 | X | X |
| Electricity Market liberalization | 0 | X | X | 0 |
| EU economy growth | 0 | 0 | X | 0 |
| Factors | Goals | Results | |||
|---|---|---|---|---|---|
| Environmental Policies (8+) | Feasibility in Changing Supplier (4−) | Income Max. (8+) | Benefit to Cost Max. (3−) | ||
| Renewable energy production (4+) | (4+) × (8+) = 32+ | - | - | (4+) × (3−) = 12− | (24+) + (9−) = 20+ |
| Fossil fuels’ price (3+) | (3+) × (8+) = 24+ | - | (3+) × (3−) = 9− | (16+) + (6−) = 15+ | |
| Extreme weather events (1−) | (1−) × (8+) = 8− | - | (1−) × (8+) = 8− | - | (8−) + (8−) = 16− |
| Social unacceptance of higher electricity prices due to incentives/subsidies (1−) | (1−) × (8+) = 8− | - | (1−) × (8+) = 8− | - | (8−) + (8−) = 16− |
| Market concentration (5+) | - | (5+) × (4−) = 20− | (5+) × (8+) = 40+ | (5+) × (3−) = 15− | (20−) + (40+) + (15−) = 5+ |
| E-mobility (1+) | (1+) × (8+) = 8+ | - | (1+) × (8+) = 8+ | (1+) × (3−) = 3− | (8+) + (8+) + (3−) = 13+ |
| Market liberalization (5−) | (5−) × (8+) = 40− | (5−) × (4−) = 20− | (5−) × (8+) = 40− | - | (40−) + (20−) + (40−) = 100− |
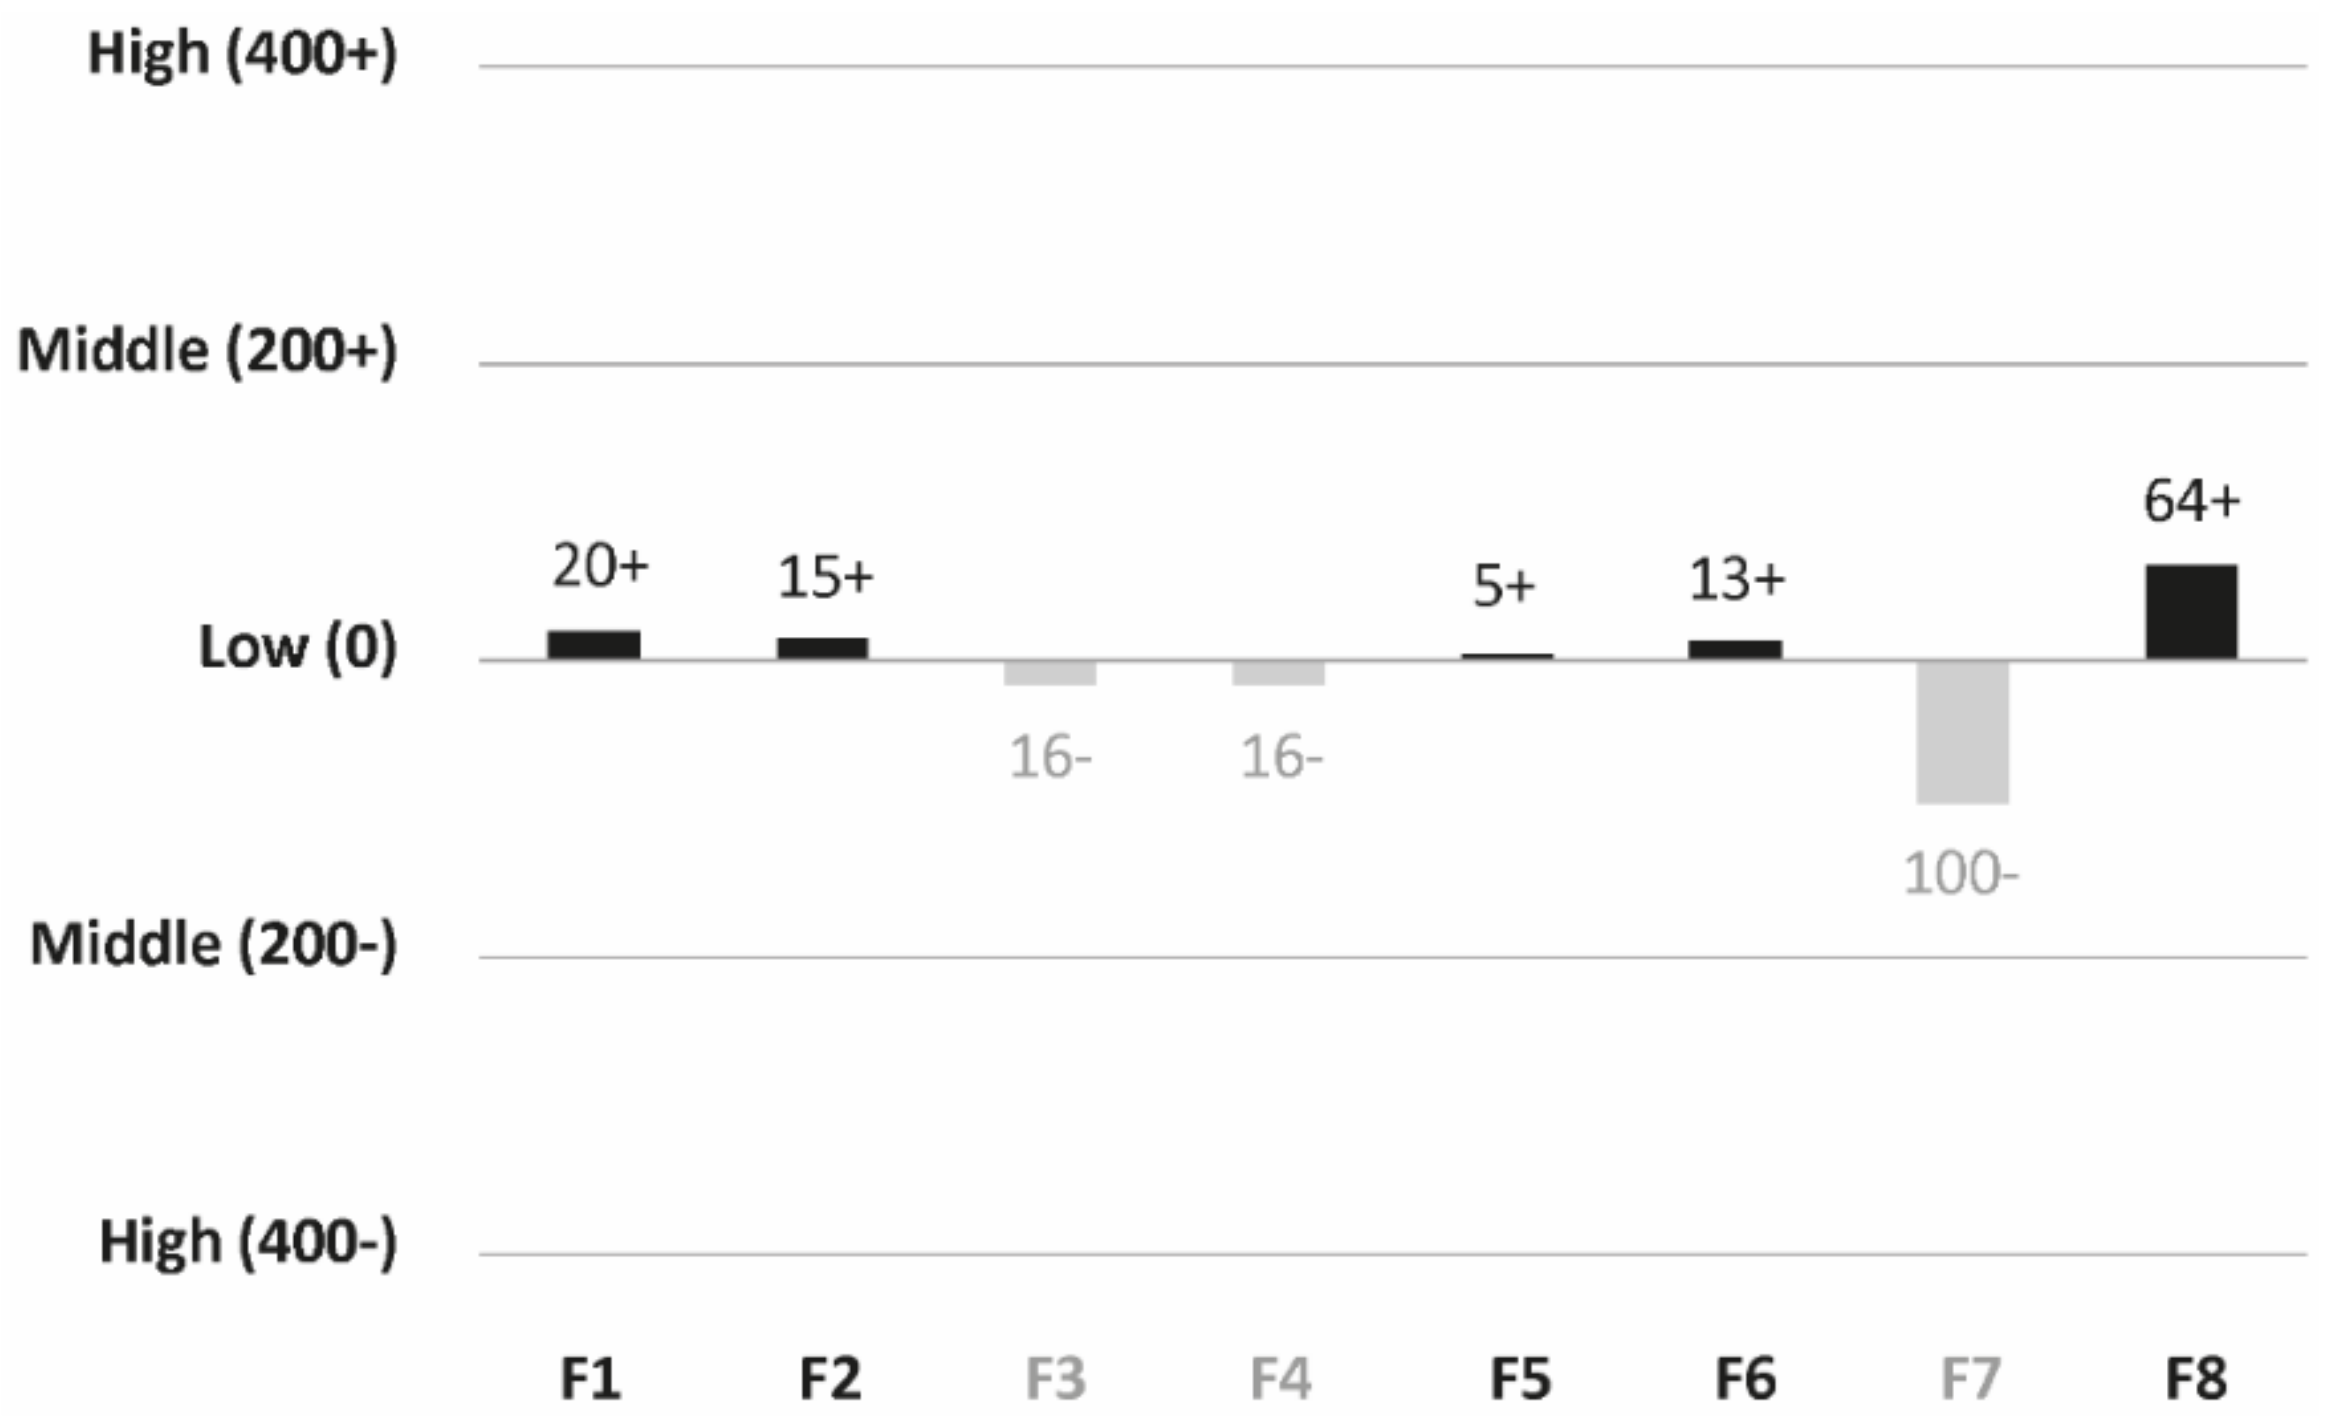
| EU economy growth (4+) | (4+) × (8+) = 32+ | - | (4+) × (8+) = 32+ | - | (32+) + (32+) = 64+ |
© 2018 by the authors. Licensee MDPI, Basel, Switzerland. This article is an open access article distributed under the terms and conditions of the Creative Commons Attribution (CC BY) license (http://creativecommons.org/licenses/by/4.0/).
Share and Cite
Pezzutto, S.; Grilli, G.; Zambotti, S.; Dunjic, S. Forecasting Electricity Market Price for End Users in EU28 until 2020—Main Factors of Influence. Energies 2018, 11, 1460. https://doi.org/10.3390/en11061460
Pezzutto S, Grilli G, Zambotti S, Dunjic S. Forecasting Electricity Market Price for End Users in EU28 until 2020—Main Factors of Influence. Energies. 2018; 11(6):1460. https://doi.org/10.3390/en11061460
Chicago/Turabian StylePezzutto, Simon, Gianluca Grilli, Stefano Zambotti, and Stefan Dunjic. 2018. "Forecasting Electricity Market Price for End Users in EU28 until 2020—Main Factors of Influence" Energies 11, no. 6: 1460. https://doi.org/10.3390/en11061460
APA StylePezzutto, S., Grilli, G., Zambotti, S., & Dunjic, S. (2018). Forecasting Electricity Market Price for End Users in EU28 until 2020—Main Factors of Influence. Energies, 11(6), 1460. https://doi.org/10.3390/en11061460