Research into an Online Calibration System for the Errors of Voltage Transformers Based on Open–Closed Capacitor


1
College of Electrical Engineering & New Energy, China Three Gorges University College, Yichang 443002, China
2
Hubei Provincial Collaborative Innovation Center for New Energy Microgrid, China Three Gorges University, Yichang 443002, China
3
School of Electronic and Information Engineering, Suzhou University of Science and Technology, Suzhou 215009, China
*
Author to whom correspondence should be addressed.
Energies 2018, 11(6), 1455; https://doi.org/10.3390/en11061455
Submission received: 17 April 2018
/
Revised: 2 June 2018
/
Accepted: 4 June 2018
/
Published: 5 June 2018
Abstract
:Periodical calibration is necessary to ensure the accuracy and reliability of voltage transformers. The traditional calibration method requires the power to be off, and the calibration period for this method is too long, meaning that problems with the transformer cannot be found in time. In this paper, a voltage transformer error online calibration system based on open–closed capacitors is proposed. Two open–closed capacitors and other auxiliary devices are utilized to construct the standard voltage sensor. The outputs of the open–closed capacitors are compared with each other to realize accurate self-checking. The average value of the output is used as the final output, which can improve the system’s accuracy and reliability. An improved algorithm based on a hybrid convolution window is proposed to extract the fundamental and harmonic signals. Test results show that the variation of the ratio error is less than 0.037%, and the variation of the angle error is less than 0.45’.
1. Introduction
The voltage transformer is one of the most important items of measurement equipment in power systems. In order to ensure the safe and stable operation of the power system, the voltage of the critical equipment and nodes in the power systems must be monitored in a timely and accurate manner. Therefore, voltage transformers are extremely necessary [1,2,3,4,5]. In order to ensure the accuracy and reliability of voltage measurements, it is very important to improve the performance of the voltage transformer. Among the factors involved in performance, the accuracy of the voltage transformer is an important index. Normally, the transformer error test is carried out in the laboratory or at the substation site. At this time, the transformer is required to have power off, and to be exiting from the power line. This method is not beneficial for observing the operation state of the transformer, and some problems cannot be found in time. Only if real-time monitoring and trend forecast of the transformer’s accuracy can be realized during the online operation can the problems of the transformer be found in time [6,7,8,9,10].
For the error comparison and calibration of the voltage transformer, reference [11] gives a calibration method for electronic voltage transformers which can also be used for transformers with analog and digital outputs. However, this method can only be used for calibration with power off, and online calibration cannot be realized [11]. For digital output of electronic voltage transformers, a high accuracy online calibration method is proposed [12]. An electromagnetic voltage transformer is used as the standard sensor. However, the electromagnetic voltage transformer is large and heavy, and is not suitable for online calibration. Because of the iron core, it is possible to bring ferromagnetic resonance under the online conditions. A double air-gap current transformer applied to the high voltage transmission line is proposed, but it cannot be used for the online calibration of the voltage transformer [13].
To solve this problem, this paper proposes a voltage transformer error online calibration system based on open–closed capacitors. Two open–closed capacitors and other auxiliary devices are used as a standard voltage sensor. The outputs of the two open–closed capacitors are compared with each other to realize accurate self-checking. The average value of the output is used as the final output, which can greatly improve the accuracy and reliability. An improved algorithm is proposed to extract the fundamental and harmonic signals. The test results show that the accuracy of the online calibration system can be achieved to 0.05 classes. Compared with traditional calibration methods, the method proposed in this paper doesn’t need to have power off, which can improve the work efficiency, and save on cost.
2. Overall Structure of the Online Calibration System
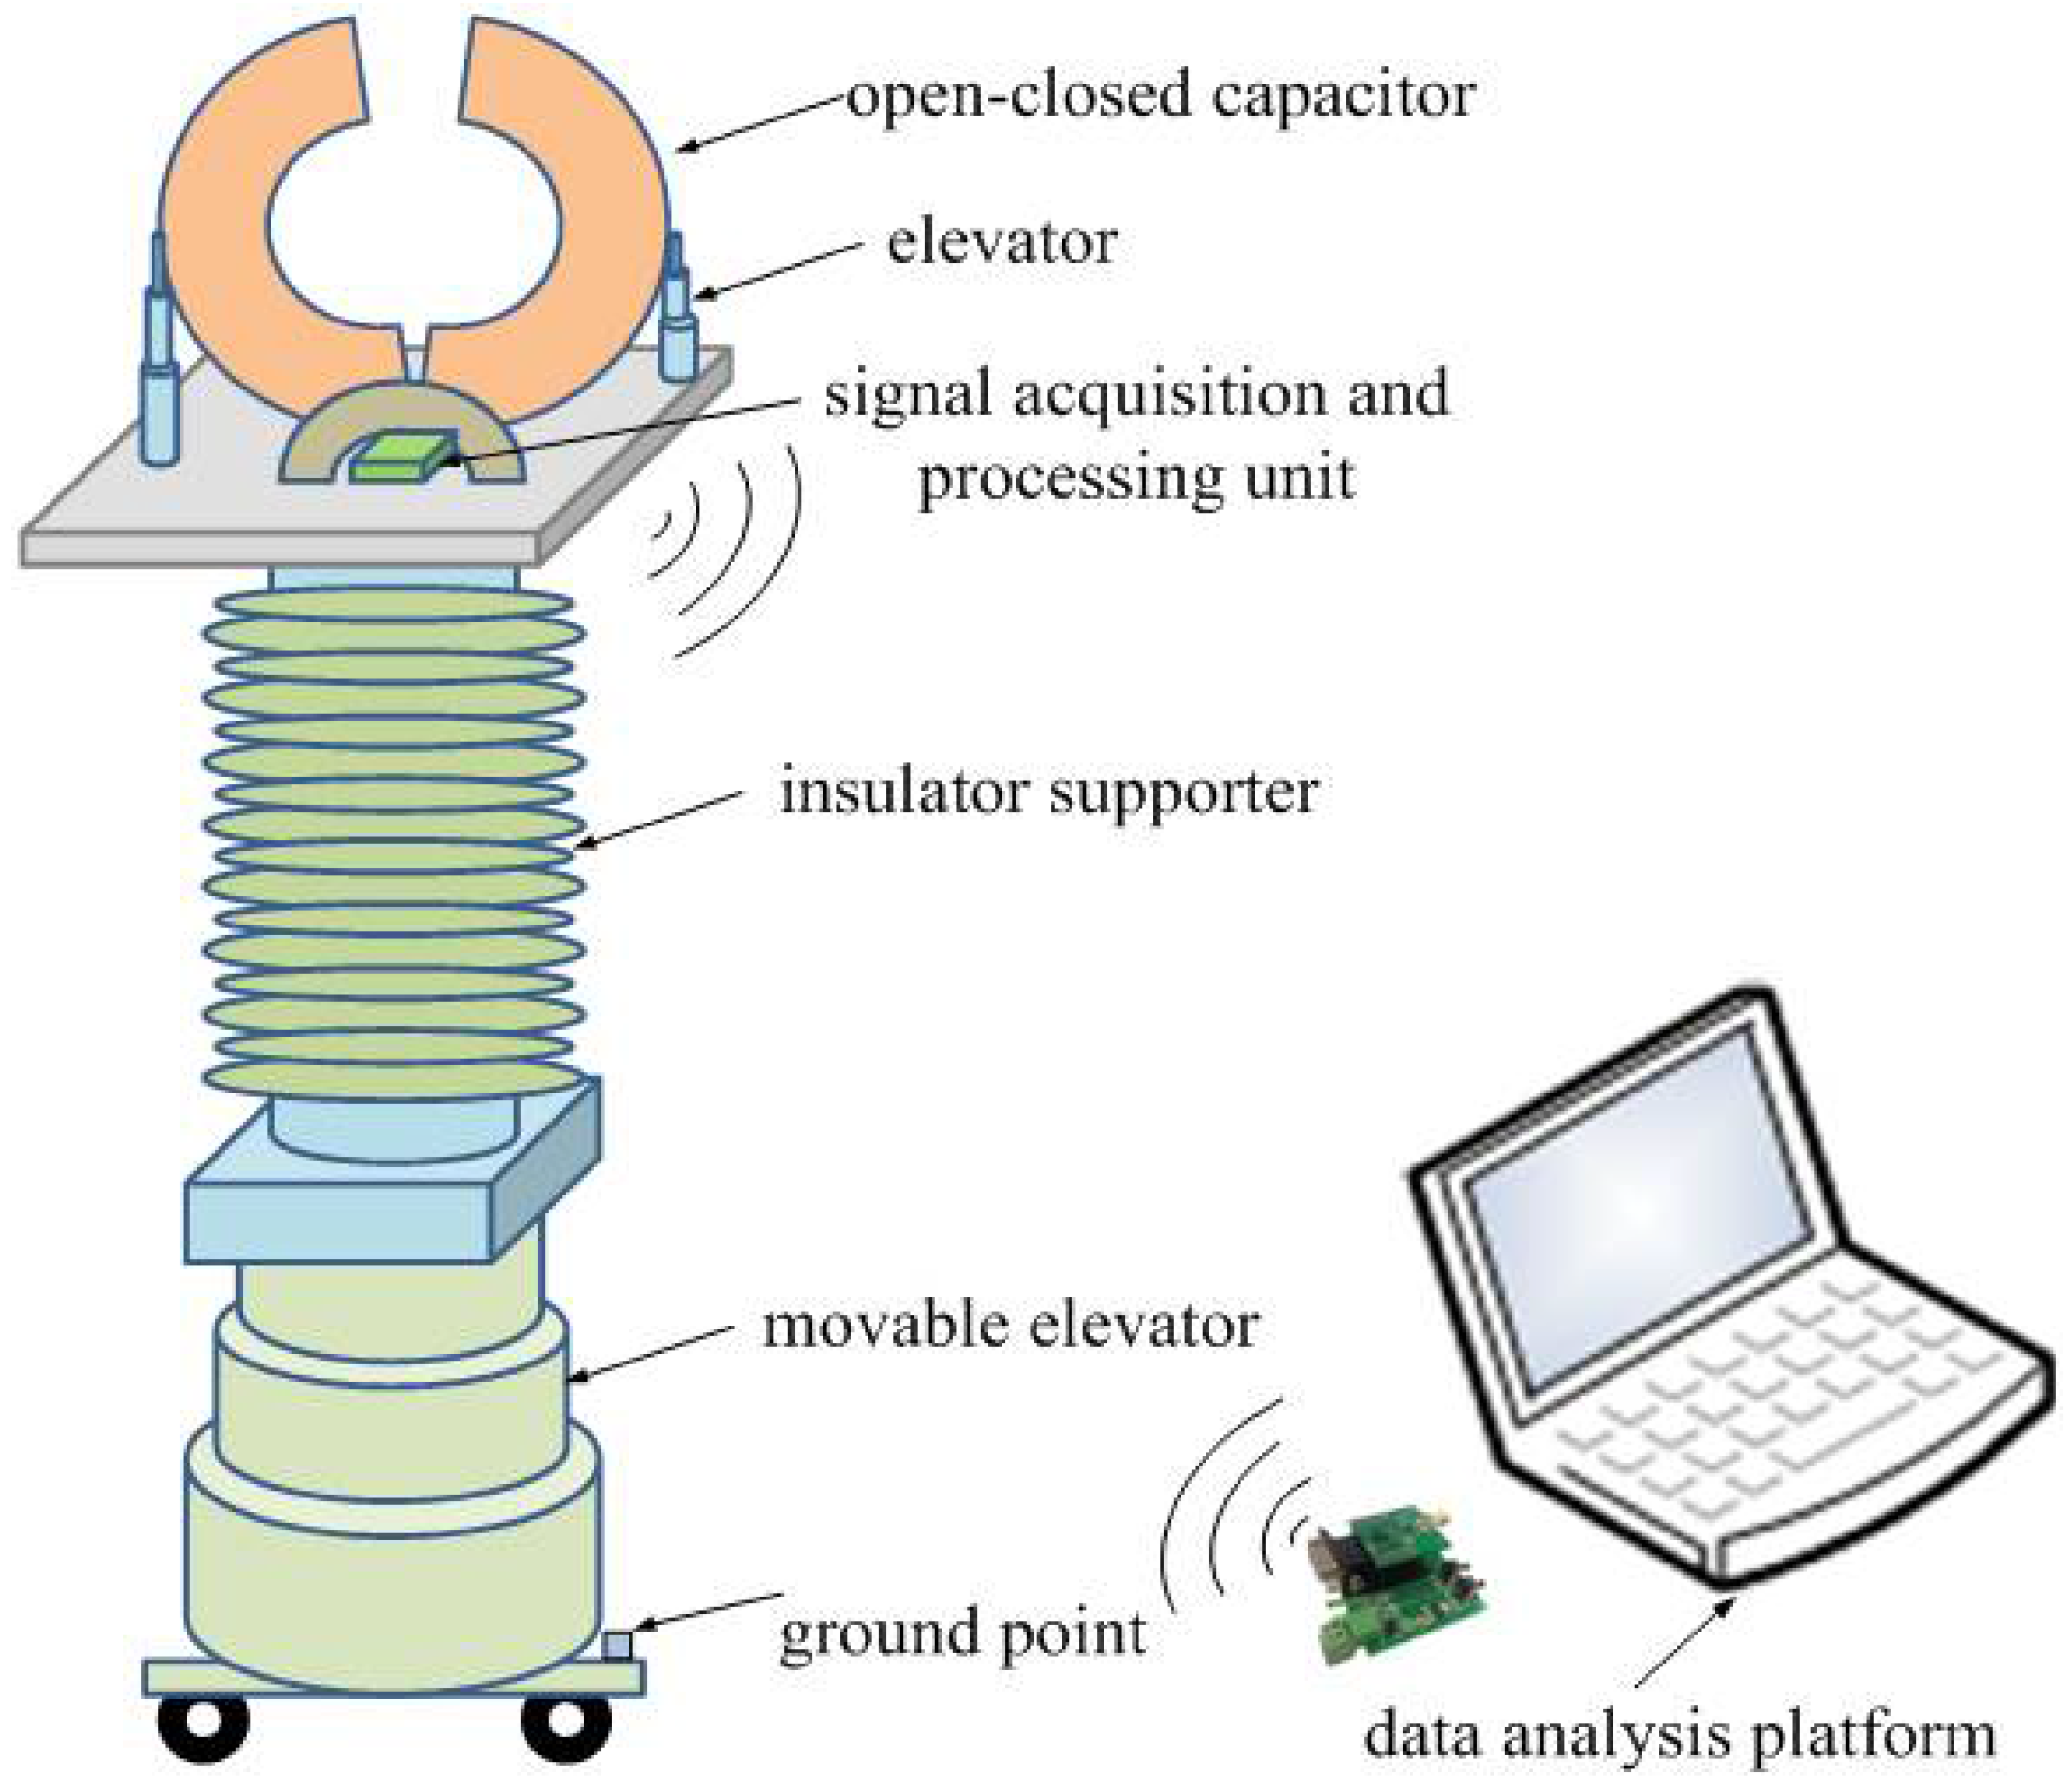
As is shown in Figure 1, the error online calibration system includes a standard voltage sensor, a signal acquisition and processing unit, an insulator supporter, a movable elevator, and a data analysis platform. The outputs of the standard voltage sensor are transmitted to the signal acquisition and processing unit through the shielded cable. After this, the data are processed and sent to the data analysis platform through wireless communication. The data analysis platform is used for error calculation, waveform display, and trend analysis. For the 110 kV system, the height of the insulation supporter is about 1.5 m. The diameter of the open–closed capacitor is 270 mm, and the height of the elevator can be adjusted from 0.4 to 3 m.
3. Performance Analysis of Standard Voltage Sensor
The standard voltage sensor consists of two open–closed capacitors. The outputs of the two open–closed capacitors are compared with each other. When the difference is small, it means the open–closed capacitors are closed well, and the position is normal. It is generally agreed that if the difference is within 0.01%, it means the difference is small, the open–closed capacitor is closed well, and the position is normal. Both outputs will be obtained by a data analysis platform, after which the difference between the two outputs can be analyzed.
In this case, the average value of output is calculated as the final result. Otherwise, it means the open–closed capacitor is abnormal, and the operator should examine and repair it. By using this method, the accuracy and reliability of the calibration results can be improved effectively.
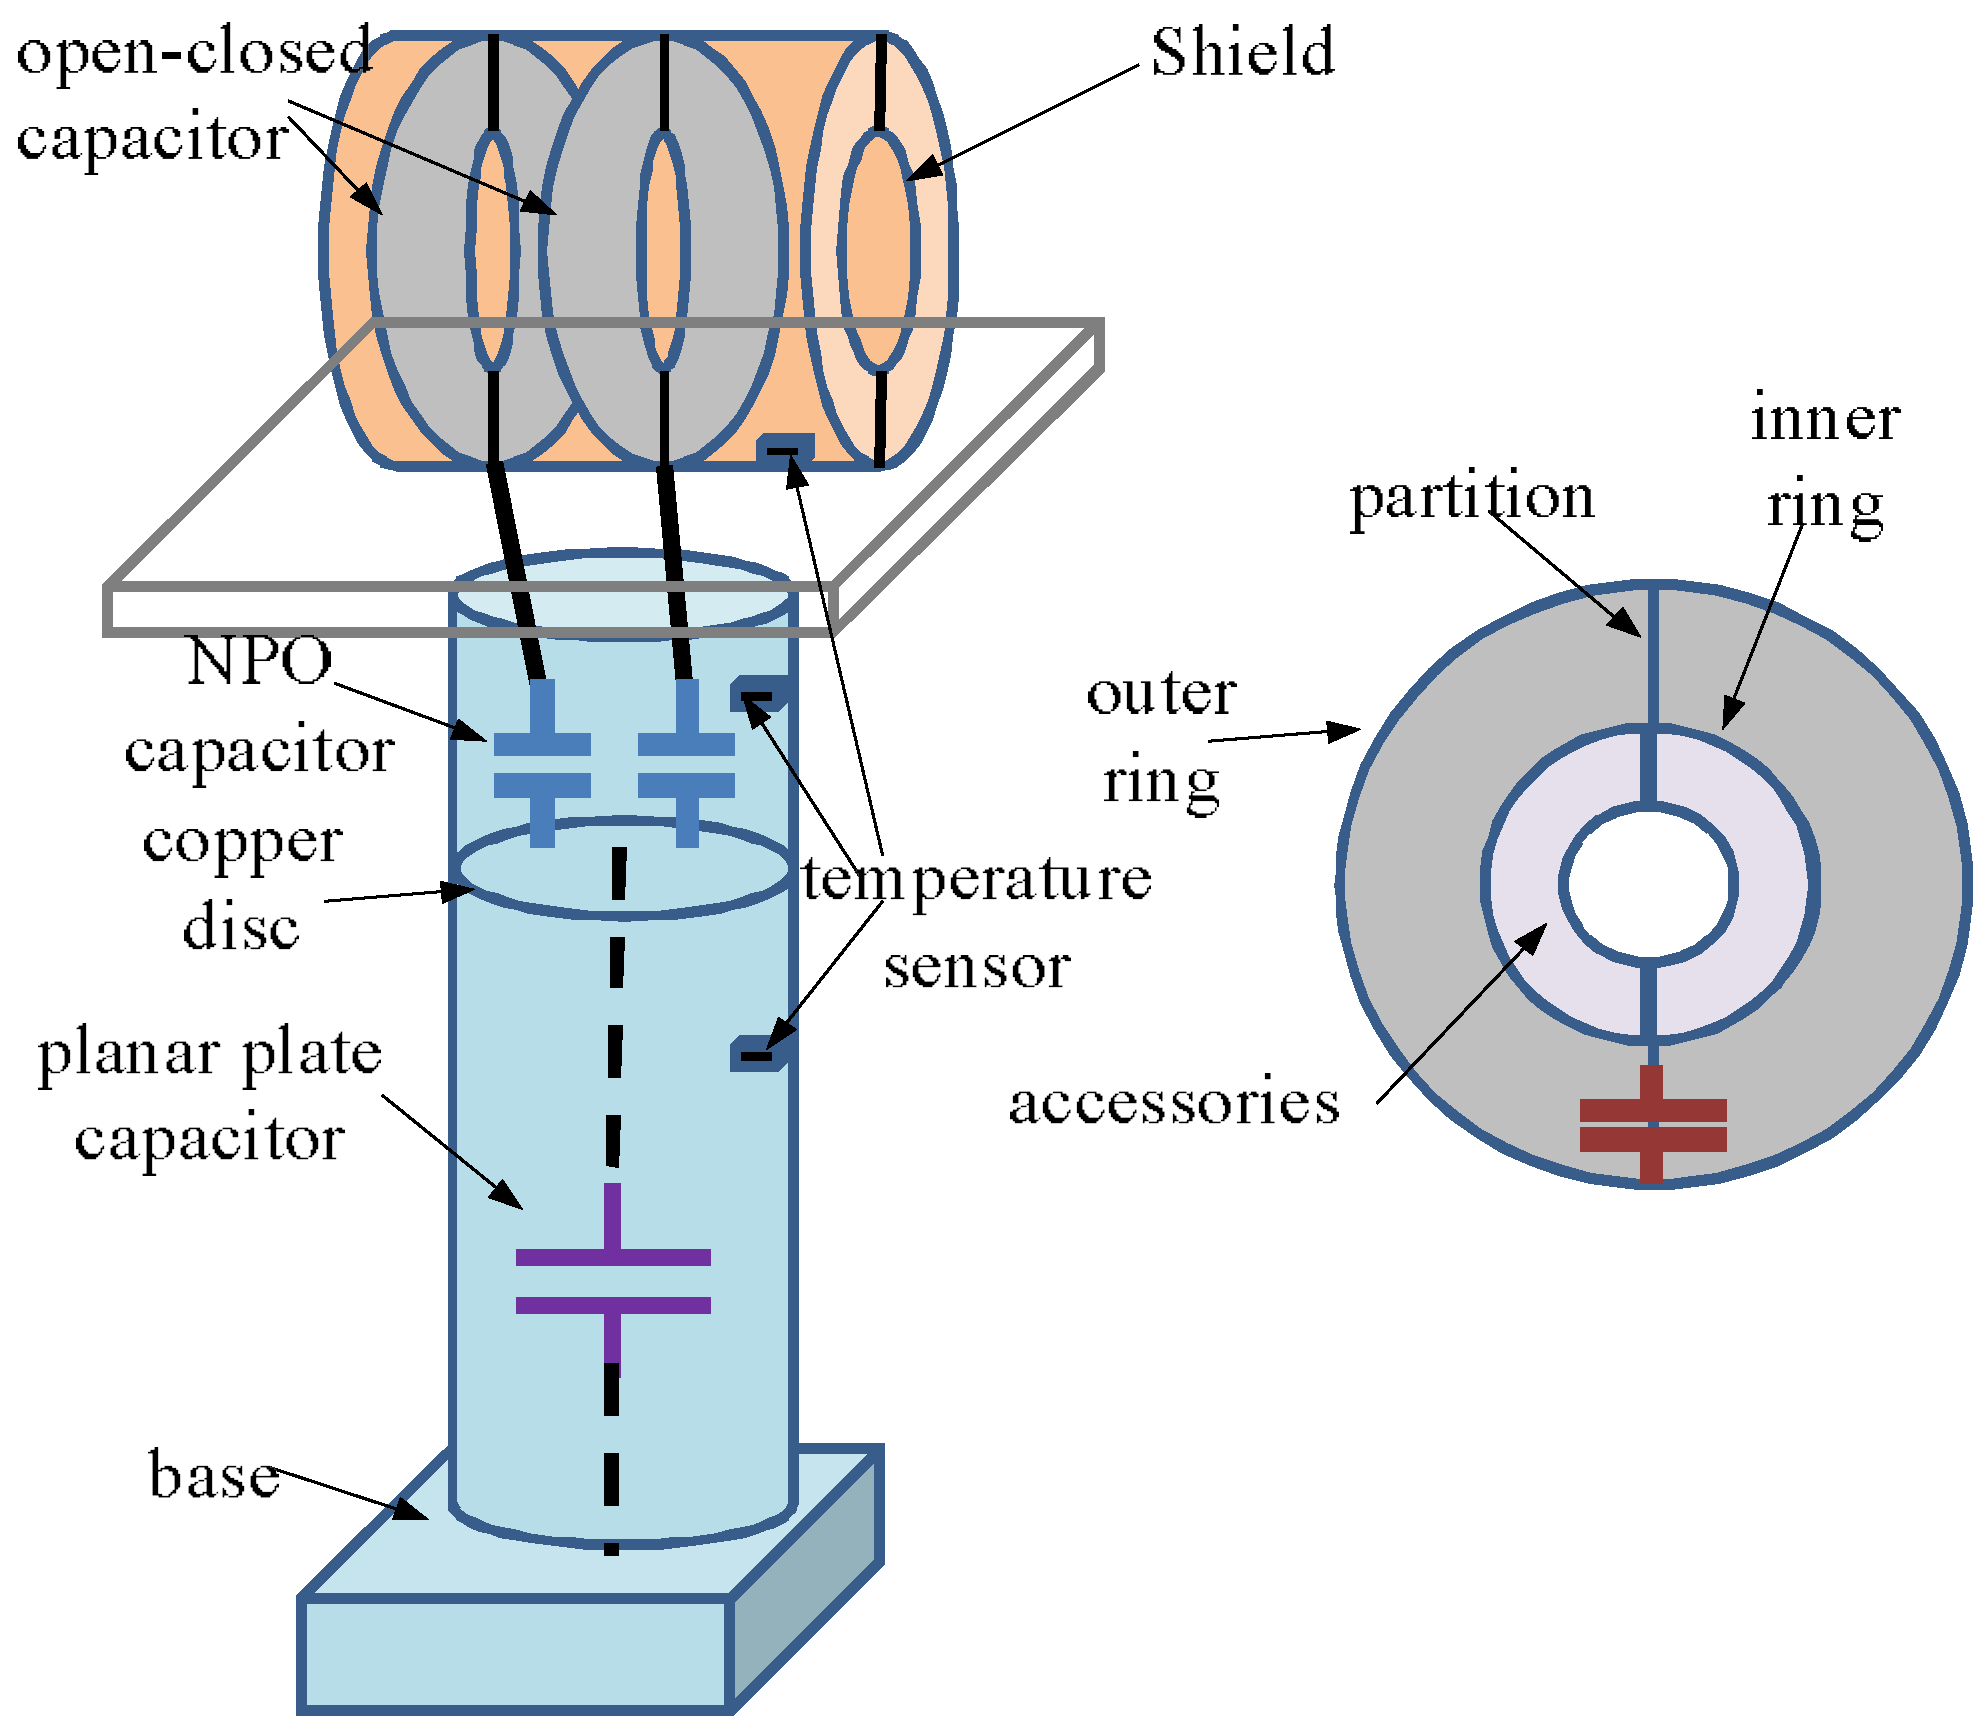
The open–closed capacitor is fixed on the supporting platform above the insulating supporter. The open–closed capacitor consists of two semi-circular cylinders, including an inner ring, an outer ring, and a partition. The inner ring and outer ring are fixed and separated by a partition. A gas capacitor is constructed by the inner ring, outer ring, and the gas. For different wire diameters, the inside of the open–closed capacitor can be equipped with accessories, so the diameter of the inner ring can be changed to fit wires of different diameters. The open–closed capacitor is installed in the shield, which can reduce the external interference. When the capacitor is open or closed, it can access or exit the primary line through the elevator. For the 110 kV system, the outer diameter of the open–closed capacitor is 270 mm, the inner diameter of the open–closed capacitor is 200 mm, and the width of the open–closed capacitor is 50 mm.
As shown in Figure 2, the standard voltage sensor is composed of two open–closed capacitors, two NPO capacitors (negative–positive 0 ppm/°C, meaning that for negative or positive shifts in temperature, the capacitance changes 0 part per million), and a planar plate capacitor. The value of NPO capacitance is 100 nF. To improve the measurement accuracy, the outputs of the two open–closed capacitors are compared with each other. If the difference is within 0.01%, it shows that the open–closed capacitor is closed well and the position is normal. In this case, the average value is taken as the final result; if the difference exceeds 0.01%, it shows that the open–closed capacitor is abnormal, and should be closed again or examined. The accuracy and reliability of the compared results can be improved effectively by this method. Temperature sensors are used to monitor the internal temperature of the standard voltage sensor, and provide data for the temperature compensation of the sensor.
The capacitance of the open–closed capacitor can be expressed as:
where is permittivity of vacuum, is the relative permittivity of gas, is length of the open–closed capacitor, and are radii of the inner ring and outer ring. The capacitance for the planar plate capacitor is given by Equation (2).
where r is the radius of the copper disc, and d is the distance between the copper disc and the base.
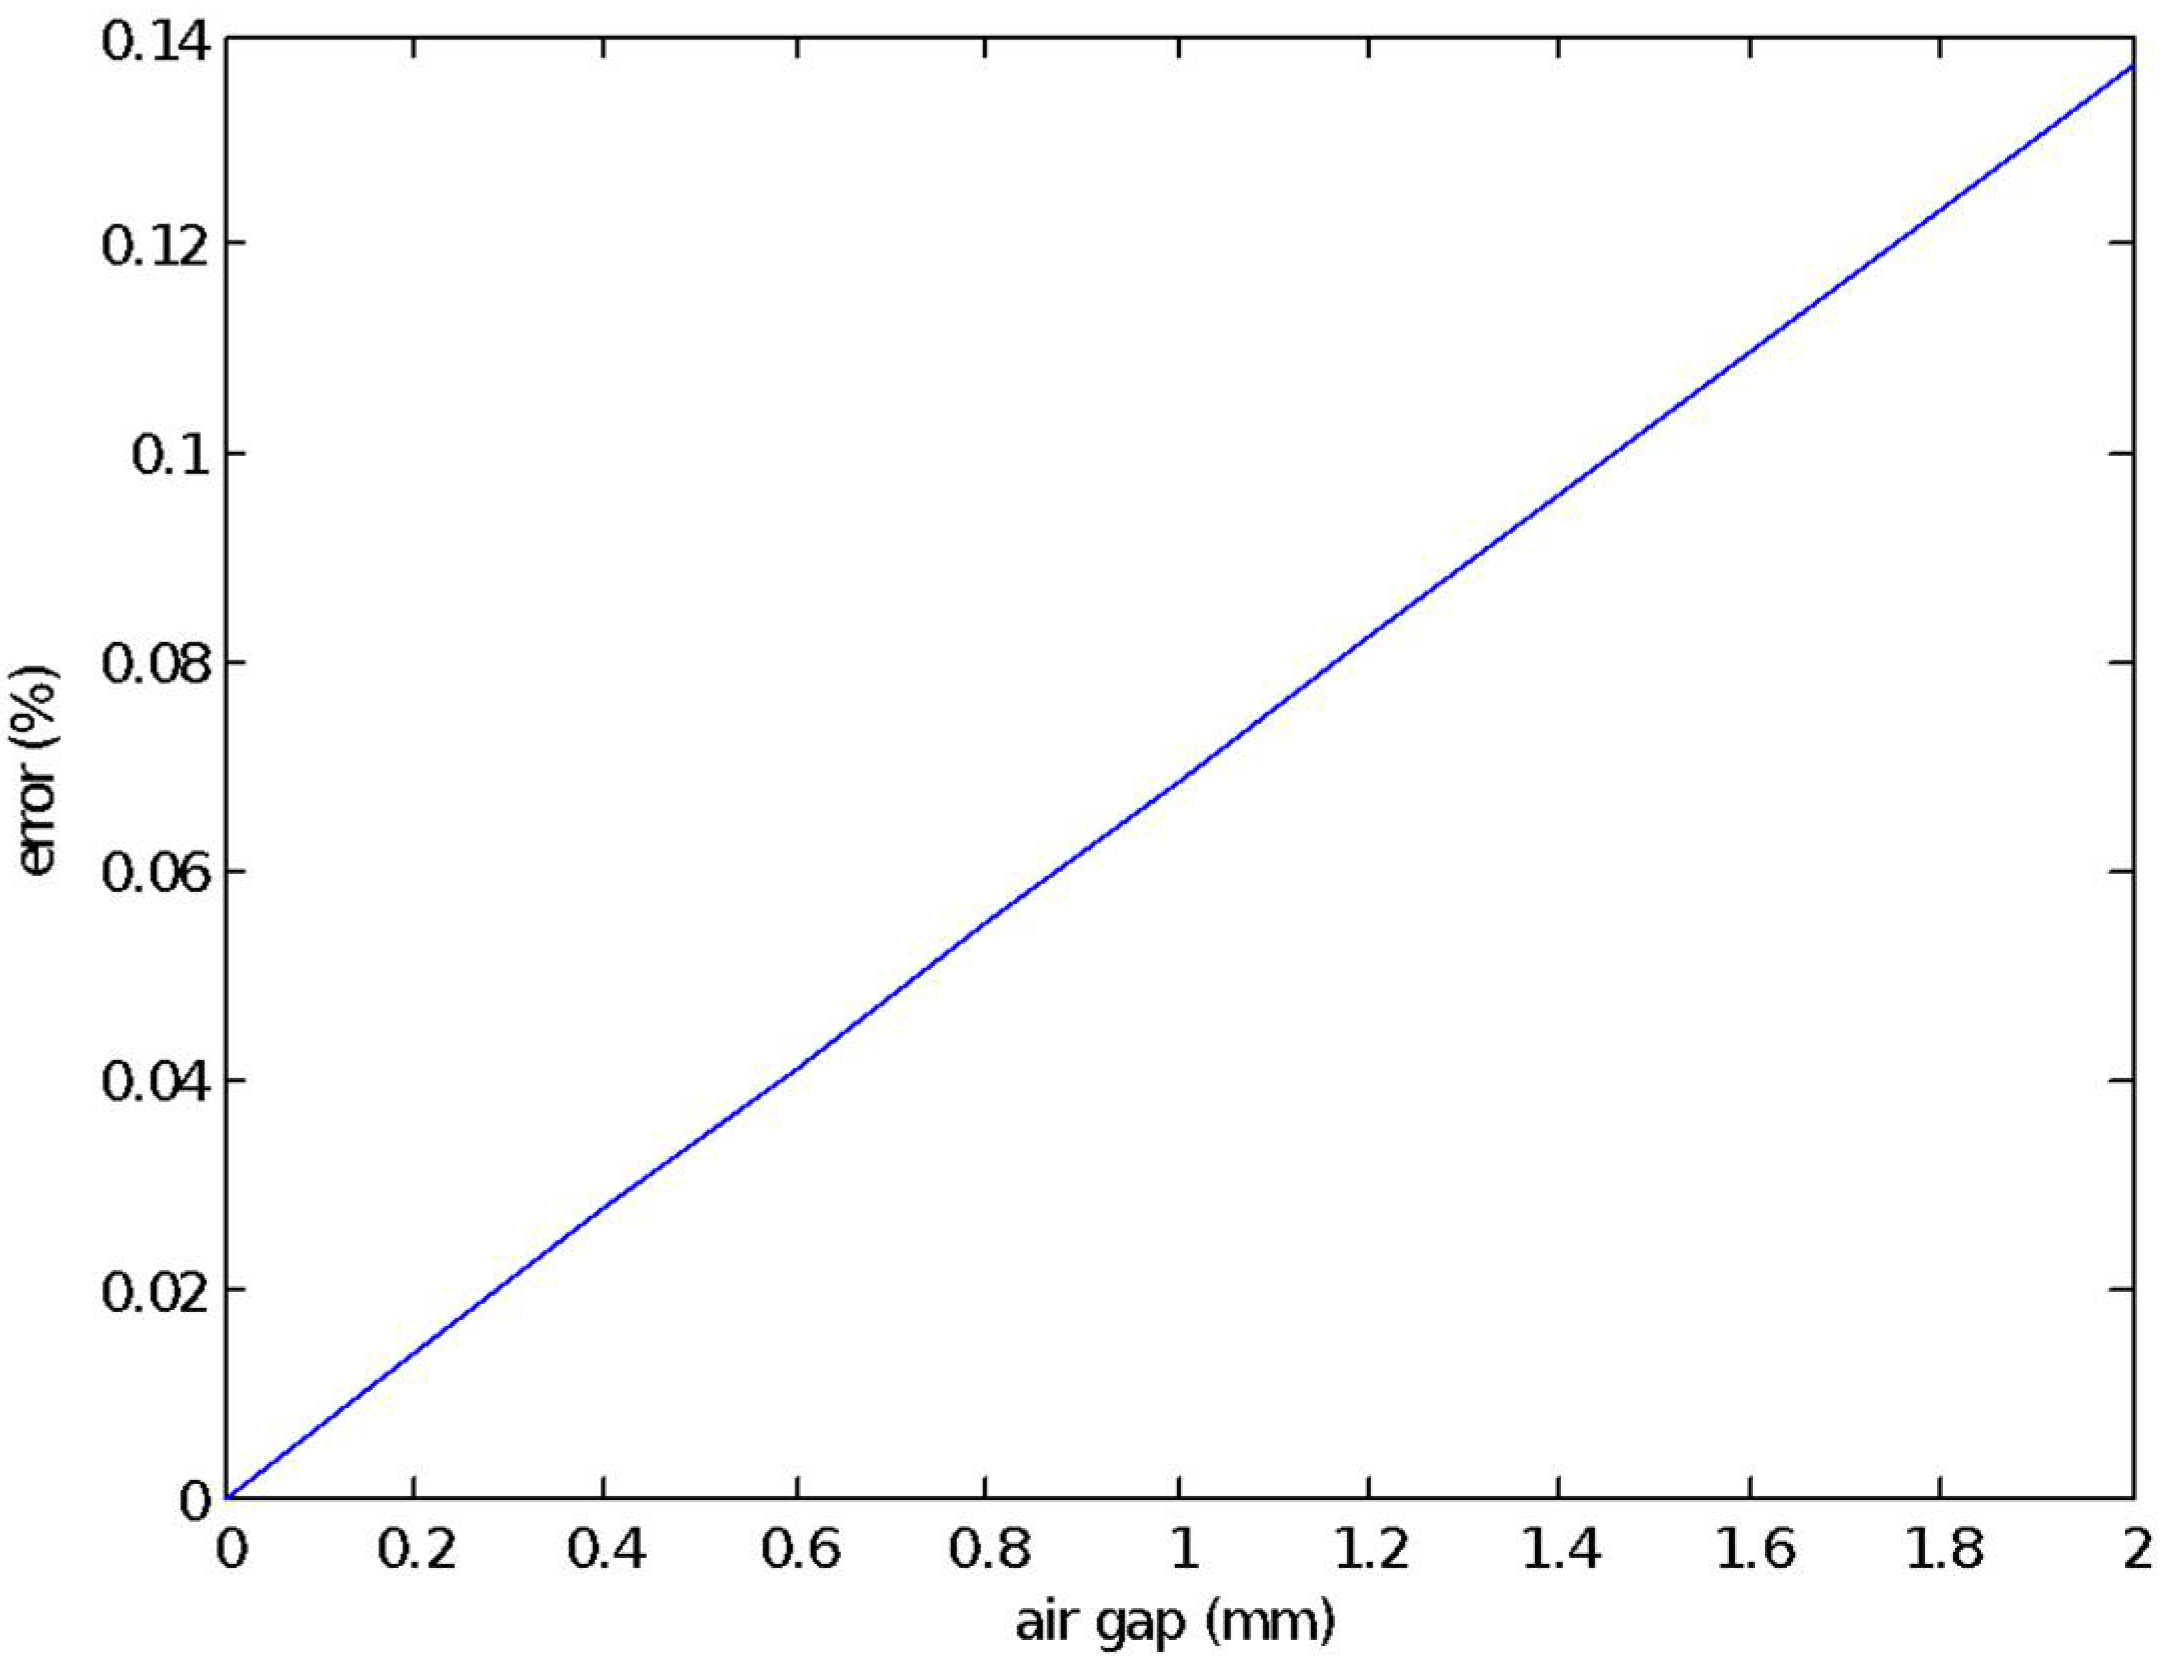
The measurement accuracy of the open–closed capacitors may be affected by an air gap. In order to verify the influence, the simulation verification is carried out, and the result is shown in Figure 3. It can be seen that when the air gap is within 0.8 mm, the error is less than 0.05%, and when the air gap is 0.2 mm, the error is less than 0.01%. The overall accuracy of the system is 0.05 accuracy grade, so the error of the sensor should be controlled within 0.01%, and the air gap should be controlled within 0.2 mm. Using a mechanical fixed method, the air gap can be controlled within 0.1 mm.
4. Research on High Accuracy Data Processing Algorithm
In the field calibration, the outputs of the standard voltage sensor are transmitted to the data analysis platform, and are used for error calculation, waveform display, and trend analysis by algorithm in the data analysis platform. The system may be affected by the frequency fluctuation and harmonic disturbance of the power grid. As a result, the problems of spectrum leakage and fence effect caused by asynchronous sampling may be generated [14,15,16,17,18,19]. In order to suppress the spectrum leakage and fence effect, an improved FFT (Fast Fourier Transformation) algorithm based on a hybrid convolution window is proposed in this paper. Compared with the traditional FFT algorithm, it has narrower main lobe width and lower side lobe peak level, and it can effectively suppress the spectrum leakage, reduce the sampling error caused by non-synchronous sampling or high order harmonics, and improve the accuracy of the calibration system.
4.1. Principle of Hybrid Convolution Window Algorithm
The hybrid convolution window is the convolution operation result of several different cosine windows in the time domain [20]. The time domain expression of cosine windows in the convolution is:
where M is the number of entries of the window function, and satisfies the constraints: .
The frequency domain expression can be obtained by Fourier transform:
When , the formula can be simplified as:
4.2. Characteristic of the Algorithm
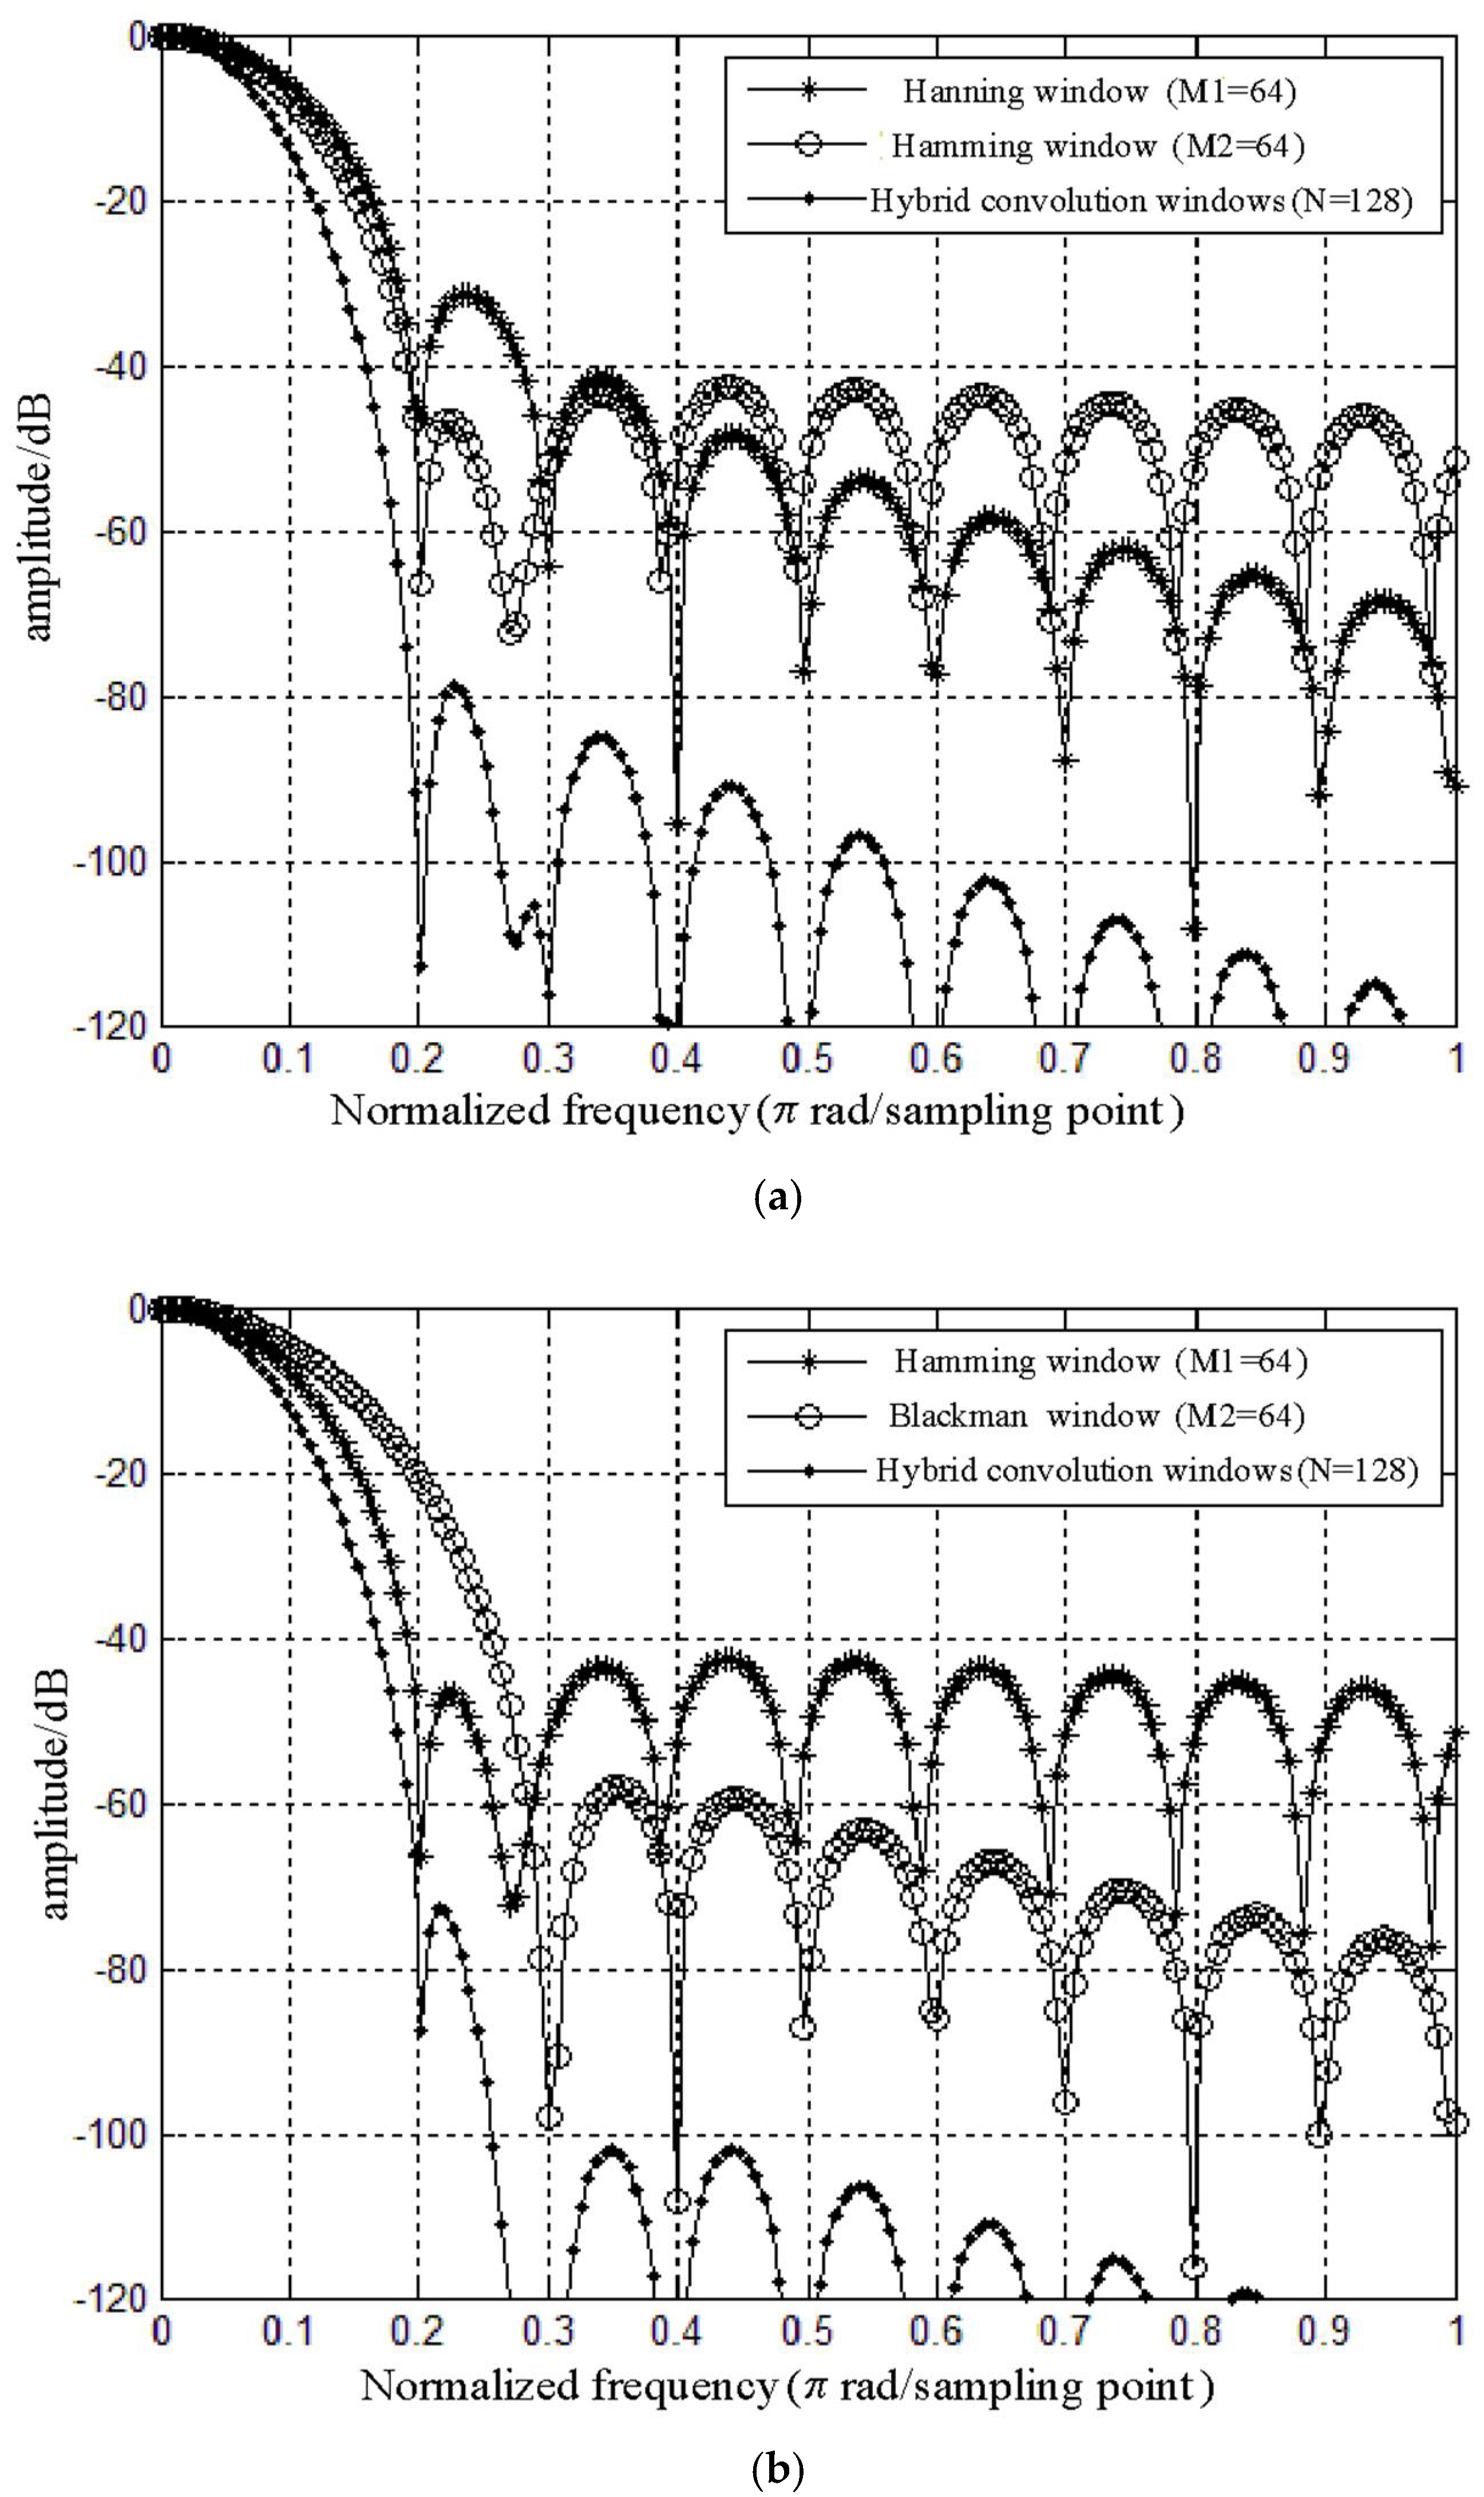
In order to study the characteristics of hybrid convolution windows, simulations of the amplitude-frequency characteristics of the following hybrid convolution window functions were carried out in this paper:
- (1)
- Figure 4a is the amplitude-frequency response diagram of the hybrid convolution window that is calculated by the convolution of a Hanning window (M1 = 64) and a Hamming window (M2 = 64). From the figure we can see that the main lobe width of is the same as that of Hanning window and Hamming window with a value of . The side lobe attenuation rate is approximately 24 dB/oct, and is the sum of the other two window functions (Hanning window is 18 dB/oct and Hamming window is 6 dB/oct). The side lobe peak level is −113 dB when , and is the sum of Hanning window (−48 dB) and Hamming window (−65 dB).
- (2)
- Figure 4b is the amplitude-frequency response diagram of the hybrid convolution window that is calculated by the convolution of a Hamming window (M1 = 64) and a Blackman window (M2 = 64). From the figure we can see that the main lobe width of is the same as that of Hamming window and Blackman window with a value of . The side lobe attenuation rate is approximately 24 dB/oct, and is the sum of the other two window functions (Hamming window is 6 dB/oct and Blackman window is 6 dB/oct). The side lobe peak level is −88 dB when , and is the sum of Hamming window (−66 dB) and Blackman window (−22 dB).
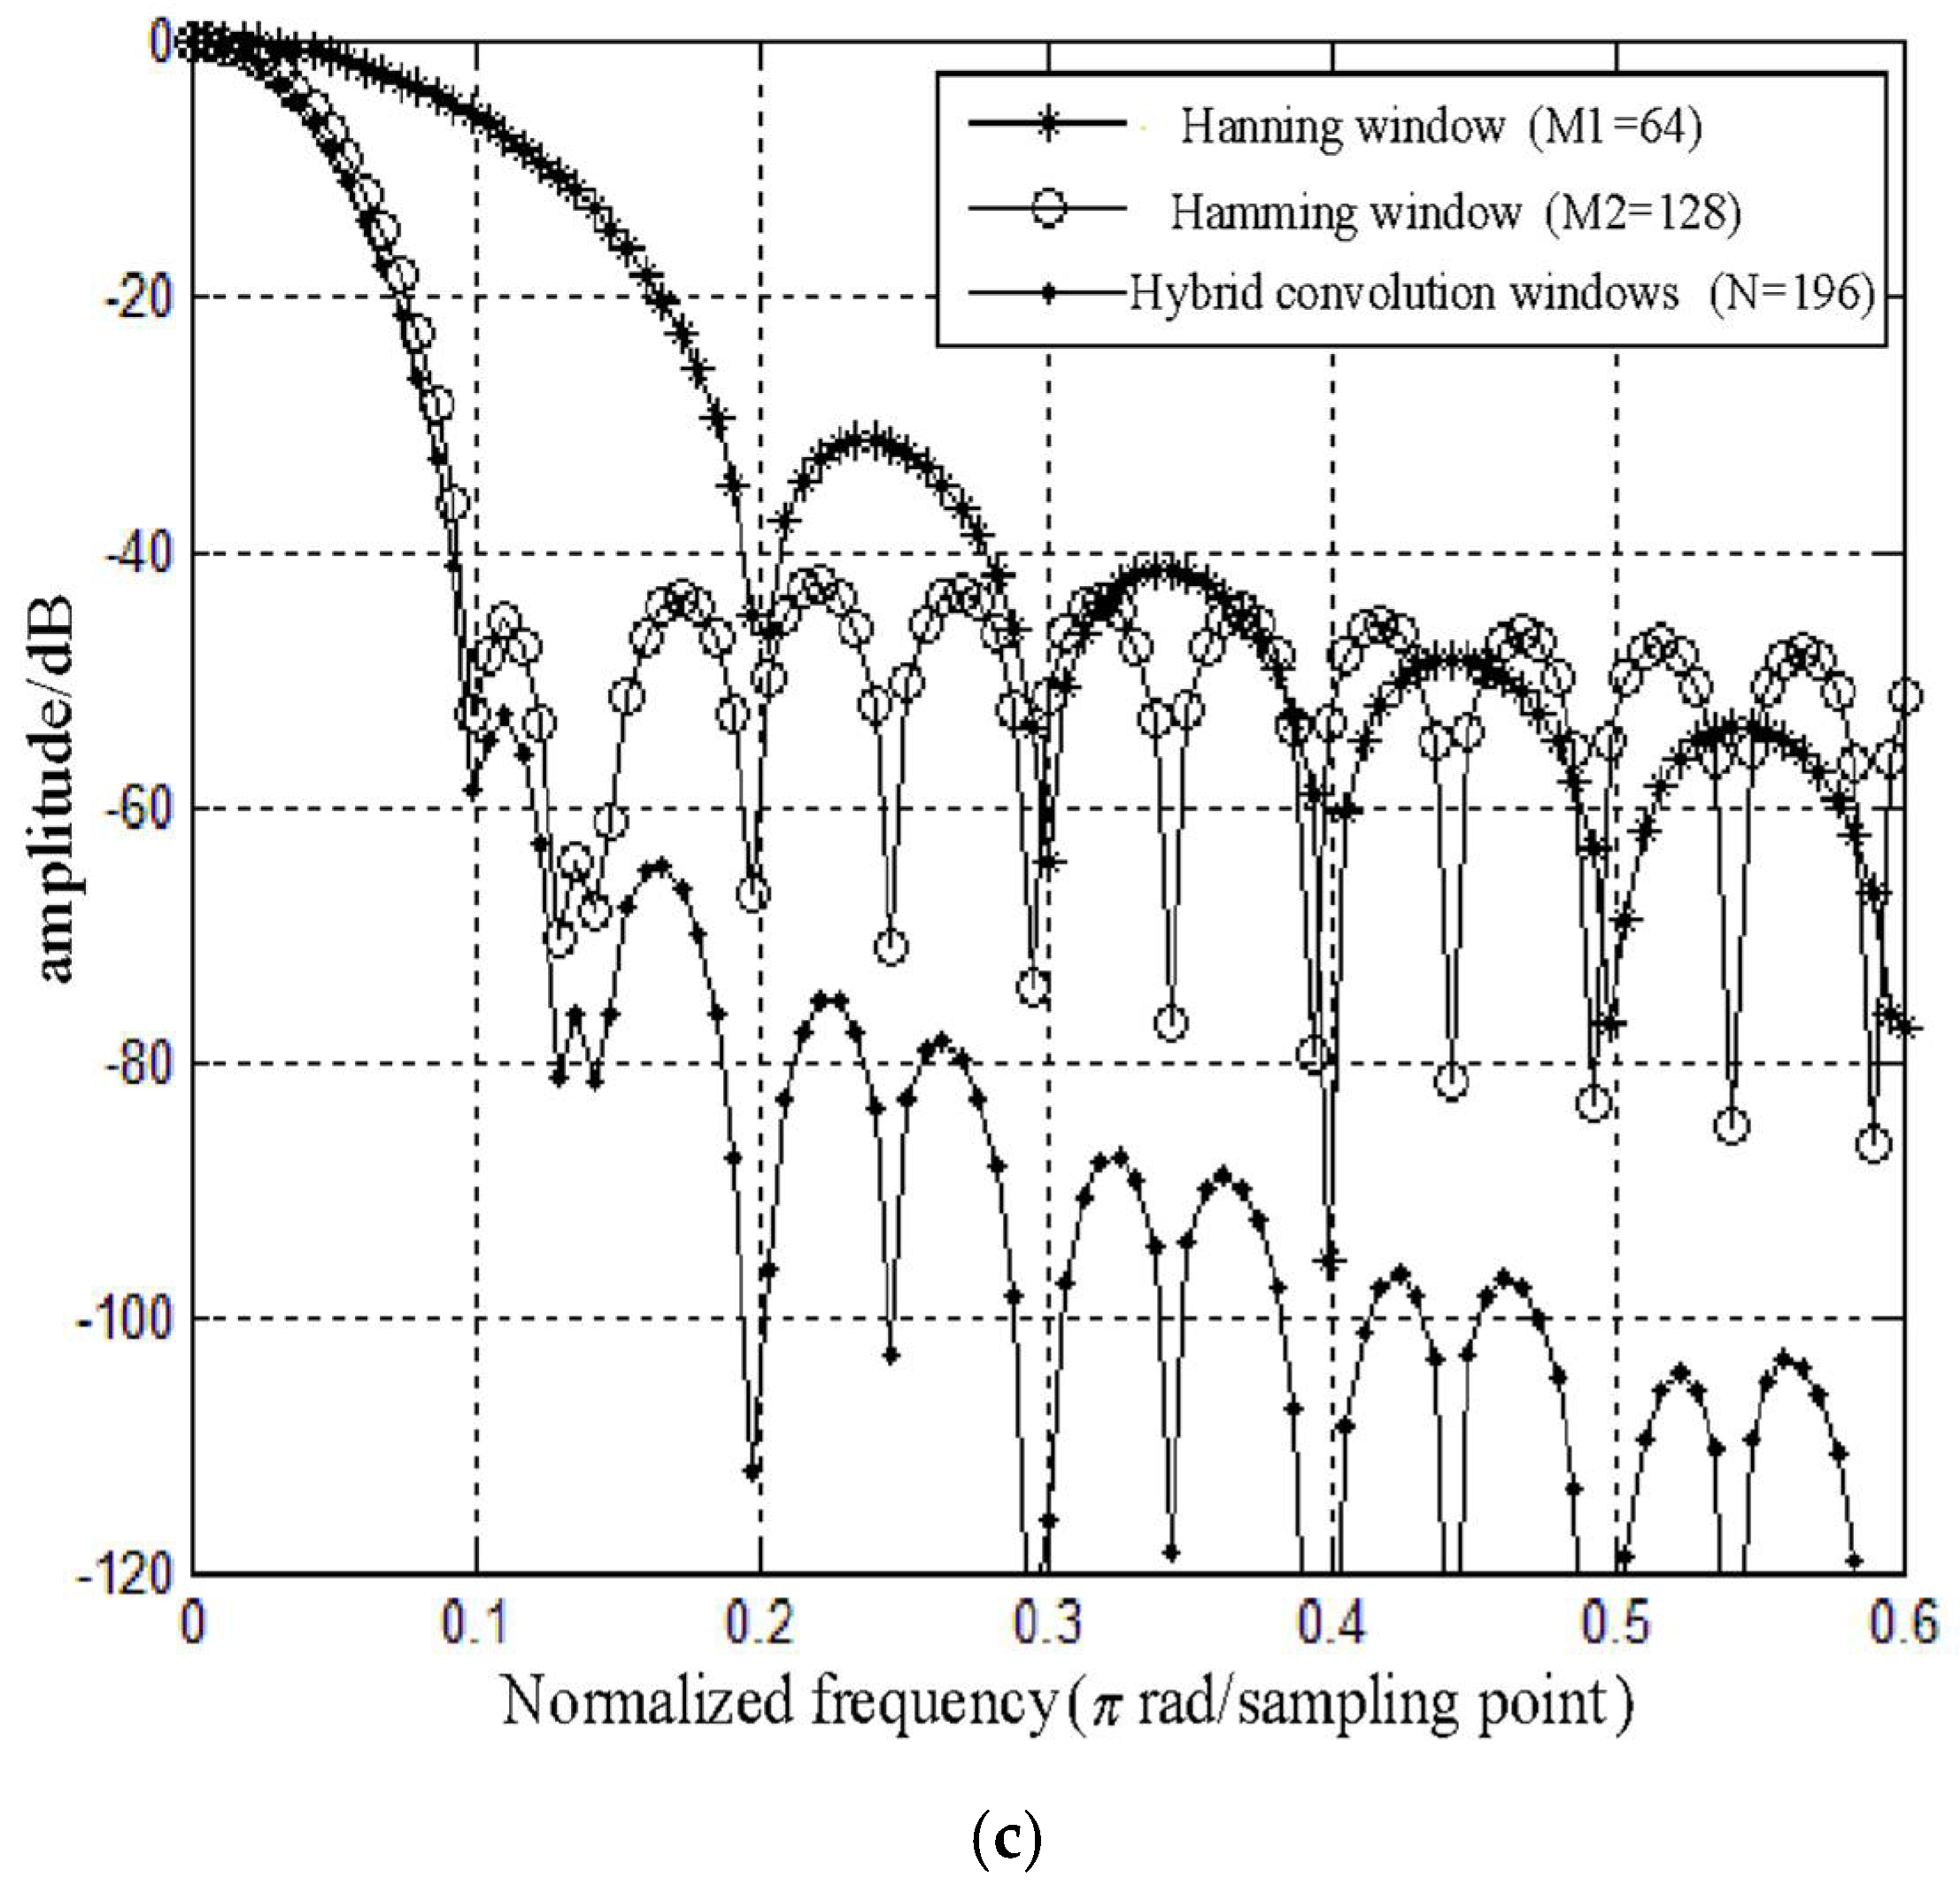
- (3)
- Figure 4c is the amplitude-frequency response diagram of the hybrid convolution window that is calculated by the convolution of a Hanning window (M1 = 64) and a Hamming window (M2 = 128). From the figure we can see that the main lobe width of is the same as that of Hamming window with a value of . The side lobe attenuation rate is approximately 24 dB/oct, and is the sum of the other two window functions (Hanning window is 18 dB/oct and Hamming window is 6 dB/oct). The side lobe peak level is −113 dB when , and is the sum of Hanning window (−48 dB) and Hamming window (−65 dB).
From the results, we can see that the main lobe width of the hybrid convolution window is the same as the narrowest window function in the window function convolution, the side lobe attenuation rate is approximately the sum of the other two window functions, and the side lobe peak level is also the sum of the other two window functions. That means the side lobe of the hybrid convolution window attenuates faster and the side lobe peak is lower. As a result, it can reduce the error caused by the spectrum leakage, and effectively improve the accuracy of data analysis.
4.3. Harmonic Accuracy Test of the Algorithm
To verify the accuracy of the hybrid convolution window algorithm used in the calibration system, the relevant error tests were carried out [21]. The virtual signal generator is used to simulate the output signals, and the base wave signals are added with 3rd, 5th and 7th harmonics. The parameters of the harmonics are shown in Table 1. The output signals are as follows:
The sampling frequency is 6.4 kHz and the sampling number is 1024. By the addition of Hamming window, Hanning window, Blackman window and hybrid convolution window on the output signals, the simulation results are shown in Table 2 and Table 3. Table 2 is the amplitude error of harmonic accuracy, and Table 3 is the phase error of harmonic accuracy. The error of the fundamental, 3rd, 5th, and 7th harmonics are obtained by different window functions. From the tables we can see that the improved FFT algorithm based on the hybrid convolution window can effectively reduce the calculation error of harmonics, and improve the measurement accuracy of the system, compared with the traditional FFT algorithm.
4.4. Frequency Fluctuation Test
The frequency fluctuation test was carried out. The initial phase is set to 0, and the sampling number is 1024. On the basis of Section 4.3, the power frequency is changed from 49.5 to 50.5 Hz. By the addition of Hamming window, Hanning window, Blackman window and hybrid convolution window on the output signals, the errors of the fundamental, 3rd, 5th, and 7th harmonics are obtained by different window functions. The errors are shown in Table 4. The results show that the ratio error is less than 0.011% and the phase error is less than 0.55′ when the frequency ranges from 49.5 to 50.5 Hz and meets the accuracy requirement, by using the hybrid convolution window.
5. System Test
5.1. Basic Accuracy Test
In order to verify the performance of the voltage transformer error calibration system, the accuracy of the system is tested. The accuracy of the system needs to be achieved to 0.05 accuracy class. The results are shown in Figure 5, in comparison with an electromagnetic voltage transformer with an accuracy level of 0.01 and corresponding calibration system. It can be seen that the voltage percentage of the online calibration system is in the range of 20–120%. The variation of the ratio error is less than 0.037%, and the variation of the angle error is less than 0.45%.
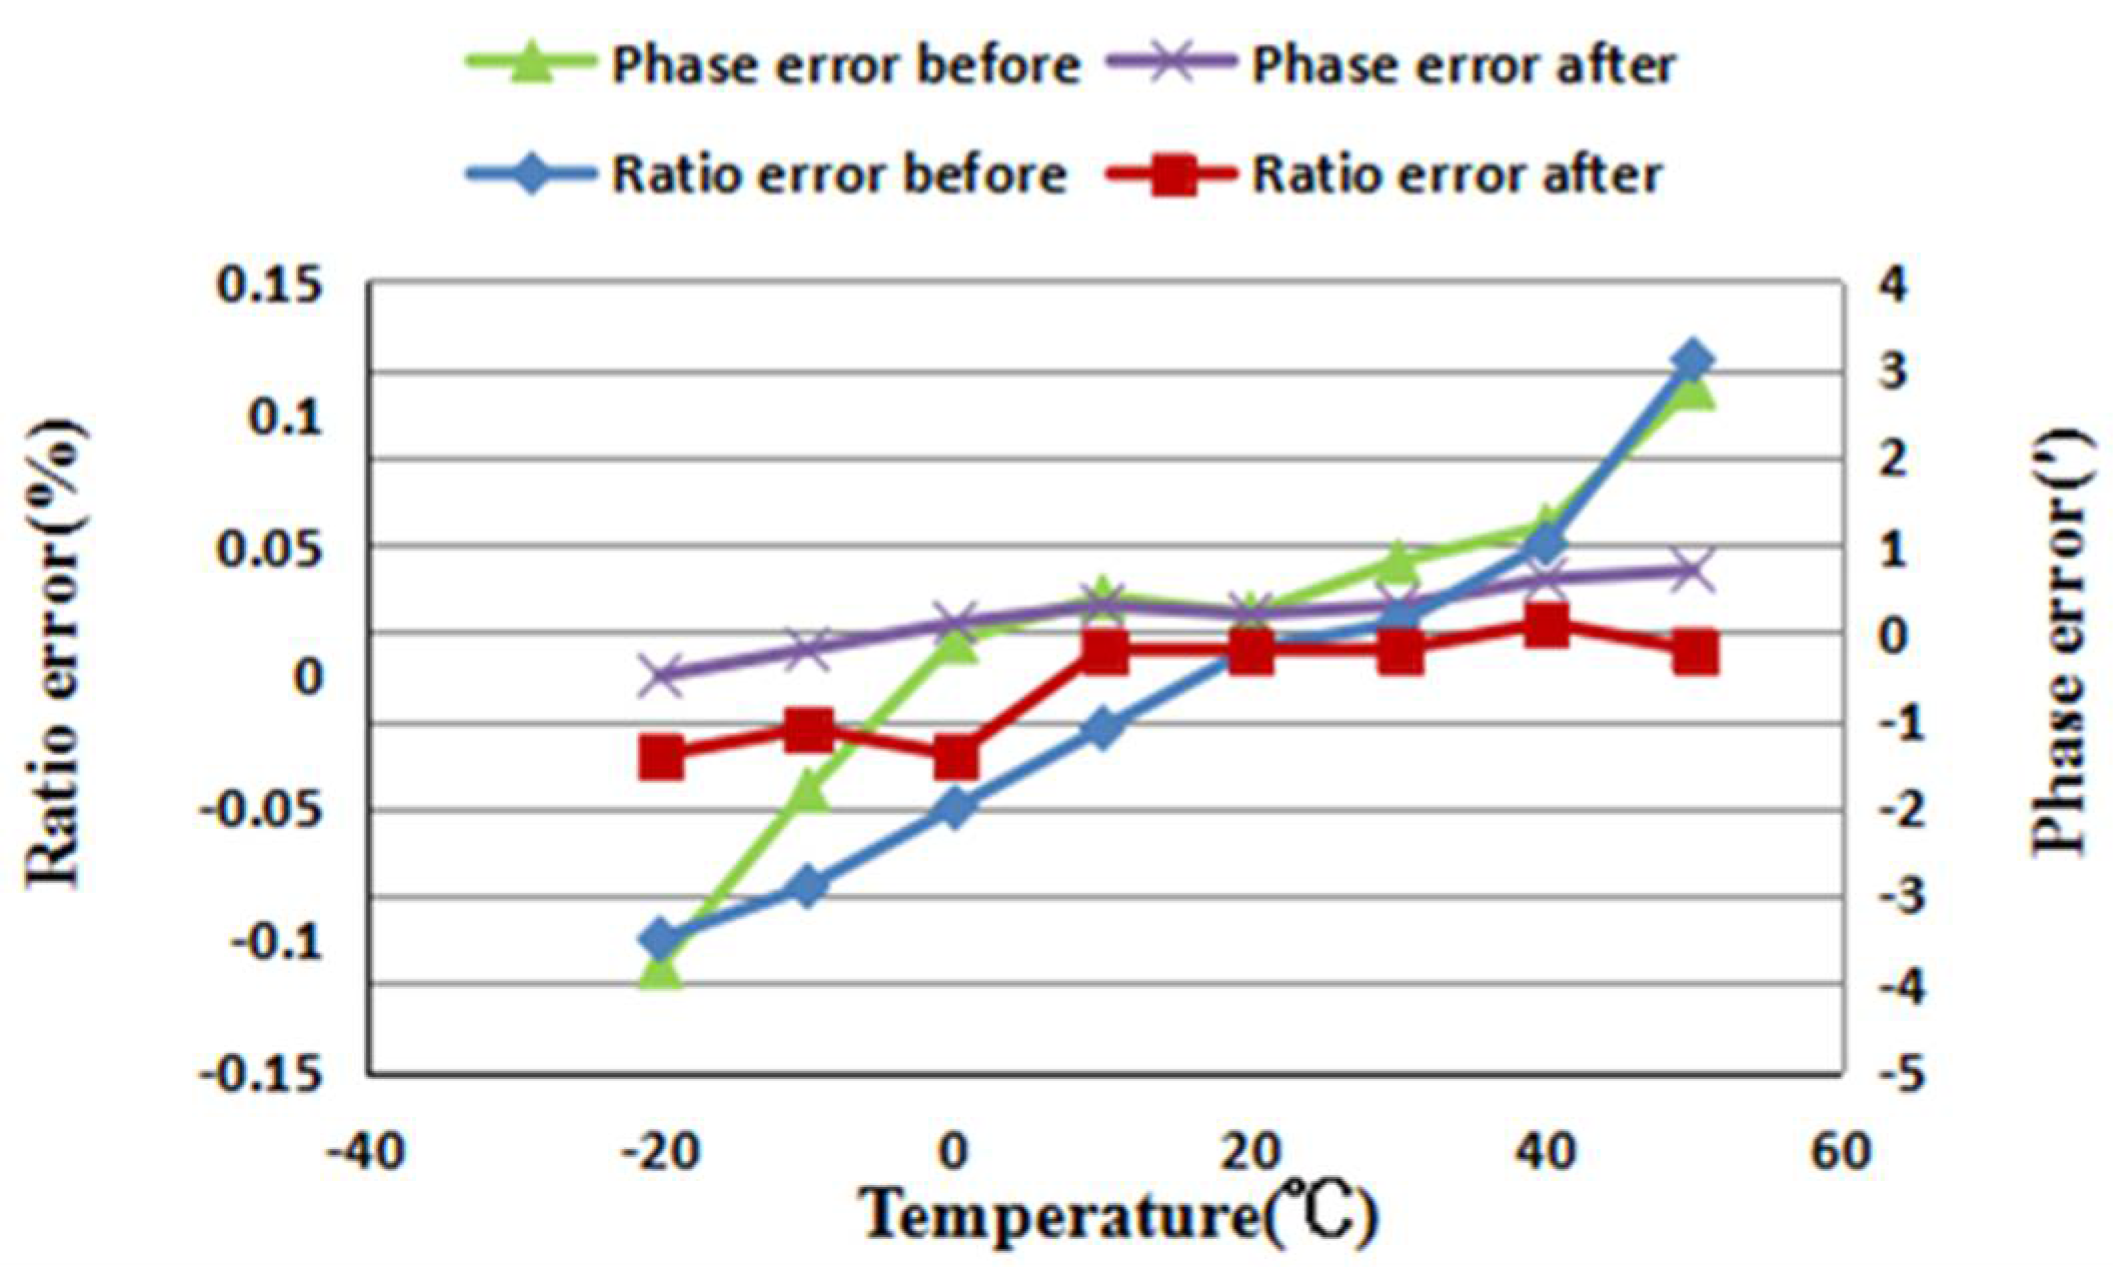
5.2. Test of Temperature Compensation Effect
In order to verify the temperature compensation effect of the error online calibration system, a test affected by temperature on the calibration system is carried out. The results are shown in Figure 6, and show that the error of the online calibration system after temperature compensation is greatly reduced. In the range of −20–50 °C, the variation of the ratio error is less than 0.05% and the variation of the angle error is less than 1.2′.
Because the accuracy of the system needs to be achieved to 0.05 accuracy class, the system needs to be calibrated. The results of Figure 5a,b are obtained by comparison with an electromagnetic voltage transformer with an accuracy level of 0.01 and corresponding calibration system. The data in Figure 6 is carried out in a dedicated temperature control room. The temperature in the room can be changed in accordance with specific requirements.
6. Conclusions
In order to solve the shortcomings of the voltage transformer calibration mode, this paper proposes a voltage transformer error online calibration system based on open–closed capacitors. The calibrated transformer is not required to have power off, or to be exiting from the power line. This method is beneficial for observing the operation state of the transformer, and some problems can be found within the available time. Real-time monitoring and trend forecast of the transformer’s accuracy can be realized during the online operation. The characteristics of the system are as follows:
- (1)
- Two open–closed capacitors and other auxiliary devices are used as a standard voltage sensor, which can calibrate the transformer without power off, effectively reduce the calibration cost, and save on the calibration time.
- (2)
- A high accuracy data processing algorithm based on a hybrid convolution window is used to extract the components of the signal. The improved FFT algorithm based on the hybrid convolution window can effectively reduce the calculation error of harmonics and improve the measurement accuracy of the system.
- (3)
- According to a basic accuracy test, the variation of the ratio error is less than 0.037%, and the variation of the angle error is less than 0.45%. In the range of −20–50 °C, the variation of the ratio error is less than 0.05% and the variation of the angle error is less than 1.2′. The test results show that accuracy of the system can be achieved to 0.05 accuracy class, with high accuracy and convenience of operation.
Author Contributions
Z.L. (Zhenhua Li) provided the main idea for this paper, designed the overall architecture of the proposed system and wrote the paper. Q.L., Z.W. and Z.L. (Zhenxing Li) conducted the test data collection and designed the experiment.
Acknowledgments
This work was supported by National Natural Science Foundation of China (Grant Number 51507091) and China Scholarship Council.
Conflicts of Interest
The authors declare no conflict of interest.
References
- Martínez, J.; Babic, S.; Akyel, C. On Evaluation of Inductance, DC Resistance, and Capacitance of Coaxial Inductors at Low Frequencies. IEEE Trans. Magn. 2014, 50. [Google Scholar] [CrossRef]
- Tajdinian, M.; Allahbakhshi, M.; Seifi, A.R.; Bagheri, A. Analytical discrete Fourier transformer based phasor estimation method for reducing transient impact of capacitor voltage transformer. IEE J. Mag. 2017, 11, 2324–2332. [Google Scholar] [CrossRef]
- Wu, W.; Xu, Y.; Xiao, X.; Hu, H. Research on Proximity Effect in Measuring Error of Active Electronic Voltage Transformers. IEEE Trans. Instrum. 2016, 65, 78–87. [Google Scholar] [CrossRef]
- Xu, Y.; Li, Y.; Xiao, X.; Xu, Z.; Hu, H. Monitoring and analysis of electronic current transformer’s field operating errors. Measurement 2017, 112, 117–124. [Google Scholar] [CrossRef]
- Zhang, Z.; Li, H.; Tang, D.; Hu, C.; Jiao, Y. Monitoring the metering performance of an electronic voltage transformer on-line based on cyber-physics correlation analysis. Meas. Sci. Technol. 2017, 28. [Google Scholar] [CrossRef]
- Pal, A.; Chatterjee, P.; Thorp, J.S.; Centeno, V.A. Online Calibration of Voltage Transformers Using Synchrophasor Measurements. IEEE Trans. Power Deliv. 2016, 31, 370–380. [Google Scholar] [CrossRef]
- Arnaldo, B.; Marco, F.; Roberto, O. A Simple Method for the Calibration of Traditional and Electronic Measurement Current and Voltage Transformers. IEEE Tradit. Trans. Instrum. Meas. 2009, 58, 1345–1353. [Google Scholar]
- Li, Z.; Li, H.; Zhang, Z. An accurate online calibration system based on combined clamp-shape coil for high voltage electronic current transformers. Rev. Sci. Instrum. 2013, 84, 075113. [Google Scholar] [CrossRef] [PubMed]
- Li, Z.; Li, H.; Zhang, Z.; Luo, P. An Online Calibration Method for Electronic Voltage Transformers Based on IEC 61850-9-2. MAPAN 2014, 29, 97–105. [Google Scholar] [CrossRef]
- Li, Z.; Yan, S.; Hu, W.; Li, Z.; Xu, Y. High Accuracy On-Line Calibration System for Current Transformers Based on Clamp-Shape Rogowski Coil and Improved Digital Integrator. MAPAN 2016, 31, 119–127. [Google Scholar] [CrossRef]
- Xiao, Y.; Pan, F.; Sun, W. A method for calibration of electronic voltage transformer. Eng. J. Wuhan Univ. 2014, 47, 350–353. [Google Scholar]
- Li, Z.; Li, H.; Zhang, Z.; Luo, P.; Li, H.; Zhang, W. High-accuracy online calibration system for electronic voltage transformers with digital output. Trans. Inst. Meas. Control 2014, 36, 734–742. [Google Scholar] [CrossRef]
- Wang, L.; Du, Z. Double Air-gap Current Transformer Applied to High Voltage Transmission Line On-site Mobile Comparison System. High Volt. Eng. 2015, 41, 106–114. [Google Scholar]
- Liang, C.; Chen, K.; Tsai, Y.; Chen, N. New Electronic Current Transformer with a Self-Contained Power Supply. IEEE Trans. Power Deliv. 2015, 30, 184–192. [Google Scholar] [CrossRef]
- Liu, K.; Fu, R.; Gao, Y.; Sun, Y.; Yan, P. High-Voltage Repetition-Frequency Charging Power Supply for Pulsed Laser. IEEE Trans. Plasma Sci. 2015, 43, 1387–1392. [Google Scholar] [CrossRef]
- Tian, Y.; Huang, X.; Tian, W.; Wang, X. Analysis of power supply from high-voltage side for electronic Current Transformer. In Proceedings of the International Exhibition and Conference for Power Electronics, Intelligent Motion, Renewable Energy and Energy Management, Shanghai, China, 27–29 June 2017; pp. 1–6. [Google Scholar]
- Zotov, L.G.; Razinkin, V.P.; Atuchin, V.V. Controllable electronic transformer based on the resonance structure with switching capacitor forlow-rise buildings residential area power supply stabilization systems. Int. J. Electr. Power Energy Syst. 2017, 91, 117–120. [Google Scholar] [CrossRef]
- Wen, H.; Zhang, J.; Meng, Z.; Guo, S.; Li, F.; Yang, Y. Harmonic Estimation Using Symmetrical Interpolation FFT Based on Triangular Self-Convolution Window. IEEE Trans. Ind. Inform. 2015, 11, 16–26. [Google Scholar] [CrossRef]
- Dong, H.; Wang, C.; Liu, W. A novel interpolated FFT algorithm based on convolution window. In Proceedings of the 2012 IEEE 14th International Conference on Communication Technology (ICCT), Chengdu, China, 9–11 November 2012; pp. 1139–1142. [Google Scholar]
- Xu, Y.; Liu, Y.; Lu, M. Improved harmonic analysis based on quadruple-spectrum-line interpolation FFT with multiple cosine window. In Proceedings of the 2017 First International Conference on Electronics Instrumentation & Information Systems (EIIS), Harbin, China, 3–5 June 2017. [Google Scholar]
- Princy, R.M.; Bella, A.B. Performance analysis of FFT algorithm. In Proceedings of the 2017 IEEE International Conference on Electrical, Instrumentation and Communication Engineering (ICEICE), Karur, India, 27–28 April 2017; pp. 1–5. [Google Scholar]
Figure 1.
The overall structure of the voltage transformer calibration system.

Figure 2.
Schematic diagram of voltage sensor.

Figure 3.
Simulation results on standard voltage sensor by the air gap size effect.

Figure 4.
Amplitude-frequency response diagrams of several hybrid convolution windows; (a) Amplitude-frequency response diagram of , (b) Amplitude-frequency response diagram of , (c) Amplitude-frequency response diagram of .
Figure 4.
Amplitude-frequency response diagrams of several hybrid convolution windows; (a) Amplitude-frequency response diagram of , (b) Amplitude-frequency response diagram of , (c) Amplitude-frequency response diagram of .


Figure 5.
Basic accuracy test; (a) The variation of the ratio error; (b) the variation of the angle error.
Figure 5.
Basic accuracy test; (a) The variation of the ratio error; (b) the variation of the angle error.
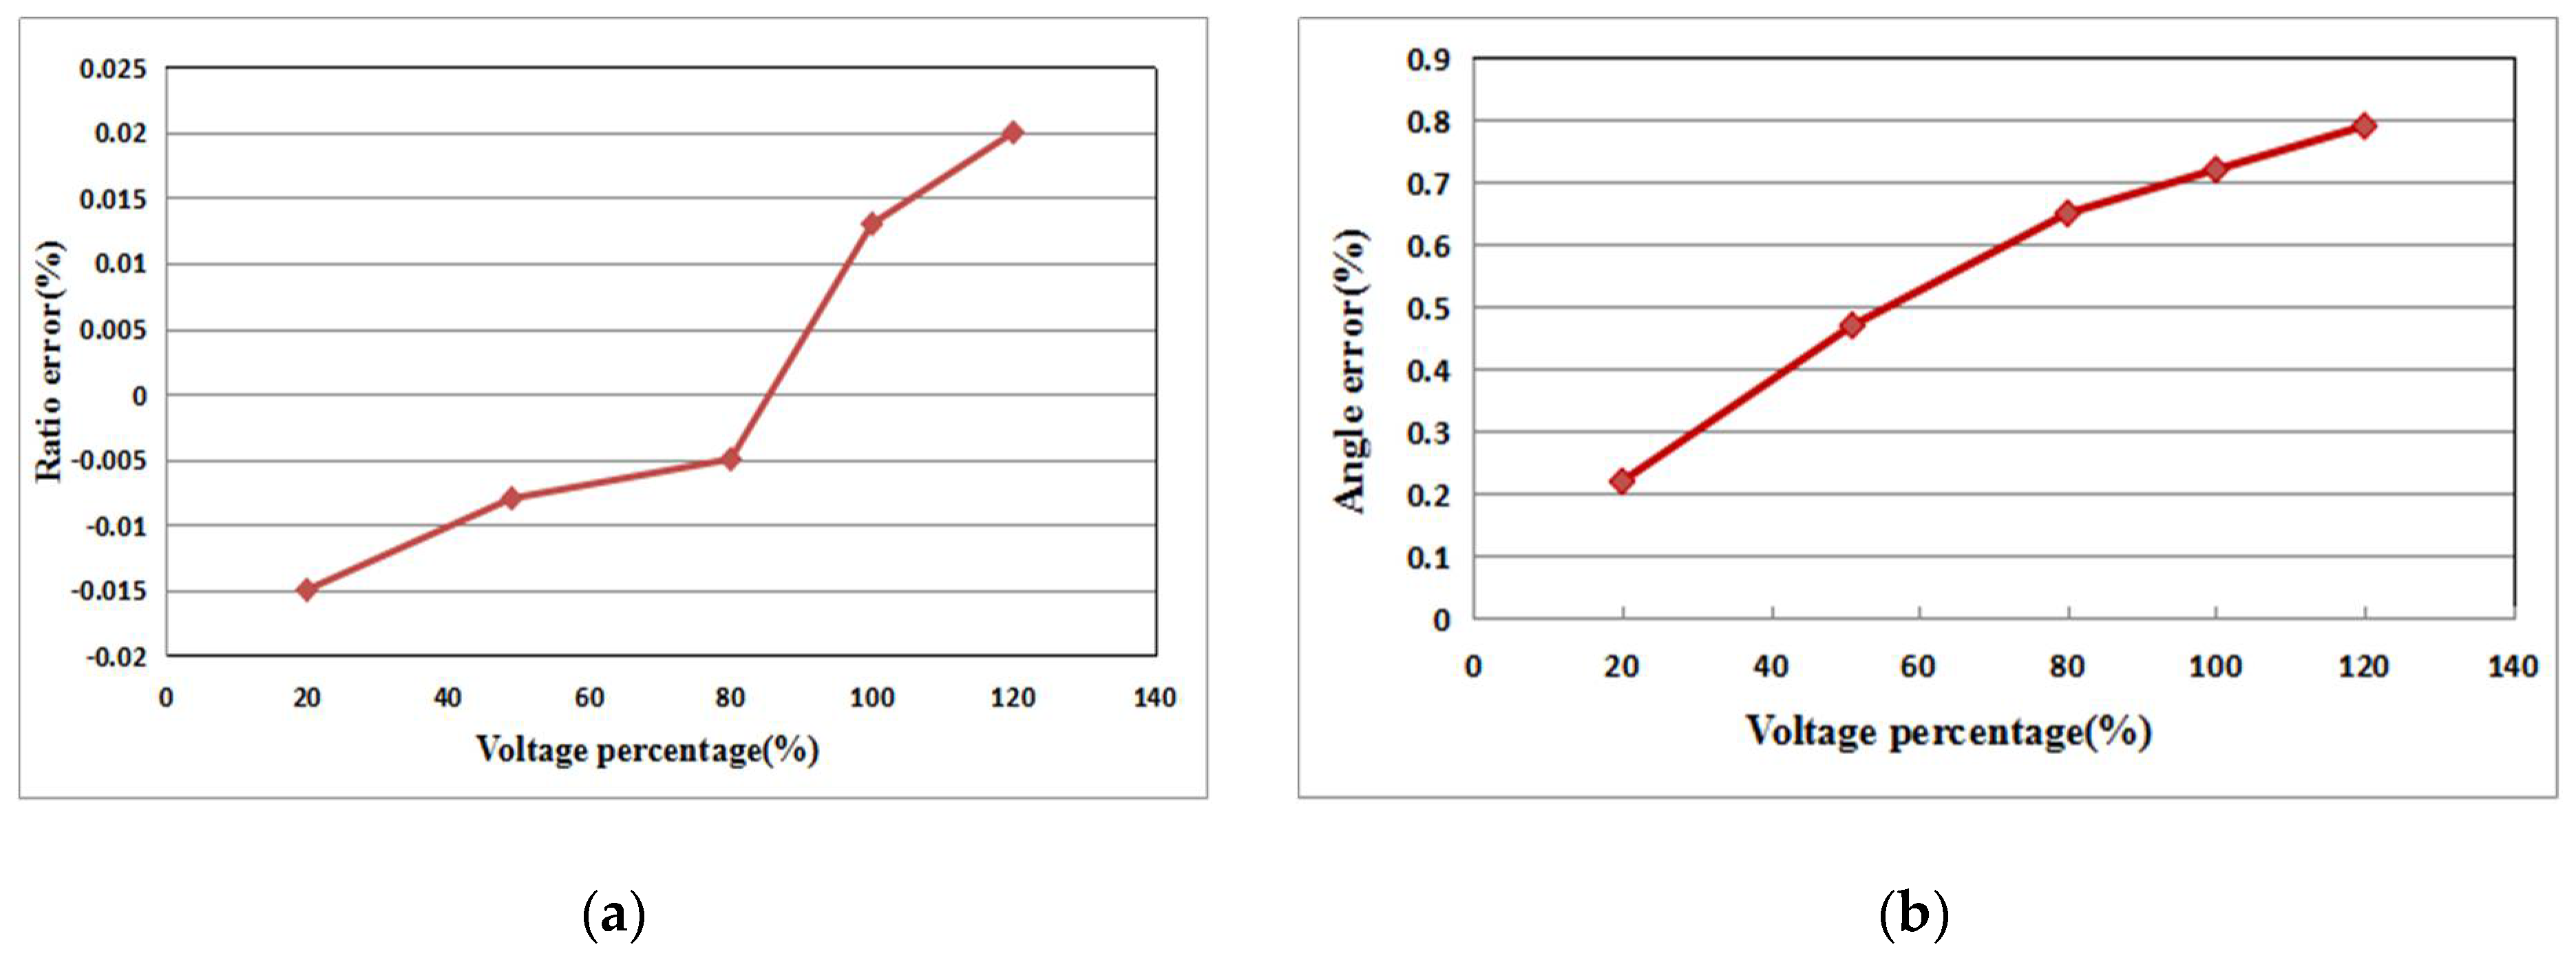
Figure 6.
Test results of temperature compensation.


Table 1.
The parameters of harmonic sources.
| Harmonic Order | 1 | 3 | 5 | 7 |
|---|---|---|---|---|
| Amplitude (V) Phase (°) | 100 | 30 | 20 | 10 |
| 0 | 20 | 130 | 150 |
Table 2.
The amplitude error of harmonic accuracy test.
| Window Functions | A1 (%) | A3 (%) | A5 (%) | A7 (%) |
|---|---|---|---|---|
| Blackman | −1.0 × 10⁻³ | −3.02 × 10⁻⁴ | −2.03 × 10⁻⁴ | −1.0 × 10⁻⁴ |
| Hanning | 1.01 × 10⁻³ | 13.0 × 10⁻⁴ | 2.01 × 10⁻⁴ | 1.05 × 10⁻⁴ |
| Hamming | −8.0 × 10⁻⁴ | −2.10 × 10⁻⁴ | −2.03 × 10⁻⁴ | −7.01 × 10⁻⁵ |
| Hanning–Hamming | −3.13 × 10⁻⁶ | −3.45 × 10⁻⁵ | −7.32 × 10⁻⁵ | −2.17 × 10⁻⁵ |
| Hamming–Blackman | −1.08 × 10⁻⁶ | −1.14 × 10⁻⁵ | −1.92 × 10⁻⁶ | 2.78 × 10⁻⁵ |
Table 3.
The phase error of harmonic accuracy test.
| Window Functions | Φ1 (°) | Φ3 (°) | Φ5 (°) | Φ7 (°) |
|---|---|---|---|---|
| Blackman | 1.99 × 10⁻⁴ | −2.10 × 10⁻⁴ | −2.03 × 10⁻³ | −2.10 × 10⁻³ |
| Hanning | 3.0 × 10⁻⁴ | 4.87 × 10⁻³ | −4.02 × 10⁻³ | −4.21 × 10⁻³ |
| Hamming | 1.42 × 10⁻³ | −1.52 × 10⁻¹ | 4.37 × 10⁻¹ | −1.98 × 10⁻³ |
| Hanning–Hamming | 9.43 × 10⁻⁷ | −3.24 × 10⁻⁶ | −5.57 × 10⁻⁵ | 4.21 × 10⁻⁵ |
| Hamming–Blackman | 1.68 × 10⁻⁵ | −2.23 × 10⁻⁵ | −8.34 × 10⁻⁶ | 5.68 × 10⁻⁵ |
Table 4.
The phase error of harmonic accuracy test.
| Window Functions | A49.5 (%) | A49.7 (%) | A50 (%) | A50.2 (%) | A50.2 (%) |
| Hanning–Hamming | −0.0094 | −2.10 × 10⁻⁴ | −2.03 × 10⁻³ | −2.10 × 10⁻³ | −2.10 × 10⁻³ |
| Hamming–Blackman | −0.0112 | 4.87 × 10⁻³ | −4.02 × 10⁻³ | −4.21 × 10⁻³ | −4.21 × 10⁻³ |
| Window Functions | Φ49.5 (′) | Φ49.7 (′) | Φ50 (′) | Φ50.2 (′) | Φ50.5 (′) |
| Hanning–Hamming | −0.511 | −0.452 | 0 | −0.405 | −0.425 |
| Hamming–Blackman | −0.504 | −0.487 | 0 | −0.401 | −0.498 |
© 2018 by the authors. Licensee MDPI, Basel, Switzerland. This article is an open access article distributed under the terms and conditions of the Creative Commons Attribution (CC BY) license (http://creativecommons.org/licenses/by/4.0/).
Share and Cite
MDPI and ACS Style
Li, Z.; Li, Q.; Wu, Z.; Li, Z. Research into an Online Calibration System for the Errors of Voltage Transformers Based on Open–Closed Capacitor. Energies 2018, 11, 1455. https://doi.org/10.3390/en11061455
AMA Style
Li Z, Li Q, Wu Z, Li Z. Research into an Online Calibration System for the Errors of Voltage Transformers Based on Open–Closed Capacitor. Energies. 2018; 11(6):1455. https://doi.org/10.3390/en11061455
Chicago/Turabian StyleLi, Zhenhua, Qiuhui Li, Zhengtian Wu, and Zhenxing Li. 2018. "Research into an Online Calibration System for the Errors of Voltage Transformers Based on Open–Closed Capacitor" Energies 11, no. 6: 1455. https://doi.org/10.3390/en11061455
Note that from the first issue of 2016, this journal uses article numbers instead of page numbers. See further details here.