Article

Analysis of Integration of MEA-Based CO2 Capture and Solar Energy System for Coal-Based Power Plants Based on Thermo-Economic Structural Theory

1
School of Energy Power and Mechanical Engineering, North China Electric Power University, Beijing 102206, China
2
CSIRO Energy, 10 Murray Dwyer Circuit, Mayfield West, NSW 2304, Australia
*
Author to whom correspondence should be addressed.
Energies 2018, 11(5), 1284; https://doi.org/10.3390/en11051284
Submission received: 21 March 2018 / Revised: 9 May 2018 / Accepted: 10 May 2018 / Published: 17 May 2018

Abstract

:
Installing CO2 capture plants in coal-fired power stations will reduce greenhouse gas emissions and help mitigate climate change. However, the deployment of this technology faces many obstacles—in particular, high energy consumption. Aiming to address this challenge, we investigated the integration of a solar energy system in a 1000 MW coal-fired power plant equipped with monoethanolamine (MEA)-based CO2 capture (termed PG-CC) by comparing the thermo-economic performance of two integrated systems with that of PG-CC. In the first system, solar-aided coal-fired power generation equipped with MEA-based CO2 capture (SA-PG-CC), solar thermal was used to heat the high-pressure feed water in the power plant, while the reboiler duty of the capture plant’s stripper was provided by extracted low-pressure steam from the power plant. The second system integrated the power plant with solar-aided MEA-based CO2 capture (SA-CC-PG), using solar thermal to heat the stripper’s reboiler. Both systems were simulated in EBSILON Professional and Aspen Plus and analysed using thermo-economics theory. We then evaluated each system’s thermodynamic and economic performance in terms of power generation and CO2 capture. Compared with PG-CC, the thermo-economic cost of electricity increased by 12.71% in SA-PG-CC and decreased by 9.77% in SA-CC-PG. The unit thermo-economic cost of CO2 was similar in both the PG-CC and SA-PG-CC systems, but significantly greater in SA-CC-PG. Overall, SA-PG-CC produced less power but used energy more effectively than SA-CC-PG. From a thermo-economic point of view, SA-PG-CC is therefore a better choice than SA-CC-PG.

1. Introduction

Human society and the ecological environment are facing enormous challenges due to the significant increase in greenhouse gas emissions and consequent climate change [1,2]. Thermal power-plant emissions make up more than 40% of global CO2 emissions, 70% of which are produced by coal-fired power plants [3]. Installing CO2 capture and storage in thermal power plants—especially coal-fired power plants—is therefore one of the most direct and effective measures to reduce CO2 emissions and help mitigate global warming [4].
Post-combustion carbon capture is the most feasible end-of-pipe technology for the large fleet of existing coal-fired power stations. Chemical absorption-based capture has been commercially realised in some coal-fired power stations, including the Boundary Dam and WA Parish power plants [5,6]. The basic principal of the technique is to absorb CO2 through chemical reaction with absorbents at low temperatures in the absorber, and then regenerate CO2 at high temperatures in the stripper [7,8]. Monoethanolamine (MEA)-based CO2 capture is the most-studied system. It has a relatively high CO2 loading capacity and a high absorption rate [9], but these advantages are outweighed by the high energy requirement for MEA regeneration [10,11].
Efforts to reduce the energy penalty on the power generation with post-combustion carbon capture generally fall into three main categories: (i) improvements to the CO2 capture process through use of better solvents, improved solvent formulations and process intensification [12,13,14,15,16,17,18,19,20,21,22,23,24,25,26,27], (ii) energy recovery during CO2 integration with power plants [28,29,30,31,32,33,34,35,36,37], and (iii) integration with renewable energy sources, such as solar energy system [23,24,25,26,27].
Within the first category, efforts have been mainly focused on development of better solvents and capture process improvement, intensification and optimisation. Currently, more than 10 companies/organisations can provide near-term solvent-based capture technologies for CO2 capture in coal-fired power stations, and these technology suppliers include Shell Cansolv, MHI, Fluor, BASF, Siemens, and University of Texas at Austin [12]. The improved solvents are mainly based on chemicals that possess amino functional groups, such as aqueous ammonia, amino acid salts and amines. For example, MHI developed the KS-1 solvent, which is based on sterically hindered amine solvent, and the company claimed that the solvent regeneration energy is 68% that of the MEA-based process and solvent loss and degradation are 10% of MEA [13]. The technology has recently been applied in a commercial project—Petra Nova Carbon Capture Project at W.A. Parish Power Plant in USA—to capture 1.4 million tonnes of CO2 per annum [14]. It has also been found that an MEA concentration of 40 wt % has a lower energy demand than 30 wt % [15]. Apart from the solvent development, process improvement, intensification and optimisation can also improve the capture performance. Even for the MEA-based process, the minimum regeneration energy in the MEA process could fall to 3.1 MJ/kg CO2 through combined parameter optimisation and process modification [16]. Simplification of vapour compression configuration can decrease energy consumption from 3.26 to 2.90 MJ/kg CO2 [17]. Pilot plant trials at University of Texas at Austin have shown that with an advanced flash stripper, the capture process based on 5 m piperazine (mole/kg water) can achieve regeneration energies of 2.1–2.5 GJ/tonne CO2 [18]. The process simulation showed that an advanced aqueous ammonia-based process that incorporates the combined flash stripping and a cold rich split can achieve a very competitive regeneration duty of 1.86 MJ/kg CO2 at an optimised stripper pressure of 12 bar and an NH3 concentration of 10.2 wt % [19]. In addition to the further development of near-term technologies, intensive research work has been carried out to develop novel solvents, including ionic liquids [20], enzyme catalysed solvents [21], and phase change solvents [22]. These novel solvents are still in the early stages of development. The location of steam extraction also effects the efficiency penalty. Extraction from the cross-over pipe between the IP and LP turbines and that from within the LP steam turbine can both reduce the efficiency penalty incurred by CO2 capture [23]. Other process configurations that can decrease the energy penalty have been reviewed, including: a stripper operating with moderate vacuum pressure (around 0.75 bar), the staged feed of the stripper, multi-pressure stripping, lean solvent vapour compression, absorber intercooling, condensate heating, condensate evaporation, stripper overhead compression, lean amine flash, split-amine flow, rich split, multi-component columns, inter-stage temperature control, vapour recompression, and matrix stripping [24,25,26,27].
In the category of energy recovery, there are three approaches to recovery of waste energy: (a) heat recovery or heat integration within the power plant to improve efficiency; (b) waste heat recovery from the CO2 capture process to use in the power plant and improve efficiency; (c) heat recovery from the power plant to use in the CO2 capture process, reducing the energy penalty [28]. Harkin (2009) reviewed the consideration of heat integration in CO2 capture coal-fired power stations and the integration of the brown coal dewatering processes into a power plant with CCS. The study showed a reduced energy penalty in the heat integration power plant and a higher energy-saving potential by pre-drying of the coal [29,30]. Xu et al. (2014) adopted three measures to recover the surplus energy from the CO2 capture process: (1) using a portion of low-pressure steam instead of high-pressure extracted steam by installing a steam ejector, (2) mixing a portion of flash-off water with the extracted steam to utilize the surplus heat of the extracted steam, and (3) recycling the low-temperature waste heat from the CO2 capture process to heat the condensed water [31]. After the heat recovery, the efficiency penalty of CO2 capture in the new integrated system decreased by 4.91 percentage points compared to the reference case [31]. The research also found that the high-stage steam substitute scheme for flue gas heat recovery saved more energy than the low-stage steam substitute scheme [32]. For the de-carbonization of natural gas combined cycle (NGCC) power plants, four measures are adopted: (1) recycling part of exhausted gas from the gas turbine to increase the CO2 concentration in flue gas, (2) mixing a portion of condensate water from the reboiler with the extracted steam to utilize the excess heat of the extracted steam, (3) compressing the CO2 stream at the top of stripper to recover the latent heat for sorbent regeneration, and (4) introducing a transcritical CO2 cycle to utilize the sensible heat in flue gas to generate electricity. The techno-economic evaluation indicated that the cost of electricity and the cost of CO2 avoided decreased by 8.66% and 27.46%, respectively [33]. Oexmann et al. (2010) integrated waste heat from the desorber overhead condenser of the CO2 capture unit and from the CO2 compressor into the water-steam-cycle of the power plant, offering an optimisation option [34]. Liu et al. (2012) investigated different integration cases between the power station and the capture plant according to different positions of steam extraction from the power plant [35]. They found that optimising the heat integration between the steam cycle and the capture process can significantly improve the overall energy efficiency of the power plant, with the efficiency penalty of the best integration case decreasing to 9.75% from the reference case of 12.3%. Wang et al. (2015) proposed extracting a portion of the water vapor and its latent heat from flue gases using a nanoporous ceramic membrane capillary condensation separation mechanism [36]. The waste heat from the power plant boiler system of a pulverised fuel power plant can also be recovered to provide up to 100% of the heat required for solvent regeneration, significantly reducing the efficiency penalty of CO2 capture process [37].
Integration of renewable energy and CO2 capture power plant can achieve lower energy penalty than other integration approaches (categories 1 and 2). In comparison to other renewables, such as wind power and photovoltaics, solar thermal with heat storage can provide steady energy under variable environmental conditions. In terms of technical feasibility, two promising options are the solar-assisted high-pressure feedwater heating and solar-assisted reboiler heating. Therefore, the integration of solar energy is chosen as a strategy to improve performance. Mokhtar et al. (2012) proposed and theoretically evaluated a system for reducing the power plant output reduction by providing part of the PCC energy input using solar-thermal energy. Fresnel concentrators were considered in the study, which showed that the output power penalty was reduced, and that the proposed technology was feasible from the perspectives of thermal efficiency and economy [38]. Zhao et al. (2012) integrated a parabolic-trough solar thermal system with an MEA-based CO2 capture process in a 600-MW coal-fired power plant [39]. The capture subsystem was modelled and simulated in Aspen Plus software, with the hybrid system having potentially less output power penalty and lower cost. Zhai et al. (2017) proposed three different configurations for integrating a 1000 MW coal-fired power plant with solar energy system and a post-combustion CO2 capture system [40]. The main difference between the three systems was that the solar thermal was used to replace the first extraction to heat the feed water, or to provide the MEA regeneration heat demand. The best option proved to be using solar thermal to replace the first high-pressure extraction and using part of the intermediate-pressure cylinder exhaust to provide the reboiler heat demand. Wang et al. (2017) performed a life cycle analysis of a 300 MW solar-assisted post-combustion CO2 capture processes [41]. Three cases were analysed: base case integrated with CO2 capture process; base case integrated with CO2 capture and solar-assisted reboiler heating process; and base case extended to CO2 capture and solar-assisted repowering process. This showed that the solar-assisted repowering scheme has better performance with regard to cost, with superior life cycle, greenhouse gas reduction rate, and life cycle cost of energy removed. Wang et al. (2017) developed a pilot test system with solar-assisted post-combustion carbon capture to study the system performance [42]. Parabolic trough and linear Fresnel reflector solar thermal collector systems were tested. Results showed that solar collectors can provide the required thermal energy for the reboiler, and the integration system was demonstrated to be technically feasible.
For these three categories, integrating solar-aided CO2 capture offers a method of providing the energy requirements of the CO2 capture process using external and near-zero emission energy [42]. In most studies, the CO2 capture system was researched from the perspectives of energy and efficiency performance. The CO2 capture system was evaluated with respect to its energy aspects [43], techno-economic aspects [44,45,46] and environment effects aspects [47]. System integration of solar thermal and power generation with CO2 capture is complex and worth further study, especially regarding the combination of exergy performance and economic performance, which can be used to evaluate the exergy and thermo-economic cost of each stream and identify improvement.
Thermo-economic structural theory, which is based on the second law of thermodynamics, is a powerful tool for exergy analysis, thermo-economic study and performance evaluation of an energy system [48]. The thermo-economic structural theory method has great advantages in the analysis of complex energy systems, having a broad application field, which includes system optimisation and troubleshooting, and is easy to combine with other methods. In the thermo-economic structural theory method. The thermodynamic performance and economic performance of the system are correlated in order to be studied, rather than being researched separately. Moreover, the exergy cost and thermo-economic cost of each flow can be obtained. In a previous study, we improved the analysis method for condensers to make thermo-economic analyses more comprehensive, and compared solar-aided coal-fired power plants in two modes (fuel saving and power boosting) [48]. This study proved that the improved thermo-economic analysis can be used to evaluate complex energy systems.
In the current study, we extend our previous work to investigate the integration of solar energy systems with a 1000 MW power plant and an MEA-based CO2 capture in two configurations. The first is the integration of solar-aided coal-fired power generation with MEA-based CO2 capture, termed SA-PG-CC. In this configuration, high-pressure extraction steam from the turbine is replaced by solar thermal to heat the feed water, while the low-pressure extraction steam is used to heat the stripper reboiler. The second configuration involves the integration of solar energy system with MEA-based CO2 capture in coal-fired power generation (SA-CC-PG), in which solar thermal replaces the low-pressure extraction steam to heat the stripper reboiler. The two configurations are compared with the baseline coal-fired power generation with MEA-based CO2 capture, termed PG-CC, in which the low-pressure extraction steam is used to heat the stripper reboiler without the introduction of solar thermal. To mitigate the efficiency penalty caused by carbon capture, SA-PG-CC and SA-CC-PG are two different ways of using solar thermal energy in power plants with CO2 capture. The aim of this study is to assess the thermo-economic performance of these two configurations and to identify further system improvements from a thermo-economic point of view.

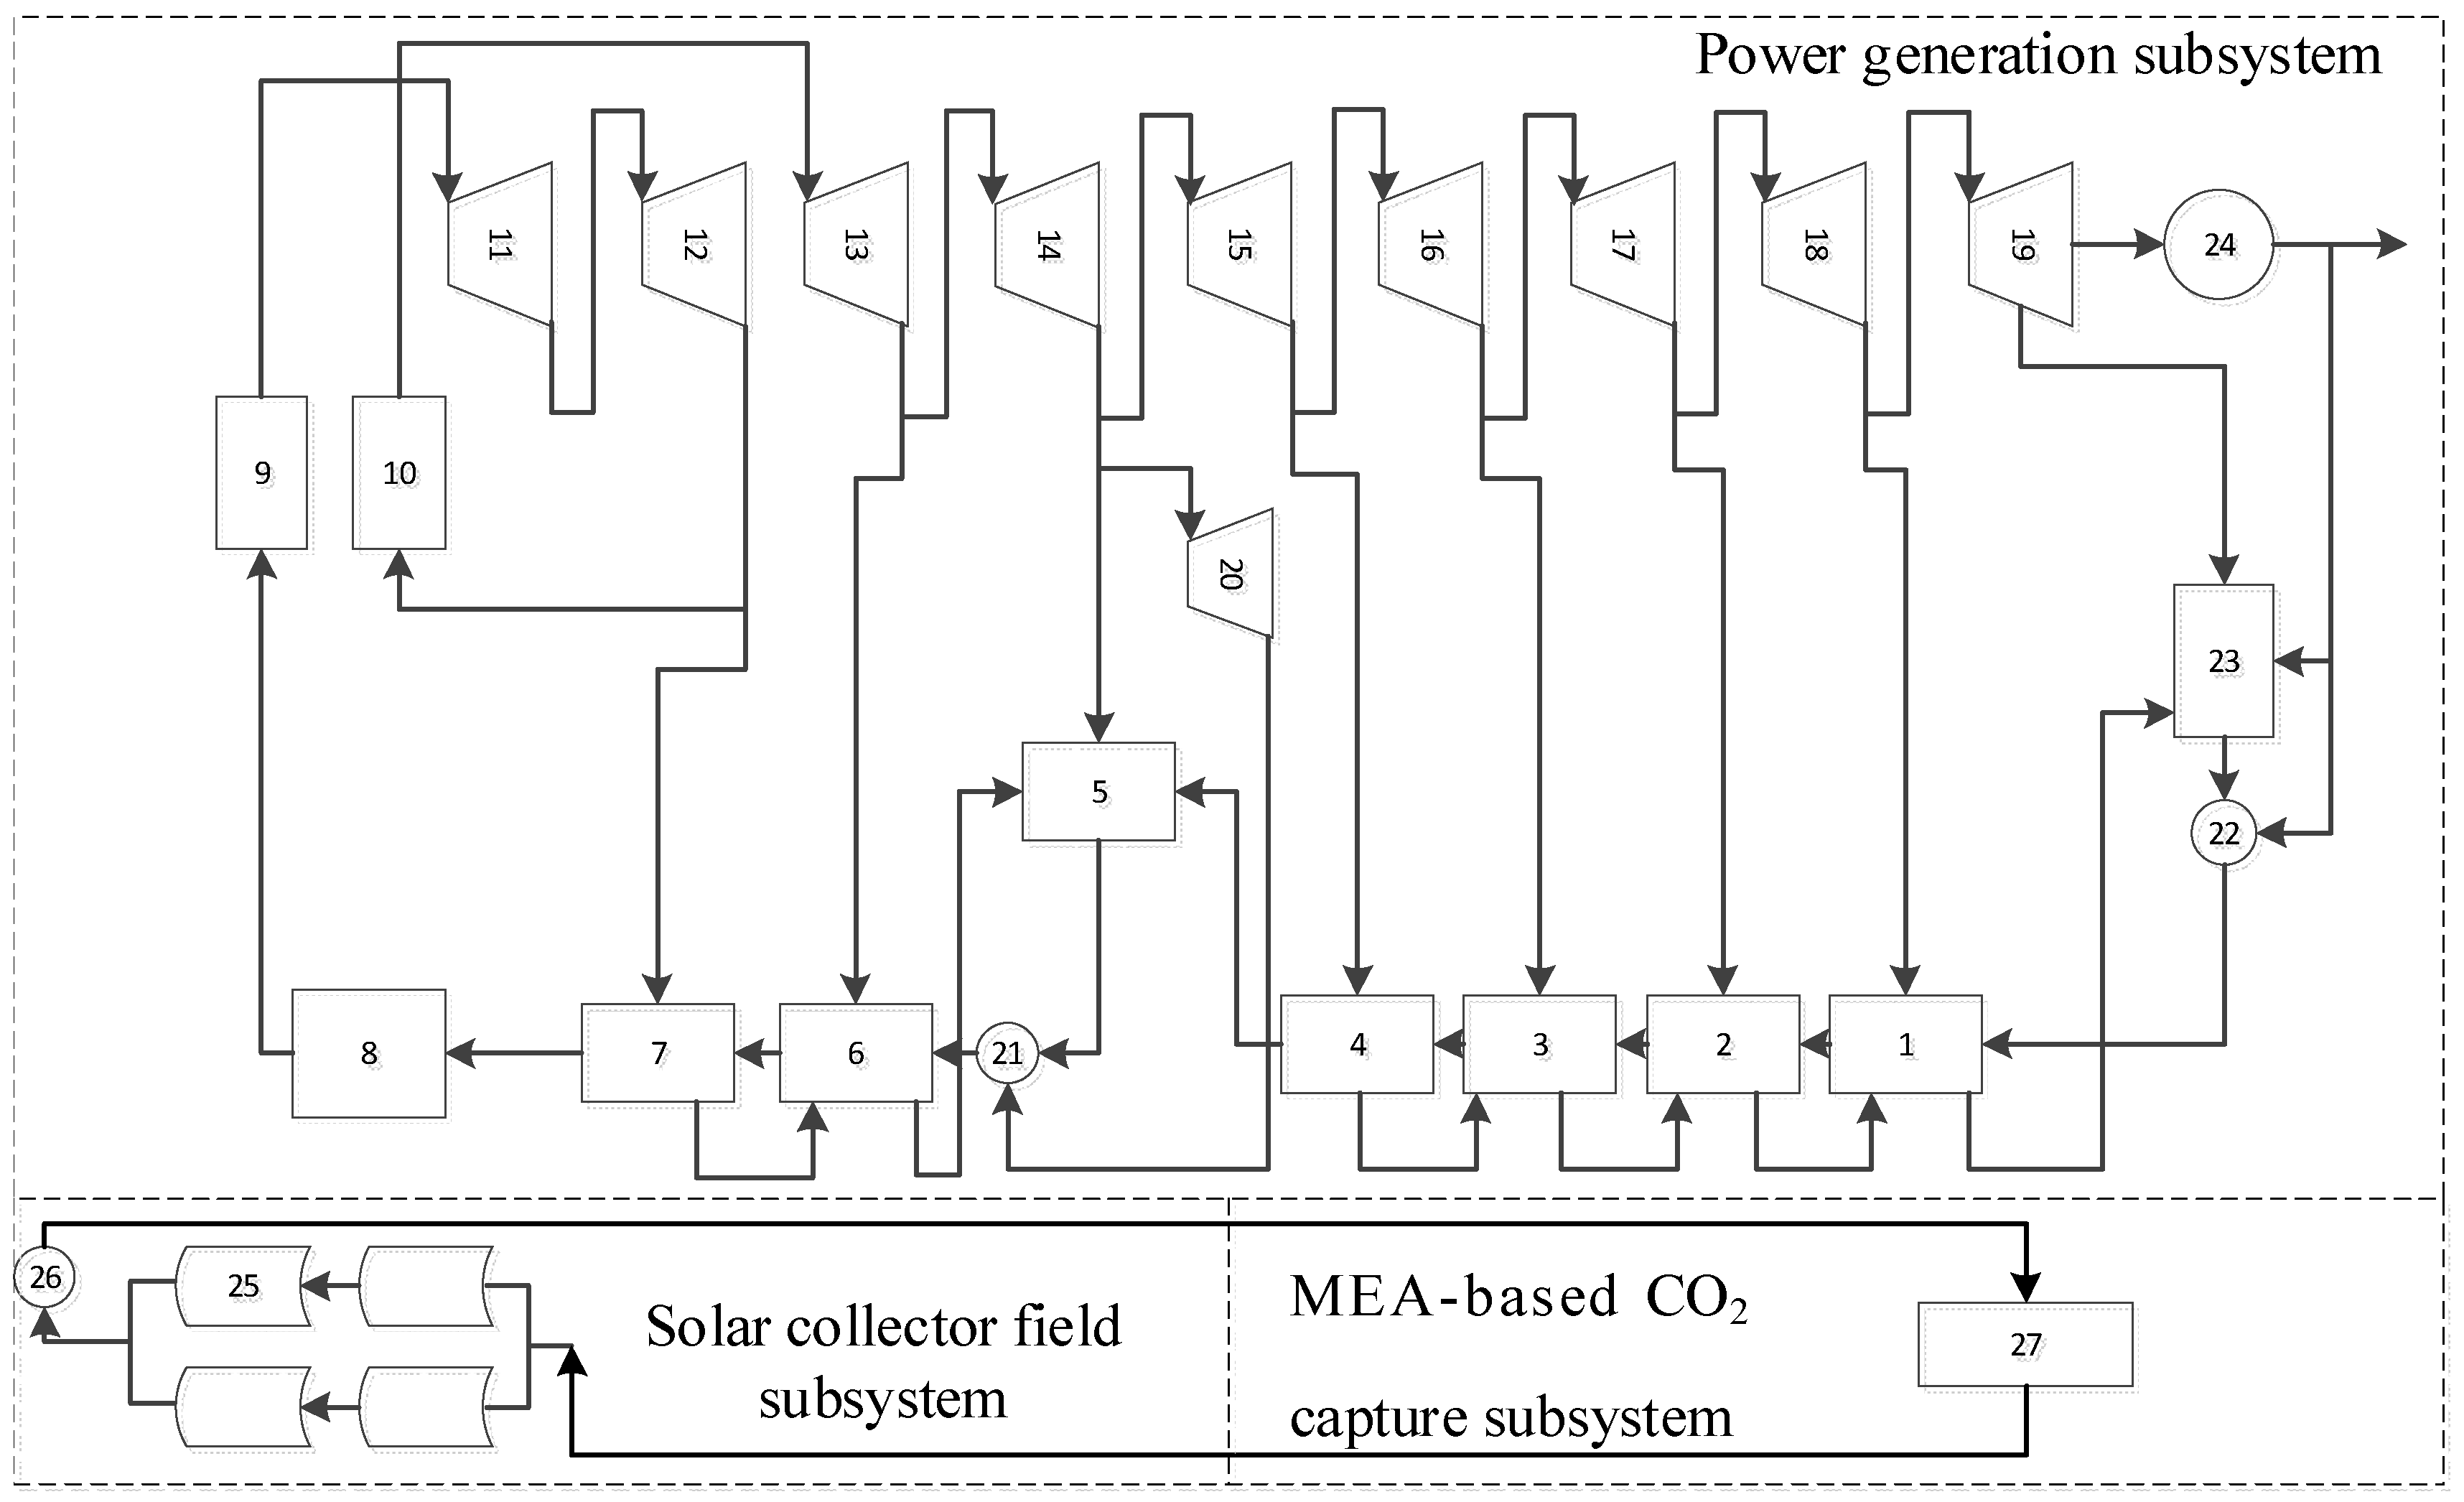
2. System Description

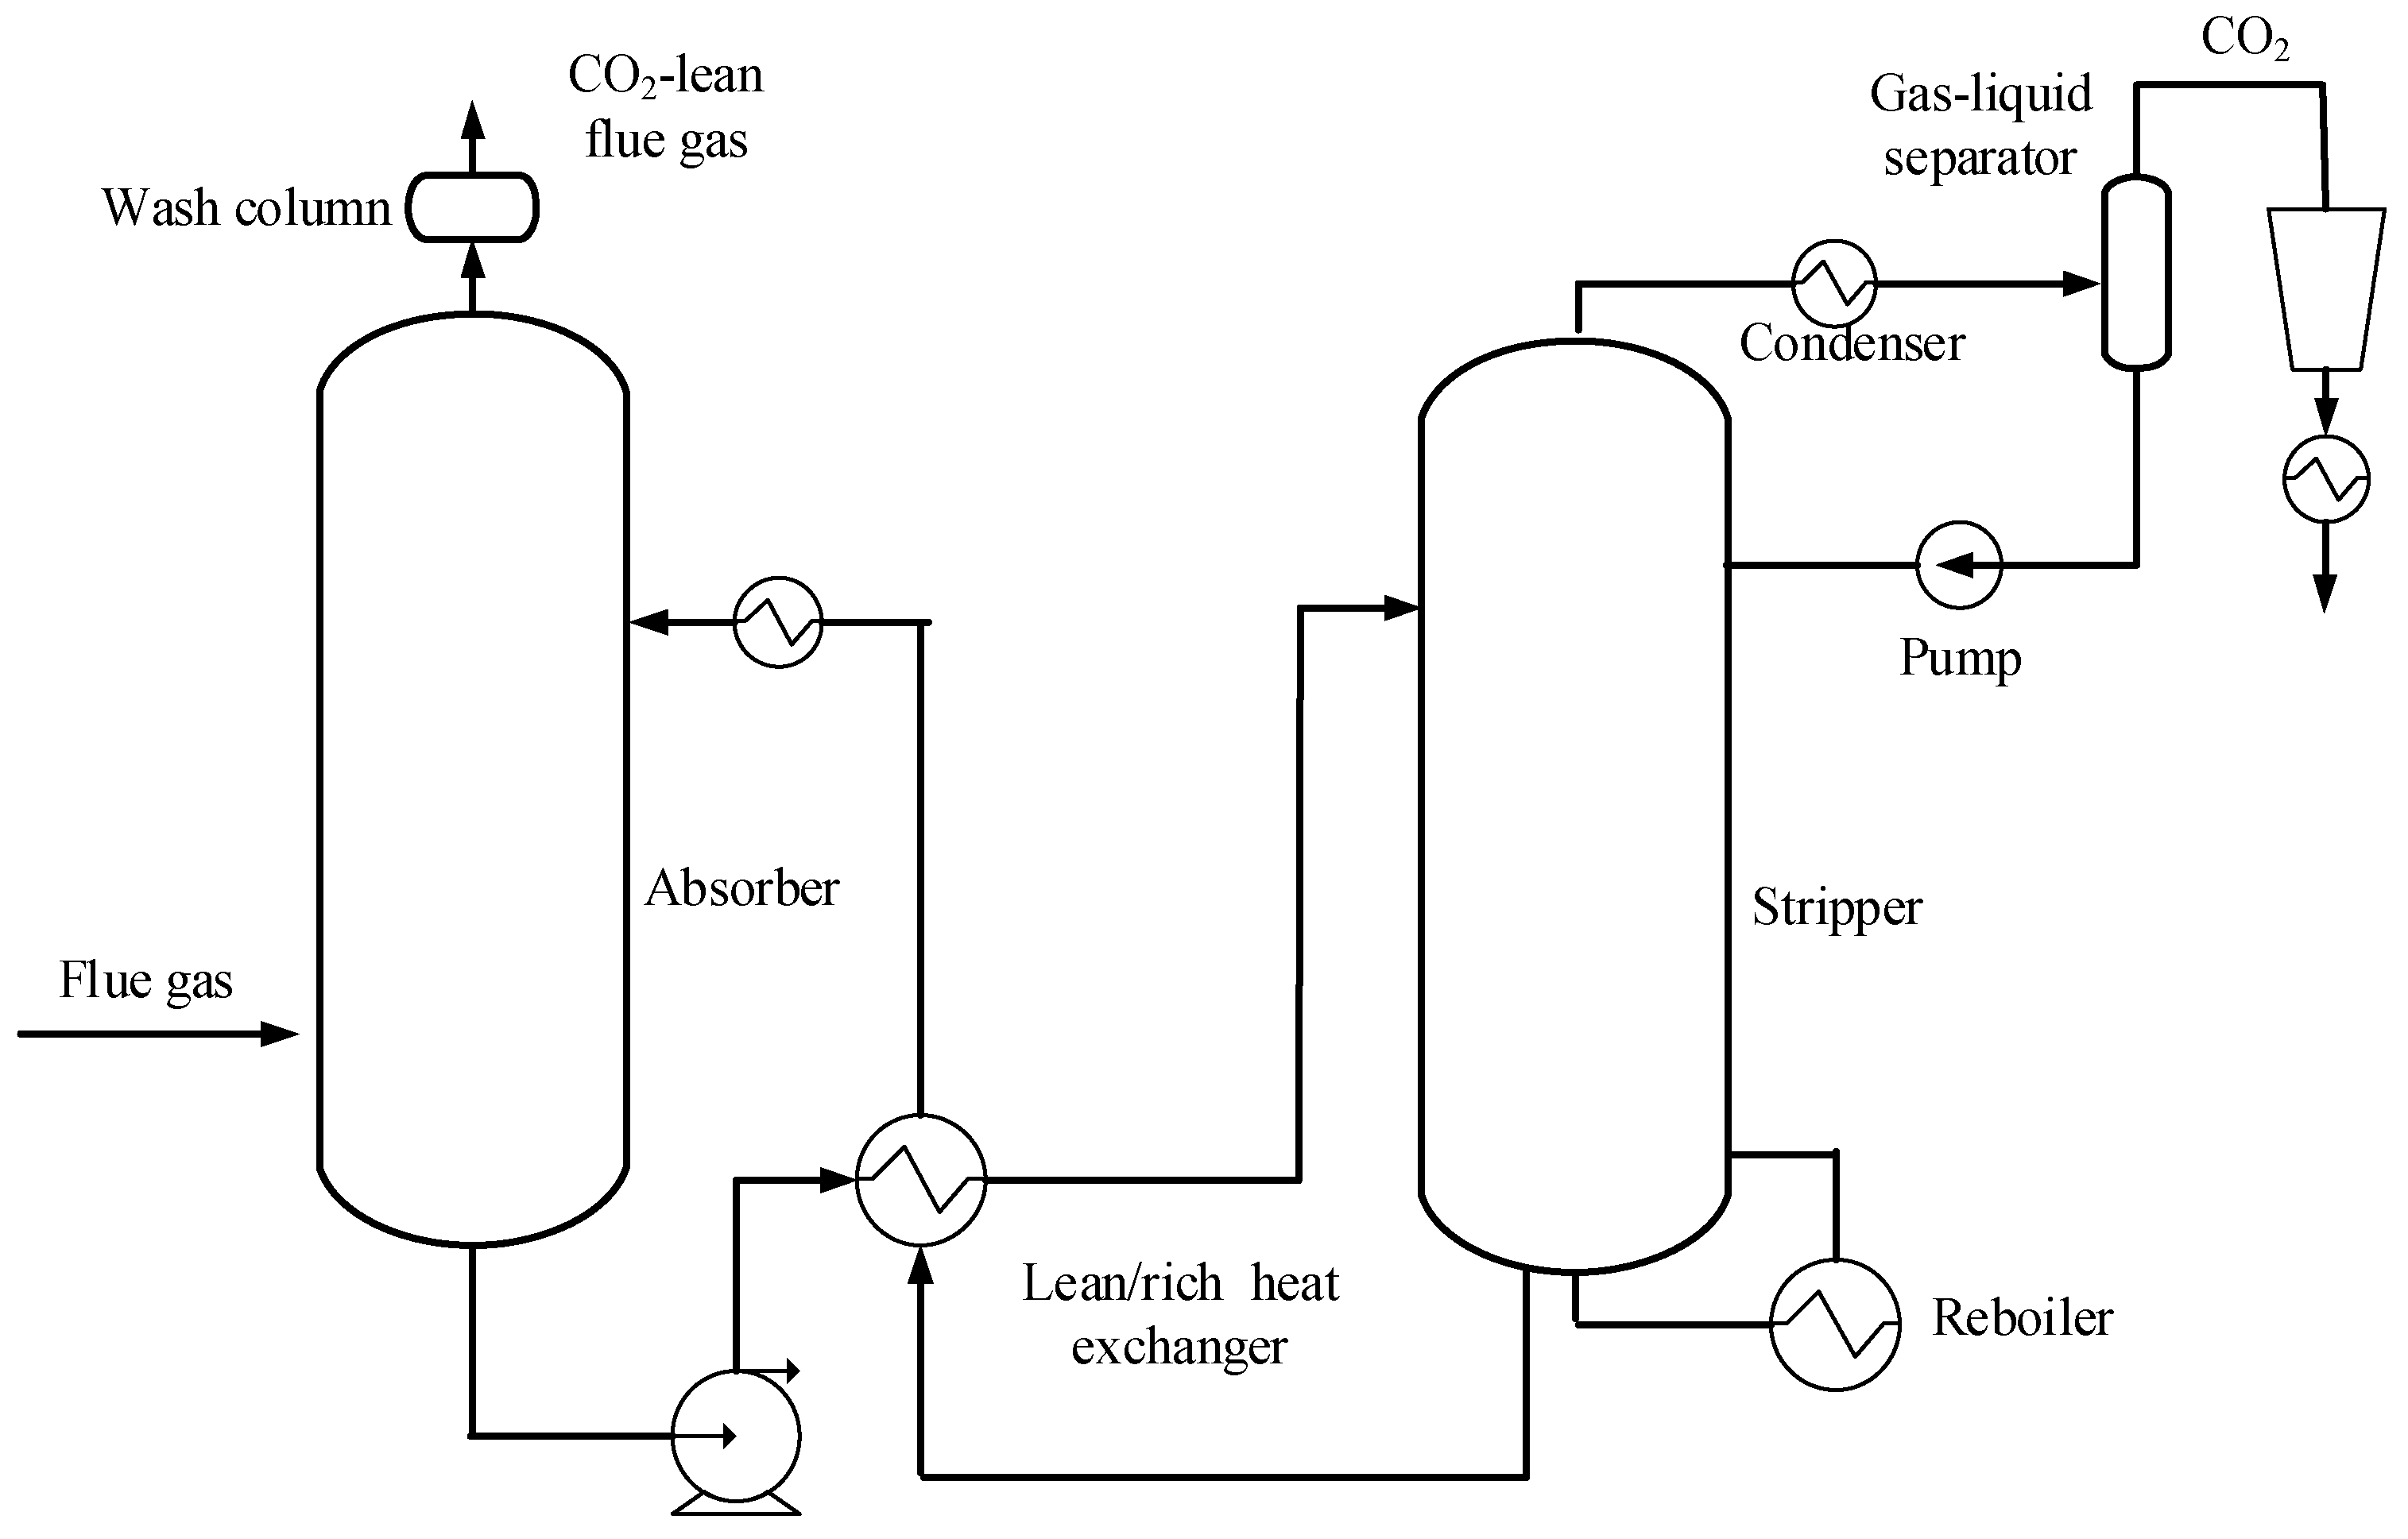
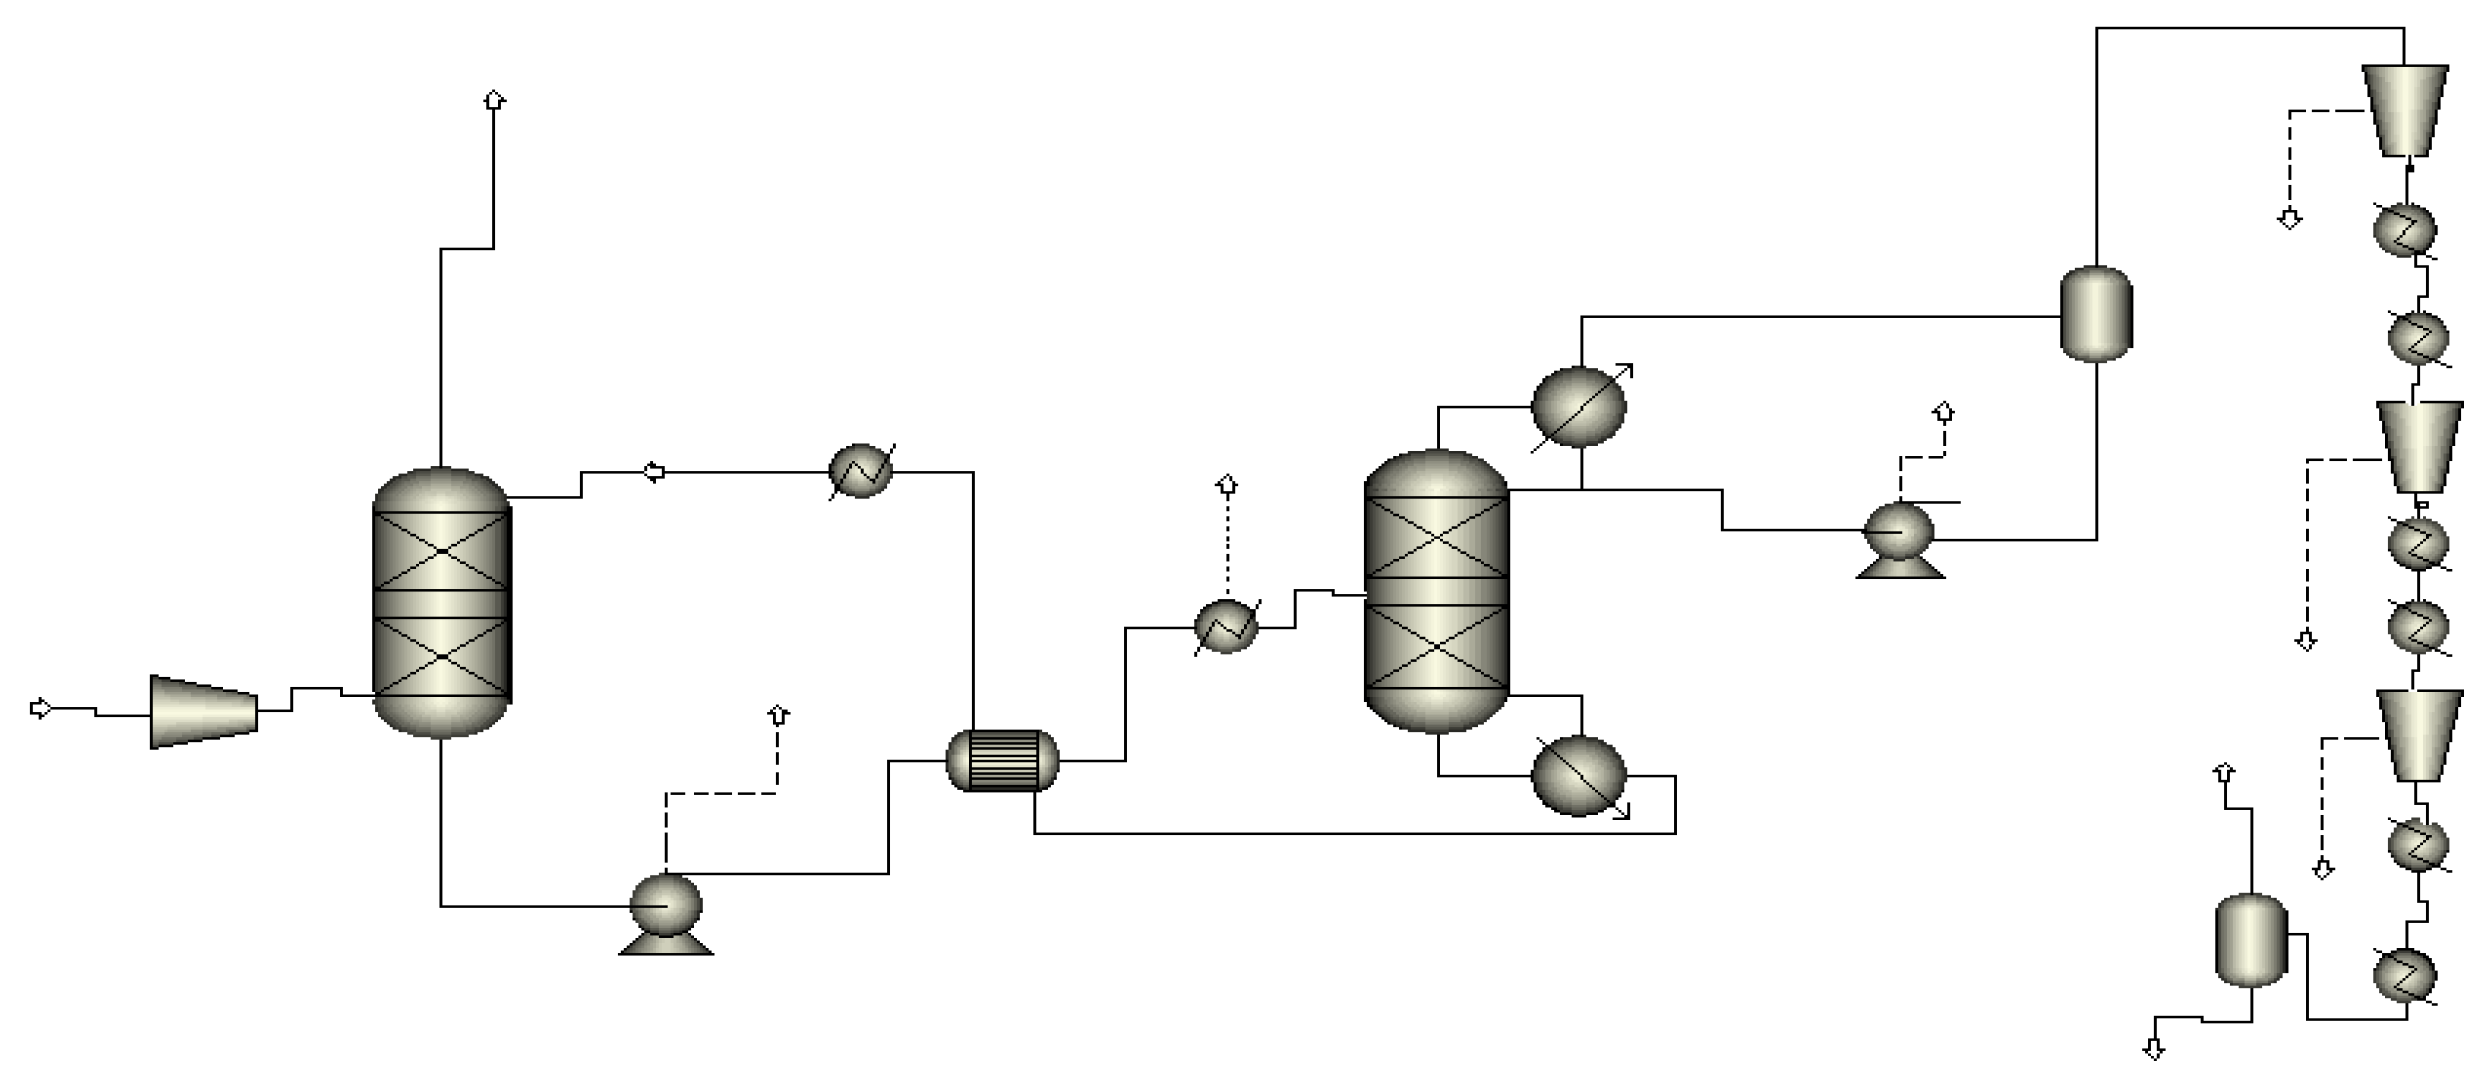
2.1. MEA-Based Post-Combustion CO2 Capture Process

Figure 1 shows the MEA-based post-combustion CO2 capture process. The flue gas discharged from the boiler is sent to the absorber bottom after pre-treatment, which includes deNOx, electrostatic precipitation, desulfurization and direct-contact cooling. The MEA solution enters the absorber from the top and is brought into contact with the flue gas flowing from the bottom through the gas and liquid distributors and internal packing materials (either random or structured). After CO2 capture, the flue gas is washed and removed via the chimney exhaust. The CO2-rich solvent is pumped into the top of the stripper after exchanging heat with the CO2-lean solvent from the stripper reboiler. The CO2-rich solvent in the stripper is further heated in the reboiler and desorbed to release the CO2. In this way, the MEA solution is regenerated and continues to capture CO2 in the absorber.

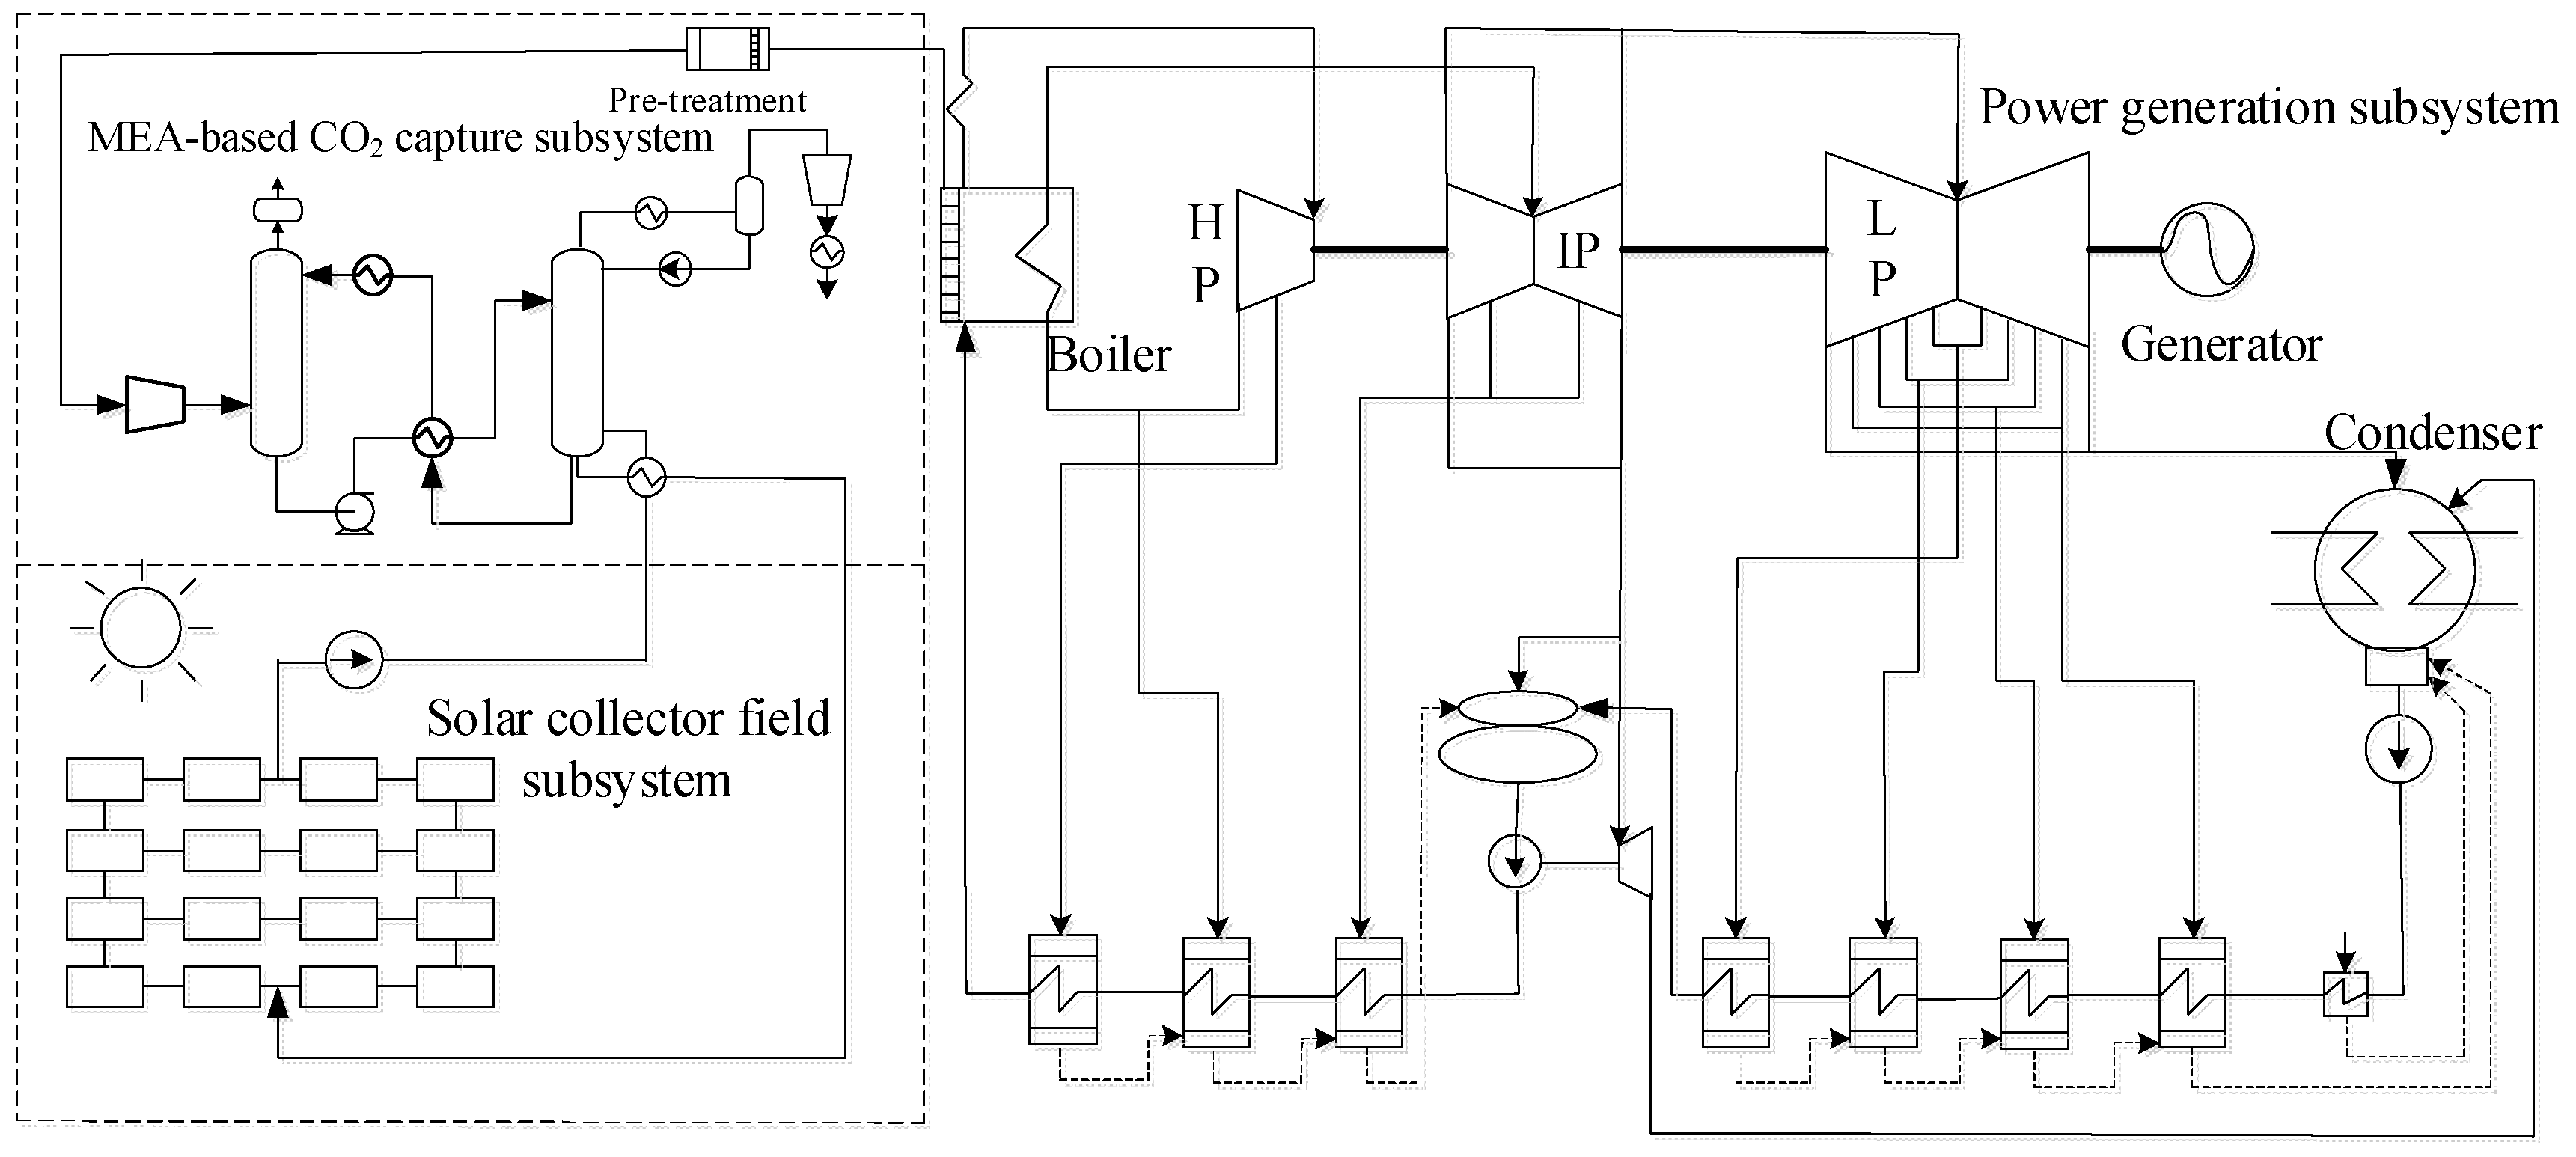
2.2. Solar-Aided Coal-Fired Power Generation with CO2 Capture

The 1000 MW SA-PG-CC system is shown in Figure 2. It consists of three subsystems: (i) a parabolic-trough solar collector, (ii) MEA-based CO2 capture, and (iii) coal-fired power generation.
In the SA-PG-CC system, the parabolic-trough solar collector is coupled with coal-fired power generation in a similar way as the SA-PG system in [25]. The MEA-based CO2 capture subsystem is directly integrated with the power station through the steam extraction. Sunlight is reflected into the heat absorption tube by parabolic-trough solar collectors, heating the thermal oil in the tube. In the oil–water heat exchanger (OWHE), feed water is heated by the thermal oil, rather than the first extraction steam from the high-pressure turbine. A flow of extracted steam from the low-pressure turbine is used to heat the CO2-rich solution in the reboiler of the stripper, allowing CO2 to be released and the MEA solution to be regenerated. After releasing heat in the reboiler, the extraction steam is sent to the condenser at the turbine exhaust, where it continues to be used in the steam cycle.

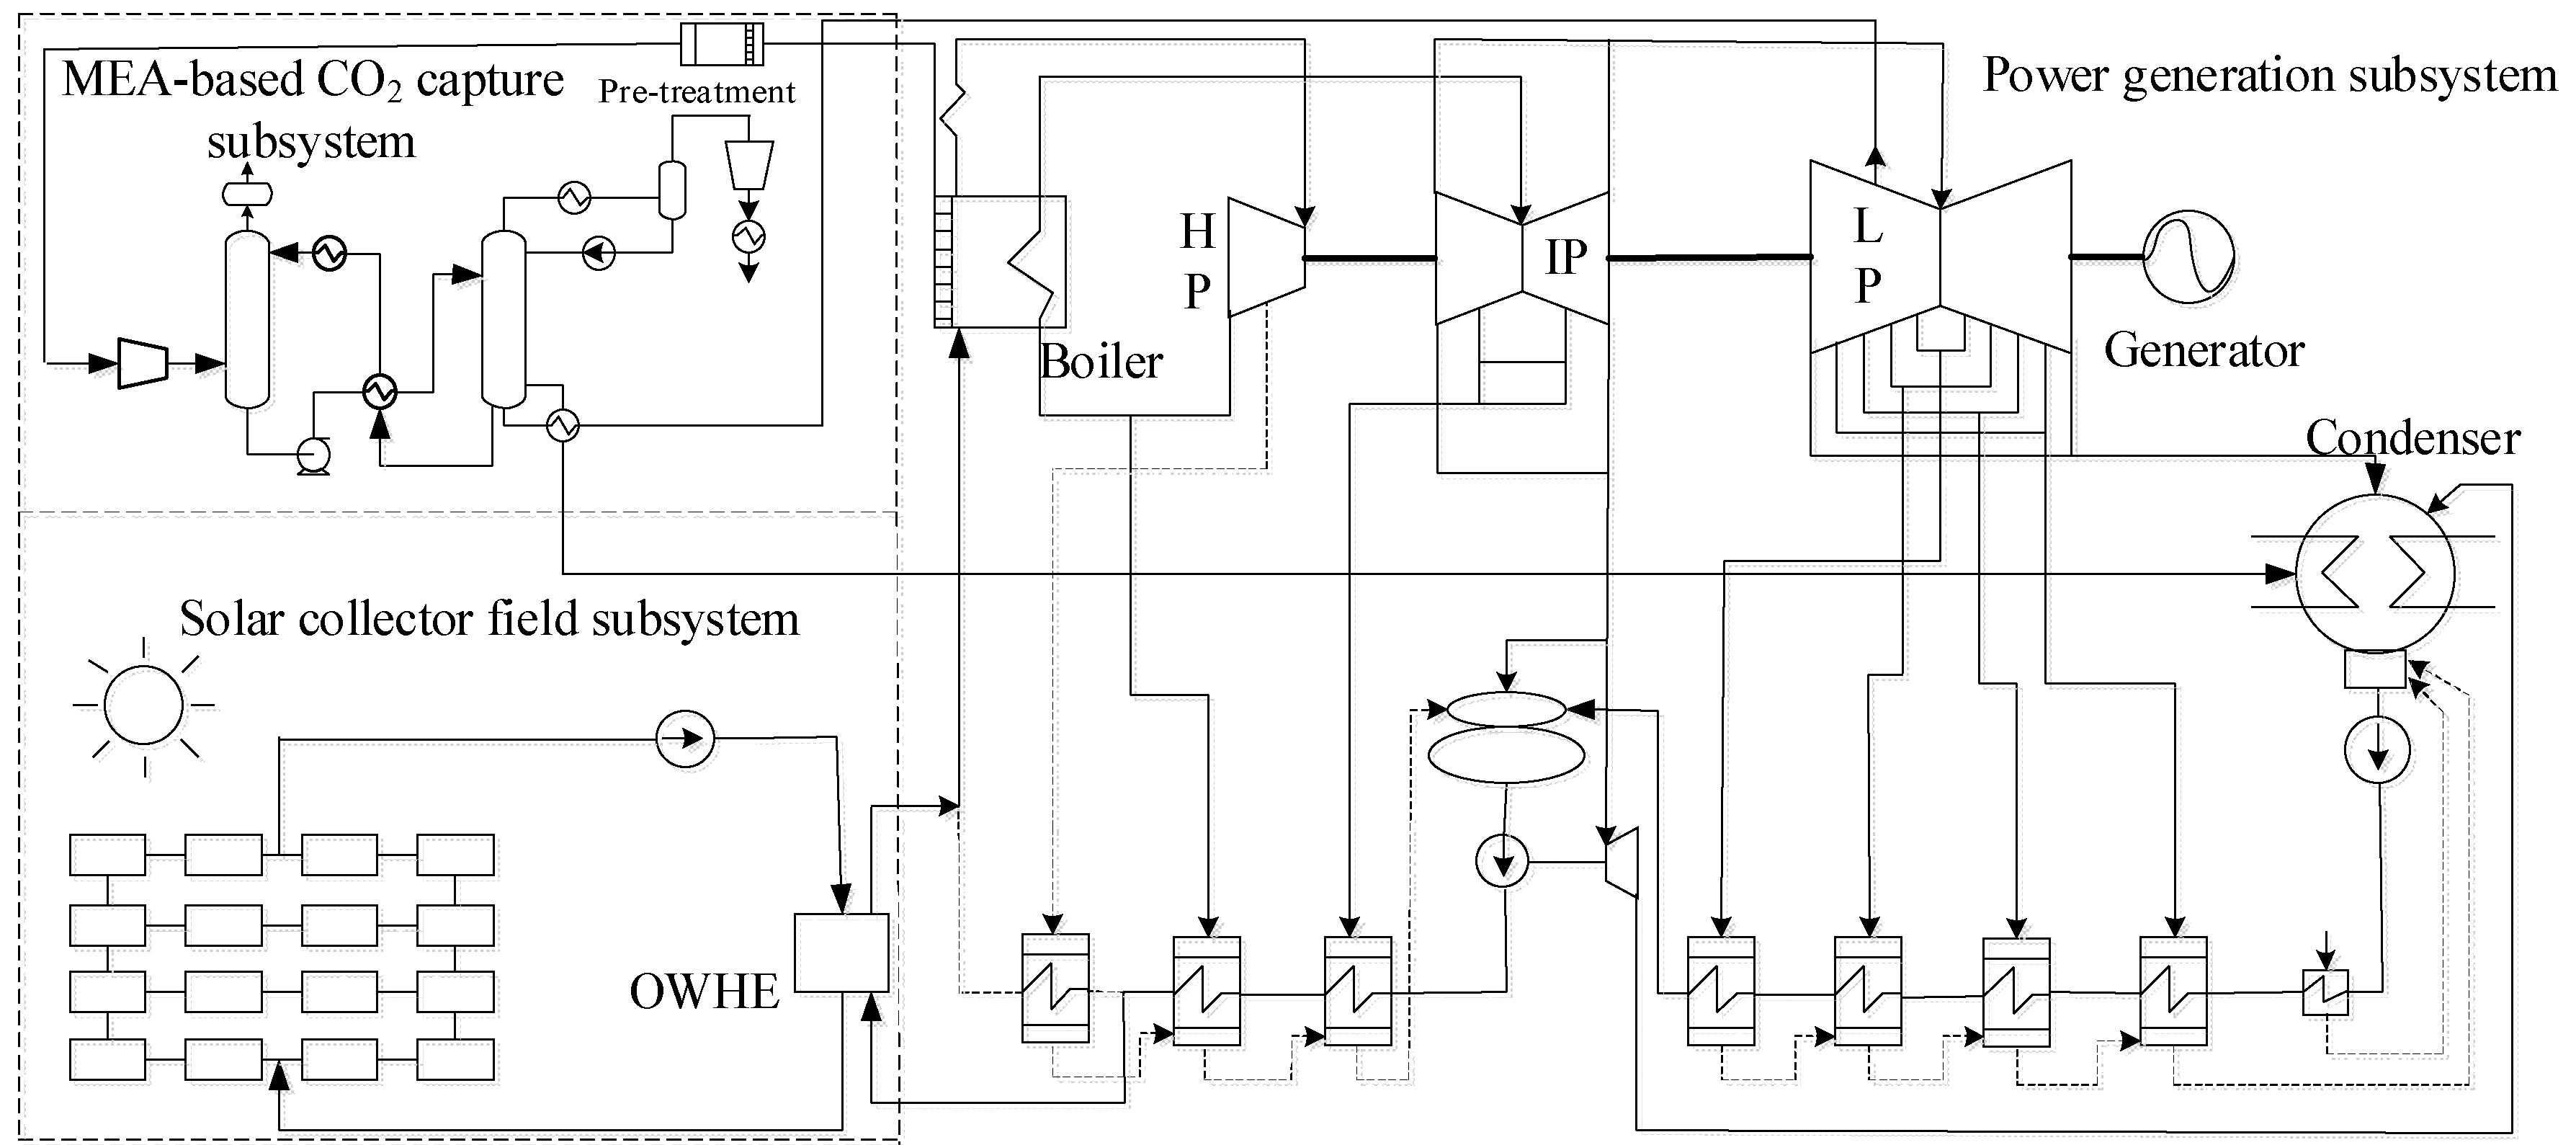
2.3. Solar-Aided CO2 Capture Coal-Fired Power-Generation System

Figure 3 shows the 1000 MW SA-CC-PG system, which has the same three subsystems as SA-PG-CC, but in a different configuration. The SA-CC-PG system integrates the parabolic-trough solar-collector subsystem with MEA-based CO2 capture and uses solar thermal to supply heat to the stripper reboiler. This is achieved by circulating the thermal oil between the solar energy system and the CO2 capture system. The thermal oil is heated in the solar energy system and then pumped through the stripper reboiler to exchange heat with the rich MEA solvent. After that, the oil returns to the solar energy system and continues the cycle.

2.4. Reference System

The reference system is a 1000 MW coal-fired power-generation system with MEA-based CO2 capture (PG-CC), as shown in Figure 2, but without the solar collector subsystem. A flow of extraction steam from the low-pressure turbine provides the heat required by the stripper boiler.
The coal-fired power-generation subsystem consists of a boiler, a turbine, a generator, a condenser, feed-water heaters and a deaerator. The boiler includes a superheater (SH) and a reheater (RH). The turbine is an N1000-25/600/600 type and consists of high-pressure cylinders (HP), intermediate-pressure cylinders (IP) and low-pressure cylinders (LP). The cylinders are divided from their extraction points to facilitate analysis. Feed-water heaters include three high-pressure reheaters (HTR1-3), four low-pressure reheaters (HTR4-7), and a deaerator (DTR).
The components’ ID numbers and abbreviations are shown in Appendix A.

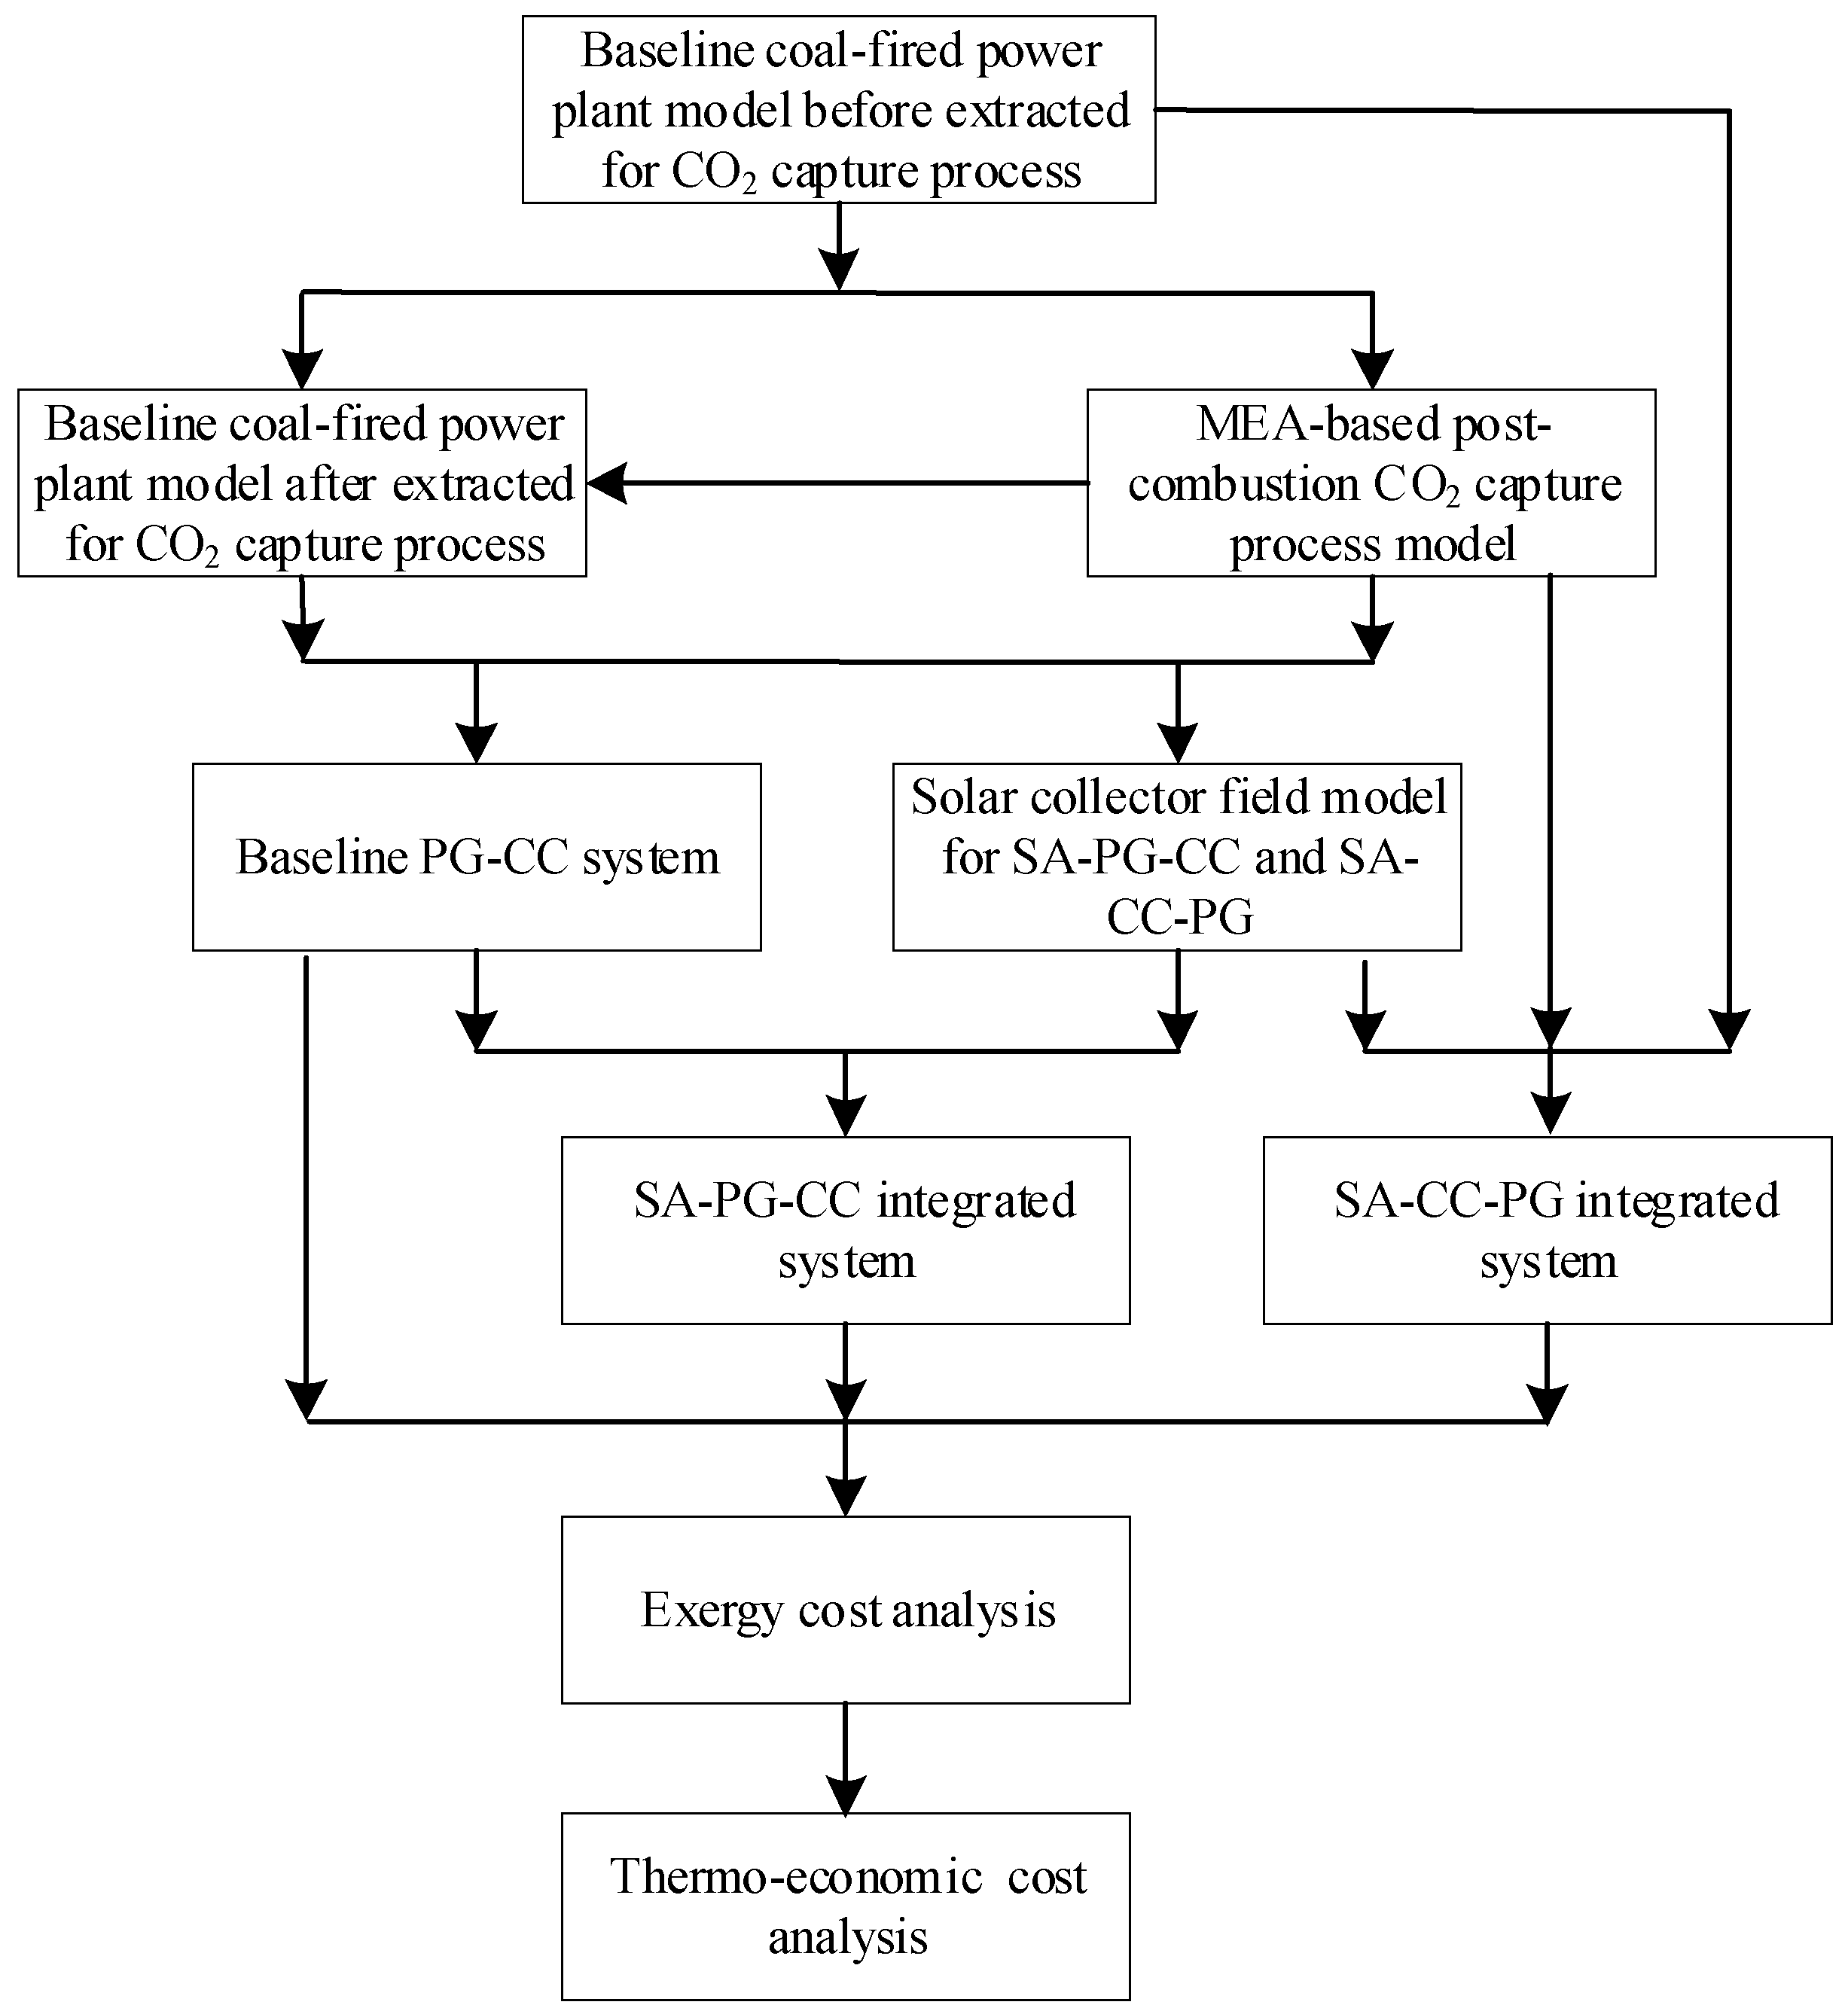
3. Modelling and Method

In this section, we establish the modelling of the system and introduce the method of thermo-economic structural theory.

3.1. System Modelling

The subsystems in the model are (i) a parabolic-trough solar-collector field, (ii) power generation, and (iii) MEA-based CO2 capture. The main calculation process is briefly introduced. This study is based on a design point system. The seasonal effects and variable irradiation condition are not considered yet. One of the advantages of the solar thermal system is its stability in dealing with different irradiation conditions, particularly for a system configured with a thermal energy storage system. If there is insufficient solar energy to meet the heating requirements for the integration, the extracted steam can be used as a supplement.

3.1.1. Solar Field Subsystem

The heat input into the fluid flow is given by:
Q H T F = m H T F ( h o u t h i n )
where QHTF is the heat absorbed by the heat transfer fluid, mHIF is the mass flowrate of the heat transfer fluid, and hout and hin are the outlet and inlet enthalpy of the heat transfer fluid, respectively.
The available heat input Q eff depends on the solar heat input Q s o l a r , the thermal losses of the receivers Q r e c e i v e r and the field piping Q p i p e :
Q eff =   Q s o l a r Q r e c e i v e r Q p i p e
The solar input Q s o l a r is determined by:
Q s o l a r = D N I A n e t f o p t k f s h a d i n g f e n d f w i n d f c l e a n
where DNI is the direct normal irradiation, A n e t is the net aperture area, f o p t is the peak optical efficiency, k is the incident angle correction, f s h a d i n g is the factor to include shading losses, f e n d is the factor to correct end loss effects, f w i n d is the factor to include optical losses due to wind impact, and f c l e a n is the factor to correct for actual mirror cleanliness.

3.1.2. Power-Generation Subsystem

The thermal process in the boiler is calculated as:
Q b = m b ( h b , o u t   h b , i n ) η b
where Q b is the thermal energy provided by coal fuel, m b is the mass flowrate of feed water, h b , i n and h b , o u t are the specific enthalpy of feed water at the boiler inlet and steam at the boiler outlet, respectively, and η b is the thermal efficiency of the boiler.
The thermal process in the turbine is calculated by:
W = m t ( h t , i n h t , o u t ) η t
where W is the work done by steam in the steam turbine, m t is the mass flowrate of steam into the steam turbine, h t , i n and h t , o u t are the specific enthalpy of the steam inlet and outlet of the turbine, respectively, and η t is the relative internal efficiency of the steam turbine.

3.1.3. MEA-Based CO2 Capture Subsystem

The chemical model used in the MEA-based CO2 capture subsystem include the following equilibrium and kinetic reactions.
Equilibrium: 2H2O ↔ H3O+ + OH
Equilibrium: CO2 + 2H2O ↔ H3O+ + HCO3
Equilibrium: HCO3 + H2O ↔ CO32− + H3O+
Equilibrium: MEAH+ + H2O ↔ MEA + H3O+
Kinetic: CO2 + OH → HCO3
Kinetic: HCO3 → CO2 + OH
Kinetic: MEA + CO2 + H2O → MEACOO + H3O+
Kinetic: MEACOO + H3O+ → MEA + CO2 + H2O
The detailed description of the capture system can be found in our previous publication [16].
The CO2 removal ratio is the molar ratio of the absorbed CO2 from the flue gas to the total CO2 content in the flue gas:
η r e m o v a l = 1 n c o 2 c l e a n g a s n c o 2 f l u e g a s
The CO2 loading (ηload) is defined as the molar ratio of CO2 to MEA in the absorbent solution:
η l o a d = n c o 2 + n M E A C O O + n H C O 3 + n C O 3 2 n M E A + n M E A + + n M E A C O O
where n is the number of moles of each component in the solution.

3.2. Thermo-Economic Structural Theory

The thermo-economic structural theory used in this paper is detailed in [28], and is only briefly described in this section.
Physical structure models are established to simulate the SA-PG-CC and SA-CC-PG systems. The physical structures are used to describe the relations of streams and components from matter and energy points of view. The productive structure is an abstract expression of the actual material flow using the concept of fuel and products to describe the productive function of components and their connections. The exergy cost of each flow is analysed according to the results of the physical model of the system. Non-energy factors, such as investment, are introduced, and the thermo-economic cost of each component is analysed according to the corresponding productive model [48,49,50].

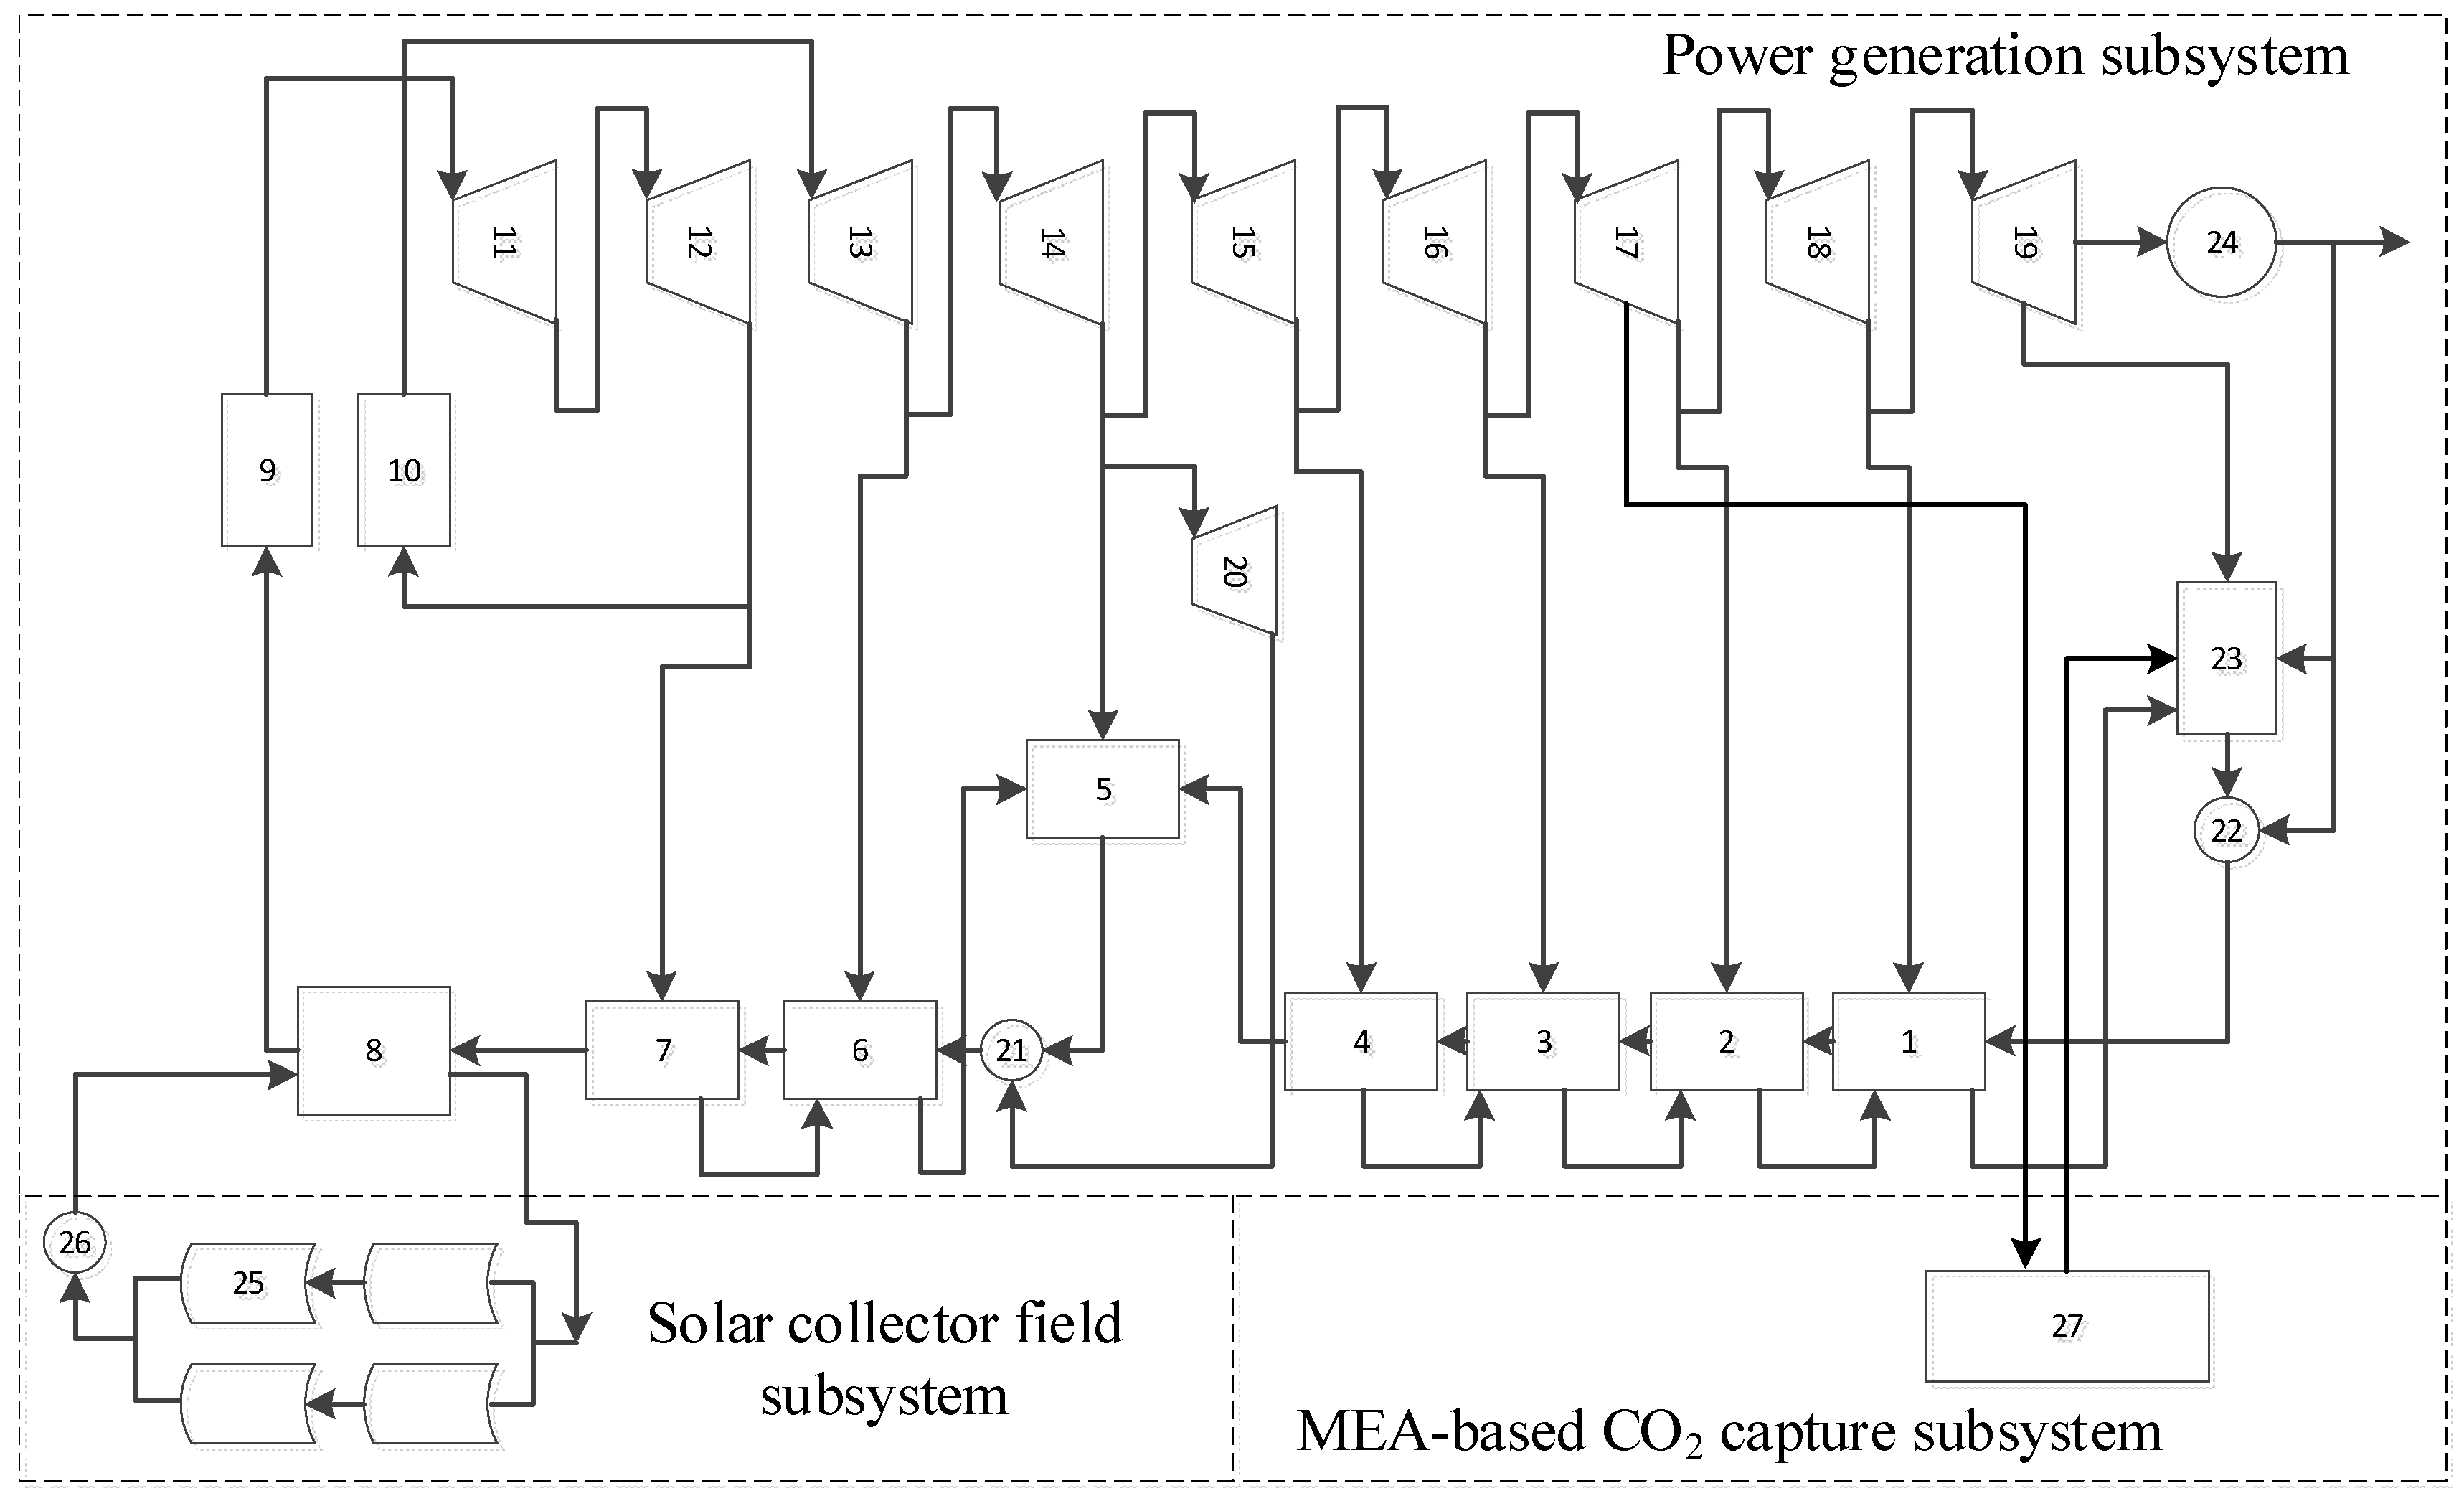
3.2.1. Physical and Productive Structures

Figure 4 shows the physical structure of the 1000 MW SA-PG-CC system. The physical structure can be obtained by dividing up the system according to component function. Inflows and outflows represent substances and exergy flows. The boiler is divided into a superheater (9) and a reheater (10). The steam turbine is divided into different components (11–19). The feed-water heaters (1–8), the deaerator (5), the condenser (23) and the pumps (21, 22, 26) are not divided, because the calculation accuracy satisfies the requirements. The parabolic-trough solar-collector subsystem consists of collectors (25) and a pump (26). The MEA-based CO2 capture subsystem is associated with the whole system via the stripper reboiler system (27).
Figure 5 shows the physical structure of the 1000 MW SA-CC-PG system. It consists of the same subsystems as SA-PG-CC, but in a different configuration.
In this thermo-economic structural theory, a component is produced according to its function. The concepts of fuel and product are used to construct the corresponding productive structure model and describe the function of each flow. The quantified representation of the production results is defined as product (P), and it can be energy or matter. The fuel (F) is the exergy consumed for the product [48,49,50,51]. The function of the condenser is to return the working fluid to the starting point of the cycle, reducing the entropy of the working fluid. Its product is negentropy (FS) [48,49,50,51], which is equal to the entropy of the working fluid reduced in the condenser, and can be calculated as:
F S = T 0 ( S i n S o u t )
where T0 is the temperature of the environment, and Sin, Sout are the entropy of the inlet and outlet flow, respectively. Each component consumes two fuels: exergy (FB), used for production, and entropy, which is increased in this process. The productive structure diagram can express the relationship between the flows of components from the perspectives of fuel and product.
Figure 6 and Figure 7 show the productive structures of the 1000 MW SA-PG-CC and 1000 MW SA-CC-PG systems, respectively. In these figures, the inlet flow of the pooled component (J) signifies the collection of products from other components. The outflow of the dispersion component (O) refers to distribution of fuels to other components.

3.2.2. Exergy Cost Model

Exergy cost B* of a flow refers to the external exergy of the system (coal fuel, Etc.) consumed for the product B. Unit exergy cost k* signifies the external exergy consumed for the unit product B:
k * = B * B
kB and kS signify the fuel exergy and negentropy consumed for the unit product B, respectively. The exergy cost equation can be obtained by:
k P , i = k B i k F B , i + k S i k F S , i i = 0 , 1 , n
kI represents the irreversible exergy loss in the process of producing the unit product P. There is k B i = 1 + k I i . The exergy cost equation can be expressed as exergy cost of fuel k F B * , exergy cost of irreversible k I i k F B , i and exergy cost of negentropy k S i k F S , i , which describes the exergy cost caused by fuel, irreversible loss and negentropy:
k P , i = k F B , i + k I i k F B , i + k S i k F S , i i = 0 , 1 , n

3.2.3. Thermo-Economic Cost Model

On the basis of the analysis of the exergy cost model, the thermo-economic cost model takes into consideration the factors of coal price, equipment investment and operation and maintenance cost. The thermo-economic cost C represents the total amount of money consumed for product P. Unit thermo-economic cost c ($/kJ) represents the total amount of money consumed for unit product: c   = C / P . Non-energy costs are denoted as Z, including the monetary cost of the fuel consumed, investment and operation cost of the system.
c p i · P i = j = 1 n c F j · F j + ξ Z j
In which the ξ is the levelized factor and Z j is investment cost of the component.
Non-energy costs are added to the exergy cost model. Unit thermo-economic cost can be expressed as the thermo-economic cost of fuel ( c F B , i ), thermo-economic cost of irreversibles ( c I , i ), thermo-economic cost of negentropy ( c N , i ) and thermo-economic cost of investment ( c Z , i ).
c P , i = c F B , i + c I , i + c N , i + c Z , i

3.2.4. Levelized Cost of Electricity Model

Levelized cost of electricity (LCOE) is calculated as [52,53]:
L C O E = T C R F C F + O & M + F C E c o a l + E s o l a r
F C F = r ( 1 + r ) t ( 1 + r ) t 1
where T C R is the total capital requirement of the power plant after integration, including the purchased equipment delivered costs, total direct costs, total indirect costs, profit, and contingency; F C F is the fixed charge factor; r is the interest rate; O & M is the annual operating and maintenance expenditure; F C is the fuel cost; t is the economic life of the plant; E c o a l and E s o l a r are the annual electricity output from coal fuel and solar thermal, respectively.

3.2.5. Model Solution

In this paper, the models for the parabolic-trough solar subsystem and coal-fired power-generation subsystem were established in EBSILON® Professional 13.00. This software is widely applied in the calculation, design and optimisation of thermodynamic systems. On the basis of the correct formula, the mass and energy conservation of the thermodynamic process can be accurately calculated [54,55,56]. The simulation results have been validated and used in thermodynamic calculations, indicating that the simulation results from EBSILON® Professional are reliable [57,58,59,60]. The MEA-based CO2 capture subsystem was modelled and simulated using Aspen Plus. This software simulates chemical processes based on mass conservation, energy conservation, chemical equilibrium and kinetics, and is widely applied in chemical process research [38,61,62,63,64]. The thermodynamic and transport properties of the MEA-based CO2 capture process were simulated using the electrolyte-NRTL model [50]. The process in Aspen Plus is shown in Figure 8. The level of detail is the same as that shown in Figure 1. According to the simulation results, the parameters of the physical structure model and the productive structure model were obtained. The exergy cost equation and thermo-economic cost equation of each component were solved simultaneously to obtain the results of the thermal-economic analysis.
The exergy cost equation and thermo-economic cost equation of each component are shown in Table 1 [48,50], and the model procedure for the analysis is shown in the Figure 9. The baseline coal-fired power plant model before extraction for the CO2 capture process is established first. Then the corresponding MEA-based post-combustion CO2 capture process model can be determined. With the baseline coal-fired power plant model and the CO2 capture process model, the coal-fired power plant model after extraction for the CO2 capture process can be obtained. Then the baseline PG-CC system can be configured, and the solar collector field models for SA-PG-CC and SA-CC-PG can be calculated. The SA-PG-CC system can be solved with the PG-CC system and the solar collector field model. The SA-CC-PG system can be solved with the baseline coal-fired power plant model before extraction for the CO2 capture process, the CO2 capture process model and the solar collector field model. Therefore, the exergy cost analysis and thermo-economic cost analysis can be carried out.

4. Case Study

4.1. Basic Data

4.1.1. Technical Parameters

The coal-fired power-generation subsystem is a 1000 MW coal-fired power plant with main parameters as listed in Table 2. We have assumed that the three systems (SA-PG-CC, SA-CC-PG and PG-CC) consume the same amount of coal per hour, and therefore produce the same amount flue gas and use the same CO2 capture process. Table 3 shows the main parameters of the parabolic-trough solar-thermal subsystem; the data is the design data of the solar collector field of the solar-aided coal-fired demonstration plant in Gansu Province, China [65]. Table 4 shows the flue gas, absorber and stripper parameters. The inlet and outlet temperature of the solar collector field is the temperature of the thermal oil that is used to heat the feedwater and reboiler in the SA-PG-CC and SA-CC-PG, respectively. In the SA-CC-PG, the thermal oil is heated in the solar energy system and then enters the stripper reboiler to exchange heat with the rich MEA solvent. The hot thermal oil temperature is 217 °C. It should be pointed out that this is the temperature of the heat source, not the solvent in the stripper. Additionally, the solvent temperature is controlled to not exceed 125 °C by design of the reboiler.

4.1.2. Economic Parameters

The coal fuel price in this system is assumed to be US$2 × 10⁻⁶/kJ. The relevant economic parameters of the system are shown in Table 5. The price of each component is shown in Appendix B [48,66,67].
The relevant economic parameters of the parabolic-trough solar-thermal subsystem are shown in Table 6 [68].
In this paper, the investment cost of each component in the MEA-based CO2 capture subsystem was obtained from calculations. The investment cost of components of the same type with different power output was calculated using Equation (15) [66,67]. The investment cost of a 1000 MW CO2 capture unit was calculated based on a 500 MW CO2 capture unit [66,67,68,69], shown in Appendix C.
C i C i , r e f = ( W i W i , r e f ) 0.6

4.2. Results and Discussion
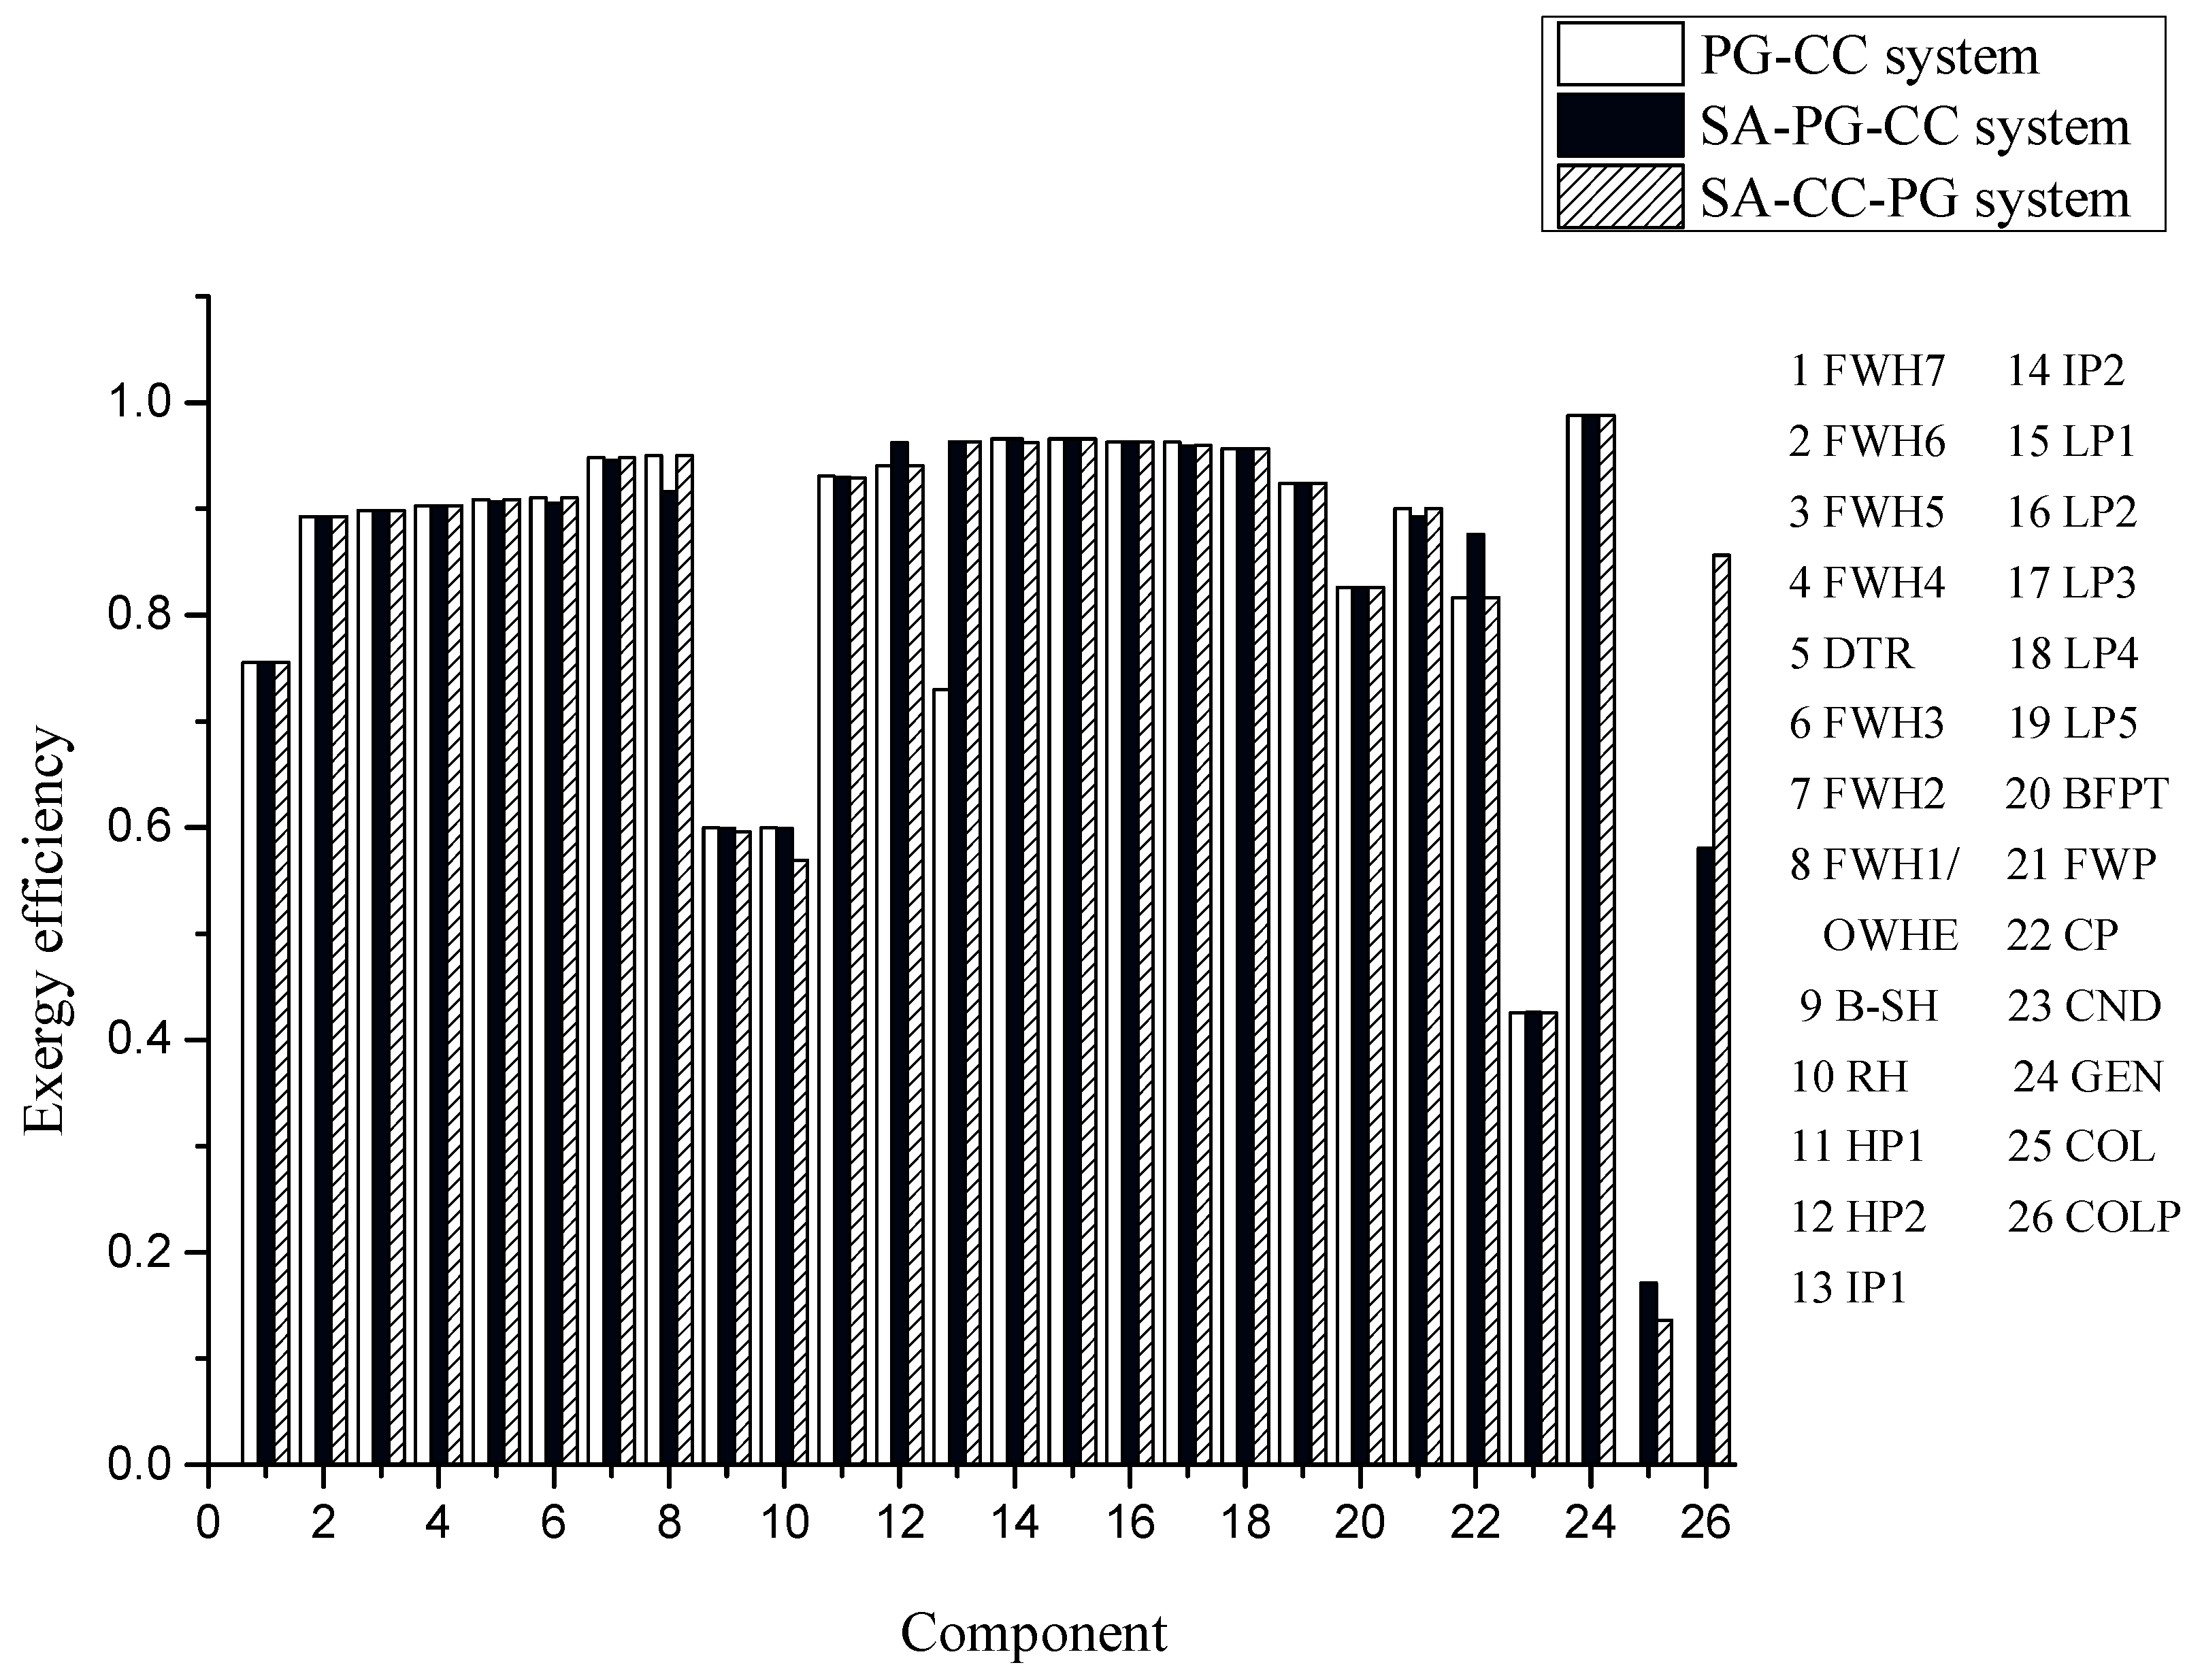
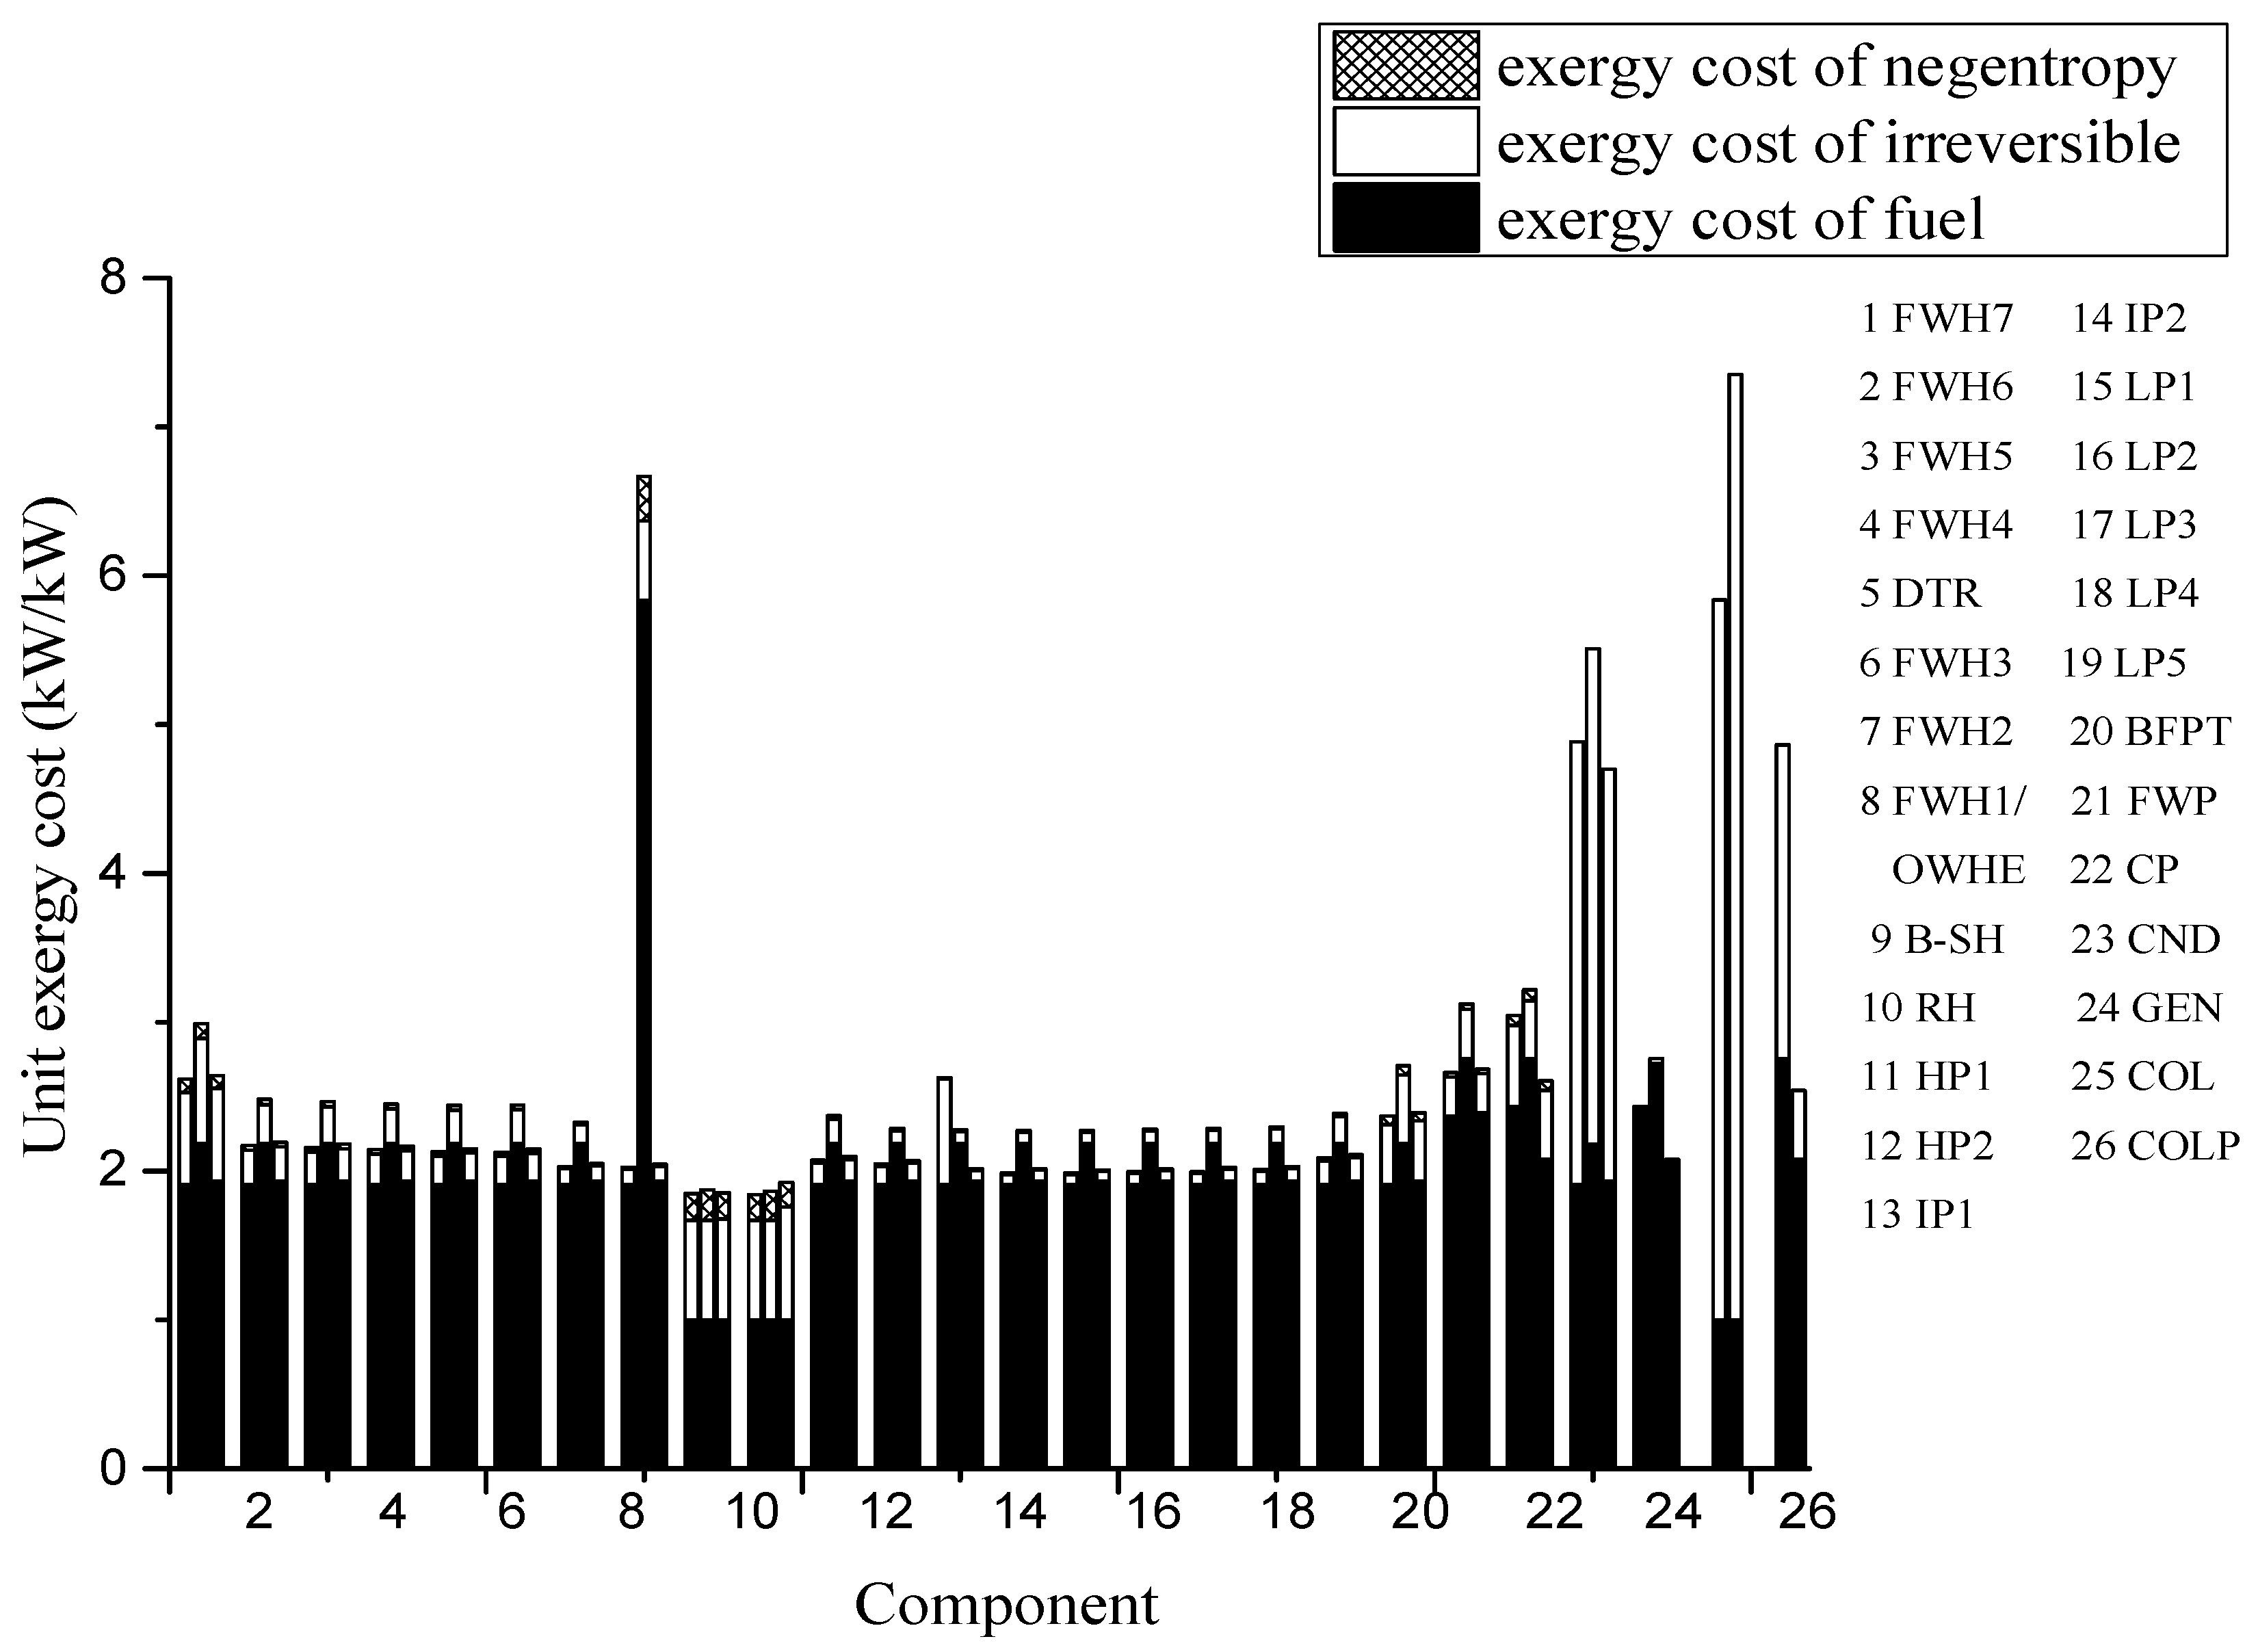
4.2.1. Exergy Cost

Table 7 shows the main exergy cost model analysis results of PG-CC, SA-PG-CC and SA-CC-PG systems, with detailed results listed in Appendix D.
In SA-PG-CC, solar thermal was used to heat the feed water, rather than the first-stage high-pressure extraction steam at a higher temperature. A flow of low-pressure extraction steam at low temperature was used to provide the heat required in the stripper reboiler. In comparison, solar thermal in SA-CC-PG provided the heat required in the stripper reboiler directly, and the low-pressure steam was not extracted.
Compared with the PG-CC system, the coal consumption rate of the SA-PG-CC and SA-CC-PG configurations decreased by 15.31 and 51.41 g/kWh, respectively. The solar thermal required in SA-CC-PG was far more than that in SA-PG-CC, which accounts for a larger share in the total input exergy of system. The exergy absorbed by the thermal oil in SA-PG-CC and SA-CC-PG was 72.9 and 327.9 MW, respectively, resulting in a system power increase of 57.2 and 162 MW, respectively. The efficiency of the system is the efficiency of the input exergy of the system (solar exergy and coal exergy) to the system power output. Both the SA-PG-CC and SA-CC-PG systems had greater power output and system efficiency than the PG-CC system, indicating that the input of solar thermal energy improved the thermal performance of system. The efficiency of the system in SA-PG-CC is 42.35%, and in SA-CC-PG it is 42.21%. The equivalent solar-power generation efficiency is the ratio of increased power output to the input solar exergy, which is 78.5% for SA-PG-CC and 49.4% for SA-CC-PG. In the SA-PG-CC system, solar sunlight is converted to a higher-temperature thermal energy, with higher exergy efficiency compared with the SA-CC-PG system. The solar thermal energy is utilized at the high-pressure extraction energy level instead of the low-pressure steam energy level, causing the differences in system efficiency and equivalent solar-power generation efficiency. This result indicates that the solar thermal energy is more fully used in the SA-PG-CC system with the same coal consumption and CO2 capture subsystem.
The exergy efficiency of each component in the PG-CC, SA-PG-CC and SA-CC-PG systems is shown in Figure 10 In both SA-PG-CC and SA-CC-PG, the exergy efficiency of the solar collector field was very low, at 0.17 and 0.14, respectively. This was mainly due to the high optical loss of the parabolic-trough solar subsystem, resulting in low optical efficiency. In addition, some energy was dissipated as heat loss. In SA-PG-CC, the working fluid was heated to a higher temperature than in SA-CC-PG by solar thermal, the exergy efficiency of the solar subsystem was also higher.
The exergy cost composition of each component in the PG-CC, SA-PG-CC and SA-CC-PG systems is shown in Figure 11. The exergy cost is divided into three parts: (i) fuel, which represents the minimum external exergy required to obtain the unit product; (ii) irreversible, which reflects the external exergy caused by irreversibility of the process on components; and (iii) negentropy, which indicates the consumption of external resources due to negentropy consumption.
Compared with the PG-CC system, the exergy cost of each component was slightly increased in SA-PG-CC; the exergy cost of the solar-thermal subsystem was significantly higher than other components, and the unit exergy cost of the electricity increased by 13.2%. For the same component, the exergy cost of the OWHE increased significantly, from 2.02 to 6.67, compared with the HP heater FWH1. This was due to the introduction of the solar energy system in SA-PG-CC. Due to the limitation of optical efficiency and thermal efficiency of the solar-collector subsystem, the exergy cost of solar thermal was higher than coal, which was mainly caused by irreversibility. In SA-PG-CC, the solar-collector subsystem was coupled with the power-generation subsystem; the sunlight was converted into thermal energy in the system and flowed through the system. With the flow of solar thermal energy, this part of the exergy cost was distributed to other components in the power-generation process. Therefore, the unit exergy costs of electricity in SA-PG-CC were higher than in PG-CC; nevertheless, the cost from coal combustion was greatly reduced, as a result of the coal consumption rate.
Compared with PG-CC, the exergy cost of each component in SA-CC-PG did not change significantly. In SA-CC-PG, solar thermal was used to heat the stripper reboiler, and there was a small impact on the coal-fired power-generation subsystem. The inefficiency of low-pressure steam from the last stage of the steam turbine caused a slighter higher exergy cost for components in SA-CC-PG than in PG-CC. The system’s power generation was increased, so that unit exergy costs of electricity and coal combustion rate slightly decreased.
Compared with SA-CC-PG, SA-PG-CC had a higher unit exergy cost for components in the power-generation subsystem, and a lower unit exergy cost for the solar-collector subsystem. In SA-PG-CC, the solar-collector subsystem was coupled with the power-generation subsystem, so that the additional solar exergy cost was shared by the power-generation subsystem components. In SA-CC-PG, the solar-collector subsystem was coupled with the MEA-based CO2 capture subsystem, and the additional solar exergy cost was shared by the MEA-based CO2 capture subsystem instead of the power-generation subsystem components. For the solar-collector subsystem, solar thermal was used at a lower temperature in SA-CC-PG (120 °C–140 °C), accompanied by a higher irreversible loss. Therefore, the solar-collector subsystem had a higher unit exergy cost in SA-CC-PG than in SA-PG-CC.
Table 8 shows the main results of the MEA-based CO2 capture subsystem’s thermal performance. The three systems have the same MEA-based CO2 capture system, with the same CO2 removal rate and reboiler heat load. The heat required for the stripper reboiler in PG-CC and SA-PG-CC was provided by the turbine low-pressure extraction steam, with a lower exergy cost. In SA-CC-PG, the heat required for the stripper reboiler was provided by the solar thermal with a higher exergy cost. Therefore, the unit exergy cost of CO2 in SA-CC-PG was significantly greater than in PG-CC and SA-PG-CC.

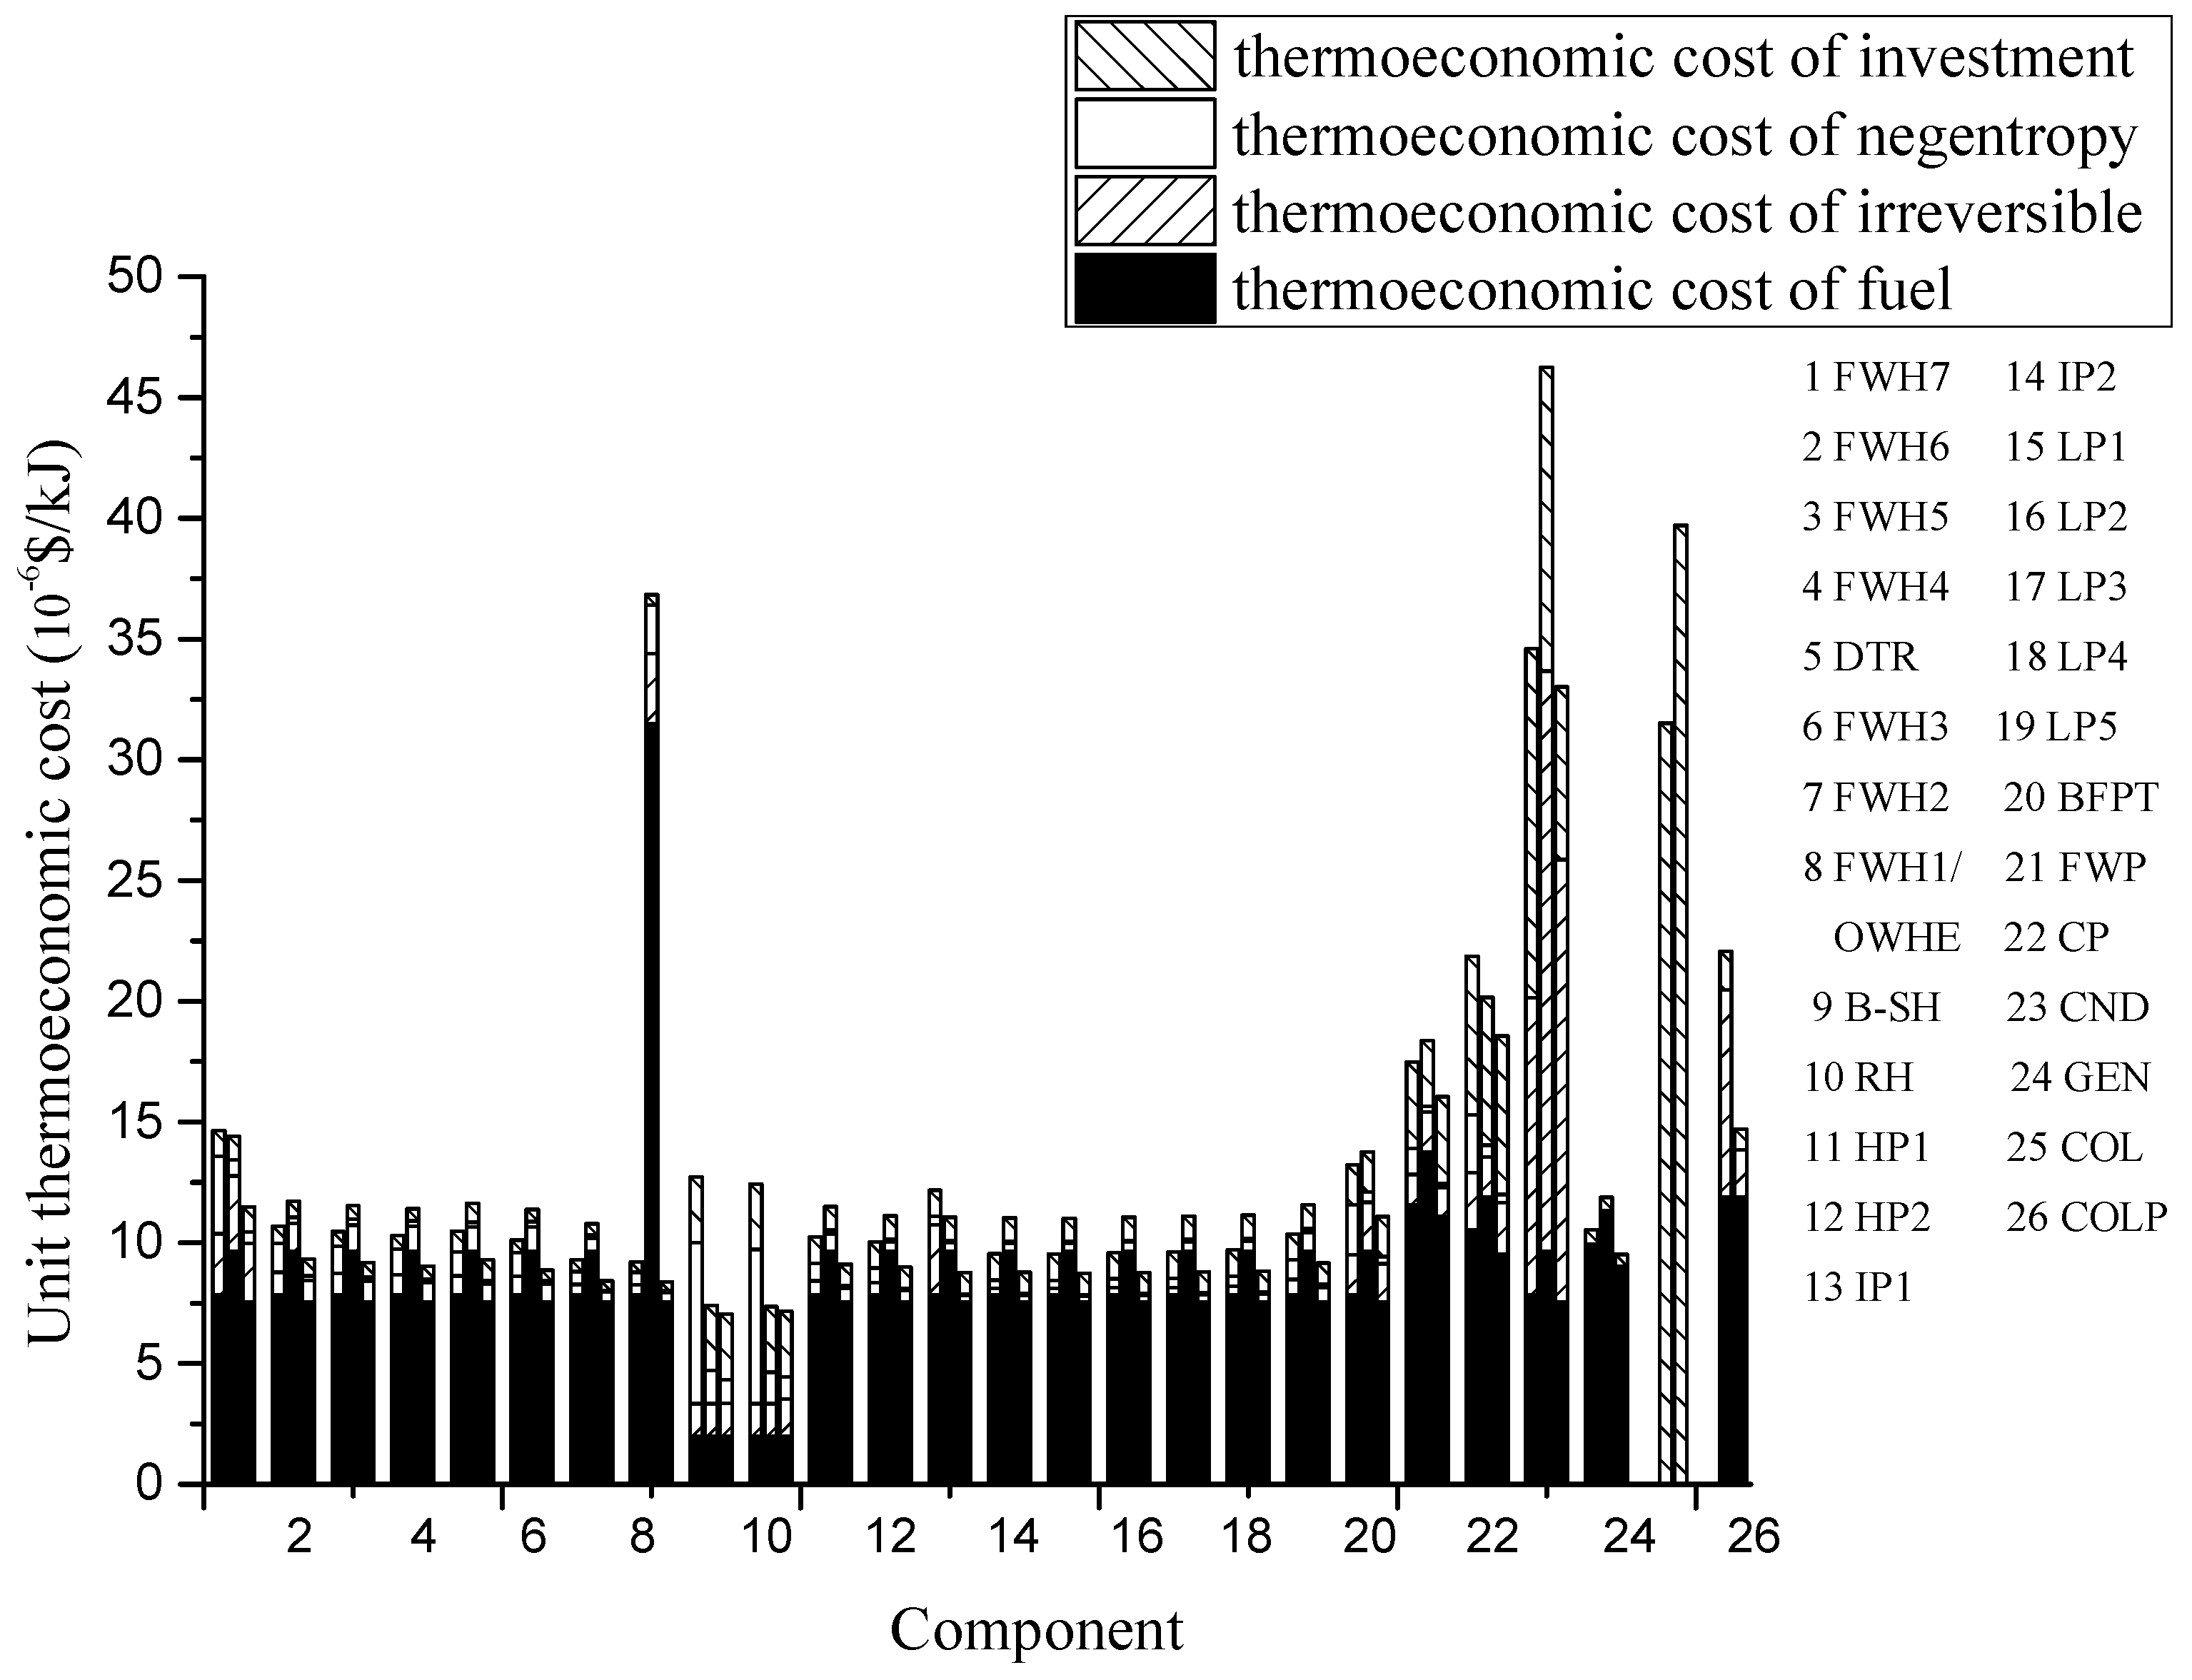
4.2.2. Thermo-Economic Cost

The investment percentage of the solar-collector subsystem, MEA-based CO2 capture subsystem and coal-fired power-generation subsystem in PG-CC, SA-PG-CC and SA-CC-PG is shown in Figure 12. Compared with PG-CC, the investment in the solar-collector subsystem in SA-PG-CC and SA-CC-PG increased. For SA-PG-CC, investment in the solar-collector subsystem accounts for 23%, while for SA-CC-PG it was 58% due to the larger size of the collector field.
Table 9 shows the main results of the thermo-economic cost model analysis for the PG-CC, SA-PG-CC and SA-CC-PG systems. Detailed results are given in Appendix E. Compared withPG-CC, the unit thermo-economic cost of electricity in SA-PG-CC was slightly increased, while the unit thermo-economic cost of CO2 remained constant. For SA-CC-PG, the unit thermo-economic cost of electricity was slightly decreased, but the unit thermo-economic cost of CO2 increased significantly.
In SA-PG-CC, both the power and efficiency of the system increased, but the system investment also increased, especially for the solar-collector field. Therefore, the unit thermo-economic cost of electricity slightly increased in SA-PG-CC.
In SA-CC-PG, the heat required by the stripper reboiler was provided by solar thermal. To meet the reboiler heat load, a significant increase in the solar-collector field area was required. This led to a large increase in the unit thermo-economic cost of CO2, of which 82.25% comprised solar-collector subsystem investment. In this system, more steam can be used for power generation, thus increasing power output. As a result, the unit thermo-economic cost of electricity slightly decreased.
The thermo-economic cost composition of each component in the PG-CC, SA-PG-CC and SA-CC-PG systems is shown in Figure 13, and is divided into four parts: fuel, irreversibility, negentropy and non-energy cost. The thermo-economic costs of components were mainly composed of fuel costs, in addition to the boiler, condenser and solar-collector field. For the boiler, the thermo-economic costs of negentropy and investment were also large, due to the entropy increase caused by combustion and heat transfer and equipment investment. For the condenser, the working fluid was returned to the initial state of the thermal cycle and the remaining exergy carried by the working fluid was discharged, resulting in a large number of irreversible losses. Therefore, the thermo-economic costs of the condenser mainly consisted of irreversibility. For the solar-collector field, solar thermal is considered to be free, so the very large thermo-economic cost is due to the enormous investment.
In comparison with the PG-CC system, the thermo-economic cost of components in the power-generation subsystem increased in SA-PG-CC because of the large thermo-economic cost of solar energy system. The thermo-economic cost of electricity in SA-PG-CC increased by 12.71%.
Compared with PG-CC, the system power output increased with the same power-generation subsystem in SA-CC-PG, so that each component of thermo-economic cost in the power-generation subsystem decreased. The thermo-economic cost of electricity in SA-CC-PG decreased by 9.77%.
Equation (12) was used to calculate the unit thermo-economic cost of CO2, considering the energy-cost and the non-energy cost in the CO2 capture process and reflecting the thermodynamic performance and economic performance. The high proportion represented by the solar-collector subsystem investment causes the great increase in the unit thermo-economic cost of CO2 in SA-CC-PG compared with the other systems.

4.2.3. Levelized Cost of Electricity

The levelized cost of electricity of three configuration systems are shown in Table 10. The LCOE of PG-CC, SA-PG-CC and SA-CC-PG are 83.32 $/MWh, 98.23 $/MWh and 165.82 $/MWh, respectively. In the thermo-economic analysis, the thermo-economic cost of electricity and CO2 are calculated separately. The investments of solar energy subsystem are distributed into electricity or CO2 according to the utilization of solar thermal. In the LCOE analysis, the total system costs appear in the LCOE. Although there is not much difference in the efficiency of the systems (42.35% in SA-PG-CC and 42.21% in SA-CC-PG), the required solar thermal energy is higher in SA-CC-PG. The share of solar exergy is 13.83% in SA-CC-PG, which is 3.45% in SA-PG-CC, and the equivalent solar-power generation efficiency is 49.4% in SA-CC-PG and 78.5% in SA-PG-CC. Therefore, the high-cost solar-collector field area is significantly increased in SA-CC-PG, causing a higher total capital requirement for SA-CC-PG (3235.9 M$ for SA-PG-CC and 5874.84 M$ for SA-CC-PG). There is less difference in the power output of the system, which is 895.9 MW for SA-PG-CC and 1000.7 MW for SA-CC-PG. Thus, there is a much higher LCOE for the SA-CC-PG system than for the SA-PG-CC system. This result also indicates the necessity of reducing the solar collector field cost for the large-scale use of solar thermal energy. In the PG-CC, the static capital payback period is 16 years if the electricity price is 14 cents, and 11 years if the electricity price is 16 cents. In the SA-PG-CC, the LCOE increased slightly after the introduction of solar thermal energy. The static capital payback period is 29 years if the electricity price is 14 cents and 16 years if the electricity price is 16 cents. In the SA-CC-PG, the LCOE is greatly increased and is not profitable until the electricity price reaches 16.6 cents.

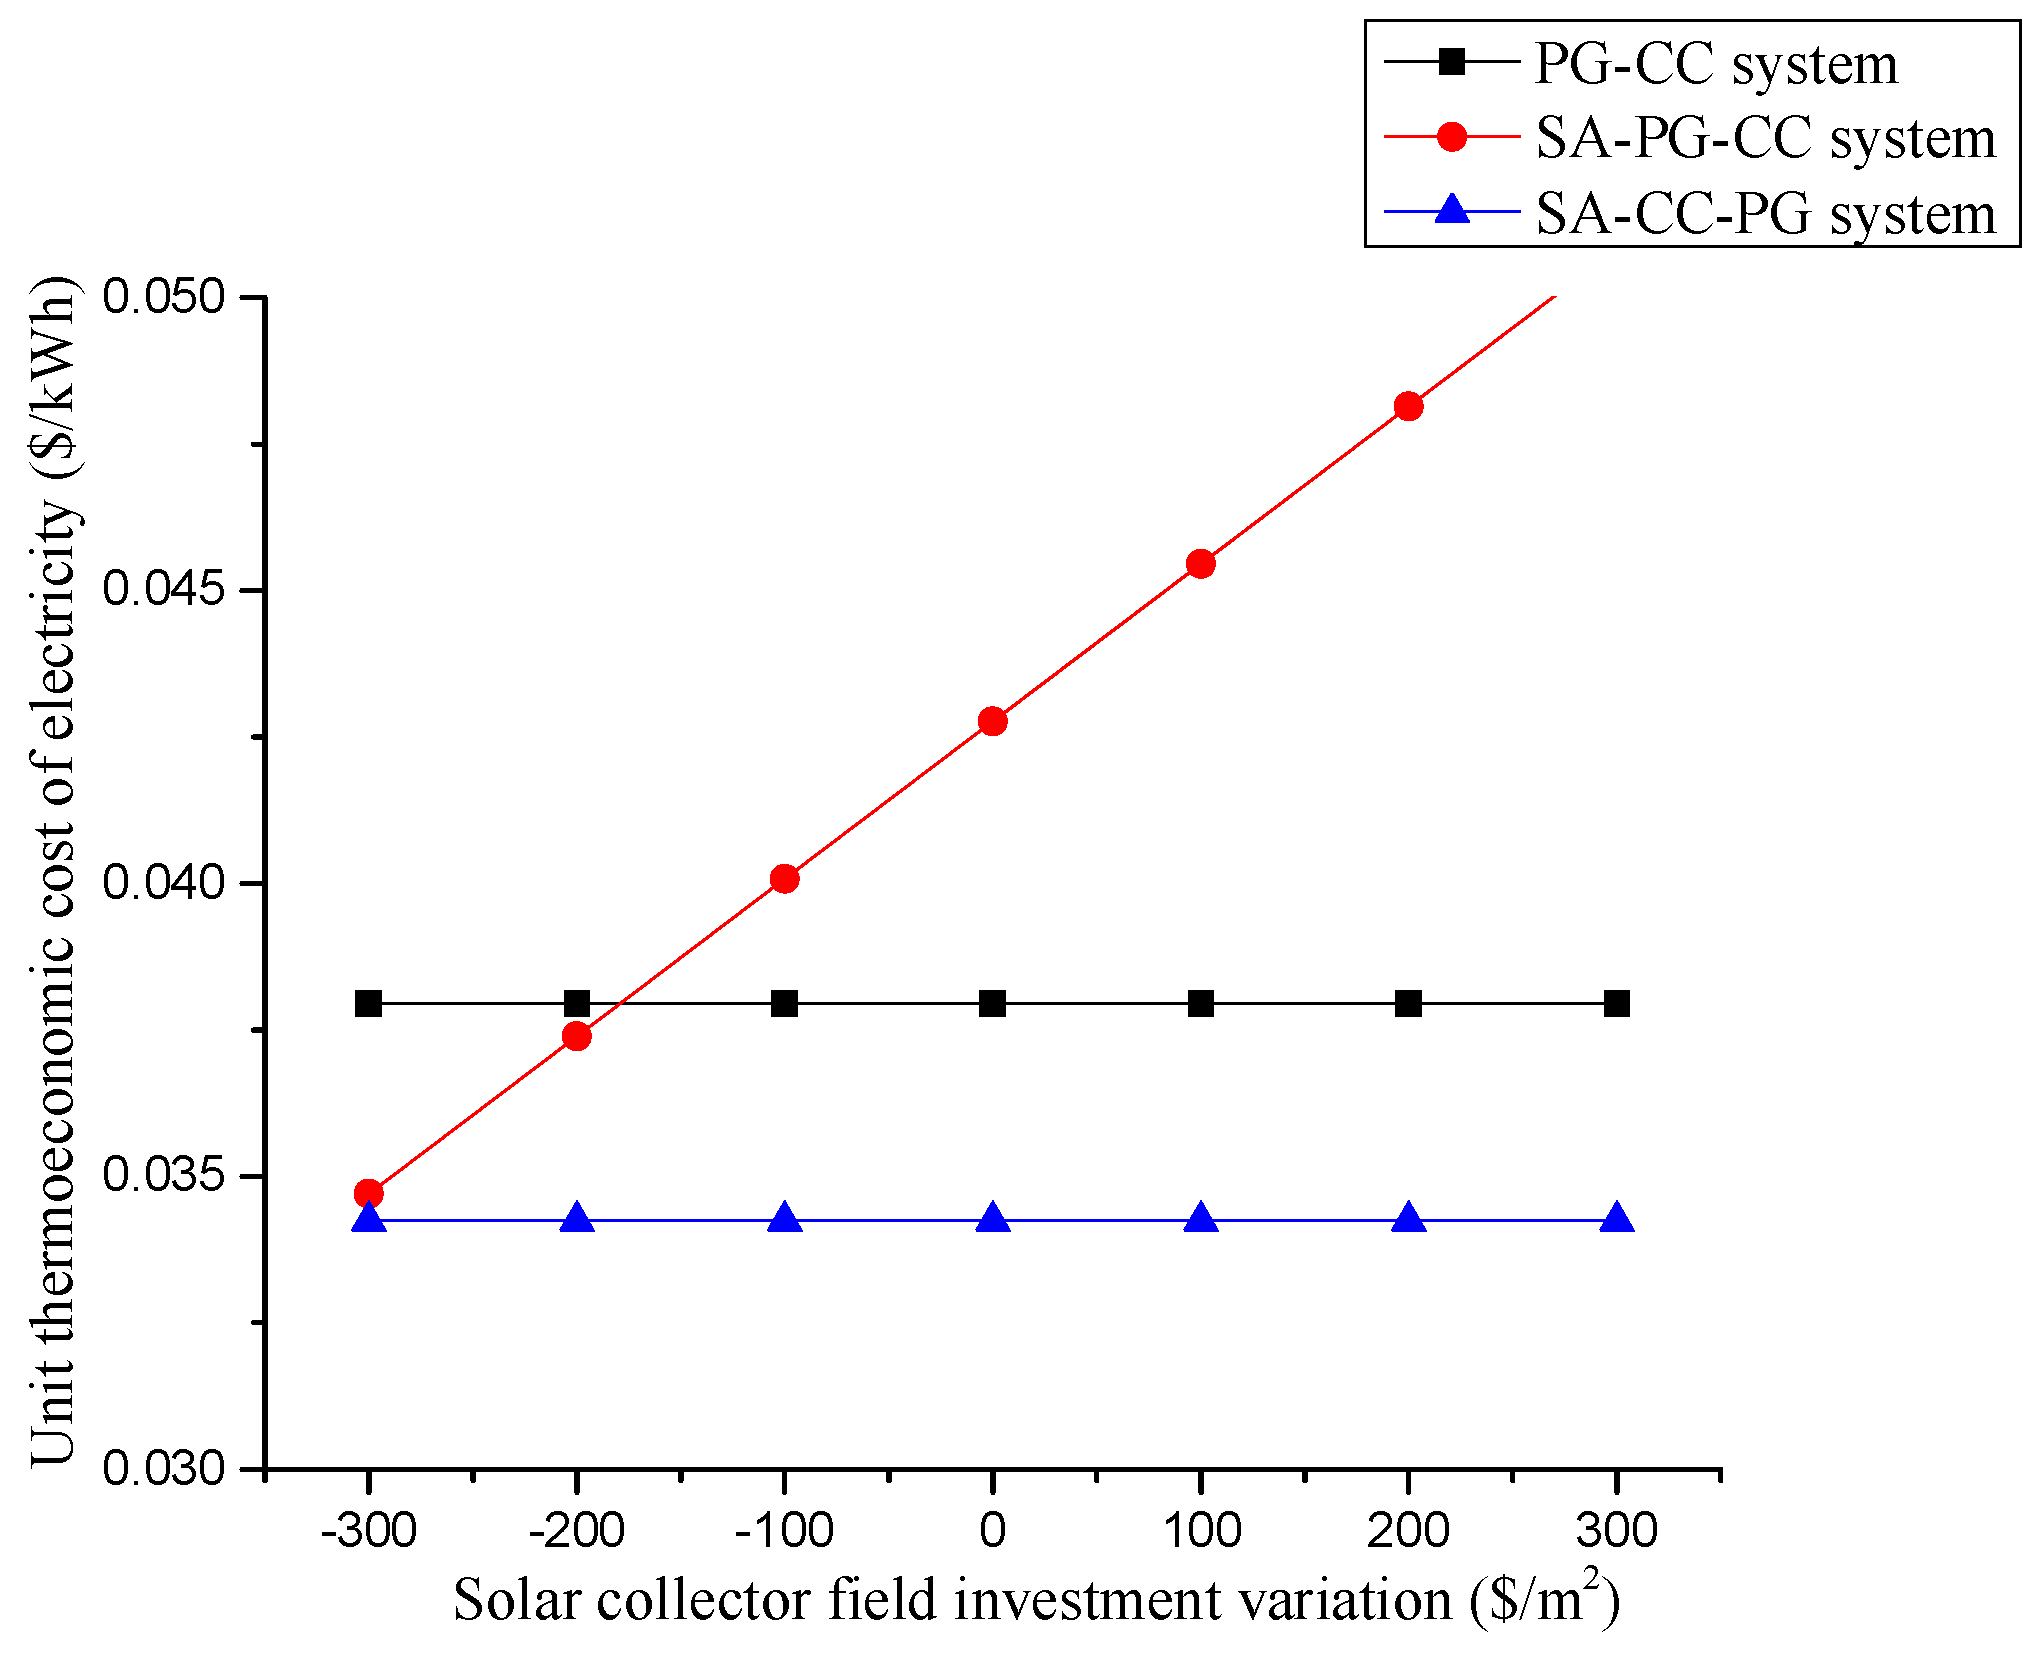
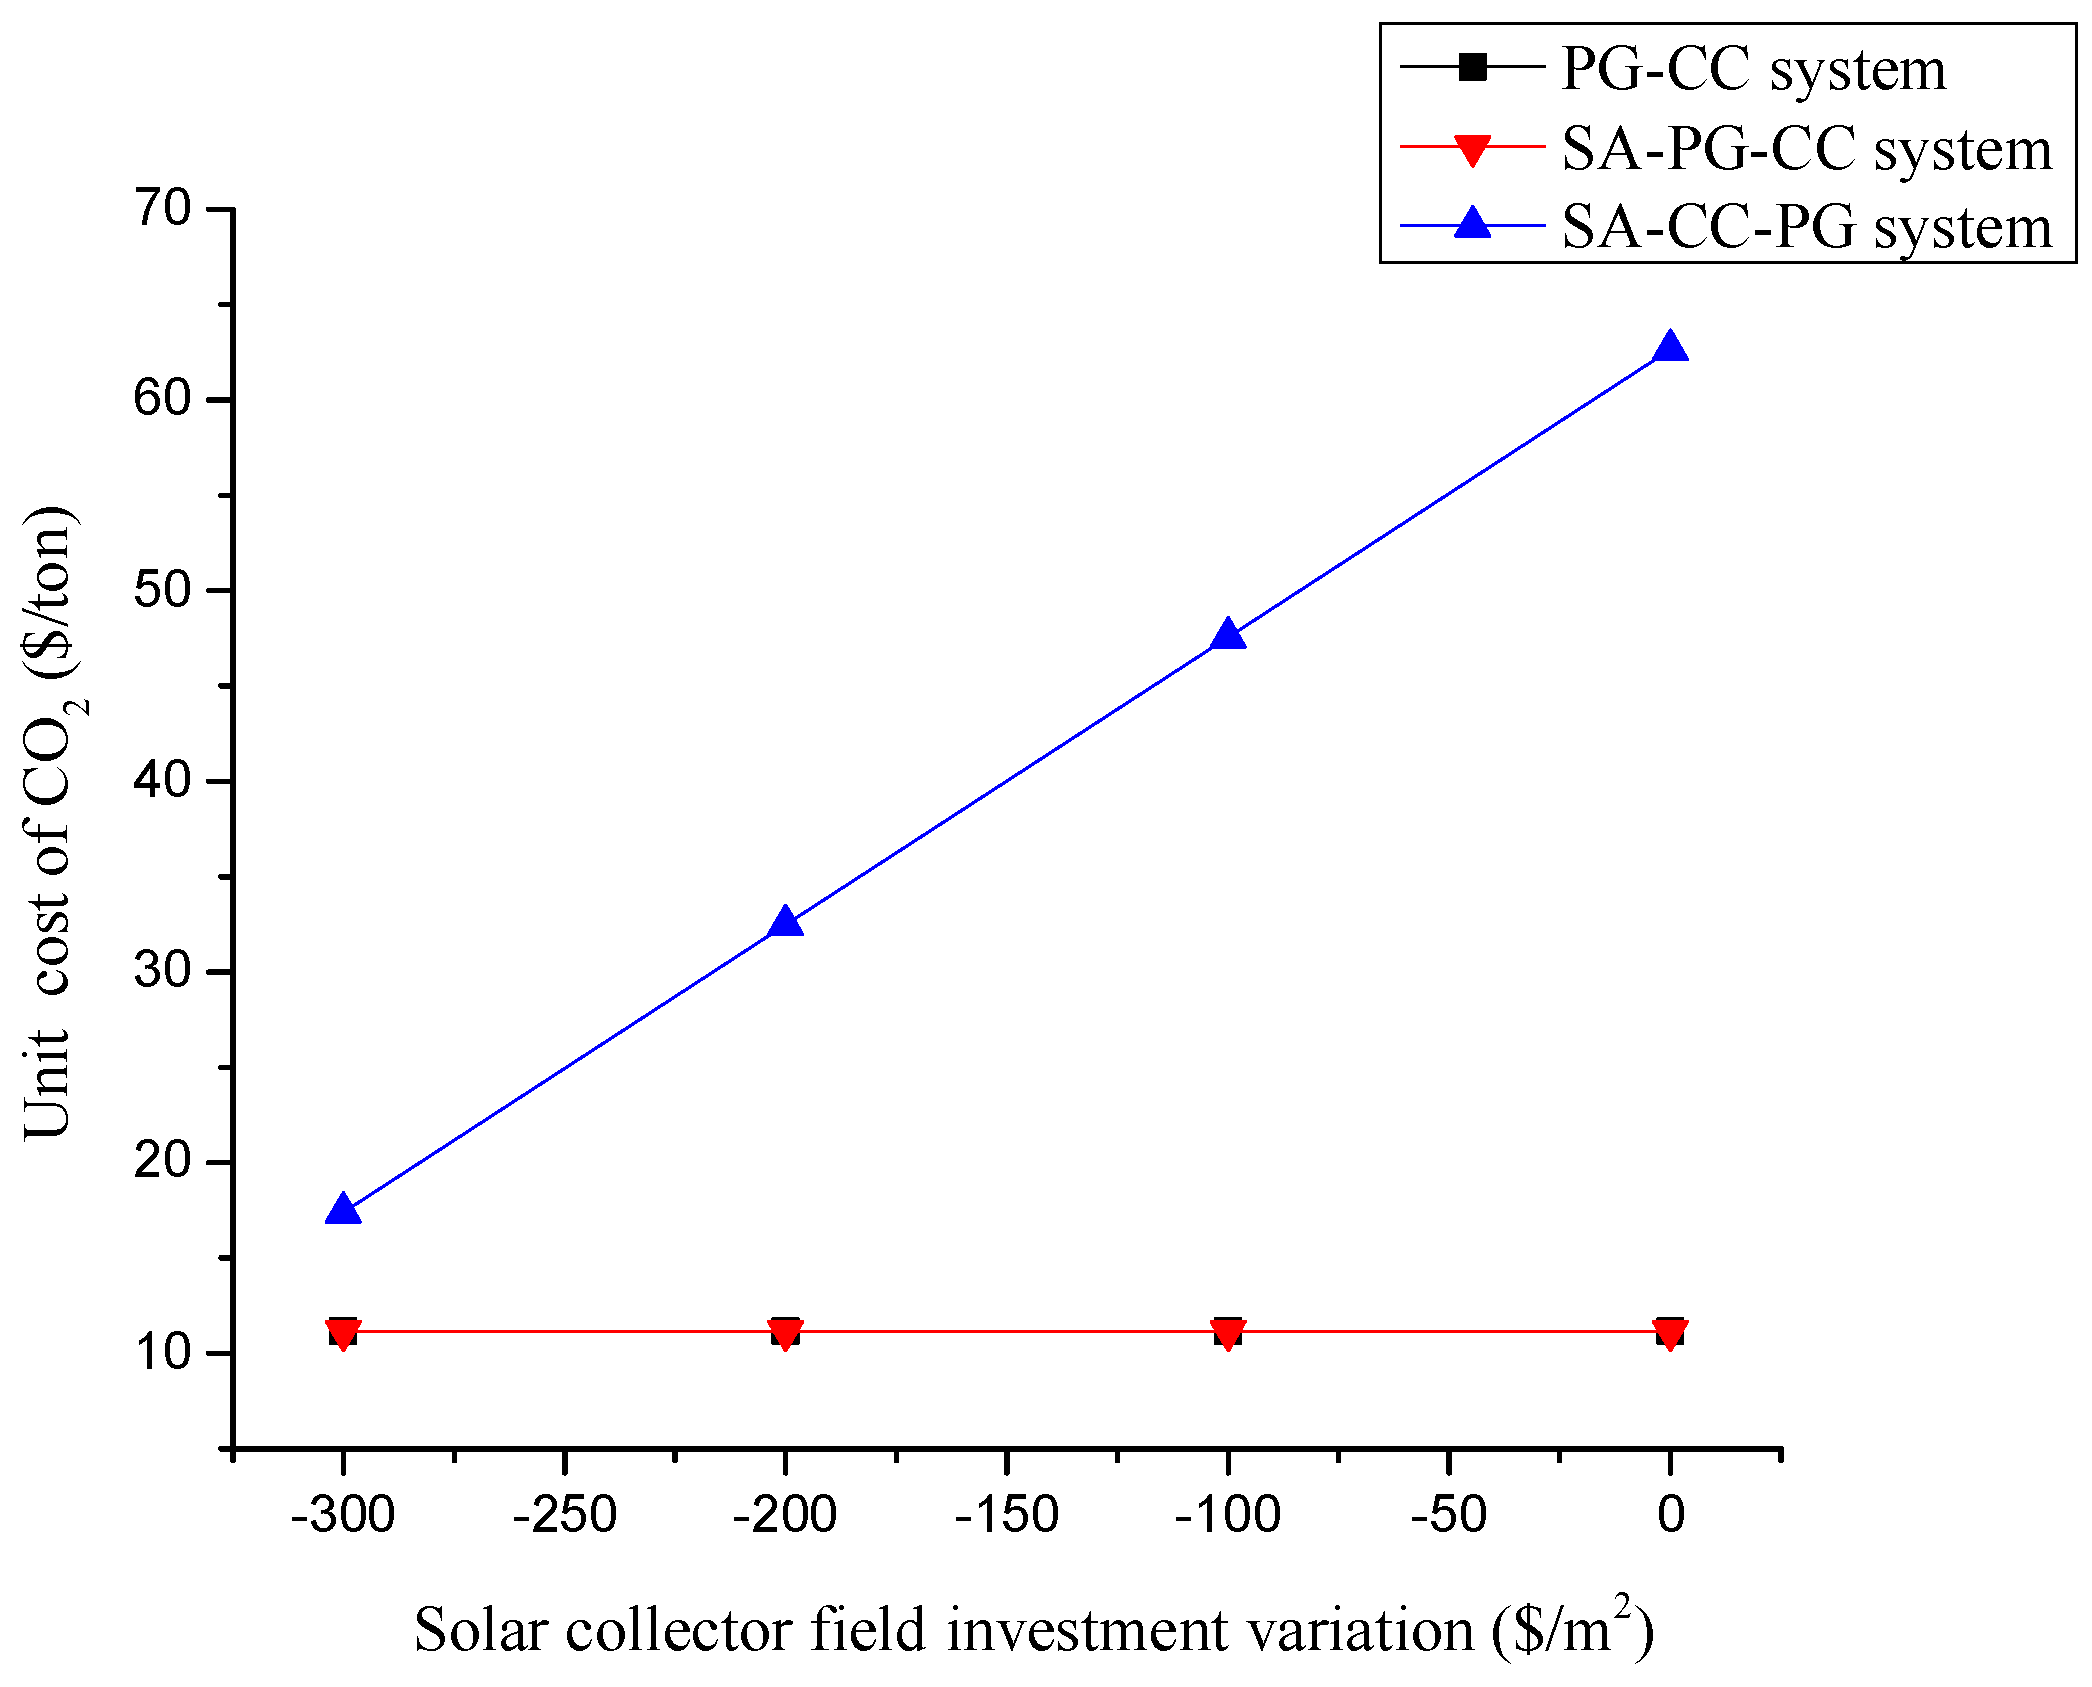
4.2.4. Sensitivity Analysis

The unit thermo-economic cost of electricity and CO2 are greatly influenced by solar-collector field investment. In this section, we discuss the influence of solar-collector field investment, and the results are shown in Figure 14 and Figure 15. Unit solar-collector field investment is taken as $308/m2 in this study, and varies within a range of plus and minus $300/m2.
The unit thermo-economic cost of electricity in SA-PG-CC is equal to that in PG-CC when the unit solar-collector field investment is reduced by $179.4/m2 to $128.6/m2 (Figure 14). The unit thermo-economic cost of electricity in SA-CC-PG is smaller than in PG-CC and SA-PG-CC.
In contrast to solar-collector field investment, the unit cost of CO2 in PG-CC is equal to that in SA-PG-CC, and is positively correlated with solar-collector field investment in SA-CC-PG (Figure 15).
In SA-CC-PG, the solar exergy and the corresponding thermo-economic cost are introduced in the CO2 capture process so that the thermo-economic cost of electricity is not affected. In SA-PG-CC, the solar exergy and the thermo-economic cost flow into the power generation process; therefore, the unit cost of CO2 remains constant and the thermo-economic cost of electricity changes. The solar-collector field investment assumes a significant proportion in the whole system and influences the thermo-economic cost of electricity greatly in SA-PG-CC and the unit cost of CO2 in SA-CC-PG. To promote the exergy efficiency of solar field and reduce the investment, improving the design of the technology is necessary for the effective utilization of solar thermal energy.

5. Conclusions

In this paper, we analysed PG-CC, SA-PG-CC and SA-CC-PG systems based on the thermo-economics theory. Our conclusions are as follows:
  • Both SA-PG-CC and SA-CC-PG systems have greater power generation than the PG-CC system, and greater system efficiency. Compared with PG-CC, the coal consumption rate of SA-PG-CC and SA-CC-PG fell by 15.31 and 51.41 g/kWh, respectively. In this research, only the first high-pressure extraction steam was replaced by solar thermal. The other extraction steam can also be replaced with more solar thermal energy. The higher equivalent solar-power generation efficiency in SA-PG-CC indicates that the solar thermal energy is more fully used in SA-PG-CC system than in SA-CC-PG; therefore, the SA-PG-CC is a better configuration than SA-CC-PG.
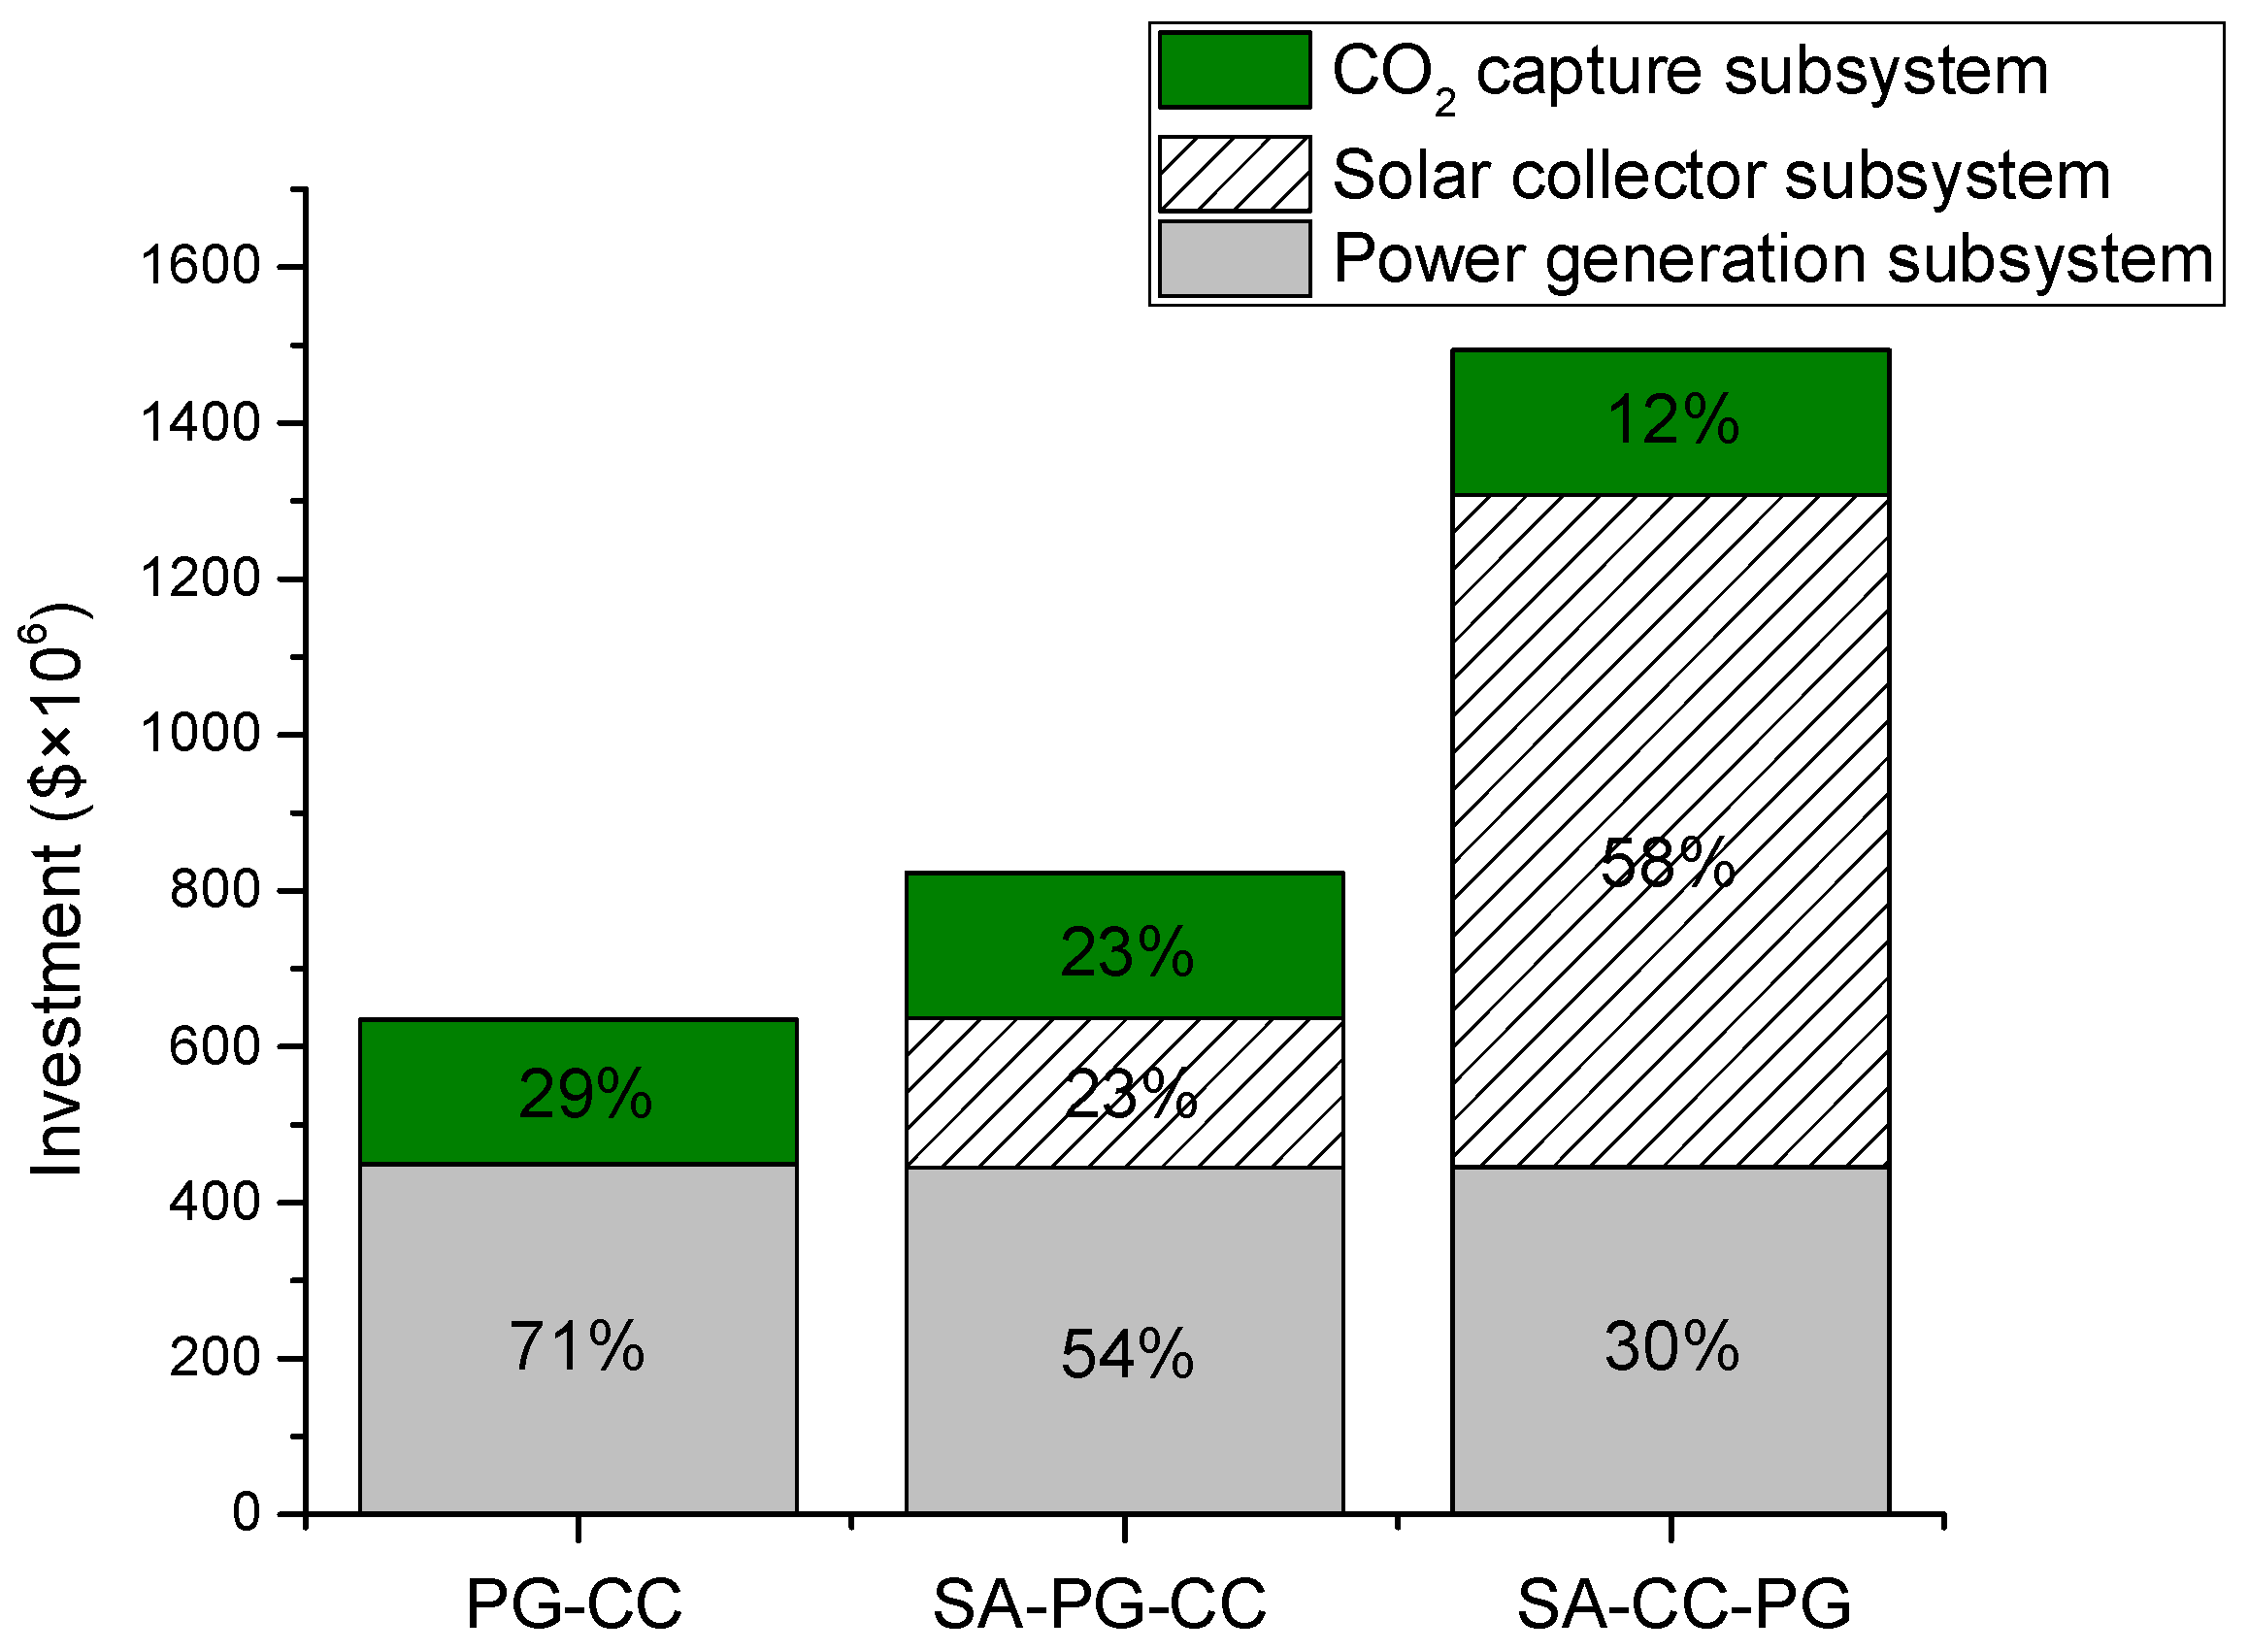
  • In SA-PG-CC, the additional exergy cost of the solar-collector subsystem was distributed to other components in the power-generation process. Therefore, the unit exergy cost of each component increased slightly compared with PG-CC, and the unit exergy cost of the electricity increased by 13.2%. SA-CC-PG had a greater amount of power generation than PG-CC, and therefore slightly lower unit exergy costs of electricity and coal combustion rate in SA-CC-PG. However, the increased low-pressure steam also increased the exergy cost of other components. In SA-CC-PG, the heat required for the stripper reboiler is provided by solar thermal with higher exergy cost. Therefore, the unit exergy cost of CO2 in SA-CC-PG was significantly greater than in PG-CC and SA-PG-CC.
  • Compared with PG-CC, the thermo-economic cost of electricity increased by 12.71% in SA-PG-CC and decreased by 9.77% in SA-CC-PG. The unit thermo-economic cost of CO2 was much higher in SA-CC-PG because of the large thermo-economic cost of solar thermal energy.
  • The increased solar thermal energy improved the efficiency of the system in SA-PG-CC compared to PG-CC, indicating a high efficiency of solar exergy to electricity in this integration. The increased exergy cost shows the great exergy loss of the solar field. The increase of the unit thermo-economic cost of electricity indicates the enormous investment in solar fields. Therefore, to improve the thermo-economic performance of the solar energy system, the exergy efficiency of the solar field should be promoted and investment should be reduced.
  • Only two integration configurations are studied in this research, and there might be better methods for the integration of solar energy systems and CO2 capture processes in coal-fired power plants. Using a general approach to optimize the solar thermal energy distribution in power generation and CO2 capture process could be studied in future research.

Author Contributions

Rongrong Zhai conceived the models of related systems; Rongrong Zhai and Hongtao Liu calculated and analyzed financial data together; Rongrong Zhai, Hongtao Liu and Hao Wu wrote the manuscript, Rongrong Zhai, Hongtao Liu and Yongping Yang revised the manuscript; and Hai Yu helped in English modification. All authors agreed on the final version of the manuscript.

Funding

The research work is supported by the National Basic Research Program of China (No. 2015CB251505), China National Natural Science Foundation (No. 51106048), and the Fundamental Research Funds for the Central Universities and 111 Project (B12034).

Conflicts of Interest

The authors declare no conflict of interest.

Nomenclature

SymbolMeaningUnit
ATotal net aperture area of solar collector fieldm2
BExergy flowkW
B*External exergy consumed for the productkW
c P Unit thermo-economic cost$/kJ
c F B Thermo-economic cost of fuel$/kJ
c I Thermo-economic cost caused by irreversible$/kJ
c N Thermo-economic cost caused by negentropy$/kJ
c Z The thermo-economic cost caused by investment$/kJ
DNISolar direct normal irradiationW/m2
E c o a l Coal exergykW
FFlue flowkJ
PProduct flowkJ
FBExergy fuelkW
FSNegentropy fuelkW
k*Unit exergy costkW/kW
kBFuel exergy of unit of productkW/kW
kIIrreversible exergy lost of unit productionkW/kW
kSNegentropy fuel of unit of productkW/kW
KZCapital costs of unit production$/kJ
IIrreversible exergy loss of productionkW/kW
ZNon-energy costs of the component$
c F Energy costs of the component$/kJ
iComponent number of input flow-
jComponent number of output flow-
η r e m o v a l CO2 removal ratio
η l o a d CO2 loading ratio

Appendix A

Table A1. Abbreviations and Components.
IDAbbreviationComponent
1–4,6–8FWHFeed-water heater
8OWHEOil–water heat exchanger
5DTRDeaerator
9SHBoiler superheater
10RHReheater
11,12HPHigh-pressure turbine
13,14IPIntermediate-pressure turbine
15–19LPLow-pressure turbine
20BFPTFeed-water pump turbine
21FWPFeed-water pump
22CPCondenser water pump
23CNDCondenser
24GENGenerator
25COLCollector
26COLPCollector oil-pump
27CCSMEA-based CO2 capture subsystem

Appendix B

Table A2. Investment of Each Component [48,66].
IDComponentPG-CC ($)SA-PG-CC ($)SA-CC-PG ($)
1FWH71,871,6921,871,6921,855,075
2FWH6884,416884,416876,554
3FWH5934,189934,189925,895
4FWH4862,262862,262854,604
5DTR1,886,0611,886,0611,886,061
6FWH31,752,0921,735,7061,485,249
7FWH22,649,1152,637,0522,245,656
8FWH1/OWHE2,427,6352,456,0822,057,915
9SH224,373,329220,422,356223,888,459
10RH52,032,17655,983,14952,517,046
11HP120,010,30317,572,40516,317,348
12HP28,301,8117,979,1656,769,733
13IP111,829,99411,362,5249,646,736
14IP211,629,11111,169,9929,482,927
15LP17,420,3857,142,7146,050,932
16LP26,633,4236,386,4935,409,206
17LP34,200,1764,218,2485,598,987
18LP42,408,2512,578,1644,951,836
19LP54,309,7194,756,45010,433,958
20BFPT3,902,1953,902,1953,902,195
21FWP7,641,7997,641,7997,641,799
22CP357,701357,701357,701
23CND29,835,53529,835,53529,835,535
24GEN40,647,86840,647,86840,647,868
25COL-191,624,287862,309,293
26COLP-64016401
27CCS186,025,000186,025,000186,025,000

Appendix C

Table A3. Investment of Each Component in the MEA-Based CO2 Capture Subsystem [67,68,69].
Component500-MW CO2 Capture System ($)1000-MW CO2 Capture System ($)
Flue gas blower2,172,0003,291,000
Absorber30,690,00046,516,000
Rich solution pump4,480,0006,789,000
Lean/rich solution heat exchanger2,175,0003,295,000
Lean solution cooler3,684,0005,583,000
Stripper16,410,00024,873,000
Reboiler10,180,00015,429,000
Circulating water pump3,684,0005,583,000
Drying and compression device32,217,61654,128,000
MEA solution13,850,00017,113,000
Corrosion inhibitor2,771,0003,425,000

Appendix D

Table A4. Results of Exergy Cost (kW/kW) in the PG-CC, SA-PG-CC and SA-CC-PG Systems.
IDComponentPG-CCSA-PG-CCSA-CC-PG
k P * k F B * k I * k N * k P * k F B * k I * k N * k P * k F B * k I * k N *
1FWH72.621.910.620.092.992.180.710.102.641.930.630.08
2FWH62.171.910.230.032.482.180.260.042.191.930.230.03
3FWH52.161.910.220.032.472.180.250.032.181.930.220.03
4FWH42.141.910.210.032.452.180.230.032.161.930.210.03
5DTR2.131.910.190.032.442.180.220.032.151.930.190.03
6FWH32.121.910.190.032.442.180.230.032.151.930.190.03
7FWH22.031.910.100.012.332.180.130.022.051.930.110.01
8FWH1/OWHE2.021.910.100.016.675.840.530.302.051.930.100.01
9SH1.851.000.670.181.871.000.670.201.851.000.680.18
10RH1.841.000.670.171.861.000.670.201.921.000.760.17
11HP12.071.910.140.022.372.180.160.022.101.930.150.02
12HP22.051.910.120.022.292.180.090.022.071.930.120.02
13IP12.631.910.710.012.282.180.080.012.011.930.070.01
14IP21.991.910.070.012.272.180.080.012.021.930.080.01
15LP11.991.910.070.012.272.180.080.012.011.930.070.01
16LP21.991.910.070.012.282.180.080.012.011.930.070.01
17LP31.991.910.070.012.292.180.090.012.021.930.080.01
18LP42.011.910.090.012.302.180.100.012.031.930.090.01
19LP52.091.910.160.022.392.180.180.022.111.930.160.02
20BFPT2.371.910.400.062.712.180.460.062.391.930.410.05
21FWP2.662.370.260.033.122.750.330.042.682.390.260.03
22CP3.052.430.550.063.222.750.390.072.612.080.470.06
23CND4.891.912.970.005.522.183.330.004.701.932.770.00
24GEN2.432.400.030.002.752.720.030.002.082.050.020.00
25COL----5.841.004.840.007.351.006.350.00
26COLP----4.742.752.110.003.222.750.460.00

Appendix E

Table A5. Results of Thermo-Economic Cost ($/kJ) in the PG-CC, SA-PG-CC and SA-CC-PG Systems.
PG-CCSA-PG-CCSA-CC-PG
IDComponent c P c F B c I c N c Z c P c F B c I c N c Z c P c F B c I c N c Z
1FWH714.647.842.543.211.0514.419.653.130.660.9811.487.542.440.461.04
2FWH610.707.840.941.190.7211.729.651.160.240.679.337.540.910.170.71
3FWH510.477.840.891.120.6111.549.651.090.230.579.177.540.850.170.61
4FWH410.297.840.841.060.5411.419.651.040.220.519.047.540.810.150.54
5DTR10.487.840.790.990.8511.649.650.990.210.799.297.540.760.140.85
6FWH310.107.840.770.970.5211.399.651.010.210.528.867.540.740.150.43
7FWH29.297.840.430.540.4710.799.650.550.120.488.437.540.410.080.40
8FWH1/OWHE9.217.840.410.520.4436.8331.512.882.000.448.387.540.400.080.36
9SH12.722.001.336.682.717.412.001.341.372.707.022.001.360.972.69
10RH12.442.001.336.392.717.352.001.341.312.707.162.001.510.932.72
11HP110.247.840.580.731.0811.499.650.730.150.979.107.540.570.110.88
12HP210.037.840.500.611.0811.119.650.380.120.978.997.540.480.090.88
13IP112.187.842.900.351.0811.059.650.370.070.978.767.540.290.050.88
14IP29.547.840.280.341.0811.029.650.340.070.978.787.540.300.060.88
15LP19.527.840.280.321.0811.029.650.340.070.978.747.540.270.050.88
16LP29.597.840.300.361.0811.069.650.370.070.978.777.540.290.050.89
17LP39.617.840.300.381.0811.109.650.410.080.978.807.540.320.060.88
18LP49.707.840.350.421.0811.149.650.440.090.978.827.540.340.060.88
19LP510.377.840.640.801.0811.579.650.790.160.979.167.540.620.120.88
20BFPT13.227.841.652.071.6613.769.652.030.421.6611.087.541.590.301.65
21FWP17.5011.551.281.073.6018.3613.761.660.242.7116.0511.081.220.153.60
22CP21.8510.542.372.396.5620.1611.881.680.496.1218.569.512.140.356.56
23CND34.607.8412.300.0014.4636.929.6524.010.0012.5925.637.5418.320.007.15
24GEN10.549.830.120.000.5811.8811.200.130.000.549.518.920.110.000.48
25COL-----31.510.000.000.0031.5139.700.000.000.0039.70
26COLP-----22.0811.888.580.001.6214.7111.881.990.000.84

References

  1. Rogelj, J.; den Elzen, M.; Hohne, N.; Fransen, T.; Fekete, H.; Winkler, H.; Schaeffer, R.; Sha, F.; Riahi, K.; Meinshausen, M. Paris Agreement climate proposals need a boost to keep warming well below 2 degrees C. Nature 2016, 534, 631–639. [Google Scholar] [CrossRef] [PubMed] [Green Version]
  2. International Energy Agency (IEA). World Energy Outlook 2017; Organisation for Economic Co-operation and Development: Paris, France, 2017. [Google Scholar]
  3. International Energy Agency (IEA). Key World Energy Statistics; International Energy Agency: Paris, France, 2017. [Google Scholar]
  4. Karimi, F.; Khalilpour, R. Evolution of carbon capture and storage research: Trends of international collaborations and knowledge maps. Int. J. Greenh. Gas Control 2015, 37, 362–376. [Google Scholar]
  5. Li, K.; Yu, H.; Yan, S.; Feron, P.; Wardhaugh, L.; Tade, M. Technoeconomic Assessment of an Advanced Aqueous Ammonia-Based Postcombustion Capture Process Integrated with a 650-MW Coal-Fired Power Station. Environ. Sci. Technol. 2016, 50, 10746–10755. [Google Scholar] [CrossRef] [PubMed]
  6. Mumford, A.; Wu, Y.; Smith, H.; Geoffrey, S. Review of solvent based carbon-dioxide capture technologies. Front. Chem. Sci. Eng. 2015, 9, 125–141. [Google Scholar] [CrossRef]
  7. Zhao, S.; Feron, P.H.M.; Deng, L.; Favre, E.; Chabanon, E.; Yan, S.; Hou, J.; Chen, V.; Qi, H. Status and progress of membrane contactors in post-combustion carbon capture: A state-of-the-art review of new developments. J. Membr. Sci. 2016, 511, 180–206. [Google Scholar] [CrossRef]
  8. Theo, W.L.; Lim, J.S.; Hashim, H.; Mustaffa, A.A.; Ho, W.S. Review of pre-combustion capture and ionic liquid in carbon capture and storage. Appl. Energy 2016, 183, 1633–1663. [Google Scholar] [CrossRef]
  9. Li, K.; Leigh, W.; Feron, P.; Yu, H.; Tade, M. Systematic study of aqueous monoethanolamine (MEA)-based CO2 capture process: Techno-economic assessment of the MEA process and its improvements. Appl. Energy 2016, 165, 648–659. [Google Scholar] [CrossRef]
  10. Oh, S.-Y.; Binns, M.; Cho, H.; Kim, J.-K. Energy minimization of MEA-based CO2 capture process. Appl. Energy 2016, 169, 353–362. [Google Scholar] [CrossRef]
  11. Zhang, W.; Liu, H.; Sun, Y.; Cakstins, J.; Sun, C.; Snape, C.E. Parametric study on the regeneration heat requirement of an amine-based solid adsorbent process for post-combustion carbon capture. Appl. Energy 2016, 168, 394–405. [Google Scholar] [CrossRef]
  12. Final Report for the Project ‘Development of an Aqueous Ammonia-Based PCC Technology for Australian Conditions’. Available online: http://anlecrd.com.au/wp-content/uploads/2016/08/Aqueous-Ammonia-Final-Report.pdf (accessed on 9 October 2017).
  13. CO2 Capture Technologies—Post Combustion Capture (PCC). Available online: http://www.globalccsinstitute.com/publications/CO2-capture-technologies-post-combustion-capture-pcc (accessed on 9 October 2017).
  14. Petra Nova Carbon Capture. Available online: https://www.globalccsinstitute.com/projects/petra-nova-carbon-capture-project (accessed on 24 July 2017).
  15. Lemaire, E.; Bouillon, P.A.; Lettat, K. Development of HiCapt+ TM Process for CO2 Capture from Lab to Industrial Pilot Plant. Oil Gas Sci. Technol. Rev. IFP Energies Nouv. 2014, 69, 1069–1080. [Google Scholar] [CrossRef]
  16. Li, K.; Cousins, A.; Yu, H.; Feron, P.; Tade, M.; Luo, W.; Chen, J. Systematic study of aqueous monoethanolamine-based CO2capture process: Model development and process improvement. Energy Sci. Eng. 2016, 4, 23–39. [Google Scholar] [CrossRef]
  17. Øi, L.E.; Bråthen, T.; Berg, C.; Brekne, S.K.; Flatin, M.; Johnsen, R.; Moen, I.G.; Thomassen, E. Optimization of Configurations for Amine based CO2 Absorption Using Aspen HYSYS. Energy Procedia 2014, 51, 224–233. [Google Scholar] [CrossRef]
  18. Chen, E.; Zhang, Y.; Sachde, D.; Lin, Y.J.; Rochelle, G.T. Evaluated Pilot Plant Results for 5 m Piperazine with the Advanced Flash Stripper. 2015. Available online: http://ieaghg.org/docs/General_Docs/PCCC3_PDF/5_PCCC3_6_Chen.pdf (accessed on 9 October 2017).
  19. Jiang, K.; Li, K.; Yu, H.; Chen, Z.; Wardhaugh, L.; Feron, P. Advancement of ammonia based post-combustion CO2 capture using the advanced flash stripper process. Appl. Energy 2017, 202, 496–506. [Google Scholar] [CrossRef]
  20. Zhang, Y.; Ji, X.; Xie, Y.; Lu, X. Screening of conventional ionic liquids for carbon dioxide capture and separation. Appl. Energy 2016, 162, 1160–1170. [Google Scholar] [CrossRef]
  21. Kunze, A.-K.; Dojchinov, G.; Haritos, V.S.; Lutze, P. Reactive absorption of CO2 into enzyme accelerated solvents: From laboratory to pilot scale. Appl. Energy 2015, 156, 676–685. [Google Scholar] [CrossRef]
  22. Wang, X.; Akhmedov, N.G.; Hopkinson, D.; Hoffman, J.; Duan, Y.; Egbebi, A.; Resnik, K.; Li, B. Phase change amino acid salt separates into CO2-rich and CO2-lean phases upon interacting with CO2. Appl. Energy 2016, 161, 41–47. [Google Scholar] [CrossRef]
  23. Le Moullec, Y.; Kanniche, M. Screening of flowsheet modifications for an efficient monoethanolamine (MEA) based post-combustion CO2 capture. Int. J. Greenh. Gas Control 2011, 5, 727–740. [Google Scholar] [CrossRef]
  24. Ahn, H.; Luberti, M.; Liu, Z.; Brandani, S. Process configuration studies of the amine capture process for coal-fired power plants. Int. J. Greenh. Gas Control 2013, 16, 29–40. [Google Scholar] [CrossRef]
  25. Cousins, A.; Wardhaugh, L.T.; Feron, P.H.M. Preliminary analysis of process flow sheet modifications for energy efficient CO2 capture from flue gases using chemical absorption. Chem. Eng. Res. Des. 2011, 89, 1237–1251. [Google Scholar] [CrossRef]
  26. Cousins, A.; Wardhaugh, L.T.; Feron, P.H.M. A survey of process flow sheet modifications for energy efficient CO2 capture from flue gases using chemical absorption. Int. J. Greenh. Gas Control 2011, 5, 605–619. [Google Scholar] [CrossRef]
  27. Bui, M.; Gunawan, I.; Verheyen, V.; Feron, P.; Meuleman, E.; Adeloju, S. Dynamic modelling and optimisation of flexible operation in post-combustion CO2 capture plants—A review. Comput. Chem. Eng. 2014, 61, 245–265. [Google Scholar] [CrossRef]
  28. Bui, M.; Fajardy, M.; Mac Dowell, N. Bio-Energy with CCS (BECCS) performance evaluation: Efficiency enhancement and emissions reduction. Appl. Energy 2017, 195, 289–302. [Google Scholar] [CrossRef]
  29. Harkin, T.; Hoadley, A.; Hooper, B. Process integration analysis of a brown coal-fired power station with CO2 capture and storage and lignite drying. Energy Procedia 2009, 1, 3817–3825. [Google Scholar] [CrossRef]
  30. Harkin, T.; Hoadley, A.; Hooper, B. Reducing the energy penalty of CO2 capture and compression using pinch analysis. J. Clean. Prod. 2010, 18, 857–866. [Google Scholar] [CrossRef]
  31. Xu, G.; Hu, Y.; Tang, B.; Yang, Y.; Zhang, K.; Liu, W. Integration of the steam cycle and CO2 capture process in a decarbonization power plant. Appl. Therm. Eng. 2014, 73, 277–286. [Google Scholar] [CrossRef]
  32. Xu, G.; Huang, S.; Yang, Y.; Wu, Y.; Zhang, K.; Xu, C. Techno-economic analysis and optimization of the heat recovery of utility boiler flue gas. Appl. Energy 2013, 112, 907–917. [Google Scholar] [CrossRef]
  33. Hu, Y.; Xu, G.; Xu, C.; Yang, Y. Thermodynamic analysis and techno-economic evaluation of an integrated natural gas combined cycle (NGCC) power plant with post-combustion CO2 capture. Appl. Therm. Eng. 2017, 111, 308–316. [Google Scholar] [CrossRef]
  34. Pfaff, I.; Oexmann, J.; Kather, A. Optimised integration of post-combustion CO2 capture process in greenfield power plants. Energy 2010, 35, 4030–4041. [Google Scholar] [CrossRef]
  35. Liu, X.; Chen, J.; Luo, X.; Wang, M.; Meng, H. Study on heat integration of supercritical coal-fired power plant with post-combustion CO2 capture process through process simulation. Fuel 2015, 158, 625–633. [Google Scholar] [CrossRef]
  36. Wang, D.; Bao, A.; Kunc, W.; Liss, W. Coal power plant flue gas waste heat and water recovery. Appl. Energy 2012, 91, 341–348. [Google Scholar] [CrossRef]
  37. Bui, M.; Fajardy, M.; Mac Dowell, N. Bio-energy with carbon capture and storage (BECCS): Opportunities for performance improvement. Fuel 2018, 213, 164–175. [Google Scholar] [CrossRef]
  38. Mokhtar, M.; Ali, M.T.; Khalilpour, R.; Abbas, A.; Shah, N.; Hajaj, A.A.; Armstrong, P.; Chiesa, M.; Sgouridis, S. Solar-assisted Post-combustion Carbon Capture feasibility study. Appl. Energy 2012, 92, 668–676. [Google Scholar] [CrossRef]
  39. Zhao, Y.; Hong, H.; Zhang, X.; Jin, H. Integrating mid-temperature solar heat and post-combustion CO2-capture in a coal-fired power plant. Sol. Energy 2012, 86, 3196–3204. [Google Scholar] [CrossRef]
  40. Zhai, R.; Qi, J.; Zhu, Y.; Zhao, M.; Yang, Y. Novel system integrations of 1000 MW coal-fired power plant retrofitted with solar energy and CO2 capture system. Appl. Therm. Eng. 2017, 125, 1133–1145. [Google Scholar] [CrossRef]
  41. Wang, J.; Zhao, J.; Wang, Y.; Deng, S.; Sun, T.; Li, K. Application potential of solar-assisted post-combustion carbon capture and storage (CCS) in China: A life cycle approach. J. Clean. Prod. 2017, 154, 541–552. [Google Scholar] [CrossRef]
  42. Wang, F.; Zhao, J.; Li, H.; Deng, S.; Yan, J. Preliminary experimental study of post-combustion carbon capture integrated with solar thermal collectors. Appl. Energy 2017, 185, 1471–1480. [Google Scholar] [CrossRef]
  43. Rezazadeh, F.; Gale, W.F.; Lin, Y.-J.; Rochelle, G.T. Energy Performance of Advanced Reboiled and Flash Stripper Configurations for CO2 Capture Using Monoethanolamine. Ind. Eng. Chem. Res. 2016, 55, 4622–4631. [Google Scholar] [CrossRef]
  44. Liu, L.; Zhao, J.; Deng, S.; An, Q. A technical and economic study on solar-assisted ammonia-based post-combustion CO2 capture of power plant. Appl. Therm. Eng. 2016, 102, 412–422. [Google Scholar] [CrossRef]
  45. Lassagne, O.; Iliuta, M.C.; Gosselin, L.; Désilets, M. Techno-economic assessment of CO2capture from aluminum smelter emissions using PZ activated AMP solutions. Can. J. Chem. Eng. 2016, 94, 761–770. [Google Scholar] [CrossRef]
  46. Raksajati, A.; Ho, M.T.; Wiley, D.E. Techno-economic Evaluation of CO2 Capture from Flue Gases Using Encapsulated Solvent. Ind. Eng. Chem. Res. 2017, 56, 1604–1620. [Google Scholar] [CrossRef]
  47. Gao, J.; Yin, J.; Zhu, F.; Chen, X.; Tong, M.; Kang, W.; Zhou, Y.; Lu, J. Environmental Effects Comparison of absorption and regeneration performance for post-combustion CO2 capture by mixed MEA solvents. Energy Sources Part A 2016, 38, 2530–2535. [Google Scholar] [CrossRef]
  48. Zhai, R.; Liu, H.; Li, C.; Zhao, M.; Yang, Y. Analysis of a solar-aided coal-fired power generation system based on thermo-economic structural theory. Energy 2016, 102, 375–387. [Google Scholar] [CrossRef]
  49. Lozano, M.A.; Valero, A. Theory of the exergetic cost. Energy 1993, 18, 939–960. [Google Scholar] [CrossRef]
  50. Chao, Z. Thermoeconomic Analysis and Optimization of Complex Energy Systems. Ph.D. Thesis, Huazhong University of Science and Technology, Wuhan, China, 2006. (In Chinese). [Google Scholar]
  51. Tsatsaronis, G. Thermoeconomic analysis and optimization of energy systems. Prog. Energy Combust. Sci. 1993, 19, 227–257. [Google Scholar] [CrossRef]
  52. Booras, G.; Davison, J.; Ekstrom, C.; Matuszewski, M.; Short, C. Toward a Common Method of Cost Estimation for CO2 Capture and Storage at Fossil Fuel Power Plants; Global CCS Institute: Docklands, Australia, 2013. [Google Scholar]
  53. Ehlers, S.; Roeder, V.; Liebenthal, U.; Kather, I.A. Techno Economic Evaluation Different Post Combustion CO2 Capture Process Flow Sheet; Hamburg University of Technology: Hamburg, Germany, 2014. [Google Scholar]
  54. Valero, A.; Serra, L.; Uche, J. Fundamentals of Exergy Cost Accounting and Thermoeconomics. Part II: Applications. J. Energy Resour. Technol. 2006, 128, 9–15. [Google Scholar] [CrossRef]
  55. Han, Y.; Xu, G.; Zheng, Q.; Xu, C.; Hu, Y.; Yang, Y.; Lei, J. New heat integration system with bypass flue based on the rational utilization of low-grade extraction steam in a coal-fired power plant. Appl. Therm. Eng. 2017, 113, 460–471. [Google Scholar] [CrossRef]
  56. Wang, L.; Yang, Y.; Dong, C.; Morosuk, T.; Tsatsaronis, G. Multi-objective optimization of coal-fired power plants using differential evolution. Appl. Energy 2014, 115, 254–264. [Google Scholar] [CrossRef]
  57. Gewald, D.; Karellas, S.; Schuster, A.; Spliethoff, H. Integrated system approach for increase of engine combined cycle efficiency. Energy Convers. Manag. 2012, 60, 36–44. [Google Scholar] [CrossRef]
  58. Burin, E.K.; Vogel, T.; Multhaupt, S.; Thelen, A.; Oeljeklaus, G.; Görner, K.; Bazzo, E. Thermodynamic and economic evaluation of a solar aided sugarcane bagasse cogeneration power plant. Energy 2016, 117, 416–428. [Google Scholar] [CrossRef]
  59. Al-Maliki, W.A.K.; Alobaid, F.; Kez, V.; Epple, B. Modelling and dynamic simulation of a parabolic trough power plant. J. Process Control 2016, 39, 123–138. [Google Scholar] [CrossRef]
  60. Krüger, M.; Bartsch, P.; Pointner, H.; Zunft, S. Solar tower power plant using a particle-heated steam generator: Modeling and parametric study. In AIP Conference Proceedings; AIP Publishing: Melville, NY, USA, 2016; Volume 1734, p. 050025. [Google Scholar]
  61. Pei, X.; He, B.; Yan, L.; Wang, C.; Song, W.; Song, J. Process simulation of oxy-fuel combustion for a 300 MW pulverized coal-fired power plant using Aspen Plus. Energy Convers. Manag. 2013, 76, 581–587. [Google Scholar] [CrossRef]
  62. Li, K.; Yu, H.; Feron, P.; Wardhaugh, L.; Tade, M. Techno-economic assessment of stripping modifications in an ammonia-based post-combustion capture process. Int. J. Greenh. Gas Control 2016, 53, 319–327. [Google Scholar] [CrossRef]
  63. Rezazadeh, F.; Gale, W.F.; Akram, M.; Hughes, K.J.; Pourkashanian, M. Performance evaluation and optimisation of post combustion CO2 capture processes for natural gas applications at pilot scale via a verified rate-based model. Int. J. Greenh. Gas Control 2016, 53, 243–253. [Google Scholar] [CrossRef]
  64. Baghernejad, A.; Yaghoubi, M. Exergoeconomic analysis and optimization of an Integrated Solar Combined Cycle System (ISCCS) using genetic algorithm. Energy Convers. Manag. 2011, 52, 2193–2203. [Google Scholar] [CrossRef]
  65. Miao, Z. Research on Performance of Carbon Capture System for Solar-Added Coal Fired Power Generation; North China Electric Power University: Beijing, China, 2016. [Google Scholar]
  66. Electric Power Planning & Engineering Institute. The Reference Cost Index of Thermal Power Engineering Rationed Design; China Electric Power Press: Beijing, China, 2012; pp. 257–331. [Google Scholar]
  67. Xiong, J. Thermo-Economic Cost Analysis and Optimization of Conventional Coal-Fired Power Generation System and CO2 Capture System; Huazhong University of Science and Technology: Wuhan, China, 2007. [Google Scholar]
  68. Rao, A. A Technical, Environmental, and Economic Assessment of Amine-Based Carbon Capture Technologies for Greenhouse Gas Control; Department of Engineering and Public Policy: Washington, DC, USA, 2003. [Google Scholar]
  69. Hong, H.; Peng, S.; Zhao, Y.; Liu, Q.; Jin, H. A Typical Solar-coal Hybrid Power Plant in China. Energy Procedia 2014, 49, 1777–1783. [Google Scholar] [CrossRef]
Figure 1. Monoethanolamine-based post-combustion CO2 capture process.
Energies 11 01284 g001
Figure 2. Solar-aided coal-fired power generation with CO2 capture (SA-PG-CC) system.
Energies 11 01284 g002
Figure 3. Solar-aided CO2 capture coal-fired power generation (SA-CC-PG) system.
Energies 11 01284 g003
Figure 4. Physical structure of the solar-aided coal-fired power generation with CO2 capture (SA-PG-CC) system.
Energies 11 01284 g004
Figure 5. Physical structure of the solar-aided CO2 capture coal-fired power generation (SA-CC-PG) system.
Energies 11 01284 g005
Figure 6. Productive structure of the solar-aided coal-fired power generation with CO2 capture (SA-PG-CC) system.
Energies 11 01284 g006
Figure 7. Productive structure of the solar-aided CO2 capture coal-fired power generation (SA-CC-PG) system.
Energies 11 01284 g007
Figure 8. The model flowsheet in Aspen Plus.
Energies 11 01284 g008
Figure 9. The model procedure for the analysis.
Energies 11 01284 g009
Figure 10. Exergy efficiency of each component in all three systems: coal-fired power-generation system with MEA-based CO2 capture (PG-CC), solar-aided coal-fired power generation with CO2 capture (SA-PG-CC) and solar-aided CO2 capture coal-fired power generation (SA-CC-PG). Note: BFPT = feed-water pump turbine; SH = boiler superheater; CND = condenser; COL = collector; COLP = collector oil-pump; CP = condenser water pump; DTR = deaerator; FWH = feed-water heater; FWP = feed-water pump; GEN = generator; HP = high-pressure turbine; IP = intermediate-pressure turbine; LP = low-pressure turbine; OWHE = oil–water heat exchanger; RH = reheater.
Energies 11 01284 g010
Figure 11. Exergy costs of all components in (left to right for each component): coal-fired power-generation system with MEA-based CO2 capture, solar-aided coal-fired power generation with CO2 capture, and solar-aided CO2 capture coal-fired power generation. Note: BFPT = feed-water pump turbine; SH = boiler superheater; CND = condenser; COL = collector; COLP = collector oil-pump; CP = condenser water pump; DTR = deaerator; FWH = feed-water heater; FWP = feed-water pump; GEN = generator; HP = high-pressure turbine; IP = intermediate-pressure turbine; LP = low-pressure turbine; OWHE = oil–water heat exchanger; RH = reheater.
Energies 11 01284 g011
Figure 12. Investment in coal-fired power-generation system with MEA-based CO2 capture (PG-CC), solar-aided coal-fired power generation with CO2 capture (SA-PG-CC) and solar-aided CO2 capture coal-fired power generation (SA-CC-PG).
Energies 11 01284 g012
Figure 13. Composition structure of thermo-economic cost in (left to right for each component): coal-fired power-generation system with MEA-based CO2 capture, solar-aided coal-fired power generation with CO2 capture, and solar-aided CO2 capture coal-fired power generation. Note: BFPT = feed-water pump turbine; SH = boiler superheater; CND = condenser; COL = collector; COLP = collector oil-pump; CP = condenser water pump; DTR = deaerator; FWH = feed-water heater; FWP = feed-water pump; GEN = generator; HP = high-pressure turbine; IP = intermediate-pressure turbine; LP = low-pressure turbine; OWHE = oil–water heat exchanger; RH = reheater.
Energies 11 01284 g013
Figure 14. Variation in unit thermo-economic cost of electricity and solar-collector field investment for coal-fired power-generation system with MEA-based CO2 capture (PG-CC), solar-aided coal-fired power generation with CO2 capture (SA-PG-CC) and solar-aided CO2 capture coal-fired power generation (SA-CC-PG).
Energies 11 01284 g014
Figure 15. Variation in unit cost of CO2 and solar-collector field investment for coal-fired power-generation system with MEA-based CO2 capture (PG-CC), solar-aided coal-fired power generation with CO2 capture (SA-PG-CC) and solar-aided CO2 capture coal-fired power generation (SA-CC-PG).
Energies 11 01284 g015
Table 1. Exergy cost equation and thermo-economic cost equation.
ComponentNumberExergy Cost EquationThermo-Economic Cost Equation
FWH, OWHE, DTR1–8 k P , i * = k B i k F B , i * + k S i k F S , I * c P , i = k B i c F B , i + k S i c F S , i + k Z i
SH, RH9,10 k P , i * = k B i k F u e l * + k S i k F S , I * c P , i = k B i c F u e l + k S i c F S , i + k Z i
HP, IP, LP, BFPT11–20 k P , i * = k B i k F B , i * + k S i k F S , I * c P , i = k B i c F B , i + k S i c F S , i + k Z i
FWP, CP21,22 k P , i * = k B i k P , 24 * + k S i k F S , i * c P , i = k B i c P , 24 + k S i c F S , i + k Z i
CND23 k P , 23 * = k B 23 k F B , 23 * + k W k W , 23 k F W , 23 * c P , 23 = k B 23 c F B , 23 + k W 23 c F W , 23 + k Z 23
GEN24 k P , 24 * = k B 24 k P , 27 * c P , 24 = k B 24 c P , 27 + k Z 24
COL25 k P , 25 * = k B 25 k F B , 25 * c P , 25 = k Z 25
COLP26 k P , 26 * = k B 26 k P , 24 * c P , 26 = k B 26 c P , 24 + k Z 26
J127 k P , 27 * = r i k P , i * c P , 27 = r i c P , i
J228 k P , 28 * = r i k P , i * c P , 28 = r i c P , i
J329 k P , 29 * = r i k P , i * c P , 29 = r i c P , i
O130 k F B , j * = k P , 27 * c F B , j = c P , 27
O231 k F B , 0 * = k F W , 23 * = k F B , 21 , 22 * = k P , 24 * c F B , 0 = c F W , 23 = c F B , 21.22 = c P , 24
Note: BFPT = feed-water pump turbine; SH = boiler superheater; CND = condenser; COL = collector; COLP = collector oil-pump; CP = condenser water pump; DTR = deaerator; FWH = feed-water heater; FWP = feed-water pump; GEN = generator; HP = high-pressure turbine; IP = intermediate-pressure turbine; J = pooled component; O = dispersion component; LP = low-pressure turbine; OWHE = oil–water heat exchanger; RH = reheater.
Table 2. Main design parameters of the coal-fired power plant subsystem.
ParameterValueUnit
Capacity1000MW
Parameters of main steam25/600/600MPa/°C/°C
Feed-water mass flow rate2733.43t/h
Condenser pressure5kPa
Feed-water temperature294.75°C
Designed coal consumption rate268g/kWh
Table 3. Main parameters of the trough solar-collector subsystem.
ParameterValuesUnit
Direct normal irradiation (DNI)805W/m2
Inlet temperature of the solar collector field280/123°C
Outlet temperature of the solar collector field387/217°C
Peak optical efficiency of collector0.73
Endloss factor0.97
Shading factor1
Wind factor0.98
Focal length1.71m
Table 4. Flue gas, absorber and stripper parameters.
Flue Gas CompositionMole per CentUnitFlue Gas CompositionMole per CentUnit
H2O10%O23.6%
CO214%Temperature40°C
N272.4%Pressure0.12Mpa
AbsorberValueUnitStripperValueUnit
Number of stages8Number of stages8
Top pressure101kPaReboiler pressure220kPa
Bottom pressure111kPaCondenser pressure210kPa
Inlet flue gas temperature40°CReboiler heat duty637,647.92kW
Inlet lean solvent temperature40°CRich solvent loading0.42
Liquid-to-gas ratio 2.8kg/kgInlet temperature *140/217°C
Lean solvent loading0.29Outlet temperature *120/123°C
* 140 °C is the inlet temperature of steam to the reboiler in SA-PG-CC. 217 °C is the inlet temperature of hot oil to the reboiler in SA-CC-PG. 120 °C is the outlet temperature of steam (water) from the reboiler in SA-PG-CC. 123 °C is the outlet temperature of thermal from the reboiler in SA-CC-PG.
Table 5. Economic parameters of the coal-fired power plant subsystem.
ParameterValueUnit
System maintenance factor1.06
Annual operating hours8000Hour
Amortise factor1
Amortise cycle5Year
Annual inflation rate0.05
Construction time3Year
Lifetime30Year
Interest rate0.08
Table 6. Economic parameters of solar fields for solar-aided coal-fired power generation with CO2 capture (SA-PG-CC) and solar-aided CO2 capture coal-fired power generation (SA-CC-PG).
ParameterSA-PG-CCSA-CC-PGUnit
Collector field area558,3512,518,165m2
Floor area1,500,0006,000,000m2
Cost of unit collector field area308308$/m2
Cost of unit floor area19.319.3$/m2
Table 7. Primary results of exergy analysis for coal-fired power-generation system with MEA-based CO2 capture (PG-CC), solar-aided coal-fired power generation with CO2 capture (SA-PG-CC) and solar-aided CO2 capture coal-fired power generation (SA-CC-PG).
ComponentPG-CCSA-PG-CCSA-CC-PGUnit
Power output838.7895.91000.7MW
Solar exergy072.9327.9MW
Share of solar exergy03.4513.83%
Coal exergy2042.62042.62042.6MW
Share of coal exergy10096.5586.17%
Coal consumption rate 319.15303.84267.74g/kWh
Efficiency of the system41.0642.3542.21%
Equivalent power output of solar57.2162MW
Equivalent solar-power generation efficiency78.549.4%
Share of solar-energy power output6.3816.19%
Unit exergy cost of electricity2.432.752.08kW/kW
Unit exergy cost of FWH12.022.05kW/kW
Unit exergy cost of OWHE6.67kW/kW
Efficiency of solar-collector field3131%
Table 8. Primary results of the MEA-based CO2 capture subsystem for coal-fired power generation system with MEA-based CO2 capture (PG-CC), solar-aided coal-fired power generation with CO2 capture (SA-PG-CC) and solar-aided CO2 capture coal-fired power generation (SA-CC-PG).
ComponentPG-CCSA-PG-CCSA-CC-PGUnit
Output power penalty161.92161.97-MW
Removal CO2199.67199.67199.67kg/s
CO2 removal rate80.7280.7280.72%
Unit CO2 thermal consumption3193.513193.513193.51kJ/kg
Unit CO2 exergy consumption1119.751119.751303.40kJ/kg
Unit exergy cost of heat source1.992.295.84kW/kW
Unit exergy cost of CO22228.302564.237609.52kJ/kg
Table 9. Main results of the thermo-economic analysis for coal-fired power-generation system with MEA-based CO2 capture (PG-CC), solar-aided coal-fired power generation with CO2 capture (SA-PG-CC) and solar-aided CO2 capture coal-fired power generation (SA-CC-PG).
ComponentPG-CCSA-PG-CCSA-CC-PGUnit
Total system investment674.83822.861493.92M$
Investment of coal-fired side448.80445.22445.64M$
Share of investment of coal-fired subsystem70.7054.1129.83%
Investment of solar side191.61862.25M$
Share of investment of solar subsystem23.2957.72%
Investment of CO2 capture system186.03186.03186.03M$
Share of investment of CO2 capture system29.3022.6112.45%
Unit thermo-economic cost of feed-water heater 1 (FHW1)8.798.3810−6$/kJ
Unit thermo-economic cost of oil–water heat exchanger (OWHE)36.8310−6$/kJ
Unit thermo-economic cost of electricity10.5411.889.5110−6$/kJ
Unit thermo-economic cost of CO211.1611.1662.64$/t
Table 10. Levelized cost of electricity analysis for coal-fired power-generation system with MEA-based CO2 capture (PG-CC), solar-aided coal-fired power generation with CO2 capture (SA-PG-CC) and solar-aided CO2 capture coal-fired power generation (SA-CC-PG) [53].
BaseFactorPG-CCSA-PG-CCSA-CC-PG
Purchased equipment delivered costs (PEDC/M$)674.83822.861493.92
InstallationPEDC0.40269.93329.14597.57
PipingPEDC0.68458.89559.541015.87
Service facilitiesPEDC0.30202.45246.86448.18
Instrumentation and controlsPEDC0.43290.18353.83642.39
Total direct costs (TDC/M$)1221.441489.382703.99
Engineering and supervisionPEDC0.33222.69271.54492.99
Construction expensesPEDC0.41276.68337.37612.51
Total indirect costs (TIC/M$)499.37608.921105.5
Profit/M$TDC + TIC0.0586.04104.91190.47
Contingency/M$TDC + TIC0.10172.08209.83380.95
Total capital requirement (TCR/M$)2653.763235.95874.84
Levelized cost of electricity ($/MWh)83.3298.23165.82

