Article

Ultrasonic-Assisted Pelleting of Sorghum Stalk: Predictive Models for Pellet Density and Durability Using Multiple Response Surface Methodology

1
College of Mechanical Engineering, Yangzhou University, Yangzhou 225009, Jiangsu, China
2
Department of Industrial and Manufacturing Systems Engineering, Kansas State University, Manhattan, KS 66506, USA
3
Jiangsu Muyang Holding Co., Ltd., Yangzhou 225009, Jiangsu, China
4
Department of Industrial and Systems Engineering, North Carolina Agricultural & Technical State University, Greensboro, NC 27411, USA
5
Department of Mechanical and Nuclear Engineering, Kansas State University, Manhattan, KS 66506, USA
*
Authors to whom correspondence should be addressed.
These authors contributed equally to this work.
Energies 2018, 11(5), 1214; https://doi.org/10.3390/en11051214
Submission received: 4 April 2018 / Revised: 2 May 2018 / Accepted: 8 May 2018 / Published: 10 May 2018

Abstract

:
In the field of renewable energy, feedstock such as cellulosic biomass has been proposed as a renewable source of fuel to produce energy. However, the use of raw biomass as feedstock causes high costs in handling, transportation, and storage. Compressing raw cellulosic biomass into pellets significantly increases the density and durability of cellulosic biomass, reducing the transportation and handling costs of feedstock. To ensure high pellet quality, high pellet density and durability are desired during a compressing process. In this study, ultrasonic vibration-assisted (UV-A) pelleting, as a novel pelleting method, was applied to measure pellet density and durability during experiments. Response surface methodology (RSM) was employed to investigate the effects of pelleting time, ultrasonic power, and pelleting pressure on the pellet density and pellet durability. The model was validated by comparing the predictive results with experimental data and demonstrated a good predictive ability (R2 > 0.95). By employing a Derringer and Suich’s desirability function, our results suggest that the optimal pellet density and durability are 1239 kg/m3 and 93%, respectively, when the pelleting time was set to 44 s, the ultrasonic power was set to 50%, and pressure was set to 42 psi (289,580 Pa).

1. Introduction

Extensive usage of petroleum transportation fuels has urged research in renewable energy to seek strategies which can provide the reliable supply of liquid transportation fuels and reduce greenhouse gas emissions [1,2,3,4]. In the United States, more than 30% of the current petroleum consumption can be replaced by cellulosic ethanol [5]. This type of replacement could ameliorate the long-lasting environment issues and economic burden. Compared with sugar-based feedstock (for example, sugar rave) and starch-based feedstock (for example, corn), cellulosic biomass does not compete with these agricultural productions for a limited land source [6].
There are some barriers to achieving cost-effective cellulosic ethanol manufacturing. A major barrier is the low density of cellulosic biomass, ranging from 40 to 250 kg/m3 [7], which causes high expenses during handling, transportation, and storage. Pelleting, which compresses biomass into a uniform shape and size of pellets can significantly increase the density of cellulosic biomass over 1200 kg/m3 [7,8,9]. In turn, the costs associated with the transportation and storage are significantly reduced to less than a factor of two and ten of those of raw biomass, respectively [10,11].
Existing biomass briquette manufacturing needs high-temperature steam and/or binder materials to produce pellets [7,12]. As a new pelleting method, Ultrasonic vibration-assisted (UV-A) pelleting can produce pellets of 1000 kg/m3 without requiring the conditions such as high-temperature steam and binder materials [6]. In addition, our previous studies demonstrated that the sugar yield of biomass processed by UV-A pelleting was 20% higher than the biomass not processed by UV-A pelleting [13].
The pellet density and durability are used as two criteria to evaluate pellet quality in the UV-A pelleting. Pellets with high densities are expected for avoiding the high expenses and dust emissions during transportation [14]. On a similar note, the high pellet durability is also required for reducing a risk of dust emissions and potential fire explosions during pelleting handling and storage [15]. Thus, the high pellet density and durability are desirable simultaneously because the pellet density and pellet durability are not dependent on each other [16].
The existing literature showed that pelleting time, pelleting pressure, and ultrasonic power is highly correlated with the pellet quality and durability [17,18,19,20,21,22,23]. The effect of single input variables on pellet density and durability was investigated each time in the experiments [18]. The response surface methodology (RSM) has been widely applied to investigate the cause-and-effect relationships in various research areas including the physical, biological, and social sciences, as well as engineering [24]. The core idea of this method is to implement an experimental design, model testing procedures, and optimization techniques to study the effects of multiple process variables on response variables with the least number of experiments [24]. To the best of our knowledge, the modeling of pellet density and durability simultaneously using RSM has not been fully investigated in previous studies. In this paper, we developed quantitative models to predict both pellet density and pellet durability in UV-A pelleting. To develop the models, a central composite experimental design was employed to conduct experiments. Then, the experimental results were used to construct regression models. Finally, the optimization techniques were applied to identify the values of a combination of three input variables (pelleting time, pressure, and ultrasonic power) for achieving desirable pellet density and pellet durability. Thus, the objectives of this research are (1) to establish a mathematical model for pellet density and durability, considering the input parameters including pelleting time, pelleting pressure, and ultrasonic power; (2) to study the main effects and interaction effects of three inputs parameters (pelleting time, ultrasonic power, and pelleting pressure) on pellet density and durability; (3) to compare the simulation results with experimental results; (4) to optimize the process parameters for maximizing the pellet density and durability simultaneously using Derringer and Suich’s desirability function.

2. Materials and Methods

2.1. Material Preparation

The raw materials, sorghum stalks, were chopped to about 17–23 cm using a tub grinder (Model haybuster H-1150 series, DaraTech Industries International Inc., Jamestown, ND, USA). A cutting mill (model SM 2000, Retsch, Inc., Haan, Germany) with a set of rotating blades inside a chamber was used to further process the chopped sorghum stalk into fine particles. A sieve with screen size 1 mm in the cutting mill was used to control sorghum stalk particle size. The moisture content (MC) of biomass particles was measured by following an NREL laboratory analytical procedure [25]. About 10 grams (g) of biomass was placed in an aluminum weighing dish and dried in an oven at 105 °C for 24 h. The weight of the biomass was recorded after oven drying. The MC was calculated as follows:
MC = weight   before   drying weight   after   drying weight   before   drying × 100 %

2.2. Experimental Setup

The experimental setup of UV-A pelleting is schematically illustrated in Figure 1. UV-A pelleting experiments were performed on a modified ultrasonic machine (Model AP-1000, Sonic-Mill, Albuquerque, NM, USA), which consisted of three subsystems including a pneumatic loading system, an ultrasonic generation system, and a biomass holding system.
In the pneumatic loading system, an air compressor (1.2 kW, 125 L, Sears, Roebuck and Co., Hoffman Estates, IL, USA) provided compressed air for a pneumatic cylinder. The pneumatic cylinder connected to the air compressor pushed the pelleting tool against the biomass in the mold. The air pressure in the pneumatic cylinder can be regulated by a pressure regulator, which can determine the magnitude of the compression pressure applied on the sorghum stalk particles.
The ultrasonic generation system consisted of three major parts: a power supply (which converts 60 Hz electrical power into 20 kHz electrical power), a converter (which converts high-frequency electrical energy into mechanical motion), and a titanium pelleting tool (which is connected to the converter and used to compress biomass).
In the biomass holding system, the aluminum mold was made in three separate parts which were assembled together with pins. The top two parts formed a hollow cylinder (18.6 mm in inner diameter) and the bottom part served as a base. The mold was clamped by a fixture which was mounted on a machine table, as demonstrated in Figure 1.
The major process of UV-A pelleting is explained as follows. A quantity of 2 g of sorghum stalk particles was loaded into the center cavity of the mold. The titanium tool was fed down to compress the sorghum stalk particles at a certain feed rate. The tool was mounted to a tool holder that was connected to an ultrasonic converter that provided ultrasonic vibrations to the sorghum stalk particles. After a predetermined pelleting time, the tool was retracted and the pellet was taken out from the dissembled mold.

2.3. Experimental Design

Three input variables (pelleting time, pressure, and ultrasonic power) were selected to produce a qualified pellet which could stay in a condensed cylindrical shape without cracks. Pelleting time was referred to as the duration when the pelleting tool was compressing biomass particles in the presence of ultrasonic vibration. A stopwatch was used to record the pelleting time during the experiments. The pressure produced by the air pressure in the pneumatic cylinder can be adjusted by the pressure regulator. A power supply provided ultrasonic power to control the vibration amplitude of the pelleting tool. The selected ultrasonic power was expressed as a percentage of the maximum ultrasonic power from 0% to 100%.
A central composite experimental design was employed to obtain a model using response surface technology [26]. The design contained 20 tests that consisted of three process variables and corresponding values of output variables, as shown in Table 1. Both linear and nonlinear models were applied to fit into the experimental data. The predictive ability of the linear models was weak because the p-value of the lack of fit F-test was less than 0.05 (that is, the linear models failed to describe the quantitative relationships between the inputs and outputs). Second-order polynomial models were chosen and used to calibrate the pellet density and durability based on the lack of fit in the F-test and R-squared statistical measures. The results were incorporated into Equation (2) and analyzed using Design Expert (StatEase, Inc., Minneapolis, MN, USA):
Y = β 0 + i = 1 3 β i x i + i < j β i j x i x j + i = 1 3 β i i x i 2 + ε

2.4. Measurement of Pellet Density and Durability

The density of a pellet was calculated by the ratio of its mass over its volume. The weight of the pellet was measured with an electronic scale (Ohaus, Pine Brook, NJ, USA), and the pellet weight was converted to pellet mass ( m ) in Equation (3). Since the produced pellet was a cylinder, the volume of the pellets was obtained by measuring the height and diameter of the pellets with a caliper.
Pellet   density =   mass volume = m H · π · ( D / 2 ) 2
In Equation (3), H represents the pellet height and the pellet diameter ( D ) equals the diameter of the mold cavity (18.6 mm).
The pellet durability is the ability of the pellet to withstand impact and other forces encountered during handling and transportation [27], which was measured based on the ASABE standard S269.4 [28] with one modification. A quantity of 100 g of pellets, processed by UV-A pelleting, were kept tumbling inside a pellet durability tester (Seedburo Equipment, Des Plaines, IL, USA) with a rotation speed of 50 rpm. After tumbling for 10 min, pellets were taken out and sieved through a U.S. No. 6 sieve with a hole diameter of 3.15 mm. Then, the following Equation (4) was employed to calculate the pellet durability index:
Pellet   durability = Weight   of   remaining   pellets   after   sieving Weight   of   pellets   before   tumbling
Both pellet density and pellet durability were recorded in three replications, and the average value of the three measurements was calculated and displayed in Table 1.

3. Results and Discussion

3.1. Response Surface Model of Pellet Density

By fitting the experimental data (as shown in Table 1) into Equation (2), a second-order polynomial model for the pellet density was obtained as follows:
Density =   645.04 + 17.42 A + 38.64 B + 17.19 C 0.08 AB 0.04 AC 0.14 BC 0.1 A 2 0.33 B 2 0.03 C 2
where A, B, and C represents pelleting time, pelleting pressure, and ultrasonic power, respectively. The values of pelleting time, pelleting pressure, and ultrasonic power in Equation (5) can range from 20 s to 70 s, 18.5 psi to 50.5 psi, and 16.5% to 58.5%, respectively. The test statistics in Table 2 indicated that the model is highly statistically significant (p-value of Model test statistics < 0.0001, and the highly statistically significance is marked using asterisk in Tables 2, 3, 5, and 6). However, the terms AB, AC, BC, and C2 is not statistically significant (p-value > 0.05). To avoid the model overfitting, these insignificant terms were removed from Equation (5) and thus, the following reduced model was proposed to calculate the pellet density.
Density ( reduced ) =   220.49 + 12.75 A + 29.46 B + 8.41 C 0.1 A 2 0.32 B 2
where A, B, and C represent pelleting time, pelleting pressure, and ultrasonic power, respectively. The values of pelleting time, pelleting pressure, and ultrasonic power in Equation (6) can range from 20 s to 70 s, 18.5 psi to 50.5 psi, and 16.5% to 58.5%, respectively. Based on the new analysis of variance (ANOVA) table (as shown in Table 3), the reduced model is also highly statistically significant (p-value < 0.0001). Moreover, the ANOVA showed that pelleting time, pelleting pressure, and ultrasonic power significantly affected pellet density in UV-A pelleting. The coefficient of determination (the ratio of the explained variation to the total variation) R2 is equal to 0.96, which is comparable to the full model ( R 2 = 0.96 in the reduced model versus R 2 = 0.97 in the full model). This indicates that the reduced model can still provide good predictions. In addition, the lack of fit of the F test indicated that the model has a good agreement with the experimental data (p-value = 0.122). The model demonstrated that the pellet density can be predicted based on the process parameters as long as these parameters varied within the ranges of the designed experiments in this study.

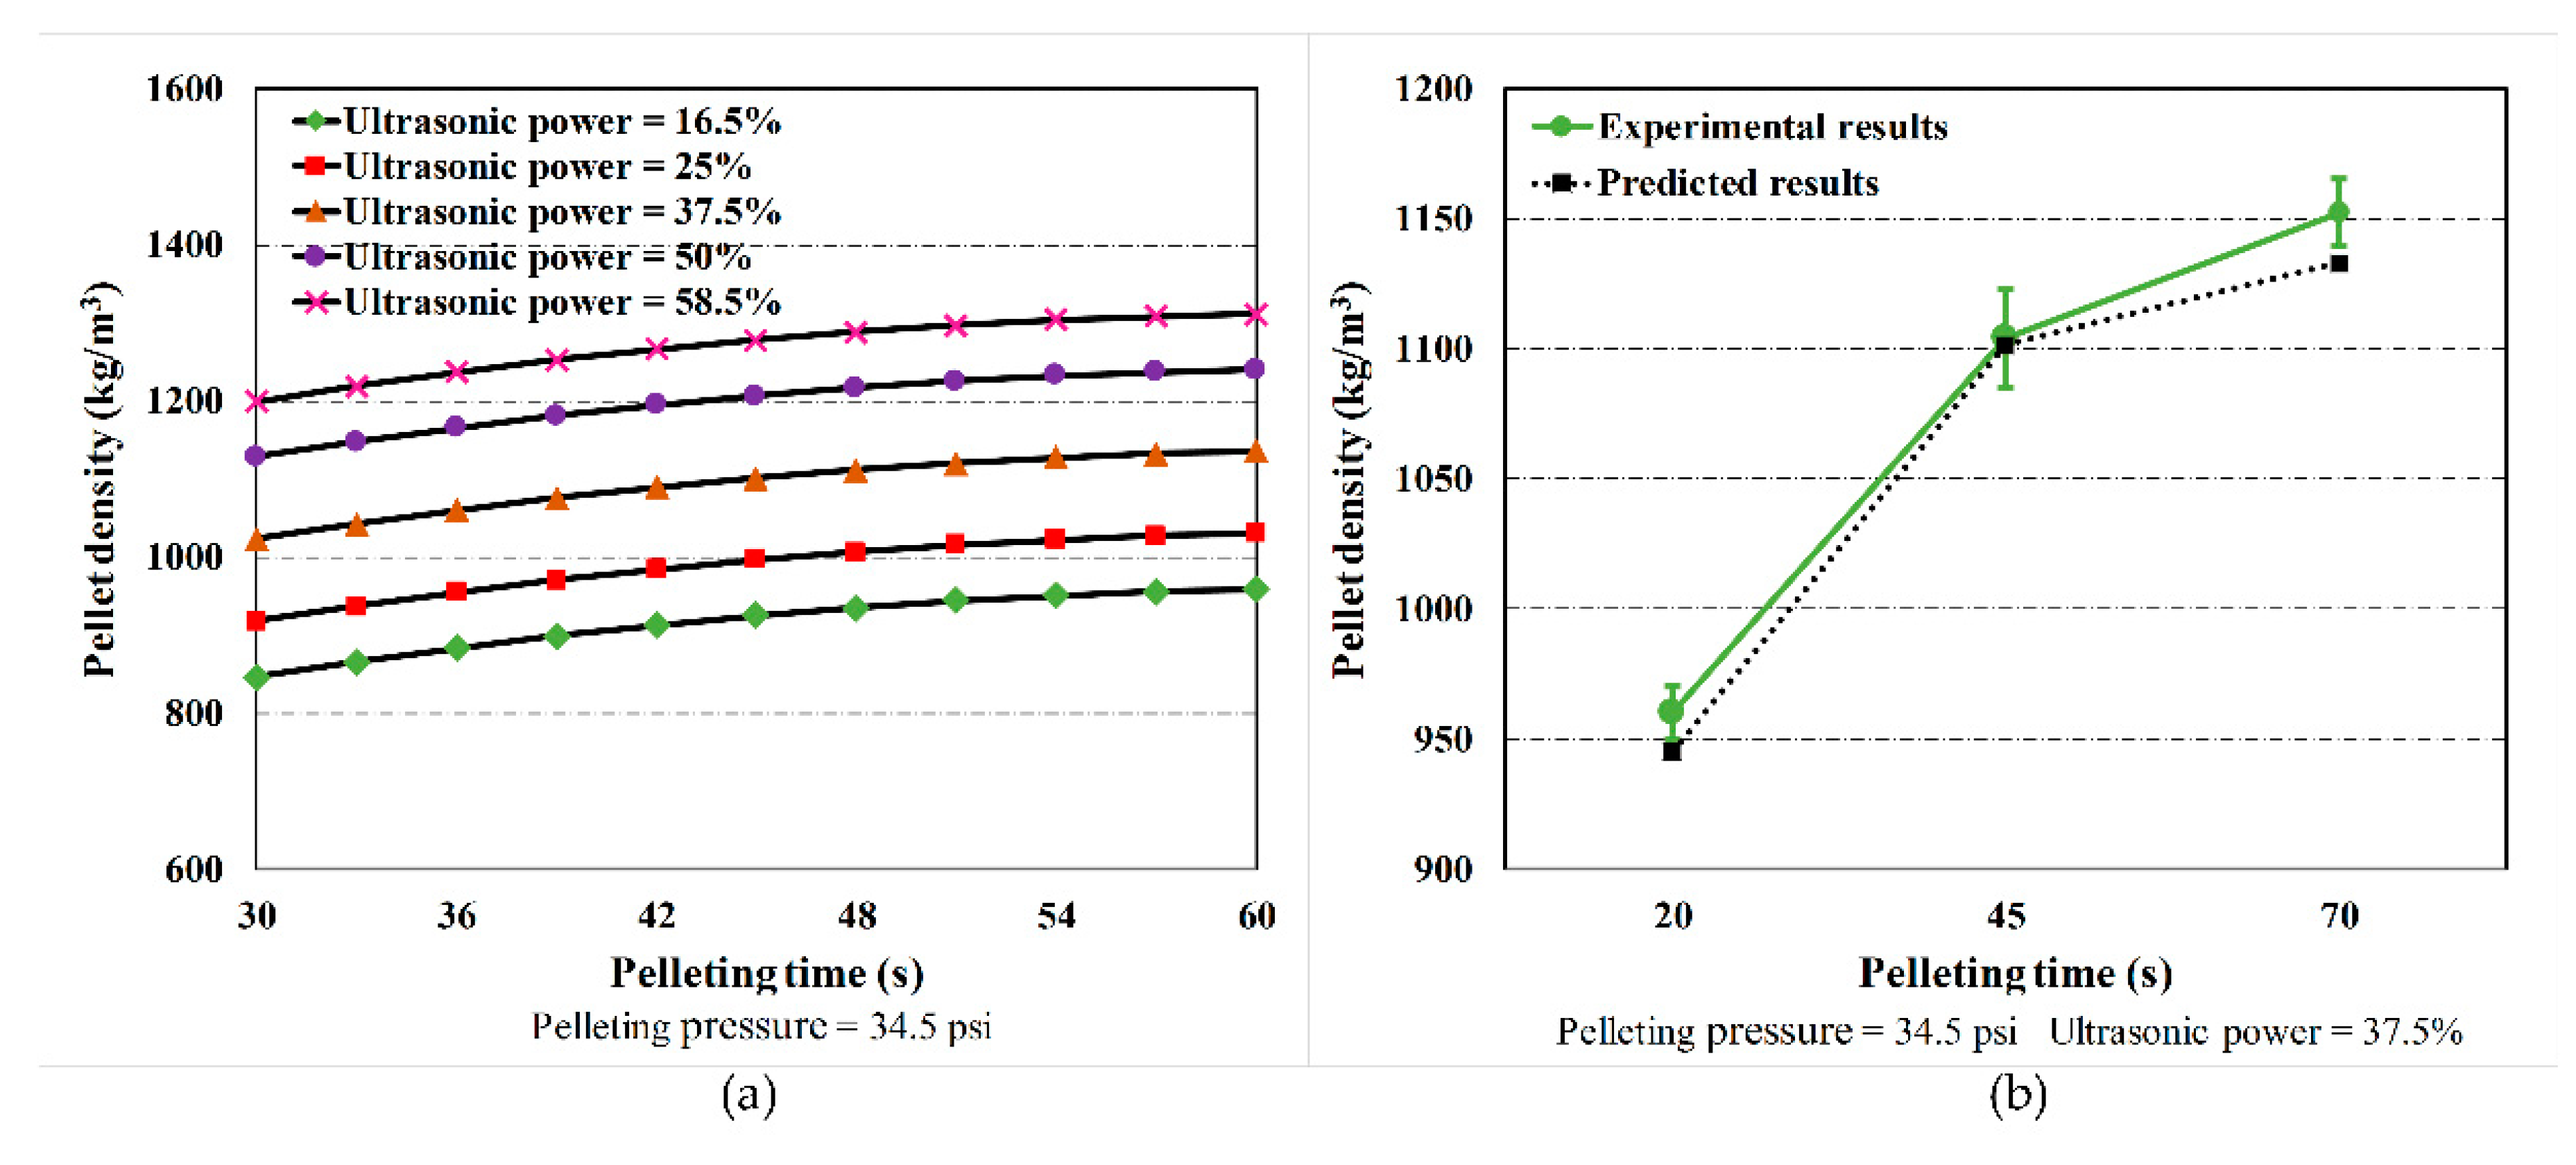
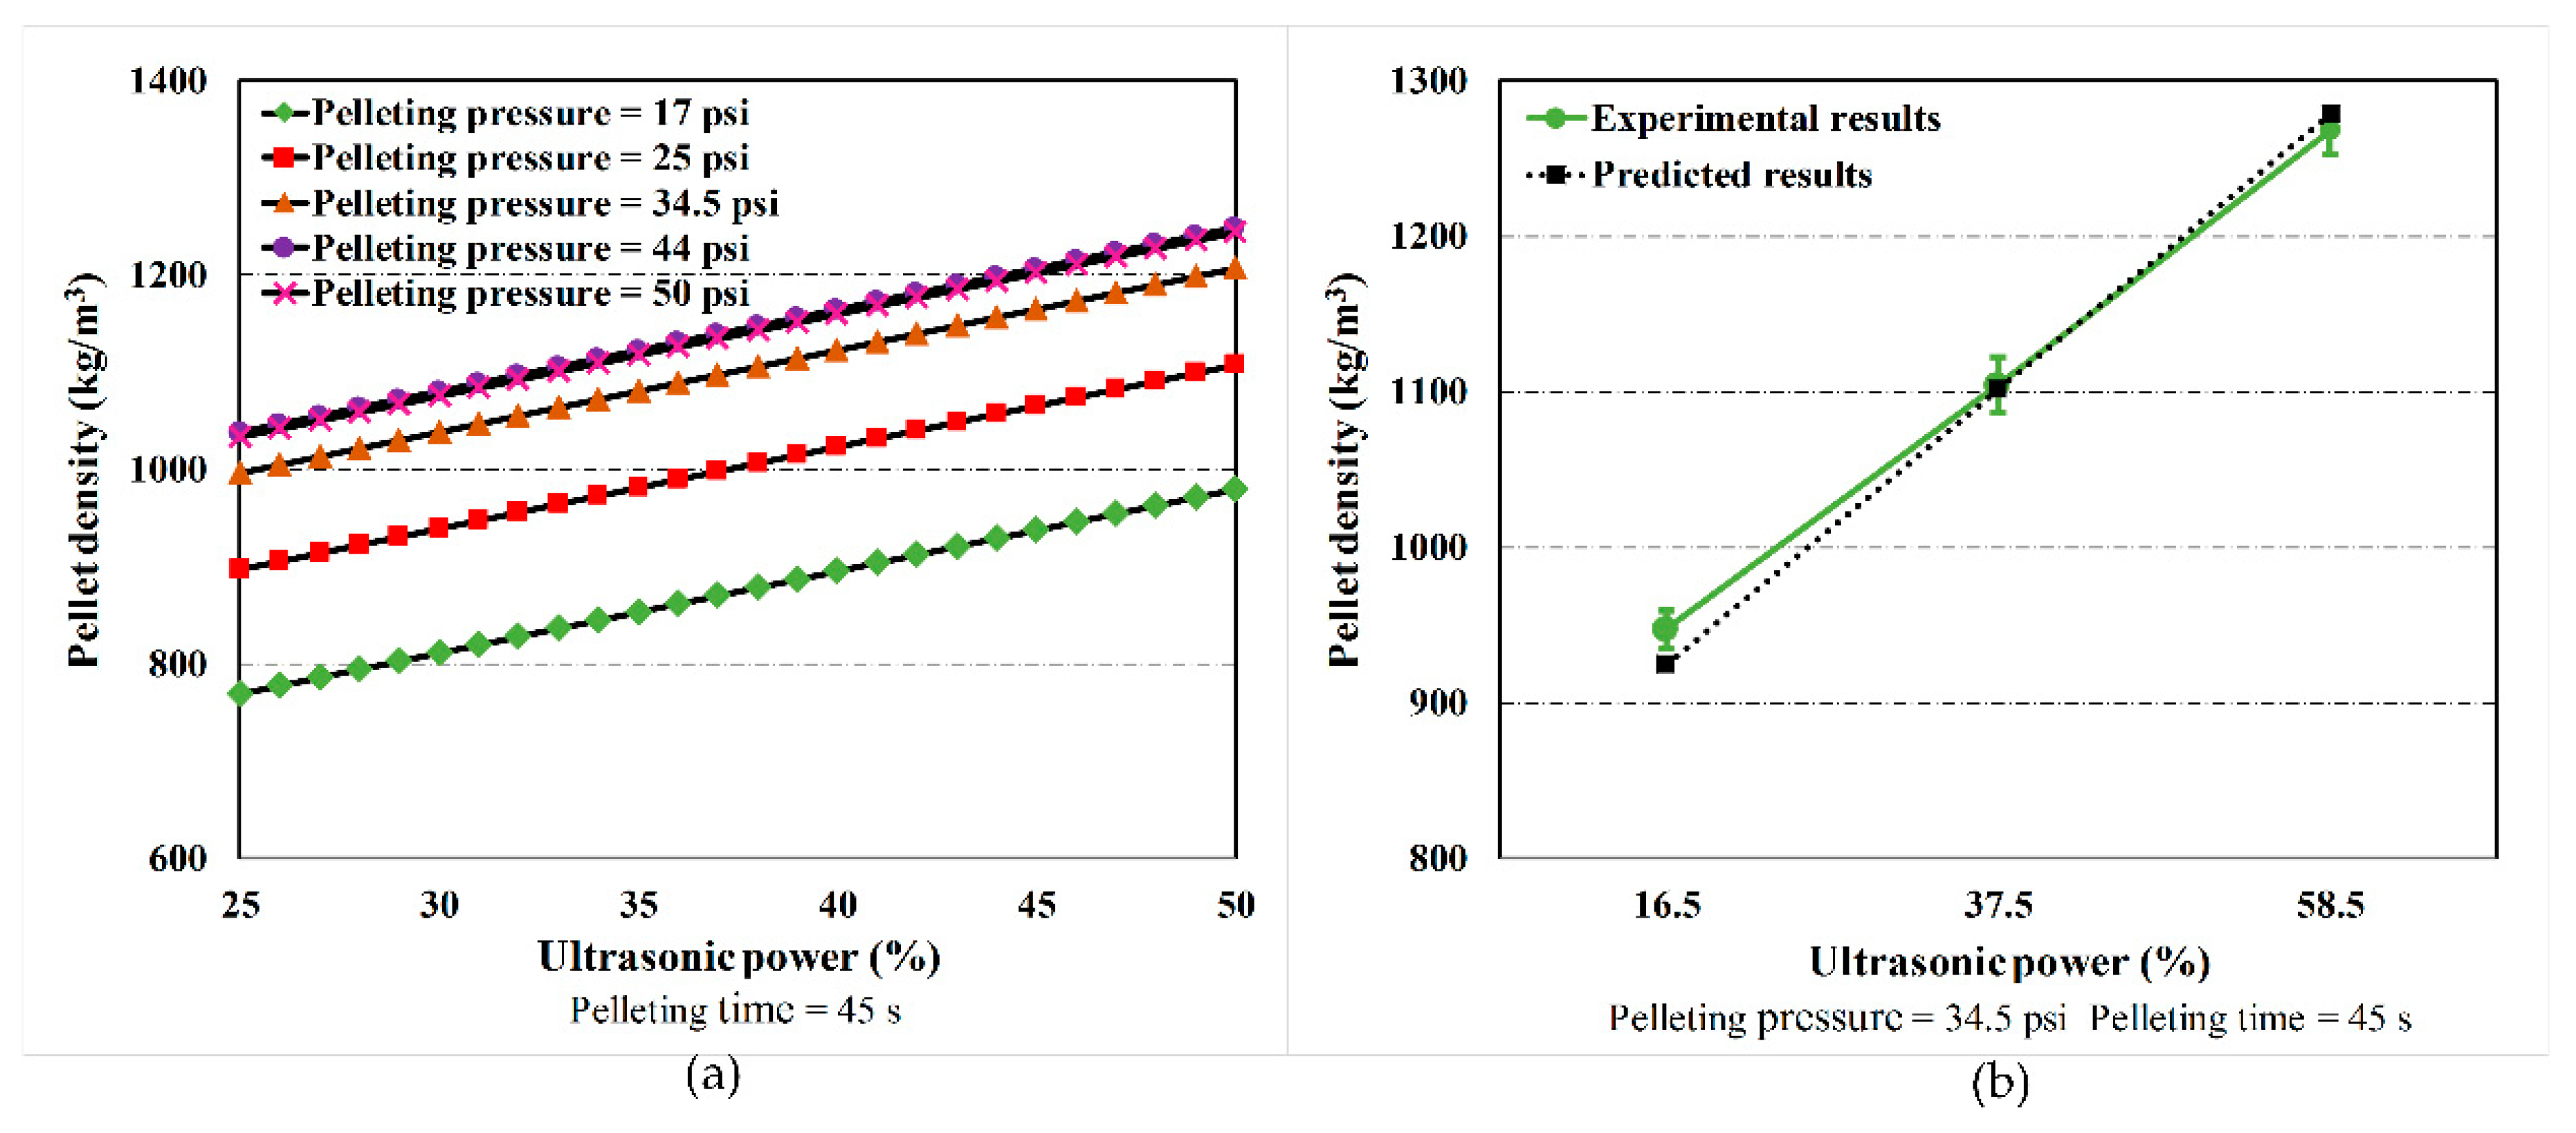
3.2. Predicted Effects of Pelleting Time, Ultrasonic Power, and Pelleting Pressure on Pellet Density

To calculate the pellet density, the values of the input variables in Table 1 need to be incorporated into Equation (6). The predicted values of pellet density under various conditions are demonstrated in Figure 2, Figure 3 and Figure 4. As shown in Figure 2a, the pellet density increased as the pelleting time increased from 30 s to 60 s for different levels of ultrasonic power. The pellet density increased gradually and then became stabilized over the pelleting time. Figure 2b shows a comparison between the predicted pellet density and the experimental results at different levels of pelleting time while the pelleting pressure was kept at 34.5 psi (237,869.1 Pa) and ultrasonic power was kept at 37.5%. The kinetics of the pellet density calibrated from Equation (6) agree well with experimental results. From both the model and experimental data, the pellet density increased by 16.5% as the pelleting time increased from 20 s to 45 s, and the pellet density increased by a further 2.8% as the pelleting time proceeded from 45 s to 70 s, respectively. The magnitude of the increase in the pellet density declined since the pellet was observed to fail to be significantly condensed at a late stage of pelleting (from 45 s to 70 s).
Figure 3a demonstrated how ultrasonic power influenced pellet density in UV-A pelleting, as predicted by Equation (6). The pellet density was almost linearly increased as the ultrasonic power increased. As the ultrasonic power increased from 25% to 50%, the pellet density for various levels of pelleting pressure also increased when the pelleting time equaled to 45 s. Figure 3b shows a comparison of pellet density between the experimental and model results at multiple levels of ultrasonic power when the pelleting pressure was kept at 34.5 psi (237,869.1 Pa), and the pelleting time was kept at 45 s. The pellet density increased by 38.2% (from 925.0 kg/m3 to 1278.2 kg/m3) as the ultrasonic power increased from 16.5% to 58.5%. The relationship between pellet density and ultrasonic power is almost linear as the ultrasonic power range from 16.5% to 58.5%, which matches with the trend in the experiments (denoted by the green line). A similar trend was reported in our previous study [18], which showed that there is a significant increase in the pellet density when ultrasonic power increased from 30% to 50%. Using other types of biomass materials such as wheat straw and switchgrass, Nottingham et al. [19], Song et al. [20], Zhang et al. [22], and Fan et al. [23] presented a similar relationship between the pellet density and ultrasonic power in UV-A pelleting. One can refer to these studies for additional information.
The effects of pelleting pressure on the pellet density in UV-A pelleting can also be calculated using Equation (6). As demonstrated in Figure 4a, an increase in the pellet density was observed when the pelleting pressure increased from 25 psi (172,369 Pa) to 44 psi (303,369 Pa) for different levels of pelleting time. However, the increase in pellet density induced by pellet pressure is not linear. This indicates that the pellet density may not be further increased after a certain level of pelleting pressure (for example, 44 psi). The reason for this is due to the fact that the pellet in the mold cannot be further condensed when the pellet pressure exceeded a certain level (for example, 44 psi). Figure 4b shows the predicted results of the pellet density that matched well with experimental results at different levels of pelleting pressure while the ultrasonic power was kept at 37.5%, and the pelleting time was kept at 45 s. It can be seen that the pellet density increased when the pelleting pressure increased. Although the experimental result is slightly higher than the simulation result as pelleting pressure increased from 34.5 psi (237,869.1 Pa) to 50.5 psi (348,185.2 Pa), the trend of the relationship between pellet density and pelleting pressure still agrees well with that trend determined by our experimental data. Furthermore, previous studies [18,20,22,23] indicated that the pellet density increased dramatically as the pelleting pressure increased from 20 to 50 psi (137,895 to 344,738 Pa). To further validate our results, the relationship between the pelleting pressure and pellet density using other pelleting methods and biomass materials was summarized in Table 4. As demonstrated in Table 4, the pelleting pressure had positive effects on pellet density (an increase in the pelleting pressure and pellet density was denoted by an upward arrow).

3.3. Response Surface Model for Pellet Durability

To develop a response surface model for pellet durability, a second-order polynomial model (as shown in Equation (2)) was fitted by the experimental results in Table 1. A predictive model for pellet durability is firstly proposed as follows:
Durability = 175.07 + 3.26 A + 2.51 B + 6.11 C 0.009 AB 0.04 AC 0.01 BC 0.01 A 2 0.02 B 2 0.04 C 2
where A, B, and C represent pelleting time, pelleting pressure, and ultrasonic power, respectively. The values of pelleting time, pelleting pressure, and ultrasonic power in Equation (7) can range from 20 s to 70 s, 18.5 psi to 50.5 psi, and 16.5% to 58.5%, respectively. The test statistics in Table 5 indicate that the model is highly statistically significant (p-value < 0.0001). Furthermore, the ANOVA showed that pelleting time, pelleting pressure, and ultrasonic power significantly affected the values of pellet durability in UV-A pelleting. However, the terms AB and BC are not statistically significant (p-value > 0.05). To avoid the model overfitting, these insignificant terms were removed from Equation (7), and thus, the following reduced model was then proposed to predict the pellet durability.
Durability reduced = 144.47 + 2.96 A + 1.63 B + 5.65 C 0.04 AC 0.01 A 2 0.02 B 2 0.04 C 2
where A, B, and C represent pelleting time, pelleting pressure, and ultrasonic power, respectively. The values of pelleting time, pelleting pressure, and ultrasonic power in Equation (8) can range from 20 s to 70 s, 18.5 psi to 50.5 psi, and 16.5% to 58.5%, respectively. The new ANOVA table (as shown in Table 6) based on the reduced model suggests that the pellet durability is highly corrected to the pelleting time, pelleting pressure, ultrasonic power, and the combined effect of pelleting time and ultrasonic power (p-value < 0.0001). It is worthwhile to point out the p-value of the lack of fit F test significantly decreased from 0.2046 (in the full model) to 0.1173 (in the reduced model). The decrease in the p-value of the lack of fit F test indicates that the reduced model fitted less in the experimental data, compared to the full model. To have a more accurate prediction, a full model was employed to calculate the pellet durability in the next section.

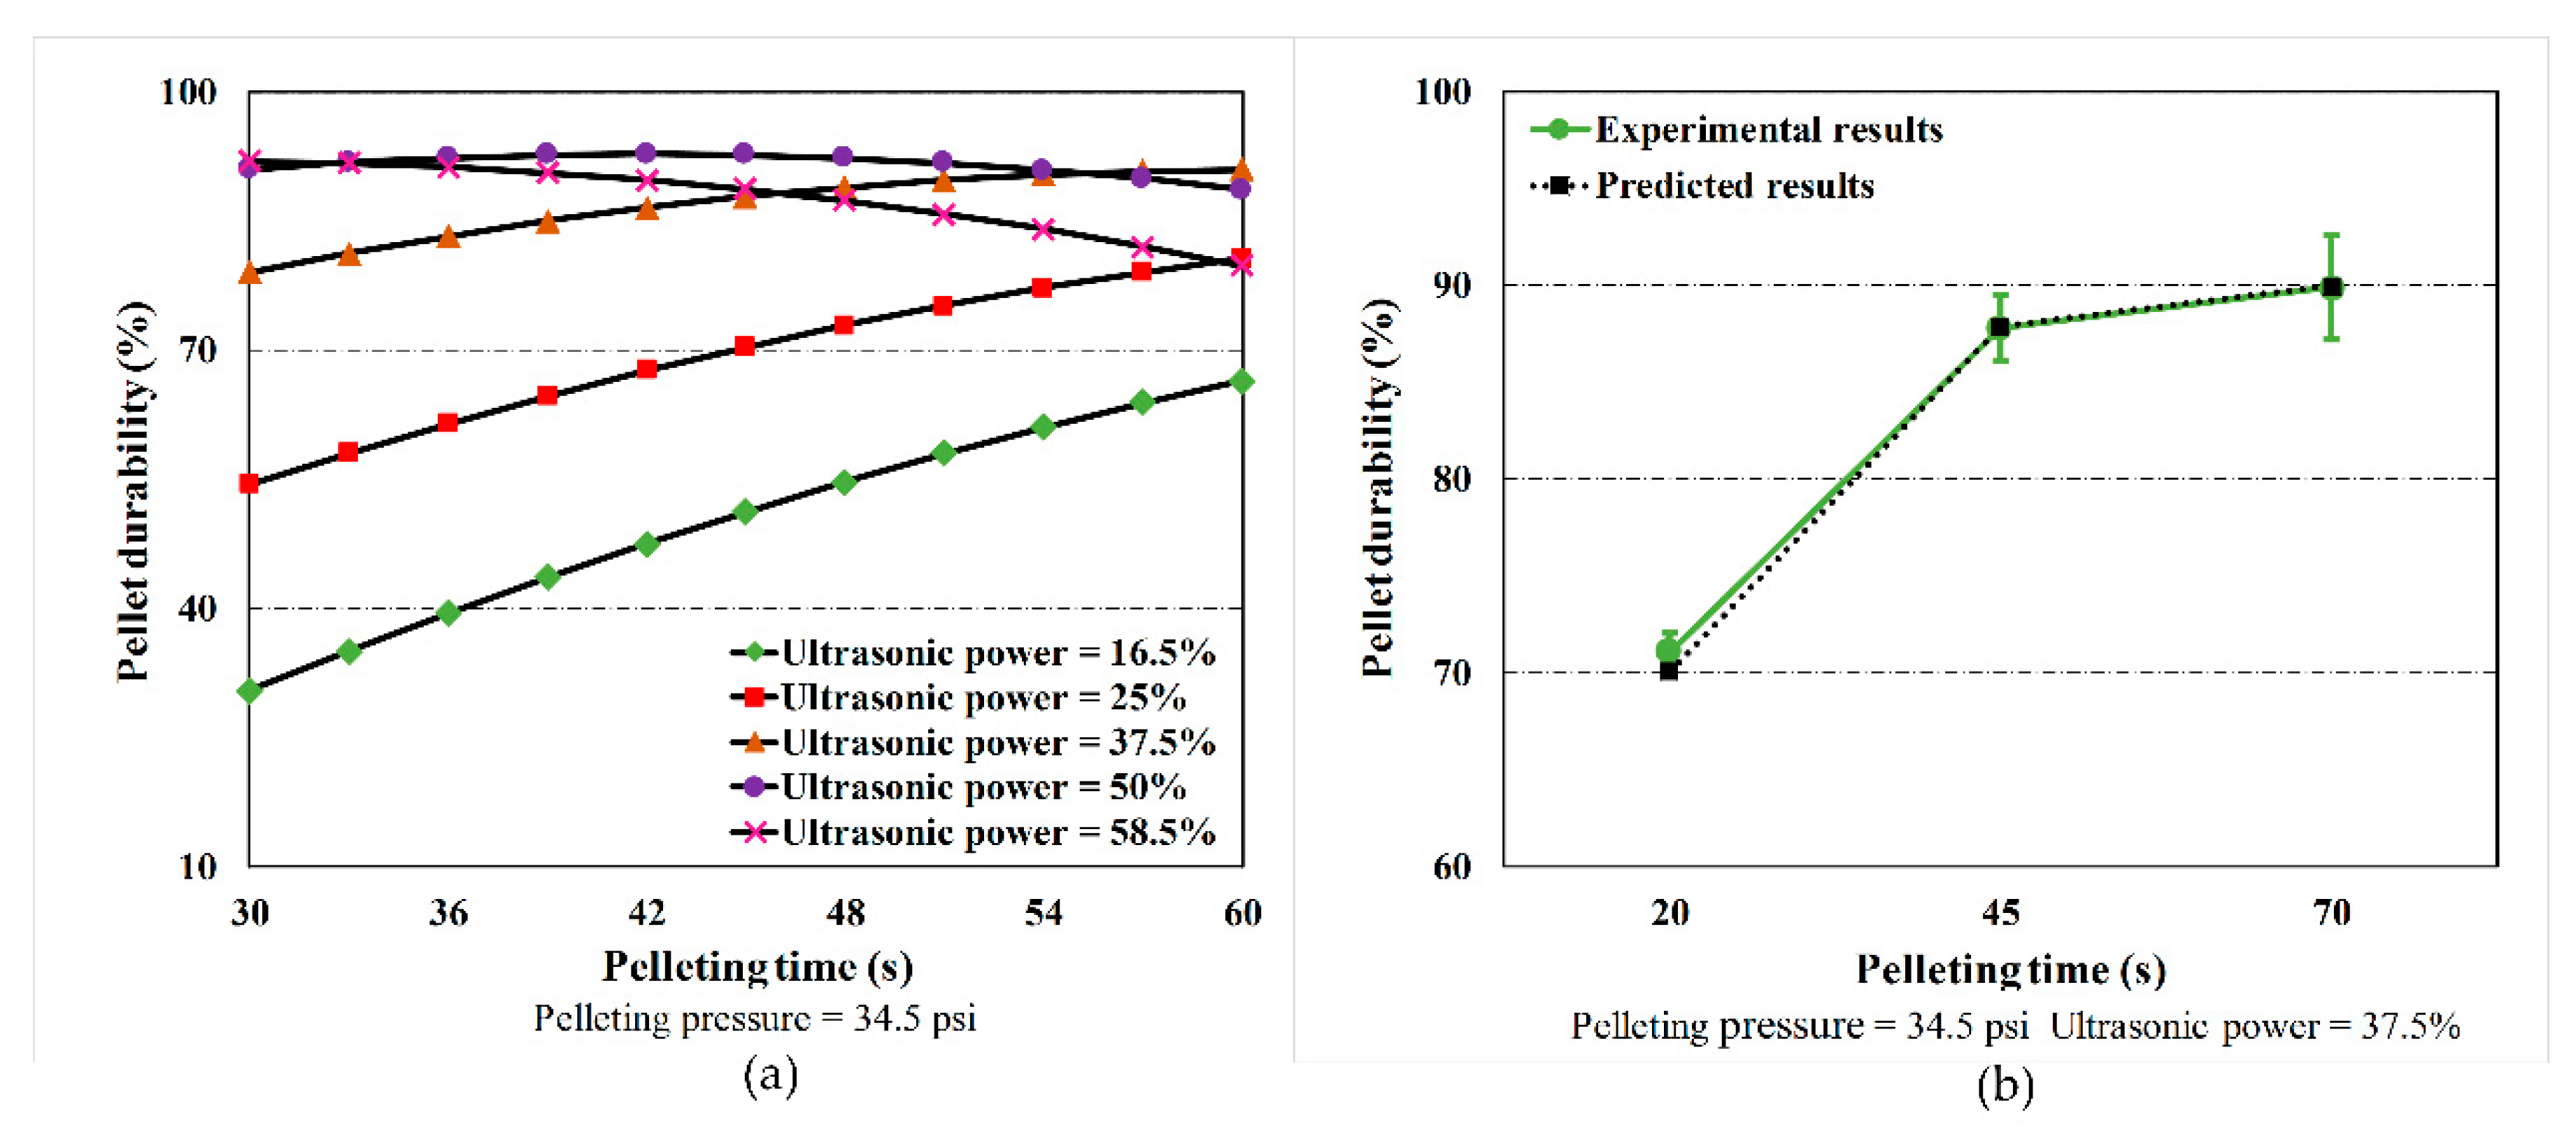
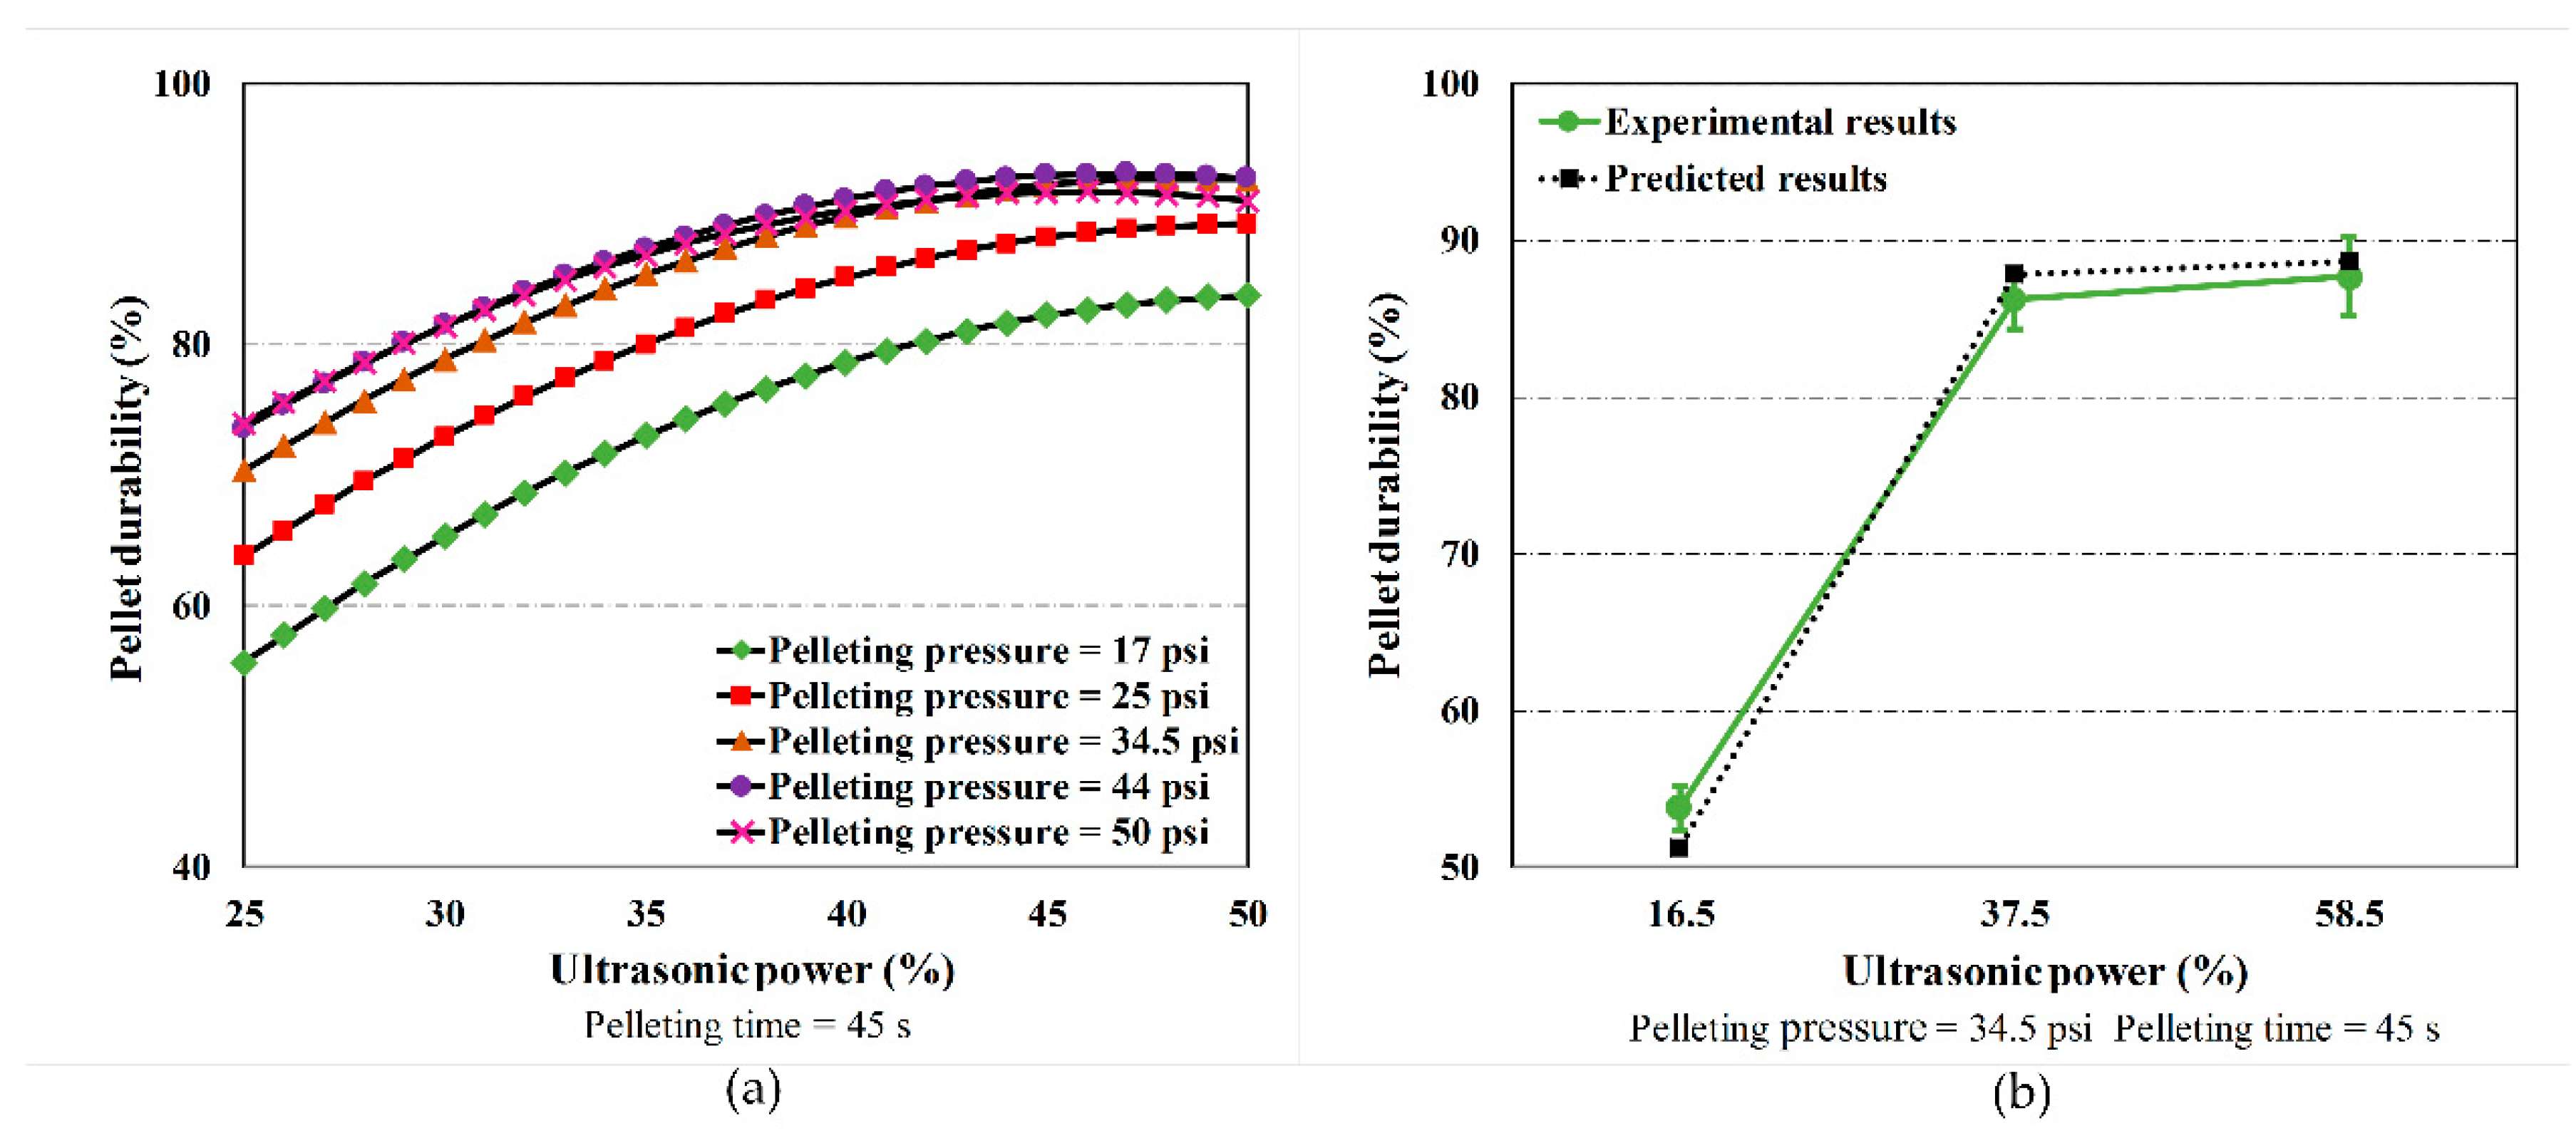
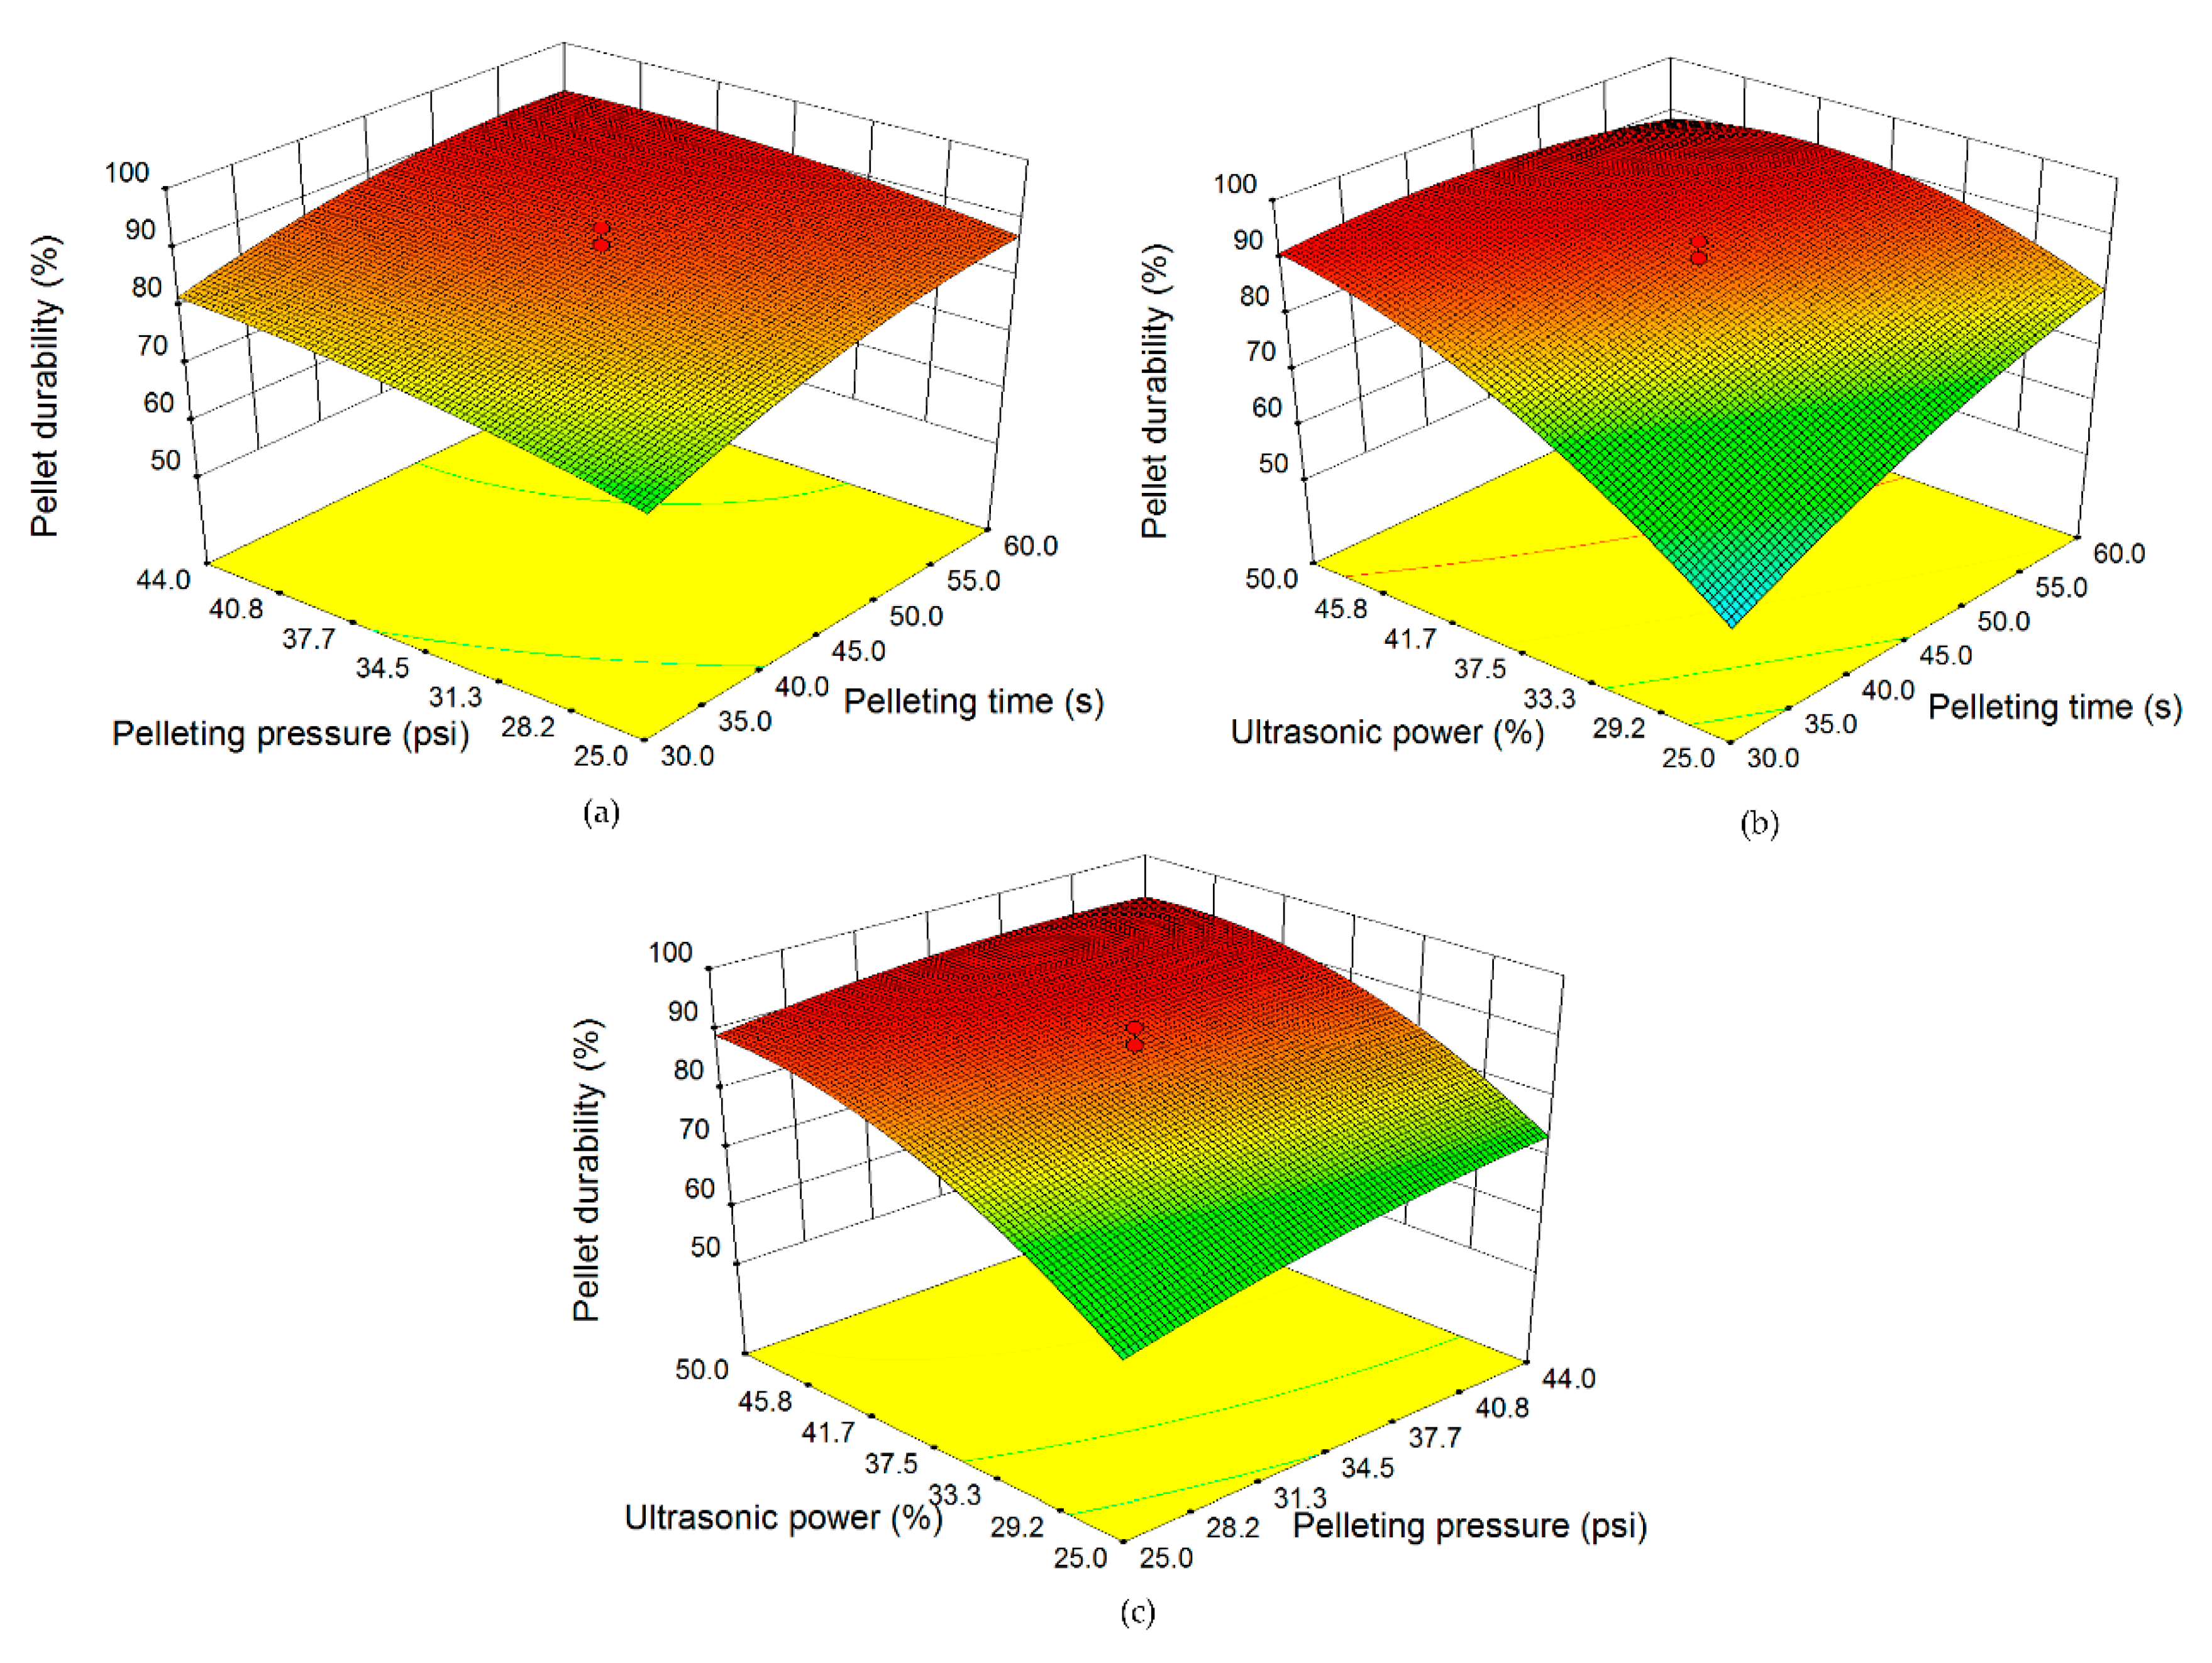
3.4. Predicted Effects of Pelleting Time, Ultrasonic Power, and Pelleting Pressure on Pellet Durability

To calculate the pellet durability, the values of the input variables in Table 1 need to be incorporated into Equation (7). The effects of pelleting time on pellet durability were predicted by Equation (7) and the results were depicted in Figure 5a. It was observed that there was an increase in pellet durability as the pelleting time increased at lower ultrasonic power (16.5%, 25%, and 37.5%). The pellet durability slightly increased and then decreased at a higher ultrasonic power (50%). When the ultrasonic power was fixed to 58.5%, the pellet durability decreased as the pelleting time increased. The decrease in pellet durability may be due to charring. Charring during the pelleting process can significantly reduce the quality of pellets [39]. High ultrasonic power with long pelleting time resulted in high temperature and could eventually lead to charring [17]. The predicted pellet durability was compared with the experimental results at different levels of pelleting time while the pelleting pressure was kept at 34.5 psi (237,869.1 Pa) and ultrasonic power was kept at 37.5%, as shown in Figure 5b. The kinetics of predicted pellet durability matched well with the trend determined by experiments. Both the model and experimental data showed that the pellet durability increased by 23.5% as the pelleting time increased from 20 s to 45 s, and the pellet durability increased by a further 2.4% as the pelleting time proceeded from 45 s to 70 s, respectively. The same trend was reported by Nottingham et al. [19] who found that an increase in pelleting time from 30 s to 50 s induced an increase in pellet durability.
Utilizing Equation (7), the effects of ultrasonic power on the pellet durability in UV-A pelleting were investigated. As shown in Figure 6a, an escalation in ultrasonic power led to an increase in pellet durability when ultrasonic power increased from 25% to 50% for different levels of pelleting pressure. Furthermore, the predicted pellet durability was compared to the experimental results when various levels of ultrasonic power were applied. Figure 6b demonstrated that the relationship between the predicted pellet durability and the ultrasonic power matched well with the trend determined by the experiments. It was observed that the ultrasonic power increased from 16.5% to 37.5% when pellet durability increased by 60.2% (from 53.8% to 86.2%). As ultrasonic power further increased from 37.5% to 58.5%, the pellet durability had only a slight increase (from 86.2% to 87.7%). This result indicates that a higher ultrasonic power may not be necessary for improving the pellet durability. This finding could help avoid an enhanced energy consumption (high ultrasonic power leads to a high energy consumption based on our previous study [40]) in future experiments. Zhang et al. [18] reported that there is an increase in pellet durability of sorghum stalk when ultrasonic power increased from 30% to 50%. The similar results between ultrasonic power and pellet durability were also reported by Tang et al. [21], Zhang et al. [22], Fan et al. [23], and Nottingham et al. [19] in UV-A pelleting of wheat straw and switchgrass.
Figure 7a demonstrated that there is an increase in pellet durability when the pelleting pressure increased from 25 psi to 44 psi (172,369 to 303,369 Pa) for different levels of pelleting time. Figure 7b shows the comparison of the relationship between pellet durability and the pelleting pressure between experimental results and model results. As demonstrated in Figure 7b, the relationship between the predicted pellet durability and pelleting pressure matched well with the trend determined by experiments. The pellet durability increased from 79.4% to 87.8% when the pelleting pressure increased from 18.5 psi to 34.5 psi (127,533 to 237,869.1 Pa) and then became stable when the pelleting pressure increased from 34.5 psi to 50.5 psi (237,869.1 to 348,185.2 Pa). It can be concluded that the pelleting pressure has positive effects on pellet durability. Similar results were also reported by Feng et al. [17], Zhang et al. [18], and Tang et al. [21] in the UV-A pelleting of wheat straw and sorghum stalk. Besides, the effects of pelleting pressure on pellet durability using other pelleting methods and other biomass materials were summarized, as shown in Table 7. It seems that there is a positive correlation between an increase in pellet durability and an increase in pelleting pressure (an increase in pelleting pressure and pellet durability was denoted by an upward arrow).

3.5. Interaction Effects on Pellet Durability

In this section, the interaction effects including the interaction effect between pelleting time and pelleting pressure, the interaction effect between pelleting time and ultrasonic power, and the interaction effect between pelleting pressure and ultrasonic power on pellet durability were investigated. As shown in Figure 8a, the pellet durability increased from 86.8% to 91.4% (increased by 5.3%) at a higher pelleting time level (60 s), and increased from 72.8% to 80.7% (increased by 10.9%) at a lower pelleting time level (30 s) due to the interaction effects between pelleting time and pelleting pressure, when pelleting pressure increased from 25 to 44 psi (172,369 to 303,369 Pa). It can be concluded that the effects of pelleting pressure on pellet durability were more significant at the lower level of pelleting time.
As shown in Figure 8b, the pellet durability increased from 80.5% to 88.7% (increased by 10.2%) at a higher pelleting time level (60 s), and increased from 54.7% to 90.9% (increased by 66.2%) at a lower pelleting time level (30 s) due to the interaction effects between pelleting time and ultrasonic power, when the ultrasonic power increased from 25% to 50%. It can be concluded that the effects of ultrasonic power on the pellet durability were more significant at the lower level of pelleting time.
As shown in Figure 8c, the pellet durability increased from 73.8% to 92.7% (increased by 25.6%) at a higher pelleting pressure level (44 psi or 303,369 Pa), and increased from 63.6% to 88.1% (increased by 38.5%) at a lower pelleting pressure level (25 psi or 172,369 Pa) due to interaction effects between pelleting pressure and ultrasonic power, when ultrasonic power increased from 25% to 50%. Thus, ultrasonic power has a higher effect on pellet durability when the level of pelleting pressure is lower.

3.6. Process Optimization for Achieving High Density and Durability Simultaneously

Since the pellet density and pellet durability is dependent on pelleting time, pelleting pressure, and ultrasonic power and their interaction effects (as demonstrated in previous Section 3.2, Section 3.3, Section 3.4 and Section 3.5), a combined effect of the three input variables were optimized to achieve the desired value of pellet density and pellet durability. To accomplish this goal, a Derringer and Suich’s function [42] was conducted, as a widely used multi-criterion decision-making method for process optimization [43], to optimize the input variables for high density and durability simultaneously. By employing the function, the input factors that optimize (maximize or minimize) a combined desirability of response variables (using the geometric mean) can be obtained. A formulation of the Derringer and Suich’s function was specified as follows:
d i = { 0 y < L ( y L T L ) r L y T 1 y > T
In Equation (9), d i is defined as an individual desirability value with a range from 0 to 1. Each response (that is, the pellet density and pellet durability) was required to be converted into an individual desirability value to perform the Derringer and Suich’s method. L represents the lowest acceptable response value, T denotes the target response value, and y are the predicted values from Equations (6) and (7). In this study, L for pellet density and durability were set to 800 kg/m3 and 80%, respectively. Similarly, T for pellet density and durability were set to 1300 kg/m3 and 95%, respectively. Parameter r was set to 1 under an assumption that each response was equally important. After each response was calculated based on Equation (9), an overall desirability was given by
D = ( d 1 × d 2 × d m ) 1 / m
In Equation (10), parameter m denotes the number of responses, so the above Equation can be further revised as follows:
D = ( d 1 × d 2 ) 1 / 2
By Equation (11), the pellet density and durability can reach 1239 kg/m3 and 93% at the same time when the pelleting time is equal to 44 s, the pelleting pressure is equal to 42 psi (289,580 Pa), and the ultrasonic power is equal to 50%. To compare the results calibrated from the model, additional confirmation experiments were conducted to verify the simulation results. The pellet durability and pellet density collected from the experiments were compared to that estimated by the Derringer and Suich’s desirability function, which demonstrated a good agreement in Table 8.

4. Conclusions

RSM has been successfully used and applied in many diverse areas such as biotechnology [44,45], chemical engineering [46,47], biofuel production [48], energy consumption [49], plant protection [50,51], and clinical practice [52,53]. One major contribution of this methodology is to investigate and quantify the relationships between a set of input variables and outputs of interest. By employing RSM, one can develop mathematical models upon history data (for example, previous experiments). If the model setup is validated and correct, the proposed models can predict and suggest future trends of outputs without requiring additional experiments. Moreover, RSM can help optimize response variables (for example, outputs of interest) by exploring the underlying relationships between input variables and the response variables with a limited number of experiments [54].
In this study, RSM was developed to predict the pellet density and durability in UV-A pelleting of sorghum stalks. By incorporating experimental data from the designed experiment into nonlinear models, the proposed method can predict the effects of pelleting time, pelleting pressure, and ultrasonic power on the pellet density and durability. It was found that three parameters (pelleting time, pelleting pressure, and ultrasonic power) significantly affected the pellet density and durability in UV-A pelleting. As observed in both the experimental and model results, the pellet density and durability escalated when the pelleting time, pelleting pressure, and ultrasonic power increased. Furthermore, the interaction effects including pelleting time × pelleting pressure, pelleting time × ultrasonic power, and pelleting pressure × ultrasonic power were significantly correlated to the pellet durability. An optimal pellet density and durability (1239 kg/m3 and 93%) was obtained when the pelleting time was set at 44 s, the pelleting pressure was set at 42 psi (289,580 Pa), and the ultrasonic power was set at 50% based on the designed experiment. A set of confirmation experiments was conducted to validate the values predicted by the Derringer and Suich’s desirability function. The results from this work demonstrated that RSM can successfully investigate the relationship between the response variable and its influencing variables with the least number of experiments. RSM can be recognized as a promising way to modeling and optimizing the UV-A pelleting and other types of manufacturing process.

Author Contributions

Q.Z. and Z.S. wrote the manuscript; and the experiments designed by Q.Z. and P.Z., who also conducted experiments with M.Z. and Z.L. The RSM model was designed and developed by Q.Z., Z.S., and X.C. Z.S. analyzed the experimental data and performed statistical analysis. Guidance and Supervision were provided by Q.Z. and J.Z.

Funding

This study is supported by NSF award CMMI-0970112, U.S. Department of Transportation Sun Grant Program with Project No. DTOS59-07-G-00053, JiangSu Science Fund award BK20140486 and JiangSu University Fund 14KJB480007, China Postdoc Fund 2014M560448, and CNSF award 51375428.

Acknowledgments

The authors gratefully extend their acknowledgements to Clyde Treadwell at Sonic Mill for providing the pelleting machine.

Conflicts of Interest

The authors declare no conflict of interest.

References

  1. Fargione, J.; Hill, J.; Tilman, D.; Polasky, S.; Hawthorne, P. Land clearing and the biofuel carbon debt. Science 2008, 319, 1235–1238. [Google Scholar] [CrossRef] [PubMed]
  2. Schmer, M.R.; Vogel, K.P.; Varvel, G.E.; Follett, R.F.; Mitchell, R.B.; Jin, V.L. Energy potential and greenhouse gas emissions from bioenergy cropping systems on marginally productive cropland. PLoS ONE 2014, 9, e89501. [Google Scholar] [CrossRef] [PubMed]
  3. Wyman, C.E. Cellulosic ethanol: A unique sustainable liquid transportation fuel. MRS Bull. 2008, 33, 381–383. [Google Scholar] [CrossRef]
  4. Wang, M.; Wu, M.; Hong, H.; Jiahong, L. Life-cycle energy use and greenhouse gas emission implications of brazilian sugarcane esthanol simulated with the greet model. Int. Sugar J. 2008, 110, 527–545. [Google Scholar]
  5. Perlack, R.D.; Eaton, L.M.; Turhollow, A.F., Jr.; Langholtz, M.H.; Brandt, C.C.; Downing, M.E.; Graham, R.L.; Wright, L.L.; Kavkewitz, J.M.; Shamey, A.M. US Billion-Ton Update: Biomass Supply for a Bioenergy and Bioproducts Industry; Agricultural and Biosystems Engineering Technical Reports and White Papers; Iowa State University Digital Repository: Ames, IA, USA, 2011. [Google Scholar]
  6. Zhang, Q.; Heng, L.; Zhang, P.; Pei, Z.; Wang, D.; Wilson, J.; Zhou, J. Comparison of two pelleting methods for cellulosic ethanol manufacturing: Ultrasonic vibration-assisted pelleting vs. Ring-die pelleting. Biomass Convers. Biorefin. 2016, 6, 13–23. [Google Scholar] [CrossRef]
  7. Mani, S.; Tabil, L.; Sokhansanj, S. Compaction of biomass grinds-an overview of compaction of biomass grinds. Powder Handl. Process. 2003, 15, 160–168. [Google Scholar]
  8. Kaliyan, N.; Morey, R.V. Factors affecting strength and durability of densified biomass products. Biomass Bioenergy 2009, 33, 337–359. [Google Scholar] [CrossRef]
  9. Mani, S.; Sokhansanj, S.; Bi, X.; Turhollow, A. Economics of producing fuel pellets from biomass. Appl. Eng. Agric. 2006, 22, 421–426. [Google Scholar] [CrossRef]
  10. Sokhansanj, S.; Turhollow, A. Biomass densification-cubing operations and costs for corn stover. Appl. Eng. Agric. 2004, 20, 495–502. [Google Scholar] [CrossRef]
  11. Sokhansanj, S.; Turhollow, A.; Tagore, S. Integrating biomass feedstock with an existing grain handling system for biofuels. In Proceedings of the 2006 ASAE Annual Meeting, Portland, OR, USA, 9–12 July 2006; Volume 12. [Google Scholar]
  12. Sokhansanj, S.; Mani, S.; Bi, X.; Zaini, P.; Tabil, L. Binderless pelletization of biomass. In Proceedings of the 2005 ASAE Annual Meeting, Tampa, FL, USA, 17–20 July 2005; p. 1. [Google Scholar]
  13. Zhang, Q.; Zhang, P.; Pei, Z.; Xu, F.; Wang, D.; Vadlani, P. Effects of ultrasonic vibration-assisted pelleting on chemical composition and sugar yield of corn stover and sorghum stalk. Renew. Energy 2015, 76, 160–166. [Google Scholar] [CrossRef]
  14. Stelte, W. Guideline: Storage and Handling of Wood Pellets; Resultat Kontrakt (RK) Report; Danish Technological Institute: Taastrup, Denmark, December 2012. [Google Scholar]
  15. Zafari, A.; Kianmehr, M.H. Effect of temperature, pressure and moisture content on durability of cattle manure pellet in open-end die method. J. Agric. Sci. 2012, 4, 203. [Google Scholar] [CrossRef]
  16. Temmerman, M.; Rabier, F.; Jensen, P.D.; Hartmann, H.; Böhm, T. Comparative study of durability test methods for pellets and briquettes. Biomass Bioenergy 2006, 30, 964–972. [Google Scholar] [CrossRef]
  17. Feng, Q.; Cong, W.; Zhang, M.; Pei, Z.; Ren, C. An experimental study on temperature in ultrasonic vibration-assisted pelleting of cellulosic biomass. In Proceedings of the ASME 2010 International Manufacturing Science and Engineering Conference, Erie, PA, USA, 12–15 October 2010; American Society of Mechanical Engineers: New York, NY, USA, 2010; pp. 519–524. [Google Scholar]
  18. Zhang, Q.; Zhang, P.; Deines, T.; Pei, Z.; Wang, D.; Wu, X.; Pritchett, G. Ultrasonic vibration-assisted pelleting of sorghum stalks: Effects of pressure and ultrasonic power. In Proceedings of the ASME 2010 International Manufacturing Science and Engineering Conference, Erie, PA, USA, 12–15 October 2010; American Society of Mechanical Engineers: New York, NY, USA, 2010; pp. 129–135. [Google Scholar]
  19. Nottingham, D.; Pei, Z.; Zhang, M.; Deines, T. The effects of pelleting time and ultrasonic power during ultrasonic vibration-assisted pelleting of switchgrass. In Proceedings of the IIE Annual Conference, Cancun, MX, USA, 5–9 June 2010; Institute of Industrial Engineers: Manhattan, KS, USA, 2010; p. 1. [Google Scholar]
  20. Song, X.; Zhang, M.; Pei, Z.; Wang, D. Ultrasonic vibration-assisted (uv-a) pelleting of wheat straw: A constitutive model for pellet density. Ultrasonics 2015, 60, 117–125. [Google Scholar] [CrossRef] [PubMed]
  21. Tang, Y.; Cong, W.; Xu, J.; Zhang, P.; Liu, D. Ultrasonic vibration-assisted pelleting for cellulosic biofuels manufacturing: A study on in-pellet temperatures. Renew. Energy 2015, 76, 296–302. [Google Scholar] [CrossRef]
  22. Zhang, P.; Deines, T.; Nottingham, D.; Pei, Z.; Wang, D.; Wu, X. Ultrasonic vibration-assisted pelleting of biomass: A designed experimental investigation on pellet quality and sugar yield. In Proceedings of the ASME 2010 International Manufacturing Science and Engineering Conference, Erie, PA, USA, 12–15 October 2010; American Society of Mechanical Engineers: New York, NY, USA, 2010; pp. 137–145. [Google Scholar]
  23. Fan, K.; Zhang, P.; Pei, Z. Ultrasonic vibration-assisted pelleting of wheat straw: A predictive model for pellet density using response surface methodology. Biofuels 2012, 3, 259–267. [Google Scholar] [CrossRef]
  24. Khuri, A.I.; Cornell, J.A. Response Surfaces: Designs and Analyses; CRC Press: Boca Raton, FL, USA, 1996; Volume 152. [Google Scholar]
  25. Sluiter, A.; Hames, B.; Hyman, D.; Payne, C.; Ruiz, R.; Scarlata, C.; Sluiter, J.; Templeton, D.; Wolfe, J. Determination of Total Solids in Biomass and Total Dissolved Solids in Liquid Process Samples; NREL Technical Report No. NREL/TP-510-42621; National Renewable Energy Laboratory: Golden, CO, USA, 2008; pp. 1–6.
  26. Gunst, R.F. Response Surface Methodology: Process and Product Optimization Using Designed Experiments; Taylor & Francis Group: Park Drive, UK, 1996. [Google Scholar]
  27. Tabil, L.; Sokhansanj, S. Process conditions affecting the physical quality of alfalfa pellets. Appl. Eng. Agric. 1996, 12, 345–350. [Google Scholar] [CrossRef]
  28. ASABE Standards 269.4. Cubes. Pellets and Crumbles—Definitions and Methods for Determining Density, Durability and Moisture Content; American Society of Agricultural Engineers: St. Joseph, MI, USA, 2007. [Google Scholar]
  29. Mani, S.; Tabil, L.G.; Sokhansanj, S. Effects of compressive force, particle size and moisture content on mechanical properties of biomass pellets from grasses. Biomass Bioenergy 2006, 30, 648–654. [Google Scholar] [CrossRef]
  30. Mani, S.; Tabil, L.G.; Sokhansanj, S. Specific energy requirement for compacting corn stover. Bioresour. Technol. 2006, 97, 1420–1426. [Google Scholar] [CrossRef] [PubMed]
  31. Wongsiriamnuay, T.; Tippayawong, N. Effect of densification parameters on the properties of maize residue pellets. Biosyst. Eng. 2015, 139, 111–120. [Google Scholar] [CrossRef]
  32. Križan, P.; Matú, M.; Šooš, Ľ.; Beniak, J. Behavior of beech sawdust during densification into a solid biofuel. Energies 2015, 8, 6382–6398. [Google Scholar] [CrossRef]
  33. Husain, Z.; Zainac, Z.; Abdullah, Z. Briquetting of palm fibre and shell from the processing of palm nuts to palm oil. Biomass Bioenergy 2002, 22, 505–509. [Google Scholar] [CrossRef]
  34. Sundaram, V.; Muthukumarappan, K. Influence of afex™ pretreated corn stover and switchgrass blending on the compaction characteristics and sugar yields of the pellets. Ind. Crops Prod. 2016, 83, 537–544. [Google Scholar] [CrossRef]
  35. Al-Widyan, M.; Al-Jalil, H. Stress-density relationship and energy requirement of compressed olive cake. Appl. Eng. Agric. 2001, 17, 749–754. [Google Scholar]
  36. Adapa, P.; Tabil, L.; Schoenau, G. Compaction characteristics of barley, canola, oat and wheat straw. Biosyst. Eng. 2009, 104, 335–344. [Google Scholar] [CrossRef]
  37. Mišljenović, N.; Čolović, R.; Vukmirović, Đ.; Brlek, T.; Bringas, C.S. The effects of sugar beet molasses on wheat straw pelleting and pellet quality. A comparative study of pelleting by using a single pellet press and a pilot-scale pellet press. Fuel Process. Technol. 2016, 144, 220–229. [Google Scholar] [CrossRef]
  38. Hu, Q.; Yang, H.; Yao, D.; Zhu, D.; Wang, X.; Shao, J.; Chen, H. The densification of bio-char: Effect of pyrolysis temperature on the qualities of pellets. Bioresour. Technol. 2016, 200, 521–527. [Google Scholar] [CrossRef] [PubMed]
  39. Feng, Q.; Cong, W.; Zhang, M.; Pei, Z.; Ren, C. An experimental study on charring of cellulosic biomass in ultrasonic vibration-assisted pelleting. Int. J. Manuf. Res. 2011, 6, 77–86. [Google Scholar] [CrossRef]
  40. Zhang, Q.; Zhang, P.; Pei, Z.; Wilson, J.; McKinney, L.; Pritchett, G. Ultrasonic-vibration assisted pelleting for cellulosic ethanol manufacturing: An experimental investigation of power consumption. In Proceedings of the ASME 2011 International Mechanical Engineering Congress and Exposition, Denver, CO, USA, 11–17 November 2011; American Society of Mechanical Engineers: New York, NY, USA, 2011; pp. 295–303. [Google Scholar]
  41. Gong, C.; Lu, D.; Wang, G.; Tabil, L.; Wang, D. Compression characteristics and energy requirement of briquettes made from a mixture of corn stover and peanut shells. BioResources 2015, 10, 5515–5531. [Google Scholar] [CrossRef]
  42. Derringer, G. Simultaneous optimization of several response variables. J. Qual. Technol. 1980, 12, 214–219. [Google Scholar] [CrossRef]
  43. Bourguignon, B.; Massart, D. Simultaneous optimization of several chromatographic performance goals using derringer's desirability function. J. Chromatogr. A 1991, 586, 11–20. [Google Scholar] [CrossRef]
  44. Kaushik, J.; Tandon, S.; Gupta, V.; Nayyar, J.; Singla, S.K.; Tandon, C. Response surface methodology based extraction of tribulus terrestris leads to an upsurge of antilithiatic potential by inhibition of calcium oxalate crystallization processes. PLoS ONE 2017, 12, e0183218. [Google Scholar] [CrossRef] [PubMed]
  45. Fang, H.; Dong, H.; Cai, T.; Zheng, P.; Li, H.; Zhang, D.; Sun, J. In vitro optimization of enzymes involved in precorrin-2 synthesis using response surface methodology. PLoS ONE 2016, 11, e0151149. [Google Scholar] [CrossRef] [PubMed]
  46. Zhou, X.; Zhou, S.; Feng, X. Optimization of the photoelectrocatalytic oxidation of landfill leachate using copper and nitrate co-doped tio2 (ti) by response surface methodology. PLoS ONE 2017, 12, e0171234. [Google Scholar] [CrossRef] [PubMed]
  47. Anguebes-Franseschi, F.; Abatal, M.; Bassam, A.; Escalante Soberanis, M.A.; May Tzuc, O.; Bucio-Galindo, L.; Cordova Quiroz, A.V.; Aguilar Ucan, C.A.; Ramirez-Elias, M.A. Esterification optimization of crude african palm olein using response surface methodology and heterogeneous acid catalysis. Energies 2018, 11, 157. [Google Scholar] [CrossRef]
  48. Xu, F.; Theerarattananoon, K.; Wu, X.; Pena, L.; Shi, Y.-C.; Staggenborg, S.; Wang, D. Process optimization for ethanol production from photoperiod-sensitive sorghum: Focus on cellulose conversion. Ind. Crops Prod. 2011, 34, 1212–1218. [Google Scholar] [CrossRef]
  49. Song, X.; Zhang, M.; Pei, Z.J.; Wang, D. Ultrasonic vibration-assisted pelleting of wheat straw: A predictive model for energy consumption using response surface methodology. Ultrasonics 2014, 54, 305–311. [Google Scholar] [CrossRef] [PubMed]
  50. Hou, W.; Zhang, W.; Chen, G.; Luo, Y. Optimization of extraction conditions for maximal phenolic, flavonoid and antioxidant activity from melaleuca bracteata leaves using the response surface methodology. PLoS ONE 2016, 11, e0162139. [Google Scholar] [CrossRef] [PubMed]
  51. Sebayang, A.H.; Hassan, M.H.; Ong, H.C.; Dharma, S.; Silitonga, A.S.; Kusumo, F.; Mahlia, T.M.I.; Bahar, A.H. Optimization of reducing sugar production from manihot glaziovii starch using response surface methodology. Energies 2017, 10, 35. [Google Scholar] [CrossRef]
  52. Liu, W.; Ji, J.; Chen, H.; Ye, C. Optimal color design of psychological counseling room by design of experiments and response surface methodology. PLoS ONE 2014, 9, e90646. [Google Scholar] [CrossRef] [PubMed]
  53. Shi, Z.; Chapes, S.K.; Ben-Arieh, D.; Wu, C.-H. An agent-based model of a hepatic inflammatory response to salmonella: A computational study under a large set of experimental data. PLoS ONE 2016, 11, e0161131. [Google Scholar] [CrossRef] [PubMed]
  54. Khuri, A.I.; Mukhopadhyay, S. Response surface methodology. Wiley Interdiscip. Rev. Comput. Stat. 2010, 2, 128–149. [Google Scholar] [CrossRef]
Figure 1. The illustration of the experimental set-up for ultrasonic vibration-assisted (UV-A) pelleting.
Energies 11 01214 g001
Figure 2. The effects of pelleting time on the pellet density. (a) The predicted pellet density at different levels of ultrasonic power (ranging from 16.5% to 58.5%) as the pelleting pressure was fixed to 34.5 psi (237,869.1 Pa) and the pelleting time increased from 30 s to 60 s. (b) For the pellet density, the comparison between the model results and experimental results at various levels of pelleting time (mean value ± SD).
Energies 11 01214 g002
Figure 3. The effects of ultrasonic power on the pellet density. (a) The predicted pellet density in relation to the ultrasonic power at various levels of pelleting pressure (ranging from 17 psi to 50 psi) when the pelleting time was set to 45 s and the ultrasonic power increased from 25% to 50%. (b) For pellet density, the comparison between the model results and experimental results at various levels of ultrasonic power (mean value ± SD).
Energies 11 01214 g003
Figure 4. The effects of pelleting pressure on the pellet density. (a) The predicted pellet density in relation to pelleting pressure at different levels of pelleting time (ranging from 20 s to 70 s) when the ultrasonic power was set to 37.5% and the pelleting pressure increased from 25 psi to 44 psi. (b) For pellet density, the comparison between the model results and experimental results at various levels of pelleting pressure (mean value ± SD).
Energies 11 01214 g004
Figure 5. The effects of pelleting time on pellet durability. (a) The predicted pellet durability in relation to the pelleting time at different levels of ultrasonic power (ranging from 16.5% to 58.5%) when the pelleting pressure was set to 34.5 psi (237,869.1 Pa) and the pelleting time increased from 30 s to 60 s. (b) For pellet durability, the comparison between the model results and experimental results at various levels of pelleting time (mean value ± SD).
Energies 11 01214 g005
Figure 6. The effects of ultrasonic power on pellet durability. (a) The predicted pellet durability in relation to ultrasonic power at different levels of pelleting pressure (ranging from 17 psi to 50 psi) when the pelleting time was set to 45 s and the ultrasonic power increased from 25% to 50%. (b) For pellet durability, the comparison between the model results and experimental results at various levels of ultrasonic power (mean value ± SD).
Energies 11 01214 g006
Figure 7. The effects of pelleting pressure on pellet durability. (a) The predicted pellet durability in relation to pelleting pressure at different levels of pelleting time (ranging from 20 s to 70 s) when the ultrasonic power was set to 37.5% and the pelleting pressure increased from 25 psi to 44 psi. (b) For pellet durability, the comparison between model results and experimental results at various levels of pelleting pressure (mean value ± SD).
Energies 11 01214 g007
Figure 8. The interaction effects of pelleting time, pelleting pressure, and ultrasonic power on pellet durability. (a) The pellet durability in relation to pelleting time and pressure in a three-dimensional response surface. Pelleting pressure ranged from 25 psi to 44 psi and pelleting time ranged from 30 s to 60 s, respectively. (b) The pellet durability in relation to pelleting time and ultrasonic power in a three-dimensional response surface. Ultrasonic power ranged from 25% to 50% and pelleting time ranged from 30 s to 60 s, respectively. (c) The pellet durability in relation to pelleting pressure and ultrasonic power in a three-dimensional response surface. Ultrasonic power ranged from 25% to 50% and pelleting pressure ranged from 25 psi to 44 psi, respectively.
Energies 11 01214 g008
Table 1. The experimental results based on a central composite design.
Test
#
Pelleting
Time (s)
Pressure
(psi)
Ultrasonic
Power (%)
Density
(kg/m3)
Durability
(%)
14534.558.51267.787.7
24534.537.51118.286.2
33044501148.491.5
46044251049.081.1
54534.537.51124.991.1
64534.537.51078.187.4
7304425960.859.0
84534.537.51087.287.2
97034.537.51152.289.9
102034.537.5960.471.7
114534.537.51112.886.8
126044501243.789.7
13602525937.175.0
144518.537.5901.279.4
154550.537.51170.188.4
164534.516.5947.253.8
173025501055.786.9
18302525762.343.6
196025501157.285.5
204534.537.51105.088.2
Table 2. The analysis of variance (ANOVA) results of the pellet density in a full model.
Source of VariationSum of SquareDegree of FreedomMean SquareF-Valuep-Value
Model282,332.71931,370.3047.97<0.0001 *
A-Pelleting time44,816.60144,816.6068.53<0.0001 *
B-Pressure64,959.70164,959.7099.33<0.0001 *
C-Ultrasonic power150,751.841150,751.84230.51<0.0001 *
AB1076.6111076.611.650.2284
AC546.721546.720.840.3821
BC2149.7512149.753.290.0999
A27130.0417130.0410.900.0080 *
B212,601.97112,601.9719.270.0014 *
C2247.821247.820.380.5519
Residual6539.9110653.99--
Lack of Fit4873.265974.652.920.13
Pure error1666.665333.33--
Total28,8872.6219---
“*” means the highly statistical significance.
Table 3. The ANOVA results of pellet density in a reduced model.
Source of VariationSum of SquareDegree of FreedomMean SquareF-Valuep-Value
Model278,300555,656.4873.72<0.0001 *
A-Pelleting time44,819.95144,819.9559.37<0.0001 *
B-Pressure64,952.84164,952.8486.03<0.0001 *
C-Ultrasonic power150,7001-199.66<0.0001 *
A26938.4416938.449.190.0090 *
B212,354.48112,354.4816.360.0012 *
Residual10,569.8214754.99--
Lack of Fit8900.699988.972.960.122
Pure error1669.135333.83--
Total-19---
Table 4. The effects of pressure on pellet density by using other pelleting methods.
Pelleting MethodPelleting Pressure Range (psi)TrendsPellet Density Range (kg/m3)TrendsMaterialRef.
Piston press45,68.7–21,828.2618–1135Wheat and barley straws, corn stover and switchgrass[29]
Piston press725.2–2175.6650–950Corn stover[30]
Piston press21,755.7–36,259.4850–1073Cob, stalk, and husk[31]
Hydraulic press4496.2–46,122836.7–1078.3Beech sawdust[32]
Hydraulic press725.2–1958.01100–1200Fibre and shell residues[33]
Piston press4583.2–22,916723.27–1416.25Corn stover and switchgrass[34]
Hydraulic press2175.6–6526.71210–1256Olive cake[35]
Piston press4583.2–20,145.7813–1011Barley, canola, oat, and wheat straw[36]
Piston press10,877.8–43,511.3644–1292Wheat straw[37]
Piston press4641.21–32,488.5643.32–700.35Woody shavings[38]
Table 5. The ANOVA results of pellet durability in a full model.
Source of VariationSum of SquareDegree of FreedomMean SquareF-Valuep-Value
Model3408.259378.6978.41<0.0001 *
A-Time479.331479.3399.25<0.0001 *
B-Pressure151.171151.1731.300.0002 *
C-Ultrasonic power1689.8111689.81349.88<0.0001 *
AB11.76111.762.440.1497
AC401.861401.8683.21<0.0001 *
BC20.16120.164.170.0683
A2110.731110.7322.930.0007 *
B240.48140.488.380.0160 *
C2576.551576.55119.38<0.0001 *
Residual48.30104.83--
Lack of Fit33.1756.632.190.2046
Pure error15.1353.03--
Total3456.5519---
Table 6. The ANOVA results of pellet durability in a reduced model.
Source of VariationSum of SquareDegree of FreedomMean SquareF-Valuep-Value
Model3376.337482.3372.15<0.0001 *
A-Time479.331479.3371.70<0.0001 *
B-Pressure151.171151.1722.610.0005 *
C-Ultrasonic power1689.8111689.81252.78<0.0001 *
AC401.861401.8660.11<0.0001 *
A2110.731110.7316.560.0016 *
B240.48140.486.050.0300 *
C2576.551576.5586.25<0.0001 *
Residual80.22126.68--
Lack of Fit65.0979.303.070.1173
Pure error15.1353.03--
Total3456.5519---
Table 7. The effects of pelleting pressure on pellet durability by using other pelleting methods.
Pelleting MethodPelleting Pressure Range (psi)TrendsPellet Durability Range (%)TrendsMaterialRef.
Piston press725.2–2175.667–94Corn stover[30]
Piston press21,755.7–36,259.428–60Cob, stalk, and husk[31]
Piston press0–13,053.462.9–88.9Mixture of corn stover and peanut shells[41]
Table 8. The results of the confirmation experiments.
ComparisonUV-A Pelleting ParametersResponsePellet Durability (%)
Pelleting Time (s)Pelleting Pressure (psi)Ultrasonic Power (%)Pellet Density (kg/m3)
Experimental value444250120489
Predicted value444250123993
Error (%)0002.824.30

