Article

A TODIM-Based Investment Decision Framework for Commercial Distributed PV Projects under the Energy Performance Contracting (EPC) Business Model: A Case in East-Central China

1
School of Economics and Management, North China Electric Power University, Beijing 102206, China
2
Beijing Key Laboratory of New Energy and Low-Carbon Development, North China Electric Power University, Changping, Beijing 102206, China
*
Author to whom correspondence should be addressed.
Energies 2018, 11(5), 1210; https://doi.org/10.3390/en11051210
Submission received: 29 March 2018 / Revised: 28 April 2018 / Accepted: 5 May 2018 / Published: 9 May 2018
(This article belongs to the Section A: Sustainable Energy)

Abstract

:
Distributed photovoltaic (DPV) projects have been rapidly proposed in China due to policy promotion, and investment decisions immensely decide the success of DPV projects. This paper aims to propose an investment decision framework for DPV projects under the energy performance contracting (EPC) business model which is currently vigorously promoted in China, thereby improving the efficiency and accuracy of decision making. Firstly, the distinctive criteria system for DPV project investment decision is established, including natural, market, technical, policy, competitive and economic factors. Secondly, the weights of criteria are determined by integrating subjective and objective weights to obtain more accurate weights. Then, the TODIM (an acronym in Portuguese of interactive and multicriteria decision making) approach is utilized to rank the alternative DPV projects, taking into account investors’ psychological behavior. Finally, a case study in central and eastern China is carried out to illustrate the rationality and feasibility of the proposed framework. The results show that the Project A4 located in Nanchang City is the optimal project, and the rank of alternatives is sensitive to the recession coefficient. This paper provides insightful information for the DPV investors with different risk preferences to evaluate the investment performance of EPC projects and select the most appropriate one under uncertain environment.

1. Introduction

With the continuous depletion of non-renewable resources such as coal, oil and natural gas over the past decades, solar energy will eventually replace other resources to be the main stream. The development of clean renewable energy (RE) has become an inevitable choice for countries to achieve energy restructuring. According to the International Energy Agency (IEA) estimates, the share of RE production in total electricity generation will increase from 21% in 2012 to 33% in 2020 [1]. Since the 21st century, as a national strategic emerging industry, China’s photovoltaic (PV) industry has developed rapidly. Its capacity and output rank first in the world. However, the unbalanced development of the domestic PV market leads to excess capacity: China’s northwestern region, which is rich in solar energy resources, mainly builds concentrated PVs. However, there is serious solar curtailment phenomenon in Gansu and Xinjiang provinces. Moreover, the demand for electricity in central and eastern regions is large, and solar energy resources are relatively insufficient. In order to accelerate the development of the domestic market and solve the problem of excess production capacity, it is imperative to accelerate the development of distributed photovoltaic (DPV) in the central and eastern regions [2].
China’s new round of power system reform is focused on energy structural problems, that is, transformation and upgrading. Thus, there is an urgent need to accelerate the construction of new energy power. As a kind of new energy power generation, PV power generation has clean, renewable, energy conservation and emissions reduction advantages and huge potential for development. It is suitable for modern social concept and has received widespread attention in the world today. 
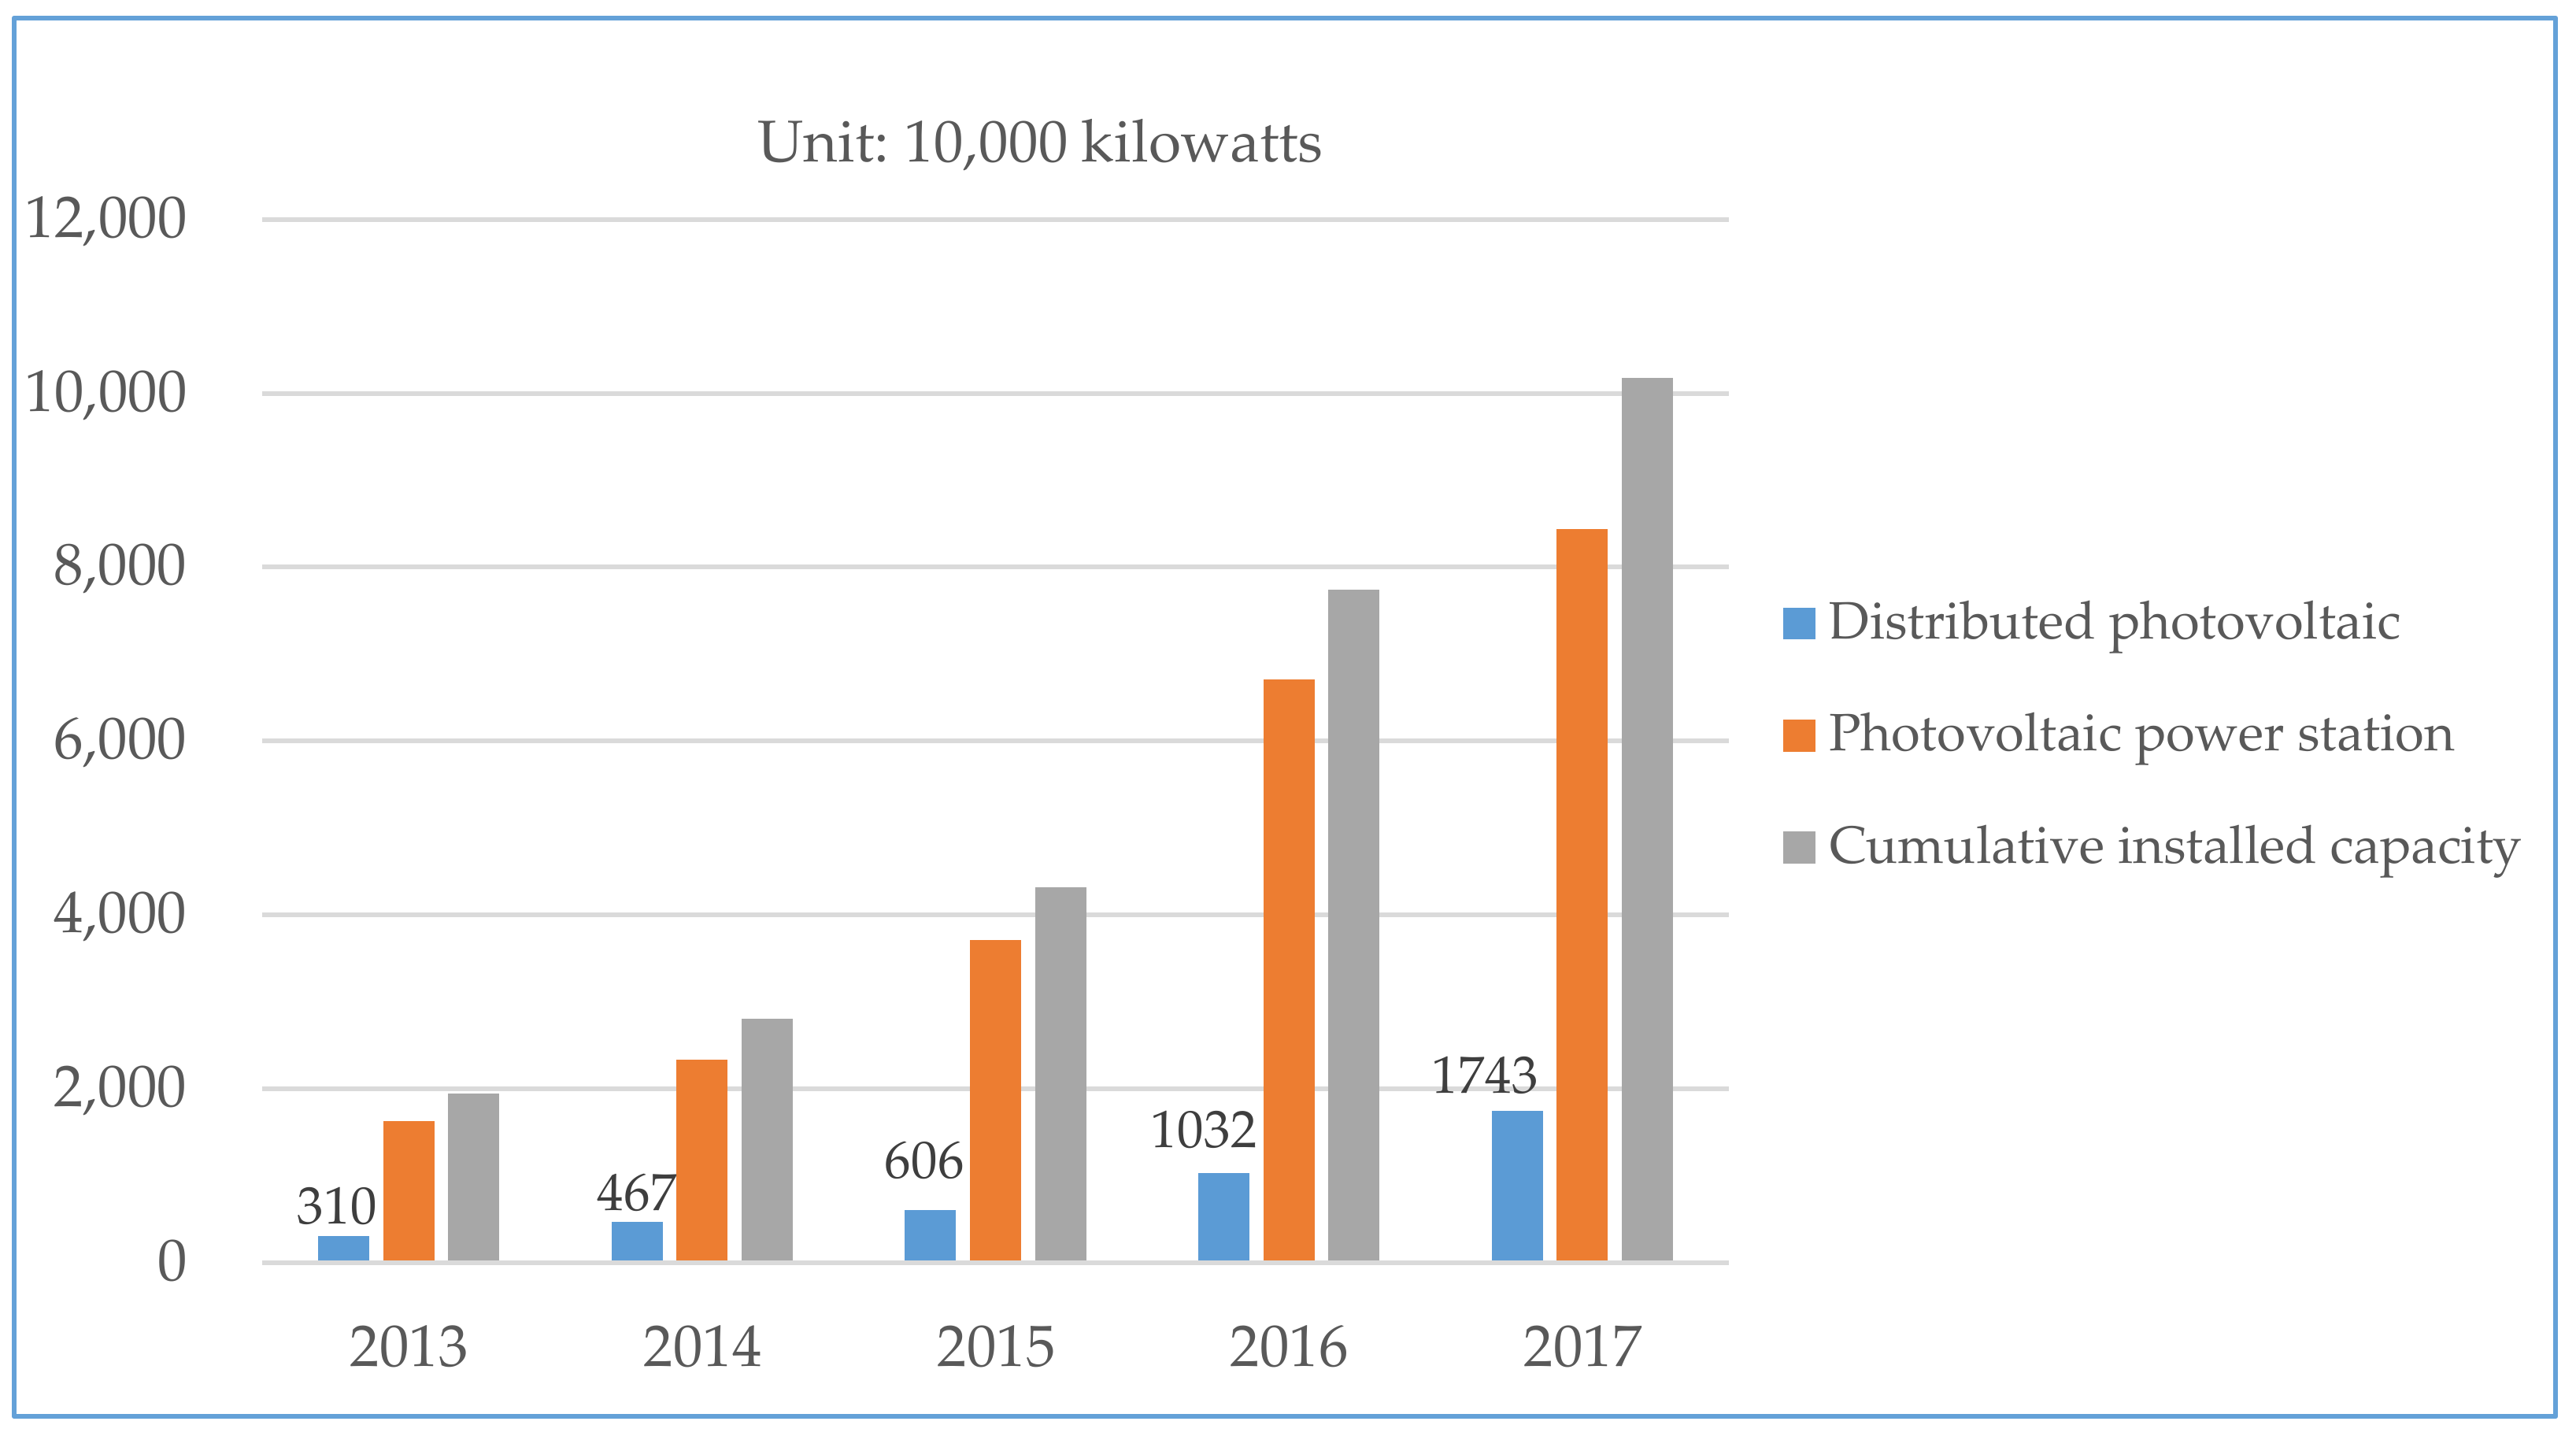
Figure 1 shows the rapid increase of installed PV power generation capacity in China from 2013 to 2017. In particular, in the first half of 2017, China’s newly installed PV power generation capacity was 24.4 million kilowatts, with an increase of 9% year-on-year. The National Energy Administration has adopted a series of measures to promote the implementation of the “leadership” plan for PV power generation and the “leadership base” construction plan. The local government and power grids regard DPV power generation as an assessment indicator for the performance. In addition, with a series of policies such as financial subsidies, acquisition of electricity security, and administrative licensing exemptions, more and more companies have joined the DPV investment. Therefore, how the government should control investment and review projects, especially how investors choose appropriate DPV power generation projects to invest has become a hot issue worth exploring.
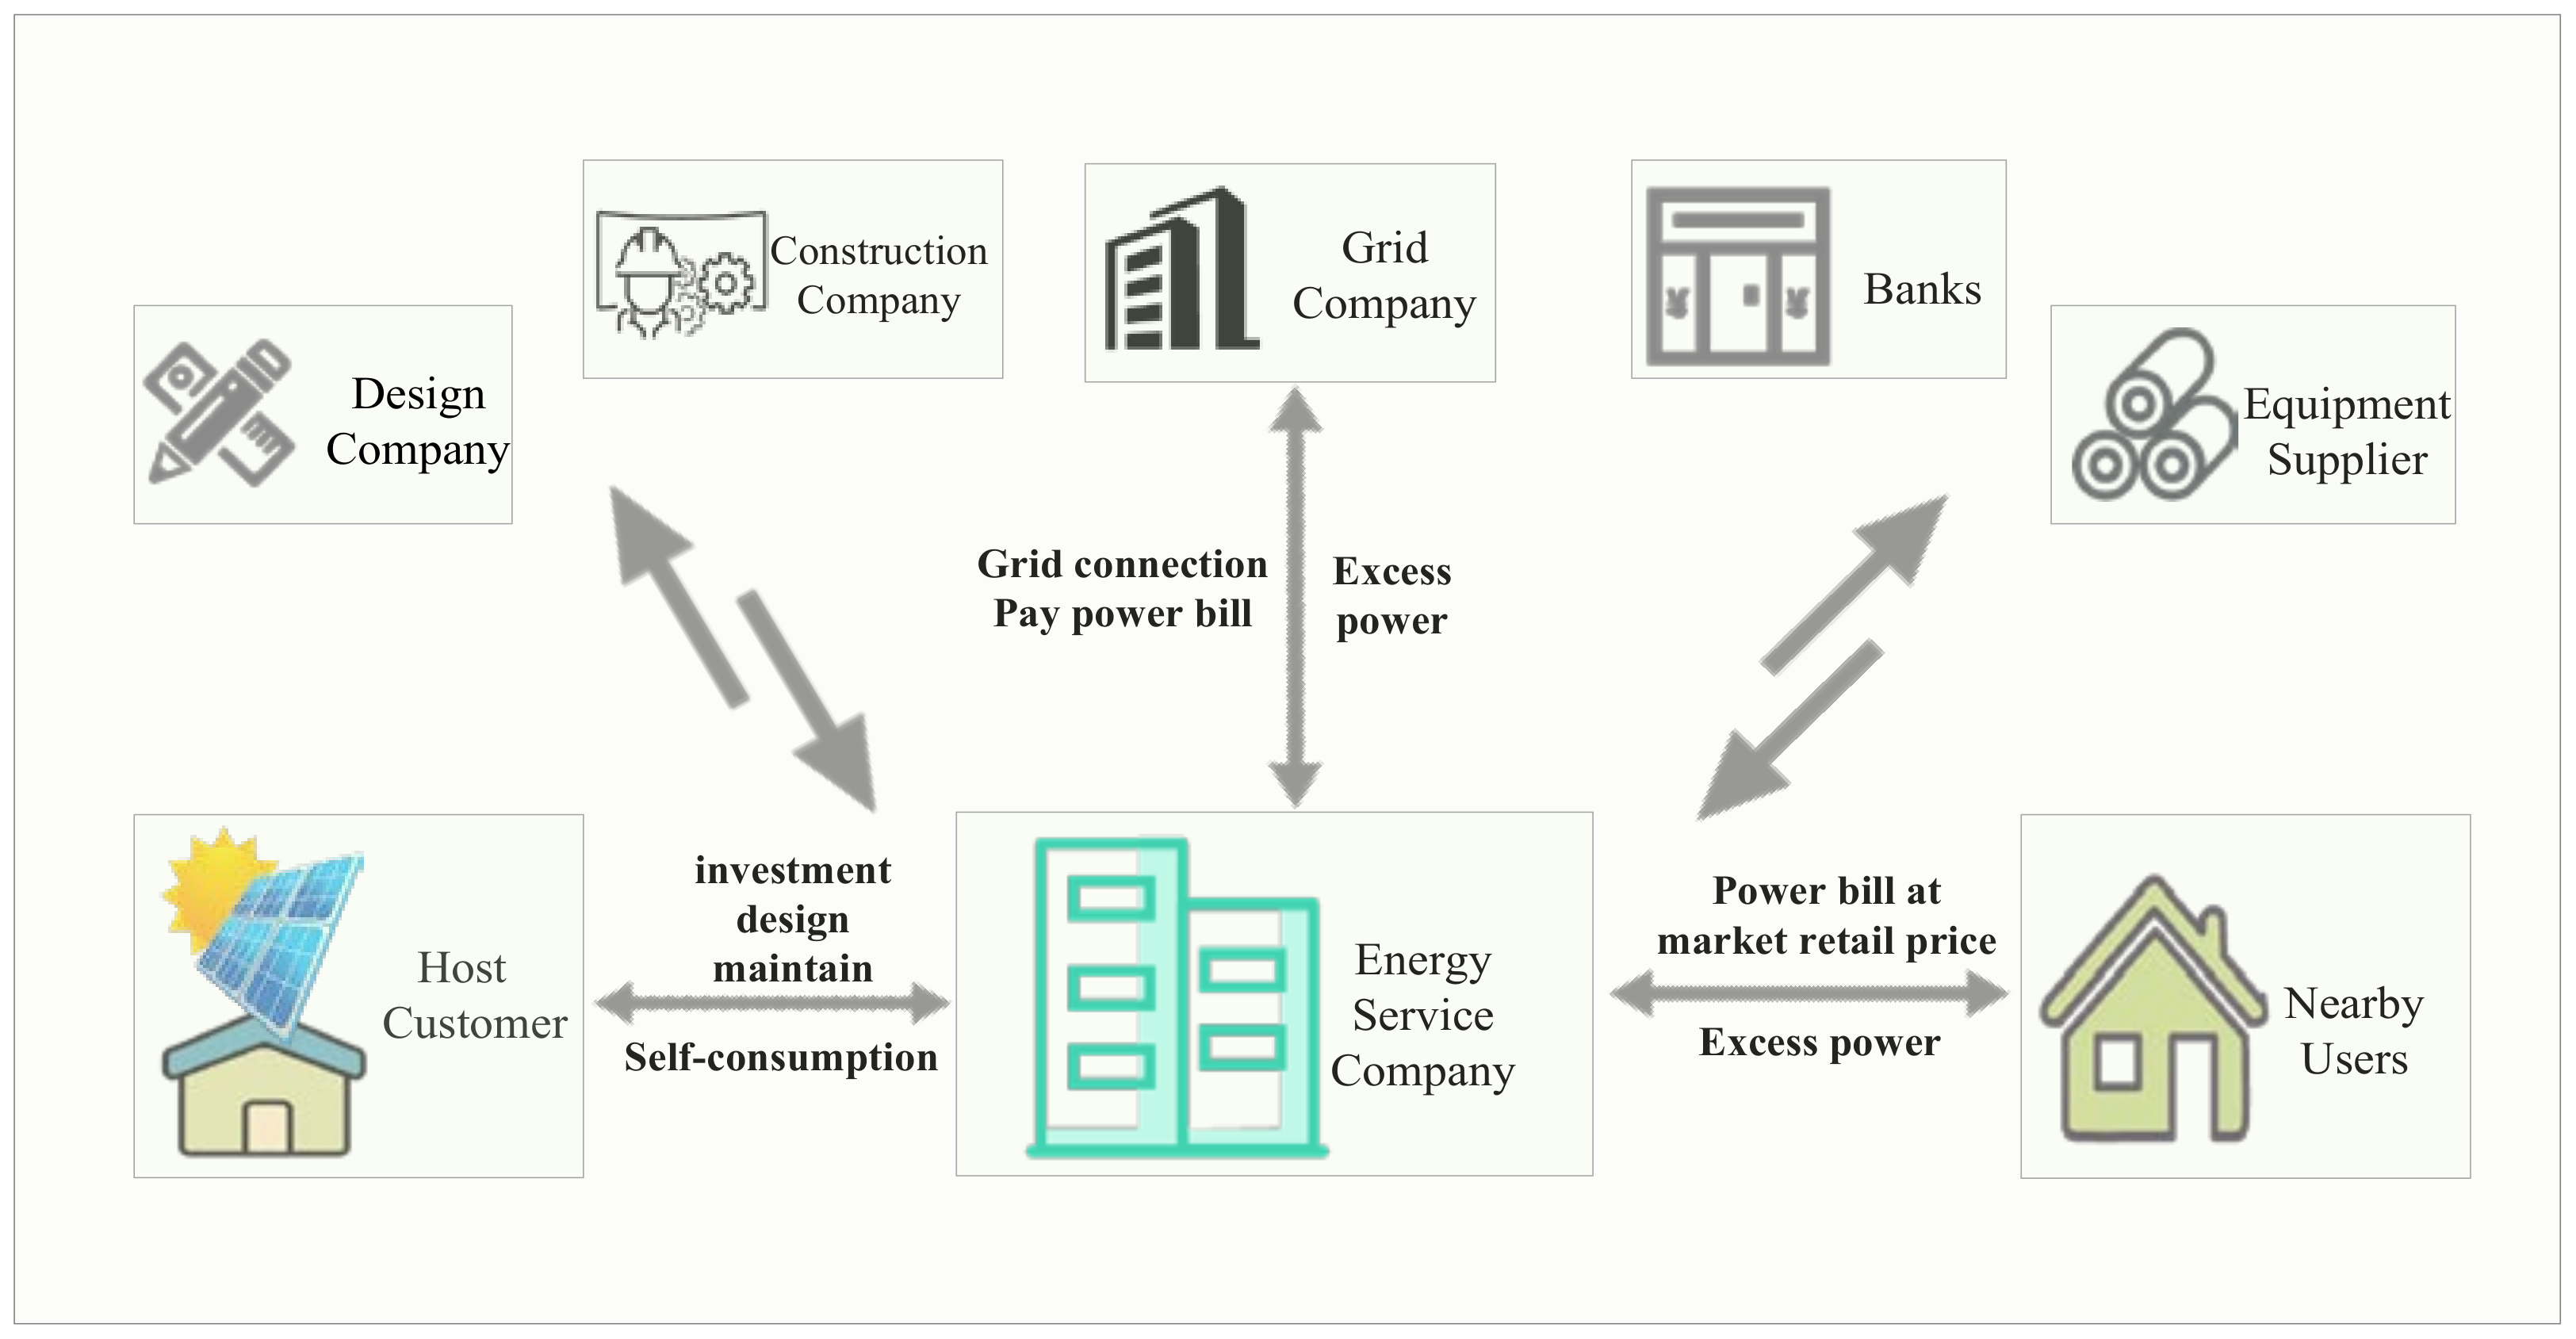
At present, the business models of China’s DPV power generation projects have diversified by introducing pluralistic investment entity. There are mainly three types of operational models, namely energy performance contracting (EPC), lease, and user self-use model. Despite of three models, there are only two types of billing methods with the power grid. One is to use part of the power for contract users themselves, and the remaining power is used for on-grid settlement, the other is the full amount of power generation on-grid settlement.
The essence of the EPC business model is that users have electricity demand, third-party investors who also receive corresponding benefits from project provide users with a complete solution to achieve a win-win goal [3]. EPC business model is the focus of this paper, which refers to a third-party investor invests in DPV power supply, responsible for project financing, design, construction, maintenance, etc. (Figure 2) Investors adopt “nearby using the surplus to grid” approach to settlement with the grid power (GC). In addition, under this model, third-party investors act to some extent as the role of power sales companies. This is exactly the direction advocated by the new round of power system reform that China is currently vigorously promoting. The EPC model helps to drive further opening of the power selling side, introducing multiple entities to participate in the competition for power sales. Third-party investors in contract energy management, as power supply service providers, have the natural advantage of becoming power sellers and have enormous potential for development in the future. The investor’s project revenue under EPC model will be introduced in the next chapter.
The main questions studied in this paper are: (1) which factors are influencing investment in DPV power generation projects? In addition, which factors are more important? (2) How the EPC business model has affected the project revenue? (3) What are the differences in decision making after considering the psychological characteristics of risk avoidance and loss of investors?
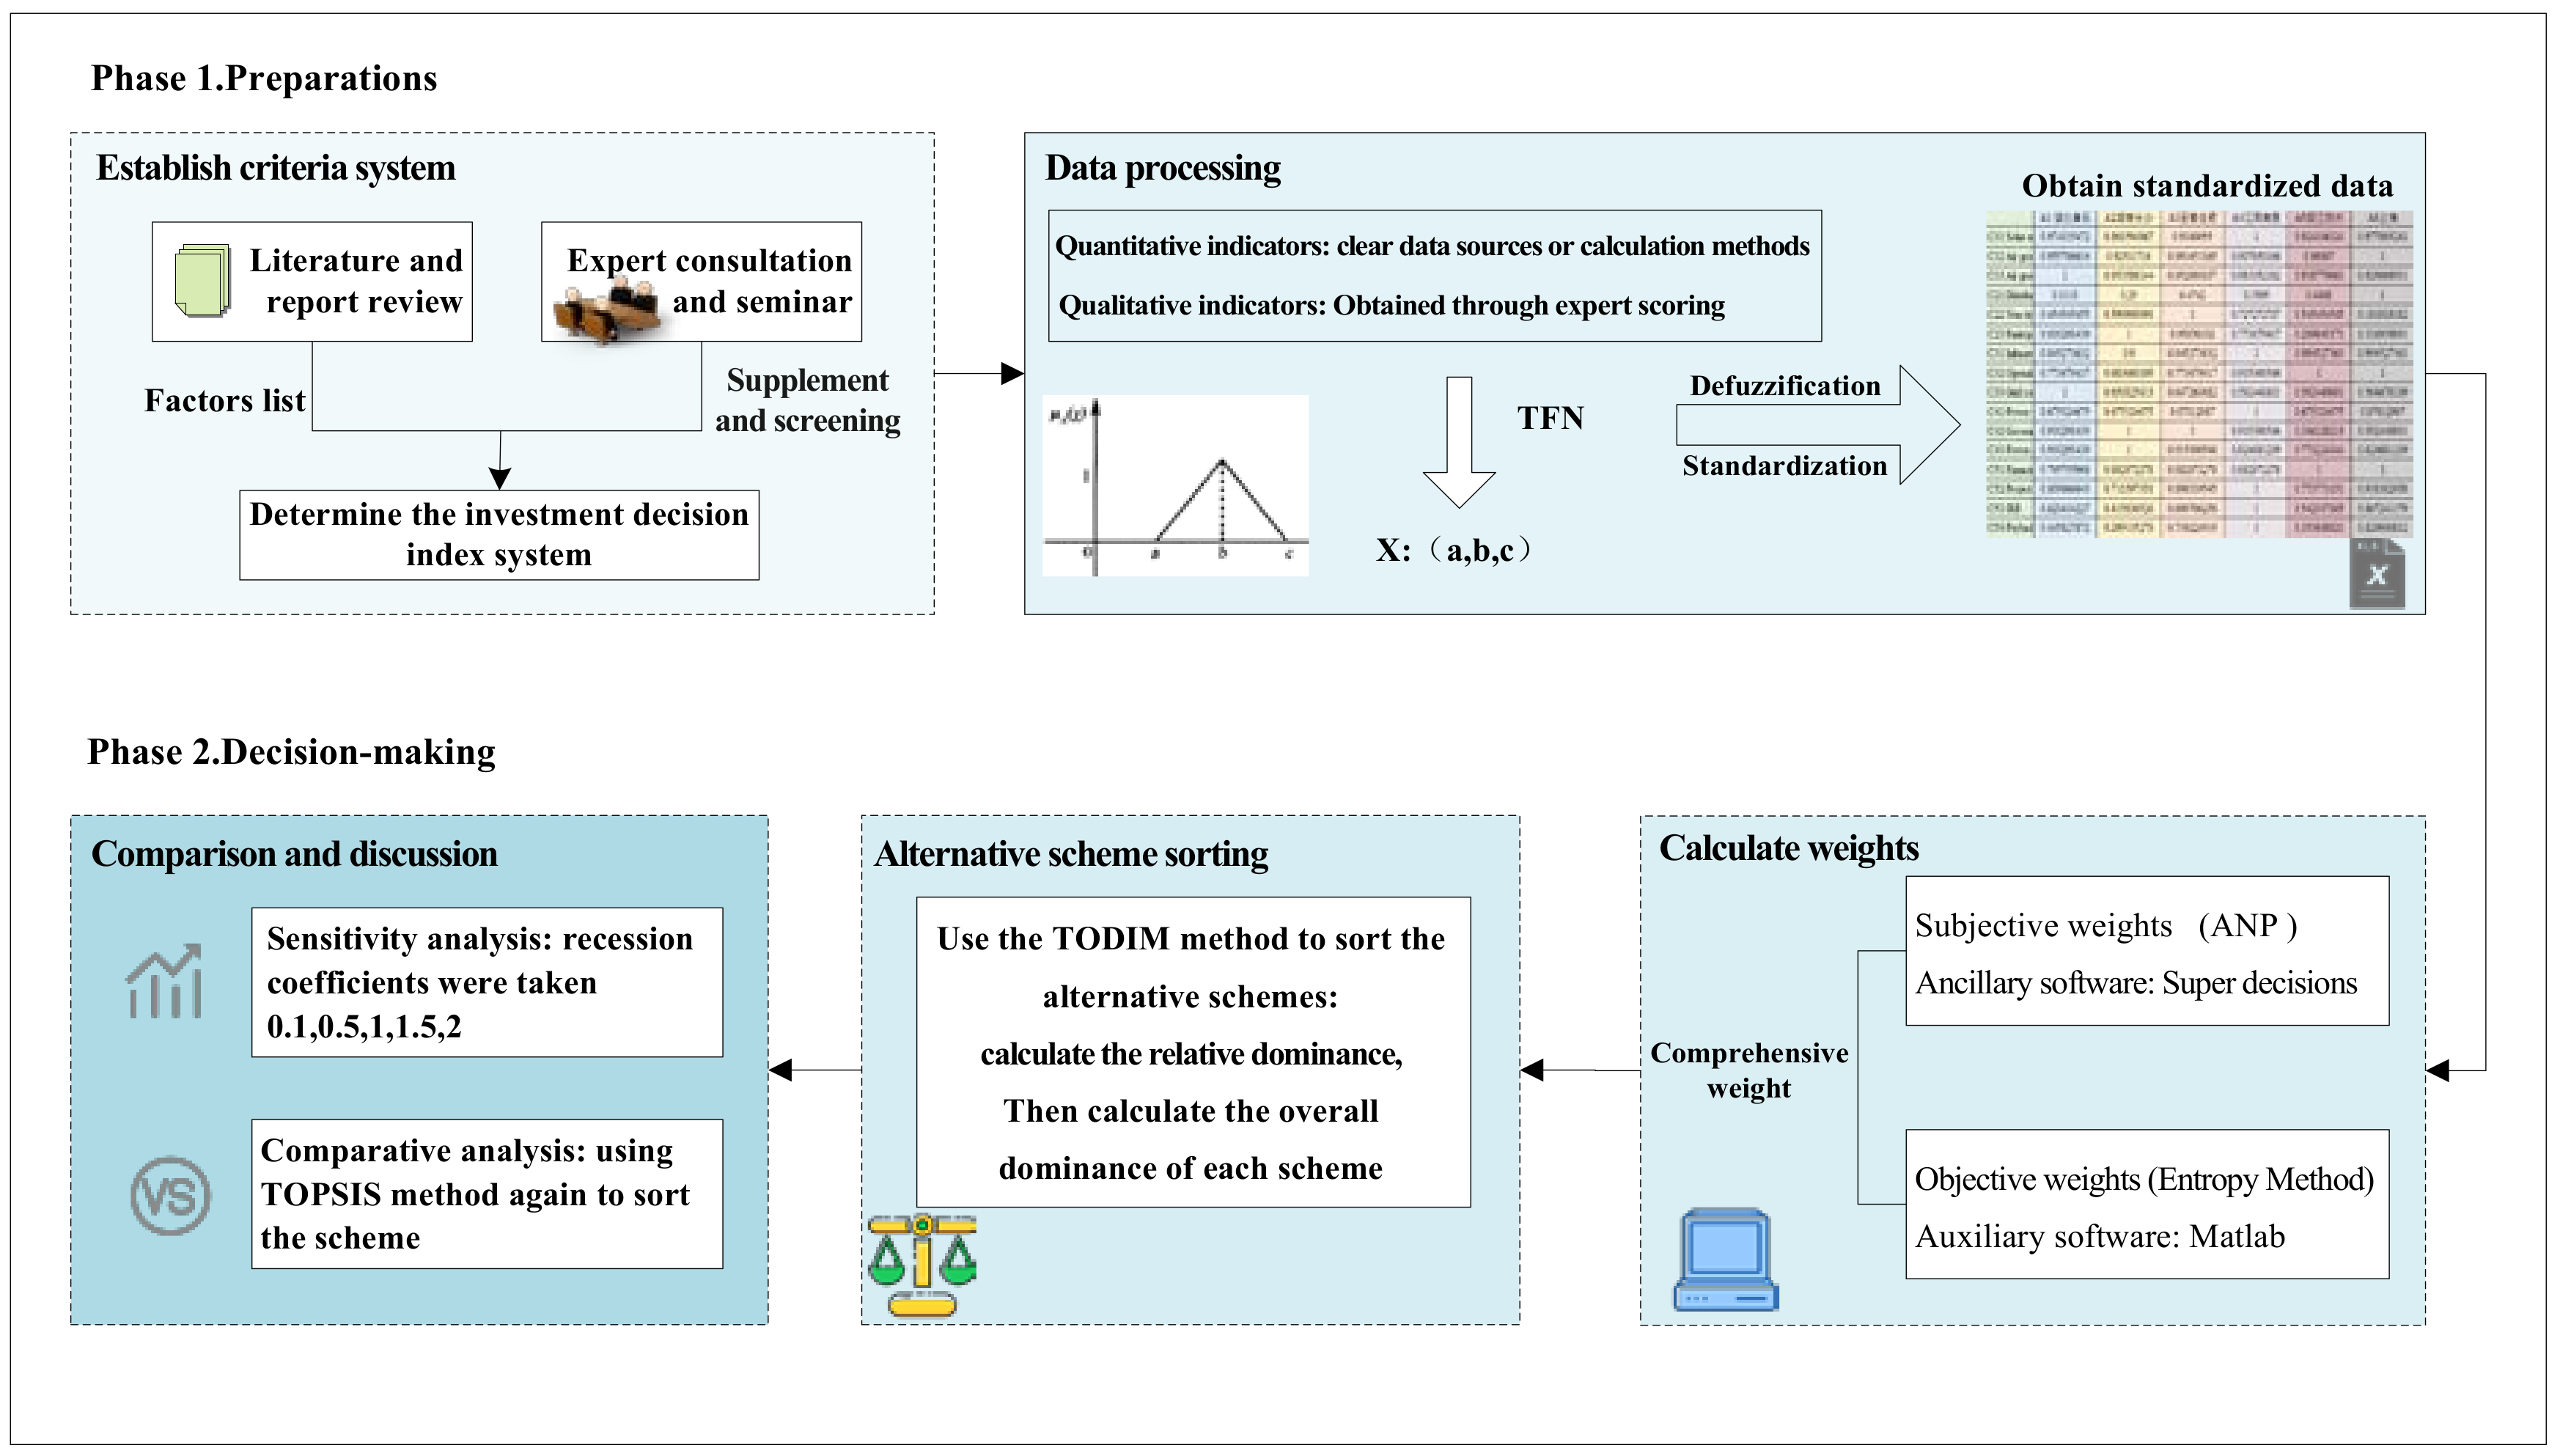
Investment decision plays an important role in the entire life cycle of DPV projects. However, two critical issues have not been solved well by existing researches. Firstly, existing DPV decision frameworks don’t consider that business models can significantly affect the economic performance of the project. Secondly, the decision frameworks don’t take account of investors’ psychology of avoiding risks and losses. To the best of our knowledge, this is the first study to deal with the above two problems simultaneously. The innovations of this study are as follows: first, a comprehensive decision criteria system of DPV projects is established from the perspective of natural, market, technological, policy and competitive, and economic. Second, the framework proposed in this paper considers the impact of business models on project economics and determines the business model is the EPC that is highly respected now and future in China. Third, the TODIM (an acronym in Portuguese of interactive and multicriteria decision making) method is applied to ranking alternatives, which can consider investors’ aversion to risk and loss.
To this end, the paper is organized as follows: Section 2 provides a comprehensive literature review of DPV project decision methods. Section 3 establishes an investment decision criteria system for DPV power generation projects based on the EPC business model. Section 4 introduces the investment decision framework of the DPV power generation project. In the 5th Section, a case study is conducted: 6 schemes of DPV power generation projects distributed in central and eastern China are selected for model validation. Besides, sensitivity analysis is conducted by adjusting the recession coefficient, using the TOPSIS method to conduct a comparative analysis. The last section provides conclusions and recommendations.

2. Literature Review

In recent years, researches on PV investment have mainly focused on the following aspects: (1) Risk analysis of PV power generation projects: analysis of risk factors and establishment of risk assessment models, application of risk models to provide decision-making information for investment decision-makers (DMs) [4,5,6]. Markov, et al. [7] considered that the physical limitations of the transmission network would pose risks for PV investment. Li et al. [6] considered extremes natural factors have adverse effects on PV power generation projects; (2) Impact of policies on the deployment and investment construction of DPV power generation projects [2,4,8]; (3) Economic analysis of PV power generation projects, including revenue, cost, net present value (NPV), and internal rate of return (IRR) [2,9]. Garcia et al. [10] proposed a compromise model (CP) model that simulates the agreement between the government that pursues as high a political price (guaranteed price) as possible and the project sponsor who hopes to receive revenue (random cash flow) as high as possible. Zhou [11] considered the on-grid price adjustment in his PV investment decision and put forward three FIT models, namely fixed feed-in tariffs (FIT) (FFIT), constant premium FIT (CPFIT) and variable premium FIT (VPFIT) models. Fang et al. [12] obtained the investment cost limit of distributed power generation projects through the application of real options, and then established the option value model of PV power generation investment and analyzed the cost-effective present value and net present value of investment options under the four scenarios; (4) Innovative business models, competitiveness, and market barriers for PV power generation projects [3,13]. Markov, et al. [7] built a four-level NPV model based on the specific case of a small-scale solar PV power station project in Indonesia to discuss the micro-incentive measures for project participants and how to adjust incentives. It can be found that the research on multi-attribute decision making for DPV power generation projects is relatively rare. This paper integrates the key points of the above literature research. In addition, risk factors, competitiveness factors, economic factors, market factors, and policy factors are set as the target attributes of the DPV power generation project. A criteria system is established and a multi-criteria decision-making (MCDM) method is used to make decisions in specific projects.
Practice has proved that the scientific decision-making of DPV power generation projects is crucial to the ultimate success of the projects. Therefore, scholars have conducted a lot of research on the decision-making methods for PV and other RE power generation projects. Lin et al. [14] obtained the system cost of DPV power generation by establishing an economic analysis model. Jannuzzi and Melo [15] established a set of technology diffusion models and defined the computer system to be used in Brazil’s PV project evaluation. Miescher, et al. [16] Used the two indicators Average Electricity Cost (LEC) and NPV to analyze and evaluate the economics of a small DPV system in Brazil. Holdermann et al. [17] used the cost and income of a typical PV system to evaluate the economics of a DPV power generation system in residential homes and businesses in Brazil. Huang et al. [18] believed that the investment cost of household DPV power generation projects is still relatively high for individuals, and the investment recovery period is long, but under the current policy subsidies and other incentive policies, the NPV can maintain a positive value. Qiang et al. [19] insisted that current PV power generation does not have national economic rationality in some regions of China. None of the above economic studies have considered the impact of the business models of DPV power generation projects on economic calculations. Shi [20] considered the impact of decay rate on the economics of DPV, and put forward an understanding of the EPC model, without considering the calculation of specific economic indicators under the EPC business model yet. Therefore, after considering the specific operating model of DPV power generation projects, this paper will be followed by the establishment of a decision-making criteria system as well as economic calculation.
Technique for Order Preference by Similarity to an Ideal Solution (TOPSIS) is a commonly used decision method that calculates the distance between alternatives and reference plans. Şengül et al. [21] used fuzzy TOPSIS to rank the RE supply projects in Turkey and proposed the investment projects that are selected by the government through case studies. Investment in wind power is subject to complementarity constraints describing a large number of market clearing conditions. Since the profit as a function of the investment variables has as sufficiently convex envelope, the considered problem can be solved by Benders decomposition. Baringo et al. [22] based on the BENDERS decomposition algorithm in the mathematical programming model, analyzed and discussed various uncertain scenarios in wind power projects, and selected investment projects with maximized profits. Fetanat [23] constructed a decision-making criteria system for offshore wind power projects, by using fuzzy analytical network process (ANP) methods to process the chromatographic relationship between decision indicators of offshore wind power projects, DEMATEL is employed in criteria and sub-criteria sections to resolve the influence relationships among indicators, ELECTRE is applied to calculate the decision making matrices of sub-criteria to alternatives. Gazheli and Bergh [24] studied a community or firm considering to diversify its investment in two distinct RE technologies. A real options approach is applied as it takes into account uncertainty about prices and learning, as well as irreversibility associated with investment decisions. TODIM approach which can capture the DMs psychological behavior, is a recently developed MCDM method. Qin et al. [25] applied TODIM method to solve a decision-making problem of selecting RE alternatives. Five RE resources as alternative solutions, each type of RE source has its advantages and disadvantages. In summary, Decision methods for RE investment are described in Table 1.
The existing decision methods for DPV power generation projects are relatively extensive, mainly from economic indicators, real option, best investment value, and maximization of interest. The core of the methods lies in the economy of the project. There are few investment decisions for PDV power generation projects using MCDM methods. In fact, there are many factors affecting DPV power generation projects besides economic. Therefore, DPV power generation projects is essentially a MCDM problem.
In general, scholars have produced more research results on investment decisions for PV projects. However, most of the methods do not consider the important impact of project business models on economic indicators when calculating project economics. There is no obvious compensation among decision-making indicators of DPV power generation projects in this paper. Alternative projects generally do not have strong veto factors. Therefore, this paper does not choose the ELECTRE method and the PROMETHEE method (MCDM) that focused on solving the problem of compensating the indicators of the project plan to sort schemes. In addition, classical methods assume that decisions are conducted in a deterministic environment and decision-makers are completely rational while facing with investment risks. However, these hypotheses are not supported in actual decision. In particular, we should consider the impact of investors’ psychological characteristics of risk and loss avoidance on project selection. TODIM is an abbreviation for Portuguese interactive and multi-criteria decision-making. It has been proved that it can effectively deal with MCDM issues of limited rationality for decision-makers [29,30]. The classic TODIM method is proposed by GOMES et al. [32] based on the prospect theory. Its main idea is to establish the relative dominance function of any scheme relative to other schemes based on the value function of the prospect theory, and then sort the schemes according to the obtained dominance. Therefore, after considering the specific business model and establishing a scientific investment decision criteria system, this paper selects the TODIM method based on prospect theory to make investment decisions.

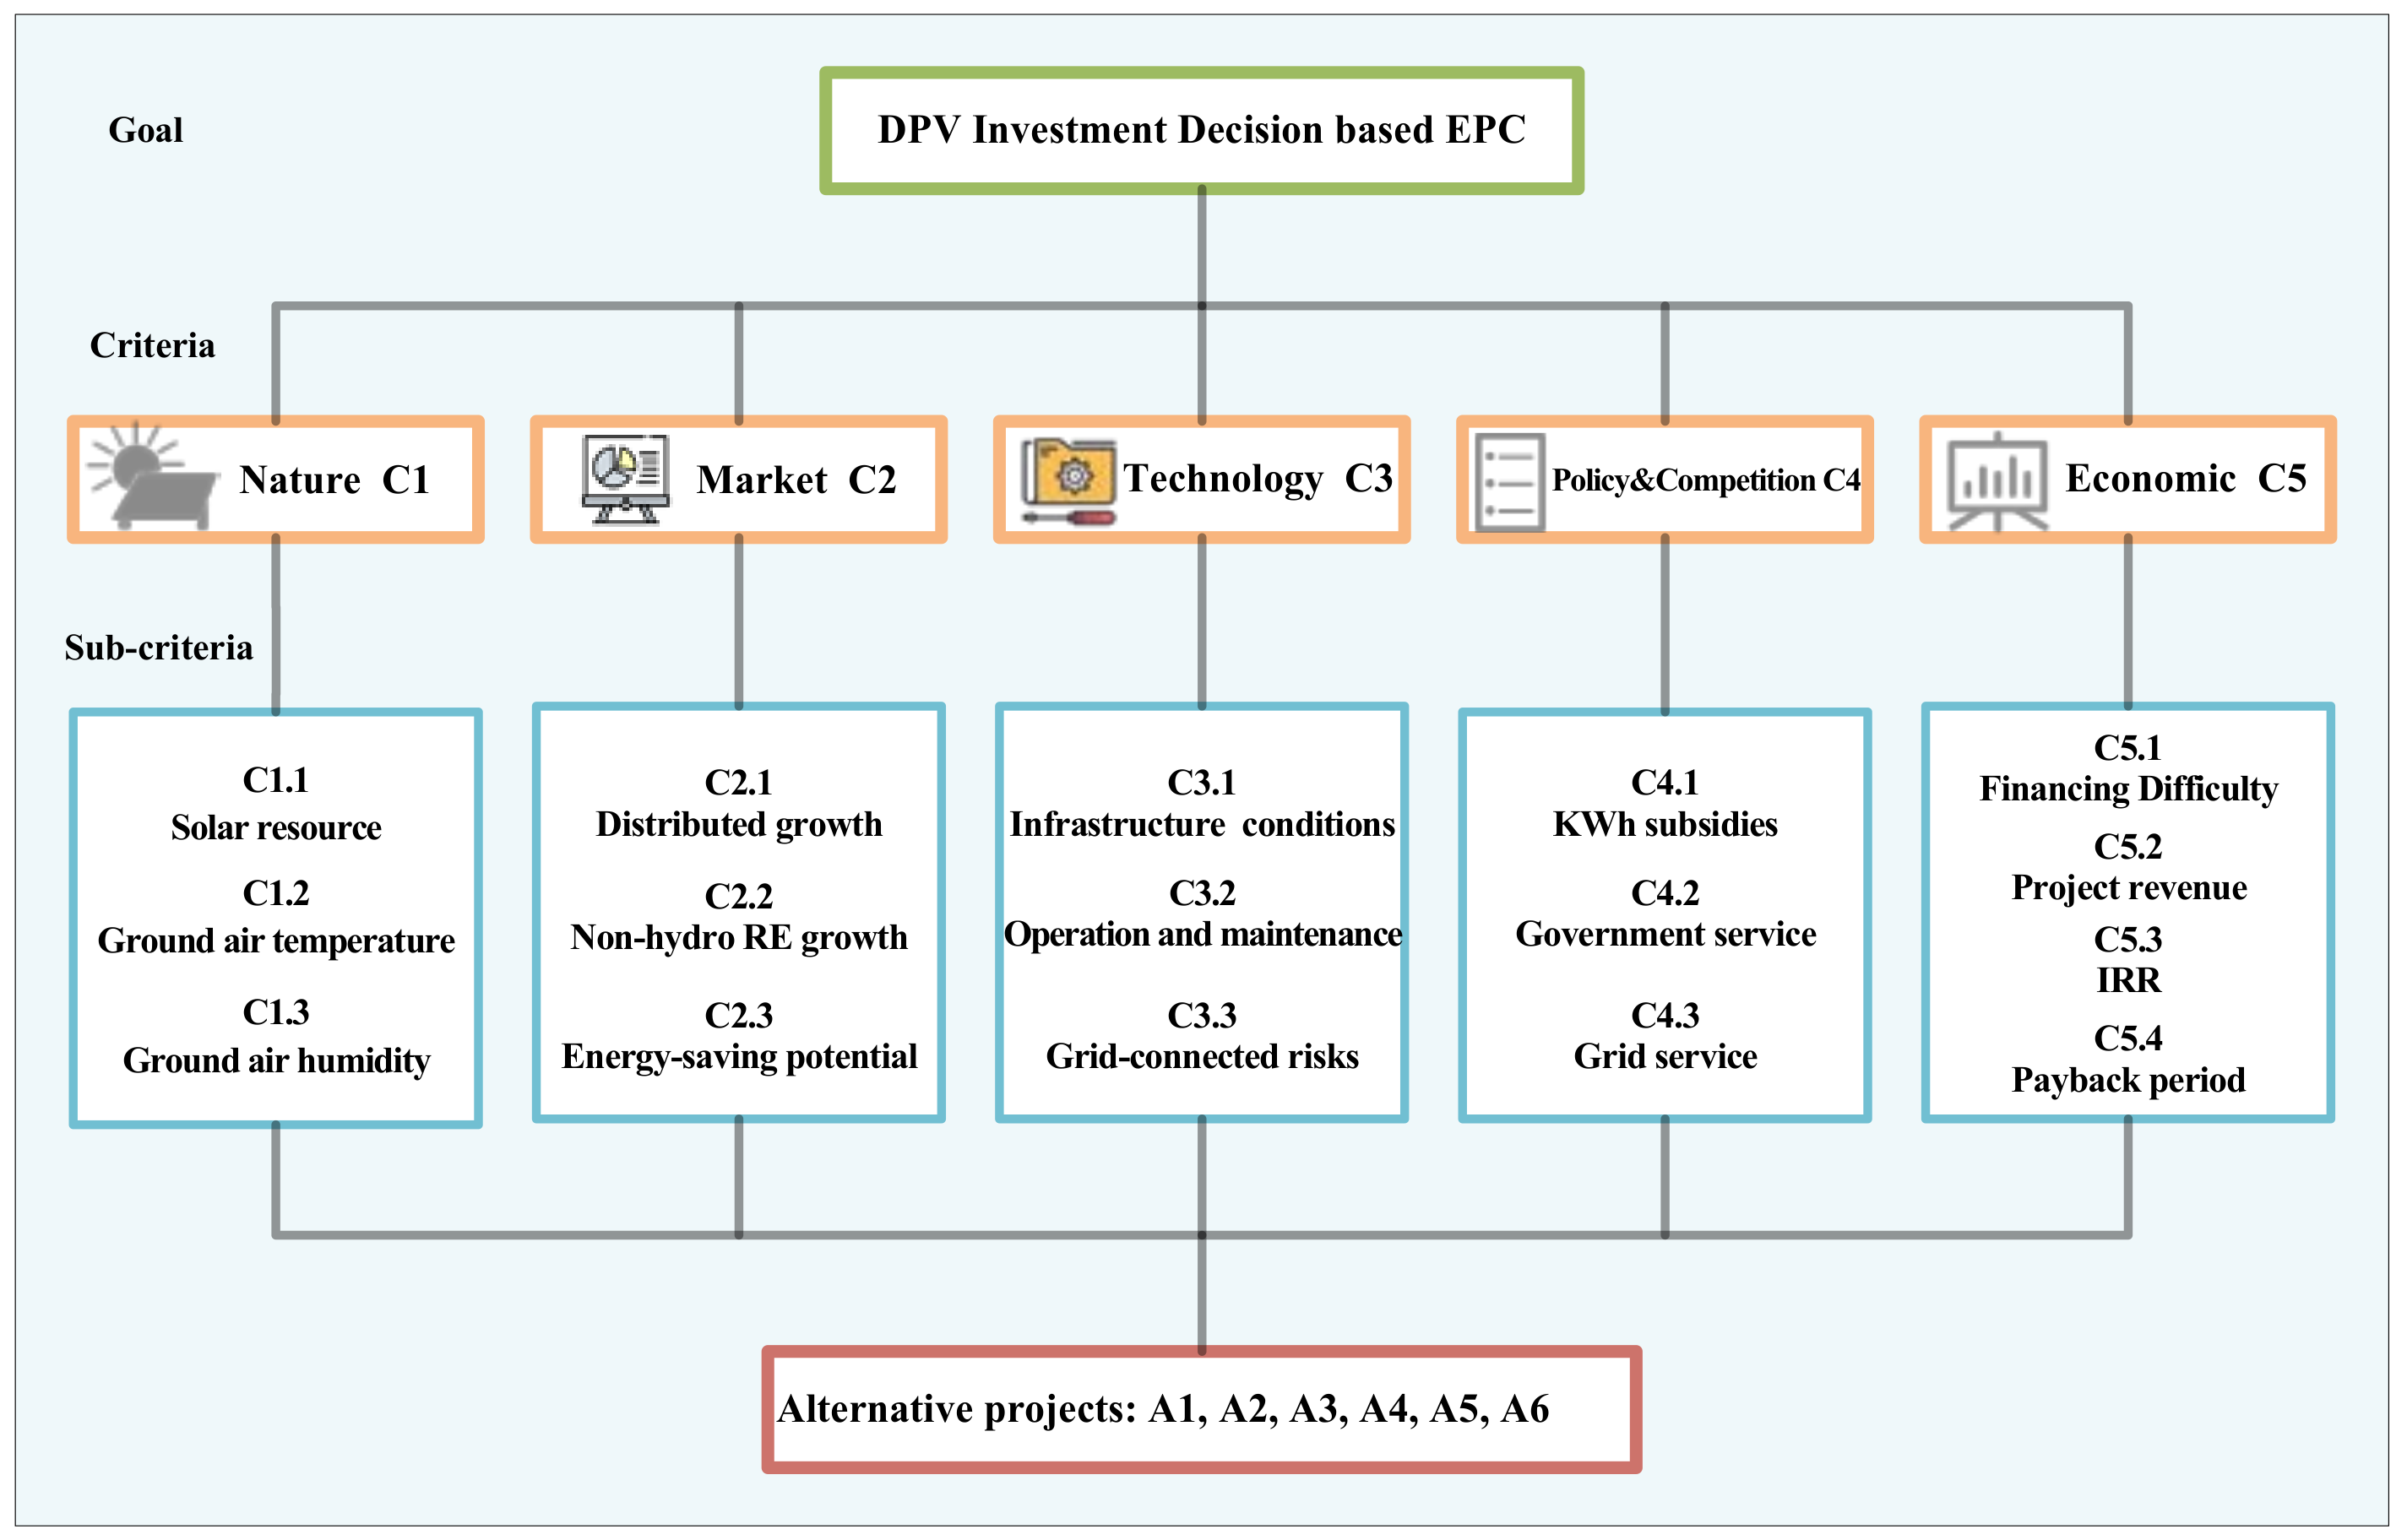
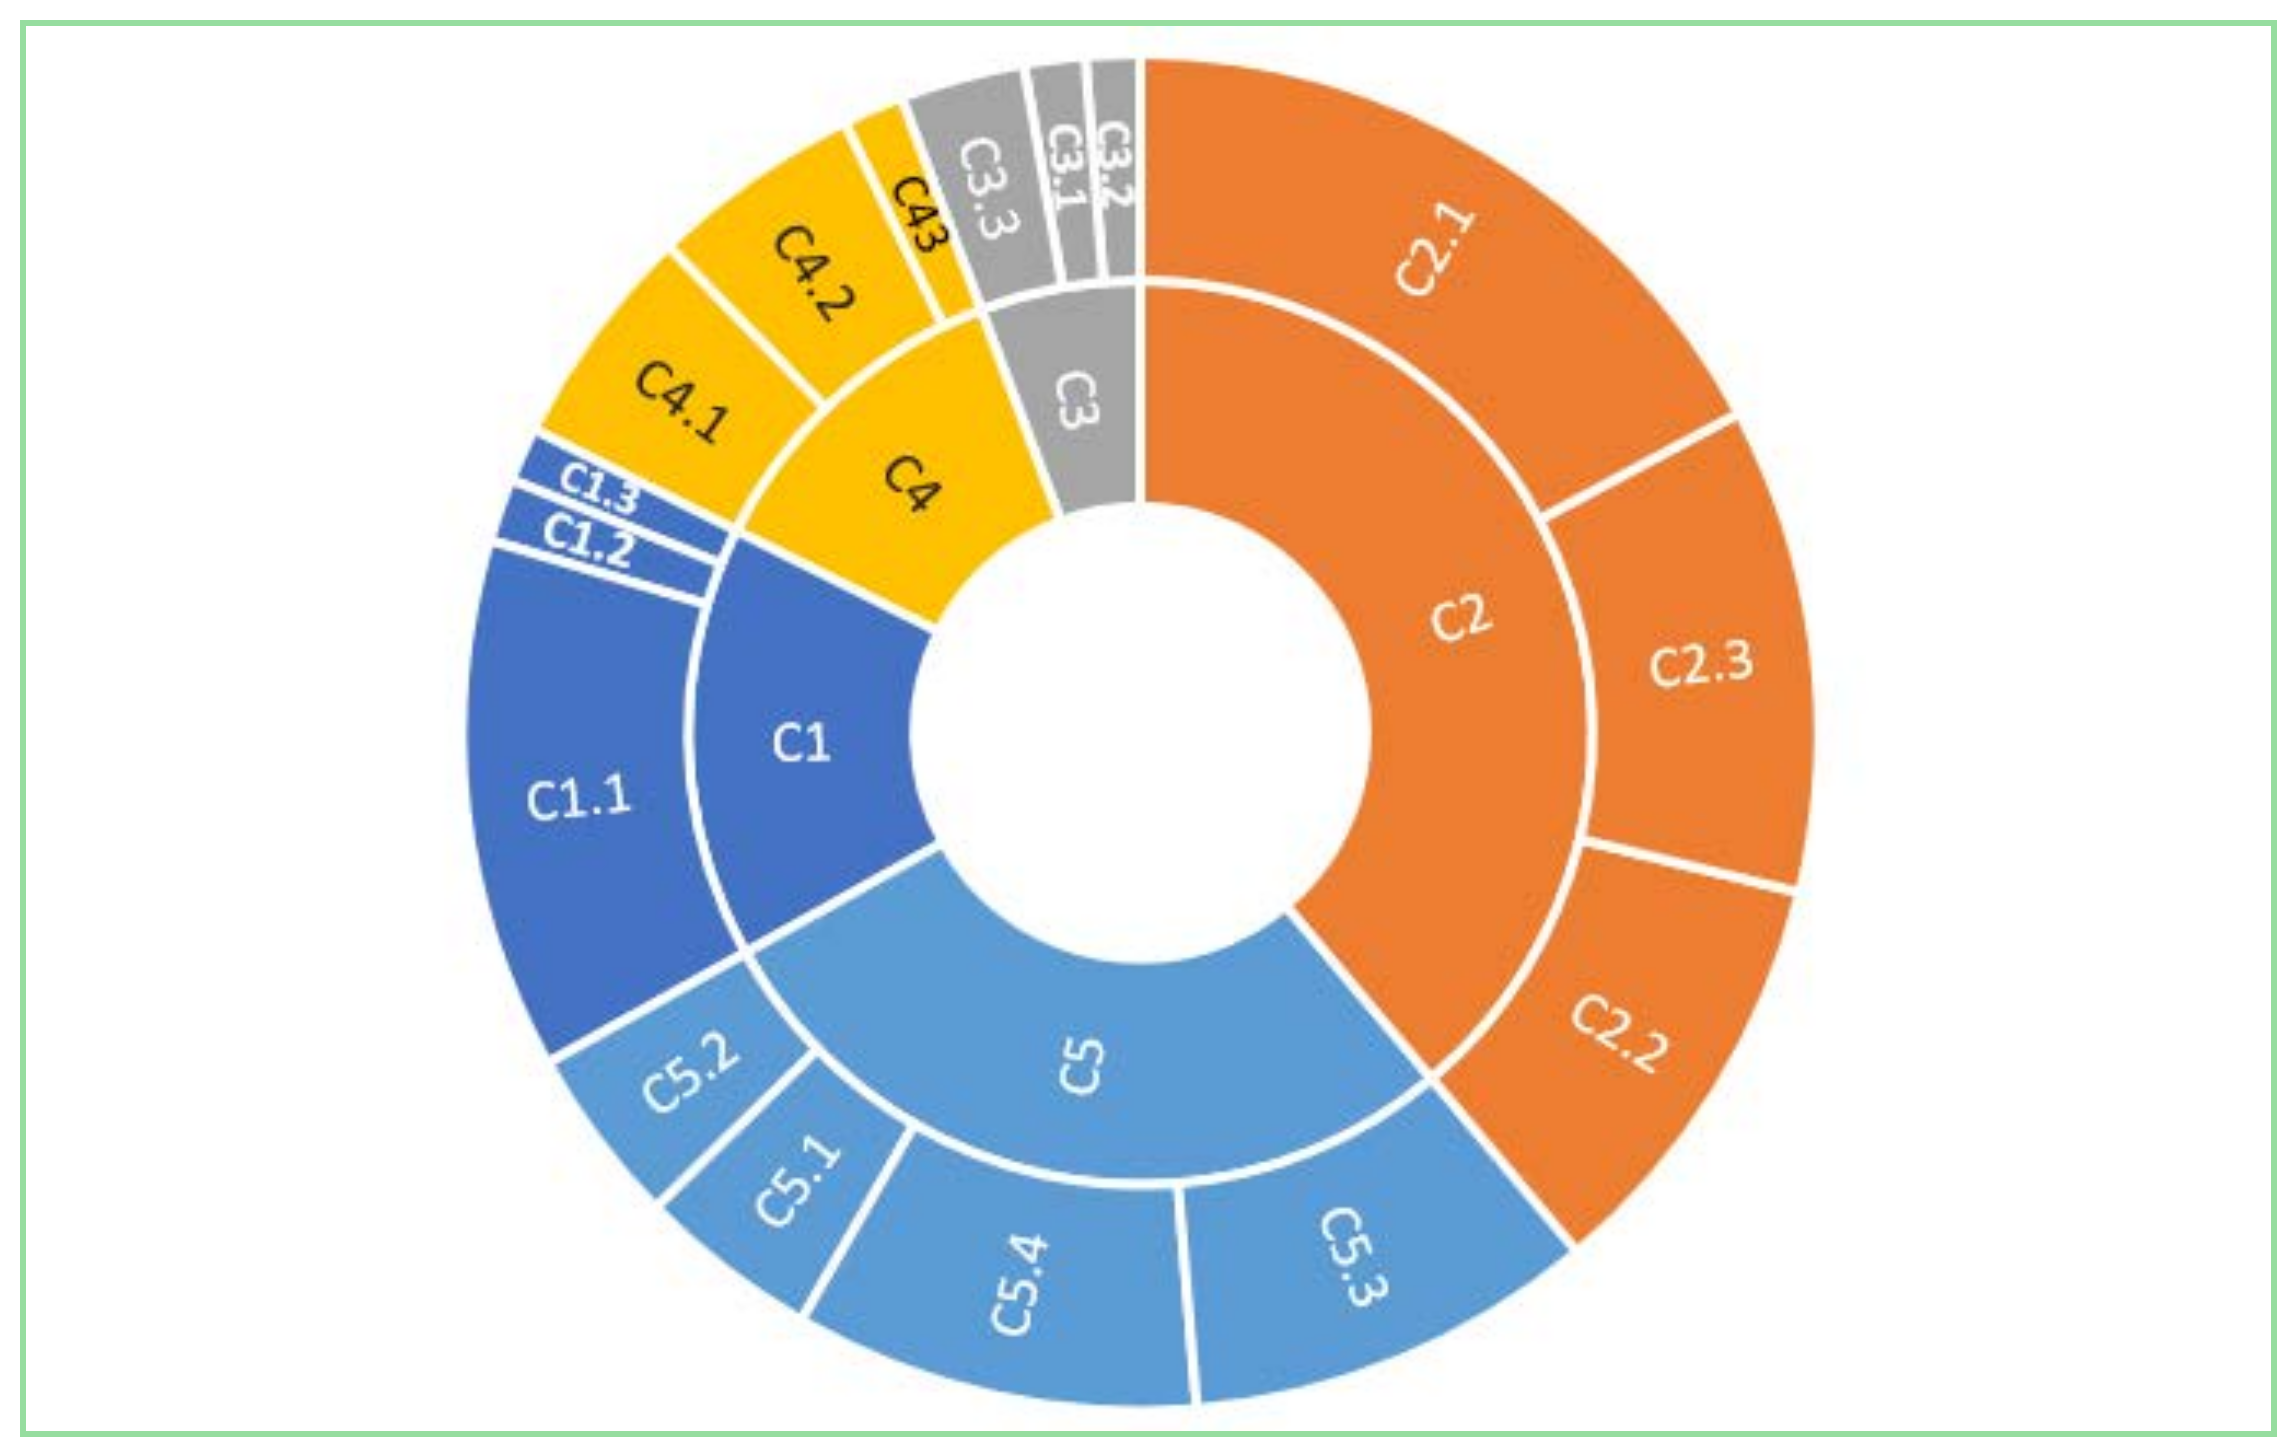
3. Investment Decision Criteria System of EPC-DPV Projects

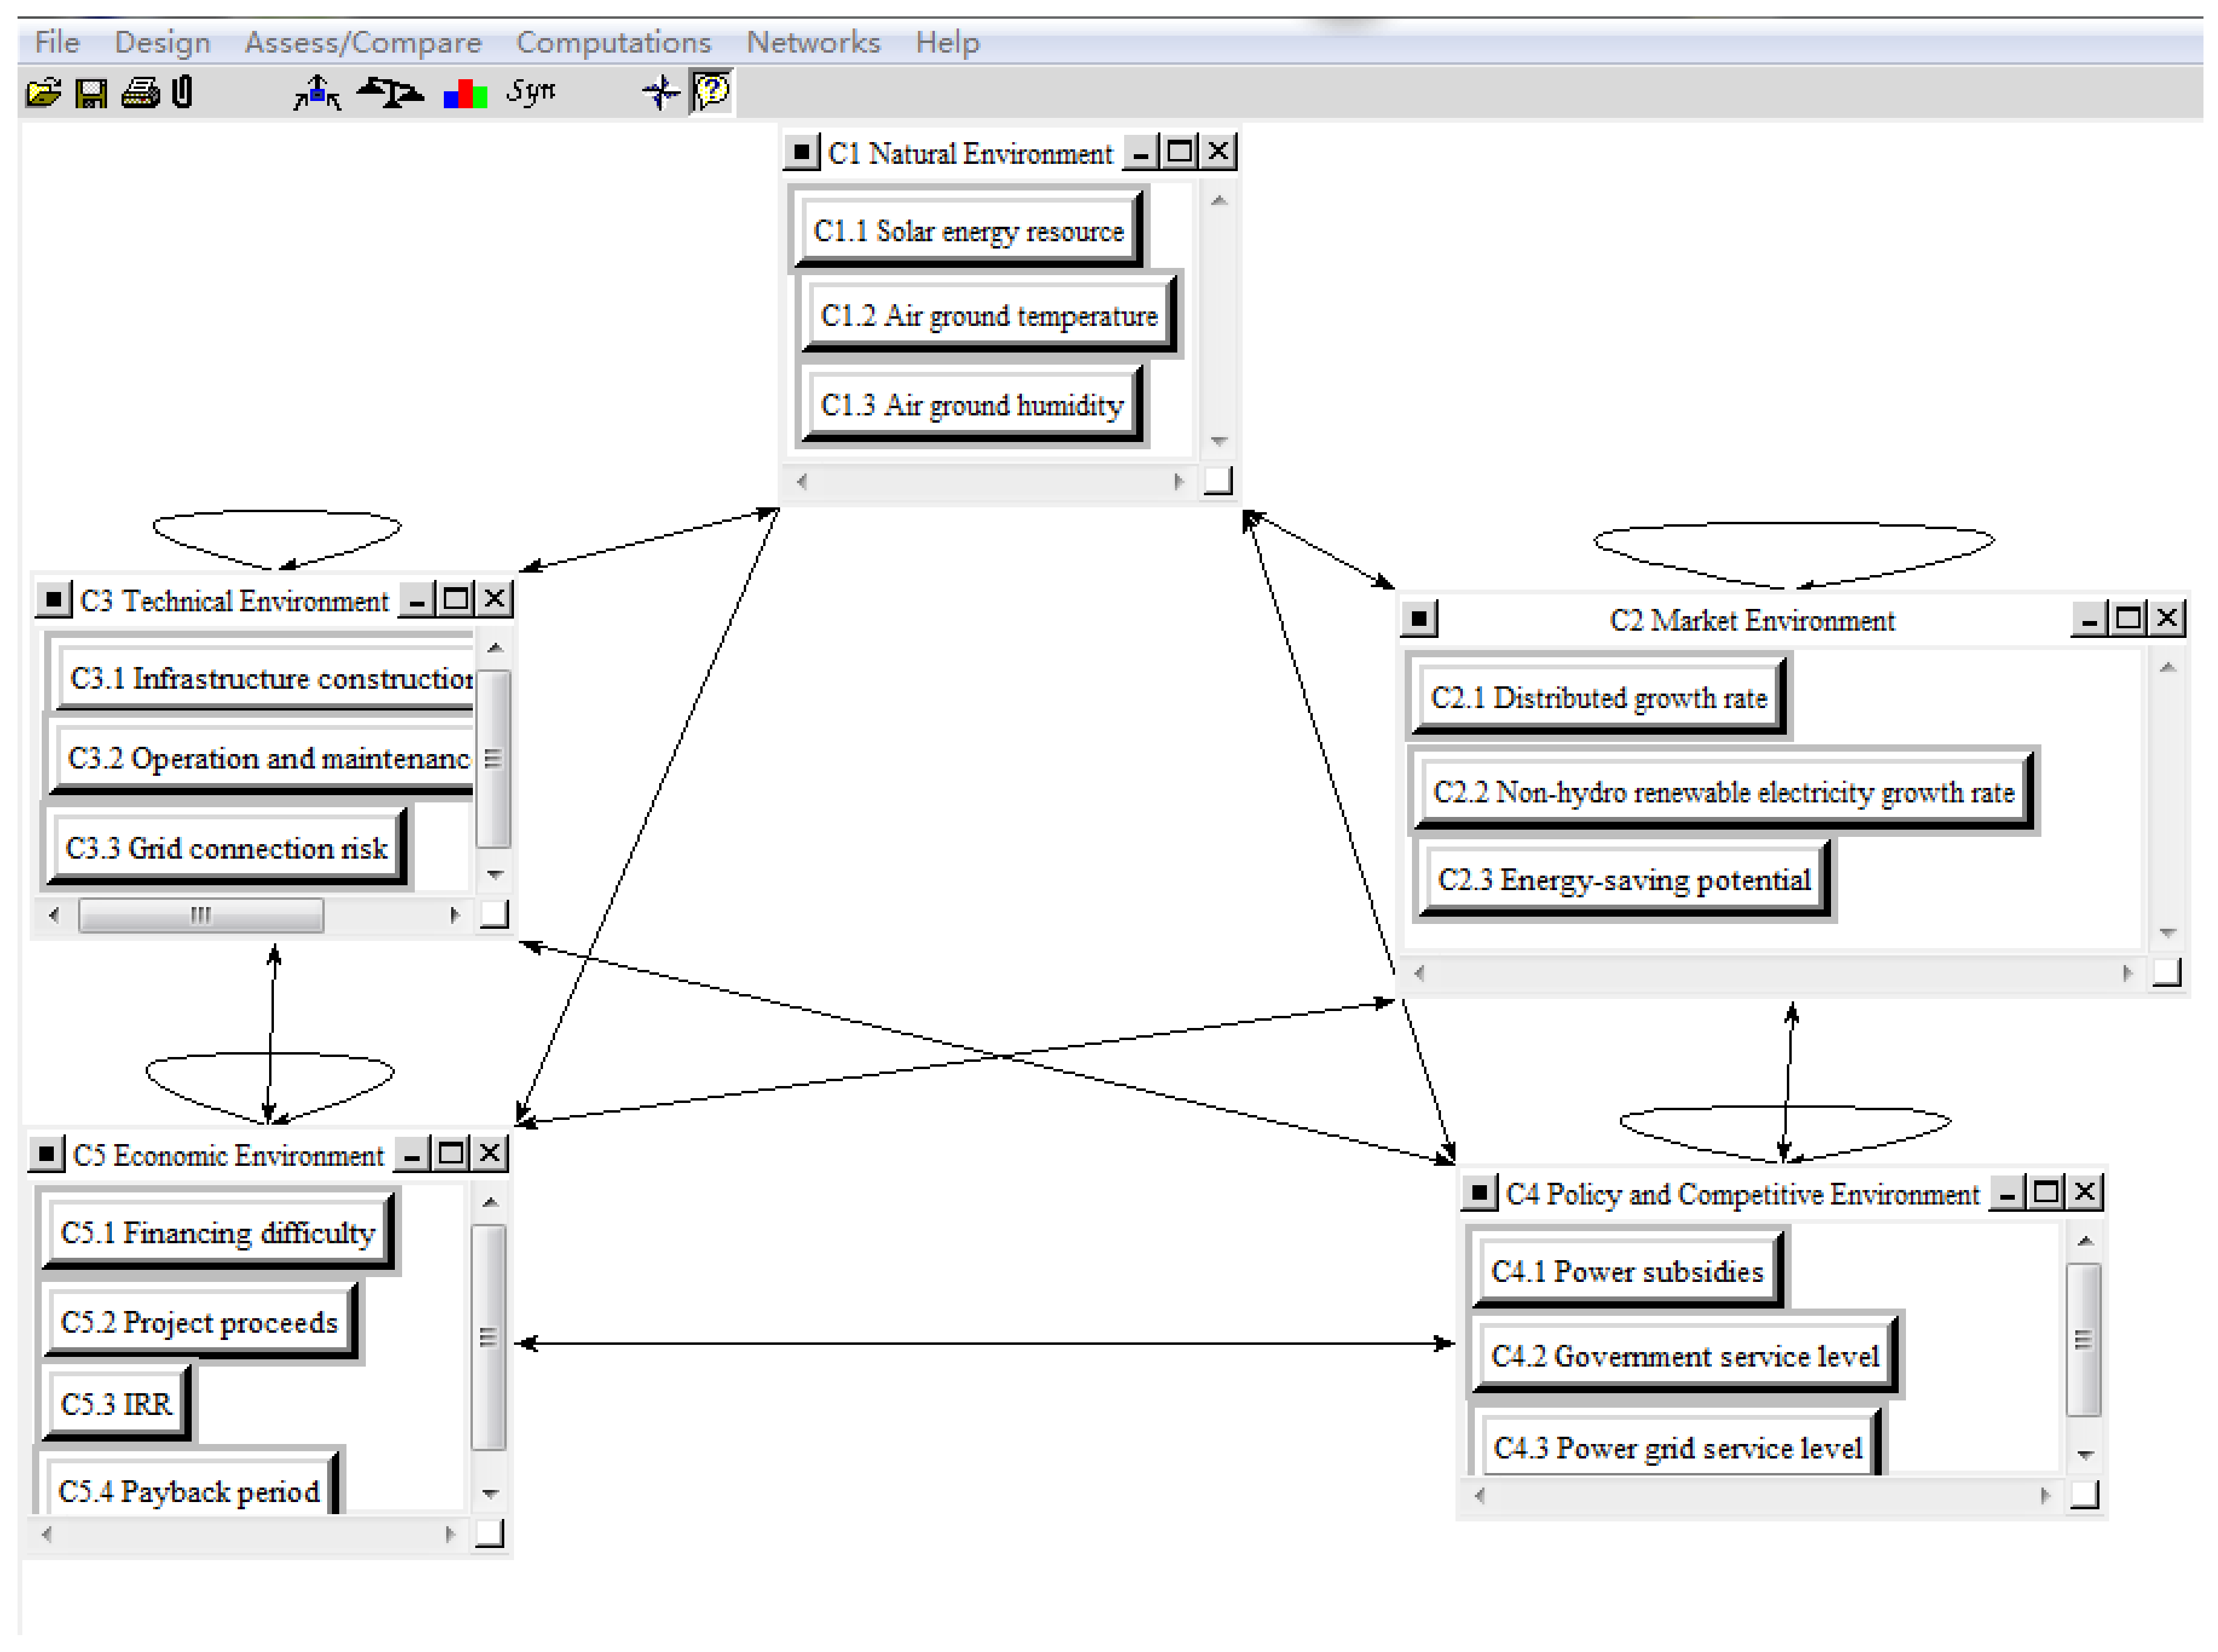
The design of the investment decision-making criteria system for DPV power generation projects is one of the key contents of this paper. This paper carries out investment decision analysis of DPV power generation projects from five aspects: natural environment C1, market environment C2, technological environment C3, policy and competitive environment C4, and economic environment C5. The 9 quantitative indicators include C1.1, C1.2, C1.3, C2.1, C2.2, C4.1, C5.2, C5.3 and C5.4. The 7 qualitative indicators include C2.3, C3.1, C3.2, C3.3, C4.2, C4.3 and C5.1. These 16 indicators constitute these five aspects. The five aspects described are the criteria to be used to evaluate the DPV projects.

3.1. Natural Environment Criteria (C1)

  • Solar energy resource (C1.1) [33,34]. PV power generation has a strong dependence on primary energy sources and is obviously constrained by solar energy resources. A key factor affecting PV power generation is the actual usable amount of solar energy resources.
  • Ground air temperature (C1.2) [35,36]. The electrical performance of solar cells and batteries varies with temperature, which affects the power generation performance of the entire PV system. Currently, large-scale commercial applications are mainly silicon-based solar cells. It mainly reflects that the open circuit voltage drops sharply with the increase of temperature. At the same time, it leads to a serious shift of the charging operating point, which could damage the system easily due to insufficient charging.
  • Ground air humidity (C1.3) [6]. Safety and reliability are the main concerns of current and future distributed generation systems. The assessment of relevant risks must take into account the safety and stability of PV equipment in normal weather conditions or accidental events and extreme weather conditions.

3.2. Market Environment Criteria (C2)

  • Distributed growth rate (C2.1) [37]. In newly-added PV installations, centralized installations should be abandoned, and the market environment status of DPVs in the project location should be directly realized through the growth rate of distributed installations.
  • Non-hydro renewable energy (RE) power growth ratio (C2.2): This indicator reflects the environmental conditions of the wind-solar power generation market in the region, and the energy structure of the region.
  • Energy-saving potential (C2.3) [38]. The energy-saving potential of DPV power generation projects often determines the speed at which energy-saving service companies (investors) can recover their investment and obtain profits. Energy-saving potential can be assessed by investigating the basic conditions of the energy-consuming equipment, production management and operation processes. This paper determines the energy saving potential of the project by evaluating the economic environment and industrial environment of the region where the project is located.

3.3. Technical Environment Criteria (C3)

  • Infrastructure conditions (C3.1) [39,40,41,42]. The construction of grid-connected DPV requires not only appropriate roof and equipment placement space, but also the convenience of transportation. Whether the construction conditions are allowed and the two parties can cooperate well with the construction will affect the overall progress and cost of the project.
  • Operation and maintenance (C3.2) [37,43,44]. O&M is the longest period of DPV power generation projects in the entire life cycle. Rational and scientific O & M systems and methods can effectively reduce the related technical risks of PV power generation.
  • Grid-connected risks (C3.3) [41,45,46]. DPV power generation has inherent characteristics such as volatility, intermittent, and periodicity. When the DPV power supply is integrated into the distribution network, it will have an adverse effect on the distribution network.

3.4. Policy and Competitive Environment Criteria (C4)

  • kWh subsidies (C4.1) [47,48,49]. The subsidy of DPV power generation by the country, provinces, and regions fully illustrates the importance of RE power generation projects, but the economic development level and subsidy intensity of each region are different. Different subsidies give investors a risk in choosing a DPV project.
  • Government service (C4.2) [9,41,50]. The government service level in the DPV project location is crucial to the healthy development of the entire project. Whether the local government has formulated and implemented the DPV power generation management rules? Whether the local government can provide investors and users with one-stop market services? Whether there are disguised charges, apportionments, and other actions to increase corporate burden? These issues all reflect the level of policy and competitiveness. The second part of Appendix A explains the process of obtaining the criteria (C4.2) information.
  • Grid service level (C4.3) [9,41,50]. The promotion and future operation of the project are closely related to the supporting services of the local grid. Whether the supporting facilities, such as the transformation of the public distribution network line and metering device installation, can be built in time according to the construction period of the PDV project? In particular, whether the revenue of on-grid electricity can be settled in time?

3.5. Economic Environment Criteria (C5)

  • Financing difficulty (C5.1) [51]. Most DPV users do not invest directly but participate in DPV power generation projects through EPC and renting out rooftops. According to the statistics of the Energy Bureau, in the first half of 2015, the actual installed capacity of PV was 7.5 GW, of which distributed accounts for 1 GW. In the first half of the year, the overall operating rate of the project was about 40%. The uncompleted projects were mainly affected by the failure of financing.
  • Project revenue (C5.2) [52]. The project revenue of DPV power generation is the economic index that investors are most concerned about. Under the EPC model, the income of investors mainly includes the sharing of energy-saving benefits of customers, revenue from electricity sales, income from excess power online, and subsidies.
When making investment decisions, different operating models will affect the policy environment, competitive environment, and economic environment of DPV power generation. However, most studies do not explicitly consider the business model of DPV power generation projects, leading to rough investment analysis. This paper determines the business model is the EPC business model that is highly respected now and future to conduct investment decision analysis, which will make the decision criteria system more reasonable, and rigorous. Project revenue comes from four parts, namely generation allowance income (I1), on-grid income (I2), nearby consumptive income (I3) and energy-saving benefits (I4), respectively.
Table 2 shows the earnings calculations for EPC-based PDV power generation projects, after summarizing the relevant literature and combining China’s EPC operating model [3,20].
  • Internal rate of return (C5.3) [50,53,54]: IRR is defined as the rate at which the total present value of capital inflows is equal to the total value of capital flows, and the discount rate when the net present value is zero. It is an important indicator of investor concern. The formula for calculating this indicator is as follows:
    N P V = n = 0 N ( C I C O ) n ( 1 + I R R ) n = 0
    where CI is the cash inflow volume, CO is the cash outflow, (CICO)n is the net cash flow in the Nth year, and N represents the life cycle of the project.
  • Payback period of investment (C5.4) [50,53,54,55]. The initial investment of the DPV project is large, and the investment return period is long. The long recovery period will increase the probability of system failure. The formula for calculating this indicator is as follows:
    n = 0 t ( C I C O ) n = 0
    where CI is the cash inflow volume, CO is the cash outflow, (CICO)n is the net cash flow in the Nth year. The investment decision criteria system for EPC-DPV generation projects is shown in Figure 3.

4. Decision Framework of EPC-DPV Projects

The investment decision framework is divided into two phases. Phase 1 is the preparation phase, including the establishment of the criteria system and data processing. Phase 2 is the decision-making phase, including the calculation of indicators weights, alternative scheme sorting and comparative discussion. Figure 4 depicts the decision-making framework for EPC-DPV projects constructed in this paper.

4.1. Phase I. Preparation—Establish Criteria System

Identifying the factors that influence investment decisions is an important prerequisite for selecting suitable projects and achieving project success [28]. There are many methods to identify the factors that affect the project. This paper adopts the two-step method combined with Delphi technology. Firstly, in-depth analysis of the EPC model and DPV power generation investment decision-making and risk management research is conducted, to identify factors that may affect the decision-making of DPV investment and to form a set of factors that can effectively understand the factors that may lead to failure of project investment decisions [29]. In addition, distributed energy sources, especially DPV generation, are increasingly drawing attention from government and investment companies. Some experts and scholars in this field have summarized the experiences and lessons of many investment decisions for PDV power generation projects. Therefore, this paper first summarizes a list of influencing factors, and then submits the list to experts with extensive research and practical experience in the field to screen and modify the influencing factors. In the process, questionnaires will be involved to determine the influencing factors. (Appendix A-Part 1) Finally, through the above-mentioned work, the investment decision-making index system of this research is established.

4.2. Phase I. Preparation—Data Processing

Section 3 introduces the investment decision criteria system and describes each indictor in detail. Then, the work of collection and preprocessing of indictor values will be carried out. Decision-making work is to analyze and evaluate the feasibility of project before the investment. The evaluation of the indicators is mainly based on the collected data information and expert evaluation opinions. On the one hand, qualitative indicators should express their connotation ideally. On the other hand, information is often missing in actual work: Experts are subject to subjective and objective factors in their assessment and cannot express opinions in a single real number. Therefore, the decision problem often has some ambiguity and uncertainty. This paper uses the triangular fuzzy number (TFN) to describe the evaluation value and solve the above problem.
Definition 1.
[56]. A fuzzy number a ˜ is a TFN, if its membership degree function is expressed mathematically as follows:
μ a ˜ ( x ) = { 0 if   x < a L ( x a L ) / ( a M a L ) if   a L x a M ( a U x ) / ( a U a M ) if   a M x a U 0 if   x > a ¯
where the a L , a M and a U are the lower value, modal value, and upper value, respectively. They satisfy a L a M a U . For the convenience, we denote a TFN by a ˜ = ( a L , a M , a U ) . For example, the indicator C1 involved in the case study uses the minimum value of the average daily irradiation value for the last 22 years of the project site as the lower bound ( a L ), with the average value as the most likely estimate ( a M ) and the maximum value as the upper bound ( a U ) to represent TFN of the indicator value. Since it is difficult to compare two TFNs directly, the defuzzification of the TFNs is necessary. Various defuzzification strategies have been suggested in the literature. In this paper, a relatively simple hierarchical average integration method was used.
Definition 2.
[57]. Let a ˜ = ( a L , a M , a U ) be a TFN, the value of defuzzification S ( a ˜ ) is given as follows:
S ( a ˜ ) = a L + 4 a M + a U 6

4.3. Phase II. Decision-Making—Calculate Weights

The indicators established in this paper have mutual influence and mutual control relationship. For example, solar energy resources will directly affect various economic indicators; Technical indicators such as O & M also affect economic indicators; O & M and Grid-connected risks are mutually dependent, and the low risk of grid connection is more convenient for general O & M. The market environment is subject to the policy environment to some extent. ANP is particularly suitable for complex decision systems that have internal dependencies and feedback relationships [58]. This paper uses Super Decisions software, a powerful computing tool for ANP, to conduct analysis and calculation. The steps to determine the weight of each decision indicator are as follows [26,28,59].
  • Step 1: Analyze the problem and establish a decision index system.
  • Step 2: Build dependencies and feedback relationships. The establishment of an ANP model must also study the relationship (feedback or dependence) between the indicators. The indicator associations in this paper are obtained through a two-dimensional table of expert surveys. After the discussion within the expert group, the correlation between the evaluation indicators is finally obtained.
  • Step 3: Establish a pairwise comparison matrix between the primary and secondary indicators based on the correlation indicators.
  • Step 4: Data processing. The questionnaire processing is mainly conducted through Microsoft Excel.
  • Step 5: Establish the ANP decision model in Super Decisions. The situation in the case study is shown in Appendix B1.
  • Step 6: Comparison of element sets and elemental judgement in ANP model.
  • Step 7: Super Decisions is used to calculate the matrix and obtain the weight of each index. The situation in the case study is shown in Appendix B2.
The entropy method is an objective weighting method. The principle is to determine the weight of the indicator based on the difference in the indicator value. It is considered that the indicator is more important in decision-making evaluation if the difference between the indicator values is more obvious [28]. This paper uses MATLAB (as shown in Appendix B3) to calculate the objective weights of each indicator by using the entropy method as a principle, after processing and integrating the indicator values.
The advantage of the entropy method is to objectively determine the weight based on the degree of variability between the index values and to avoid deviations due to human subjective factors. However, the method neglects the significance of the indicators themselves for the evaluation of the project to a large extent. In addition, the weights of the two results were discussed through interviews’ questionnaires. (Part 3 of Appendix A) Therefore, this paper adopts the ANP method to determine the subjective weights and the entropy method to determine the objective weights in order to obtain the comprehensive weights of each decision indicator.

4.4. Phase II. Decision-Making—Alternative Scheme Sorting

Different from the conventional decision-making methods, the TODIM method is developed based on the prospect theory. It is a multi-attribute decision-making method that considers the decision makers’ psychological behavior. When project decision-makers make investment decisions, they are often affected by factors such as their own cognition, practical experience, and psychological factors. These factors will give decision-makers certain reference dependencies, leading to loss-avoidance behaviors for decision-makers. The TODIM method compares the alternatives and obtains the overall dominance of each solution to solve the multi-attribute decision-making problem in which the attribute values have been uniformly converted to precise values [60]. Therefore, this paper selects the TODIM method for multi-attribute decision-making of DPV power generation projects under the EPC business model.
Before using the TODIM method to calculate the relative dominance, it is necessary to obtain a standardized decision matrix and determine the relative weights of the indicators. In order to eliminate the impact of dimensions, the decision matrix needs to be standardized as follows:
Benefit indicators:   n i j = X i j X max
Cost indicators:   n i j = X min X i j
Definition 3.
[25]. Let A = {A1, A2K, Am} be a solution set consisting of m schemes, and C = {C1, C2K, Cn} is a finite attribute set. The decision matrix consisting of the indicator attribute values for all alternatives is R = [ r i j ] m x n . (represents the jth indicator evaluation value of the ith scheme) rij can be represented by real numbers, interval numbers, fuzzy numbers, intuitionistic fuzzy numbers [25]. In this paper, the indicator values are calculated using triangular fuzzy numbers and then defuzzied to obtain real values. The main steps of the classic TODIM method used in this paper are as follows:
  • Step 1: Normalize the decision matrix and determine the relative weights of the indicators. In order to eliminate the influence of dimensionality, it is necessary to standardize the decision matrix to obtain a standardized decision matrix N = [ n ij ] mxn . The relative weight of indicator Cj is wjr (wjr = wj/wr). w r = max { w j | j n } is the reference weight.
  • Step 2: Consider the relative dominance of scheme Ai relative to each scheme:
    δ ( A i , A j ) = c = 1 n Φ c ( A i , A j )
    where:
    Φ c ( A i , A j ) = {    w c r c = 1 m w c r ( x i c x j c ) ,   ( x i c x j c ) > 0    0 ,   ( x i c x j c ) = 0 1 θ c = 1 m w c r w c r ( x i c x j c ) ,   ( x i c x j c ) < 0
    Φc(Ai,Aj) reflects the dominance of scheme Ai relative to scheme Aj under the indicator C, where θ (recession coefficient) is used to represent the degree of the DMs avoidance of losses. The smaller θ, the higher the degree to which policymakers prefer risk avoidance. (xicxjc) > 0 reflects efficiency; (xicxjc) = 0 shows no benefit and no loss; (xicxjc) < 0 reflects loss; The relative dominance of each attribute is added to the final advantage matrix.
  • Step 3: Calculate the overall dominance ( ξ i ) of scheme Aj: The final dominance matrix is standardized to obtain the overall dominance of a scheme:
    ξ i = j = 1 n δ ( A i , A j ) min i j = 1 n δ ( A i , A j ) max i { j = 1 n δ ( A i , A j ) } min i { j = 1 n δ ( A i , A j ) }
  • Step 4: Based on the size of the overall dominance ( ξ i ), all alternatives are ranked. The larger the value of the ( ξ i ), the better the scheme is, and the investment decision maker should give priority to it.

4.5. Phase II. Decision-Making—Comparison and Discussion

Investors have different investment psychology, and their degree of emphasis on loss and risk is also different. Therefore, this part further analyzes the sensitivity to verify the stability of decision results. Calculating the overall dominance of different projects corresponds to the ranking results of different recession coefficients. This coefficient reflects the sensitivity of the decision makers to the loss. The smaller the value is, the higher the degree of avoidance of the decision makers is. The value of θ depends on the risk aversion attitude of decision makers. Besides, sensitivity analysis is made for parameters mentioned in Appendix A part 3 including on-grid electricity, the contracted revenue ratio and the share of subjective weight.
In order to illustrate the difference between the TODIM method and the conventional method when considering the investor’s psychology in project selection, this section will use the TOPSIS method to sort the six schemes again. The TOPSIS method is mainly used to calculate the Euclidean distance between the object being evaluated and the positive ideal system [61]. Finally, the optimal solution according to the integrated queue indication value is selected.
Let ( x 1 + , x 2 + , x m + ) be a positive ideal system and ( x 1 , x 2 , x m ) be a negative ideal system, then the Euclidean distance between the object being evaluated and the positive ideal point is:
y i + = j = 1 m w j ( x i j x j + ) 2 ,   i = 1 , 2 , n
The Euclidean distance between the object being evaluated and the negative ideal point is:
y i = j = 1 m w j ( x i j x j ) 2 ,   i = 1 , 2 , n
The general negative ideal point is the virtual worst scheme. Each of its attribute values is the worst of the attribute in the decision matrix, and the scheme close to the positive ideal point and far from the negative ideal point is the best solution. The calculation of the queuing indicated value emphasizes the distance from the negative ideal point. The bigger the queuing indicator is, the better the scheme is:
C i = y i y i + + y i

5. A Case Study of China

5.1. Background Introduction

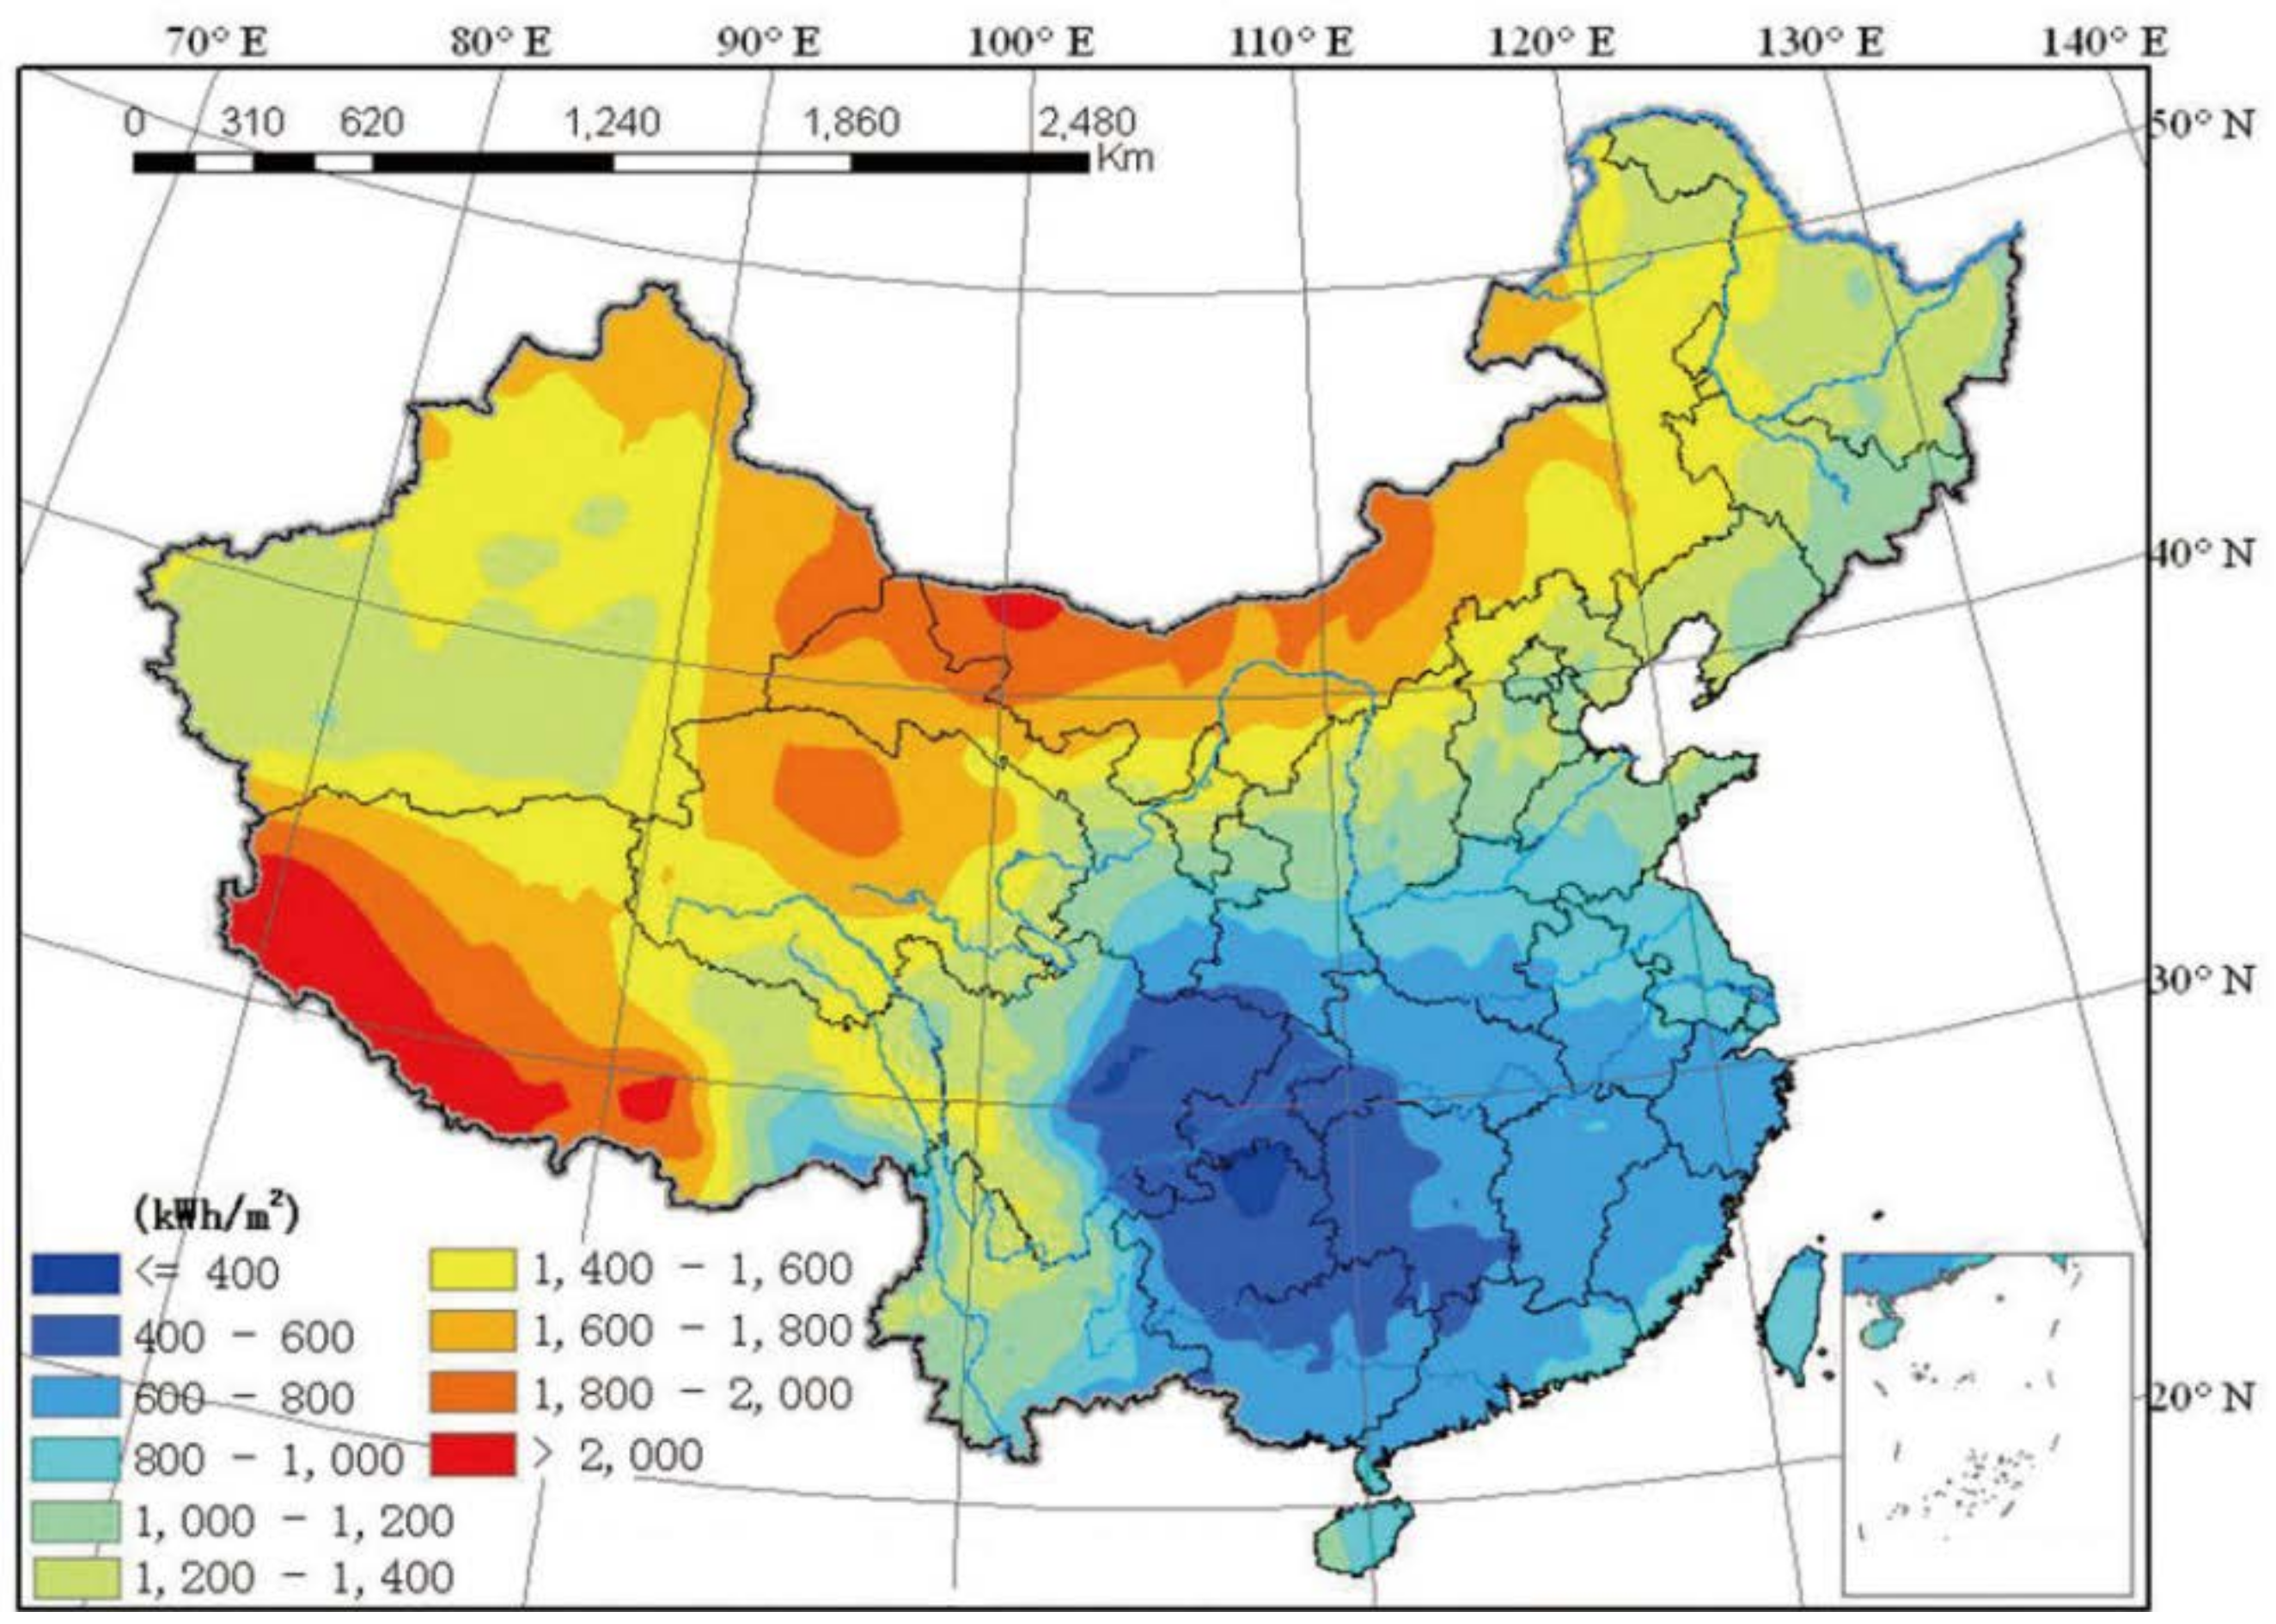
A very important idea in the 13th Five-Year Plan in China is that the development of RE will be more focused on local production and use in the nearest area. PV fully complies with this principle and is the direction of future development. China’s PV power generation presents a pattern of common development in the east, middle and the west. According to the distribution of solar energy resources in China as shown in 
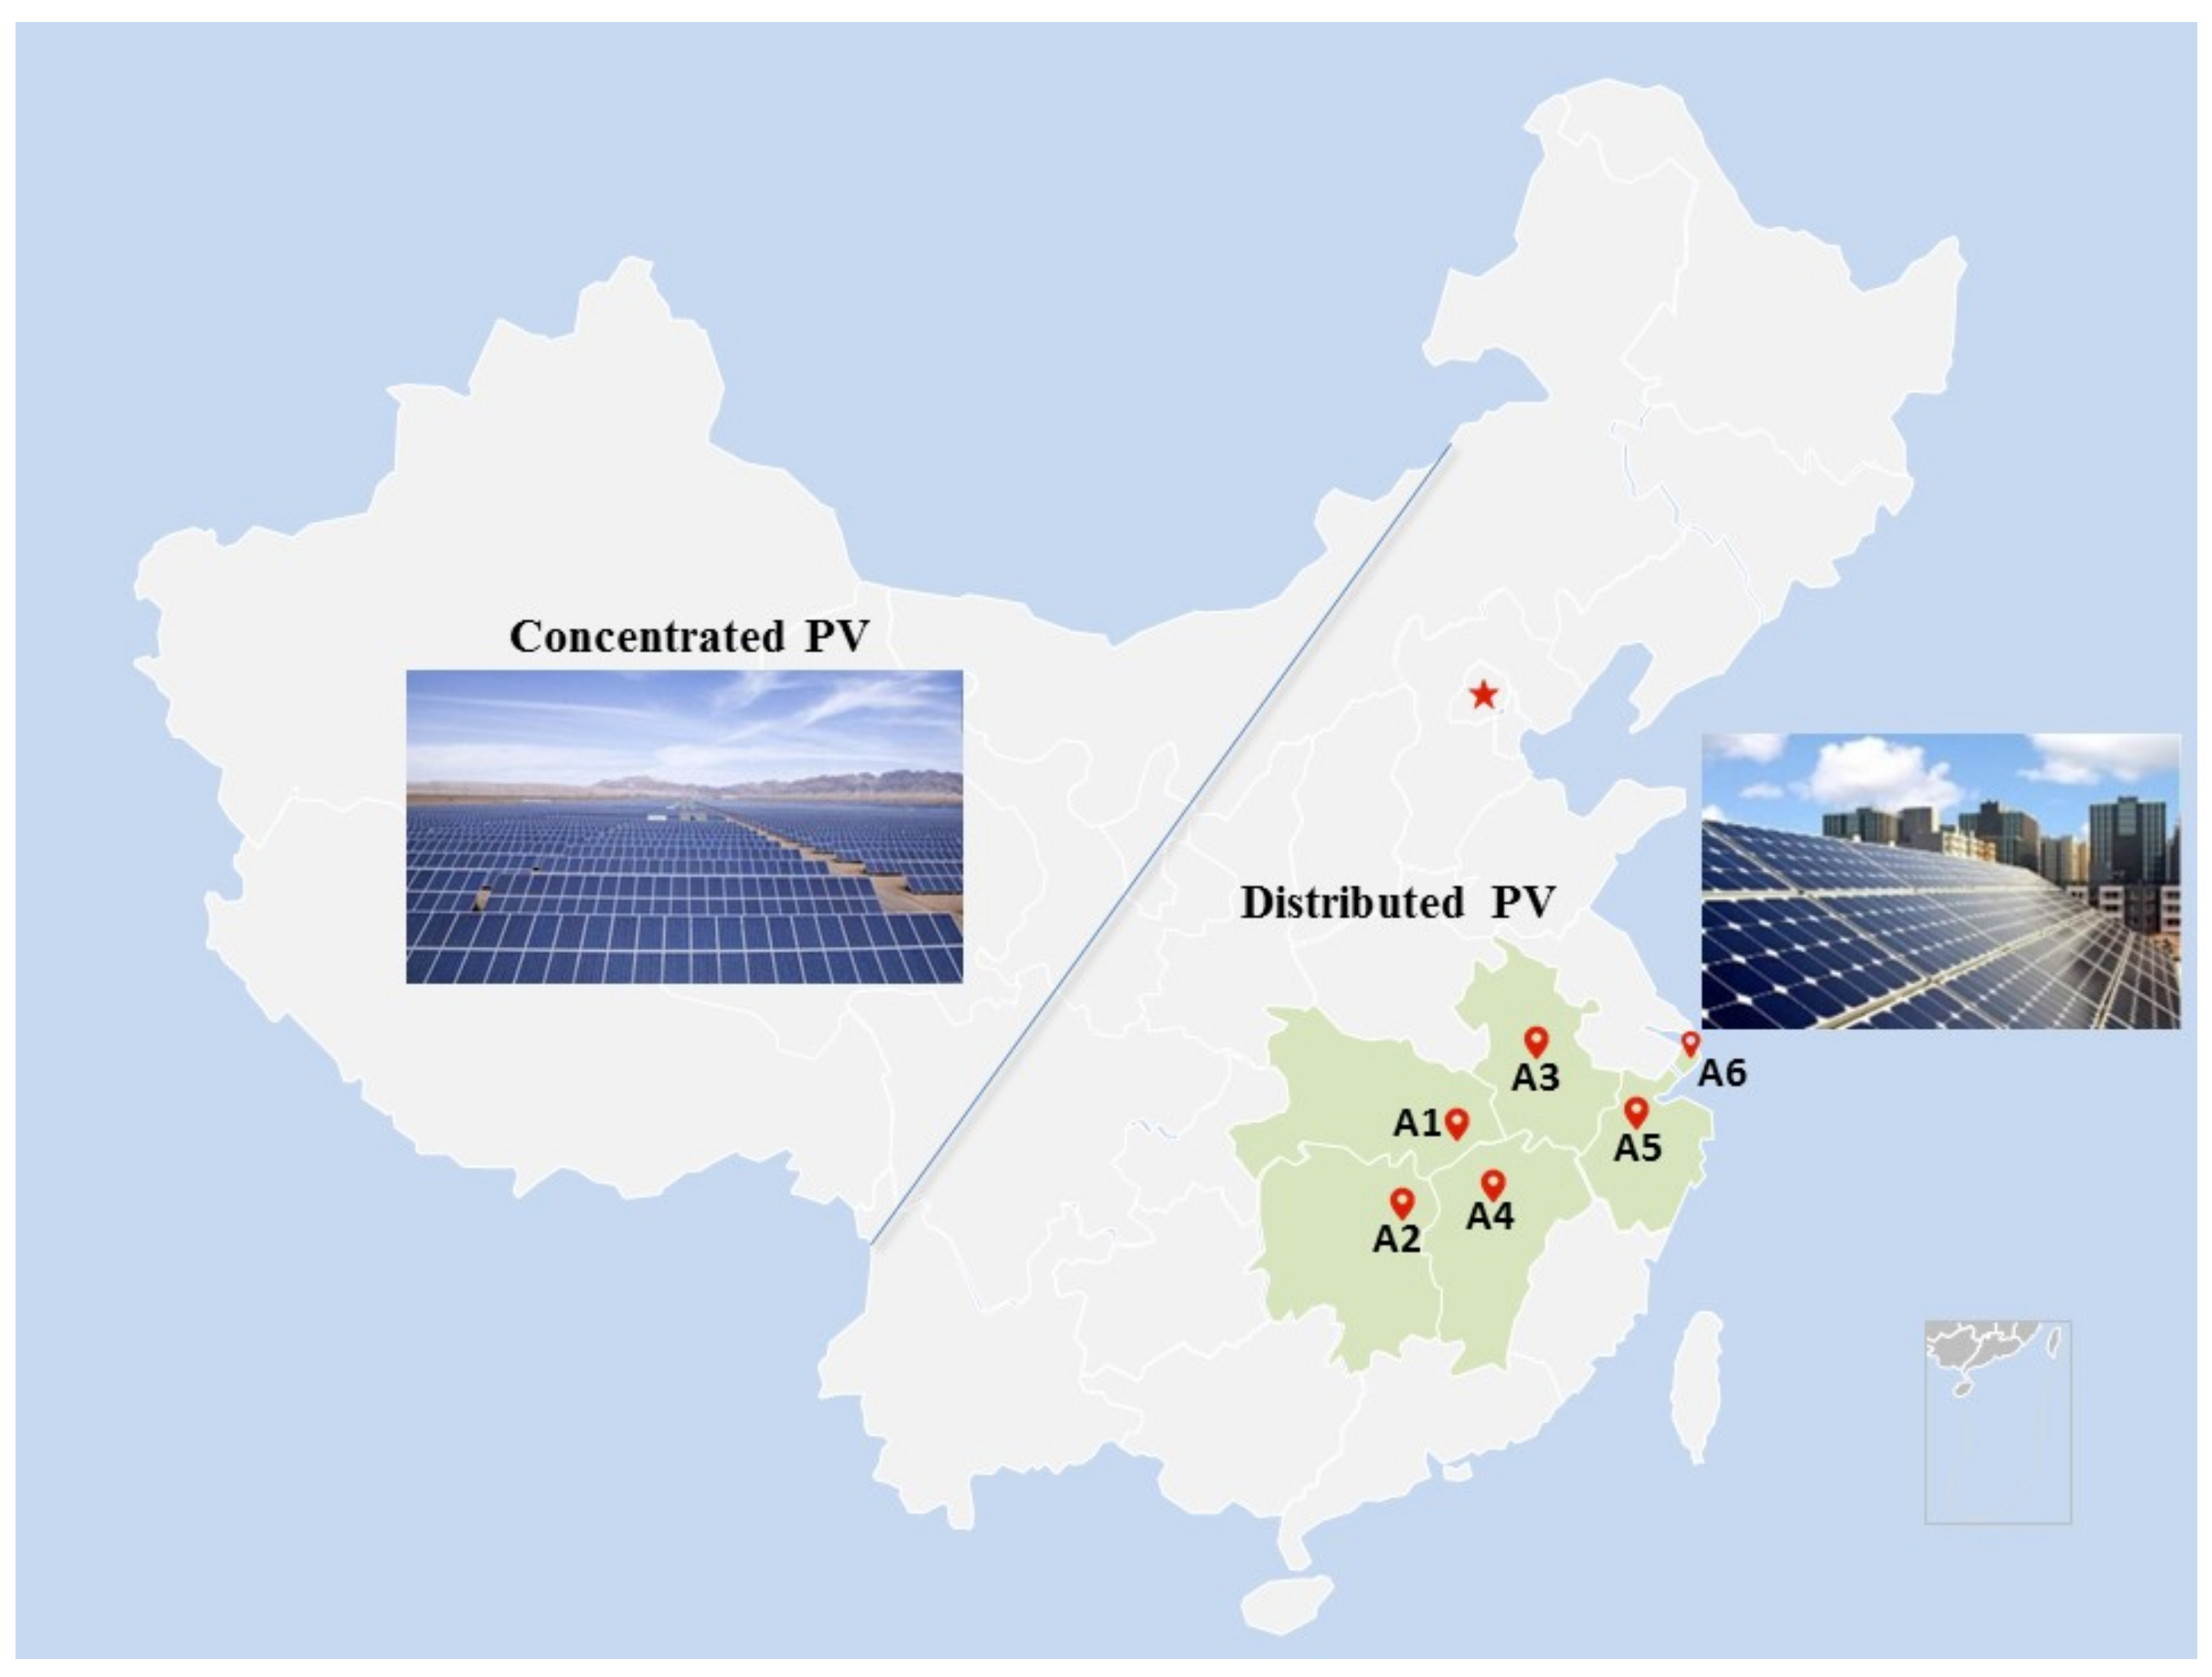
Figure 5, concentrated PV power stations are mainly constructed in the western region, and DPV power generation projects are concentrated in the central and eastern provinces. A domestic new energy investment company plans to invest in grid-connected EPC distributed photovoltaic power generation projects. After six alternative projects are initially formed through the preliminary work, the company plans to use investment decision-making model to find a high investment value of the scheme to invest.
The six projects initially selected are located in the central and eastern provinces of China, as shown in Figure 6. A1 is located in Huangshi City, Hubei Province; A2 is located in Changsha City, Hunan Province; A3 is located in Hefei City, Anhui Province; A4 is located in Nanchang City, Jiangxi Province; A5 is located in Hangzhou City, Zhejiang Province; A6 is located in Shanghai. The installed capacity of the DPV power generation system is set to 1000 KW. The PV power generation system is installed on the roof of the industrial and commercial enterprise’s plant in the municipal district. The areas where these six projects are located are all suitable for the development of DPV power generation projects, with the conditions for DPV power generation to be consumed nearby, and the remaining amount of access to the grid.
However, these six projects differ in market environment, policy subsidies, competitive environment and so on, which brings obstacles for the investors to choose which projects to invest in. In order to maximize economic and social benefits, the company decided to invite experts in the field of DPV power generation to form an assessment committee to help them select the most suitable project for investment. The committee is composed of three main experts, all of whom are professors. Expert E1 is an outstanding scholar in the field of new energy project management and has a solid foundation for theoretical research. The research direction of expert E2 is investment decision. He has been responsible for the investment decision analysis of power grid and government projects on many occasions. Expert E3 has many years of experience in power engineering construction. The three experts have certain understanding of the investment environment and policies for new energy projects.

5.2. Alternative Data Sources

The evaluation criteria system in the investment decision model consists of nine quantitative indicators and seven qualitative indicators. The details are described in the previous section. The data values of the nine quantitative indicators have clear data sources and calculation methods (Table 3).
The data values of qualitative indicators are obtained through questionnaire surveys and the holding of expert seminars. Using very poor (1), poor (3), general (5), good (7), very good (9), these five language scales describe the attribute of project indicators. Finally, the scores of three experts are counted to determine the score. The data values are first described in terms of TFNs. Through defuzzification and normalization processing, the attribute values of the indicators all lie within the range of 0–1.

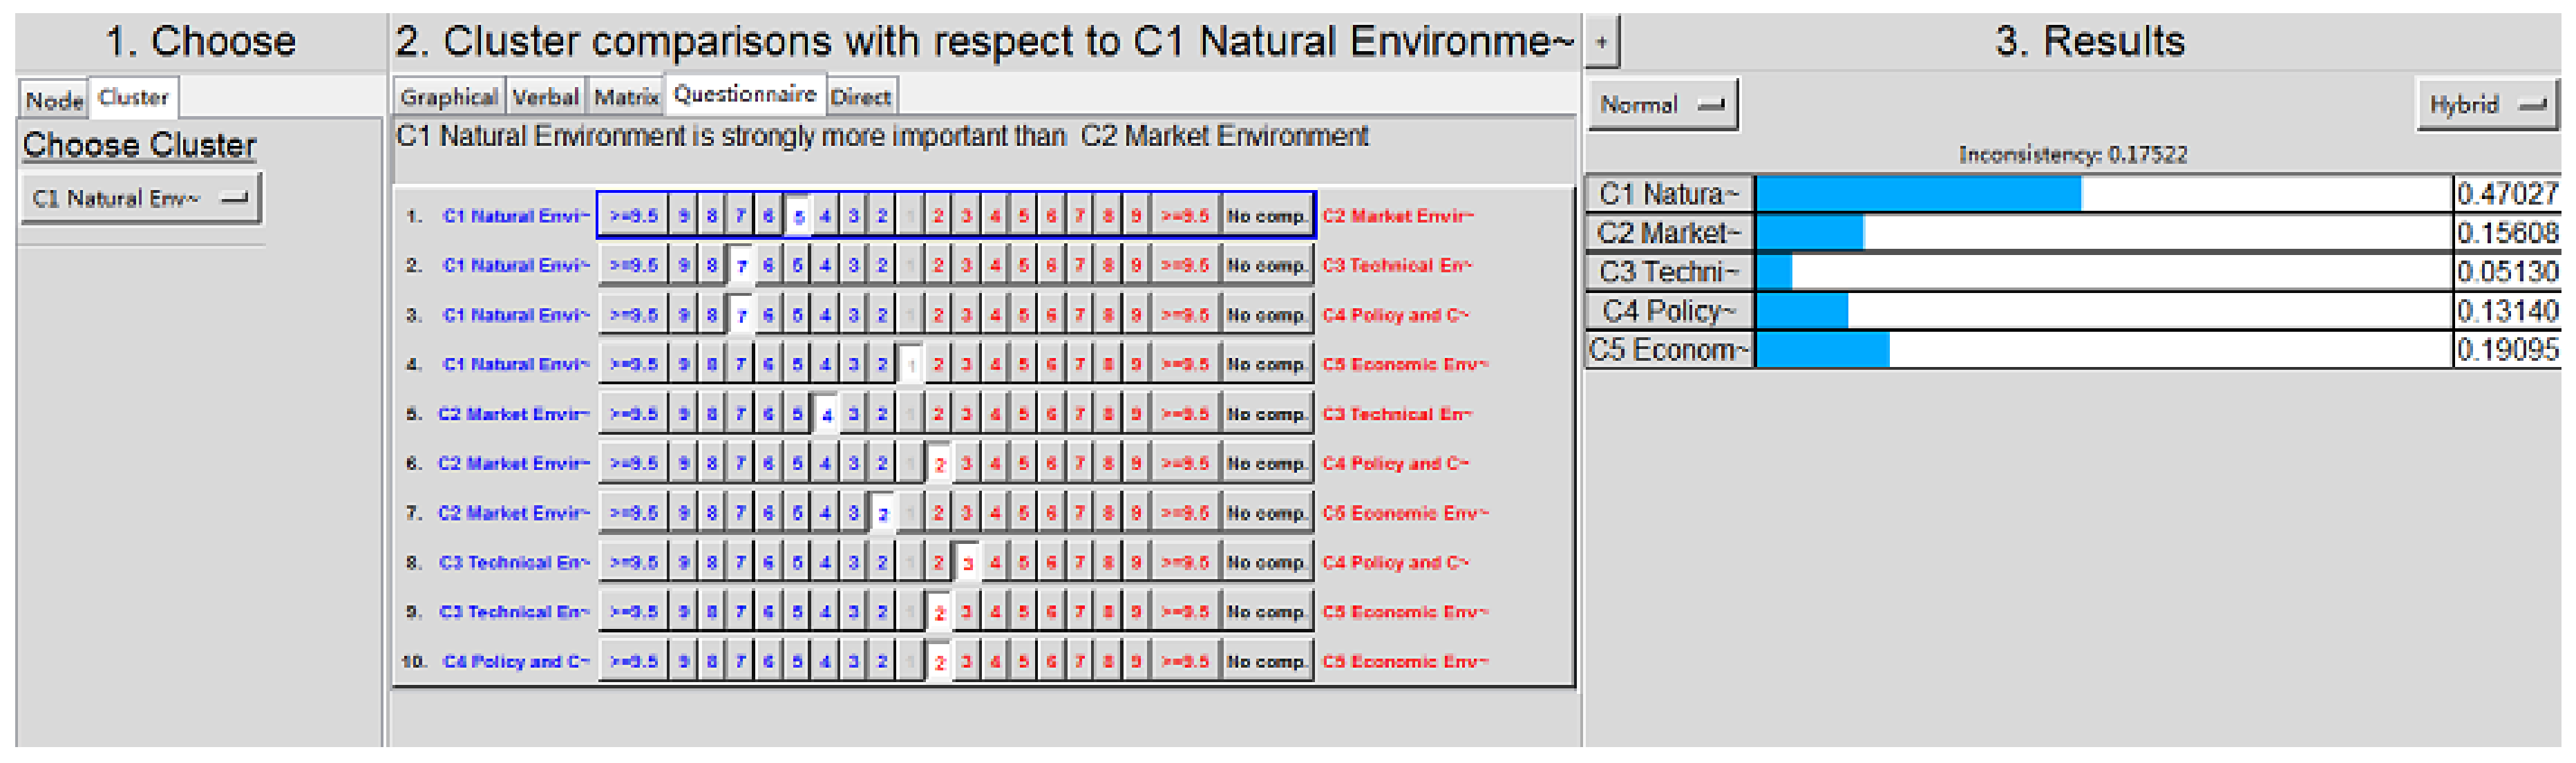
5.3. Weight Calculation

This section is based on the ANP method and entropy method described in 4.3 to determine the subjective weights and objective weights of the indicators, and finally get the comprehensive weights. The three indicators C1.1, C1.2, and C1.3 in the natural environment take their minimum, average, and maximum values as the numerical source of the TFN; Under the economic environment, the three indicators C5.2, C5.3, and C5.4 use the on-grid values of 30%, 50%, and 70% of the total power generation as the source of the number of TFNs. The on-grid values settings here are obtained through the interviews’ questionnaire. (Part 3 of Appendix A) The attribute value of the TFN of the qualitative indicator is composed of the minimum value, the average value, and the highest value scored by the experts. The titles of the three experts are professors. When expert opinions are assembled, they are considered to have the same weight.
When calculating subjective weights, the most important step is to analyze the relevance of the indicators. The final mutual influence concern of the factors is shown in Table 4. The symbol “√” means that the criterion in the row would have an effect on the factor in the column.
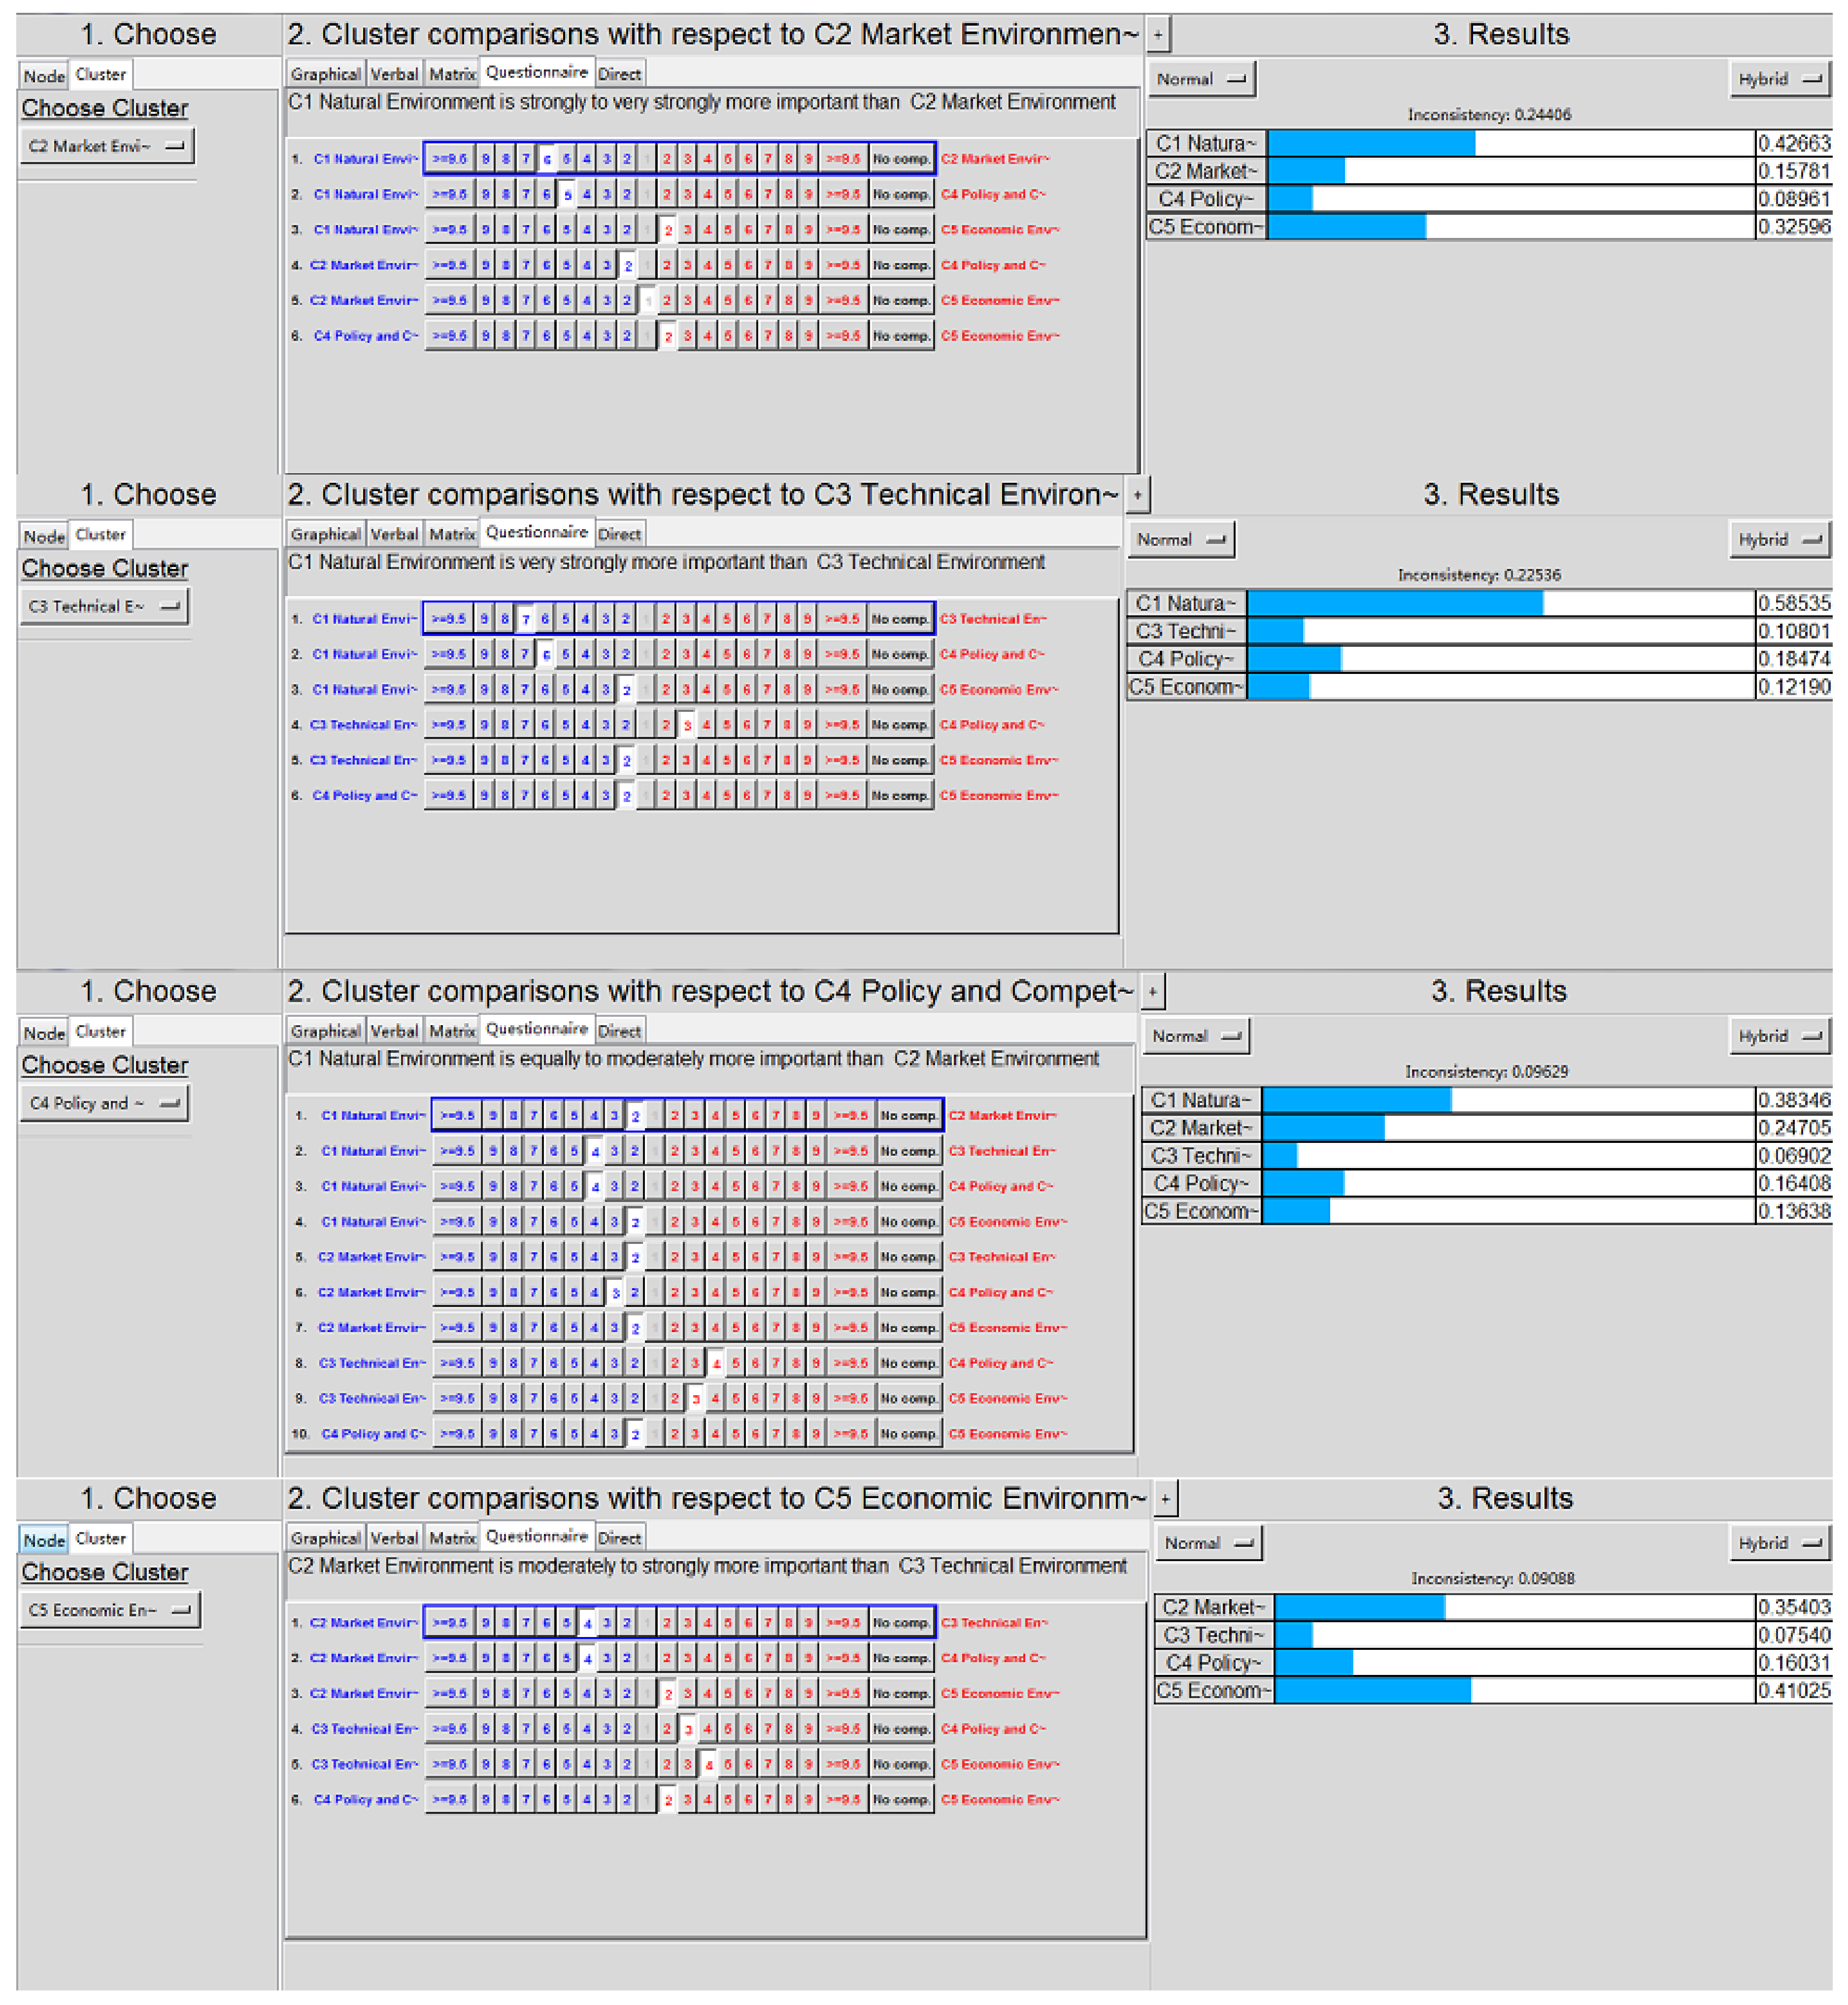
Set equal shares of the subjective weight and the objective weight to calculate comprehensive weights. Investors consider that both weights are equally important when there are many attributes and large uncertainties. The final results are shown in the Table 5.
The market environment and economic environment account for a relatively high proportion. Due to the little difference in solar energy resources, the weight of environmental indicators is not prominent. Figure 7 shows the intuitive proportions of indicators at all levels.

5.4. Applying TODIM Method for Ranking

By the above calculation (Equations (5) and (6)), the normative decision matrix N = [ n i j ] m × n can be obtained. The relative weight of indicator Cj is wjr = wj/wr, where w r = max { w j | j n } is the reference weight. Due to the large number of decision indicators, only the dominance matrix Φ 11 under indicator C1.1 is listed here as an example (Table 6).
According to the steps described in Section 4.4, compute the dominance matrix Φj for each indicator Cj, then summarize the dominance of the 16 indicators to get the overall dominance matrix of the project, as shown in Table 7.
According to the Equations (8) and (9), calculate the comprehensive sorting value of the solution. The result is shown in Table 8.
Based on the calculation results, the order of alternative items can be determined as follows: A 4 > A 3 > A 6 > A 5 > A 1 > A 2 . Therefore, the company should give priority to investing in Project A4, which meets the requirements of DPV power generation technology and has good economic, environmental, and social benefits. The result is an optimal project plan that reflects the investor’s certain psychological, i.e., the recession coefficient θ = 1.

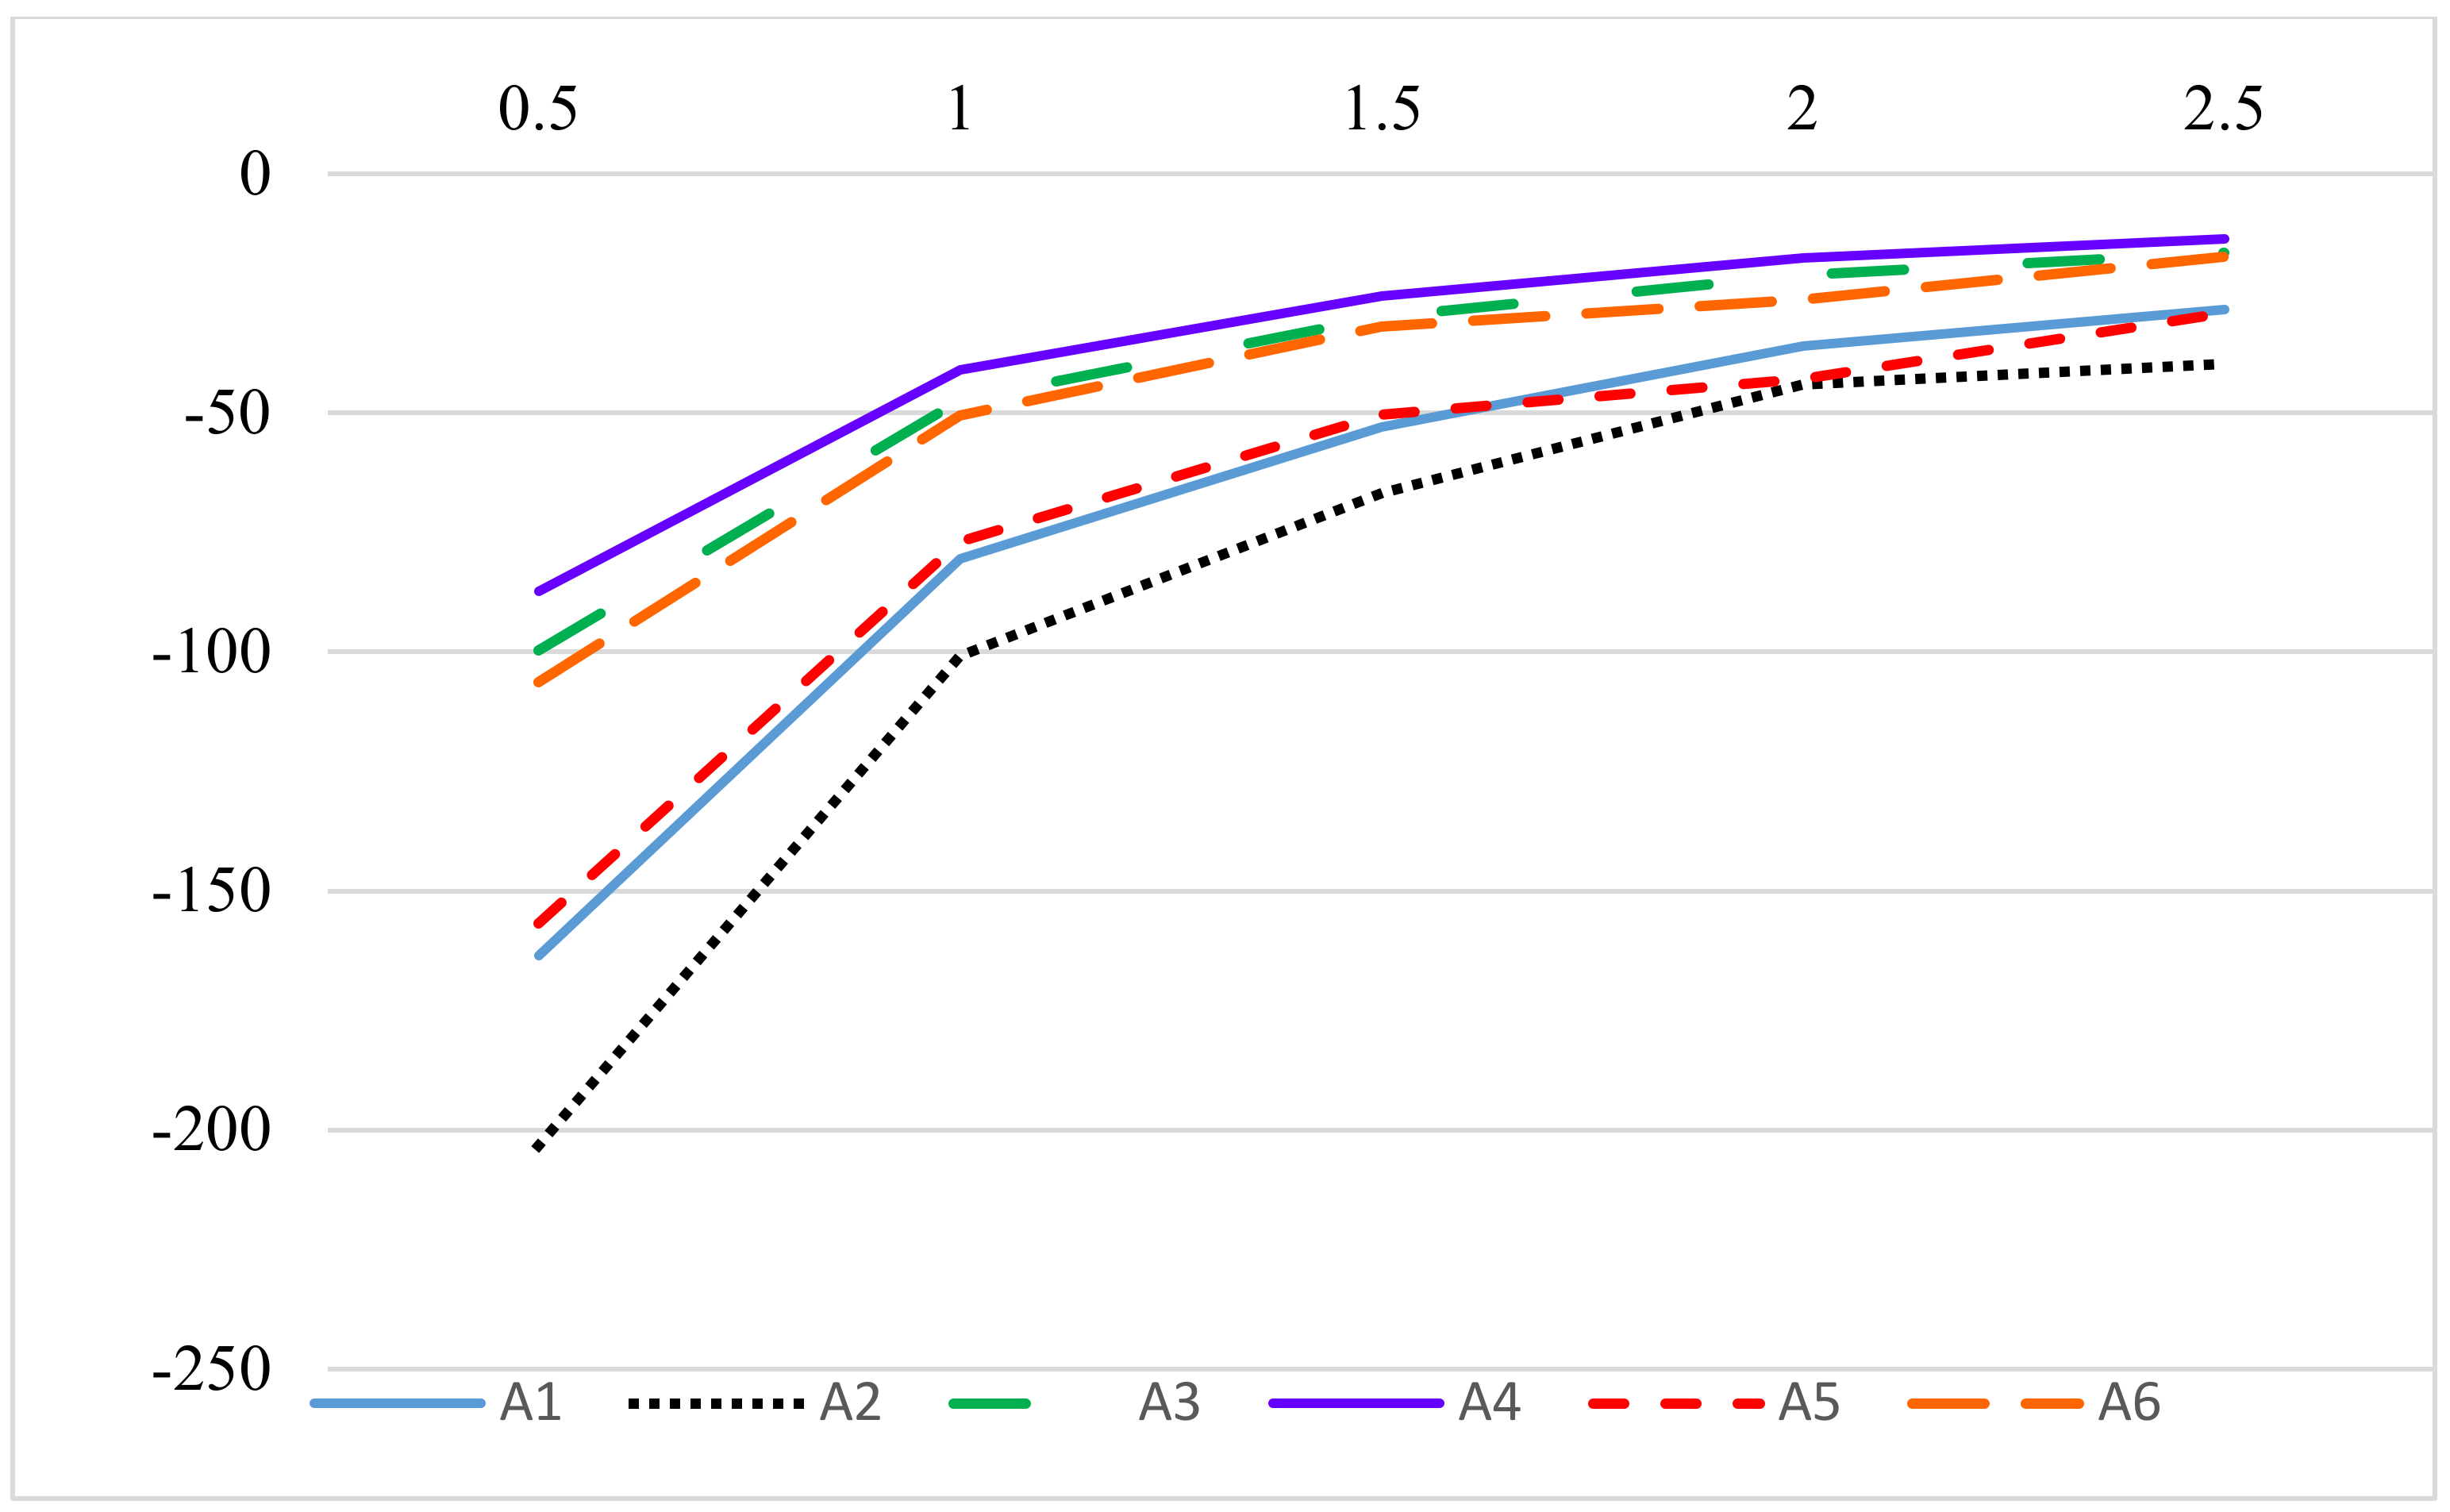
5.5. Sensitivity Analysis

In the existing studies, the two values θ = 1 and θ = 2.5 are used at the most [30,31]. The sensitivity analysis in this part sets the recession coefficients to 0.1, 0.5, 1, 1.5, 2, and 2.5 respectively. Then the overall dominance and ranking of each scheme is calculated (Table 9).
According to Figure 8, the smaller the value of θ, the higher the degree of evasion of the decision makers on the loss, the more sensitive to the loss, the smaller the overall dominance of the program; As the value of θ becomes larger, the gap between the overall dominance of the schemes becomes smaller; In addition, the value of θ will also affect the ranking of the scheme: Regardless of changes in the value of θ, scheme A4 is always the optimal solution. However, it can be seen that the ranking results of schemes 1 and 2 have changed as the value changes from 1.5 to 2, which shows that the decision maker’s psychology will have an impact on the ranking result.
This part also further analyzes the sensitivity to verify the stability of decision results. Sensitivity analysis is made for parameters mentioned in Appendix A part 3. We assumed that the project’s on-grid electricity is 30%, 50%, 70% respectively to make sensitivity analysis (Table 10) and parameter a (the contracted revenue ratio) is set to 0.1, 0.3, 0.5, 0.7, 0.9 for sensitivity analysis (Table 11). In addition, the share of subjective weight is set to 0.1, 0.3, 0.5, 0.7, 0.9 respectively (Table 12).
The change of on-grid electricity can affect the economic change of the alternatives, but there is no change in the other aspects of the decision criteria system, which leads to no change in the final ranking results. That is to say, economy is only one of the important aspects of decision-making that is not able enough to change the results.
Similar to the situation in Table 10, the final ranking results have not changed, and the economic changes in the alternative project lead to a slight change in the overall dominance, but not enough to change the results.
It can be seen that with the increase of the proportion of subjective weight, the ranking results of alternative projects have changed. The projects that rank second and third changed the order, and the ranking results of other projects did not change. This shows that the proportion of subjective and objective weight will have an impact on the ranking results. Its impact on the whole decision criteria is enough to influence the final ranking results to a certain extent.

5.6. Comparative Analysis

The results of comparative analysis using the TOPSIS method are shown in the following table. The ranking results obtained by the TOPSIS method is shown in Table 13. It can be seen that the optimal alternative obtained by the TOPSIS is different from the TODIM method. Except the A4, the ranking results of other schemes are not very different besides the order exchange between the two ranking adjacent schemes. It’s worth noting that the ranking of scheme A4 changes from fourth to first. The TOPSIS method places more emphasis on the distance between alternative and best reference scenarios while the TODIM method focuses on the impact of the disadvantages of the alternatives in the decision making.

6. Conclusions

With the promotion of favorable policies, the DPV power generation is developing rapidly in China, and more and more DPV projects under the EPC business model will be built. This paper establishes an investment decision framework for DPV-EPC projects to help investors to select the most appropriate project. The main conclusions of this paper are as follows.
(1)
An investment decision criteria system is established for DPV projects under the EPC business model through a literature survey and interaction with experts. The decision-making criteria contain five categories, namely natural environment, market environment, technical environment, policy and competitive environment, and economic environment, to evaluate the alternative comprehensively.
(2)
A TODIM-based approach is applied to rank the alternative DPV projects. In this approach, the TFNs are used to express the decision-making information and the weights are determined by integrating subjective and objective weights. This method considers investor’s loss-aversion behavior and obtains more accurate criteria weights.
(3)
A case in central and eastern China is studied to demonstrate the validity of the proposed investment decision framework, in which the Project A4 located in Nanchang City is the optimal project plan. The most influential factor for investment decision of DPV-EPC projects is market environment, followed by the economic environment.
(4)
A sensitivity analysis of parameters conducted to illustrate the robustness of the decision result. The Project A4 is chosen as the optimal project plan in all experiments, but the ranking order is sensitive to the investor’s loss-aversion level and the ratio of subjective weight and objective weight.
(5)
A comparison analysis with another MCDM method namely TOPSIS is performed to present the superiority of the proposed method. The final results determined by two methods are significantly different, indicating that whether considering DPV investors’ psychological behavior can affect the investment decision result.
The merit of the proposed framework is its practical applicability under uncertain environment, but there are still some limitations in this paper. In the future research, similar studies can be conducted under an intuitionistic fuzzy environment to deal with more complex problems. In addition, since the portfolio becomes an important means of risk diversification, DPV project portfolio selection under fuzzy environment is a topic worthy of further study.

Author Contributions

Y.W. and J.Z. designed the investment decision framework; J.Z. and Y.H. established the decision index system, collected the relative data and calculated the result; J.Z. and Y.H. studied the TODIM method application and analyzed the result collectively; after that, X.S. and L.L. corrected the paper; Finally, J.Z. wrote the paper and formatted the manuscript for submission.

Acknowledgments

This paper is supported by the Fundamental Research Funds for the Central Universities (NO. 2018ZD14) and the 2017 Special Project of Cultivation and Development of Innovation Base (NO. Z171100002217024). The authors are thankful to all experts who participated in the consultation process for their valuable inputs.

Conflicts of Interest

The authors declare no conflict of interest.

Appendix A. Interviews’ Questionnaire Template

Part 1: Factors influencing investment decisions
In this study, a list of factors affecting the investment decision-making of distributed photovoltaic power generation projects under the contract energy management operation mode was compiled through the collection of literature materials.
Natural environment (C1)Solar energy resource level C1.1
Air ground temperature C1.2
The overall level of sunshine C1.3
Geological disaster C1.4
Altitude and air pressure C1.5
Climate Disasters C1.6
Air ground humidity C1.7
Market environment (C2)Distributed growth rate C2.1
Non-hydro renewable electricity growth rate C2.2
Participate in market transactions C2.3
Market access barriers C2.4
Market demand C2.5
Market Competitiveness C2.6
Force majeure C2.7
Technical environment (C3)Technology Maturity C3.1
Infrastructure construction conditions C3.2
Operation and maintenance level C3.3
Grid connection risk C3.4
Equipment selection risk C3.5
Power supply reliability C3.6
Power stability C3.7
Construction safety C3.8
Design defect C3.9
Lack of project experience C3.10
Completion risk C3.11
Policy and Competitive environment (C4)Power subsidies C4.1
Government service level C4.2
Power grid service level C4.3
Subsidy implementation C4.4
Regional policy C4.5
Delay in approval C4.6
Environmental pollution C4.7
Government corruption C4.8
Government credit C4.9
Government intervention C4.10
Public opposition C4.11
Insufficient bidding competition C4.12
Legislative changes C4.13
Economic environment (C5)Financing difficulty C5.1
Construction cost C5.2
Solvency C5.3
On-grid price C5.4
Financing interest rate C5.5
Inflation C5.6
Project proceeds C5.7
IRR C5.8
Payback period C5.9
In your opinion:
a. 
Are there any important factors missing?
b. 
Which factors have the highest impact on the decision-making?
c. 
Do you think the classification of indicators is reasonable??
d. 
If not, can you give some advice on it?
Part 2: Policy-related risks
In the criteria system of this study, there are 7 qualitative indicators that require your evaluation, and you can use very poor, poor, general, good, very good (5 language scales) to describe the criteria attribute. (Take indicator C4.2 as an example).
According to your knowledge and experience:
a. 
Does the Hangzhou municipal government have extra charges for the DPV project?
b. 
What convenient service measures has Hangzhou municipal government developed for the DPV project?
c. 
Has the Hangzhou government established and implemented the DPV power generation management rules?
d. 
What do you think of the government’s service level for DPV power generation projects? (very poor, poor, general, good, very good)
Part 3: Parametric assumptions
In the last part of this interview, we would like to share some of our assumptions with you, to test how these compare to your estimations.
a. 
In order to calculate the I2 (On-grid income) we assumed that the project’s on-grid electricity is 30%, 50%, 70% respectively. Do you find this ratio reasonable?
b. 
Do you agree with our assumption that the subjective weight and objective weight are equally important in DPV project?
c. 
Do you agree with our estimation of the contracted revenue ratio(a)? Should it be lower/higher?

Appendix B. Weight Calculation by Tools

The process of calculating the weight of each indicator by the SuperDecisions software can be summarized in the following steps.
(1)
According to the constraint relations among indexes, the ANP model diagram of investment decision of DPV can be established.
Figure A1. Using SuperDecisions to construct the relationship between indicators.
Energies 11 01210 g0a1
(2)
Then the important degree of each indicator is determined by using pair-wise comparison based on the experience and logical reasoning of the experts.
The important degree of each indicator is determined by using pair-wise comparison based on the experience and logical reasoning of the experts (Take first-tier indicators as an example).
(3)
Finally, the weight of each indicator could be calculated by the software of SuperDecisions. The result is shown as follows.
Figure A2. The subjective weight of the indicator is obtained by SuperDecisions.
Energies 11 01210 g0a2aEnergies 11 01210 g0a2bEnergies 11 01210 g0a2c
Figure A3. Applying MATLAB to obtain objective weights of indicators.
Energies 11 01210 g0a3

References

  1. Agency, I.E. World Energy Investment Outlook; International Energy Agency: Paris, France, 2014; p. 55. [Google Scholar]
  2. Zhao, X.; Zeng, Y.; Zhao, D. Distributed solar photovoltaics in china: Policies and economic performance. Energy 2015, 88, 572–583. [Google Scholar] [CrossRef]
  3. Zhang, S. Innovative business models and financing mechanisms for distributed solar pv (dspv) deployment in china. Energy Policy 2016, 95, 458–467. [Google Scholar] [CrossRef]
  4. Angelopoulos, D.; Doukas, H.; Psarras, J.; Stamtsis, G. Risk-based analysis and policy implications for renewable energy investments in greece. Energy Policy 2017, 105, 512–523. [Google Scholar] [CrossRef]
  5. Betz, S.; Caneva, S.; Weiss, I.; Rowley, P. Photovoltaic energy competitiveness and risk assessment for the south african residential sector. Prog. Photovolt. Res. Appl. 2016, 24, 1577–1591. [Google Scholar] [CrossRef] [Green Version]
  6. Rocchetta, R.; Li, Y.F.; Zio, E. Risk assessment and risk-cost optimization of distributed power generation systems considering extreme weather conditions. Reliability Eng. Syst. Saf. 2015, 136, 47–61. [Google Scholar] [CrossRef] [Green Version]
  7. Markov, K.K.; Bijelic, I.B.; Dobric, G.; Rajakovic, N. Investment Decisions in the Photovoltaic Power Plant in Terms of the Market Bearing in Mind the Physical Limitations of the Transmission Network. In Proceedings of the International Symposium on Industrial Electronics, Banja Luka, Bosnia Herzegovina, 3–5 November 2016; pp. 1–6. [Google Scholar]
  8. Zhang, F.; Deng, H.; Margolis, R.; Su, J. Analysis of distributed-generation photovoltaic deployment, installation time and cost, market barriers, and policies in china. Energy Policy 2015, 81, 43–55. [Google Scholar] [CrossRef]
  9. Peng, P.; Shao, L.; Yu, G.; Lou, X.; Shao, Y.; Sun, J. Economic comparison of distributed grid-connected photovoltaic generation with different business models. In Proceedings of the IEEE International Conference on Power and Power and Renewable Energy, Shanghai, China, 21–23 October 2017; pp. 585–588. [Google Scholar]
  10. Garcia-Bernabeu, A.; Benito, A.; Bravo, M.; Pla-Santamaria, D. Photovoltaic power plants: A multicriteria approach to investment decisions and a case study in western spain. Ann. Oper. Res. 2016, 245, 163–175. [Google Scholar] [CrossRef]
  11. Zhou, N.; Liu, N.; Zhang, J. Multi-scenarios pv-based microgrids investment decision considering feed-in-tariff regulation. In Proceedings of the 2016 IEEE 11th Conference on Industrial Electronics and Applications, Hefei, China, 5–7 June 2016; pp. 2311–2316. [Google Scholar]
  12. Fang, S.; Liu, J.; Liu, M.; Zhang, Z.; Zhou, Y.H. Photovoltaic power generation investment decision-making framework based on real options theory. Appl. Mech. Mater. 2013, 392, 480–483. [Google Scholar] [CrossRef]
  13. Strupeit, L.; Palm, A. Overcoming barriers to renewable energy diffusion: Business models for customer-sited solar photovoltaics in japan, germany and the united states. J. Clean. Prod. 2016, 123, 124–136. [Google Scholar] [CrossRef]
  14. Lihua, L.; Ruimin, Z.; Meiping, H.; Hong, Z.; Chengyi, S. The Economic Benefits of Distributed Photovoltaic Power Generation. 2014. Available online: https://www.researchgate.net/publication/286296013_ (accessed on 1 March 2018).
  15. Jannuzzi, G.D.M.; Melo, C.A.D. Grid-connected photovoltaic in brazil: Policies and potential impacts for 2030. Energy Sustain. Dev. 2013, 17, 40–46. [Google Scholar] [CrossRef]
  16. Mitscher, M.; Rüther, R. Economic performance and policies for grid-connected residential solar photovoltaic systems in brazil. Energy Policy 2012, 49, 688–694. [Google Scholar] [CrossRef]
  17. Holdermann, C.; Kissel, J.; Beigel, J. Distributed photovoltaic generation in brazil: An economic viability analysis of small-scale photovoltaic systems in the residential and commercial sectors. Energy Policy 2014, 67, 612–617. [Google Scholar] [CrossRef]
  18. Huang, H. Financial analysis of distributed photovoltaic power generation project of family. J. Anhui Electrical Eng. Prof. Tech. Coll. 2014, 19, 72–77. [Google Scholar]
  19. Qiang, J.; Zinan, S.; Jingru, L.; Lulu, Y. National economic evaluation of photovoltaic generation. Electric Power Constr. 2013, 34, 87–90. [Google Scholar]
  20. Shi, Q.; Wenshu, Y.U.; Xie, P. Economic benefit analysis of distributed photovoltaic under the energy internet background. Power Syst. Clean Energy 2016, 32, 100–106. [Google Scholar]
  21. Şengül, Ü.; Eren, M.; Shiraz, S.E.; Gezder, V.; Şengül, A.B. Fuzzy topsis method for ranking renewable energy supply systems in turkey. Renew. Energy 2015, 75, 617–625. [Google Scholar] [CrossRef]
  22. Baringo, L.; Conejo, A.J. Wind power investment: A benders decomposition approach. IEEE Trans. Power Syst. 2012, 27, 433–441. [Google Scholar] [CrossRef]
  23. Fetanat, A.; Khorasaninejad, E. A novel hybrid mcdm approach for offshore wind farm site selection: A case study of iran. Ocean Coast. Manag. 2015, 109, 17–28. [Google Scholar] [CrossRef]
  24. Gazheli, A.; Bergh, J.V.D. Real options analysis of investment in solar vs. Wind energy: Diversification strategies under uncertain prices and costs. Renew. Sustain. Energy Rev. 2018, 82, 2693–2704. [Google Scholar] [CrossRef]
  25. Qin, Q.; Liang, F.; Li, L.; Chen, Y.W.; Yu, G.F. A todim-based multi-criteria group decision making with triangular intuitionistic fuzzy numbers. Appl. Soft Comput. 2017, 55, 93–107. [Google Scholar] [CrossRef]
  26. Wu, Y.; Yang, M.; Zhang, H.; Chen, K.; Wang, Y. Optimal site selection of electric vehicle charging stations based on a cloud model and the promethee method. Energies 2016, 9, 157. [Google Scholar] [CrossRef]
  27. Chen, T.Y. An Interval Type-2 Fuzzy Promethee Method Using a Likelihood-Based Outranking Comparison Approach; Elsevier Science Publishers B. V.: New York, NY, USA, 2015; pp. 105–120. [Google Scholar]
  28. Peng, A.H.; Xiao, X.M. Material selection using promethee combined with analytic network process under hybrid environment. Mater. Des. 2013, 47, 643–652. [Google Scholar] [CrossRef]
  29. Qin, J.; Liu, X.; Pedrycz, W. An extended todim multi-criteria group decision making method for green supplier selection in interval type-2 fuzzy environment. Eur. J. Oper. Res. 2016, 258, 626–638. [Google Scholar] [CrossRef]
  30. Ren, P.; Xu, Z.; Gou, X. Pythagorean fuzzy todim approach to multi-criteria decision making. Appl. Soft Comput. 2016, 42, 246–259. [Google Scholar] [CrossRef]
  31. Zhang, X.; Xu, Z. The todim analysis approach based on novel measured functions under hesitant fuzzy environment. Knowl.-Based Syst. 2014, 61, 48–58. [Google Scholar] [CrossRef]
  32. Gomes, L.F.A.M.; Lima, M.M.P.P. Todim: Basic and application to multicriteria ranking of projects with environmental impacts. Paris 1991, 16, 113–127. [Google Scholar]
  33. Liu, J.; Xu, F.; Lin, S. Site selection of photovoltaic power plants in a value chain based on grey cumulative prospect theory for sustainability: A case study in northwest china. J. Clean. Prod. 2017, 148, 386–397. [Google Scholar] [CrossRef]
  34. Sánchez-Lozano, J.M.; García-Cascales, M.S.; Lamata, M.T. Comparative topsis-electre tri methods for optimal sites for photovoltaic solar farms. Case study in spain. J. Clean. Prod. 2016, 127, 387–398. [Google Scholar] [CrossRef]
  35. Hong, T.; Koo, C.; Park, J.; Park, H.S. A gis (geographic information system)-based optimization model for estimating the electricity generation of the rooftop pv (photovoltaic) system. Energy 2014, 65, 190–199. [Google Scholar] [CrossRef]
  36. Koo, C.; Hong, T.; Park, J. Development of the life-cycle economic and environmental assessment model for establishing the optimal implementation strategy of the rooftop photovoltaic system. Technol. Econ. Dev. Econ. 2016. [Google Scholar] [CrossRef]
  37. Garni, H.A.; Kassem, A.; Awasthi, A.; Komljenovic, D.; Al-Haddad, K. A multicriteria decision making approach for evaluating renewable power generation sources in saudi arabia. Sustain. Energy Technol. Assess. 2016, 16, 137–150. [Google Scholar] [CrossRef]
  38. Qin, Q.; Liang, F.; Li, L.; Wei, Y.M. Selection of energy performance contracting business models: A behavioral decision-making approach. Renew. Sustain. Energy Rev. 2017, 72, 422–433. [Google Scholar] [CrossRef]
  39. Kurt, Ü. The fuzzy topsis and generalized choquet fuzzy integral algorithm for nuclear power plant site selection—A case study from turkey. J. Nucl. Sci. Technol. 2014, 51, 1241–1255. [Google Scholar] [CrossRef]
  40. Latinopoulos, D.; Kechagia, K. A gis-based multi-criteria evaluation for wind farm site selection. A regional scale application in greece. Renew. Energy 2015, 78, 550–560. [Google Scholar] [CrossRef]
  41. Wu, Y.; Geng, S. Multi-criteria decision making on selection of solar–wind hybrid power station location: A case of china. Energy Convers. Manag. 2014, 81, 527–533. [Google Scholar]
  42. Wu, Y.; Geng, S.; Zhang, H.; Gao, M. Decision framework of solar thermal power plant site selection based on linguistic choquet operator. Appl. Energy 2014, 136, 303–311. [Google Scholar] [CrossRef]
  43. Amer, M.; Daim, T.U. Selection of renewable energy technologies for a developing county: A case of pakistan. Energy Sustain. Dev. 2011, 15, 420–435. [Google Scholar] [CrossRef]
  44. Chatzimouratidis, A.I.; Pilavachi, P.A. Technological, economic and sustainability evaluation of power plants using the analytic hierarchy process. Energy Policy 2009, 37, 788–798. [Google Scholar] [CrossRef]
  45. Abudeif, A.M.; Moneim, A.A.A.; Farrag, A.F. Multicriteria decision analysis based on analytic hierarchy process in gis environment for siting nuclear power plant in egypt. Ann. Nucl. Energy 2015, 75, 682–692. [Google Scholar] [CrossRef]
  46. Gorsevski, P.V.; Cathcart, S.C.; Mirzaei, G.; Jamali, M.M.; Ye, X.; Gomezdelcampo, E. A group-based spatial decision support system for wind farm site selection in northwest ohio. Energy Policy 2013, 55, 374–385. [Google Scholar] [CrossRef]
  47. Chen, G. From mercantile strategy to domestic demand stimulation: Changes in china's solar pv subsidies. Asia Pac. Bus. Rev. 2015, 21, 96–112. [Google Scholar] [CrossRef]
  48. Fan, B. Is subsidies conducive to guide pv enterprises to expand r&d investment?—Dynamic game analysis based on datum of listed companies. J. Nanjing Univ. Aeronaut. Astronaut. 2017, 19, 18–22. [Google Scholar]
  49. Lawrey, R.N.; Pillarisetti, J.R. Energy subsidies versus economic efficiency: Practical and theoretical issues in the case of brunei darussalam. Asian Soc. Sci. 2011, 7. [Google Scholar] [CrossRef]
  50. Dong, J.; Feng, T.T.; Yang, Y.S.; Yu, M. Macro-site selection of wind/solar hybrid power station based on electre—II. Renew. Sustain. Energy Rev. 2014, 35, 194–204. [Google Scholar]
  51. Tavana, M.; Keramatpour, M.; Santos-Arteaga, F.J.; Ghorbaniane, E. A fuzzy hybrid project portfolio selection method using data envelopment analysis, topsis and integer programming. Expert Syst. Appl. 2015, 42, 8432–8444. [Google Scholar] [CrossRef]
  52. Shakouri, M.; Lee, H.W.; Kim, Y.W. A probabilistic portfolio-based model for financial valuation of community solar. Appl. Energy 2017, 191, 709–726. [Google Scholar] [CrossRef]
  53. Guo, S.; Zhao, H. Optimal site selection of electric vehicle charging station by using fuzzy topsis based on sustainability perspective. Appl. Energy 2015, 158, 390–402. [Google Scholar] [CrossRef]
  54. Wu, Y.; Geng, S.; Xu, H.; Zhang, H. Study of decision framework of wind farm project plan selection under intuitionistic fuzzy set and fuzzy measure environment. Energy Convers. Manag. 2014, 87, 274–284. [Google Scholar] [CrossRef]
  55. Wu, Y.; Xie, C.; Xu, C.; Li, F. A decision framework for electric vehicle charging station site selection for residential communities under an intuitionistic fuzzy environment: A case of beijing. Energies 2017, 10, 1270. [Google Scholar] [CrossRef]
  56. Chang, D.Y. Applications of the extent analysis method on fuzzy ahp. Eur. J. Oper. Res. 1996, 95, 649–655. [Google Scholar] [CrossRef]
  57. Xiao, Y.; Li, H. Improvement on judgment matrix based on triangle fuzzy number. Fuzzy Syst. Math. 2003, 2, 59–64. [Google Scholar]
  58. Erdoğmuş, Ş.; Aras, H.; Koç, E. Evaluation of alternative fuels for residential heating in turkey using analytic network process (anp) with group decision-making. Renew. Sustain. Energy Rev. 2006, 10, 269–279. [Google Scholar] [CrossRef]
  59. Wu, Y.; Wang, Y.; Chen, K.; Xu, C.; Li, L. Social sustainability assessment of small hydropower with hesitant promethee method. Sustain. Cities Soc. 2017, 35, 522–537. [Google Scholar] [CrossRef]
  60. Mohamed, H.; Omar, B.; Abdessadek, T.; Tarik, A. Comparison of fuzzy ahp and fuzzy todim methods for landfill location selection. Springerplus 2016, 5, 501. [Google Scholar]
  61. Seyedmohammadi, J.; Sarmadian, F.; Jafarzadeh, A.A.; Ghorbani, M.A.; Shahbazi, F. Application of saw, topsis and fuzzy topsis models in cultivation priority planning for maize, rapeseed and soybean crops. Geoderma 2017, 310, 178–190. [Google Scholar] [CrossRef]
Figure 1. China’s installed PV power generation capacity from 2013 to 2017. Source: National Energy Administration.
Energies 11 01210 g001
Figure 2. Mechanism of energy performance contracting (EPC) business model.
Energies 11 01210 g002
Figure 3. EPC-DPV Generation Project Investment Decision Criteria System.
Energies 11 01210 g003
Figure 4. Decision-making Framework for EPC-DPV Projects.
Energies 11 01210 g004
Figure 5. Distribution of solar energy resources in China. Source: China Renewable Energy Society.
Energies 11 01210 g005
Figure 6. Distribution of the alternative projects.
Energies 11 01210 g006
Figure 7. Criteria and sub-criteria weights.
Energies 11 01210 g007
Figure 8. Dominance under different recession coefficients.
Energies 11 01210 g008
Table 1. Decision methods for RE investment.
CategoryMethod DescriptionDisadvantage
MCDMTOPSIS: Consider the distance between alternatives and the best and worst references.Unable to clearly demonstrate the advantages of the selected program [26].
ELECTRE: Applying Priority Relationships Between Process Plans to Solve Compensatory Problems of Indicators.Need to define many parameters [27,28].
PROMETHEE: Focused on solving the problem of compensating the indicators of the project plan.The calculation process is too tedious [26].
TODIM: It is a MCDM method developed in recent years. Unlike previous MCDM methods, it can consider investors’ evasion of losses and risks.The value of recession coefficient θ is not clearly defined. Sensitivity analysis is needed to verify the decision results [29,30,31].
Mathematical methodReal option theory: There are uncertain factors in PV investment, identify and estimate the option value of PV.Without comprehensive consideration. The focus is on the economics of the project; In addition, the investment cycle of PV projects is long and the economy is obviously uncertain.
Build a project objective function (profit maximization) model, using mathematical algorithms to solve.
BENDERS decomposition algorithm: Since the profit as a function of the investment variables has as sufficiently convex envelope, the considered problem can be solved by Benders decomposition.
Table 2. DPV project revenue in EPC business model.
Financial IndicatorsComponents
I = I 1 + I 2 + I 3 + I 4 I: Total revenue
I1: Generation allowance income
I2: On-grid income
I3: nearby consumptive income
I4 energy-saving benefits
I 1 = Q R Q: generating capacity
R: kWh subsidy
I 2 = Q i P Qi: On-grid capacity
P: Local desulfurization coal benchmark price
I 3 = Q j P ο C Qj: Nearby consumption
Po: Real-time price
C: Agreed discount
I 4 = ( Q j P ο Q j P ο C ) a a: contracted revenue ratio
Table 3. Introduction to data sources.
IndicatorsUnitData Sources
C1.1kWh/m2/dayNASA ATMOSPHERIC SCIENCE DATA CENTER
C1.2°CNASA ATMOSPHERIC SCIENCE DATA CENTER
C1.3%NASA ATMOSPHERIC SCIENCE DATA CENTER
C2.1%National Energy Administration New Energy Division
C2.2%National Energy Administration New Energy Division
C4.1yuan/kWhNational Energy Administration New Energy Division
C5.2yuan I = I 1 + I 2 + I 3 + I 4
I1: generation allowance income, I2: on-grid income
I3: nearby consumptive income, I4: energy-saving benefits
(the calculation process for each part is shown in Table 2.)
C5.3%calculated by Equation (1)
C5.4yearcalculated by Equation (2)
Table 4. Mutual influence concerns of the indicators.
CriteriaNatural (C1)Market (C2)Technical (C3)Policy and Competitive (C4)Economic (C5)
C1.1C1.2C1.3C2.1C2.2C2.3C3.1C3.2C3.3C4.1C4.2C4.3C5.1C5.2C5.3C5.4
C1.1
C1.2
C1.3
C2.1
C2.2
C2.3
C3.1
C3.2
C3.3
C4.1
C4.2
C4.3
C5.1
C5.2
C5.3
C5.4
Table 5. Summary of the weight of each indicator.
IndicatorsSubjective WeightsObjective WeightsComprehensive Weights
C1.10.25130.002112.67%
C1.20.02540.00121.51%
C1.30.0290.00061.30%
C2.10.13630.207617.20%
C2.20.02530.176210.08%
C2.30.05590.175911.59%
C3.10.02410.00491.45%
C3.20.00810.0181.31%
C3.30.02020.03942.98%
C4.10.08480.02245.36%
C4.20.01230.08925.07%
C4.30.02250.00661.45%
C5.10.08080.00574.33%
C5.20.07280.01214.25%
C5.30.12290.07339.81%
C5.40.02850.16479.66%
Table 6. Dominance matrix under indicator C1.1.
SchemesA1A2A3A4A5A6
A100.119516490.07148281−0.45006890.07977477−0.1473196
A2−0.94330580−0.7559856−1.0451736−0.7024124−0.9547403
A3−0.56419120.095783090−0.72171580.03541499−0.5831079
A40.057023560.13242310.0914411200.098059680.0538822
A5−0.6296370.08899538−0.2795193−0.7739540−0.646642
A60.018665340.120965230.07387955−0.42527510.081929290
Table 7. Dominant Matrix of All Alternatives.
SchemesA1A2A3A4A5A6Dominance
A10−7.45871−16.3118−20.7953−14.3543−21.6227−80.5428
A2−16.10090−18.9729−23.0549−18.1975−24.5899−100.916
A3−4.667−3.531830−14.2436−10.8659−14.1376−47.4459
A4−7.86464−5.80264−10.77970−7.89915−8.6097−40.9559
A5−14.9125−9.61594−18.8937−18.74030−14.7815−76.9439
A6−11.4585−9.84781−11.5749−13.5356−4.066450−50.4832
Table 8. Collective Sort Results of Alternative Items.
AlternativesA1A2A3A4A5A6
Dominance0.34524400.89275210.4006240.832199
Results562143
Table 9. Schemes with different recession coefficients Ranking results.
Schemes0.10.511.522.5
DRDRDRDRDRDR
A10.34550.34350.34550.33750.30140.4354
A2060606060606
A30.89320.89220.89320.89120.86420.8872
A4111111111111
A50.40140.440.40140.39940.04450.4095
A60.83230.83630.83230.84630.67130.863
(Note: D represents Dominance and R represents Results.).
Table 10. Schemes with different on-grid electricity ranking results.
30%50%70%
DRDRDR
A10.330450.330450.33045
A20.000060.000060.00006
A30.902220.900720.89932
A41.000011.000011.00001
A50.625440.626840.62804
A60.774630.774530.77433
Table 11. Schemes with different contracted revenue ratio ranking results.
Schemes0.10.30.50.70.9
DRDRDRDRDR
A10.34550.33950.33650.33450.335
A20606060606
A30.89320.90420.90320.90220.9012
A41111111111
A50.40140.63140.6340.62840.6274
A60.83230.77730.77630.77530.7743
Table 12. Schemes with different subjective weight ranking results.
Schemes0.10.30.50.70.9
DRDRDRDRDR
A10.36450.34450.34550.34150.3435
A20606060606
A30.89130.88430.89320.90420.8912
A41111111111
A50.7140.68340.40140.63240.6644
A60.94920.88520.83230.77730.8423
Table 13. Schemes in TOPSIS method Ranking results.
SchemesA1A2A3A4A5A6
D+0.169620.214750.074390.141110.119620.11499
D0.065540.089830.167970.113620.125730.15803
Queuing value0.278720.294920.693060.446040.512450.57881
Ranking results651432
TODIM ( θ = 1 )562143

