Article

Numerical Study on Electrochemical Performance of Low-Temperature Micro-Solid Oxide Fuel Cells with Submicron Platinum Electrodes

1
School of Mechanical Engineering, Chung-Ang University, 84 Heukseok-ro, Dongjak-gu, Seoul 06974, Korea
2
School of Mechanical and Aerospace Engineering, Nanyang Technological University, 50 Nanyang Avenue, Singapore 639798, Singapore
*
Authors to whom correspondence should be addressed.
Energies 2018, 11(5), 1204; https://doi.org/10.3390/en11051204
Submission received: 17 April 2018 / Revised: 4 May 2018 / Accepted: 7 May 2018 / Published: 9 May 2018
(This article belongs to the Section F: Electrical Engineering)

Abstract

:
The present study established the two-dimensional axisymmetric model for a freestanding circular cell of the low-temperature micro-solid oxide fuel cell (µ-SOFC) that is composed of platinum (Pt) electrodes and a yttria-stabilized zirconia (YSZ) electrolyte. The only membrane electrode assembly (MEA) was constructed for the numerical simulation in order to avoid the meshing problem with a very high aspect ratio of the submicron layers. We considered the charge and species conservation equations and electrode kinetics to elucidate the intricate phenomena inside the µ-SOFC. The extensive numerical simulations were carried out by using the commercial code to predict the effect of operating temperature and electrolyte thickness on the electrochemical performance of µ-SOFC. Our numerical model was calibrated with the results from experiments, and we provided the average cell current density and overpotentials with respect to the electrolyte thickness and the operating temperature. It was found that the electrochemical performance increased with the increase in operating temperature, owing to both rapid electrochemical reactions and ionic conduction, even in µ-SOFC. Moreover, the major voltage loss of µ-SOFC at low-temperature was caused by the cathodic activation overpotential.

1. Introduction

Recently, there has been a growing demand for using solid oxide fuel cells (SOFCs) as a portable power source, and many types of research are ongoing to miniaturize the SOFC by changing various design parameters [1,2]. Particular interest has begun to emerge as a micro-solid oxide fuel cell (μ-SOFC) having submicron-thick porous electrodes and electrolytes by MEMS technology and thin film deposition methods [3]. Therefore, the characteristics of the membrane electrode assembly (MEA) are determined by the manufacturing process and the working environment [4]. Many studies have been conducted to evaluate the performance of μ-SOFC according to the thickness of electrodes and electrolyte in MEA [5]. Unlike conventional SOFCs that are operating above 800 °C, power output from μ-SOFC operating at low temperatures can be miserably small due to the decline of ionic conductivity and catalytic activity [6]. Therefore, efforts are being made to improve electrochemical performances of μ-SOFCs by reducing electrolyte thickness or utilizing highly catalytic electrode materials [7]. It is necessary to analyze the thermo-fluidic characteristics in detail in order to produce a more robust SOFC [8]. However, it is difficult to fully understand the heat and the mass transfer inside the μ-SOFC due to the extremely thin MEA layer, fabrication difficulty, and the high chance to membrane fracture during the manufacturing and operating process [9].
In this study, we chose numerical simulation as one of the various methods to investigate the electrochemical reactions and the heat/mass transfer characteristics inside the low-temperature (LT) μ-SOFC. Because SOFCs involve complex mechanisms, such as electrochemical reactions and ionic/electronic conduction, and reactant transport, many researchers are still trying to establish the adequate physical models for SOFCs [10]. Especially, inside μ-SOFCs with the submicron scale MEA, the physical phenomena can be different from the conventional SOFCs [11]. In addition, the MEA of μ-SOFC s has a very large aspect ratio due to its thin thickness, making it difficult to compose the computational grids when considering mesh quality. These low-quality meshes could have a negative influence on the convergence of numerical results. To overcome computational limitations, we modeled the two-dimensional geometry with the axisymmetric condition while considering the shape of the circular μ-SOFC that was utilized in previously reported works [12]. Thus, the present study aims to predict the thermo-fluidic characteristics and electrochemical reactions inside the submicron MEA of μ-SOFC by computational fluid dynamics (CFD) simulation. Also, this study investigates the effect of the electrolyte thickness and operating temperature on the output power and air-fuel reactions. Our numerical analysis models were verified with the experimental results from the literature.

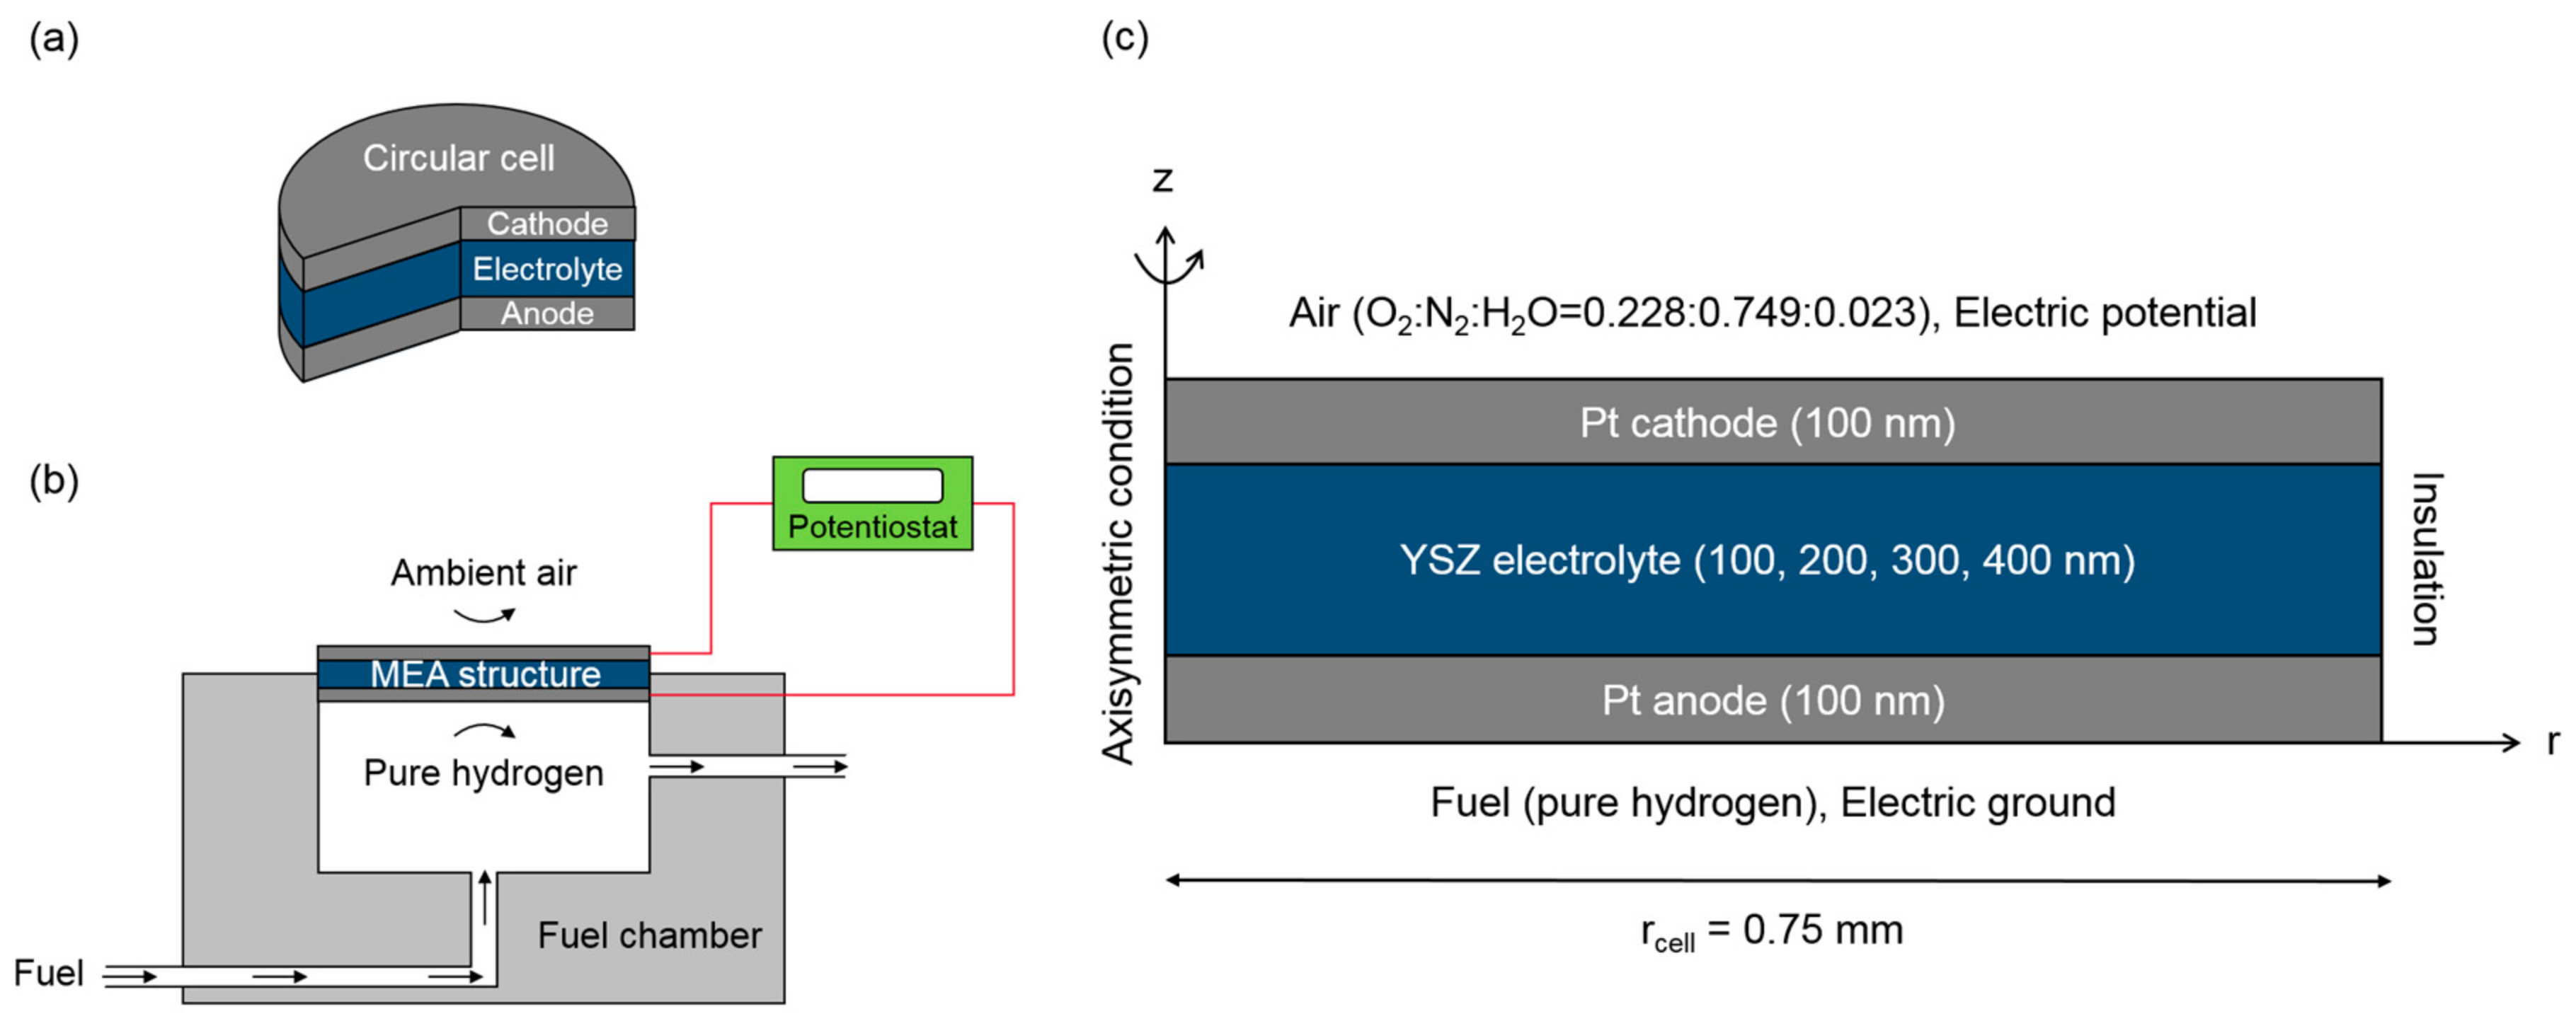
2. Model Description

The model for µ-SOFC with the submicron layer thickness was developed, in which only the MEA structure was constructed as a computational domain. The two-dimensional axisymmetric condition was adopted due to its circular cell configuration, as shown in Figure 1a. Figure 1b showed an experimental setup for performance test with MEA structure of µ-SOFC and Figure 1c presented a schematic of a model for the MEA structure of a µ-SOFC single cell. We adopted an MEA structure that was composed of Pt electrodes and yttria-stabilized zirconia (YSZ) electrolyte with thickness of 100 nm as a reference case. Based on the reference case, the effect of operating temperature and electrolyte thickness on electrochemical performance was investigated and compared with experimental data of literature [13].
Following assumptions were made in this study. (1) Each species of the gas mixture was treated as an ideal gas [14]. (2) There is no pressure gradient inside the electrodes with a submicron thickness, because of exposure to the ambient air. Therefore, the advective fluid motion could be neglected on the basis of Darcy’s law. (3) Air and fuel are sufficiently supplied, and the concentration gradient of bulk gas species is close to zero. Thus, experimental fuel inlet condition was applied at the bulk gas/electrode interface as a boundary condition. (4) The porous Pt electrode is considered as a homogeneous and isotropic material. (5) YSZ electrolyte is fully dense solid material [14]. (6) Electrochemical reactions occur at the interface between electrodes and electrolyte.
Unlike conventional SOFC simulation, the μ-SOFC considered in this study has a very huge aspect ratio of ~7500. If the advective fluid motion of the bulk gas mixture was considered as in the general SOFC simulation, it is necessary to generate a numerous number of grids near MEA structure and require very high computational resources. Based on the experimental conditions of stationary ambient air with very low fuel inlet velocity (~10 sccm), we can consider that mass transport by diffusion is more dominant than advective fluid motion. Therefore, it is an effective way to construct only MEA structure. Moreover, assumptions (2) and (3) can simplify the simulations of thin film electrodes.

2.1. Governing Equations

The present model included the charge and species conservation equations and electrode kinetics. The charge carriers inside the µ-SOFC are electron and ion. The conservation equations for each charge carrier are as follows:
( σ e l e c e f f ϕ e l e c ) = Q e l e c ,
( σ i o n e f f ϕ i o n ) = Q i o n ,
where σ is the electric/ionic conductivity, φ is the electronic/ionic potential, and Q is the electronic/ionic source term by the electrochemical reactions, as shown below:
Q e l e c = S i ,
Q i o n = S i ,
where S is the active specific surface area and i is the local current density. The above equations are applied only at the interface between the electrodes and electrolyte. The species conservation for each component of the gas mixture is as follows:
J i = R i ,
where Ji is the diffusive flux of species i, and Ri is the species source term for the electrochemical reactions.
R i = ± M i S i n F ,
where + and − sign represent the source and sink, respectively, n represent the number of electrons that are participating in the electrochemical reaction. The species source term appears only at the electrodes/electrolyte interface with a positive sign for H2, minus sign for H2O at fuel chamber/anode interface, and a positive sign for O2 at ambient air/cathode interface.
In the present study, the diffusion of gas species within porous electrodes can be described by two diffusion mechanisms: molecular diffusion and Knudsen diffusion [15]. Molecular diffusion is the dominant diffusion mechanism in the large pore domain, explaining molecular-molecular interactions. On the other hand, Knudsen diffusion accounts for the collisions between the molecules and the solid pore wall, which is more dominant as the pore size becomes comparable with the mean free path. In this study, pore radius of the electrodes is about 10 nm and the Knudsen number is estimated as to be about 7.8. Thus, Knudsen diffusion with molecular diffusion should be considered.
There are several models to account for the species transport phenomena. The Maxwell-Stefan equation is the only diffusion equation that distinguishes diffusion from convection in a simple way [16]. This is widely used in multi-component systems. However, it is inappropriate to consider the effect of Knudsen diffusion, which represents the interaction between the gas molecules and pore wall. The dusty gas model is also widely used and is an equation that takes Knudsen diffusion into account in Maxwell-Stefan equation [16]. However, it has implicit form and difficult to mathematically solve two- or three-dimensional numerical problems. Therefore, we adopted modified Fick’s law which has a concise form relative to dusty gas model and can consider the Knudsen diffusion of multi-component species [9] to evaluate diffusive flux, J.
Operating principle of the µ-SOFC is reverse of electrolysis of water. At the cathode, oxygen is reduced and oxygen ion is conducted though the electrolyte. At the anode, hydrogen is oxidized reacting with oxygen ion to produce water and electrons. The electrochemical reaction formula is following equations:
1 2 O 2 + 2 e O 2 ,
H 2 + O 2 H 2 O + 2 e .
The open circuit voltage was evaluated using the Nernst equation [17]:
E e q = E 0 R T 2 F ln ( P H 2 O P H 2 P O 2 1 / 2 ) ,
where E0 is the equilibrium potential at reference state (1 atm, 25 °C), R is the universal gas constant, T is the gas temperature, F is the Faraday’s constant, and Pi is the partial pressure of each gas species at three phase boundary (TPB). The generalized form of the Butler-Volmer equation is used to describe the relationship between activation overpotential and the local current density, which can be written by:
i = i 0 [ c R c R * exp ( α a n F η a c t R T ) c P c P * exp ( α c n F η a c t R T ) ]
where i0 is the exchange current density, c is the concentration at TPB, c* is the reference concentration, subscript R and P mean reactant and product, αa/αc are the anodic/cathodic charge transfer coefficient, n is the number of transferred charges, and ηact is the activation overpotential. The Exchange current density for the cathode and anode were evaluated using the following set of equations [18]:
i 0 , c = i O 2 * ( c O 2 c O 2 * ) γ c ,
i O 2 * = A c exp ( E c R T ) ,
i 0 , a = i H 2 * ( c H 2 c H 2 * ) γ a ,
i H 2 * = A a exp ( E a R T ) ,
where i* is the reference exchange current density of O2/H2 at cathode/anode, Ec/a is the activation energy of cathode/anode, γ c / a is reaction order for cathode/anode, and Ac/a is the pre-exponential factor for cathode/anode. E and A are parameterized to fit the model data to the experimental results. The reference exchange current density, which is in the form of the Arrhenius equation, describes the electrochemical reaction rate at the electrode/electrolyte interface. The activation overpotential at each electrode can be estimated, as follows [19]:
η a c t = ϕ e l e c ϕ i o n E e q ,
where Eeq is equilibrium potential.
The ohmic overpotential was calculated using the following equations [20]:
η o h m = i A S R ,
A S R = H a σ a + H e l σ e l + H c σ c ,
where i is the local current density and ASR is the area specific resistance of the MEA. The concentration overpotential was negligible when compared to other overpotentials because the air/fuel consumption rate was very small through the µ-SOFC single cell. The average cell current density was defined to estimate the cell performances by using the following equations [21]:
I a v g = 0 A c e l l i d A A c e l l = 0 r c e l l 2 π r i d r π r c e l l 2 ,
where Acell is the electrode/electrolyte interface area, and rcell is the radius of the cell. Additionally, the constitutive equations for numerical analysis regarding the transport parameters are listed in Table 1. Geometrical and electrochemical parameters are also shown in Table 2.
The most important part of the conducting numerical analysis is to assign the exact parameter values. However, it is difficult to construct a stable set of parameters because experimental conditions, such as specimen materials, manufacturing processes, and operating conditions differ from one another. Therefore, in this study, parameters were adopted by comparing those from every literature reporting similar µ-SOFC to get robust numerical results.

2.2. Boundary and Operating Conditions

All of the boundary and operating conditions for the present study were determined from the experimental condition of the literature [13], as shown in Table 3. At the interface of ambient air/cathode, a mass fraction (O2:N2:H2O = 0.228:0.749:0.023) and electric potential (0.2~1.0 V) were applied as boundary conditions. Also, at the interface of the hydrogen fuel/anode, a mass fraction (pure hydrogen) and electric ground (0 V) were applied as boundary conditions, as shown in Figure 1c. The interfacial chemical reaction was considered by applying ionic/electronic charge source and gas species source term to the electrode/electrolyte interface. Symmetric condition means zero gradients of the parameter, and insulation represents zero flux through the boundary.

2.3. Numerical Methods

The two-dimensional numerical simulation was conducted by using commercial code (COMSOL Multiphysics v.5.3) that is based on finite element method. We conducted the steady-state numerical simulation to investigate the performance of µ-SOFCs under different operating conditions. The fully coupled algorithm with parallel direct sparse solver (PARDISO) was used to compute the set of conservation equations. The axisymmetric coordinate was adopted due to circular cell configuration. The finer grids were established near the electrodes/electrolyte interface in which the electrochemical reactions occur. Grid sensitivity test was conducted while considering the computational cost and accuracy of results, and finally, 33,750 grids were employed for extensive numerical simulations.

3. Results and Discussion

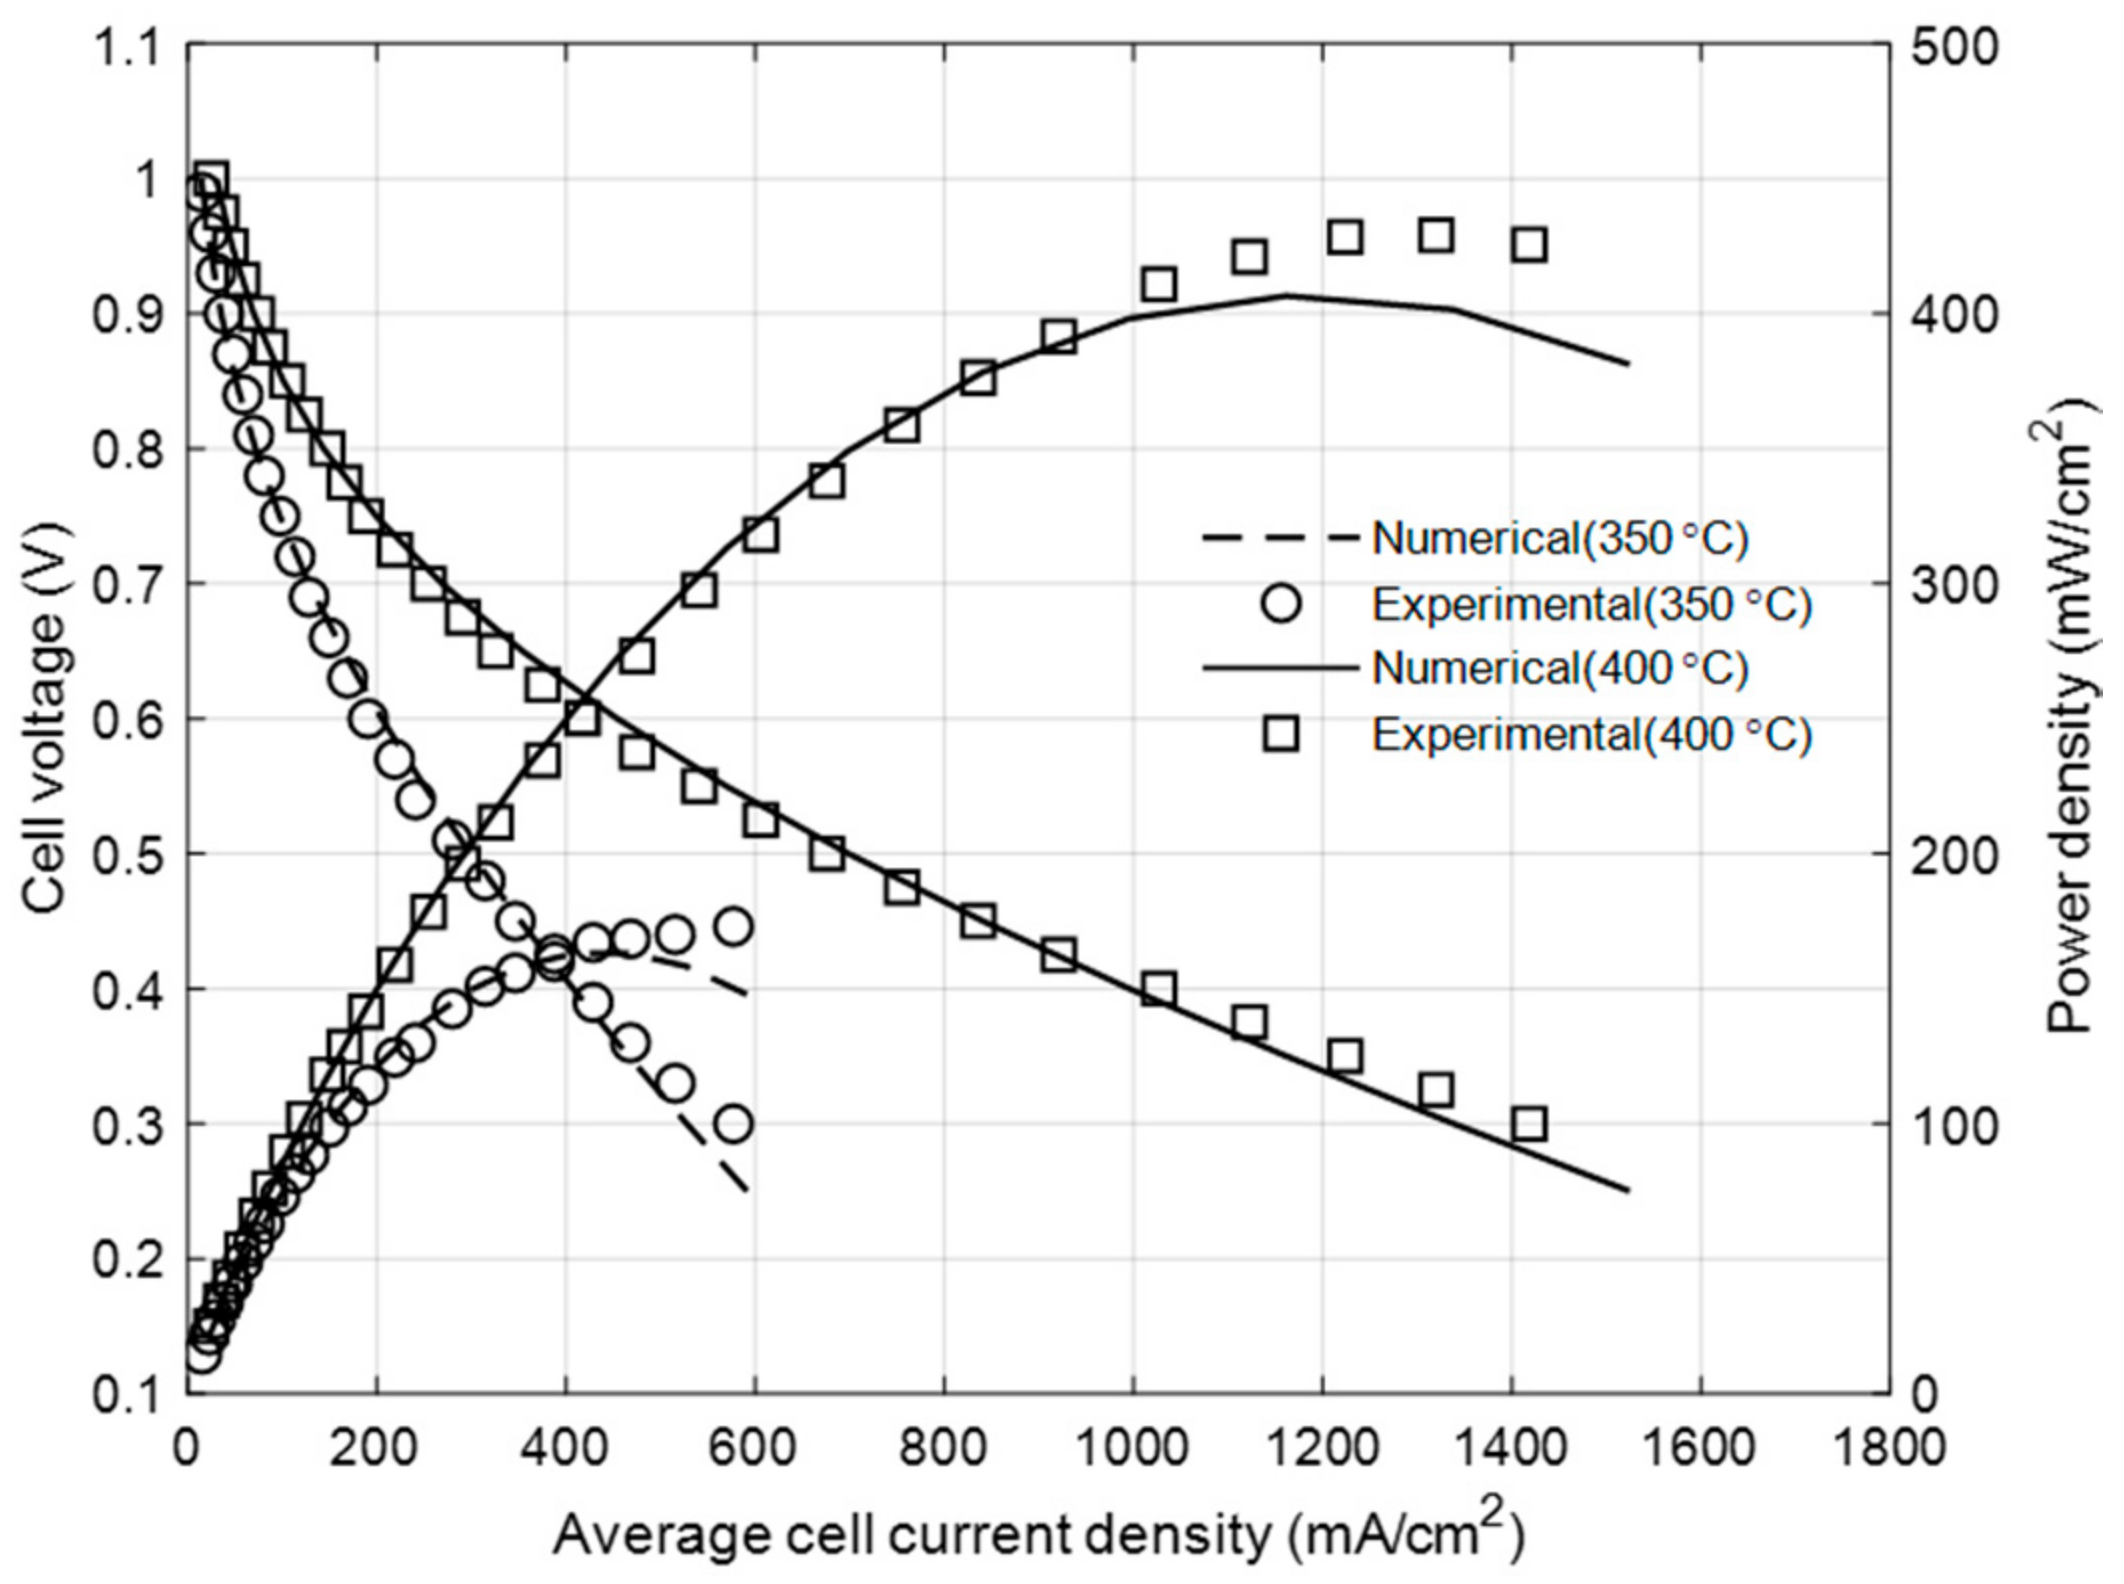
3.1. Model Calibration with Experimental Data

The Pt electrodes of the µ-SOFC can be fabricated through different deposition processes, resulting in different morphological properties, such as porosity, tortuosity, and pore size distribution, even with the same materials and shape. Since the mass transport through the porous electrodes and the TPB area are very significant to determine electrochemical reaction rate, cell performances could have deviations according to electrode morphology. Thus, polarization curves that were obtained by the experimental data should be compared to parameterize the activation energy, and pre-exponential factor appeared in Equations (11)–(14). It is in the form of the Arrhenius equation describing the reaction rate at each electrode/electrolyte interface. The activation energy represents the amount of the energy barrier, and the pre-exponential factor is a coefficient that is related to the number of attempts to overcome the energy barrier.
The model was calibrated with the experimental data in [13] to obtain the reference exchange current density, and the resulting parameters for calculating the reference exchange current density are summarized in Table 4. We confirm that estimated reference exchange current density by using this set of parameters was within the range of the literature [18,25], as shown in Table 5. Given the set of parameters, the electrochemical performance of the µ-SOFC can be estimeated under various operating conditions. Figure 2 shows the comparison of cell performances between the numerical model and experimental data concerning the operating current density. The evaluated curves at 350 °C and 400 °C by using this model showed good agreement with the experimental data. It means that the present numerical models can be extended to predict the performance of µ-SOFC at different operating conditions.
We chose the cell under operating temperature at 400 °C as a reference case and investigated the cell current density-voltage-power curve (I-V-P) with irreversible voltage losses, as shown in Figure 3a. The maximum power density predicted by the model was 406.5 mW/cm2 and showed the deviation of 5.9% with experimental data measured as 432.4 mW/cm2. This discrepancy originated from the model assumptions and numerical errors, but it could be acceptable when considering its deviation. Figure 3b shows the individual contributions to the various types of voltage drop. The cathodic activation overpotential was dominant among all of the irreversible voltage losses, especially in the low current density region. It is certain that the activation energy of the oxygen reduction reaction occurring at the cathode/electrolyte interface is higher than that of the hydrogen oxidization at the anode/electrolyte interface.
Generally, the species concentration of the hydrogen and oxygen inside the electrodes along the z-direction are important to the analysis of the chemical reaction that is directly related to the electrochemical performance. We applied the experimental inlet condition to the bulk gas/electrodes boundaries of the computational domain that is based on the assumption (3), as mentioned above. The amount of the reduced concentration along the z-direction was very small due to much thinner electrodes than those of the conventional SOFC. In fact, the variation of concentration was less than 0.05% of the input amount, and its gradient showed almost constant. Thus, the concentration overpotential could be neglected at both the cathode and the anode in this study.

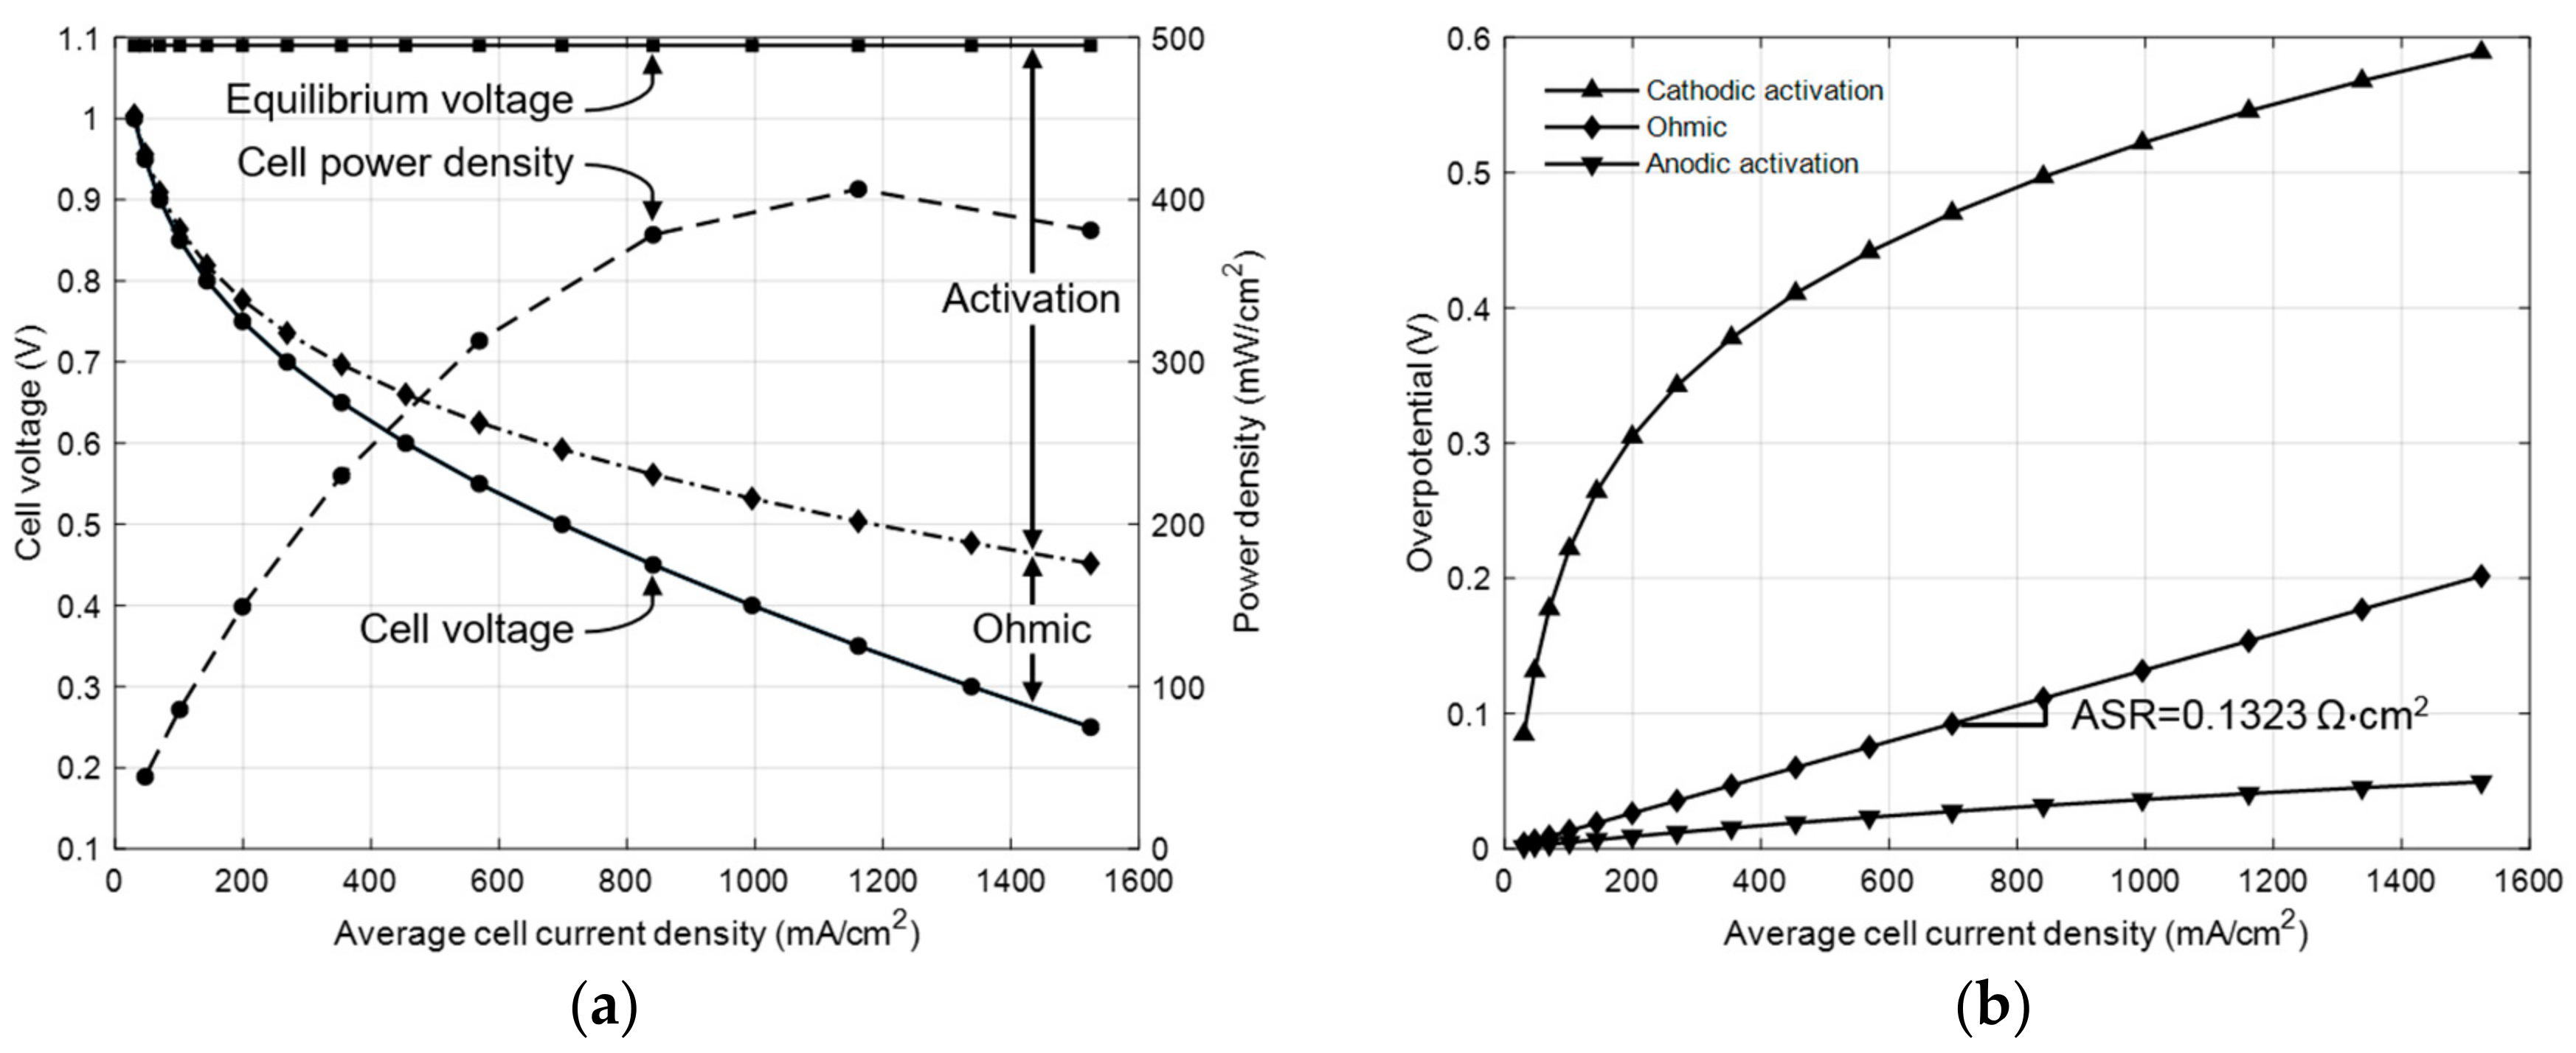
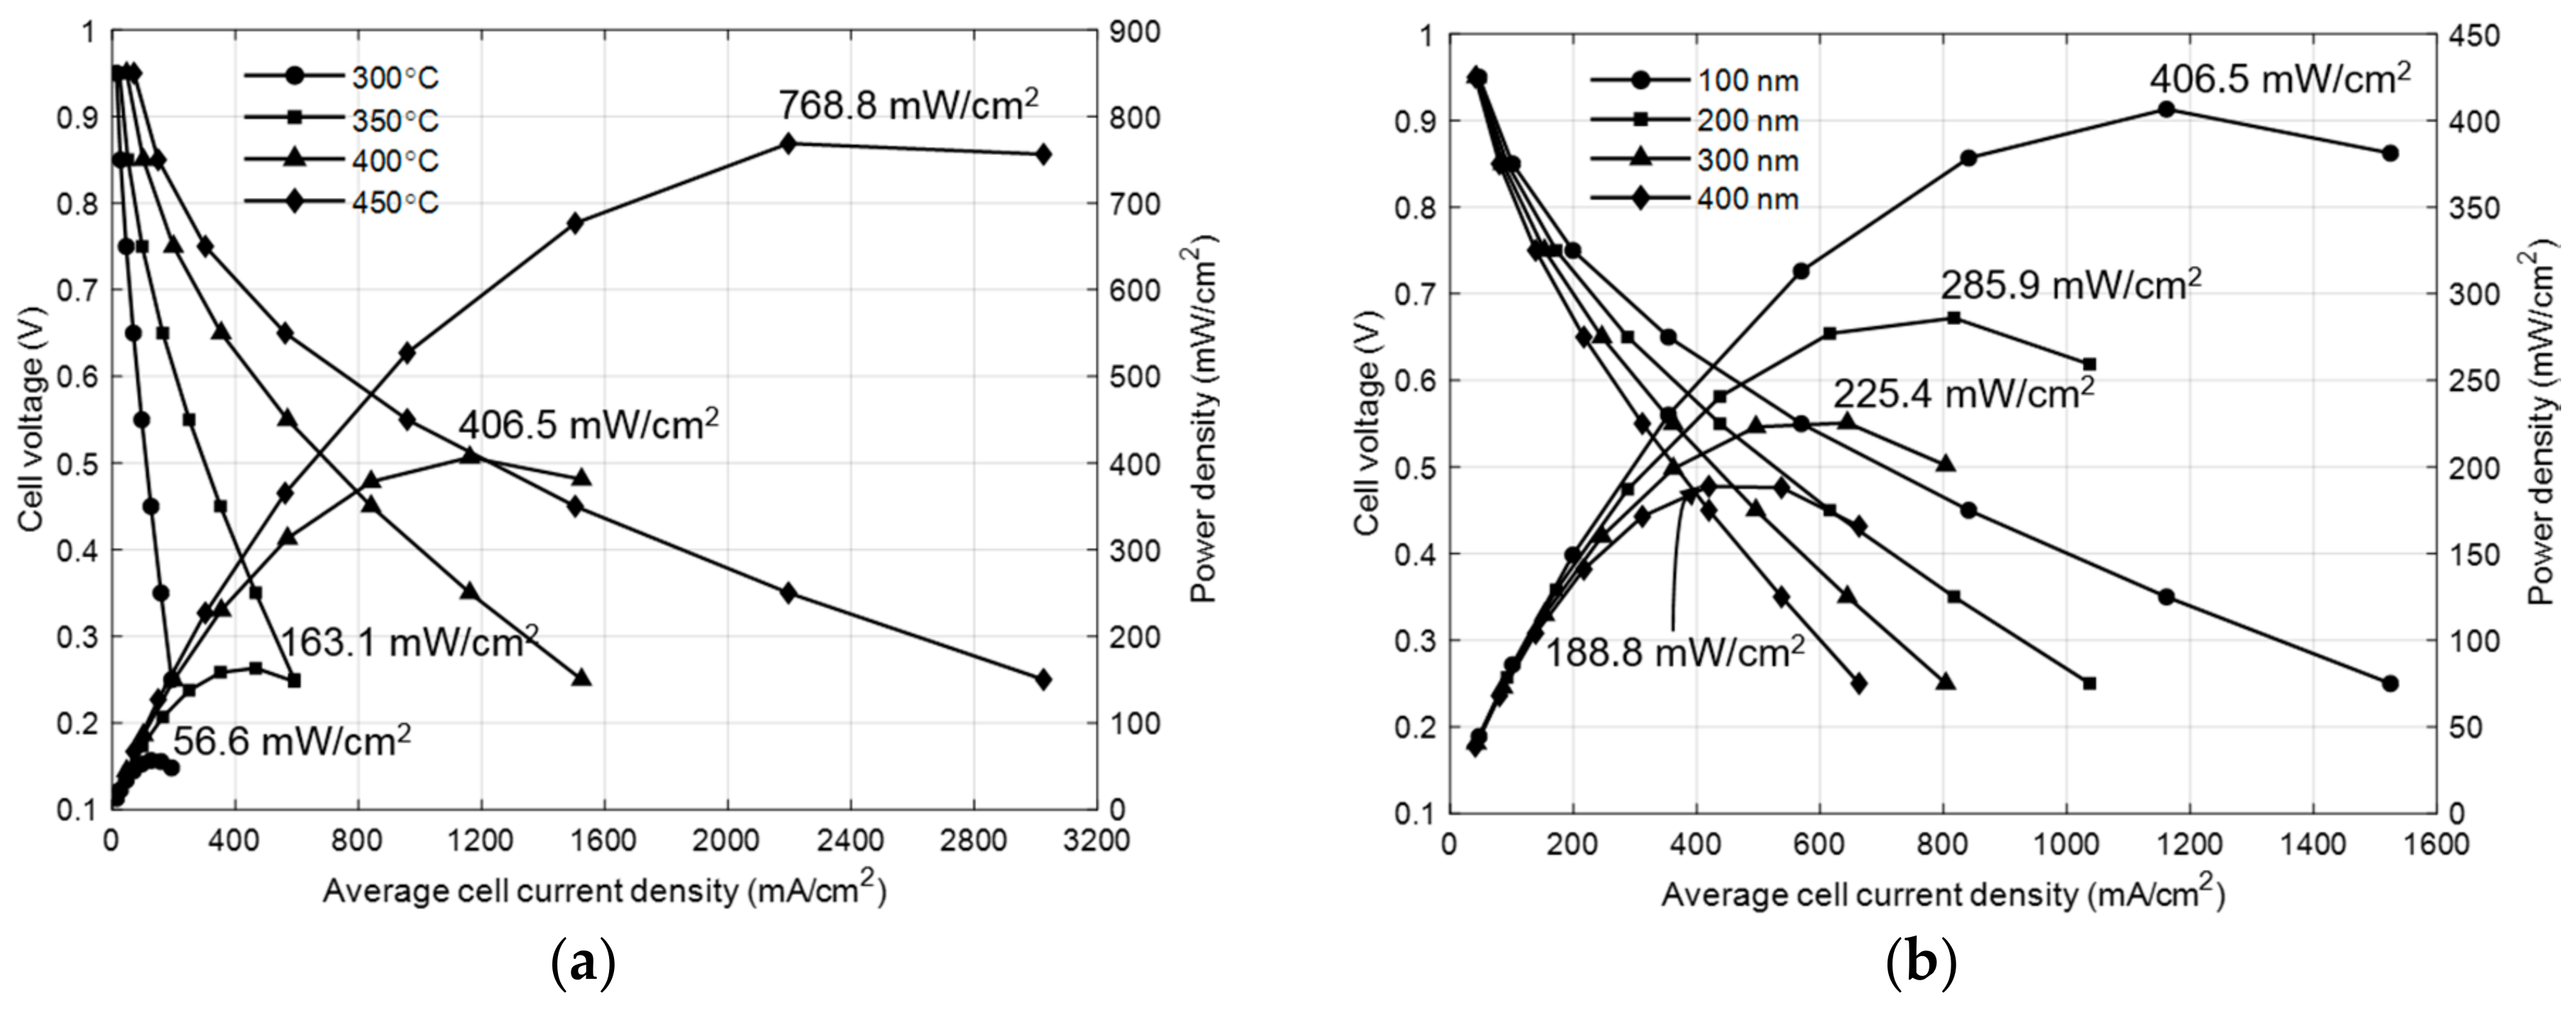
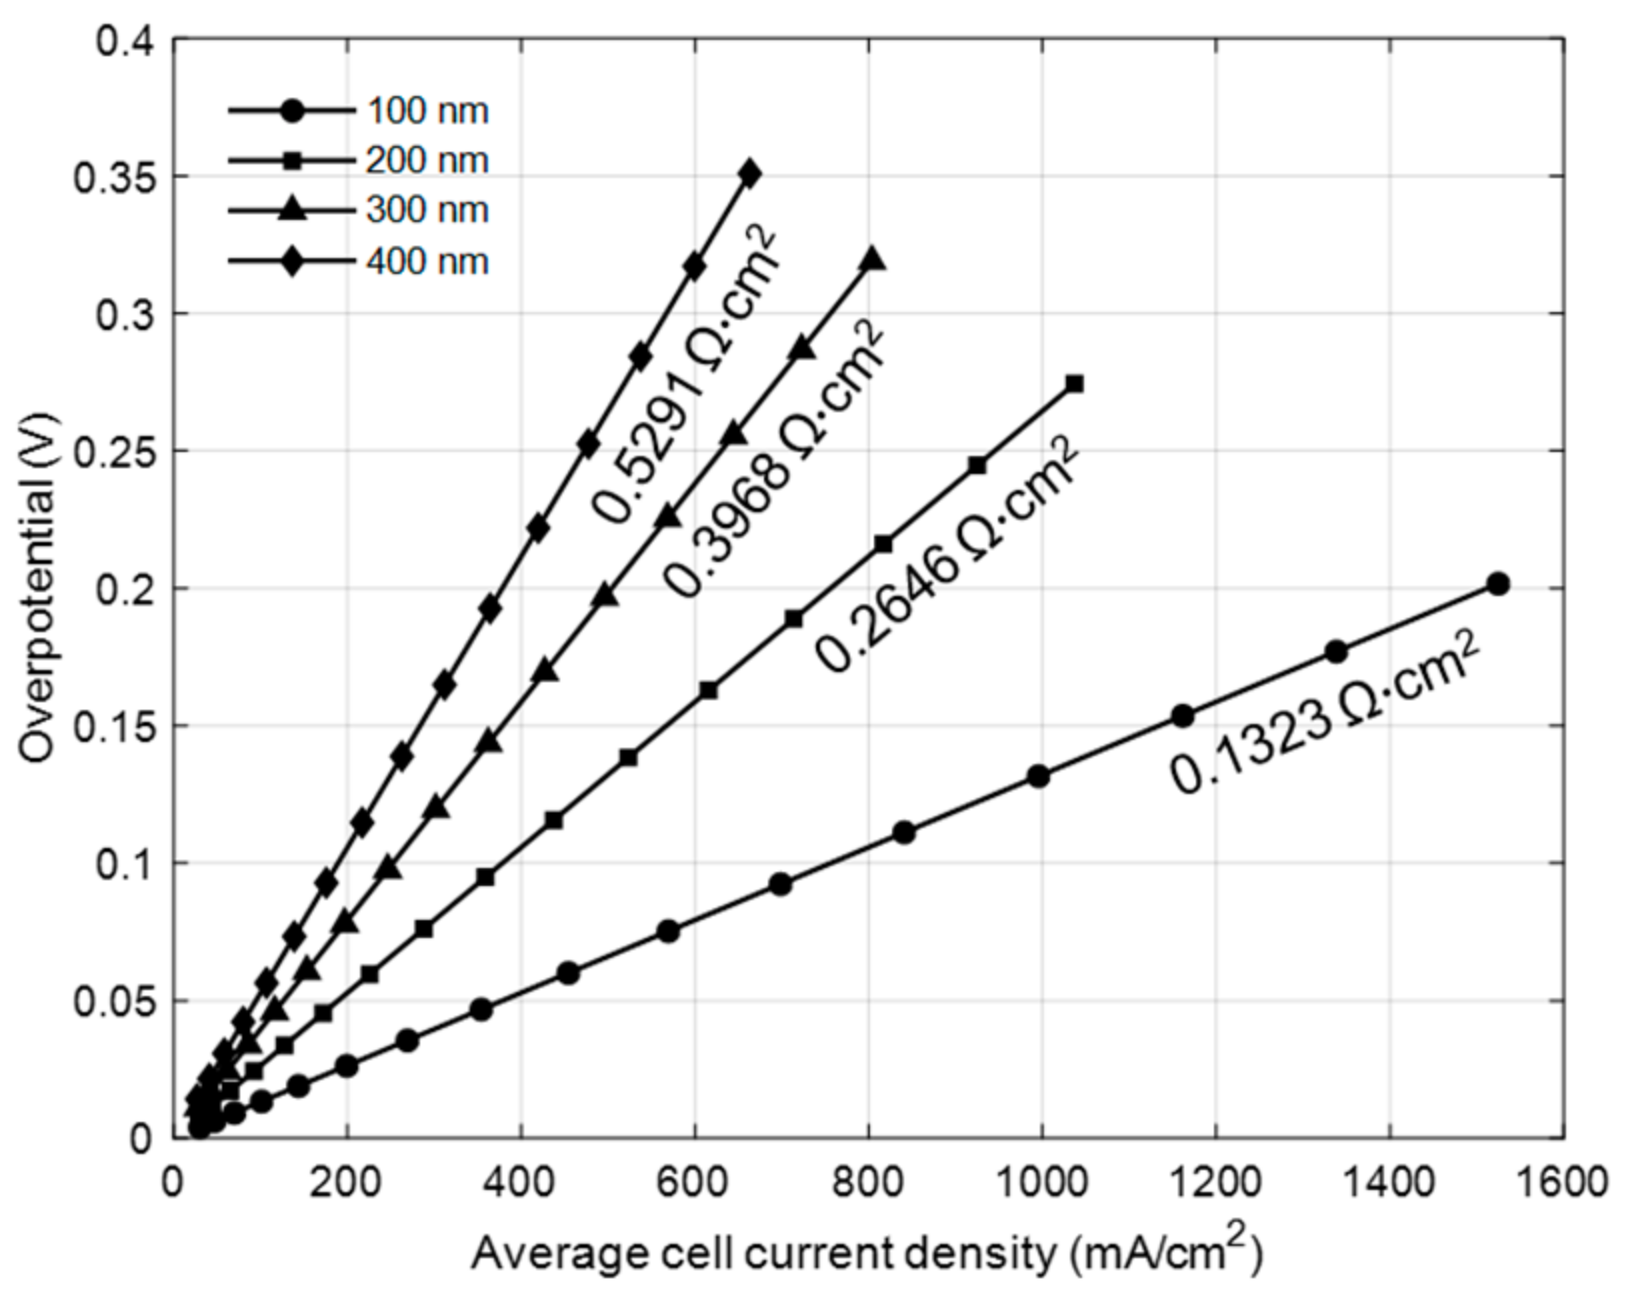
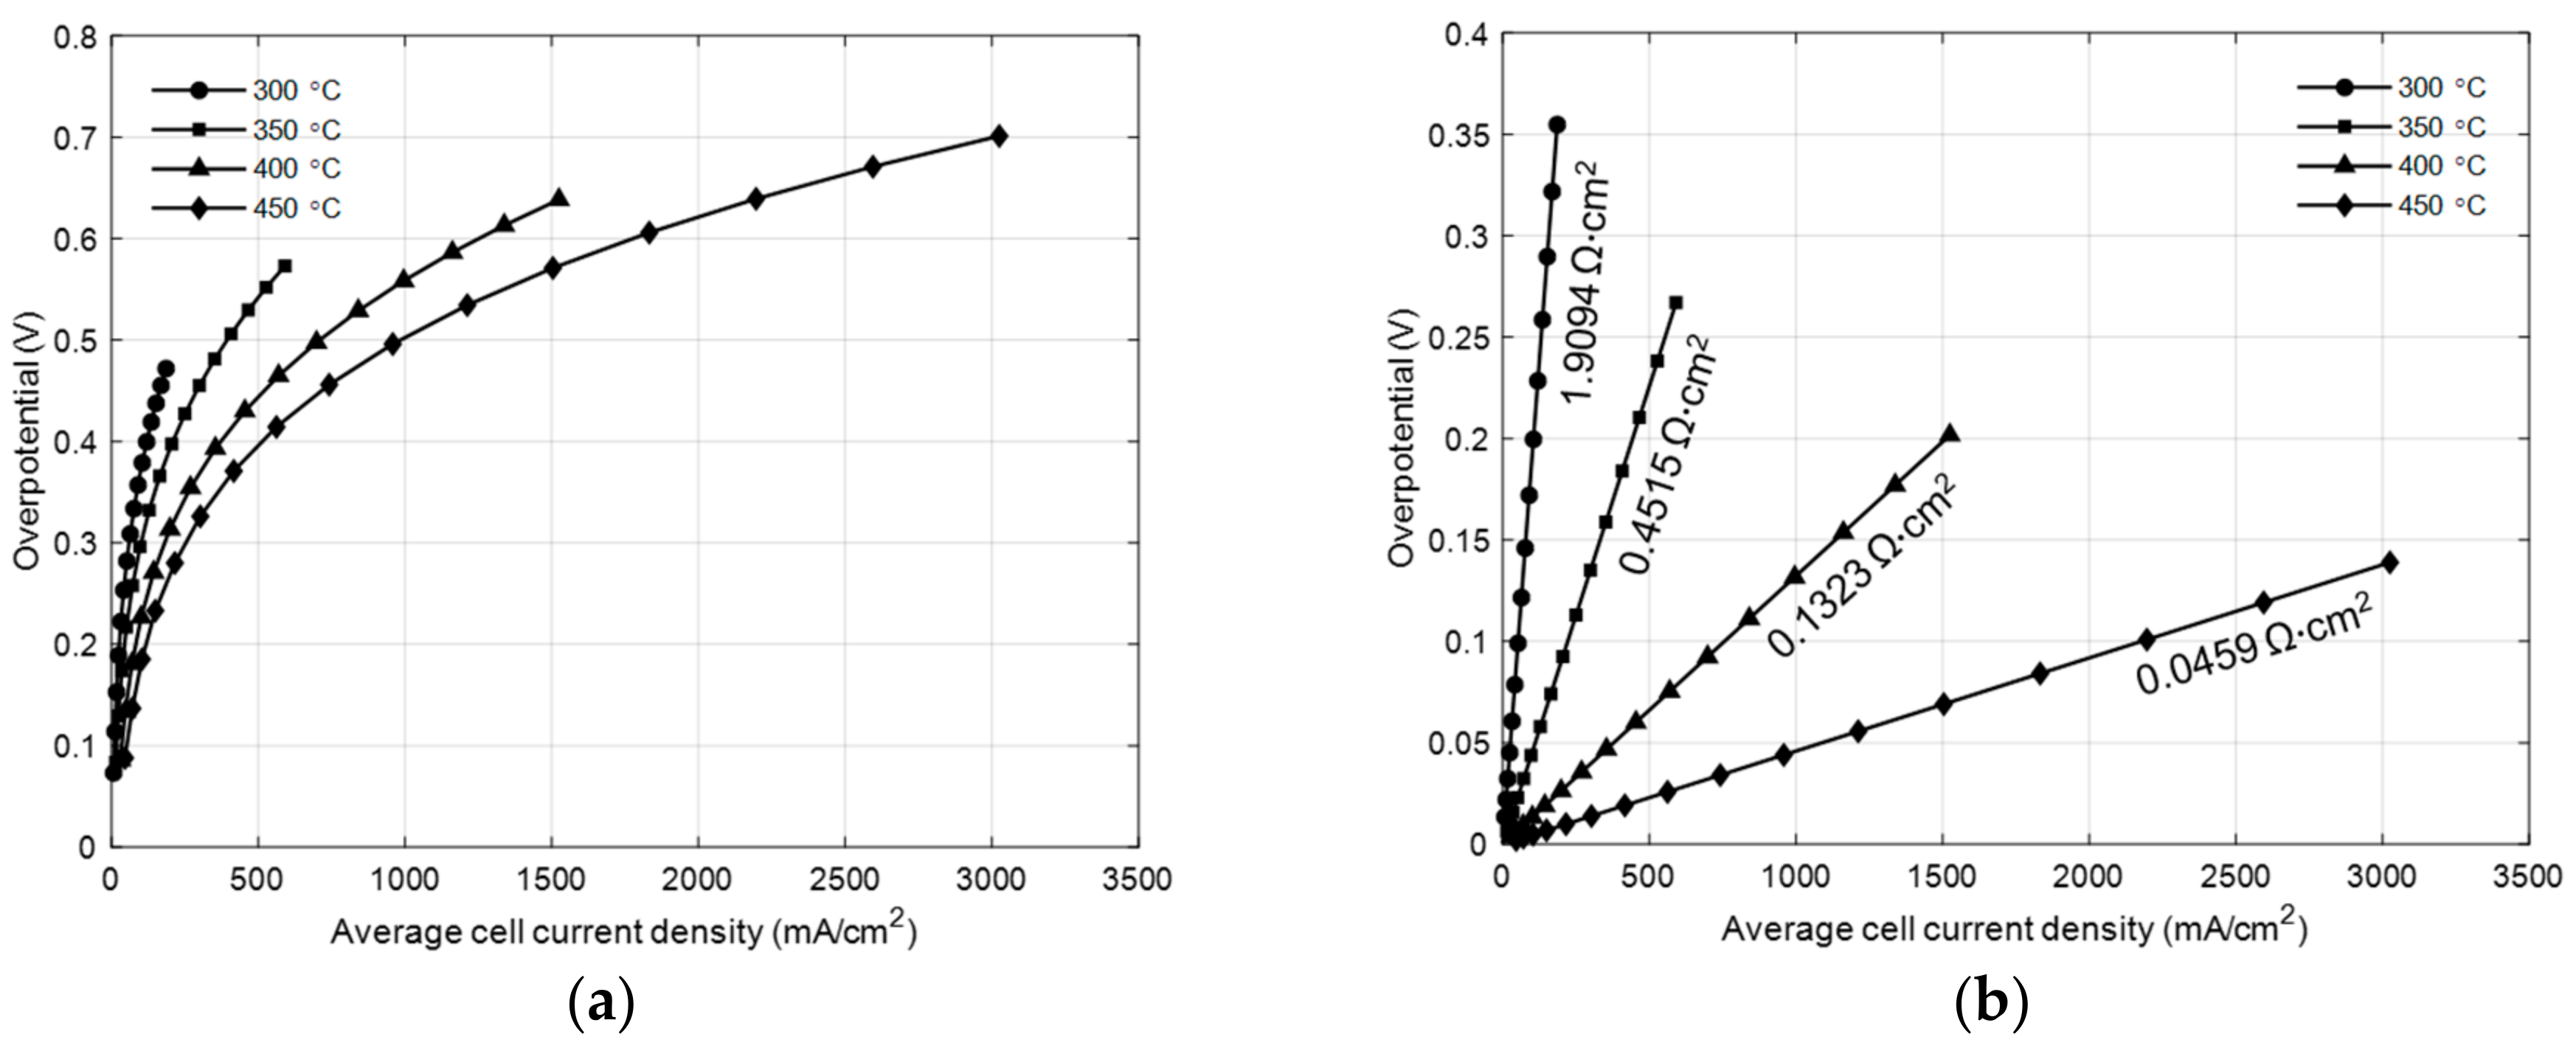
3.2. Effect of Operating Temperature and Electrolyte Thickness

The electrochemical performances of µ-SOFC were predicted by using the calibrated model, as extended to other temperature ranges. Figure 4a shows I-V-P curves that represent the proportional tendency, according to the elevating temperature. The maximum power densities for the single cell operating at 300, 350, 400, and 450 °C were predicted to be 56.6, 163.1, 406.5, and 768.8 mW/cm2, respectively. As expected, the power density was significantly affected by the operating temperature, and this tendency qualitatively corresponds to the literature [26]. Therefore, the greater effect of temperature on the electrochemical performance of µ-SOFC was caused by the lower operating temperature.
With varying the electrolyte thickness, I-V-P curves at 400 °C were evaluated, as shown in Figure 4b. The maximum power densities of the cell with 100, 200, 300, and 400 nm electrolyte thickness are estimated to be 406.5, 285.9, 225.4, and 188.8 mW/cm2, respectively. Therefore, the electrochemical performance is inversely proportional to the electrolyte thickness, as reported in the literature [27]. From these results, the electrochemical performance of the cell was highly affected by the electrolyte thickness variation.
Figure 5 represents the estimated activation and ohmic overpotentials with respect to the average cell current density at different operating temperatures. The increasing tendency for activation loss and the decreasing tendency for its gradient were shown as the current density increases. Also, the amount of activation loss was reduced with the increase in operating temperature at same operating current density due to rapid electrochemical reactions, as presented in Figure 5a. Similarly, Figure 5b shows the decreasing tendency of ohmic loss with increasing in operating temperature. The ionic conductivity of YSZ electrolyte significantly increases with temperature, while the electric conductivity of Pt electrodes linearly decrease within the range from 300 to 450 °C. Therefore, the ASR, indicated under each graph in the Figure 5b, dramatically decreased resulting in a reduced ohmic loss, which can be expected from Equations (17) and (18). The activation overpotential showed the higher value than the ohmic overpotential at all operating current densities in present numerical results. The maximum differences between activation and ohmic loss were 0.1878, 0.3225, 0.4367, and 0.5622 V at operating temperatures 300, 350, 400, and 450 °C, respectively. At these conditions, the ratio of activation overvoltage to total voltage loss are 70.2, 75.2, 76.0, and 83.4%, respectively. Thus, we confirmed that the activation loss was a major cause of various voltage drops from the equilibrium potential for µ-SOFC having submicron electrodes.
Figure 6 presents the predicted ohmic overpotentials with respect to the average cell current density with different electrolyte thicknesses. The ohmic overpotential decreased with the thickness of the electrolyte because of the lower ion transport resistance for thinner electrolyte. Consequently, cell performances were gradually enhanced with the decrease in electrolyte thickness, owing to the reduction of ASR. According to Ohm’s law for the relationship between current density and voltage, the plotted lines represent the ohmic overpotential concerning the average cell current density having a linear tendency. We did not present the activation overpotential curves for these cases because the activation overvoltage is independent of the electrolyte thickness, as can be seen from Equation (16).

4. Conclusions

The present study established the two-dimensional axisymmetric model for a single cell of µ-SOFC with submicron MEA structures. The present model was calibrated with experimental data from the literature and provided the average cell current density-voltage-power density, and overpotentials to qualitatively evaluate the electrochemical performances with different operating temperature and electrolyte thickness. The key assumptions were made to overcome numerical limitations regarding the high aspect ratio of submicron electrodes and electrolyte. Thus, we can only construct the MEA structure for the computational domain and neglect the advective fluid motion inside the porous electrodes. These assumptions played an important role to improve the convergence of numerical results for submicron MEA structure.
From the parametric study, we investigated the effect of operating temperature and electrolyte thickness on electrochemical performances and confirmed the typical qualitative tendency. When the operating temperature increased, cell performance significantly increased due to the rapid electrochemical reactions and the higher ionic conductivity. When the electrolyte thickness decreased, cell performance was also increased, owing to the lower ionic resistance of electrolyte, even though the electronic conductivity of electrodes increased with a temperature range from 300 to 450 °C. It is also suggested that the major voltage loss of this cell is caused by cathodic activation overpotential.
The numerical model, which we fitted to the experimental results, was extended to estimate the electrochemical performance of MEA as well as irreversible voltage losses that cannot be measured under various experimental conditions. Actually, we calculated the activation energy and the pre-exponential factor by conducting parameterization of the reference exchange current density with the experimental polarization curves at two operating temperatures. If there are sufficient reference data at different operating temperatures, we can get a more stable parameter set than the current values. However, there are lack of useful experimental data to be compared with our results, especially in the case of thin film μ-SOFCs with a huge aspect ratio. In the further works, we will supplement to obtain a more stable parameter that is set to be utilized at various submicron MEA models.

Author Contributions

J.M.P. and D.Y.K. established the numerical model and conducted simulations for the current manuscript with all figures and tables under the supervision of S.H.L. and P.-C.S. (co-corresponding authors). Also, J.D.B. and Y.-J.Y gave their effort to analyze and discuss the detailed results, and they made useful comments on which the quality of current study could be improved. Above all, S.H.L. and P.-C.S., as the co-corresponding authors (equally contributed), have provided useful suggestions for data analysis and have discussed research progress.

Acknowledgments

This research was supported by the Chung-Ang University research grant in 2016. Also, this research was supported by the Korea Institute for Advancement of Technology (KIAT) grant funded by the Korea Government—Ministry of Trade Industry and Energy (MOTIE), (No. N0001075).

Conflicts of Interest

The authors declare no conflict of interest.

References

  1. Dyer, C.K. Fuel cells for portable applications. J. Power Sources 2002, 106, 31–34. [Google Scholar] [CrossRef]
  2. Evans, A.; Bieberle-Hutter, A.; Rupp, J.L.M.; Gauckler, L.J. Review on microfabricated micro-solid oxide fuel cell electrolytes. J. Power Sources 2009, 194, 119–129. [Google Scholar] [CrossRef]
  3. Liu, K.Y.; Yun, Y.J.; Lee, S.H.; Su, P.C. Sputtered nanoporous PtNi thin film cathodes with improved thermal stability for low temperature solid oxide fuel cells. J. Power Sources 2009, 194, 119–129. [Google Scholar] [CrossRef]
  4. Jung, W.; Kim, J.J; Tuller, H.L. Investigation of nanoporous platinum thin films fabricated by reactive sputtering: Application as micro-SOFC electrode. Electrochim. Acta 2017, 247, 558–563. [Google Scholar] [CrossRef]
  5. Hleig, J.; Tuller, H.L.; Maier, J. Electrodes and electrolytes in micro-SOFCs: A discussion of geometrical constraints. Solid State Ion. 2004, 174, 261–270. [Google Scholar]
  6. Huang, H.; Nakamura, M.; Su, P.; Fasching, R.; Saito, Y.; Frinz, F.B. High-performance ultrathin solid oxide fuel cells for low-temperature operation. J. Electrochem. Soc. 2007, 154, B20–B24. [Google Scholar] [CrossRef]
  7. Park, J.M.; Kim, D.Y.; Baek, J.D.; Yoon, Y.J.; Su, P.-C.; Lee, S.H. Effect of electrolyte thickness on electrochemical reaction and thermo-fluidic characteristics inside a SOFC unit cell. Energies 2018, 11, 473. [Google Scholar] [CrossRef]
  8. Hanna, J.; Lee, W.Y.; Shi, Y.; Ghoniem, A.F. Fundamentals of electro- and thermochemistry in the anode of solid oxide fuel cells with hydrocarbon and syngas fuels. Prog. Energy Combust. Sci. 2014, 40, 74–111. [Google Scholar] [CrossRef]
  9. Lee, S.; Kim, H.; Yoon, K.J.; Son, J.W.; Lee, J.H.; Kim, B.K.; Choi, W.; Hong, J. The effect of fuel utilization on heat and mass transfer within solid oxide fuel cells examined by three-dimensional numerical simulations. Int. J. Heat Mass Transf. 2016, 97, 77–93. [Google Scholar] [CrossRef]
  10. Andersson, M.; Paradis, H.; Yuan, J.; Sunden, B. Three dimensional modeling of a solid oxide fuel cell coupling charge transfer phenomena with transport processes and heat generation. Electrochim. Acta 2013, 109, 881–893. [Google Scholar] [CrossRef]
  11. Baek, J.D.; Liu, K.-Y.; Su, P.-C. A functional micro-solid oxide fuel cell with a 10 nm-thick freestanding electrolyte. J. Mater. Chem. A 2017, 5, 18414–18419. [Google Scholar] [CrossRef]
  12. He, Z.; Li, H.; Birgersson, E. Reduced model for the planar solid oxide fuel cell. Comput. Chem. Eng. 2013, 52, 155–167. [Google Scholar] [CrossRef]
  13. Baek, J.D.; Yoon, Y.; Lee, W.; Su, P.-C. A circular membrane for nano thin film micro solid oxide fuel cells enhanced mechanical stability. Energy Environ. Sci. 2015, 8, 3374–3380. [Google Scholar] [CrossRef]
  14. Lee, S.; Park, M.; Kim, H.; Yoon, K.J.; Son, J.W.; Lee, J.H.; Kim, B.K.; Choi, W.; Hong, J. Thermal conditions and heat transfer characteristics of high-temperature solid oxide fuel cells investigated by three-dimensional numerical simulations. Energy 2017, 120, 293–305. [Google Scholar] [CrossRef]
  15. Fatma, N.C.; Suryanarayana, R.P.; Francisco, E.-B.; Ismail, C. On modeling multi-component diffusion inside the porous anode of solid oxide fuel cells using Fick’s model. J. Power Sources 2009, 192, 467–474. [Google Scholar]
  16. Spiegel, C. PEM Fuel Cell Modeling and Simulation Using Matlab, 1st ed.; Elsevier: Cambridge, MA, USA, 2008; pp. 120–123. [Google Scholar]
  17. Chan, S.H.; Khor, K.A.; Xia, Z.T. A complete polarization model of a solid oxide fuel cell and its sensitivity to the change of cell component thickness. J. Power Sources 2001, 93, 130–140. [Google Scholar] [CrossRef]
  18. Shi, J.; Xue, X. CFD analysis of a novel symmetrical planar SOFC design with micro-flow channels. Chem. Eng. J. 2010, 163, 119–125. [Google Scholar] [CrossRef]
  19. Current Density Distribution in Solid Oxide Fuel Cell. COMSOL Multiphysics Tutorial Guide. Available online: https://cn.comsol.com/model/current-density-distribution-in-a-solid-oxide-fuel-cell-514 (accessed on 18 July 2017).
  20. Aguiar, P.; Adjiman, C.S.; Brandon, N.P. Anode-supported intermediate temperature direct internal reforming solid oxide fuel cell. J. Power Sources 2004, 138, 120–136. [Google Scholar] [CrossRef]
  21. Shi, Y.; Cai, N.; Li, C. Numerical modeling of an anode-supported SOFC button cell considering anodic surface diffusion. J. Power Sources 2007, 164, 639–648. [Google Scholar] [CrossRef]
  22. Flynn, D.R.; O’Hagan, M.E. Measurements of the Thermal Conductivity and Electrical Resistivity of Platinum from 100 to 900 °C. J. Res. Natl. Bur. Stand. C Eng. Instrum. 1967, 71C, 255–284. [Google Scholar] [CrossRef]
  23. Ferguson, J.R.; Fiard, J.M.; Herbin, R. Three-dimensional numerical simulation for various geometries of solid oxide fuel cells. J. Power Sources 1996, 58, 109–122. [Google Scholar] [CrossRef]
  24. Naveed, A.; Stephen, P.D.; Daniel, L.; Kevin, K. A three-dimensional numerical model of a single-chamber solid oxide fuel cell. Int. J. Hydrogen Energy 2009, 34, 8645–8663. [Google Scholar]
  25. KaKac, S.; Pramuanjaroenkij, A.; Zhou, X.Y. A review of numerical modeling of solid oxide fuel cells. Int. J. Hydrogen Energy 2007, 32, 761–786. [Google Scholar] [CrossRef]
  26. Zhao, F.; Virkar, A.V. Dependence of polarization in adnode-supported solid oxide fuell cells on various cell parameters. J. Power Sources 2005, 141, 79–95. [Google Scholar] [CrossRef]
  27. Perng, S.; Chen, C. Numerical Investigation of Anode Thickness on the Performance and Heat/Mass Transport Phenomenon for an Anode-Supported SOFC Button Cell. Int. J. Nanomater. 2015, 16, 172876. [Google Scholar] [CrossRef]
Figure 1. (a) Freestanding low temperature micro-solid oxide fuel cell (µ-SOFC) single cell; (b) schematic of experimental setup for performance test with membrane electrode assembly (MEA) structure; and, (c) geometry and boundary conditions for numerical analysis.
Energies 11 01204 g001
Figure 2. Comparison between numerical prediction and experimental data from Ref. [13].
Energies 11 01204 g002
Figure 3. (a) Average cell current density-voltage-power curve (I-V-P) curves; and, (b) individual overpotentials with respect to average cell current density for the reference case (T = 400 °C, Hel = 100 nm).
Energies 11 01204 g003
Figure 4. I-V-P curves (a) with varying operating temperatures (300, 350, 400, 450 °C); and, (b) with varying electrolyte thickness (100, 200, 300, 400 nm) at 400 °C.
Energies 11 01204 g004
Figure 5. Overpotentials regarding the average cell current density at different operating temperatures. (a) activation overpotentials; and, (b) ohmic overpotentials.
Energies 11 01204 g005
Figure 6. Ohmic overpotentials regarding the average cell current density with different electrolyte thickness at 400 °C.
Energies 11 01204 g006
Table 1. Constitutive equations for transport parameters.
ParameterEquationReference
(19) Electronic conductivity (S/m) σ P t = 1.0239 × 10 7 1 + ( 0.4033 × 10 2 ) T ( 0.5802 × 10 6 ) T 2 [22]
(20) Effective Electronic conductivity (S/m) σ P t e f f = ε σ P t [9]
(21) Ionic conductivity (S/m) σ Y S Z = 3.34 exp ( 10300 T ) [23]
(22) Binary diffusivity (m2/s) D i j = 3.16 × 10 4 T 1.75 ( 1 / M i + 1 / M j ) 1 / 2 p [ ( v i ) 1 / 3 + ( v j ) 1 / 3 ] [9]
(23) Mixture averaged diffusivity (m2/s) D m i x , i = 1 x i j i N x j / D i j [9]
(24) Knudsen diffusivity (m2/s) D K n , i = 8 3 r p o r e R T 2 π M i [9]
(25) Effective diffusivity (m2/s) D i e f f = ε τ ( D m i x , i D K n , i D m i x , i + D K n , i ) [9]
(26) Bruggeman correlration τ = ε 1 / 2 [19]
Table 2. Geometrical and electrochemical parameters.
ParameterValue
Cathode thickness, Hc100 (nm)
Electrolyte thickness, Hel100, 200, 300, 400 (nm)
Anode thickness, Ha100 (nm)
Cell radius, rcell0.75 (mm)
Operating temperature, Top300, 350, 400, 450 (°C)
Operating pressure, Pop1 (atm)
Operating cell voltage, Vcell0.2~1.0 (V)
Cathode porosity, εc0.16
Anode porosity, εa0.16
Anodic charge transfer coefficient, cathode, α a c , [24]0.375
Cathodic charge transfer coefficient, cathode, α c c , [24]0.125
Anodic charge transfer coefficient, anode, α a a , [24]1
Cathodic charge transfer coefficient, anode, α c a , [24]0.5
Reaction order, cathode, γ c , [18]0.5
Reaction order, anode, γ a , [18]0.5
Pore radius, rpore10 (nm)
Number of charge, cathode, nc4
Number of charge, anode, na2
Table 3. Boundary conditions.
BoundaryElectronic ChargeIonic ChargeSpecies
Ambient air/CathodeElectric potentialInsulationMass fraction
Cathode/ElectrolyteInsulationInsulationInsulation
Anode/ElectrolyteInsulationInsulationInsulation
Hydrogen Fuel/AnodeElectric groundInsulationMass fraction
Central axisSymmetrySymmetrySymmetry
Side wallInsulationInsulationInsulation
Table 4. Parameters for reference exchange current density.
ParameterValueUnit
Ac4.0348 × 106(A/m2)
Ec3.7681 × 104(J/mol2)
Aa1.0719 × 106(A/m2)
Ea2.3850 × 103(J/mol2)
Table 5. Comparison of reference exchange current density with literature.
ParameterThis StudyJ. Shi et al. [18]S. Kakac et al. [25]Unit
i O 2 * 4.8077 × 1032.00 × 1035.51 × 109(A/m2)
i H 2 * 6.9998 × 1051.08 × 1041.67 × 108(A/m2)

