Article

Impacts of Decarbonisation on the Water-Energy-Land (WEL) Nexus: A Case Study of the Spanish Electricity Sector

1
Centro de Investigaciones Energéticas, Medioambientales y Tecnológicas (CIEMAT), Av. Complutense, 40, 28040 Madrid, Spain
2
Chair of Renewable and Sustainable Energy Systems, Technical University Munich, Lichtenbergst. 4a, 85748 Garching bei München, Germany
*
Author to whom correspondence should be addressed.
Energies 2018, 11(5), 1203; https://doi.org/10.3390/en11051203
Submission received: 2 February 2018 / Revised: 12 April 2018 / Accepted: 27 April 2018 / Published: 9 May 2018
(This article belongs to the Special Issue The Nexus of Renewable Energy, Water, and Food Systems)

Abstract

:
Over the last decades, combating climate change has been an important concern for policy makers. As a result, many policies have been designed towards this direction. Being electricity generation the focus of climate change mitigation policies, important changes are expected in this sector over the next few years as a result of the implementation of such policies. However, electricity production also generates other impacts on the water, energy and land (WEL) nexus that must be further investigated. To shed some light to this issue, this paper presents and discusses the potential impacts on the water-energy-land nexus resulting from the decarbonisation of the Spanish electricity system impacts under two different long-term scenarios. Using a Life Cycle Assessment (LCA) approach, a set of environmental impacts relevant for the nexus have been analysed for the current and future electricity generation technologies in Spain. Additionally, through the use of an optimization energy model—Times-Spain—the evolution of the electricity technologies in Spain until 2030, under two different scenarios and targets has been assessed. Taking into consideration such scenarios, the global warming, acidification, eutrophication, ecotoxicity, water consumption, resource depletion and land use impacts have been estimated. Results show that, over time, together with the decrease of greenhouse gas emission, acidification and eutrophication tend to decrease in both scenarios. On the contrary, ecotoxicity and resource use impacts tend to increase.

1. Introduction

Over the last few years, several decarbonisation policies have been implemented in Europe with the ultimate objective of combating climate change and reducing energy dependence. The European Union (EU) established in 2009 its “2020 Climate and Energy Package” (20% renewables, 20% reduction in emissions compared to 1990 levels and 20% energy savings) which will run until 2020 [1,2]. Shortly after, the European Commission published a roadmap to 2050, on the path to reduce between 80 and 90% of greenhouse gas (GHG) emissions by 2050 [3]. In October 2014, the European Council set new and more ambitious decarbonization objectives in the “2030 Climate and Energy Package” [4] to replace the old “2020 package”. All these energy transition policies aim to achieve a more competitive, secure and sustainable energy system but mainly focus on reducing global warming emissions, increasing renewable energies penetration and energy efficiency. As shown in many studies [5], the electricity sector is expected to play a relevant role in the energy system decarbonization efforts, with an increasing electrification of the system and higher penetration of renewable technologies in the electricity generation mix.
Electricity generation has important impacts on water, land and energy. Since these three resources are highly interconnected, future changes in the electricity generation mix will likely modify the relationships that conform such nexus. In this context, assessing the magnitude of such impacts deserves attention by the scientific community as well as by policy makers in order to avoid unwanted effects.
Electricity generation technologies make use of water resources mainly for cooling and cleaning purposes as well as for irrigating energy crops and extracting fuels [6,7]. Similarly, hydropower plants use water as a resource to generate electricity. When talking about water use, it is usually distinguished between consumptive water use—the water removed from available supplies without return to the water bodies—and non-consumptive water use—the use that does not deplete the water bodies—like hydropower generation. Unless regulation prioritizes its use among them, the consumptive water uses for energy generation compete directly with the use of water for other purposes such as residential uses or food production. Water is an increasingly scarce resource in a context of continuous population and economic growth. Additionally, water availability is also affected by climate change, which causes an increase of drought periods in some regions and flood recurrence in other regions. In this context, water demand from electricity generation technologies may become a serious problem in many regions of the world. Furthermore, besides the resource availability constraint, pollutants from the different phases along the energy technologies life cycles may directly impact water bodies through water streams or lixiviates. Additionally, they may indirectly impact through the air pollutants deposition on soil and water bodies.
Spain is a semi-arid country with limited natural water availability. From an energy planning perspective, water is a strategic resource and the analysis of the impacts that the Spanish electricity system has on it is of great interest. According to climate change projections by the Centre for Studies and Experimentation of Public Works for Spain [8], water availability in the medium term (2040) is predicted to decrease by 5 to 25%, depending on the river basin district and climate scenarios considered [9]. The impacts that water scarcity might have on the energy system in Spain have been investigated by [10], who adapted a current energy model by including water constrains derived from climate change. According to their results, water scarcity could lead to higher energy system costs and, in extreme cases with water shortages, the energy system would be the last option to employ the water, which would cause additional problems to the system.
Energy (or electricity in our particular case) and territory are two elements that are also closely interrelated. The territory is the physical support of energy generation activities, so that the various stages of the energy production life cycles have impacts on the territory in terms of occupation and transformation. Power generation makes use of the territory not only for the installation of the power plants but also in the upstream stages corresponding to extraction, processing and transport of fuels and downstream in the stages of final disposal of waste generated after the decommissioning of the facilities. Electricity generation may also damage the soil by emitting pollutants to the air, soil and water along the different phases of the life cycle that might lead to environmental impacts such as acidification. As such, all these impacts might hinder the capacity of the territory to support food production.
Land can be understood as a primary resource for energy technologies. In the case of fossil technologies, land contains and provides fossil resources, such as coal, natural gas or crude oil. When considering renewable technologies, land must also be included as part of the system, either as a provider for raw materials—some of them classified as rare materials—or as a container for nutrients, in the case of bioenergy. Due to these activities, land will be transformed, modifying its initial status and services it could have provided before. But it might be also the case that this land use change causes other impacts such as an increase in CO2 emissions. There is a growing evidence that bioenergy might give rise to land uses changes, both directly and indirectly, of great importance, which has as main consequence the release of carbon emissions from soil [11]. On the other hand, energy is required in any operation related to the extraction of raw materials, fuels, or bioenergy cultivation.
Lastly, the nexus between land and water is highly related to the ecosystem services that they provide. An adequate land will ensure convenient runoff, filtration and purification of water, while adequate clean water runoff will ensure an appropriate soil structure, which will contribute to the maintenance of the land cover and the services related to it. Furthermore, degradation of soil and water bodies caused by energy generation produces great impacts on ecosystems challenging their capacity to deliver important ecosystem services and it has been recently studied by the scientific community [12,13].
There is a growing evidence in the literature that shows that a nexus approach is needed to support a transition towards the sustainability of energy systems exploiting synergies, avoiding trade-offs between sectorial policies, and allowing climate mitigation measures to be more land, water and ecosystem smart [14].
Nexus interactions have been characterized in the literature by the three bilateral relationships among water-energy, energy-land/food and water–land/food that together form a set of relationships that are very dynamic and complex, and are influenced by numerous external drivers and factors. Several conceptual frameworks for analysing the nexus have been proposed in the literature. In all these frameworks, while the interlinkages among water, energy and land/food are at the core of the analysis, the different authors have added additional issues of special concern for them such as ecosystems [15,16,17,18], climate [19,20,21], minerals [22], and fibres [23] as reviewed by [24]. Recently, a review of the most updated articles focused on the nexus was published [25]. They establish three ways of understanding the integration of the nexus that are currently followed by the most recent studies. These are (i) incorporation: which would imply bringing the issues of the three sectors into one system, (such as for example in [26,27]); (ii) cross-linking on specific interlinks which aims at highlighting priority issues (such as for example in [28,29]); and (iii) assimilation that it is the view of sector decision-makers trying to include key related sectors in their strategies (see for example [30]). Finally, Stigson and his team identify several areas of improvement to better analyse and understand the integration of the nexus [31]. Based on them, the nexus should highlight how decisions in one sector can interact with other sectors and provide tools to policymakers based on scientific knowledge.
From the energy system perspective, several authors have highlighted the importance of examining existing and potential innovative energy technologies that can reduce the trade-offs across the three nexus dimensions [26,28,31,32]. In this sense, the adoption of technological improvements (e.g., dry cooling technologies) that may reduce the impacts of technologies on water and land is seen as a key area for policy integration across energy and water policies that can create synergies among those policies [33]. Furthermore, it is recognized that including additional aspects within energy systems assessments in the light of the nexus concept could be important. Such aspects can include air pollution and its effects on acidification and eutrophication and mineral depletion [32].
The challenge when analysing the nexus water-energy-land is the direction of the relations among the three axes. Each element of the nexus can play the role of resource for the other two elements while it can also be the source of several impacts. Figure 1 below shows the most important links identified. Water is needed to generate energy while energy is needed in the water cycle to pump and distribute the water to the final users. The more scarce water becomes, the higher energy is required for their acquisition. The larger amount of conventional fuels is consumed to generate energy, the larger impacts on water and land will take place. Energy generation land requirements might compete with other uses of land and might induce land use change and deforestation which, in turn, affects water basins hydrology. All of these relationships are affected by global tendencies like climate change impacts as well as policies and globalization, economic factors such as the economic growth model and the degree and speed of technological innovation and also local, regional and national sectorial policies.
Energy transition pathways towards decarbonisation include the increasing use of renewable technologies. However, some renewable technologies might cause other environmental impacts that should be considered to avoid shifting from one problem to another. This might be the case of some clean energy technologies, which, albeit they do not consume fossil resources, in turn make use of rare metals and other critical materials which are very scarce in the planet. According to [35], gallium, indium, and neodymium are elements of special concern from a long-term-supply standpoint.
This paper aims to fill some of the identified gaps by analysing how the future energy and climate change targets in Spain may impact the two other pillars of the nexus. Impacts of energy systems on land and water are estimated considering not only occupation or withdrawal but also impacts on soil and water quality. Only by estimating these potential impacts, it is possible to derive policy recommendations and help policy makers avoid important water, energy and land (WEL) nexus conflicts in the future.
In our paper, we first address the impacts on acidification, eutrophication, ecotoxicity and use of resources—in terms of water and scarce minerals—of different energy technologies taking into account their current situation and their expected technical improvements in the midterm. Knowing the potential impacts associated to each technology, we then study the evolution of the energy mix in Spain resulting from the climate change mitigation policies and analyse the total impacts derived from the future scenario compared to a business as usual situation.

2. Methodology

This work integrates two different and complementary methodologies as depicted in Figure 2. On the one hand it uses Life Cycle Assessment (LCA) methodology to estimate the environmental impacts of the different current and future electricity generation technologies in Spain. The set of environmental impacts investigated is composed of WEL relevant impacts such as eutrophication, acidification and toxicity impacts and also resource depletion, water consumption and climate change impacts. On the other hand, it uses a partial equilibrium energy system model -Times-Spain- to estimate the evolution of the electricity technologies portfolio until the year 2030 subject to a set of restrictions imposed by the current energy policy commitments (under the EU 20-20-20 energy and climate package) as well as some plausible targets for the year 2030 under the EU 2030 climate and energy strategy.
The results of both analyses have been combined to obtain an estimation of the impact that different electricity generation scenarios might have on different aspects of the WEL nexus. Somehow similar methodological approaches have been followed by other authors [33] who analyzed the development of the German energy market until 2030, the environmental impacts of electricity generation in the BLUE map and Baseline IEA scenarios [36], the sustainability of the Mexican electricity supply [37] and the impact of high penetration of renewables in the European electricity system [38].

2.1. Life Cycle Analysis of Energy Technologies

Life Cycle Analysis (LCA) is a method to assess the potential environmental impacts of services or products along their whole life cycle. Also known as “cradle to grave” analysis, LCA takes into account all inputs and outputs in terms of energy, raw materials, emissions, co-products, etc. in each stage along the life cycle and evaluates the potential impacts by using different impact assessment methods. The procedure on how to conduct an LCA is standardized by the ISO norms 14040:2006 and 14044:2006.

2.1.1. Definition of the Goal, Data Sources and Main Hypothesis

The objective of the study is to evaluate the environmental impacts associated to two different electricity generation scenarios until 2030. Each scenario is composed by several electricity generation technologies with different contribution shares in each period. Many of these technologies have not yet reached their highest mature development stage which implies that there is still room for improvement in terms of their techno-economic performance. For this reason, each technology has been studied independently, taking into account the potential technology improvements that are expected to take place during the analysed period. The functional unit chosen in all cases is 1 kWh of electricity produced and all stages from raw material extraction until dismantling have been considered.
In order to conduct the analyses, we have identified the most appropriate process for each technology provided in the Ecoinvent v3.1 database, but some adjustments have been done to better describe the Spanish context. These modifications are related to the origin of different fuels such as natural gas and coal as well as the source and amount of water used for refrigeration. Additionally, we have identified and adjusted three renewable energy technologies that are expected to improve their performance along the period considered in TIMES-Spain. These technologies are wind onshore, solar photovoltaic and concentrated solar power (CSP).
Based on the report published by KIC Innoenergy on wind energy innovation development [39], we have assumed that the capacity factor will increase by 4% and 6% in those plants installed by 2020 and 2025, respectively.
Similarly, based on the International Energy Agency Technology Roadmap for Solar Photovoltaic Energy in 2014 [40], we have assumed that the mc-Si panels will reach 21% efficiency by 2030. Besides, a reduction in the silicon required to produce the wafer is expected since new manufacturing plants using ribbon technology will already have a more efficient technology with lower silicon losses.
In the case of CSP plants, we have assumed that by 2030 they will all have already dry cooling systems which will decrease the water consumption up to 0.3 m3/MWh [41]. This measure will affect the efficiency of the plant, which would have increased to 20% in normal cooling conditions but it will only reach 15% in this case.
Finally, it is important to remark that along the analysed period, the Spanish electricity system imports electricity from France. For this reason, the development of the electricity technology mix in France throughout this period has also been considered, including the technology advances already mentioned.

2.1.2. Description of The Considered Impacts

Electricity generation could lead to various environmental impacts. In this sense, in 2011, the European Platform of LCA recommended a set of impact categories as well as impact assessment models and factors for the European context [42]. Among all categories, we have only selected those that are related to the Water-Energy-Land nexus.
• Acidification
Acidification is the process of introduction of acidic substances to the environment mainly caused by sulphur and nitrogen oxide emissions. After reacting with water vapour in the air, these oxides are converted into acidic compounds which are deposited on the earth surface. The recommended impact assessment method is the accumulated exceedance [43,44]. The impact units are expressed in moles of H+.
• Eutrophication of freshwater bodies
These impacts are linked to the accumulation of nutrients in the water with consequent massive algae growth and decreased oxygen concentration. These impacts are measured in kg of P equivalent. The recommended impact assessment method is ReCiPe [45].
• Terrestrial eutrophication
Terrestrial eutrophication is the consequence of an addition of nutrients to the soil that might change the composition of the ecosystem, providing additional nutrients to some species which leads to an increase of their production. Terrestrial eutrophication is caused when airborne emissions of nitrogen compounds are deposed on the terrestrial surface. The recommended impact assessment method is the accumulated exceedance [43,44].
• Marine eutrophication
Marine eutrophication is caused by an increase of some limiting nutrients that trigger the growth of algae. As a consequence, the light does not reach other plants and thus, the whole ecosystem is affected. The dead organic matter remains on the bottom of the water body, which decreases the available oxygen. The recommended impact assessment method is ReCiPe [45].
• Ecotoxicity of fresh water bodies
When released to the environment, some polluting substances that reach fresh water have the potential to damage humans or ecosystems. These potential damages are quantified using the USEtox method [46].
• Impact of energy technologies on land use
This impact is measured in terms of kg of carbon (C) released from vegetation and soil as a result of the conversion of an area of natural vegetation into electricity production. This impact is assessed through the Soil Organic Matter [47]. Soil organic matter is commonly used to indicate the quality of soil. Although it only measures the carbon content, this attribute is related with many other soil characteristics such as vulnerability to erosion, compaction and fertility among others. Soils with low carbon content are more vulnerable than those with high carbon content, which are able to provide more services to the ecosystem, including the availability to produce food. This impact evaluates the potential changes in land quality. However, a site-specific analysis should be carried out, once a specific location is determined for a new facility.
• Water consumption
As recommended by the European Commission, the Swiss Ecoscarcity model for water consumption has been used [48]. In this method, water consumption in each region is weighted depending on the availability of water in the area. Impacts are expressed in terms of liters equivalent. In this model, water scarcity is defined based on the water stress index of the Organisation for Economic Co-operation and Development (OECD): water extraction percentage versus the amount of water available (rainfall + inputs − evaporation). Given the different countries and regions of the world, a characterization factor that weights water consumption depending on the water stress index is calculated. This impact is of high importance in regions with water scarcity and the use of a specific impact methodology can affect the final results. Water returned to a river or a lake after the cooling process in power plants is not included as consumption in this impact category.
• Resource depletion
The method used [49] assesses the consumption of non-renewable resources (fossil fuels and minerals). Characterization factors are given for metals, fossil fuels and mineral compounds. The method also covers most of the substances/materials identified as critical by the European Commission’s Ad-hoc Working Group on defining critical raw materials [50].

2.2. Energy Scenario Modelling with TIMES–Spain

2.2.1. Description of the Model

TIMES–Spain is a techno-economic energy optimization model belonging to the TIMES family of models developed by the International Energy Agency (IEA) in the Energy Technology Systems Analysis Programme (ETSAP) (http://iea-etsap.org/). TIMES is a model generator of bottom-up optimization models representing the entire energy systems of one or more regions or countries. It includes all the stages from resource extraction and production to final consumption in the demand sectors. The output of a TIMES model is the optimal composition of the energy system under analysis that meets the demand for energy services maximizing the net benefit. In TIMES models, this is equivalent to minimize the total cost of the energy system. This cost includes capital costs for investing and dismantling; fixed operation and maintenance costs; variable operation and maintenance costs; import costs and export revenues; domestic resource production costs; commodity delivery costs; taxes and subsidies; etc. More information on TIMES can be found in [51,52,53] and at the ETSAP web page (http://www.iea-etsap.org/web/index.asp).
Times−Spain is a one region model with a time horizon of 2050 which covers five demand sectors with their respective energy technologies fully characterized by their technological, economic and environmental parameters: industry, subdivided into 13 subsectors; residential; commercial; transport; and agriculture.
Regarding the energy supply, it includes the mining, production and processing of primary energy sources (uranium, fossil fuels and biomass) and all the electricity and heat production technologies with their corresponding technological, economic and environmental parameters. Also high, medium and low voltage grids are represented as well as high and low temperature heat grids. Renewable resources potentials are included explicitly in the model.
One of the main input data is the end-use energy services demand. The projections of the demands are computed based on the evolution of two important drivers: GDP and population. Average GDP growths for the 5-years period are actual historic values and the result of the output of a macroeconomic model GEM-E3 for the rest of the period. Population growth estimations are taken from the National Statistics Institute (INE). The considered evolution of GDP and population in the model is shown in Table 1.
In the case of the residential, industrial and transport sectors, demand data have been updated with national data projections when available. Other inputs are the existing stock of energy related equipment in all the sectors and the remaining time of operation, the potential future technologies with their corresponding parameters gathered through literature searches, the present and future sources of primary energy supply including different forms of biomass such as energy crops and industrial and municipal waste amongst others as well as current environmental and energy policies. Energy imports and exports with the neighbouring countries are also considered in the model. The oil price is estimated in 78 $2010/barrel in 2010 and growing up to 140 $2010/barrel in 2035. Although current expansion of US oil production might lead to a lower increase of international oil price in the future this is not expected to alter the results obtained because oil electricity production is very low in Spain and also because the electricity system evolution is mainly driven by the climate and renewable energy targets and not by oil price evolution.
The reference year in the model is 2005, and 2010 and 2015 data have been calibrated to reflect the real energy system in those years. The Spanish Feed-In Tariff (FIT) system is included until 2012 when supports to new facilities stopped. TIMES−Spain contains CO2, CH4, N2O, CO, NOx, SO2, PM2.5 and PM10 emission data derived from fuel combustion, as well as some extra emission factors for processes without combustion. Emission factors have been reviewed and updated [54].
Despite TIMES–Spain is a proven, suitable and recognized tool for long term analysis, the level of temporal detail is quite low. This leads to uncertainty when renewable technologies play an increasingly relevant role to meet current and future climate policies due to their intermittent nature and short predictability. More information about TIMES−Spain can be found in [55,56,57].

2.2.2. Set of Scenarios

In order to analyze the impact of energy generation on the WEL nexus in Spain, two alternative scenarios have been built.

Business as Usual Scenario (BAU)

This scenario gathers all the energy and environmental policies as well as other relevant policy commitments in force in Spain as in 2015. The scenario includes the FIT scheme in place in the country from 2005 to 2012 until its derogation by the Decree-Law 1/2012 [58]. The BAU scenario also includes subsidies to investments on renewable technologies in the commercial and residential sectors. BAU scenario also considers the commitments in force related to Directive 28/2009/EC [3] on the promotion of the use of energy from renewable sources, Directive 29/2009/EC [1] to improve and extend the greenhouse gas emission allowance trading scheme of the Community, and Directive 81/2008/EC [59] on national emission ceilings for certain atmospheric pollutants. These commitments set by 2020 have been maintained at the same level until the end of the time horizon. Such Directives are included as a constraint into the model setting a series of objectives such as 20% renewable energy from final energy consumption and a maximum emission of 258.4 Mt of CO2 by 2020, and SO2 and NOX emission ceilings up to 746 and 847 kt respectively from 2015 to 2035.
Regarding nuclear power plants, the BAU scenario assumes a constant nuclear power capacity installed until 2035 considering that the current power plants will be allowed to extend their lifetimes beyond the 40 or even 50-years-period.

Target Scenario (TARGET2030)

This is an ambitious scenario that takes into consideration the goals set in the 2030 Framework for Climate and Energy proposed by the Commission in January 2014 [5] and agreed by the EU leaders in October 2014 which sets new energy and climate policy objectives for the period between 2020 and 2030. GHG emission reductions considered are 21% in 2020 and 30% in 2030 compared to 2005 emissions. The objectives for non-Emission Trading System (ETS) emissions considered in this work are to reach a reduction of 10% by 2020 and 20% by 2030, also compared to 2005. Total non ETS reduction target proposed for Spain is 26%, and in this work it has been considered that the energy sector will contribute with 20% while other diffuse sectors such as agriculture and land use change are only responsible for the additional 6%. Renewable energy contribution to final energy is set at 20% in 2020 and 27% in 2030. An energy efficiency improvement has been forced through a reduction of 20% and 27% of primary energy consumption in 2020 and 2030 respectively compared to the primary energy consumption of the BAU scenario. Finally, the European Council recognized the fundamental importance of a fully connected internal energy market. To that end, the achievement of a minimum target of 10% of electricity interconnections (percentage over installed capacity) in the case of some countries (including Spain) by 2020 is set, which implies achieving the 15% target by 2030. In this work, it has been considered that this interconnection capacity is effectively achieved. Regarding nuclear power, it has not been considered lifetime extension of the existing plants. Therefore, there will be no nuclear power generation from 2028.

3. Results and Discussion

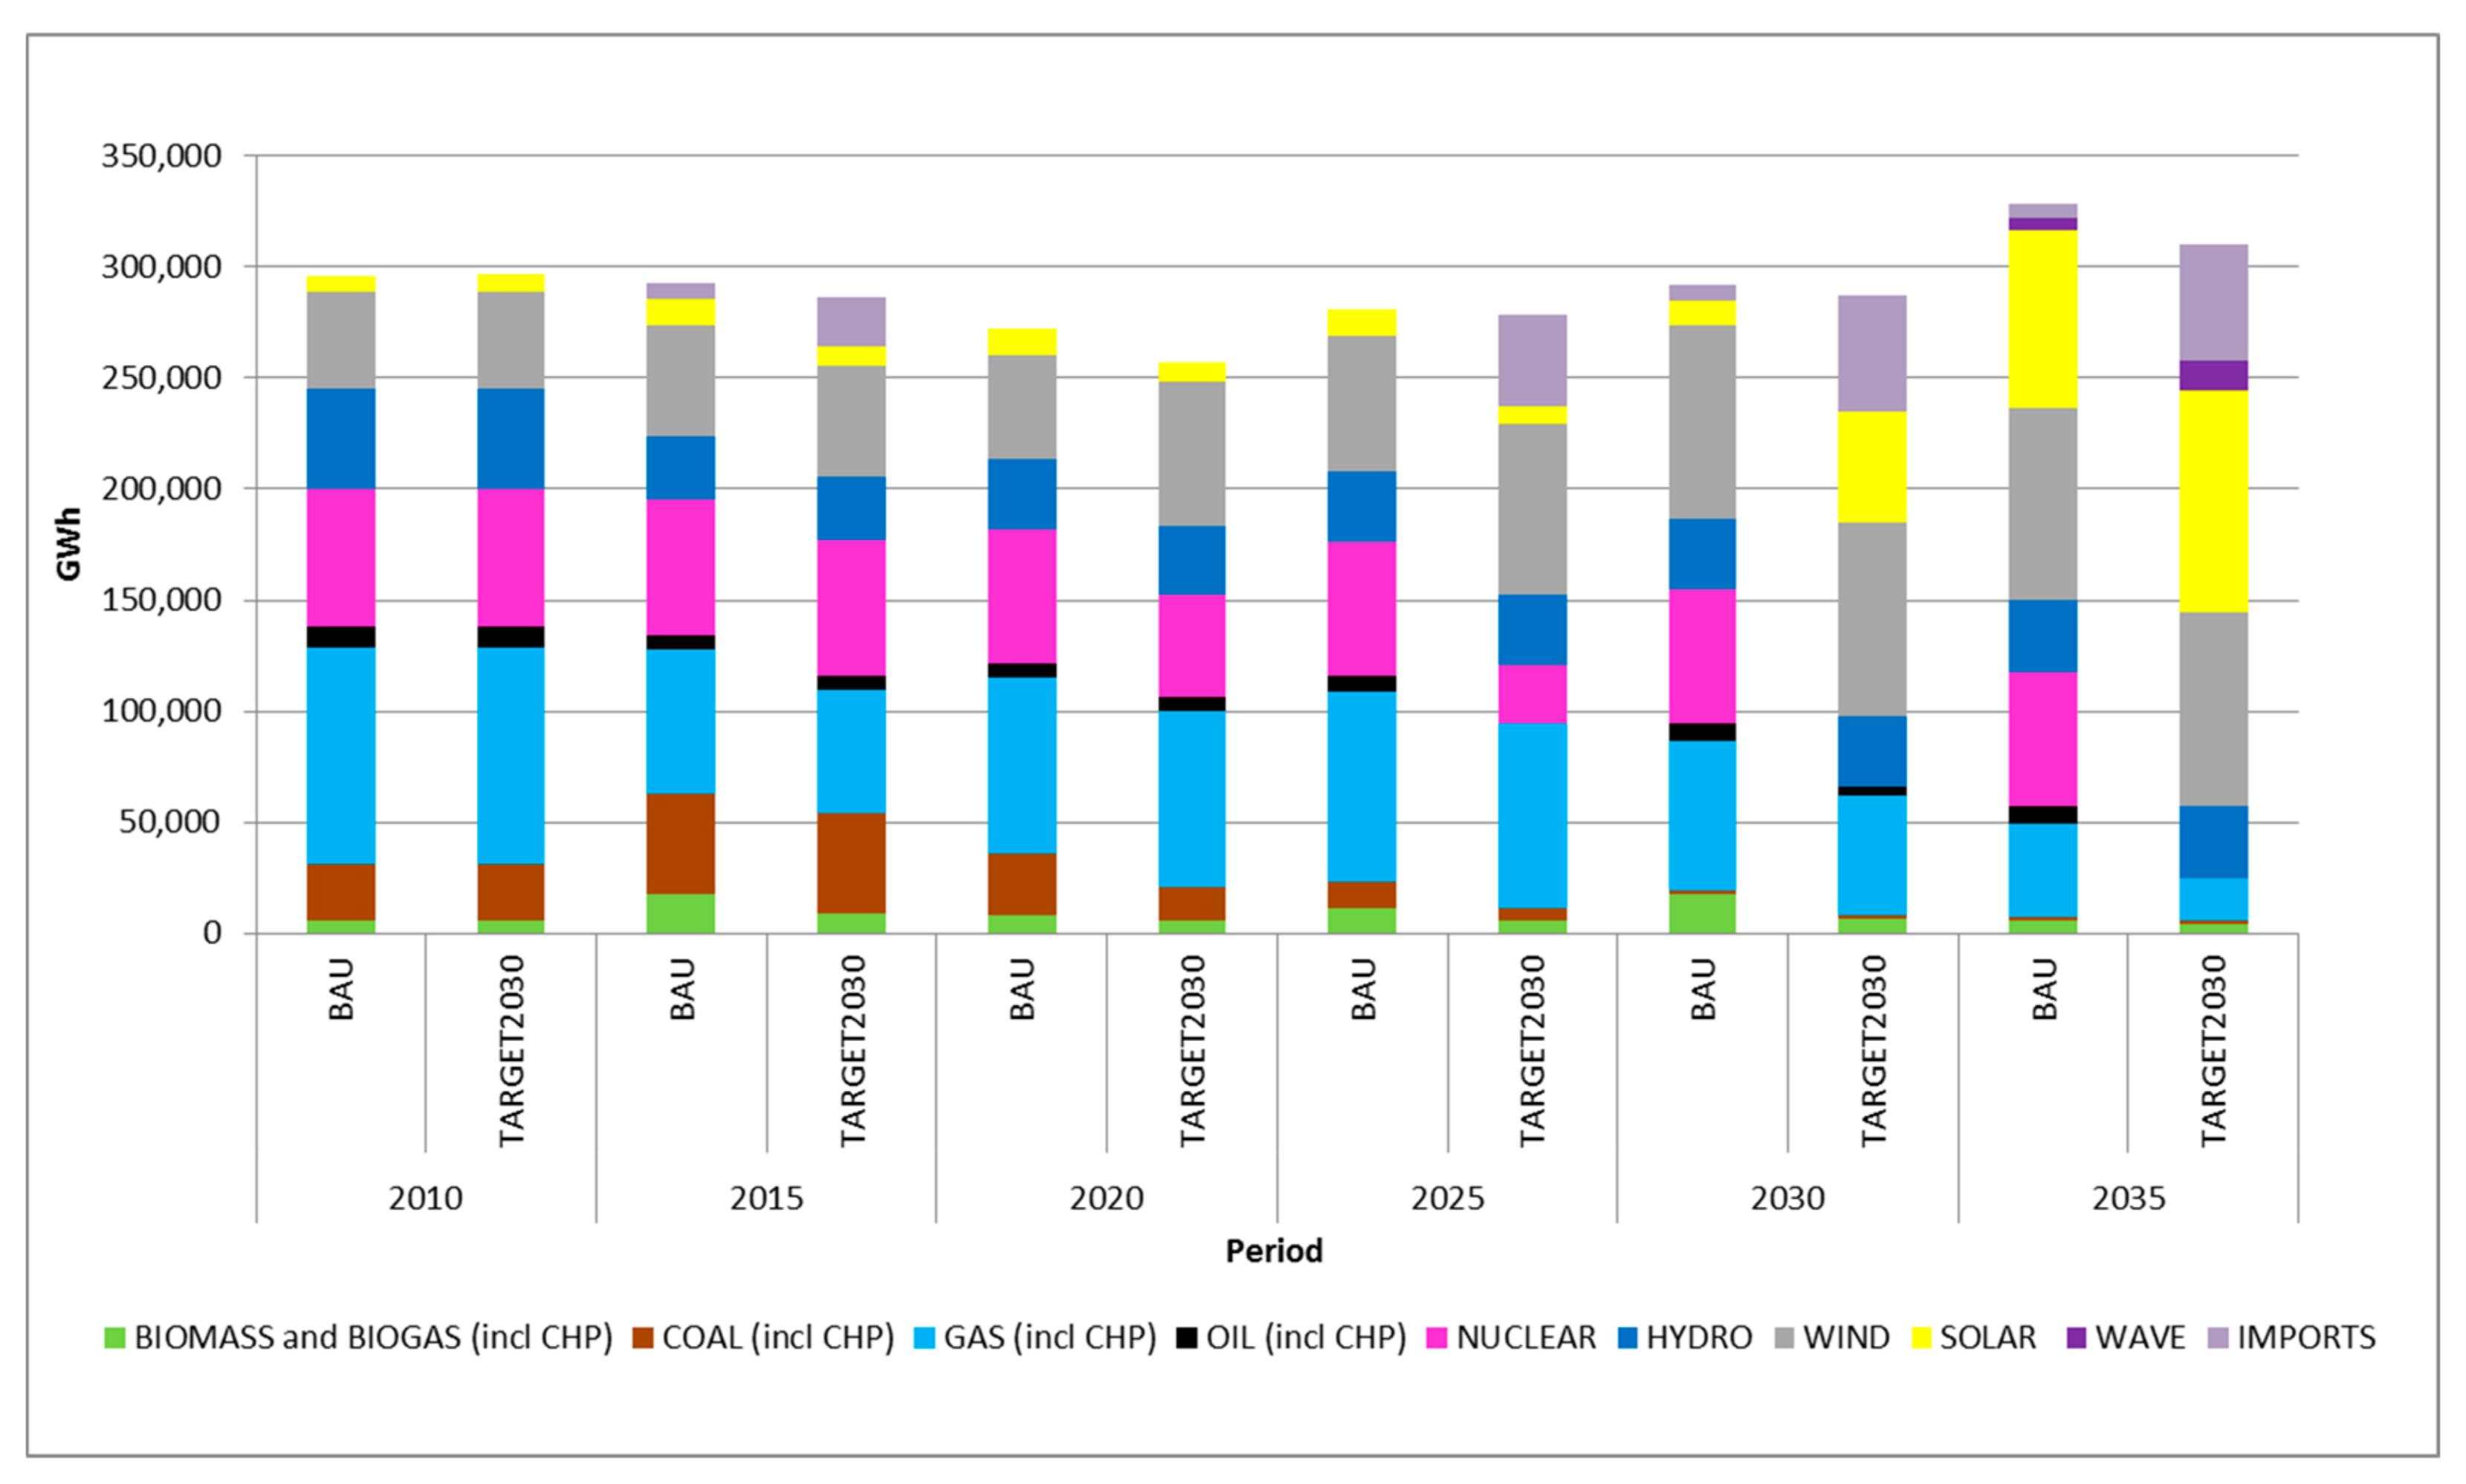
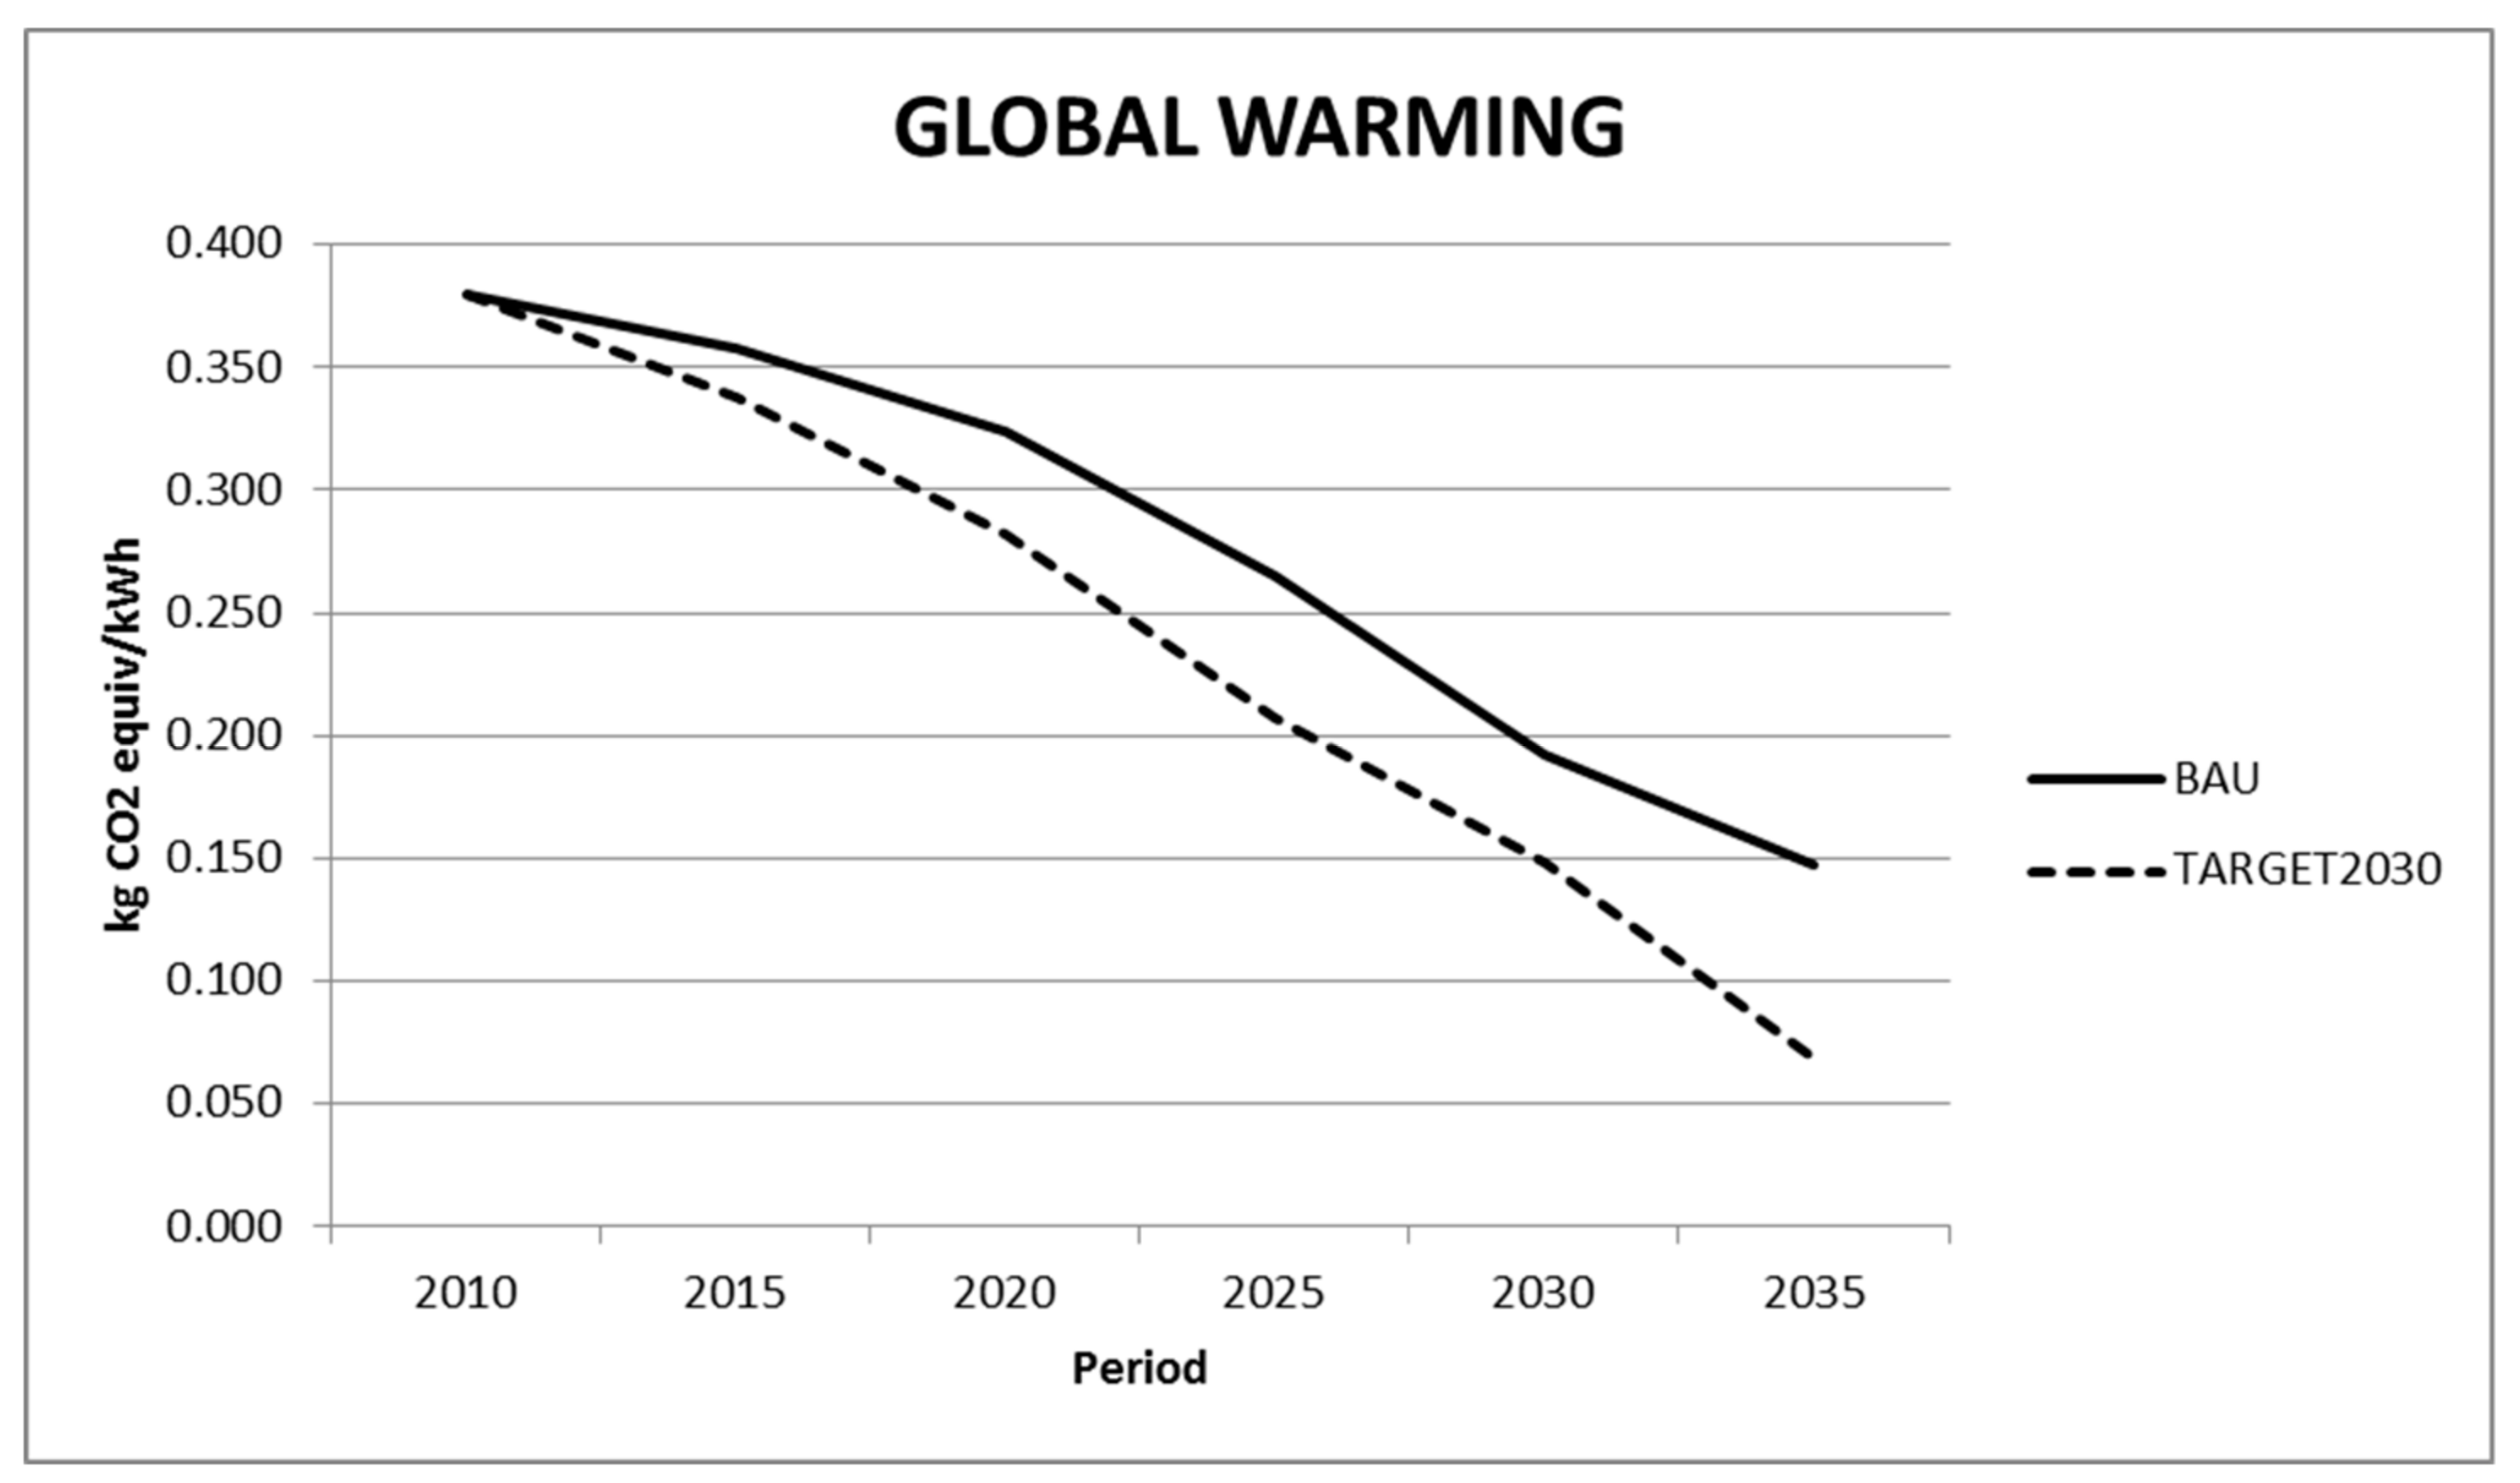
3.1. Electricity Mixes Resulting from These Scenarios and CO2 Emissions Associated

This paper focuses on the effects on the WEL nexus of two alternative electricity generation scenarios described above. According to the results of the modelling exercise, the portfolio of electricity generation technologies under the considered scenarios is shown in Figure 3.
As can be seen in this figure, BAU scenario results show a much gasified electricity system that is gradually phasing out coal power but still relies on nuclear electricity for base load and with an increasing penetration of wind electricity. Renewable electricity share at the end of the period reaches 50% from which 30% corresponds to wind technologies, 11% to hydro, 6% to biomass and 4% to solar technologies.
TARGET2030 results show an increasingly renewable system but still using gas as backup technology and with a high rate of electricity imports (18%) mainly due to the reinforced electricity interconnection assumption. Coal power plants are phased out at a higher rate and nuclear power plants are completely decommissioned at the end of the period. Renewable electricity share in 2030 is 61% from which non dispatchable technologies (wind and solar PV) represent 47%. Dispatchable renewable electricity (biomass, hydro and solar thermal) account for the remaining 14%. This amount of dispatchable renewable technologies and the existence of gas back up capacity make this high renewable share feasible.
In order to overcome the above mentioned limited temporal detail of TIMES-Spain, future work plans to integrate a dispatch model of the power system combining, in that way, long term analysis with high level temporal detail tools. GHG emissions intensity associated to these scenarios is shown in Figure 4.
Electricity generation shows a very high decarbonization rate in both scenarios. Starting from a value of 379 g CO2eq/kWh in 2010, BAU scenario reaches a CO2 intensity of 193 g CO2eq/kWh in 2030. Greenhouse gases emissions decrease even faster in the TARGET2030 scenario. TARGET2030 reaches a value of 149 g CO2eq/kWh.

3.2. Impacts on the FEW Nexus of the Different Electricity Generation Technologies

Before analyzing each scenario, the impacts per kWh of electricity generated by the different power generation technologies used by the model have been estimated individually. Results of each impact per kWh of electricity are shown in Table 2.
As shown in Table 2, acidification (mainly caused by sulphur and nitrogen oxides) as well as terrestrial and marine eutrophication (mainly caused by nitrogen oxides) greatest impacts are produced by oil followed by coal, lignite and natural gas power plants. Also the electricity produced by biogas leads to significant impacts linked to ammonia emissions in the fuel cycle.
Focusing only on renewable energies, solar photovoltaic power generation has the highest acidification and eutrophication impacts linked to the solar panels manufacturing processes. Nevertheless, as can be seen in Table 2, these impacts are much lower than those resulting from oil. These impacts are reduced as the efficiency of the technology increases with time. Solar thermal concentration power plants also have high acidifying and eutrophication emissions when operated with natural gas, but these impacts are greatly reduced when plants are operated only with solar resource. The rest of renewables and nuclear energy have smaller acidifying and eutrophication emissions.
Acidifying and eutrophication emissions originated by the electricity imported from France are increasing as the French system produces more photovoltaic electricity.
Fresh water bodies’ eutrophication greatest impacts, mainly caused by phosphate effluents, are those originated by lignite and coal technologies and are associated to mining activities while the other technologies produce much smaller impacts.
Ecotoxicity impact results are very significant for lignite as they are linked to emissions of heavy metals from mining processes. Solar photovoltaic technology has also significant emissions resulting from the incineration of waste copper from panels in the end of their life processes.
Concerning land use, this study assumes that once the electricity power facility life time is over, the land area occupied by the facility will be recovered. This statement can be done under the Spanish context, where the electricity companies are forced to restore the occupied area [60,61].
Land use impacts associated with biomass and biogas technologies are due to land use change and the C release associated to this change in areas dedicated to forest crops. In the case of coal mining and lignite, it was considered that only part of the occupation of the mine was subsequently restored. The impact associated to oil and gas technologies mainly takes place in the fields of extraction. In the case of hydroelectricity, only the occupation of flooded soil but not the land use change impacts have been considered in terms of release of C. This fact and the long life of dams results in low land use estimated impacts.
Land use impacts of photovoltaic power technologies are linked to the occupation of land and to changes in land use in silicon mining activities. As for CSP, the impact on land use is moderate and linked to the occupation of land by the solar field and the extraction of gas in the hybrid technology. Windmills have also moderate impacts on land use that are reduced by increasing efficiency of these technologies.
Lignite power plants have the highest impact on water consumption in mining activities. The fact that such mining activities take place in Spain implies a quite high characterization factor. Coal mining also consumes large amounts of water but in areas with less water stress.
Water consumption of current CSP plants is high because existing plants use wet cooling systems and the water used has a high weighting factor. As mentioned earlier, it is assumed that future technologies will use dry cooling and therefore will have less impact on water use. Nuclear technology has also important water consumption mainly due to the cooling system.
Finally, regarding the use of resources, the high impacts of solar photovoltaic are due to the consumption of silver and zinc in the manufacture of the panels while those of wind are associated to the manufacture of wind turbines.

3.3. Impacts on the WEL Nexus of the Different Electricity Generation Scenarios

Combining the results obtained before, it is possible to analyze the evolution of the different impacts over time as the electricity mix transitions towards decarbonization and incorporates new clean technologies.

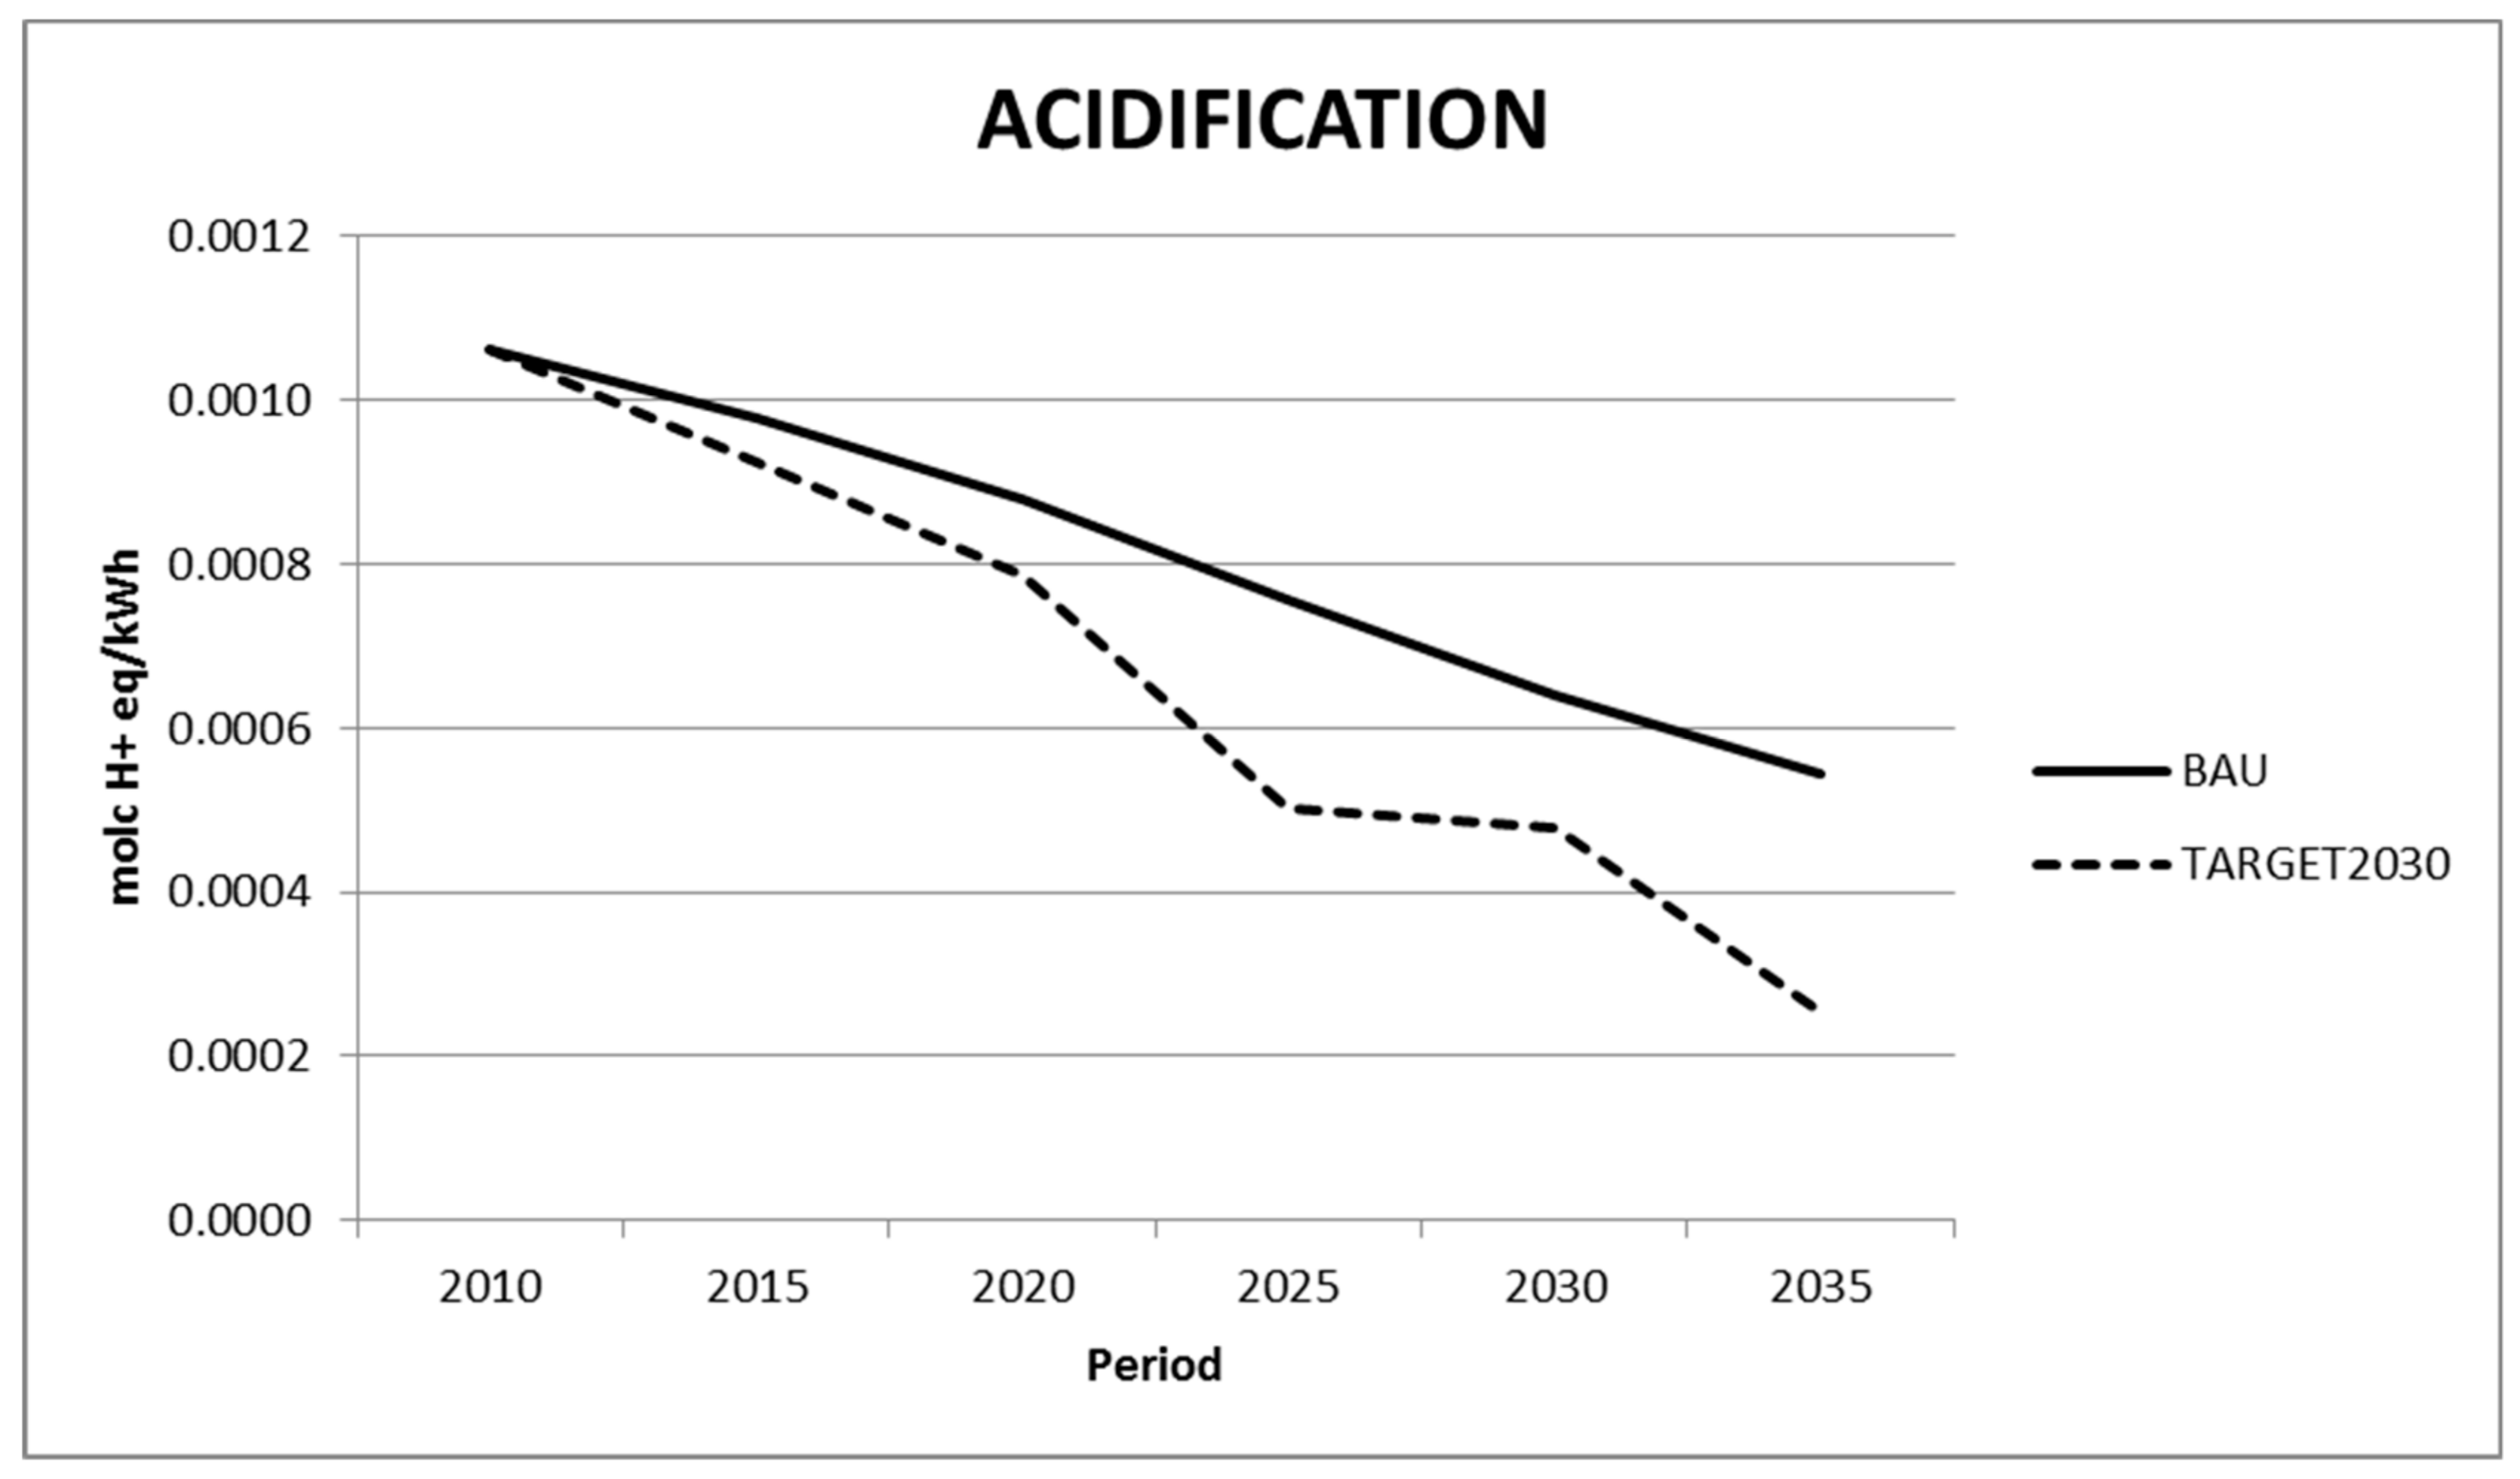
3.3.1. Impacts on Acidification

The evolution of acidification impacts produced by the Spanish electricity generation mix along the period from 2010 to 2035 in the BAU and TARGET2030 scenario is shown in Figure 5. The detailed contribution of each technology is shown in Table S1 of the Supplementary Materials. Acidification impacts are reduced in both scenarios in 49% and 76%, respectively.
In both scenarios, the main technologies responsible of these impacts are coal, gas and oil power plants including the CHP plants of the industrial sector. Also in both scenarios coal technologies decrease their share in the mix and this fact has important benefits in the overall electricity generation acidification impacts. Coal is responsible for 36% of total acidification impacts at the beginning of the period but only contributes with 3% and 5% in the BAU and TARGET2030 scenarios respectively at the end of the period. Gas technologies are used to produce electricity during all the period in both scenarios and therefore their impacts remain to a great extent being still 32–34% at the end of the period in both scenarios. Renewable technologies also contribute to acidification impacts of the system and its contribution to the total impact increase overt time as the electricity mix becomes more decarbonized and these technologies represent a higher share of the generation system. While at the beginning of the period these technologies only contribute with 4% of the total acidification impact, at the end of the period, renewable technologies represent 24% in the BAU scenario and 43% in the TARGET2030 scenario.
Comparisons with results published in the literature are difficult to undertake because different energy systems have different penetration of fossil and renewable technologies and the decarbonization pathways are not always based on the same set of technologies. Nevertheless, our results are consistent with those found by [37,54].
As to the relevant legislation, the EU has a long-term objective of not exceeding critical loads for acidity in order to protect the ecosystems from acidification. According to the European Environmental Agency, improvements in this regard taken place from 2000 have been considerable and the areas of Spain were critical loads were exceeded have been reduced [62]. In 2010, these areas were concentrated in the Northern coast of Spain as well as in the Madrid area. As many coal power plants in Spain are located in the Northern coastal area, the anticipated phasing out of these plants will help to further reduce these exceedances. These results clearly suggest a synergy between climate and energy policies in Spain and the existing efforts to reduce acidification emissions.

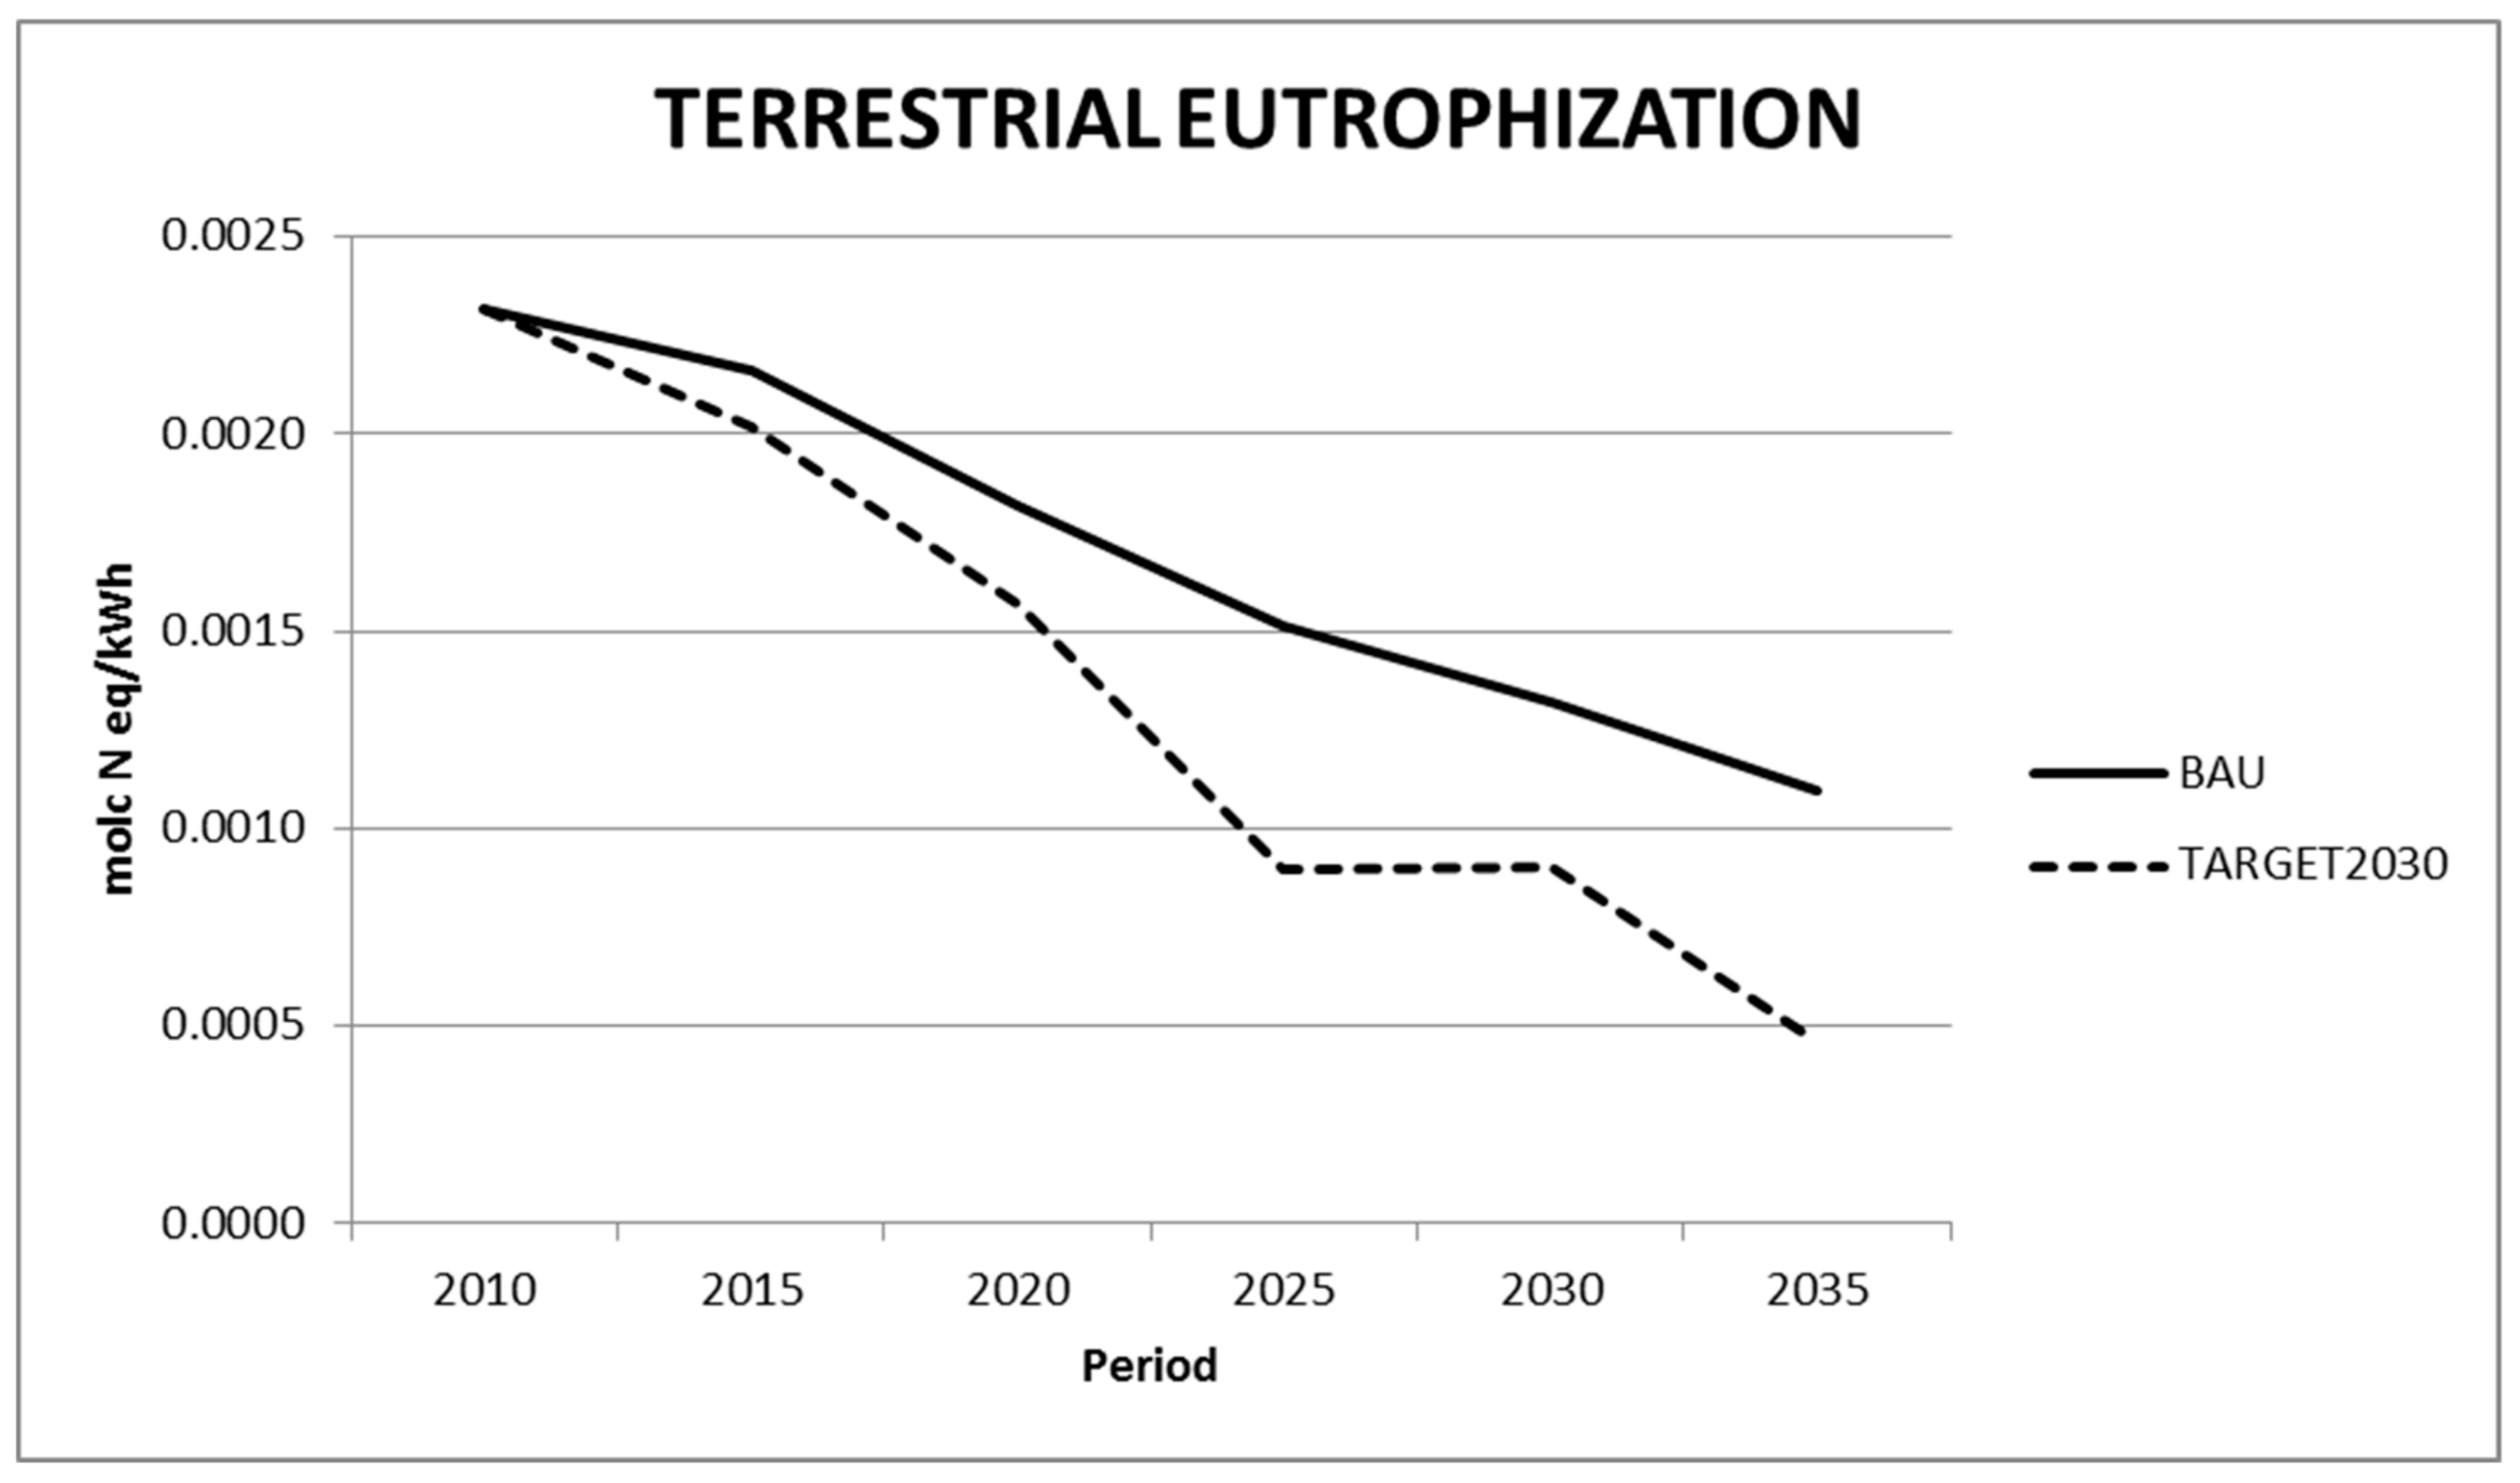
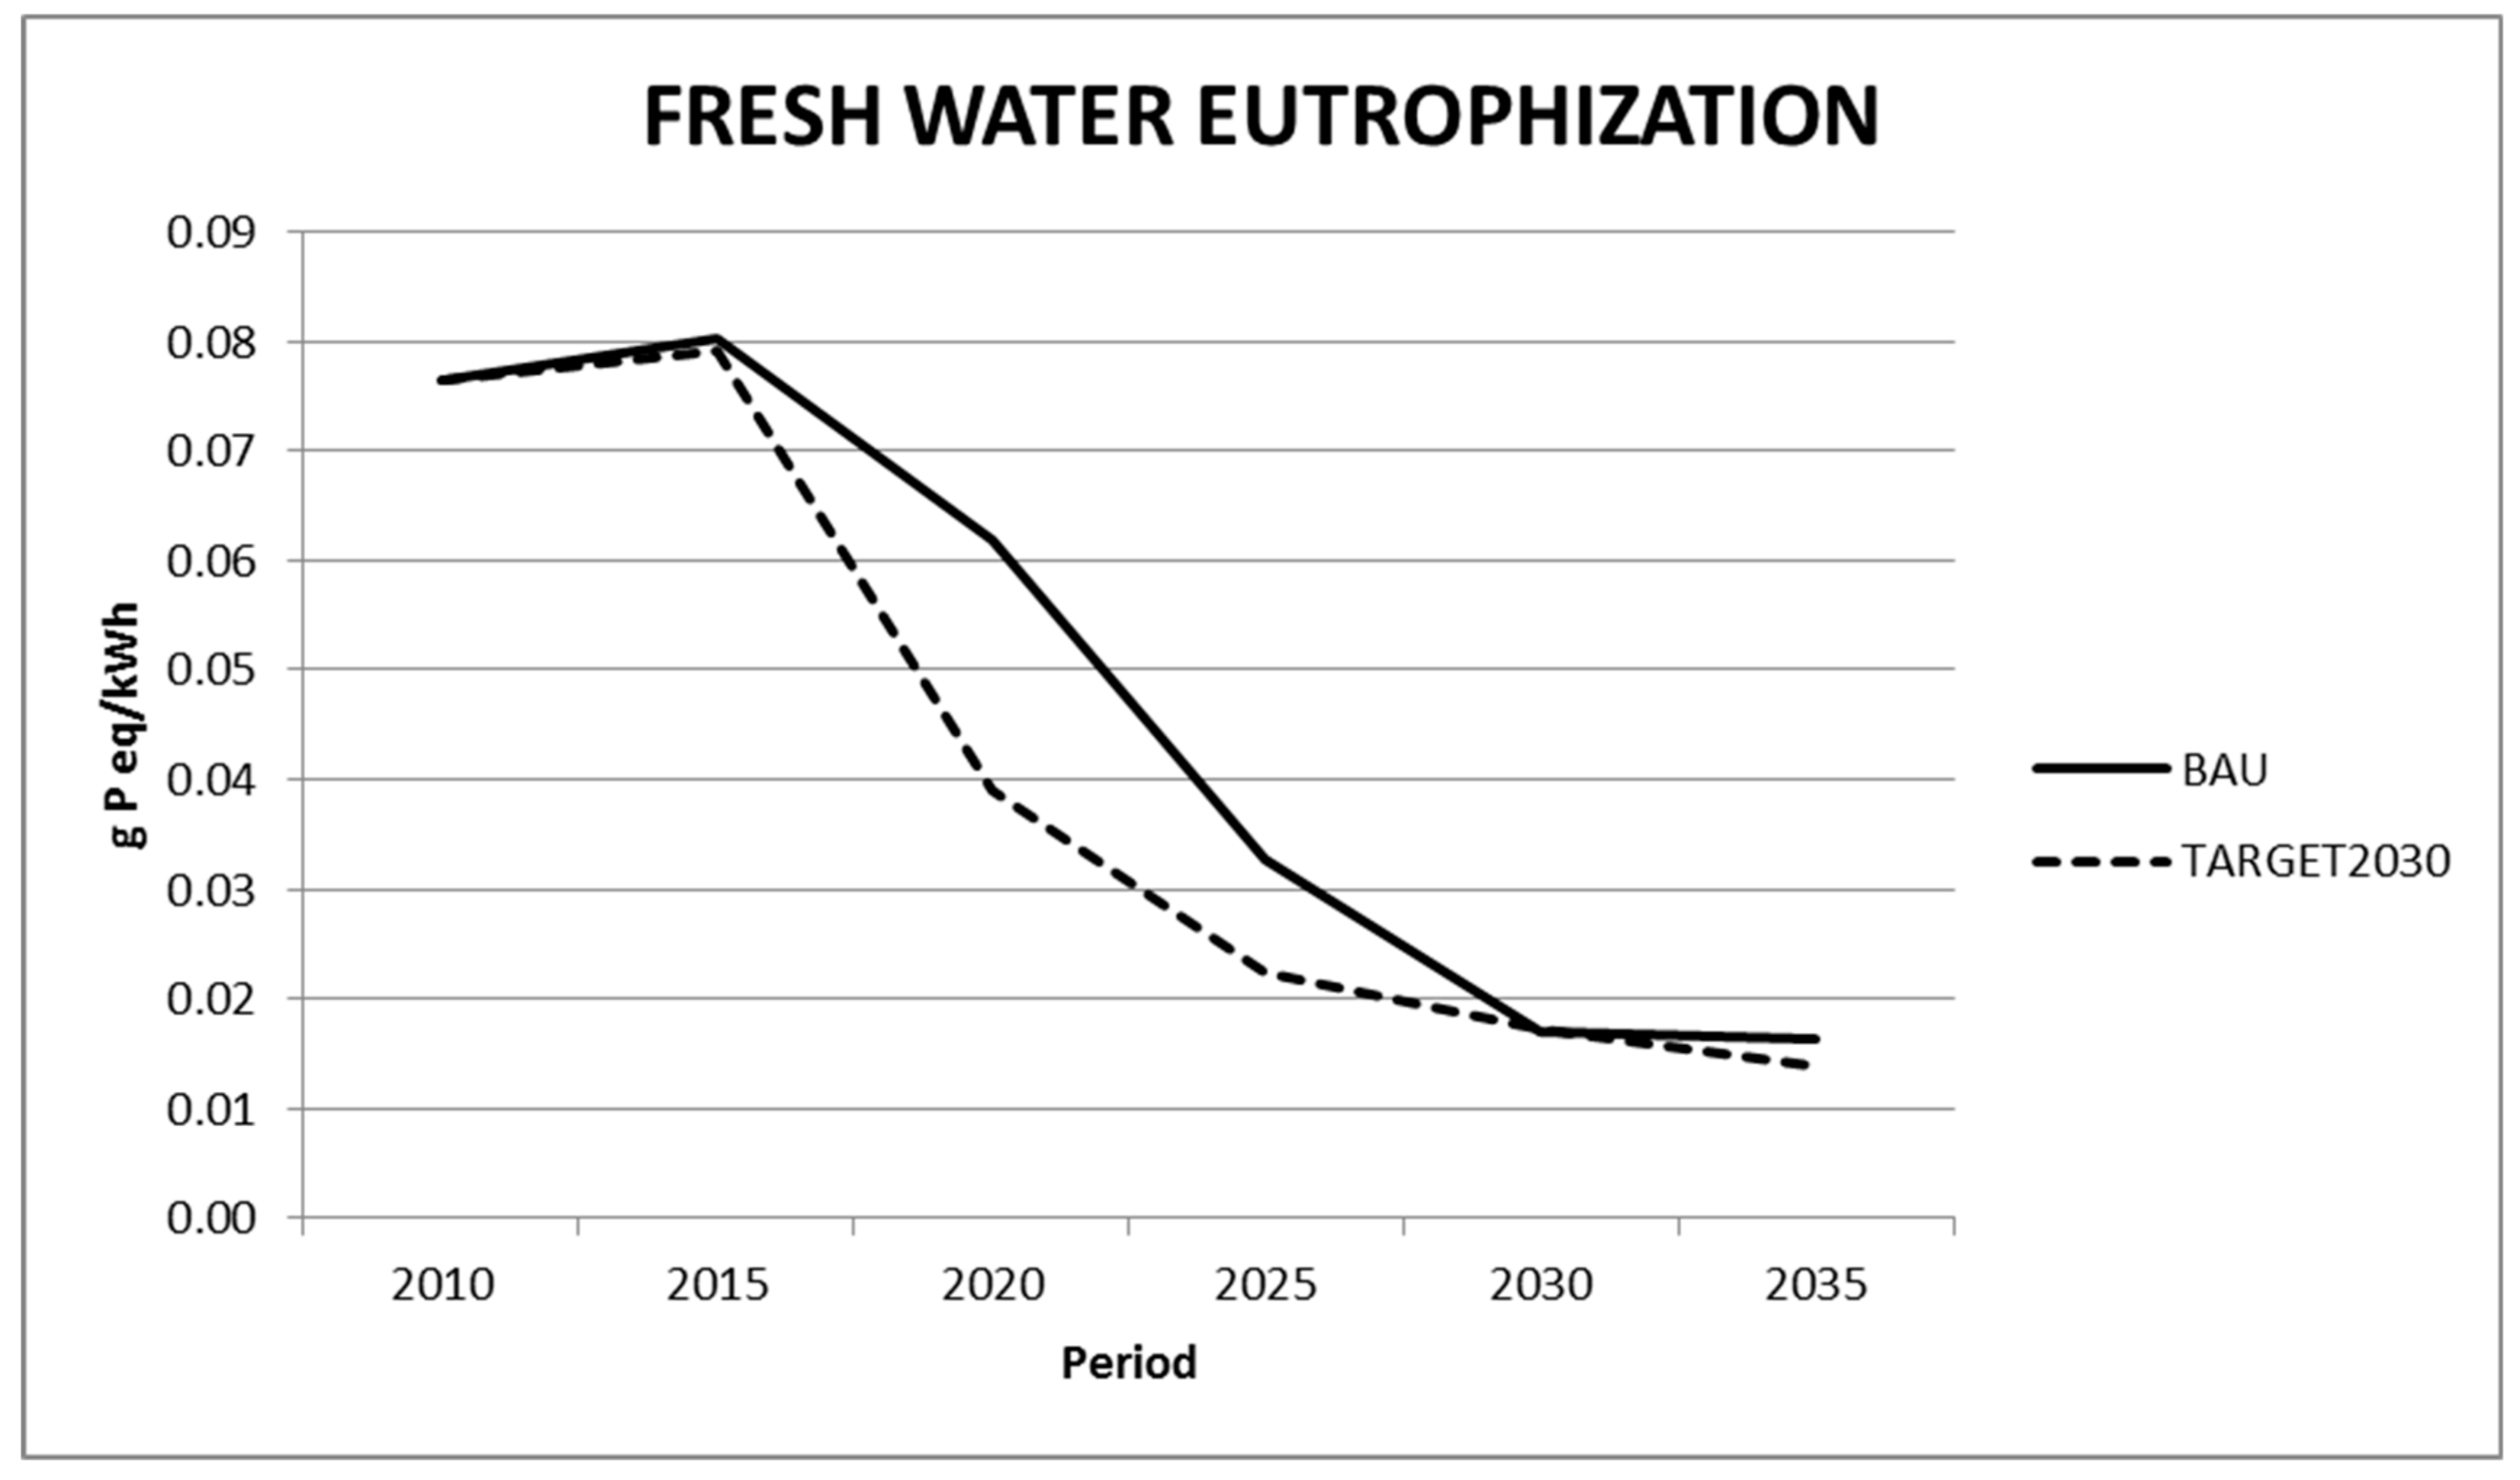
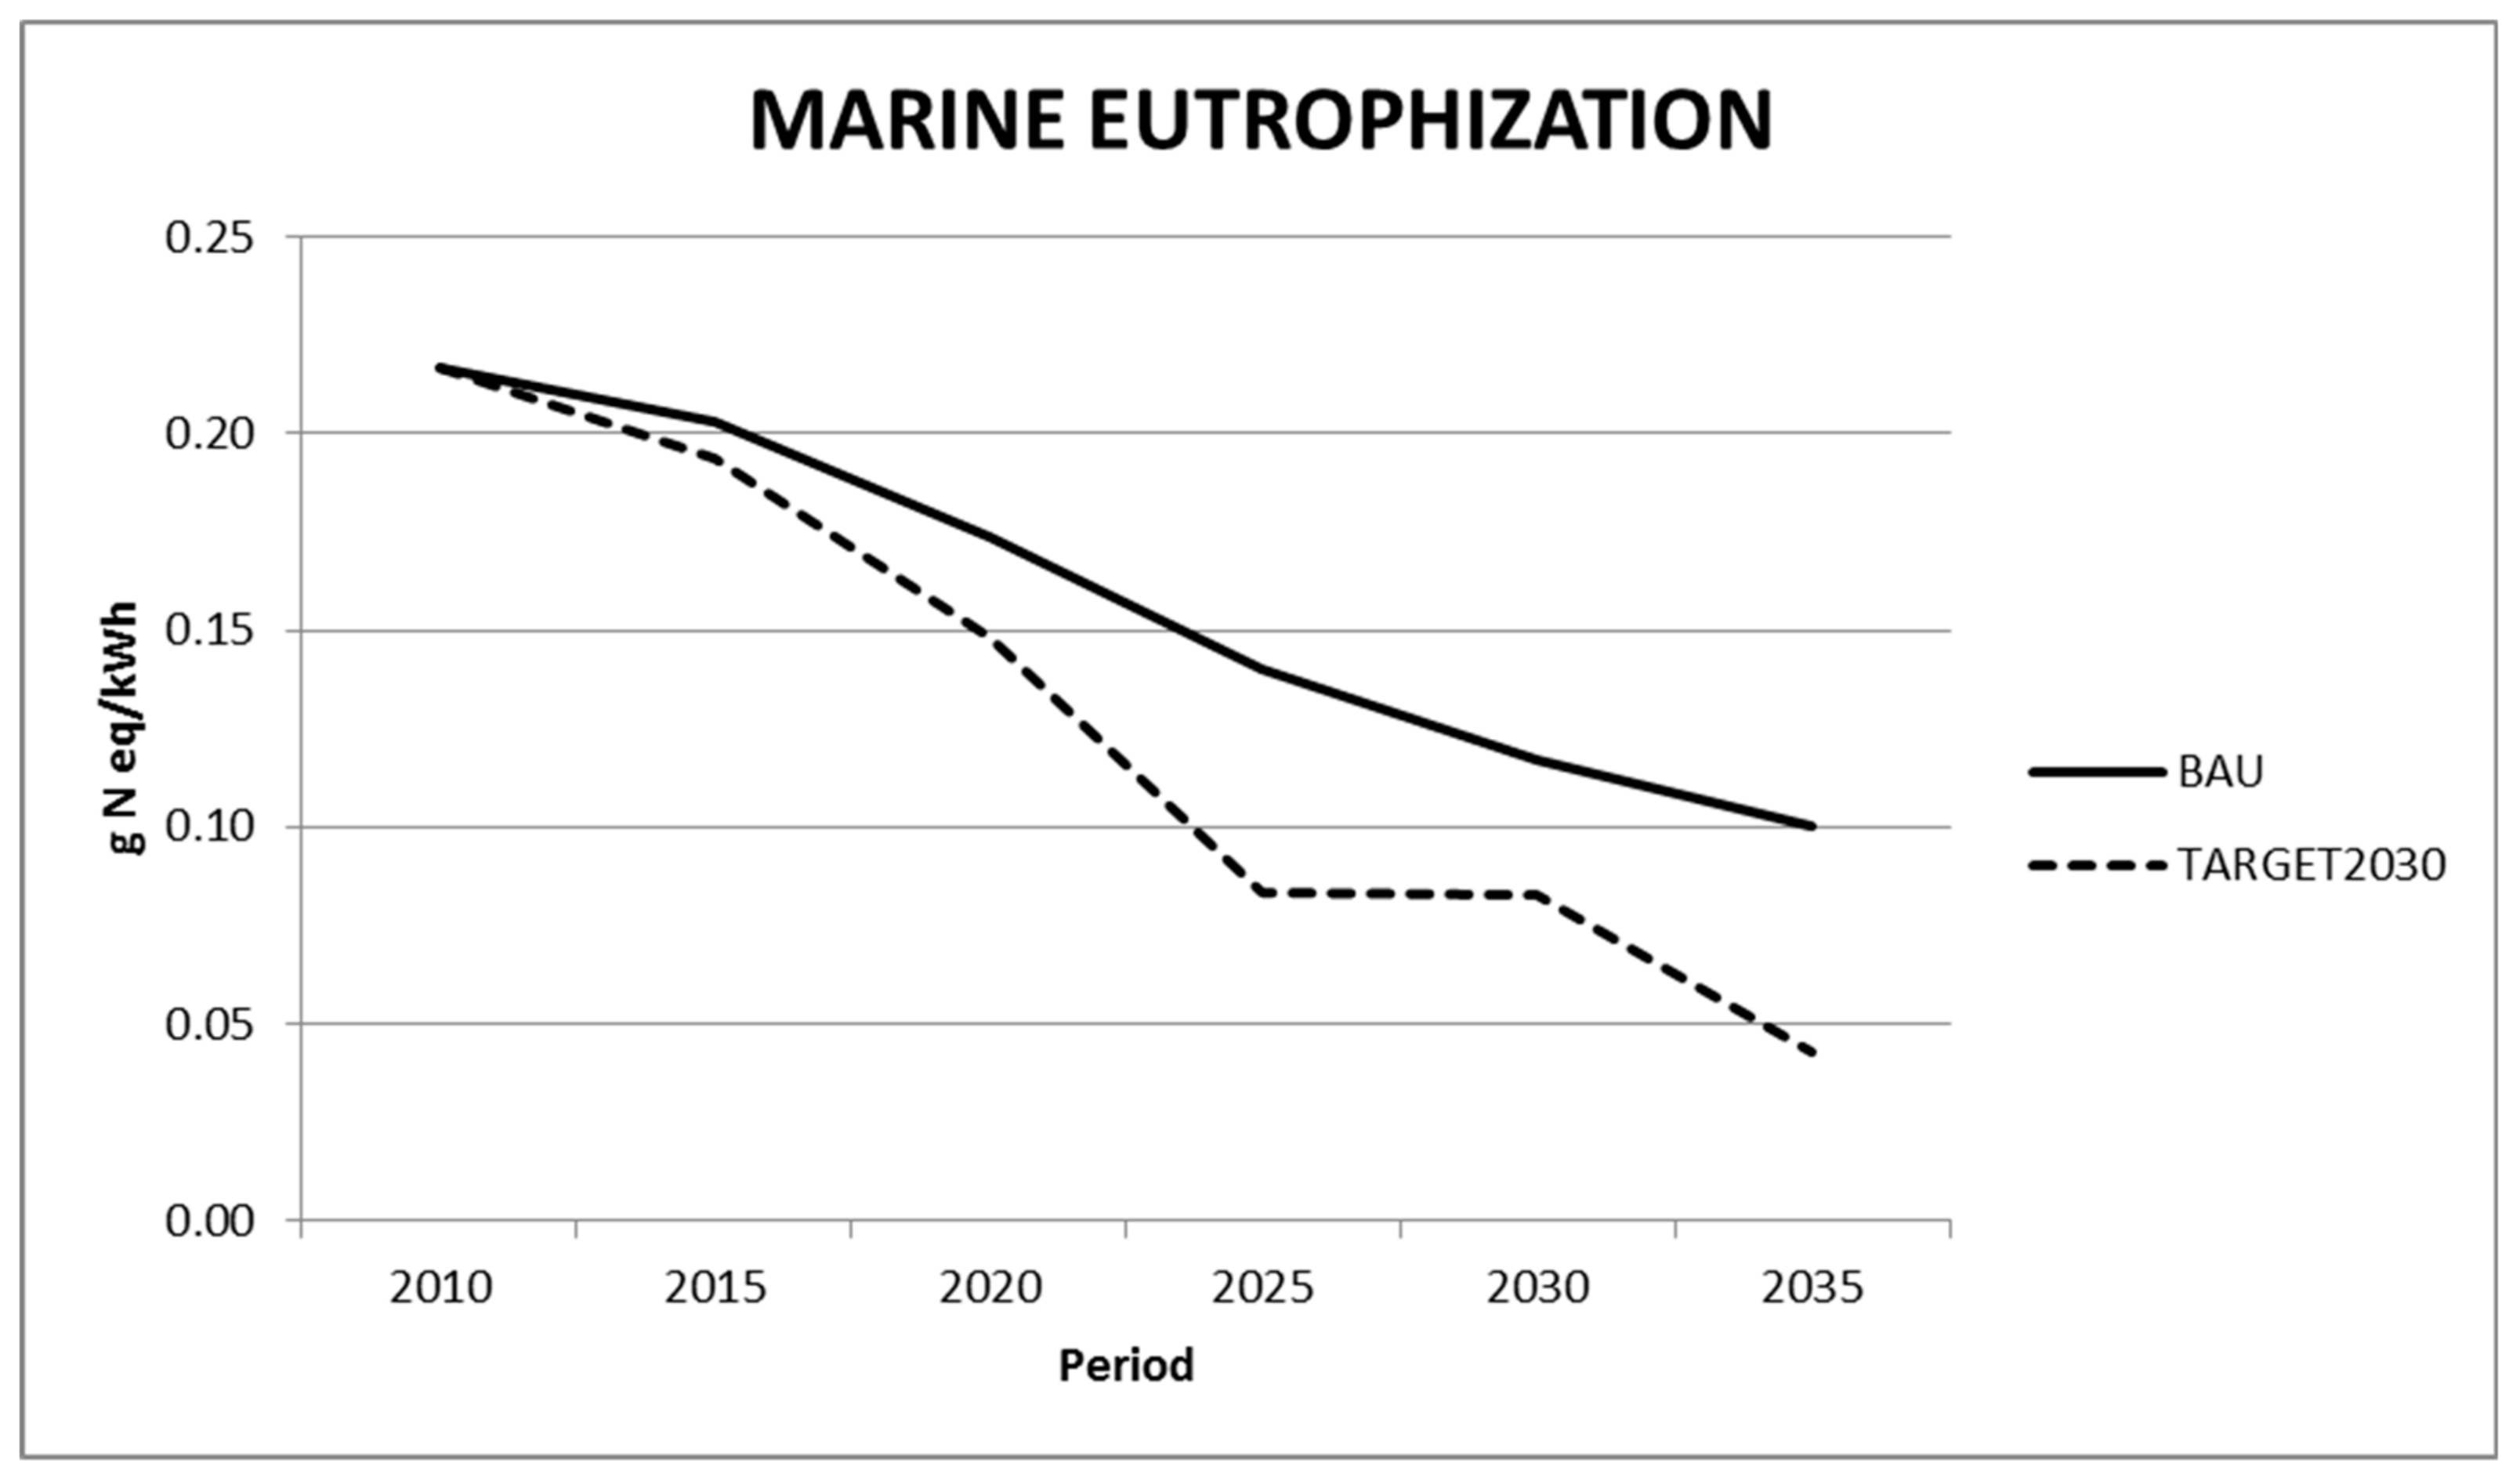
3.3.2. Impacts on Eutrophication

Eutrophication impacts -either terrestrial, fresh water or marine—also follow a decreasing trend in the two analyzed scenarios. In general, the most decarbonized scenario (TARGET2030), also shows the lowest eutrophication impacts. The dynamic evolution of these impacts is shown in Figure 6, Figure 7 and Figure 8. Although comparisons with results published in the literature are difficult, these results are consistent with those found by [36,37,38], however found that eutrophication impacts in some scenarios with carbon taxes increased as natural gas was replaced by renewables. These findings are not happening in our considered scenarios even though the same substitution is taking place.
Detailed contributions of each technology to the total impact are shown in Tables S2–S4 in the Supplementary Information section.
Terrestrial and marine eutrophication are mainly caused by coal, gas and oil technologies. Since these technologies are replaced by renewables, the eutrophication impacts decrease. As expected, this trend is more noticeable in the strictest decarbonization scenario (TARGET2030) in which a higher penetration of renewables takes place. On the contrary, fresh water eutrophication is mainly caused by coal technologies and as coal disappears from the electricity supply system in both scenarios in a similar rate, so does the evolution of the impacts.
The EU has also a long-term objective of not exceeding critical loads for nutrient nitrogen to reduce terrestrial eutrophication and avoid nutrient imbalances. In 2000, the whole Spanish territory showed exceedances of critical loads which, despite the observable improvements, still remained in 2010 [62].
Eutrophication of rivers, reservoirs and lakes in Spain is an important problem due to the semiarid conditions of the territory. Eutrophication affects both the quality of water for irrigation purposes as well as for human consumption but also has an adverse effect on the fauna. Also in this case, climate and energy policies are expected to strength the efforts to reduce the eutrophication loads into our fresh water bodies.

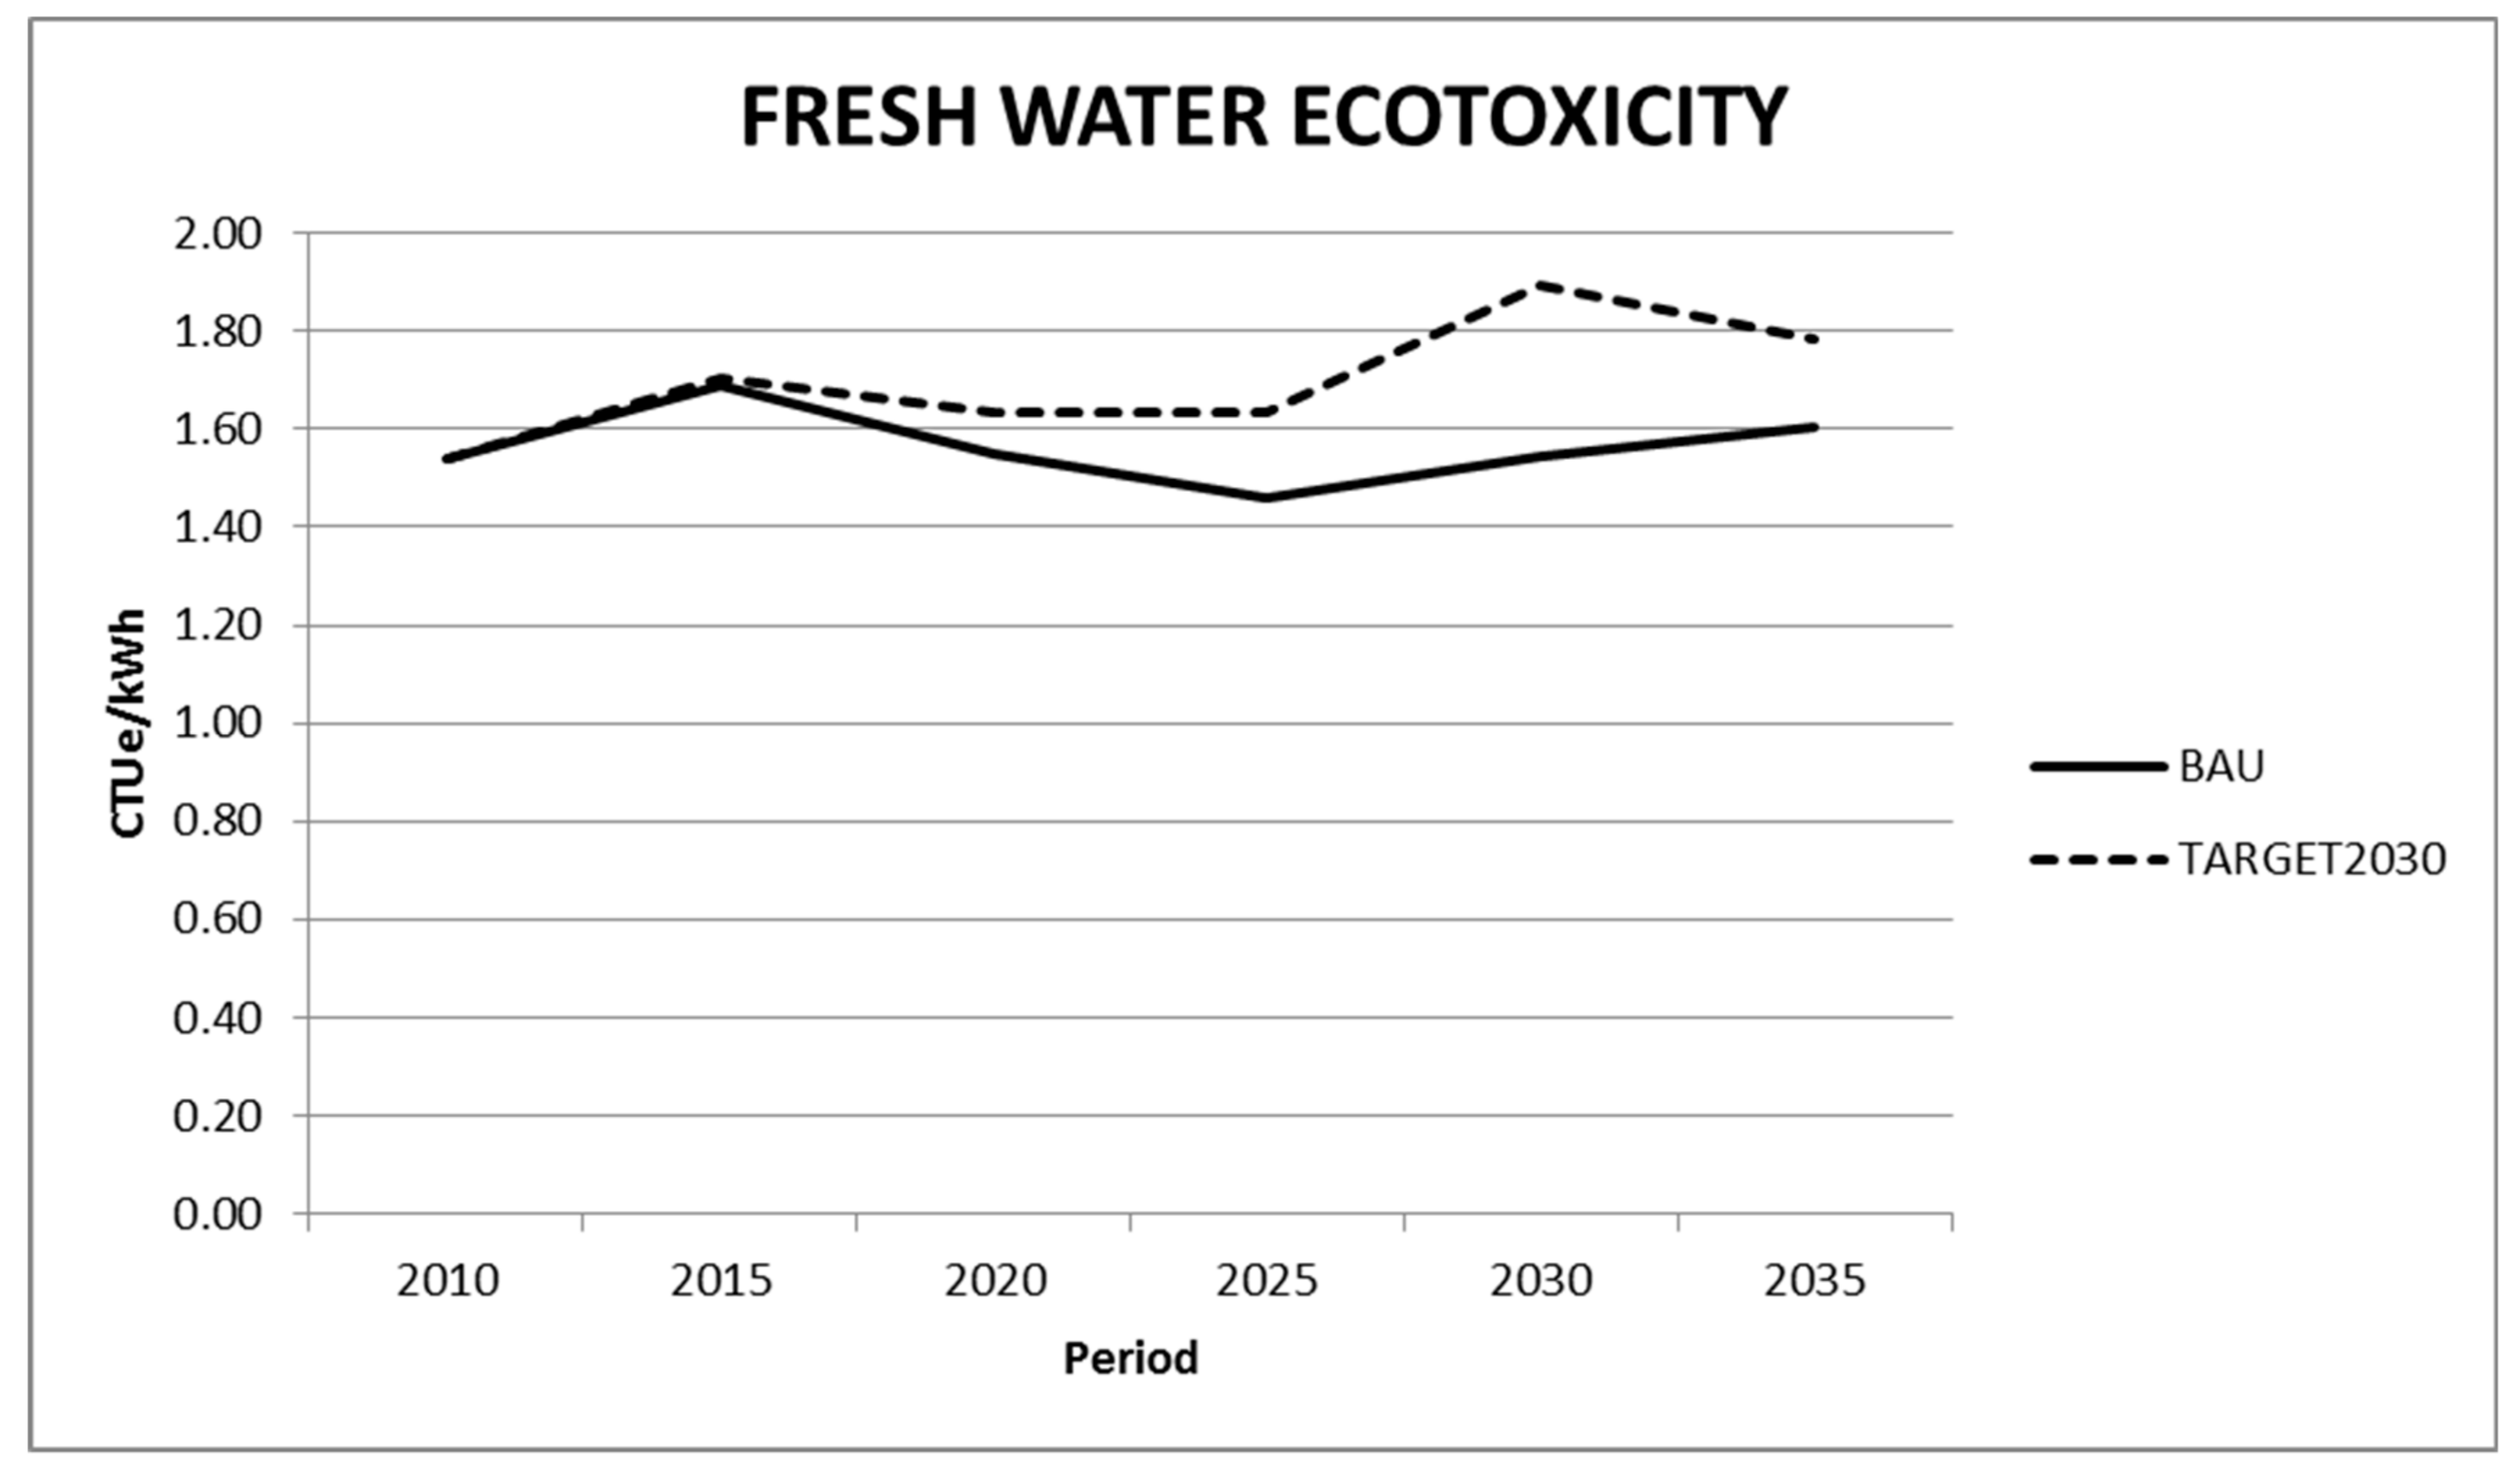
3.3.3. Impacts on Aquatic Ecotoxicity

Fresh water ecotoxicity impacts tend to rise in both scenarios but especially in the most decarbonized one with 4% increase in the BAU scenario and 16% increase in the TARGET2030 (see Figure 9). In the BAU scenario, impacts tend to decrease from 2015 to 2025 due to the reduction in coal consumption. As shown before, coal electricity aquatic ecotoxicity impacts are linked to heavy metals emissions from mining processes. After 2025, the increase in wind power first and photovoltaics later, drive the observed increase in ecotoxicity impacts. In the TARGET2030 scenario, the impacts originated by the higher rate of penetration of wind and photovoltaics, cancels out the reduction of ecotoxicity impacts driven by the decrease in coal consumption. Aquatic ecotoxicity impacts of wind and solar PV technologies are linked to the waste management processes of these technologies. This type of result has not been found in the literature. The reason behind these results can be found in the much higher penetration of wind and solar PV in the scenarios considered in this work. In the case of [36] for example, who analyzed the aquatic ecotoxicity impacts of the IEA’s Bluemap scenario [63], the penetration of wind and solar PV at the end of the period (2050) was 11% and 16% respectively while, in our case, a much larger scale penetration of wind (28%) and solar PV (13–20% depending on the scenario) is considered. Ecotoxicity impacts resulting from the imported electricity represent a significant part (12%) of the total impacts in the TARGET2030 scenario. This electricity, imported from France, has an increasing share of wind and solar PV electricity in the mix.
Stricter policies regulating the discharge of toxic compounds to water bodies should be put in place in order to reduce the adverse impacts of renewable penetration anticipated in this work.

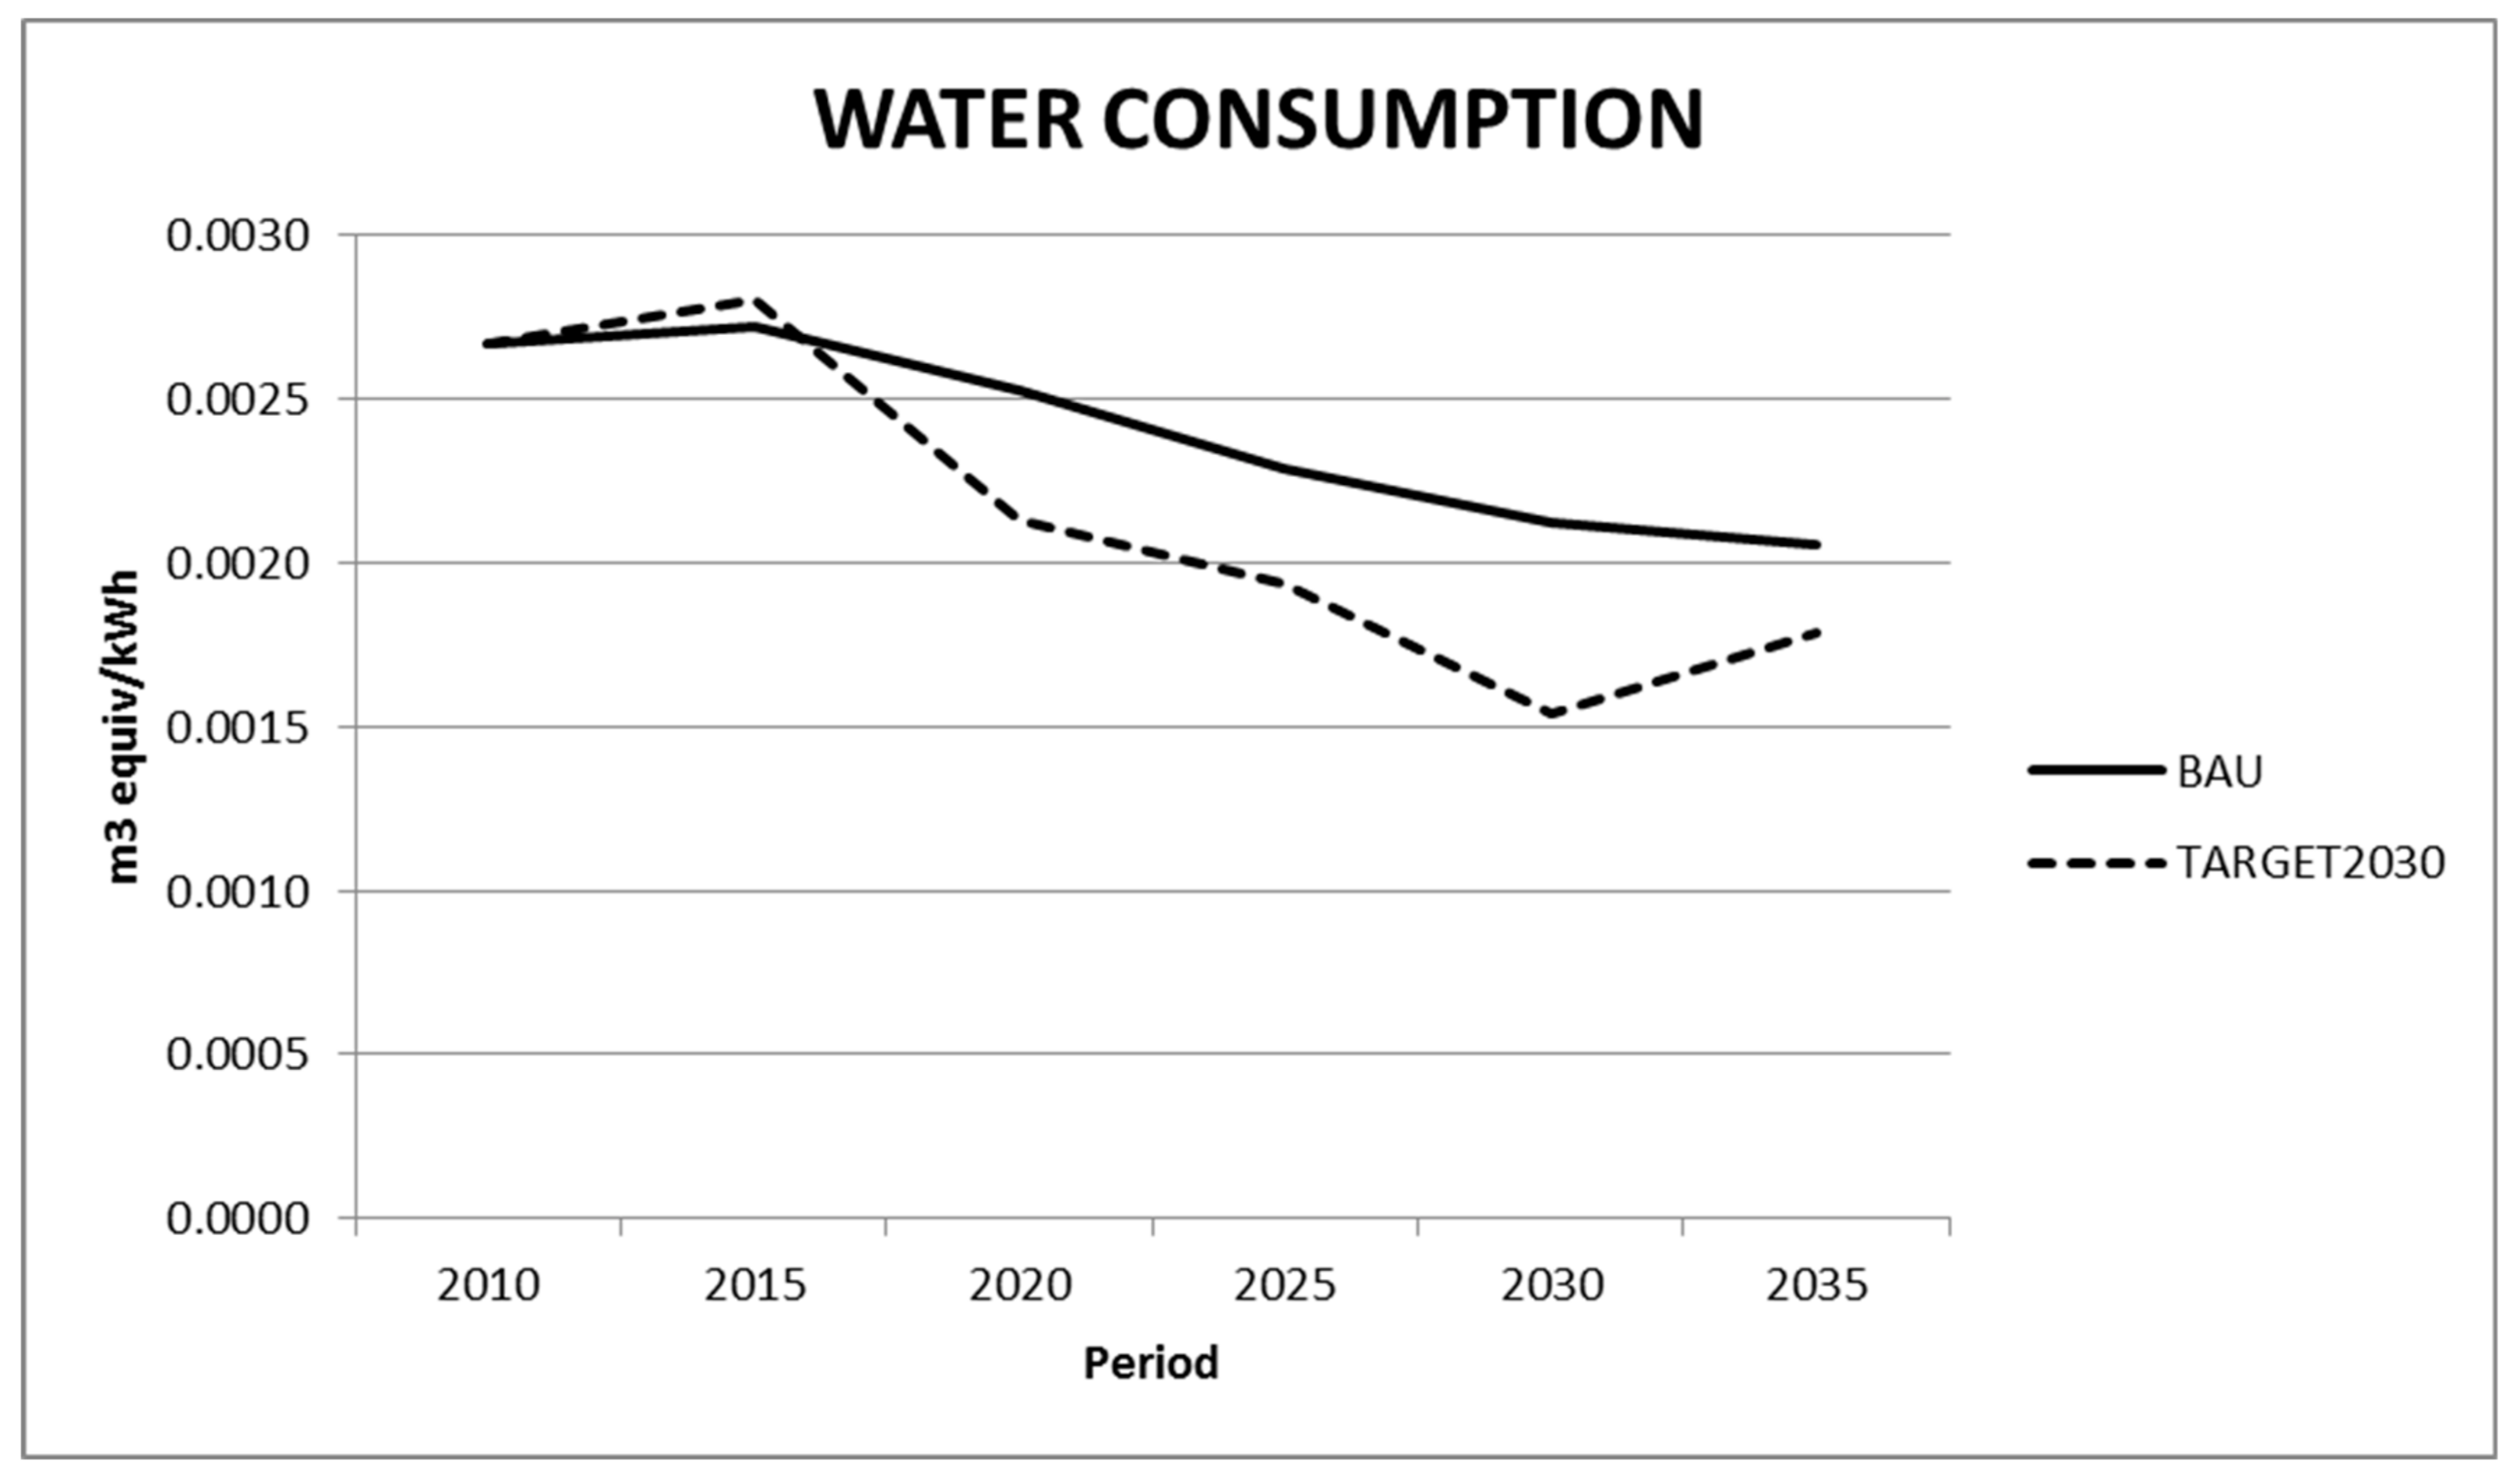
3.3.4. Impacts on Water Consumption

Water consumption per kWh is reduced both in the BAU scenario and in the TARGET2030 one by 23% and 33% respectively (Figure 10). In the BAU scenario, as the coal share in the electricity mix decreases, the relative importance of water consumption due to nuclear energy increases, being this technology the one that contributes the most to this impact. In the scenario TARGET2030, the contribution of nuclear energy to water consumption is also important up to 2025 when the technology disappears from the electricity mix. In the last periods of this scenario, the share of the impact on water consumption associated to solar photovoltaic and solar thermal electricity increases. The effect of imported electricity on water consumption is also important in this scenario. These impacts are mainly caused by nuclear technologies operating in France but are produced in the French territory.
The results displayed in Figure 10 are especially relevant for a semiarid country like Spain, where increasing concerns about possible future scarcity of water in a context of uncertain climate change consequences exist. Valin and his colleagues argued that, in future scenarios, the lack of consideration of water scarcity, induced by climate change in energy planning could lead to high costs and probably the curtailment of some water intensive technologies [11]. Our results show that, thanks to the adoption of technological improvements, especially in CSP, these problems are not expected to take place since, even in a context of very high penetration of renewables technologies, water use by electricity generation is significantly reduced. To shed more light to this very important result, this impact will be further investigated in future studies by using the new impact method proposed by the Life Cycle Initiative WULCA on the Available Water Remaining (http://www.wulca-waterlca.org/project.html).

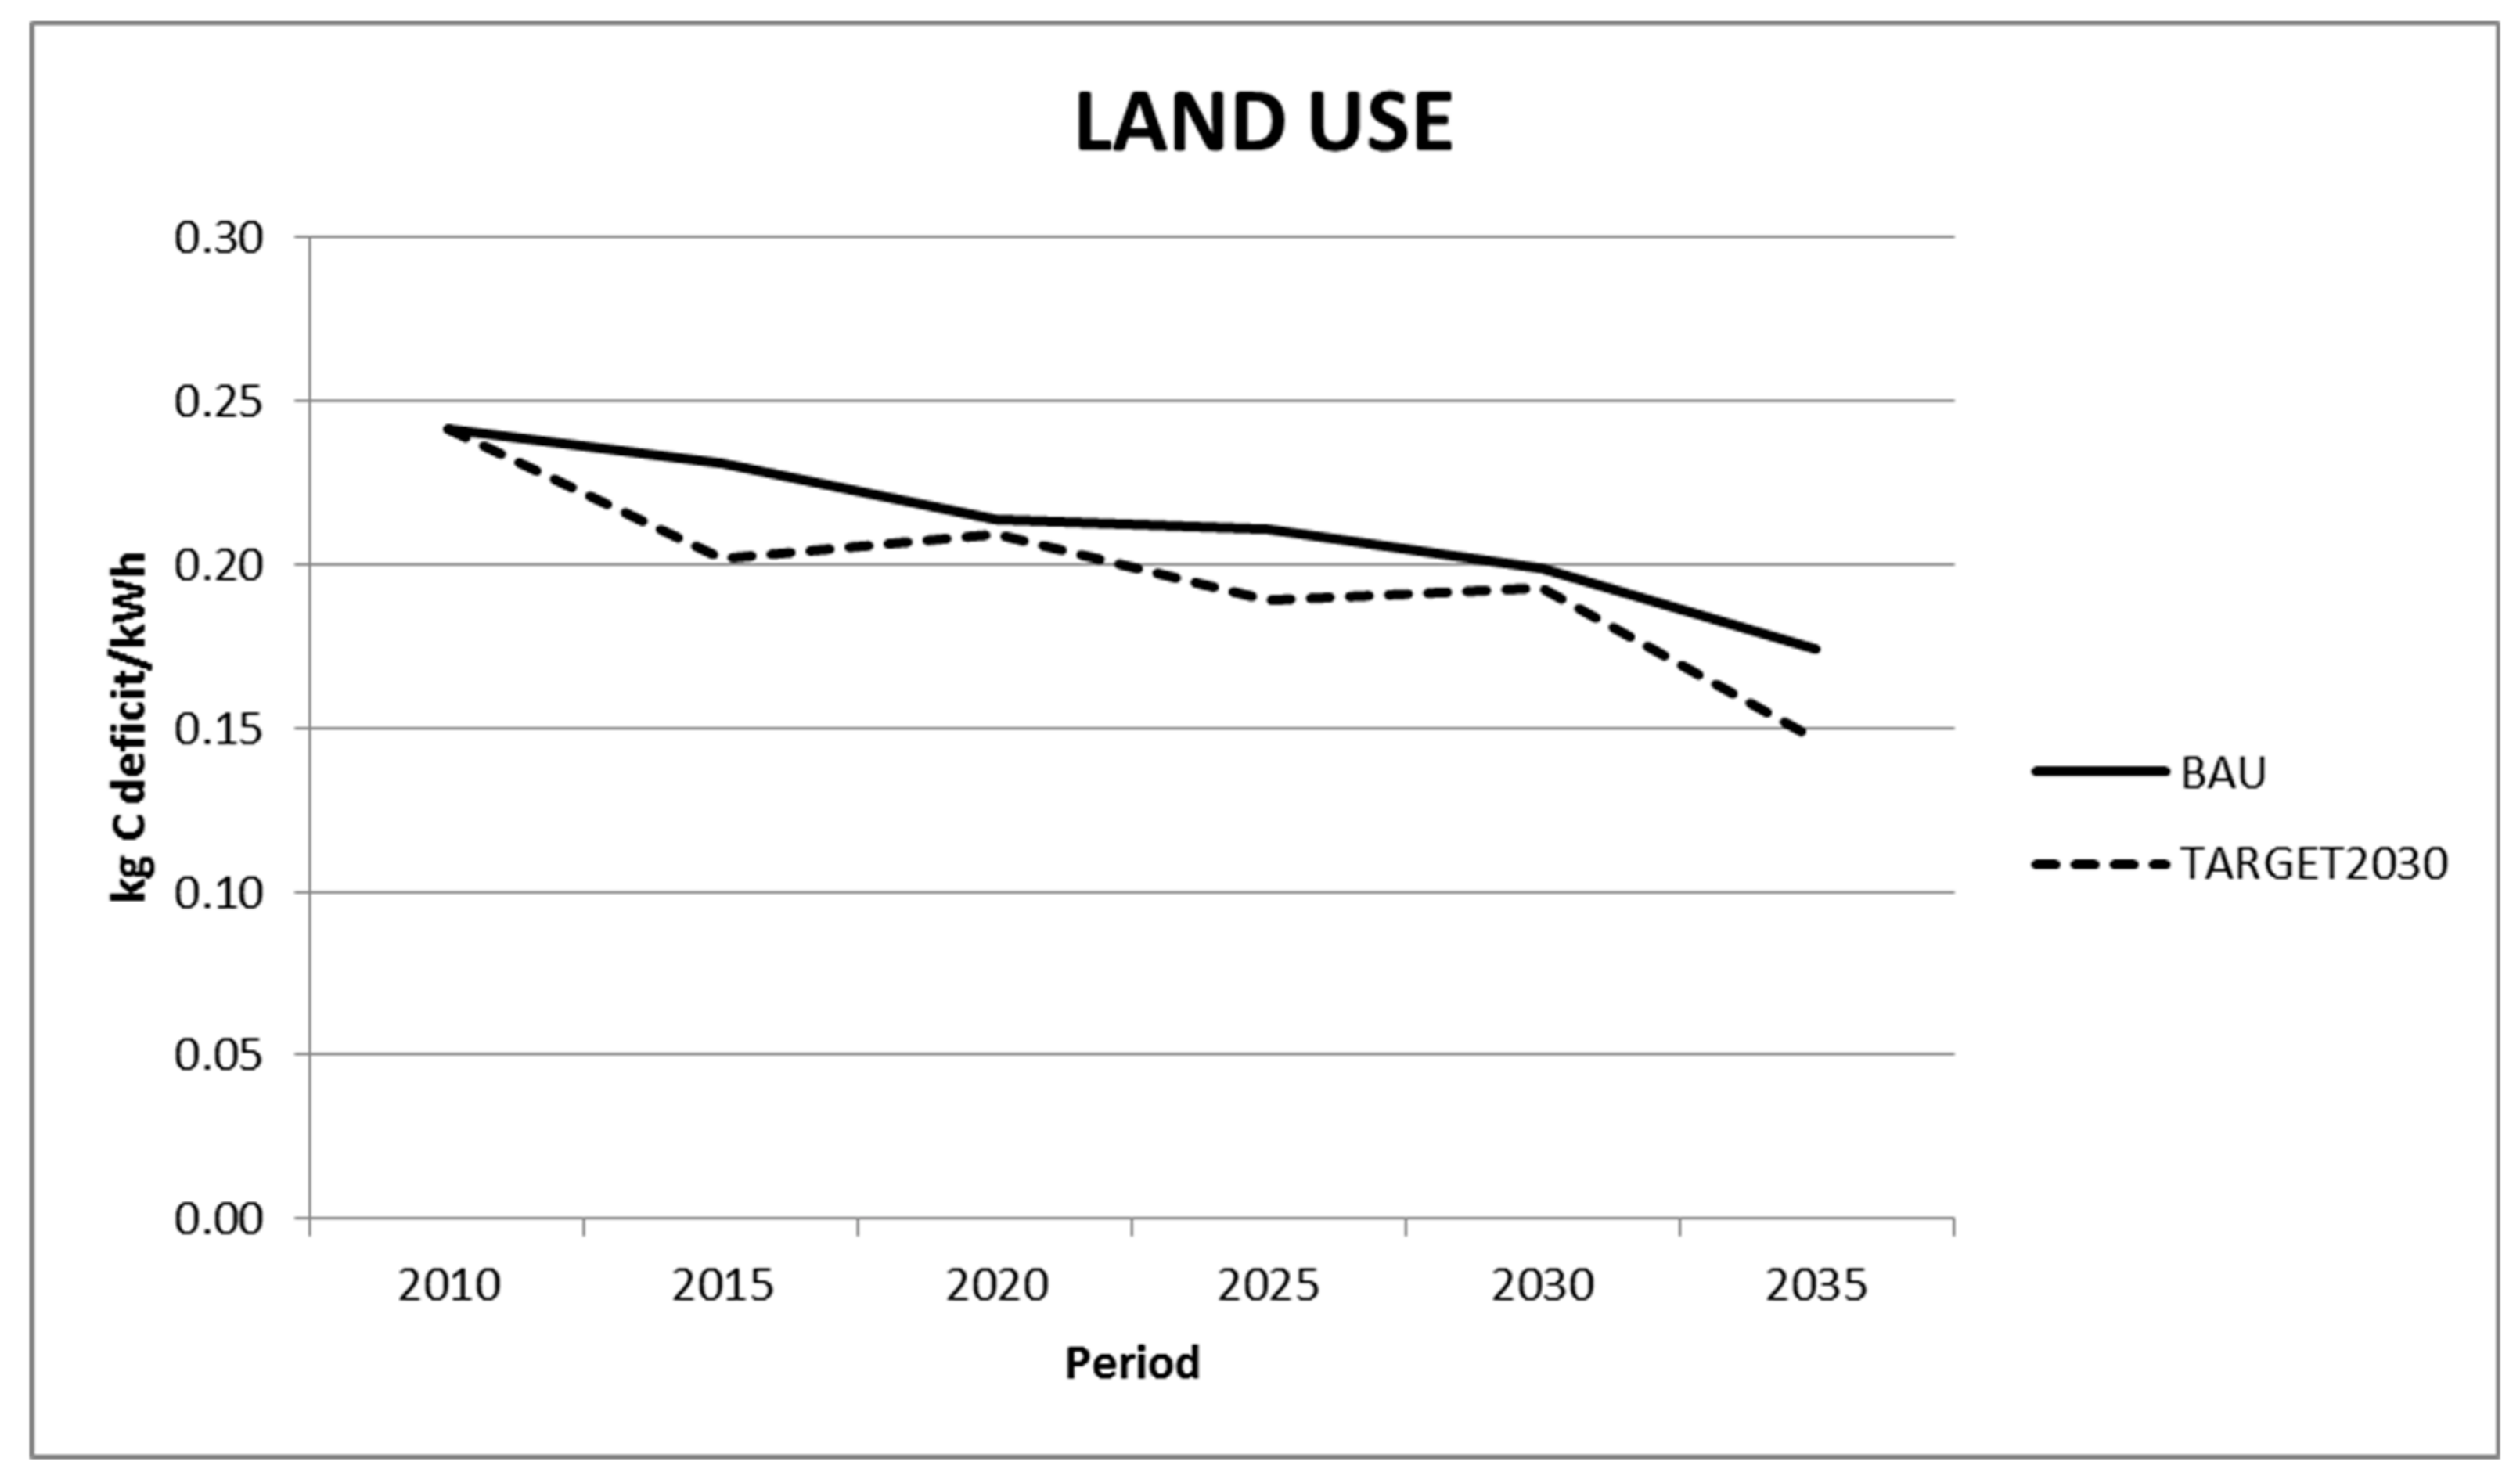
3.3.5. Impacts on Land Use

Results show a decrease in land use in both scenarios (Figure 11). In the BAU scenario, this reduction is 28% by 2035 compared to the starting year, while in the TARGET2030 scenario, the impact is reduced by 39%. At the beginning of the period, in both scenarios, land use impacts are mainly caused by coal and gas technologies. The impacts associated with coal technologies are due to land use change and the release of C associated with this change, in the mines (considering that only part of the occupation of the mine was subsequently restored). The impact associated to gas technologies mainly occurs in the extraction fields. In this sense, it is important to note that over the last few years there has been an increasing impact caused by wind and solar photovoltaic power associated to the extraction of raw materials, especially in silicon mining. Finally, it is important to highlight that these impacts do not include indirect land use change impacts (iLUC) that have demonstrated to be important in biomass technologies [63].

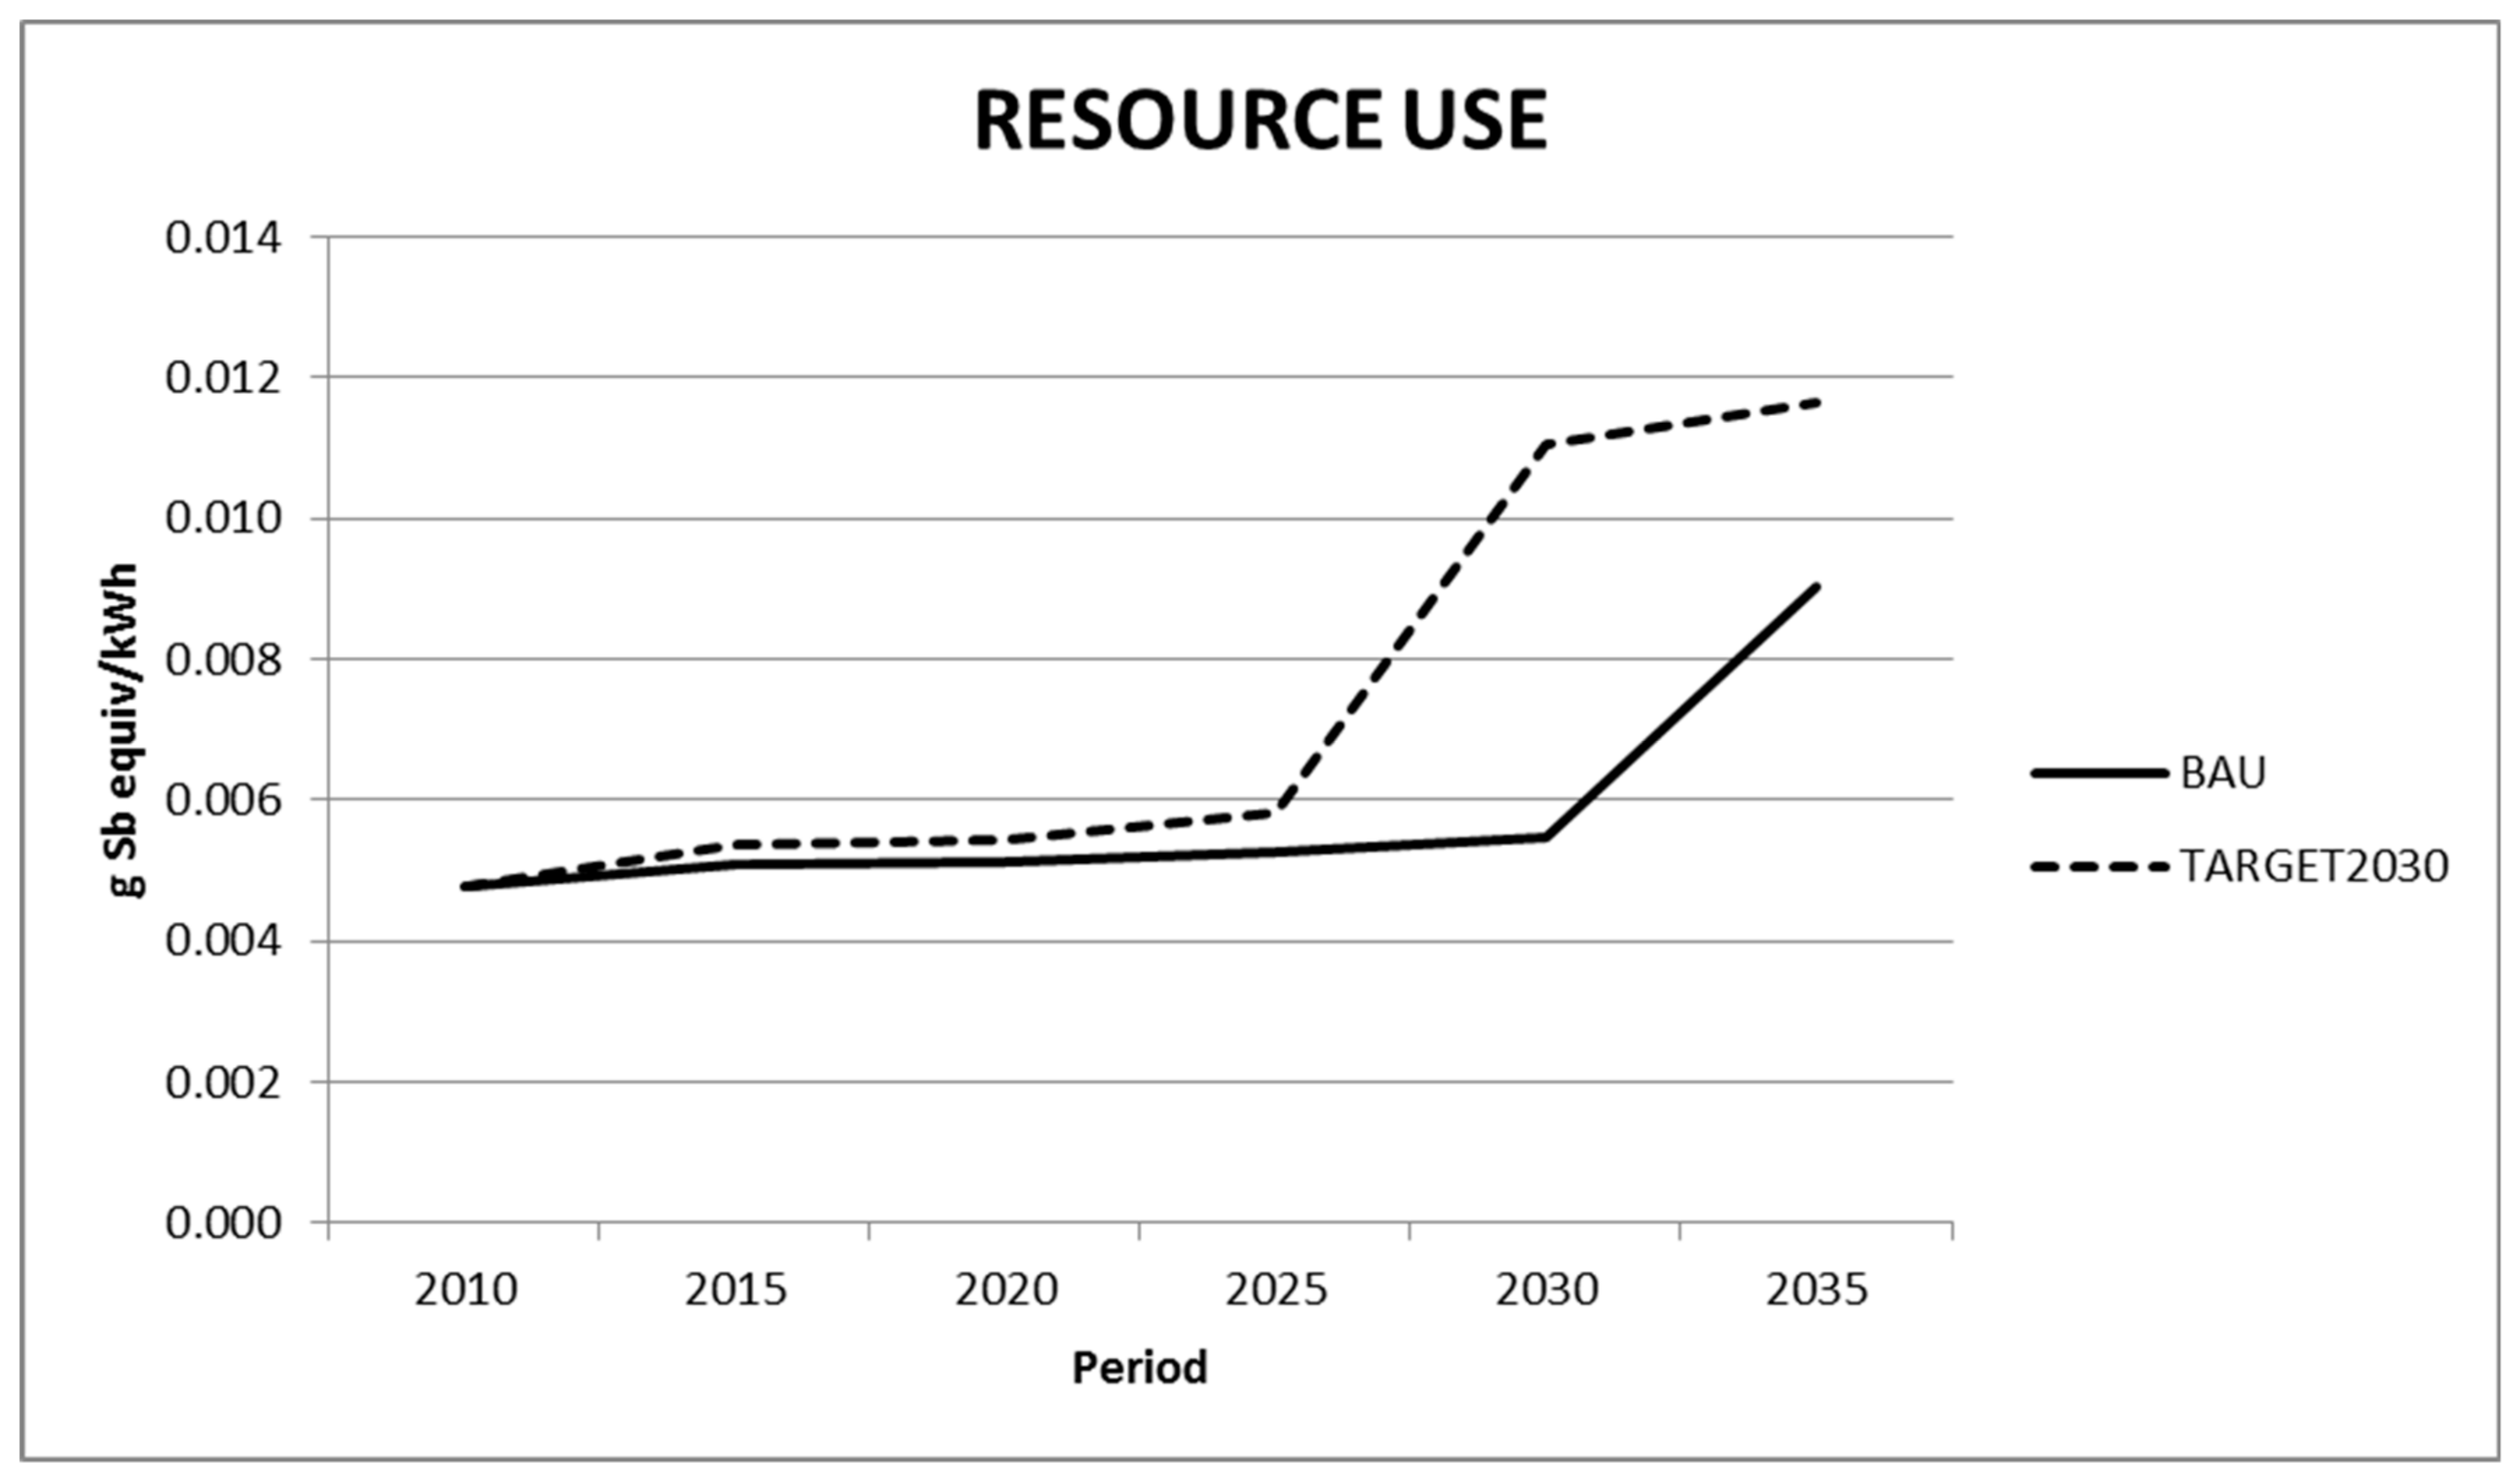
3.3.6. Impacts on Resource Use

As shown in Figure 12, the impact on resource use increases in both scenarios, although the growth is higher in the TARGET2030 scenario (140%). The main technologies contributing to this impact are solar photovoltaic and wind energy. The importance of these technologies in the TARGET2030 scenario is the highest compared to other technologies and also their contribution to the electricity mix is much higher than in BAU.
Resource use impacts of solar photovoltaic are mainly due to the consumption of silver and zinc in the manufacture of solar PV panels and those of wind are associated to the manufacture of wind turbines. Silver is the most widely used electrode material in solar photovoltaic technologies due to its unique reflective and conductive properties. Strategies to either reduce silver content in PV panels or increase the rate of silver recycling from discarded PV panels are being investigated by the industry.
As in the case of freshwater ecotoxicity, a tradeoff between the effect of energy and climate policies and resource conservation is observed. R + D + i efforts are needed to decrease the use of scarce materials by wind and solar PV technologies and increase the recyclability of the materials used.

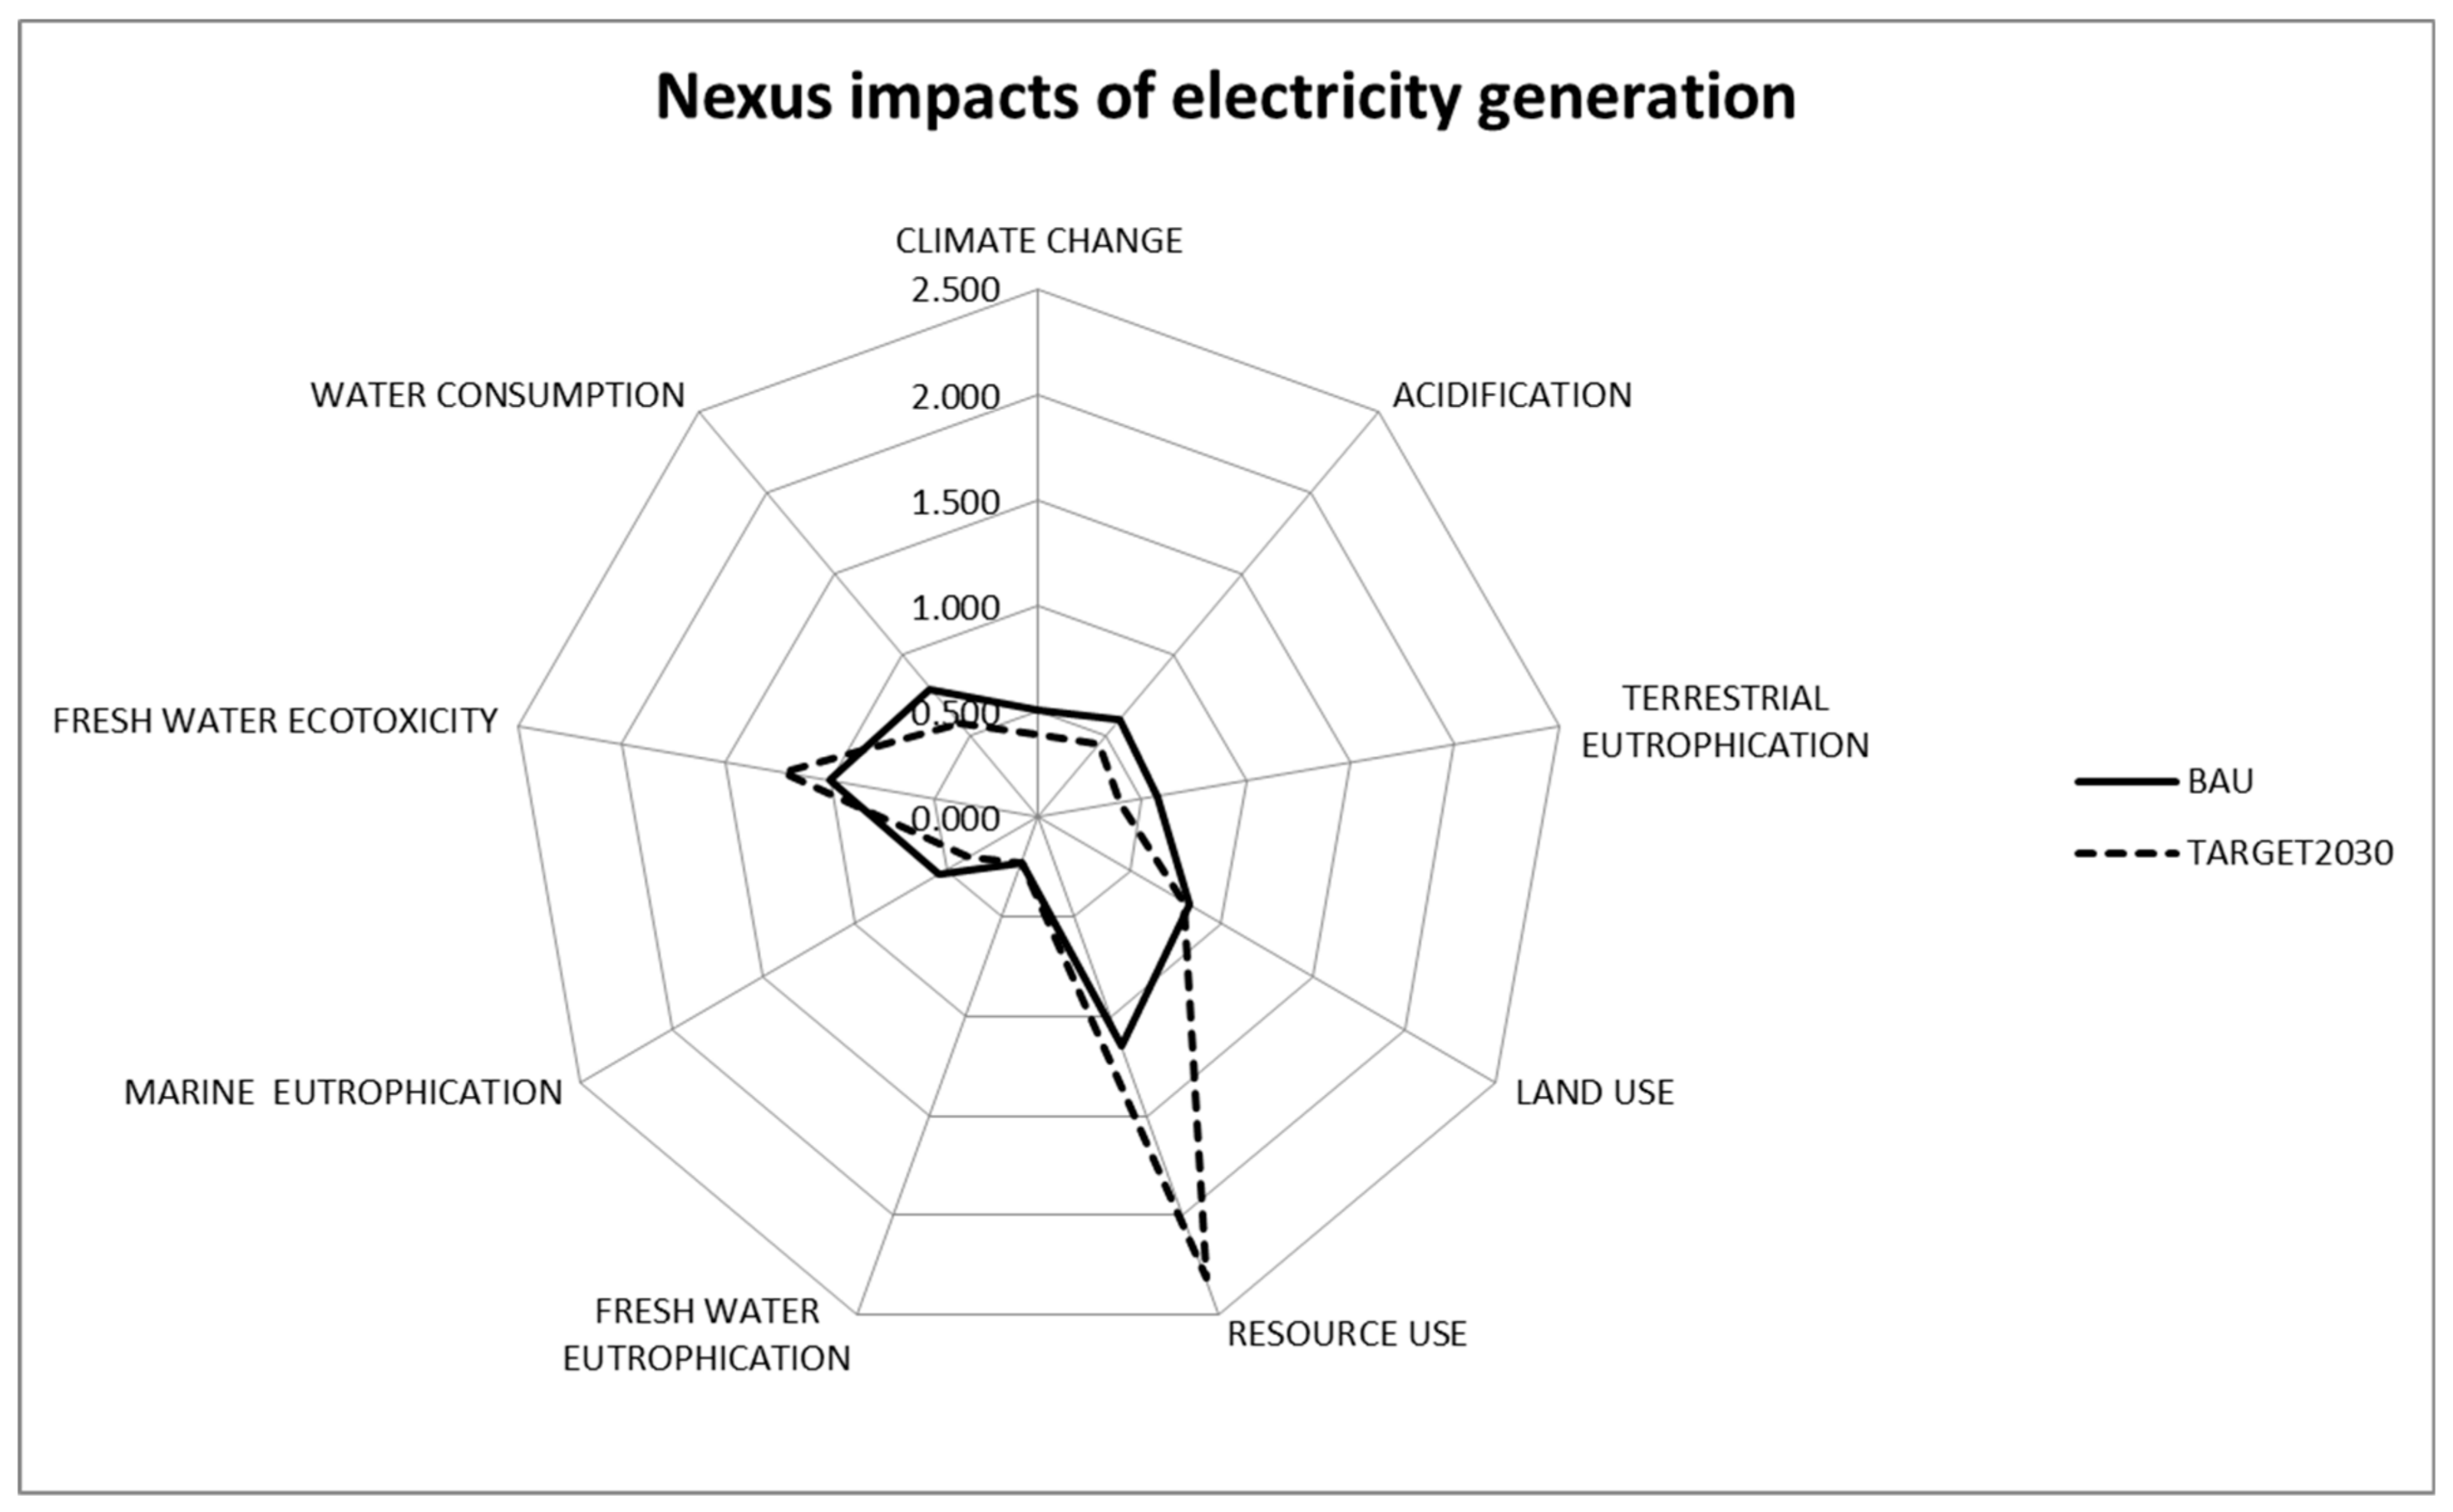
3.3.7. Overall Impacts on the Nexus

Figure 13 below shows the quantified impacts on the WEL nexus from the electricity production by 2030 in both scenarios compared to those produced at the beginning of the modelling period. It becomes evident that, although most of the nexus impacts are reduced, the attainment of GHG emissions reductions are accompanied by the increase in two of the selected indicators for the nexus analysis, namely fresh water ecotoxicity and resource use. It is particularly striking that resource use impacts more than double in 2030 compared to 2010 in TARGET2030 scenario.

4. Conclusions

Results from this work show that soil acidification and eutrophication impacts—either terrestrial, fresh water or marine—follow a decreasing trend in the two analyzed scenarios, mainly due to phase out of coal electricity technologies, which are compensated by the penetration of renewables. In most impact categories analyzed in this work, the most decarbonized scenario (TARGET2030) shows the lowest values.
The impacts on land use, measured in terms of loss of C due to land use change, follow a downwards pattern in both scenarios. Despite the increased penetration of renewable energies, this downward trend is slightly more remarkable in the TARGET2030 scenario. According to this result, the capacity of the territory to support food production will not be hindered in any of the scenarios.
Water consumption per kWh is reduced in both the BAU scenario and in the TARGET2030 scenario by 23% and 33% respectively. This result demonstrates that, even in a context of very high penetration of renewable technologies, water use by electricity generation is significantly reduced. Water withdrawal from hydropower technologies will not increase either since penetration of these technologies remains stable in both scenarios.
In the above mentioned impacts, a clear synergy between the climate mitigation polices and the conservation of water, land and ecosystems can be observed. However, aquatic ecotoxicity impacts tend to rise in both scenarios being this trend higher in the most decarbonized scenario with 4% increase in the BAU scenario and 16% increase in the TARGET2030. The increase in wind and solar PV drives the observed increase in ecotoxicity impacts. These impacts are linked to the waste management processes of these technologies. Although solar PV and wind are already mature technologies, there is a lack of awareness concerning the best available technologies to handle the end of life stage. Few studies have been able to collect enough real information to study this phase and further research is needed to better describe and take into consideration the real performance of the whole life cycle [64].
Similarly, regarding the use of resources, both scenarios follow an upwards pattern mainly driven by the increase in photovoltaic generation. This impact is linked to the use of silver and zinc in the manufacture of the modules. These problems can be tackled by either reducing the content of silver in PV panels or by increasing the rate of silver recycling from discarded PV panels.
Although comparisons with results published in the literature are difficult—in the sense that different energy systems have different fossil and renewable technologies penetration rates and that the decarbonization pathways are not always based on the same set of technologies—these results are consistent with those found by others [37,54].
In conclusion, based on the results of this work, it can be said that decarbonization scenarios tend to reduce all impacts on the WEL nexus with the exception of aquatic ecotoxicity and use of resources, and that this reduction is generally more marked in the most decarbonized scenarios.
Polices aimed at promoting R+D+i development to decrease the identified impacts on ecotoxicity and resource consumption of wind and solar PV generation are needed in order to minimize the negative consequences associated to the increased share of these technologies in current and future climate change mitigation strategies. In this sense, some key impacts related to renewable energy technologies are expected to decrease in the future as a consequence of the promotion of the EU Action Plan for the Circular Economy, which will contribute to “closing the loop” of product lifecycles through greater recycling and re-use of materials. Similarly, it is also recommended to investigate and promote other renewable technologies that avoid or minimize such adverse impacts.

Supplementary Materials

The following are available online at https://www.mdpi.com/1996-1073/11/5/1203/s1, Table S1: Acidification impact of the Spanish electricity mix in two scenarios (molc H+ equiv), Table S2: Terrestrial eutrophication impacts of the Spanish electricity mix in two scenarios (molc N equiv), Table S3: Fresh water eutrophication impacts of the Spanish electricity mix in two scenarios (kg P equiv), Table S4: Marine eutrophication impacts of the Spanish electricity mix in two scenarios (kg N equiv), Table S5: Fresh water ecotoxicity impacts of the Spanish electricity mix in two scenarios (CTU equiv.), Table S6: Water consumption impacts of the Spanish electricity mix in two scenarios (m3 equiv), Table S7: Land use impacts of the Spanish electricity mix in two scenarios (kg C deficit), Table S8: Resource use impacts of the Spanish electricity mix in two scenarios (kg Sb equiv).

Author Contributions

All the authors conceived the work. Y.L. and C.D.L.R. undertook literature reviews. Y.L. and H.C. worked and provided the results with the energy model. Y.L. and C.D.L.R. worked and provided the results with the LCA. All the authors analysed the data, prepared the writing-original draft, participated in the writing-review and editing, and worked on the discussion.

Acknowledgments

This paper has been elaborated using the information generated by the authors during the development of the Research Project “Caracterización del nexo agua-energía-tierra en España” funded by Fundación Canal de Isabel II during 2014 and 2015.

Conflicts of Interest

The authors declare no conflict of interest.

References

  1. European Commission (EC). Decision No 406/2009/EC of the European Parliament and of the Council of 23 April 2009 on the Effort of Member States to Reduce Their Greenhouse Gas Emissions to Meet the Community’s Greenhouse Gas Emission Reduction Commitments up to 2020; European Commission (EC): Brussels, Belgium, 2009. [Google Scholar]
  2. European Commission (EC). Directive 28/2009/EC of the European Parliament and of the Council of 23 April 2009 on the Promotion of the Use of Energy from Renewable Sources and Amending and Subsequently Repealing Directives 2001/77/EC and 2003/30/EC; European Commission (EC): Brussels, Belgium, 2009. [Google Scholar]
  3. European Commission (EC). Energy. Roadmap 2050. Impact Assessment and Scenario Analysis. Commission Staff Working Paper Impact Assessment. Accompanying the Document Communication from the Commission to the Council, the European Parliament, the European Economic and Social Committee and the Committee of the Regions; Energy Roadmap 2050 {COM(2011) 885 final}. {SEC(2011) 1566 final}. {SEC(2011) 1569 final}; European Commission (EC): Brussels, Belgium, 2011. [Google Scholar]
  4. European Commission (EC). Communication from the Commission to the European Parliament, the Council, the European Economic and Social Committee and the Committee of the Regions A Policy Framework for Climate and Energy in the Period from 2020 to 2030; {SWD(2014) 15 Final} {SWD(2014) 16 Final}; European Commission (EC): Brussels, Belgium, 2014. [Google Scholar]
  5. European Commission (EC). EU Reference Scenario 2016. Energy, Transport and GHG Emissions. Trends to 2050. 2016. Available online: https://ec.europa.eu/energy/sites/ener/files/documents/ref2016_report_final-web.pdf (accessed on 18 October 2017).
  6. Macknick, J.; Newmark, R.; Heath, G.; Hallett, K.C. A Review of Operational Water Consumption and Withdrawal Factors for Electricity Generating Technologies; Technical Report NREL/TP-6A20-50900; National Renewable Energy Laboratory: Golden, CO, USA, 2011.
  7. International Energy Agency (IEA). Water for Energy. In World Energy Outlook 2012; IEA: Paris, France, 2012; ISBN 978-92-64-18084-0. Available online: http://www.worldenergyoutlook.org/media/weowebsite/2012/WEO_2012_Water_Excerpt.pdf (accessed on 15 November 2017).
  8. Centro de Estudios y Experimentación de Obras Públicas (CEDEX). Evaluación del Cambio Climático en los Recursos Hídricos en Régimen Natural. Encomienda de Gestión de la Dirección General del Agua (MARM) al CEDEX para el Estudio del Cambio Climático en los Recursos Hídricos y las Masas de Agua; CEDEX: Madrid, Spain, 2010. [Google Scholar]
  9. Garrido, A.; Willaarts, B.; Rey, L.; López-Gunn, E. Considerations on Climate Variability and Change in Spain. In Water, Agriculture and the Environment: Can We Square the Circle; de Stefano, L., Llamas, M.R., Eds.; Taylor and Francis Group: London, UK, 2012; pp. 191–202. ISBN 978-0-203-09612-3. [Google Scholar]
  10. Khan, Z.; Linares, P.; García-González, J. Adaptation to climate-induced regional water constraints in the Spanish energy sector: An integrated assessment. Energy Policy 2016, 97, 123–135. [Google Scholar] [CrossRef]
  11. Valin, H.; Peters, D.; van den Berg, M.; Frank, S.; Havlik, P.; Forsell, N.; Hamelinck, C. The Land Use Change Impact of Biofuels Consumed in the EU. Quantification of Area and Greenhouse Gas Impacts; Project Number: BIENL13120 Commissioned and Funded by the European Commission; International Institute for Applied Systems Analysis (IIASA): Laxenburg, Austria, 2015. [Google Scholar]
  12. Hastik, R.; Walzer, C.; Haida, C.; Garegnani, G.; Pezzutto, S.; Abegg, B.; Geitner, C. Using the “Footprint” Approach to Examine the Potentials and Impacts of Renewable Energy Sources in the European Alps. Mt. Res. Dev. 2016, 36, 130–140. [Google Scholar] [CrossRef]
  13. Milner, S.; Holland, R.A.; Lovett, A.; Sunnenberg, G.; Hastings, A.; Smith, P.; Wang, S.; Taylor, G. Potential impacts on ecosystem services of land use transitions to second-generation bioenergy crops in GB. GCB Bioenergy 2016, 8, 317–333. [Google Scholar] [CrossRef] [PubMed] [Green Version]
  14. Hoff, H. Understanding the Nexus. Background Paper for the Bonn 2011 Conference: The Water, Energy and Food Security Nexus; Stockholm Environment Institute: Stockholm, Sweden, 2011. [Google Scholar]
  15. Rasul, G. Contribution of Himalayan Ecosystems to Water, Energy, and Food Security in South Asia: A Nexus Approach; International Centre for Integrated Mountain Development (ICIMOD): Kathmandu, Nepal, 2012. [Google Scholar]
  16. United Nations Economic Commission for Europe (UNECE). Water-Food-Energy-Ecosystems Nexus for Reconciling Different Uses in Transboundary River Basins—UNECE Water Convention; Draft Methodology for the Nexus Assessment for Discussion; United Nations Economic Commission for Europe (UNECE): Geneva, Switzerland, 2013. [Google Scholar]
  17. Boelee, E.; Hoa, E.; Chiramba, T. UNEP’s Engagement in the Water-Energy-Food Nexus. In Proceedings of the Conference on Sustainability in the Water-Energy-Food Nexus, Bonn, Germany, 19–20 May 2014. [Google Scholar]
  18. Hoa, E. Governing the Water-Energy-Food Nexus: Opportunities for Basin Organisations, Technical Background Document for Theme 2: “Water-Energy-Food Nexus”. In Proceedings of the First International Environment Forum for Basin Organizations, Nairobi, Kenya, 26–28 November 2014. [Google Scholar]
  19. World Economic Forum (WEF). Water Security: Water-Food-Energy-Climate Nexus; Dominic, W., Ed.; The World Economic Forum Water Initiative; Island Press: Washington, DC, USA, 2011; ISBN 978-1-59726-735-9. [Google Scholar]
  20. Food and Agriculture Organisation of the United Nations (FAO). The Water-Energy-Food Nexus at FAO, Concept Note; FAO: Rome, Italy, 2014. [Google Scholar]
  21. Food and Agriculture Organisation of the United Nations (FAO). Walking the Nexus Talk: Assessing the Water-Energy-Food Nexus in the Context of the Sustainable Energy for All Initiative; FAO: Rome, Italy, 2014. [Google Scholar]
  22. Andrews-Speed, P.; Bleischwitz, R.; Boersma, T.; Johnson, C.; Kemp, G.; VanDeveer, S.D. The Global Resource Nexus. The Struggles for Land, Energy, Food, Water, and Minerals; Transatlantic Academy: Washington, DC, USA, 2012; Available online: http://www.transatlanticacademy.org/sites/default/files/publications/TA%202012%20report_web_version.pdf (accessed on 21 November 2017).
  23. World Business Council for Sustainable Development (WBCSD). Co-Optimizing Solutions: Water and Energy for Food, Feed and Fibre; WBCSD: Geneva, Switzerland, 2013. [Google Scholar]
  24. UN-ESCWA. Conceptual Frameworks for Understanding the Water, Energy and Food Security Nexus; E/ESCWA/SDPD/2015/WP.2, UNESCWA Working Paper; UN-ESCWA: Beirut, Lebanon, 2015. [Google Scholar]
  25. Al-Saidi, M.; Elagib, N.A. Towards understanding the integrative approach of the water, energy and food nexus. Sci. Total Environ. 2017, 574, 1131–1139. [Google Scholar] [CrossRef] [PubMed]
  26. Bazilian, M.; Rogner, H.; Howells, M.; Hermann, S.; Arent, D.; Gielen, D.; Steduto, P.; Mueller, A.; Komor, P.; Tol, R.S.J.; et al. Considering the energy, water and food nexus: Towards an integrated modelling approach. Energy Policy 2011, 39, 7896–7906. [Google Scholar] [CrossRef]
  27. Hadian, S.; Madani, K. A System of Systems Approach to Energy Sustainability Assessment: Are All Renewables Really Green? Ecol. Indic. 2015, 52, 194–206. [Google Scholar] [CrossRef]
  28. Ringler, C.; Bhaduri, A.; Lawford, R. The nexus across water, energy, land and food (WELF): Potential for improved resource use efficiency? Curr. Opin. Environ. Sustain. 2013, 5, 617–624. [Google Scholar] [CrossRef]
  29. Konadu, D.D.; Mourão, Z.S.; Allwood, J.M.; Richards, K.S.; Kopec, G.; McMahon, R.; Fenner, R. Land use implications of future energy system trajectories—The case of the UK 2050 Carbon Plan. Energy Policy 2015, 86, 328–337. [Google Scholar] [CrossRef]
  30. Allouche, J.; Middleton, C.; Gyawali, D. Technical veil, hidden politics: Interrogating the power linkages behind the nexus. Water Altern. 2015, 8, 610–626. [Google Scholar]
  31. Stigson, P.; Roth, S.; Karlsson, A. Re-evaluating the Sustainability of Energy Systems: The nexus of Energy, Water and Land-Use. In Handbook of Clean Energy Systems; John Wiley and Sons Ltd.: Hoboken, NJ, USA, 2015; pp. 1–14. [Google Scholar] [CrossRef]
  32. Mouratiadou, I.; Biewald, A.; Pehl, M.; Bonsch, M.; Baumstark, L.; Klein, D.; Popp, A.; Luderer, G.; Kriegler, E. The impact of climate change mitigation on water demand for energy and food: An integrated analysis based on the Shared Socioeconomic Pathways. Environ. Sci. Policy 2016, 64, 48–58. [Google Scholar] [CrossRef]
  33. Keles, D.; Möst, D.; Fichtner, W. The development of the German energy market until 2030—A critical survey of selected scenarios. Energy Policy 2011, 39, 812–825. [Google Scholar] [CrossRef]
  34. Willarts, B.A.; De la Rúa, C.; Cabal, H.; Garrido, A.; Lechón, Y. El Nexo Agua-Tierra-Energía en España; Fundación Canal Isabel II; Fundación Canal: Madrid, Spain, 2016; ISBN 978-84-945176-1-7. [Google Scholar]
  35. Graedel, T.E. On the Future Availability of the Energy Metals. Annu. Rev. Mater. Res. 2011, 41, 323–335. [Google Scholar] [CrossRef]
  36. Hertwich, E.G.; Gibon, T.; Bouman, E.A.; Arvesen, A.; Suh, S.; Heath, G.A.; Shi, L. Integrated life-cycle assessment of electricity-supply scenarios confirms global environmental benefit of low-carbon technologies. Proc. Natl. Acad. Sci. USA 2015, 112, 6277–6282. [Google Scholar] [CrossRef] [PubMed]
  37. Santoyo-Castelazo, E.; Azapagic, A. Sustainability assessment of energy systems: Integrating environmental, economic and social aspects. J. Clean. Prod. 2014, 80, 119–138. [Google Scholar] [CrossRef]
  38. Berrill, P.; Arvesen, A.; Scholz, Y.; Gils, H.G.; Hertwich, E.G. Environmental impacts of high penetration renewable energy scenarios for Europe. Environ. Res. Lett. 2016, 11. [Google Scholar] [CrossRef]
  39. KIC InnoEnergy. Future Renewable Energy Costs: Onshore Wind. How Technology Innovation Is Anticipated to Reduce the Cost of Energy from European Onshore Wind Farms; BVG Associates: Cricklade, UK, 2014. [Google Scholar]
  40. International Energy Agency (IEA). Technology Roadmap Solar Photovoltaic Energy, 2014 ed.; Energy Technology Perspectives; IEA: Paris, France, 2014. [Google Scholar]
  41. KIC InnoEnergy. Future Renewable Energy Costs: Solar-Thermal Electricity. How Technology Innovation Is Anticipated to Reduce the Cost of Energy from European Solar-Thermal Electricity Plants; KIC InnoEnergy: Ag Eindhoven, The Netherlands, 2015. [Google Scholar]
  42. European Commission (EC) Joint Research Centre (JRC)—Institute for Environment and Sustainability. International Reference Life Cycle Data System (ILCD) Handbook—Recommendations for Life Cycle Impact Assessment in the European Context, 1st ed.; EUR 24571 EN; Publications Office of the European Union: Luxemburg, 2011. [Google Scholar]
  43. Seppälä, J.; Posch, M.; Johansson, M.; Hettelingh, J.P. Country-dependent Characterisation Factors for Acidification and Terrestrial Eutrophication Based on Accumulated Exceedance as an Impact Category Indicator. Int. J. Life Cycle Assess. 2006, 11, 403–416. [Google Scholar] [CrossRef]
  44. Posch, M.; Seppälä, J.; Hettelingh, J.P.; Johansson, M.; Margni, M.; Jolliet, O. The role of atmospheric dispersion models and ecosystem sensitivity in the determination of characterisation factors for acidifying and eutrophying emissions in LCIA. Int. J. Life Cycle Assess. 2008, 13, 477–486. [Google Scholar] [CrossRef]
  45. Struijs, J.; Beusen, A.; van Jaarsveld, H.; Huijbregts, M.A.J. Eutrophication. In ReCiPe 2008 A Life Cycle Impact Assessment Method Which Comprises Harmonised Category Indicators at the Midpoint and the Endpoint Level. Report I: Characterisation Factors, 1st ed.; Ministerie van VROM: Den Haag, The Netherlands, 2008; Available online: https://www.leidenuniv.nl/cml/ssp/publications/recipe_characterisation.pdf (accessed on 15 November 2017).
  46. Rosenbaum, R.K.; Bachmann, T.M.; Gold, L.S.; Huijbregts, M.A.; Jolliet, O.; Juraske, R.; Koehler, A.; Larsen, H.F.; MacLeod, M.; Margni, M.; et al. USEtox—the UNEP-SETAC toxicity model: Recommended characterisation factors for human toxicity and freshwater ecotoxicity in life cycle impact assessment. Int. J. Life Cycle Assess. 2008, 13, 532. [Google Scholar] [CrossRef]
  47. Milà i Canals, L.; Romanyà, J.; Cowell, S.J. Method for assessing impacts on life support functions (LSF) related to the use of ‘fertile land’ in life cycle assessment (LCA). J. Clean. Prod. 2007, 15, 1426–1440. [Google Scholar] [CrossRef]
  48. Frischknecht, R.; Steiner, R.; Jungbluth, N. The Ecological Scarcity Method—Eco-Factors 2006. A Method for Impact Assessment in LCA; Environmental Studies No. 0906; Federal Office for the Environment: Bern, Switzerland, 2009; 188p. [Google Scholar]
  49. Guinée, J.B.; Gorrée, M.; Heijungs, R.; Huppes, G.; Kleijn, R.; de Koning, A.; Van Oers, L.; Sleeswijk, A.; Suh, S.; Udo de Haes, H.A.; et al. Handbook on Life Cycle Assessment: Operational Guide to the ISO Standards; Series: Eco-Efficiency in Industry and Science; Kluwer Academic Publishers: Dordrecht, The Netherlands, 2002. [Google Scholar]
  50. European Commission (EC). Report on Critical Raw Materials for the EU; Report of the Ad hoc Group on Defining Critical Raw Materials; European Commission (EC): Brussels, Belgium, 2014. [Google Scholar]
  51. Loulou, R.; Remme, U.; Kanudia, A.; Lehtila, A.; Goldstein, G. Documentation for the TIMES Model—PART I: TIMES Concepts and Theory; Energy Technology Systems Analysis Programme: Paris, France, 2005. [Google Scholar]
  52. Loulou, R.; Remme, U.; Kanudia, A.; Lehtila, A.; Goldstein, G. Documentation for the TIMES Model—PART II: Reference manual; Energy Technology Systems Analysis Programme: Paris, France, 2005. [Google Scholar]
  53. Loulou, R.; Labriet, M. ETSAP-TIAM: The TIMES integrated assessment model Part I: Model structure. Comput. Manag. Sci. 2008, 5, 7–40. [Google Scholar] [CrossRef]
  54. García-Gusano, D. A Long-Term Analysis of the Spanish Environmental Policies Using the Life Cycle Assessment Method and Energy Optimization Modelling; CIEMAT Editorial: Madrid, Spain, 2014; ISBN 978-84-7834-715-5. [Google Scholar]
  55. Labriet, M.; Cabal, H.; Lechón, Y.; Giannakidis, G.; Kanudia, A. The implementation of the EU Renewable Directive in Spain. Strategies and challenges. Energy Policy 2010, 38, 2272–2281. [Google Scholar] [CrossRef]
  56. Cabal, H.; Lechón, Y.; García, D.; Gargiulo, M.; Labriet, M.; Tosato, G. Description of the Updated TIMES-Spain Model; Project COMET. Integrated Infrastructure for CO2 Transport and Storage in the West Mediterranean Collaborative. Project FP7-ENERGY 2009; CIEMAT: Madrid, Spain, 2011. [Google Scholar]
  57. García-Gusano, D.; Garraín, D.; Dufour, J. Prospective life cycle assessment of the Spanish electricity production. Renew. Sustain. Energy Rev. 2017, 75, 21–34. [Google Scholar] [CrossRef]
  58. Boletín Oficial del Estado (BOE). Real Decreto-ley 1/2012, de 27 de Enero, por el que se Procede a la Suspensión de los Procedimientos de Preasignación de Retribución y a la Supresión de los Incentivos Económicos para Nuevas Instalaciones de Producción de Energía Eléctrica a Partir de Cogeneración, Fuentes de Energía Renovables y Residuos. Decree Law 1/2012, BOE n 24. 2012; 8068–8072. [Google Scholar]
  59. European Commission (EC). Directive 81/2008/EC of the European Parliament and the Council on National Emission Ceilings for Certain Pollutants (NEC Directive); European Commission (EC): Brussels, Belgium, 2008. [Google Scholar]
  60. Boletín Oficial del Estado (BOE). Referencia: BOE-A-2005-895, Madrid, España, por el que se Establece la Relación de Actividades Potencialmente Contaminantes del suelo y los Criterios y Estándares para la Declaración de Suelos Contaminados. Royal Decree 9/2005, BOE n 15. 14 January 2005. [Google Scholar]
  61. European Commission (EC). Directive 75/2001/EC of the European Parliament and of the Council of 24 November 2010 on Industrial Emissions (Integrated Pollution Prevention and Control); European Commission (EC): Brussels, Belgium, 2001. [Google Scholar]
  62. European Environmental Agency (EEA). Exposure of Ecosystems to Acidification, Eutrophication and Ozone. 2012. Available online: https://www.eea.europa.eu/data-and-maps/indicators/exposure-of-ecosystems-to-acidification-2/exposure-of-ecosystems-to-acidification-3 (accessed on 25 September 2017).
  63. International Energy Agency (IEA). Energy Technology Perspectives 2010. Scenarios and Strategies to 2050; Organisation for Economic Co-Operation and Development (OECD)/IEA: Paris, France, 2010. [Google Scholar]
  64. Latunussa, C.E.L.; Ardente, F.; Blengini, G.A.; Mancini, L. Life Cycle Assessment of an innovative recycling process for crystalline silicon photovoltaic panels. Sol. Energy Mater. Sol. Cells 2016, 156, 101–111. [Google Scholar] [CrossRef]
Figure 1. Nexus interrelationships. Adapted from [34].
Energies 11 01203 g001
Figure 2. Methodological approach.
Energies 11 01203 g002
Figure 3. Electricity production technology portfolio in BAU and TARGET2030 scenarios.
Energies 11 01203 g003
Figure 4. Evolution of global warming emissions produced by the Spanish electricity generation mix.
Energies 11 01203 g004
Figure 5. Evolution of acidification impacts produced by the Spanish electricity generation mix.
Energies 11 01203 g005
Figure 6. Evolution of terrestrial eutrophication impacts produced by the Spanish electricity generation mix.
Energies 11 01203 g006
Figure 7. Evolution of fresh water eutrophication impacts produced by the Spanish electricity generation mix.
Energies 11 01203 g007
Figure 8. Evolution of marine eutrophication impacts produced by the Spanish electricity generation mix.
Energies 11 01203 g008
Figure 9. Evolution of fresh water ecotoxicity impacts produced by the Spanish electricity generation mix.
Energies 11 01203 g009
Figure 10. Evolution of water consumption impacts produced by the Spanish electricity generation mix.
Energies 11 01203 g010
Figure 11. Evolution of land use impacts produced by the Spanish electricity generation mix.
Energies 11 01203 g011
Figure 12. Evolution of resource use impacts produced by the Spanish electricity generation mix.
Energies 11 01203 g012
Figure 13. Impacts on the WEL nexus of electricity generation in 2030 compared to those in 2010.
Energies 11 01203 g013
Table 1. GDP and population projection used in the modelling exercise.
Socioeconomic Drivers2005201020152020202520302035
Gross domestic product (GDP) (Billion € Constant 2005 prices)9099489621116117112731384
Average GDP growth in the following 5 years period1.7%−0.3%2.7%1.5%1.7%1.7%1.6%
Population (million inhabitants)43.3046.4946.4546.1145.7645.4245.09
Table 2. Impacts on the water, energy and land (WEL) nexus of power generation technologies.
AcidificationTerrestrial EutrophicationFresh Water EutrophicationMarine EutrophicationFresh Water EcotoxicityLand UseWater ConsumptionResource Use
molc H+ eqmolc N eqkg P eqkg N eqCTUekg C deficitl water eqkg Sb eq
Biogas1.31 × 10−34.18 × 10−35.37 × 10−52.20 × 10−41.784.47 × 10−14.08 × 10−13.95 × 10−6
Biogas Chp3.77 × 10−41.20 × 10−31.55 × 10−56.34 × 10−55.12 × 10−11.29 × 10−11.17 × 10−11.14 × 10⁻⁶
Natural Gas Chp1.70 × 10−32.98 × 10−33.51 × 10−52.78 × 10−46.50 × 10−15.93 × 10−14.751.14 × 10−6
Natural Gas Cc Chp1.19 × 10−31.82 × 10−32.36 × 10−51.71 × 10−43.77 × 10−13.94 × 10−11.577.20 × 10−7
Biomass Chp9.26 × 10−43.58 × 10−34.10 × 10−51.94 × 10−45.10 × 10−16.21 × 10−13.211.56 × 10−6
Coal2.57 × 10−36.21 × 10−34.25 × 10−46.30 × 10−43.423.31 × 10−13.791.48 × 10−6
Lignite1.57 × 10−33.92 × 10−32.92 × 10−39.48 × 10−418.91.66 × 10−111.18.63 × 10−7
Csp Current Tech5.97 × 10−41.23 × 10−32.30 × 10−51.03 × 10−44.28 × 10−12.14 × 10−18.191.20 × 10−6
Csp Future Tech with Gas6.90 × 10−41.39 × 10−32.65 × 10−51.19 × 10−44.81 × 10−12.43 × 10−13.881.33 × 10−6
Csp Future Tech without GAS7.08 × 10−51.50 × 10−43.25 × 10−61.18 × 10−59.66 × 10−26.76 × 10−24.933.11 × 10−7
Natural GAS Combined Cycle9.67 × 10−41.48 × 10−31.92 × 10−51.38 × 10−43.06 × 10−13.20 × 10−11.465.84 × 10−7
Minihydro1.74 × 10−55.91 × 10−51.03 × 10−65.44 × 10−62.70 × 10−29.75 × 10−31.07 × 10−21.87 × 10⁻⁷
Hydro Dam2.19 × 10−57.02 × 10−51.34 × 10−66.45 × 10−62.99 × 10−22.79 × 10−21.74 × 10−22.68 × 10⁻⁷
Nuclear1.11 × 10−42.00 × 10−46.00 × 10−62.13 × 10−54.32 × 10−11.44 × 10−24.935.12 × 10−6
Waves2.13 × 10−59.82 × 10−53.26 × 10−117.84 × 10−62.08 × 10−3-8.11 × 10−30.000.00
Oil7.46 × 10−31.81 × 10−21.35 × 10−51.66 × 10−36.74 × 10−15.45 × 10−13.511.63 × 10−6
PV Current Tech Mix5.73 × 10−47.84 × 10−44.56 × 10−58.08 × 10−54.274.50 × 10−13.177.63 × 10−5
PV Roof Current Tech7.99 × 10−49.88 × 10−47.92 × 10−51.08 × 10−410.98.84 × 10−24.229.85 × 10−5
PV Roof Future Tech2.71 × 10−43.78 × 10−42.05 × 10−53.86 × 10−51.682.50 × 10−11.513.67 × 10−5
PV Plant Current Tech5.43 × 10−47.57 × 10−44.10 × 10−57.71 × 10−53.365.00 × 10−13.027.33 × 10−5
PV Plant Future Tech3.09 × 10−43.74 × 10−43.11 × 10−54.16 × 10−54.583.44 × 10−21.314.56 × 10−5
Wind Current1.28 × 10−42.44 × 10−41.08 × 10−52.42 × 10−53.971.59 × 10−11.68 × 10−17.74 × 10−6
Wind Medium Term1.09 × 10−42.07 × 10−49.11 × 10−62.05 × 10−53.371.35 × 10−11.43 × 10−16.56 × 10−6
Wind Future1.00 × 10−41.91 × 10−48.40 × 10−61.89 × 10−53.101.24 × 10−11.31 × 10−16.05 × 10−6
Imports 20151.39 × 10−43.01 × 10−46.81 × 10−62.75 × 10−55.76 × 10−14.03 × 10−24.095.32 × 10−6
Imports 20201.42 × 10−43.17 × 10−47.84 × 10−62.77 × 10−58.92 × 10−16.04 × 10−23.686.10 × 10−6
Imports 20251.53 × 10−43.50 × 10−48.64 × 10−62.98 × 10−51.137.59 × 10−23.406.71 × 10−6
Imports 20301.57 × 10−43.53 × 10−49.20 × 10−63.02 × 10−51.268.39 × 10−23.287.61 × 10−6
Imports 20351.57 × 10−43.54 × 10−49.23 × 10−63.03 × 10−51.278.44 × 10−23.287.63 × 10−6

