1. Introduction
High-strength large-diameter pipe is the trend of long-distance high pressure gas pipelines due to its greater capacity and lower cost. The reason for using increasingly high pressures in long-range transmission pipelines is dictated by the efficiency of gas turbine fuel consumption, which is necessary for transporting the same volume of gas through pipeline with a specified diameter and length, but under a higher operating pressure [
1]. The use of API X70 and X80 high strength steel allows the increase of the design factor. In gas transmission pipeline design, the design factor is used as a safety margin to the specified minimum yield strength (SMYS) of the pipe material. In the newly published code GB50253-2015 in China, location class 1 is further divided into division 1 and division 2. In division 2, the design factor of the pipe can be 0.80. When the design factor is improved from 0.72 to 0.8, the pipeline throughput and transport efficiency will be highly increased. In keeping with this philosophy, a 300 km long test pipe section in the west–east China gas pipeline III is designed with 0.8 factor.
Many years of experience in the operation of high stress gas pipelines and statistical analysis results of pipeline incidents show that operating pipelines at stress levels over 72% SMYS presented few problems in USA and Canada, and the design factor did not control incidents or the safety of pipelines [
2]. It is more economically favorable to increase the design factor from 0.72 to 0.80. Meanwhile, the ASME B 31.8 states “the installed pipeline system shall be hydrostatically tested to at least 1.25 times the maximum allowable operating pressure(MAOP)” [
3]. Following the items in GB50253-2015, the integrity of the test pipe section is guaranteed by pipeline strength pressure test with no less than 100% of SMYS.
A pressure test is always required for a new pressure system before use to ensure the safety, reliability of operation and leak tightness of the pressure systems. With the newly built test pipe section in the west–east China gas pipeline III, the hydrostatic test is the key step to guarantee the safety of test section with 0.8 design factor. A group of studies have issued this problem from different aspects. According to the statistical data of pipeline yield strength samples, the acceptable maximum test pressure is determined; the systematic analysis is made on the relationship between testing pressure level and residual defects, the criteria of yield deformation under the testing pressure, and the calculation of accumulated plastic strain [
4,
5].
The pressure in the pipeline will reach up to 100% of SMYS. In such high pressure, most small defects in the pipe can be exposed during the test process. However, SMYS is the start of the deformation of the pipeline. The 100% SMYS pressure means it may lead to yield deformation of the pipeline. Both Chinese and American codes agree with this standard and state that special attention should be paid to the testing. The pressure control and pressure–volume control methods are recommended for controlling the test procedure. For the 0.8 design factor section engineering applications, a real-time control of the P-V curve is adopted during the pressure testing and the Hall element which can record pump strokes is used to determine the water volume pumped into pipelines [
6].
The P-V curve method is an effective method to control the pressure test process. The failure criteria of different situations have been given in the codes and specifications. The criteria are mainly empirical based on the decline and drift of the P-V curve. The P-V curve method is still a deterministic approach. It ignores most detailed information about the variable distribution and test process. In addition to P-V curve method, the Acoustic Emissions (AE) method, as another deterministic approach, is proven effective for assessing the condition of pipeline during the hydrostatic test [
7,
8,
9]. In this paper, the probabilistic index, i.e., the reliability of the pipeline, is introduced as a new index in the hydrostatic test of the pipeline.
Reliability based method has already been applied in onshore pipelines [
10,
11,
12]. It is used to find the potential accidents and reduce the risk. For pipeline with 0.8 design factor, reliability methods are powerful and useful when assessing the probability of failure in pipelines. The distribution of all variables is the first step of probabilistic assessment [
13,
14]. The study in [
15] presents excellent work on the limit state design for the hydrostatic test, where the safety factors and the parameter distributions are calibrated to meet the desired reliability levels.
In this study, a reliability based assessment approach is proposed to analyze the detailed information in the pipeline testing and to provide a probabilistic safety measurement. The failure probability of the pipeline is monitored during the hydrostatic testing process. In accordance with the design requirements, the hoop stress generated in the pipeline strength pressure test should be no less than 100% of SMYS. For such a high pressure test strength, the pipeline is at the edge of the its limit strength. Therefore, the yield deformation of the pipeline is possible to happen. With just P-V curve and a 0.2% bias criteria, people only know the failure of the pressure test when the deformation really happens. While our method can predict the failure with the degree of the risk. It clearly describes the trend of the risk in the testing process.
The rest part of the paper is organized as follows.
Section 2 introduces the theory of the P-V relationship so that the theoretical calculation can be used as a reference line during the testing process.
Section 3 describes mathematic models for the failure analysis of limit state of excessive plastic deformation.
Section 4 gives the failure probability analysis for the increasing of the internal pressure by means of Monte Carlo simulation. The data used in the calculation are collected from an in service X80 pipeline in China.
2. Calculation of P-V Curve
With 0.8 design factor, the hoop stress of the pipeline will exceed 100% SMYS. The volume of water injected and the inner pressure are monitored. The pressure–water inflow volume (P-V) curve is used to monitor the testing process to avoid the occurrence of a nonlinear water inflow volume of ≤0.2% pipeline volume in the whole testing period, and the corresponding signal processing system is developed for the P-V curve.
There are three parts which are related to the water injection volume. These parts are the main consequences of the water injections. The expressions for volume increment are the following [
16]:
the expansion of pipeline volume caused by the internal pressure rising
where
C is
compression of the residual air
compression of water
Thus, the total water inflow with pressure before yielding is
where
D is the pipe diameter;
t is the wall thickness;
is the Poisson’s ratio;
E is the elasticity modulus;
P is the internal pressure;
L is the length of pipeline section;
n is the residual air ratio;
is the initial pressure;
is the volume of the pipe before expansion; and
K is the elasticity modulus of water.
At first, the pressure grows slowly with the increasing water inflow volume because of compressibility of the remaining air in pipeline [
4]. Then, there is a quick ramp-up of the pressure when the water inflow volume reaches a certain amount. The accurate estimation of the P-V cure is necessary for the prediction of the limit state of the pipeline. Only with a reasonable
n can the calculated curve agree with the on-site recorded curve. The residual air ratio
n is a key parameter in the prediction of the P-V curve. By using a short section of 0.8 design factor test pipeline, the following part of this section describes the process of how to confirm the ration residual air.
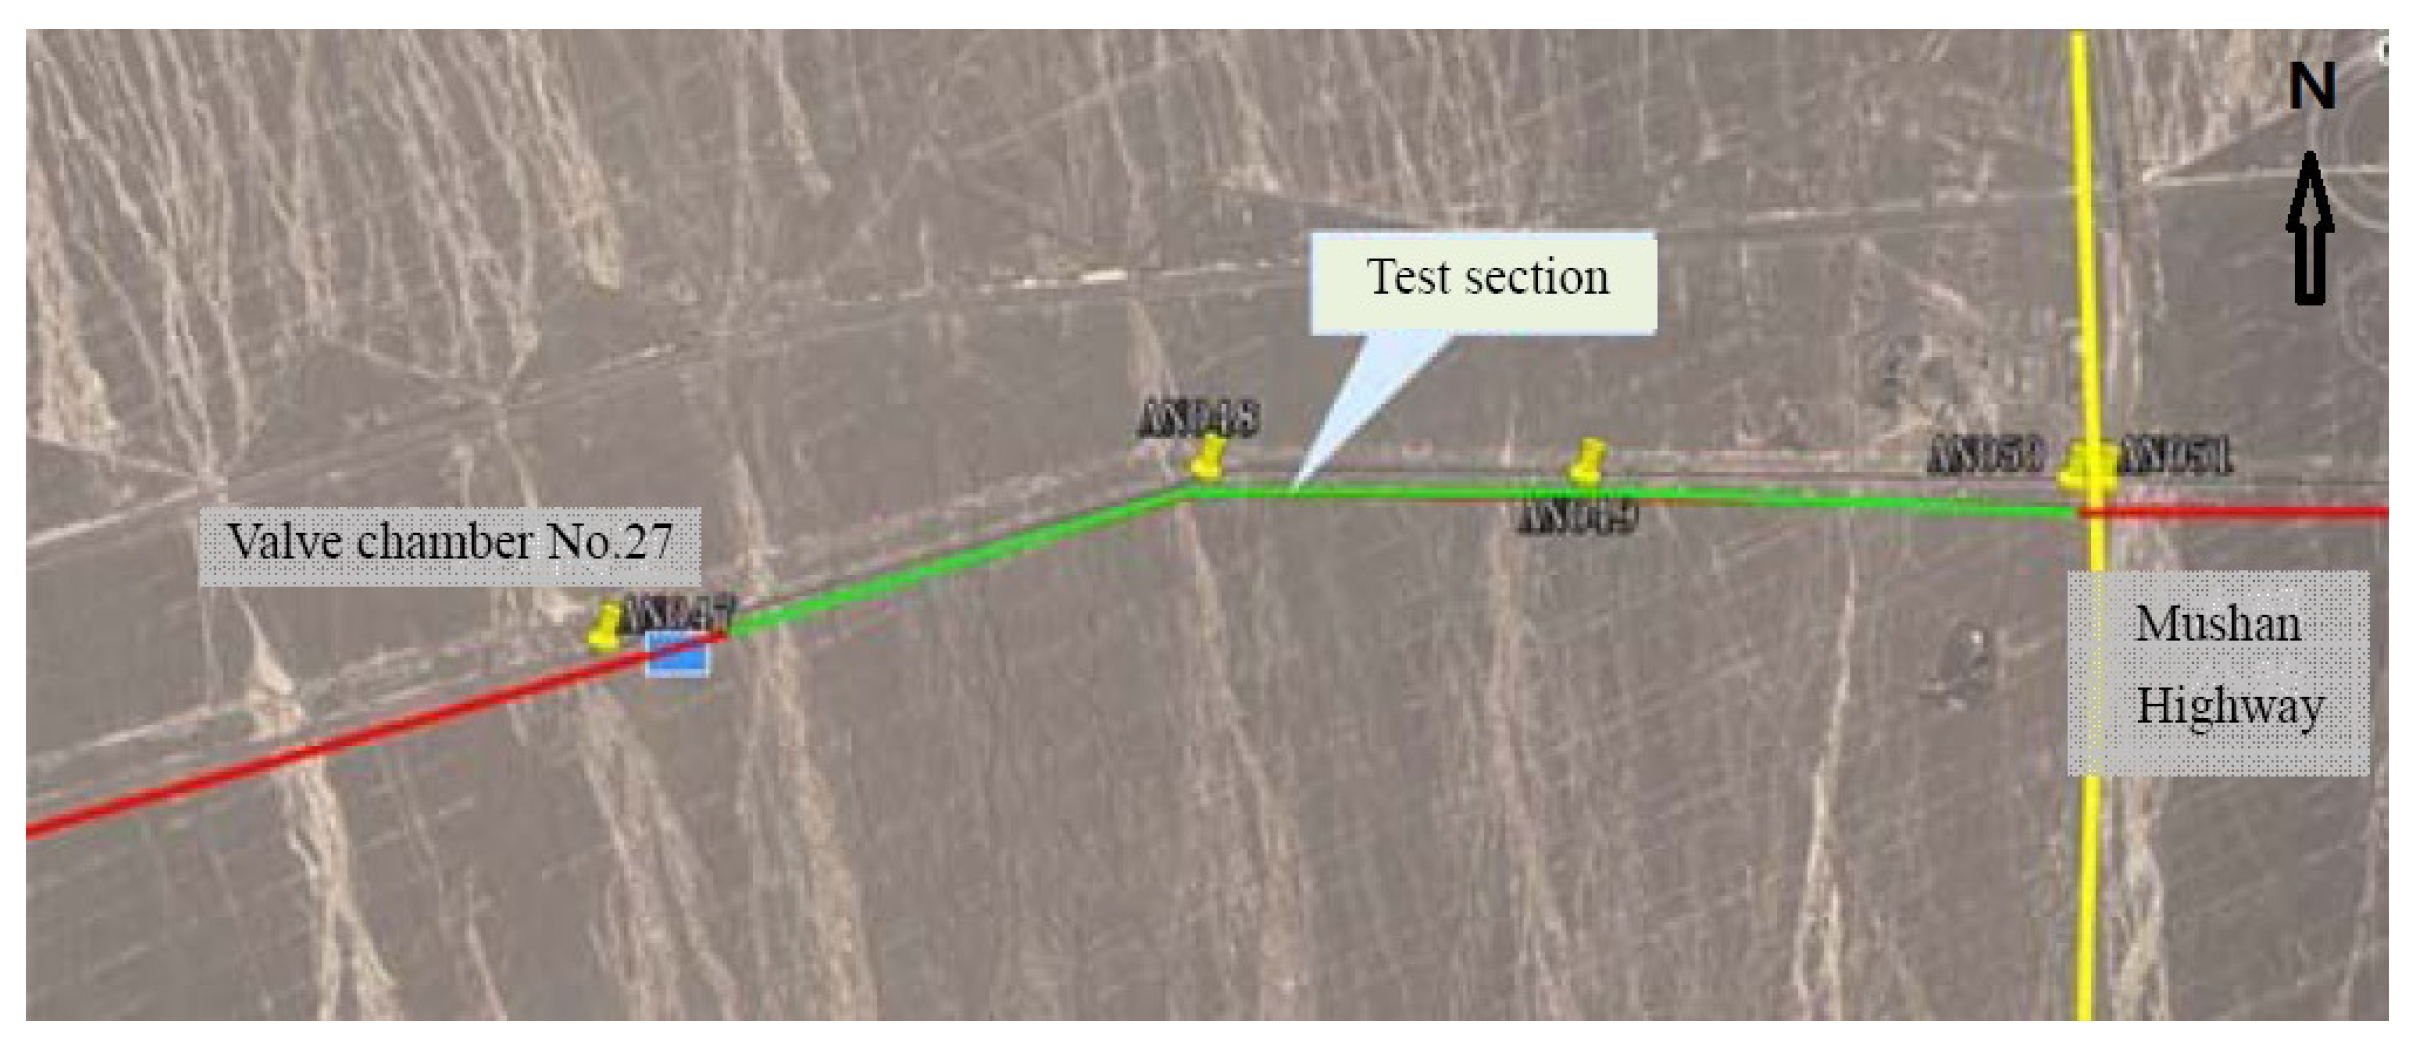
The length of the test section is 3.91 km, which starts at valve chamber No. 27 of west section of west–east China gas pipeline III (stack number: AN047) and ends at crossing point at Mushan highway (stack number: AN051). The terrain is flat along the test section with 5.3 m elevation difference, which makes it possible to be treated as horizontal section. The planar drawing of the test section on the aerial photograph is shown in
Figure 1, where the green line represents the test section along the main line shown by the red line, the yellow line is Mushan highway [
17]. The basic parameters of the test section are as in
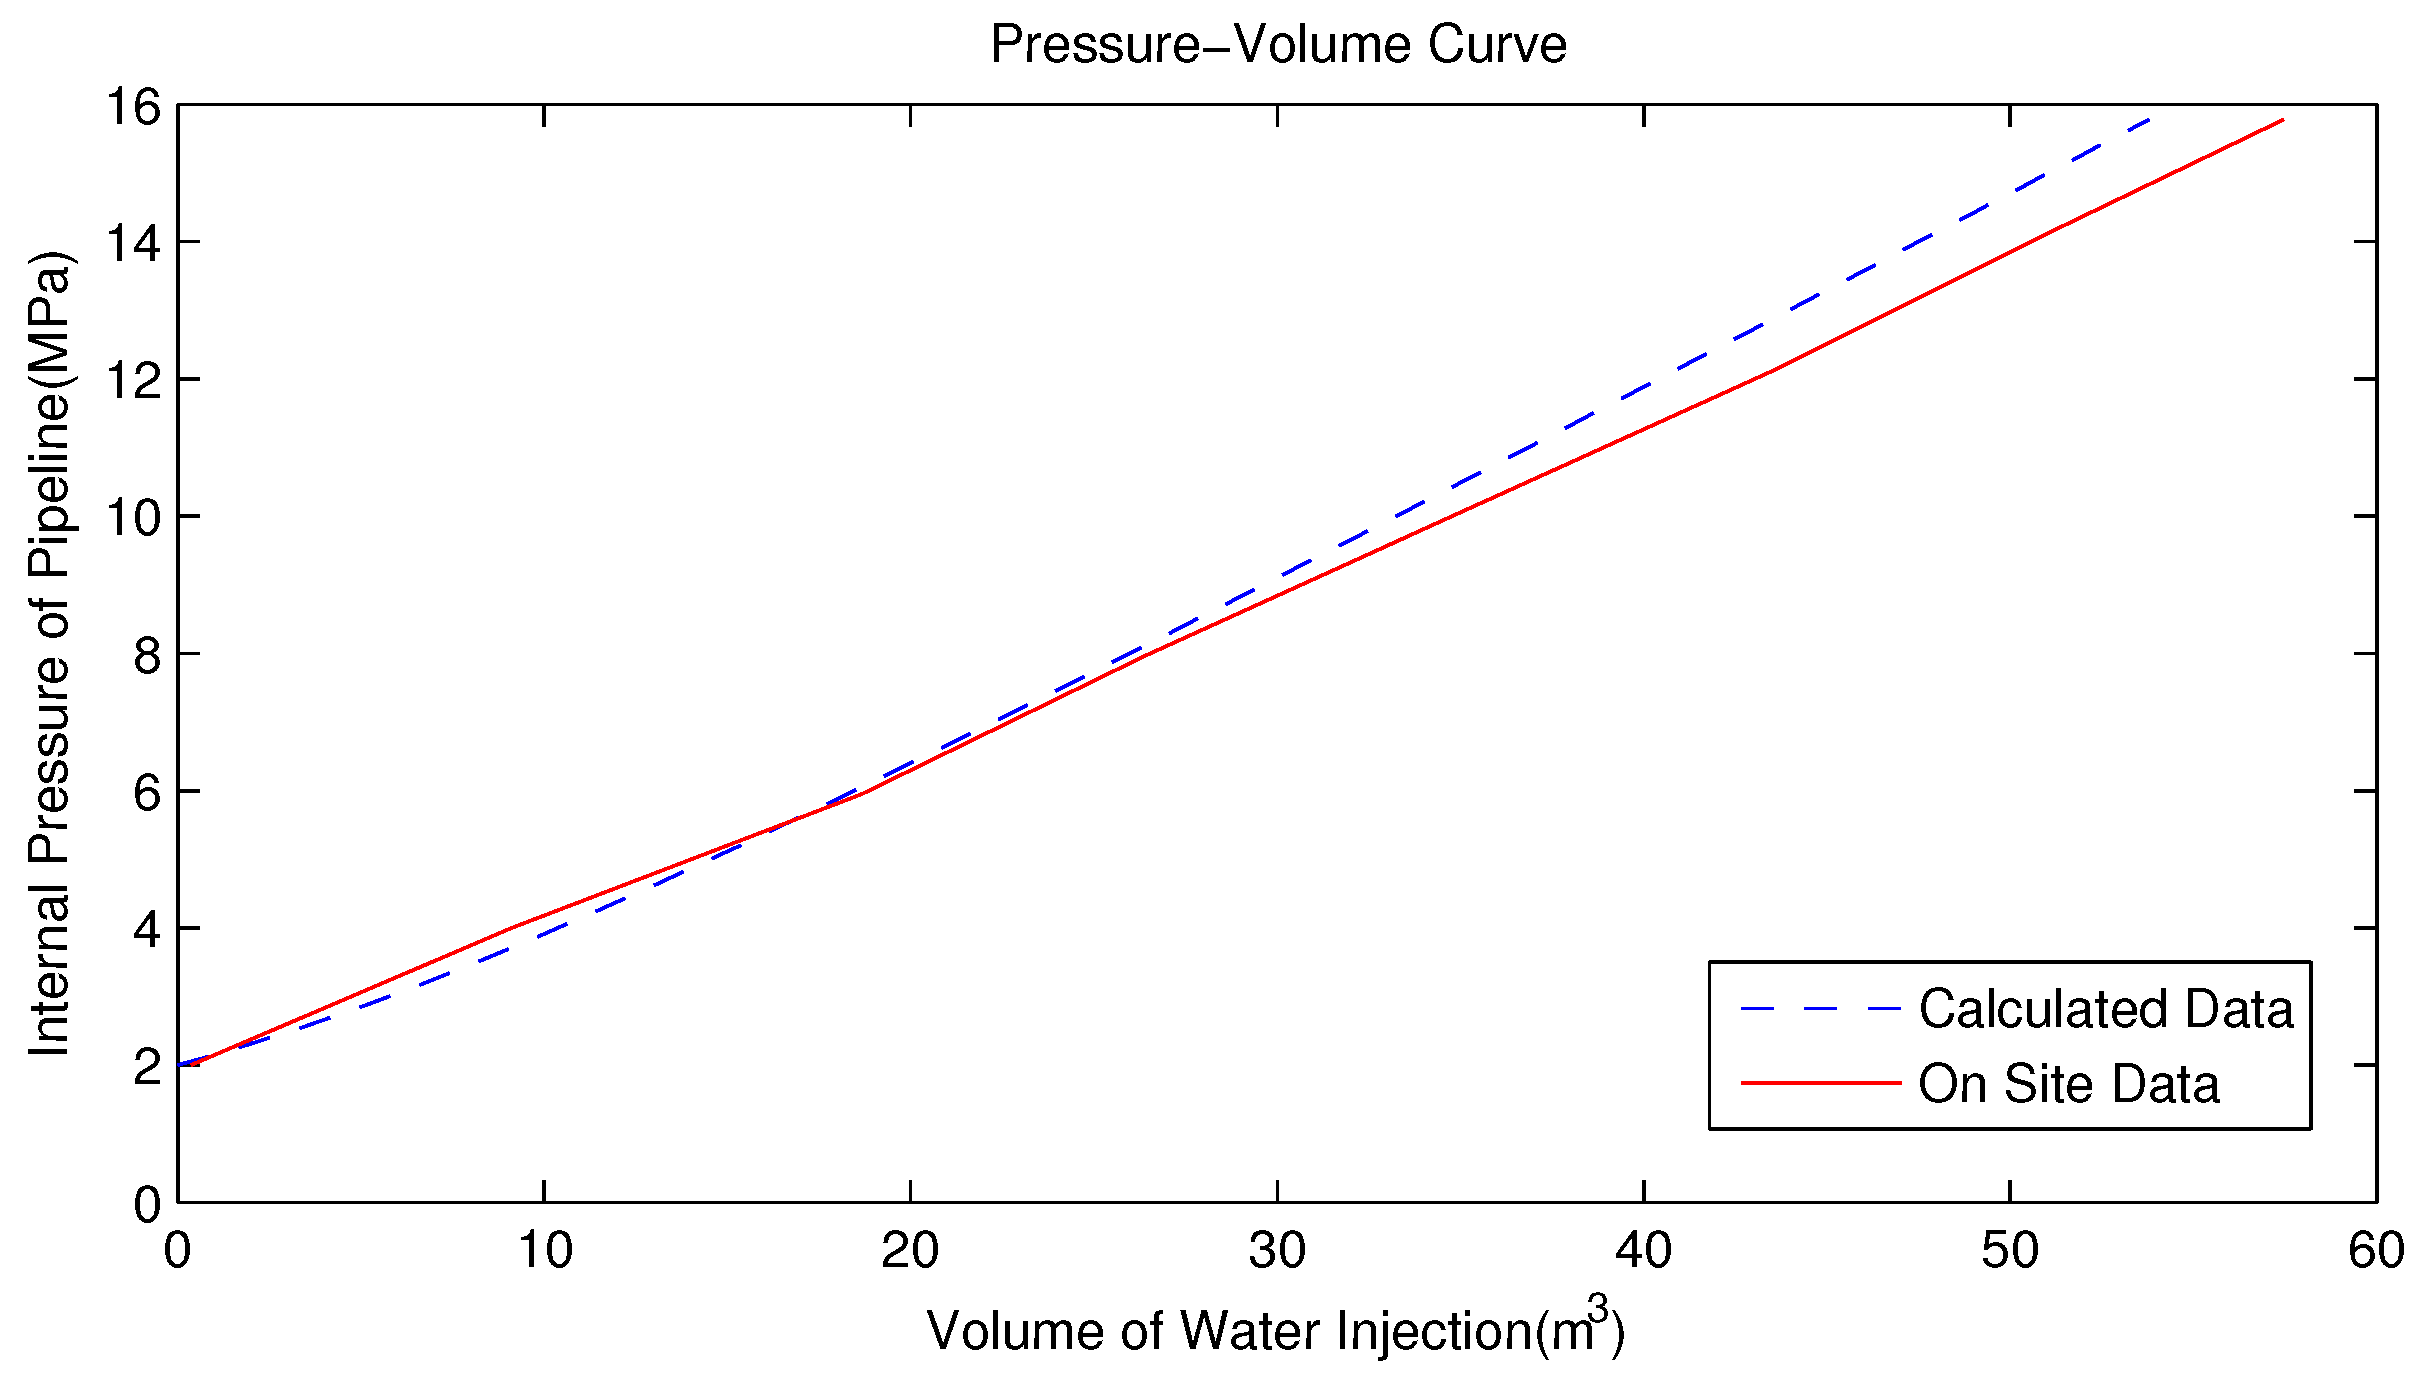
Table 1. The P-V curve of on-site data is shown in
Figure 2 with red line.
In
Figure 2, one can see that the first recorded point is about 2 MPa, which is much higher than
MPa. This is different from the theoretical notion that the initial internal pressure is the same as the atmosphere pressure. The actual situation is that the pressure is recorded when the injected water volume nearly equals the volume of the test pipe section.
With the above listed parameters, the volume of the test pipe section is 4319.5 m
3. With a simulation started with
MPa, it it easy to get that the initial pressure
MPa corresponding to the residual air ratio
n , i.e., 7 m
3 air remaining in the pipeline. Thus, the predicted P-V curve is calculated as the blue dash line in
Figure 2. The blue line fitting the on-site data well means the prediction is valid.
Remark 1. For the pipeline of 16.5 mm thickness, volume caused by the decrease of the wall thickness is not negligible, especially at the last period of the testing with higher pressure. This is different from the exist results [6].
Remark 2. The residual air ratio n is calculated with the first point of the on-site data. Then, the predicted curve can get with known parameters. It can be used as a reference line to the following recorded on-site P-V data.
3. Limit State for the Hydrostatic Test of the Pipelines
According to ASME B31.8, all piping systems shall be tested after construction except for pre-tested fabricated assemblies and welded tie-in connections where post construction tie-in testing is not practical [
3]. For pipelines that utilize 0.8 design factor, the hydrostatic test pressures may lead to hoop stresses approaching SMYS of the pipe material. Thus, excessive plastic deformation may occur during testing with such high pressure. It can lead to coating damage and subsequent corrosion. In this condition, excessive plastic deformation should be monitored in real time even in prediction. A limit state function is necessary for the calculation. The limit state function is a comparison of the applied plastic hoop strain and the calculated allowable plastic hoop strain. The plastic strain is calculated using the von Mises yield criterion. An allowable plastic strain of 1.3% was selected for straight pipes to ensure the integrity of both pipe and coating [
17]. It is suggested that the allowable strain for field bends be defined on a case-by-case basis, taking into account relevant information such as the actual bend angle and coating specifications.
With von Mises principle, the limit state function for deformation is
where
is the effective stress;
is the hoop stress;
is the effective yield stress;
is the tensile yield strength in the hoop direction;
is the shift of the initial yield surface towards the hoop tensile direction;
is the tensile yield strength in the axial direction;
is the tensile yield strength in the hoop direction;
is the axial stress; and
v is the Poisson’s ratio equaling 0.3.
The limit state function for excessive plastic hoop strain is
where
is taken as 0.013 for straight pipes following [
15].
is the plastic hoop strain calculated incrementally using an iterative plasticity theory algorithm following [
15].
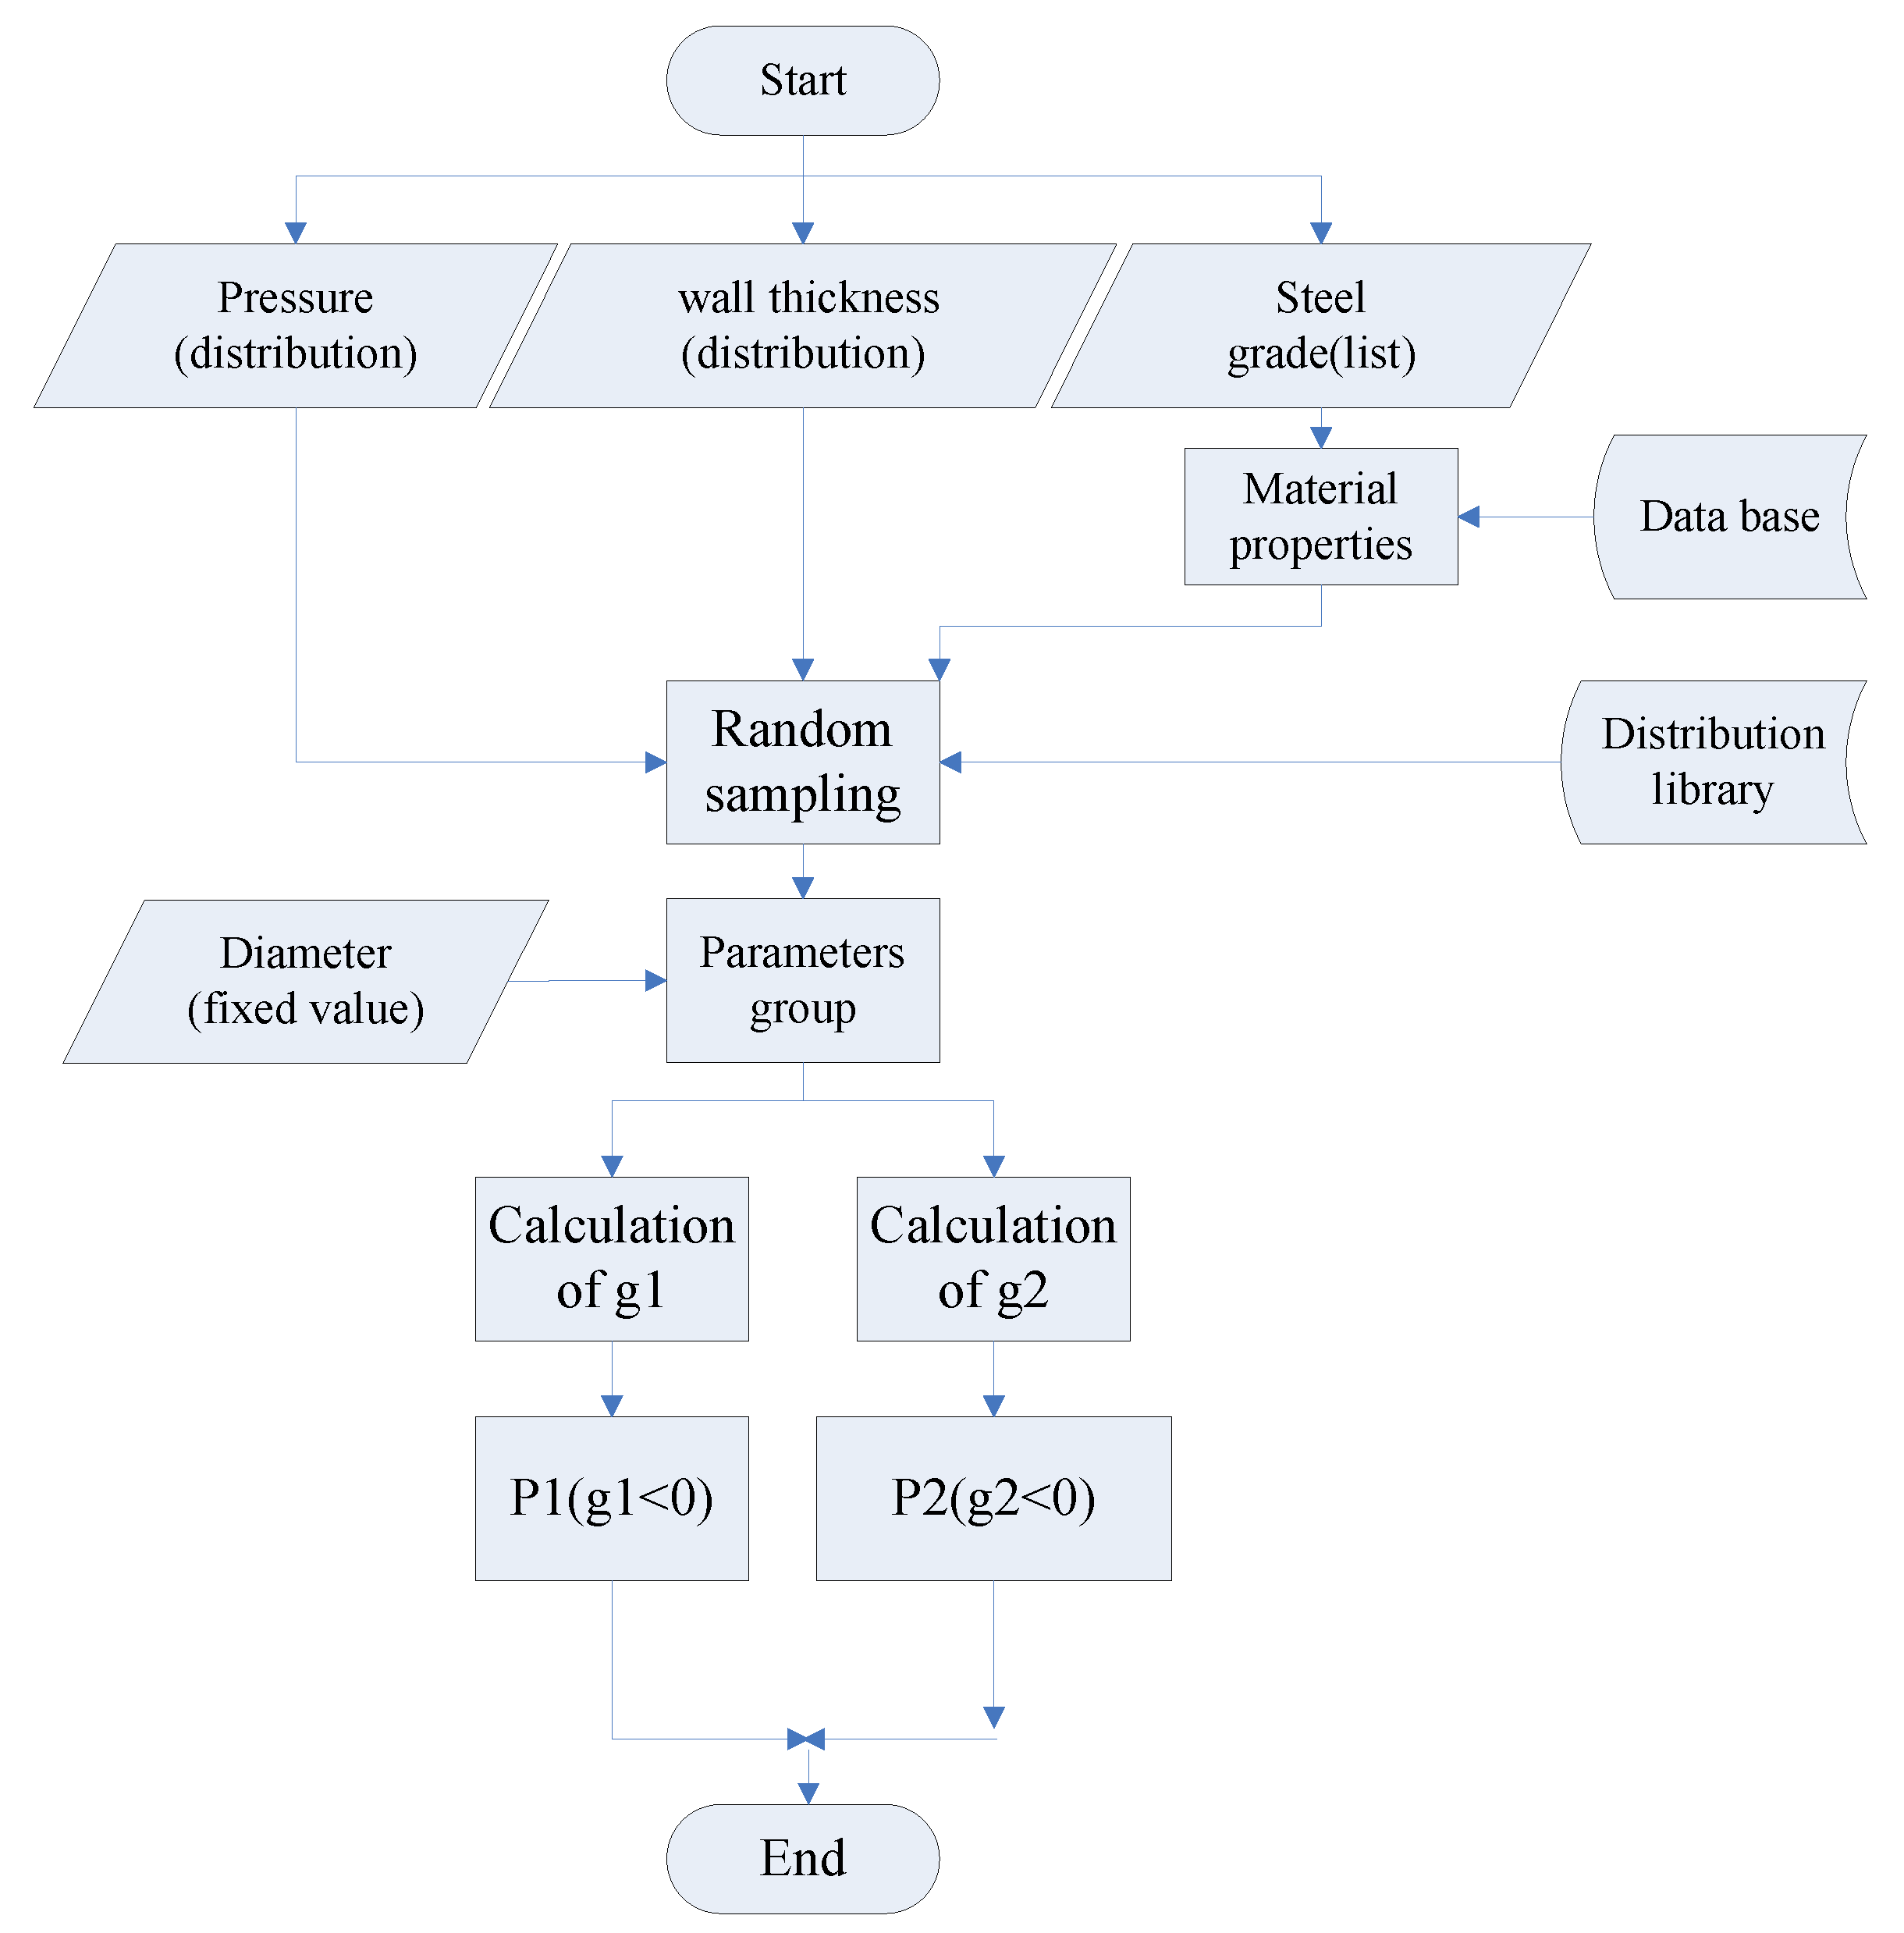
The probability of failure of yield deformation and excessive plastic deformation are calculated by Monte Carlo method. Monte Carlo simulation is not a high efficiency method. However, there are two reasons for using it. Firstly, the input variables in limit state functions are probabilistic. Each uncertain variable used may be expressed by different probabilistic distributions. They vary according to the data collected from the site. Secondly, Monte Carlo simulation is flexible for considering some exceptional cases, such as temperature change and re-rejection of the water during testing. Based on the essential elements of Monte Carlo calculation technique, the algorithm is as in
Figure 3. A post processing of the data is necessary in the case the estimated probability of failure of the limit state is too small [
18].
4. Reliability Assessment Method
To illustrate the proposed method, the case of the test section in the west–east China gas pipeline III is used as an example in this section. The west–east China gas pipeline III is a high-pressure, large-diameter onshore pipeline. Thirty billion cubic meters per year of natural gas are planned to be transported via this pipeline thousands of miles through China. The basic parameters of the pipeline are as in
Table 2.
There is a test section of 0.8 design factor which starts at valve chamber No. 27 of west section of west–east China gas pipeline III (stack number: AN047) and ends at crossing point at Mu shan highway (stack number: AN051), as shown in
Figure 1. The P-V curve data on-site are shown in
Table 3 [
17].
In the testing process, the water injection volume and pipeline internal pressure should be closely supervised and recorded. When the flow and pressure appear to be anomalous, water pump and conduit should be timely examined to find the possible malfunction. In addition, the 0.2% bias of the P-V cure is used as a criterion of the test failure. The above mentioned steps are all post processing methods that work when a failure happens.
The reliability based assessment method and the probability of the failure is quantified as an index which shows the extent of the risk. Following the simulation process in
Figure 3, the calculated probability of failure with the increasing of the internal pressure is listed in
Table 4.
To calculate
and
, thepressure is used as the control parameter. It is assumed as
following the terms of Annex O in CSA Z662-07 [
19]. The yielding strength of X80−1219 mm×16.5 mm is a normal distribution with mean value
MPa and std value
MPa, which is collected from the pipe mill [
6].
Following the result in
Table 3, the fitted relationship between volume and pressure is
. According to the process of the pipeline testing, the diameter of the pipeline is no longer deterministic, which is different from the recommended parameter type in [
18]. Then, the volume expansion of the pipeline is assumed to be the consequence of the variance of the diameter. The distribution of the diameter is assumed as
following the terms of Annex O in CSA Z662-07 [
19].
The input data used in the reliability assessment are summarized in
Table 5.
Remark 3. In Table 4, one can see that the failure probability increases intensively when the internal pressure reaches MPa. It means the engineers should pay attention to the injection operation then. The water injection should slow down to make the pressure increase at a slower speed.
Remark 4. The on-site intelligent deformation inspection shows that there are 33 deformations along the 3.9 km pipeline and no significant excessive plastic deformation. The calculated probability of failure is 0.0228 at 15.78 MPa (Table 4), which means it is highly probable that deformation happens. Meanwhile, the calculated probability of failure is 4.72 × 10 in 15.78 MPa (Table 4), which means deformation is unlikely. Our calculation agrees with the actual situation in a probabilistic sense.
5. Conclusions
Reliability based assessment method is an emerging method for the design and assessment of natural gas pipeline [
20]. The main purpose of this paper is to provide quantitative indicators by considering the uncertainties. The reliability analysis is performed to the testing processing of an test pipe section with a 0.8 design factor in the west–east China gas pipeline III. Besides the P-V cure 0.2% bias criterion, the probabilities of failure is also used as a reference index in the process.
In this paper, the reliability is calculated with internal pressure as the sole control variable. In fact, the results are affected by many factors, including the geometries and material properties of the pipe. These are reflected by the predicted P-V cure and the on-site recorded P-V curve. In future studies, a relationship between the difference of the two curves and the failure will be proposed. The internal pressure and the bias from the theoretical volume of the pipe are connected and dynamically changed. Overall, we find the dynamic reliability assessment of the hydrostatic testing to be more realistic and predictable.


