1. Introduction
Alternative fuels are being largely supported by federal and local entities in the United States as a solution to reduce greenhouse gas (GHG) emissions from the transportation sector, improve local air quality, stimulate economic growth, reduce oil consumption, and increase national energy security. While deployment of hydrogen fuel cell electric vehicles (FCEVs) within the U.S. light-duty vehicle (LDV) sector has received limited attention so far, 2014 marked the first year in which FCEVs became commercially available in California [
1], where significant investments are being made to deploy a successful hydrogen refueling infrastructure system, and FCEVs are a part of transformation pathways toward a sustainable energy future [
2]. Hydrogen is a clean energy carrier that can be produced via several pathways, including electrolysis, that can use electricity produced from renewable energy sources. Electrolytic hydrogen production could facilitate the integration of renewable energy sources by providing a flexible demand for electricity that would otherwise be curtailed [
3,
4,
5]. Over the next decades, FCEVs might become a major component of transportation electrification efforts across the entire country, especially for those applications in which adoption of battery electric vehicles is more challenging, such as large vehicles with long range and fast refueling requirements.
Conditio sine qua non for the successful adoption of FCEVs by private customers is the availability of a refueling infrastructure network that guarantees adequate coverage—including corridors connecting densely populated areas, which are likely to be early FCEV markets—and expands in line with vehicle adoption patterns [
6]. However, the early rollout of refueling infrastructure may be hindered by the lack of fuel demand, which makes the financial case for building refueling stations less profitable. In particular, low utilization rates of hydrogen refueling stations in the early years (when few FCEVs are on the road) negatively impacts their finances significantly, making the case for building hydrogen stations harder [
7]. To solve this conundrum, often referred to as a “
chicken-and-egg” problem, incentives and support can be provided to build hydrogen refueling stations and transition the market through the early phase, also known as the “
valley of death”. Modelling and projections tools provide policymakers and automakers important data to inform decisions about infrastructure investment and guide the transition through the “
valley of death”.
In this context, we review modelling methodologies used to project hydrogen refueling infrastructure requirements to support FCEV adoption and describe the demand-side and refueling station placement modules of the National Renewable Energy Laboratory’s (NREL’s) scenario evaluation and regionalization analysis (SERA) model. We also report two alternative deployment case studies for hydrogen refueling infrastructure to satisfy growing demand for use in passenger vehicles in the United States. SERA determines the optimal production and delivery scenarios for hydrogen, given hydrogen production resource availability in the United States and technology cost. Given annual hydrogen demands on a city-by-city basis, forecasts of feedstock costs, and a catalogue of available hydrogen production and transportation technologies, the model generates “blueprints” for hydrogen infrastructure buildout that minimize the overall capital, operating, and feedstock costs for infrastructure networks that meet the specified demand profiles. The buildout of hydrogen refueling stations over time, in different geographic regions, is modelled to maximize coverage and strategically provide access to potential FCEV early adopters.
The two case study scenarios described in this paper are self-consistent and in line with both near-term (5–10 years) ongoing activities, such as hydrogen refueling station deployment in California and in other regions of the country [
8,
9,
10,
11], and long-term research and development (R&D) objectives and deployment ambitions (e.g., [
12,
13]). In particular, one deployment scenario—Urban Scenario—focuses on deployment in California, where that state has committed significant resources to promote FCEV adoption, and in a limited number of big cities across the country. A second scenario—
National Expansion Scenario—explores opportunities related to a more widespread adoption of FCEV across the entire United States.
The objective of this paper is to provide an overview of the models used to project hydrogen refueling infrastructure requirements to support FCEVs and detail the geospatial disaggregation of FCEV adoption and related deployment of hydrogen refueling infrastructure. The paper also illustrates what successful scenarios of fuel cell electric vehicle adoption and related infrastructure in the United States might look like, and lay the modelling foundation to answer questions, such as How many refueling stations will be required to support a growing number of FCEVs across the United States? What would be the impact of different regional deployment (i.e., FCEVs concentration in large urban areas as opposed to widespread adoption) and station size? How will coverage for hydrogen for use in transportation evolve over time (i.e., when will hydrogen stations be introduced in the different U.S. urban areas) under different vehicle demand scenarios? What level of costs may be required to support the deployment of a successful hydrogen refueling infrastructure network? What are the main levers to optimize stations operation and maximize fuelling availability so as to more efficiently support FCEV adoption?
2. Refueling Infrastructure Modelling Methodologies
Given the key role of refueling infrastructure to enable and support the adoption of FCEVs (“
chicken-and-egg” problem), several models have been developed to explore and inform infrastructure roll-out plans and generate “
blueprints” for hydrogen infrastructure buildout. In general, these models usually focus on specific regions characterized by a high probability of FCEV adoption based on population, socioeconomic and policy factors, estimated early-adopter presence, and other drivers. Areas of potential hydrogen demand are then aggregated into clusters to determine if and when they will warrant infrastructure investment [
14,
15,
16,
17,
18,
19,
20]. Clusters in which refueling stations are predicted to be deployed are then connected to each other using “connector” stations along major roads between the clusters.
Within a particular cluster, models project station placement based on three main approaches (
Table 1): generalized,
p-median, and flow-intercepting. Generalized modelling approaches include using stated or revealed surveys to guide station placement (e.g., place stations near home/work, at all major intersections, etc.). Another general framework for station placement is to use a set of rules to guide placement, including mimicking the existing gasoline station network or placing stations to ensure customers are within a maximum driving time from a station. Finally, generalized approaches also include solving optimization algorithms based on simplified geometric representations of cities with no local resolution.
Hydrogen refueling station placement, based on p-median approaches, seeks to optimize the network by minimizing the average driving time to a refueling station. The p-median approach uses road network and population geographic information system (GIS) data. The optimization is typically completed using a demand-weighted or fuel consumption-weighted travel distance. The p-median approach simulates refueling behavior in which drivers refuel close to their home or work locations (rather than along their usual routes). This framework can also be viewed as “consumer-oriented”, since it seeks to minimize driving time for all consumers, which may force stations to be located far from the highest demand concentration to provide sufficient network coverage and convenient refueling for all drivers.
The third approach to placing refueling stations is the flow-intercepting model, which classifies demand as a flow along a path, as opposed to a particular point, as in the
p-median approach [
21]. A demand is satisfied—or “
intercepted”—if there is a refueling station anywhere along the driving path of an agent. In general, flow-intercepting models maximize the demand flow that is intercepted [
22]. However, since a demand flow is considered captured as long as there is a refueling station anywhere along its driving path, the conventional flow-intercepting models do not accurately reflect hydrogen refueling station capacity constraints, vehicle driving range limitations, nor the ability for consumers to allow for small departures from the path to refuel. Thus, flow-intercepting models have been modified to more accurately reflect these factors [
23,
24,
25]. Behaviorally, the flow-intercepting model approach represents consumers primarily refueling along their travel path, as opposed to at the origin or destination. This modelling framework can also be viewed as “operator-oriented”, since stations are only located at potential high-utilization locations along paths, as opposed to ensuring coverage for all consumers.
The methods described above generate projections to determine where to place stations within a local area, however, they do not explicitly detail the sequence of when to build each station to assume synergistic growth of the FCEV and infrastructure markets, or how to prioritize a large-scale roll-out of refueling infrastructure. In this paper, we describe the methods used in the SERA model to address these limitations.
3. NREL’s Scenario Evaluation, Regionalization, and Analysis (SERA) Model
NREL’s SERA model, extensively used to perform hydrogen infrastructure network expansion analysis by several public and private stakeholders (e.g., [
8,
42,
43]), projects scenarios of FCEV adoption over time, and required hydrogen refueling infrastructure roll-out, based on estimates of potential adopters of passenger FCEVs. SERA also locates hydrogen production facilities and projects buildout of hydrogen distribution networks based on cost estimates of different alternatives, such as hydrogen pipelines.
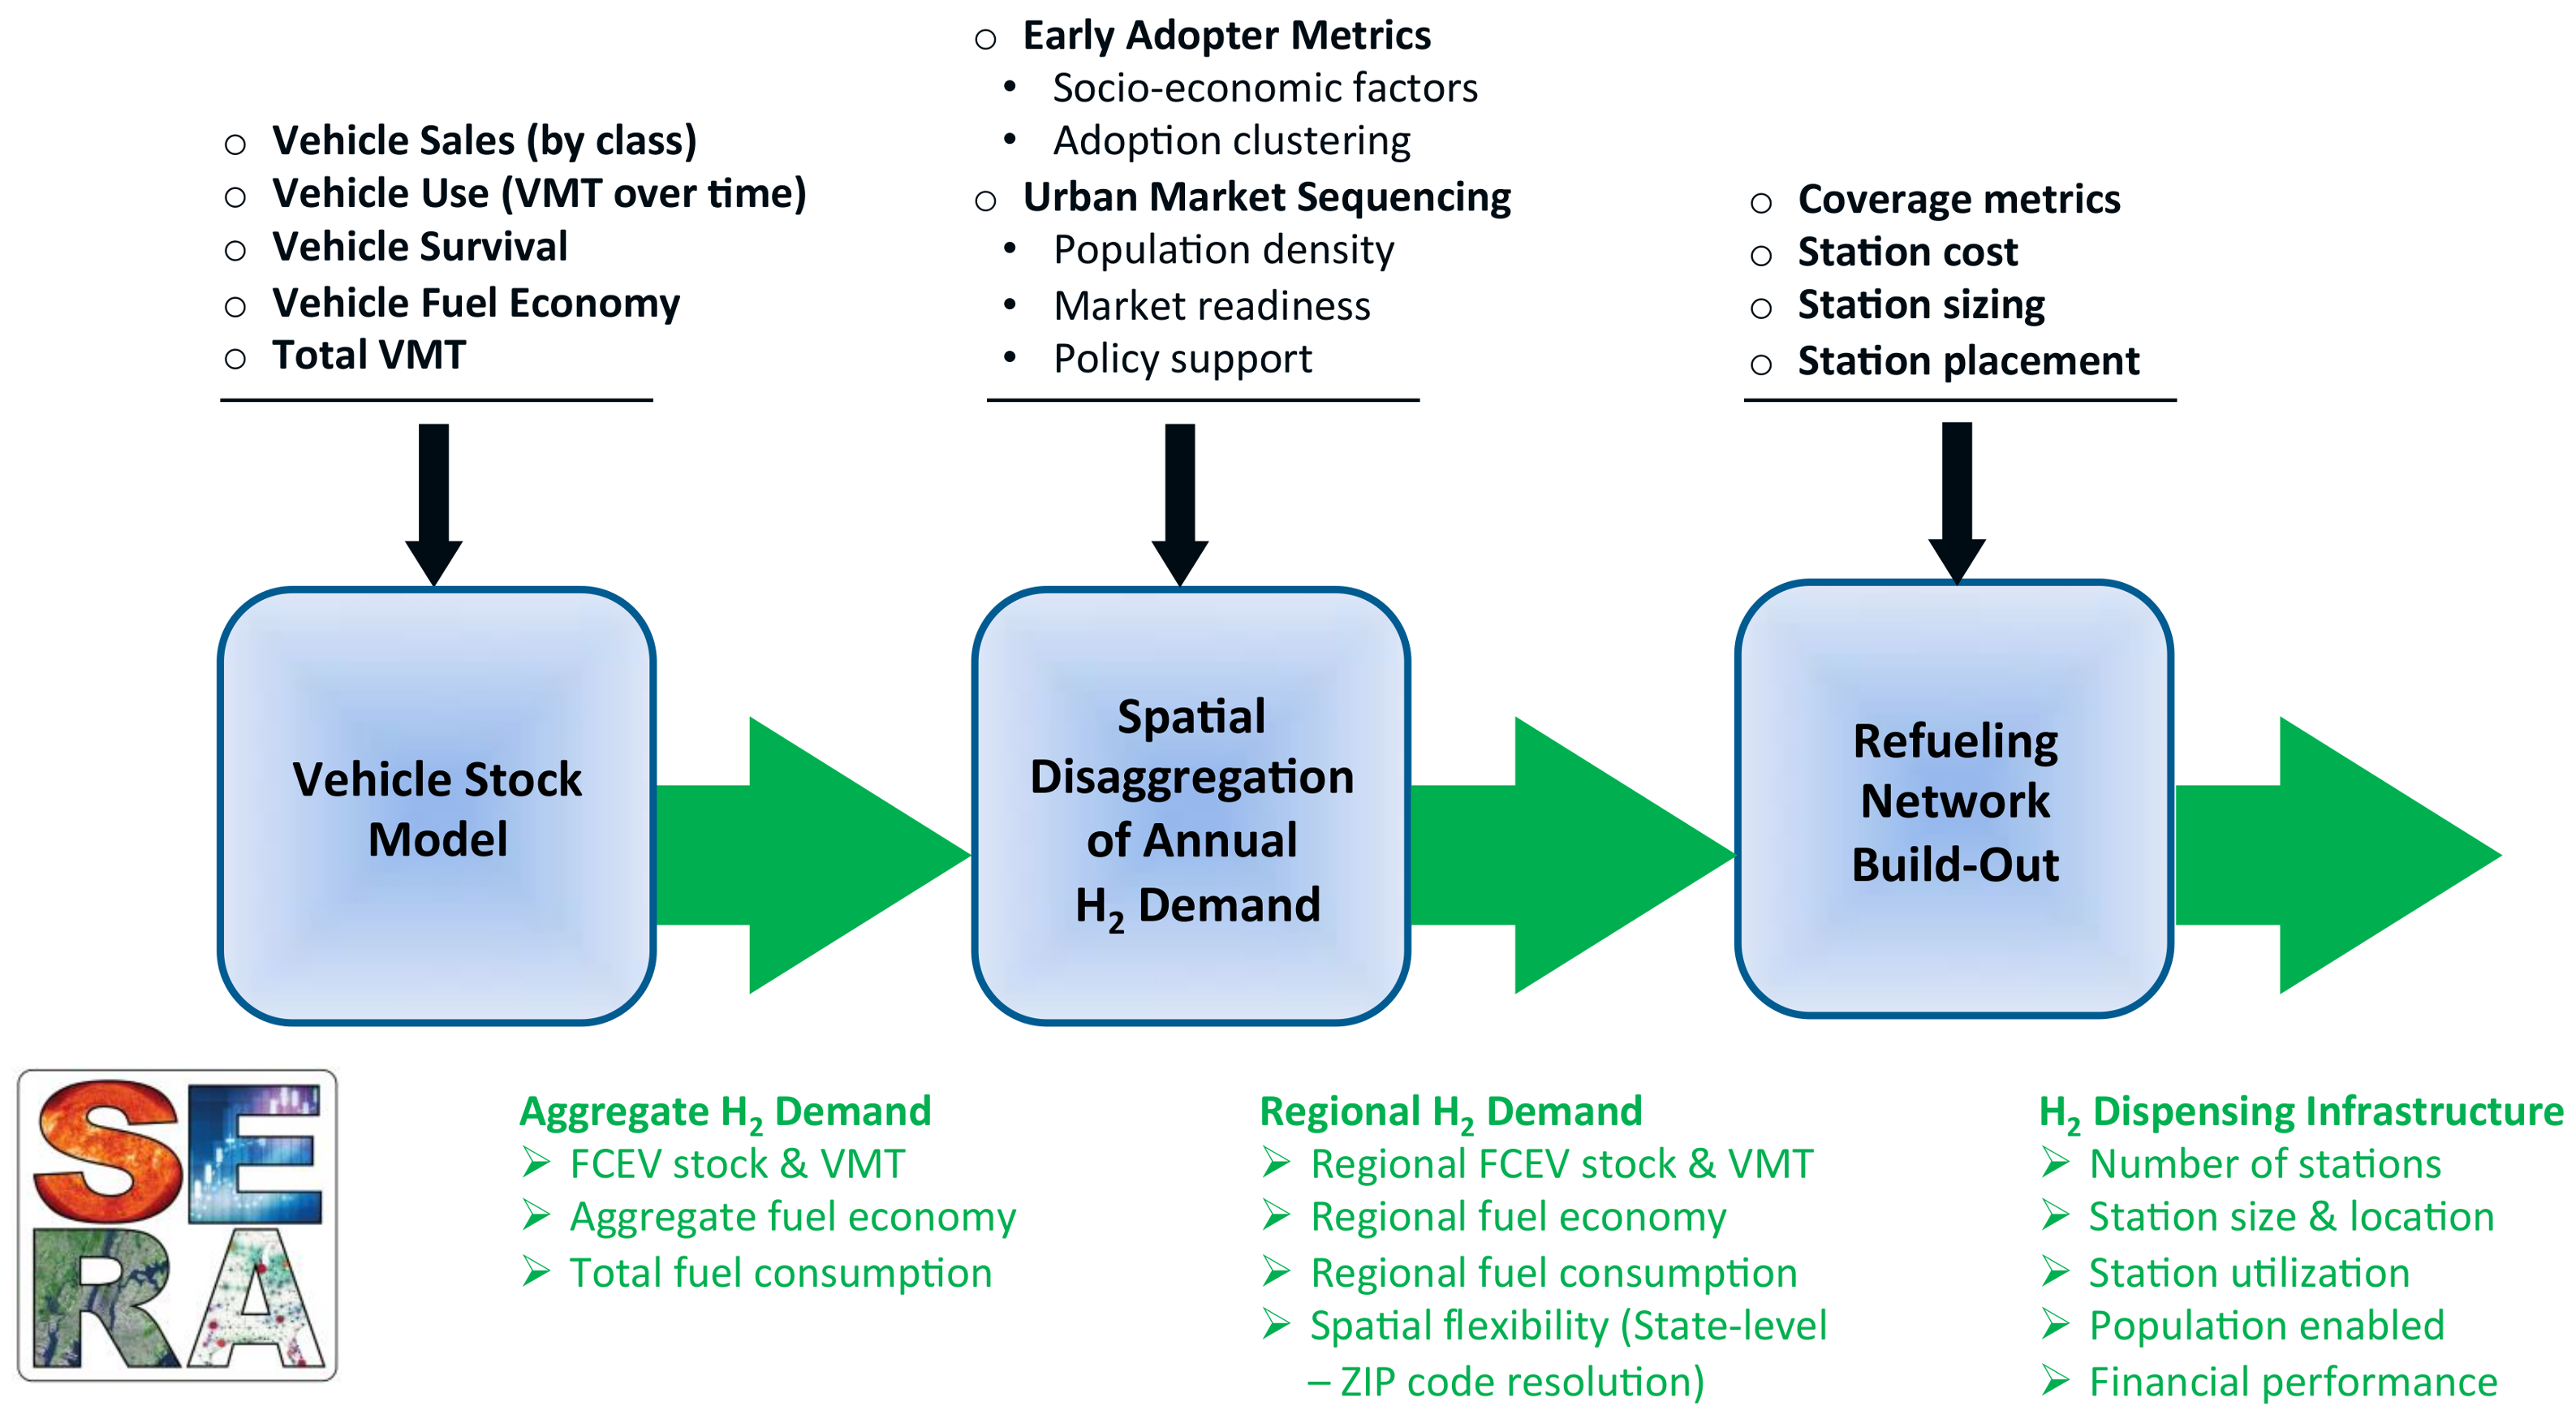
The demand-side and refueling infrastructure buildout modules of SERA projects geospatially and temporally resolved scenarios of hydrogen refueling infrastructure deployment based on projected demand for hydrogen in the LDV sector, following three steps (
Figure 1) [
44]:
Based on vehicle characteristics and exogenous FCEV adoption rates, a vehicle stock model computes aggregate hydrogen demand.
The vehicle adoption and associated hydrogen demand are spatially disaggregated to capture differences between the different geographic areas considered.
The expansion of the hydrogen refueling network over time is modelled to mimic strategic station deployment aimed at maximizing the network coverage, effectiveness, and profitability for the previously disaggregated FCEV adoption pattern.
3.1. Spatial Disaggregation
The SERA model’s demand disaggregation algorithm is based on the likelihood of early FCEV adoption based on early adopter metrics, and the strategic sequencing of hydrogen introduction into different urban markets.
3.1.1. Early Adopter Metrics
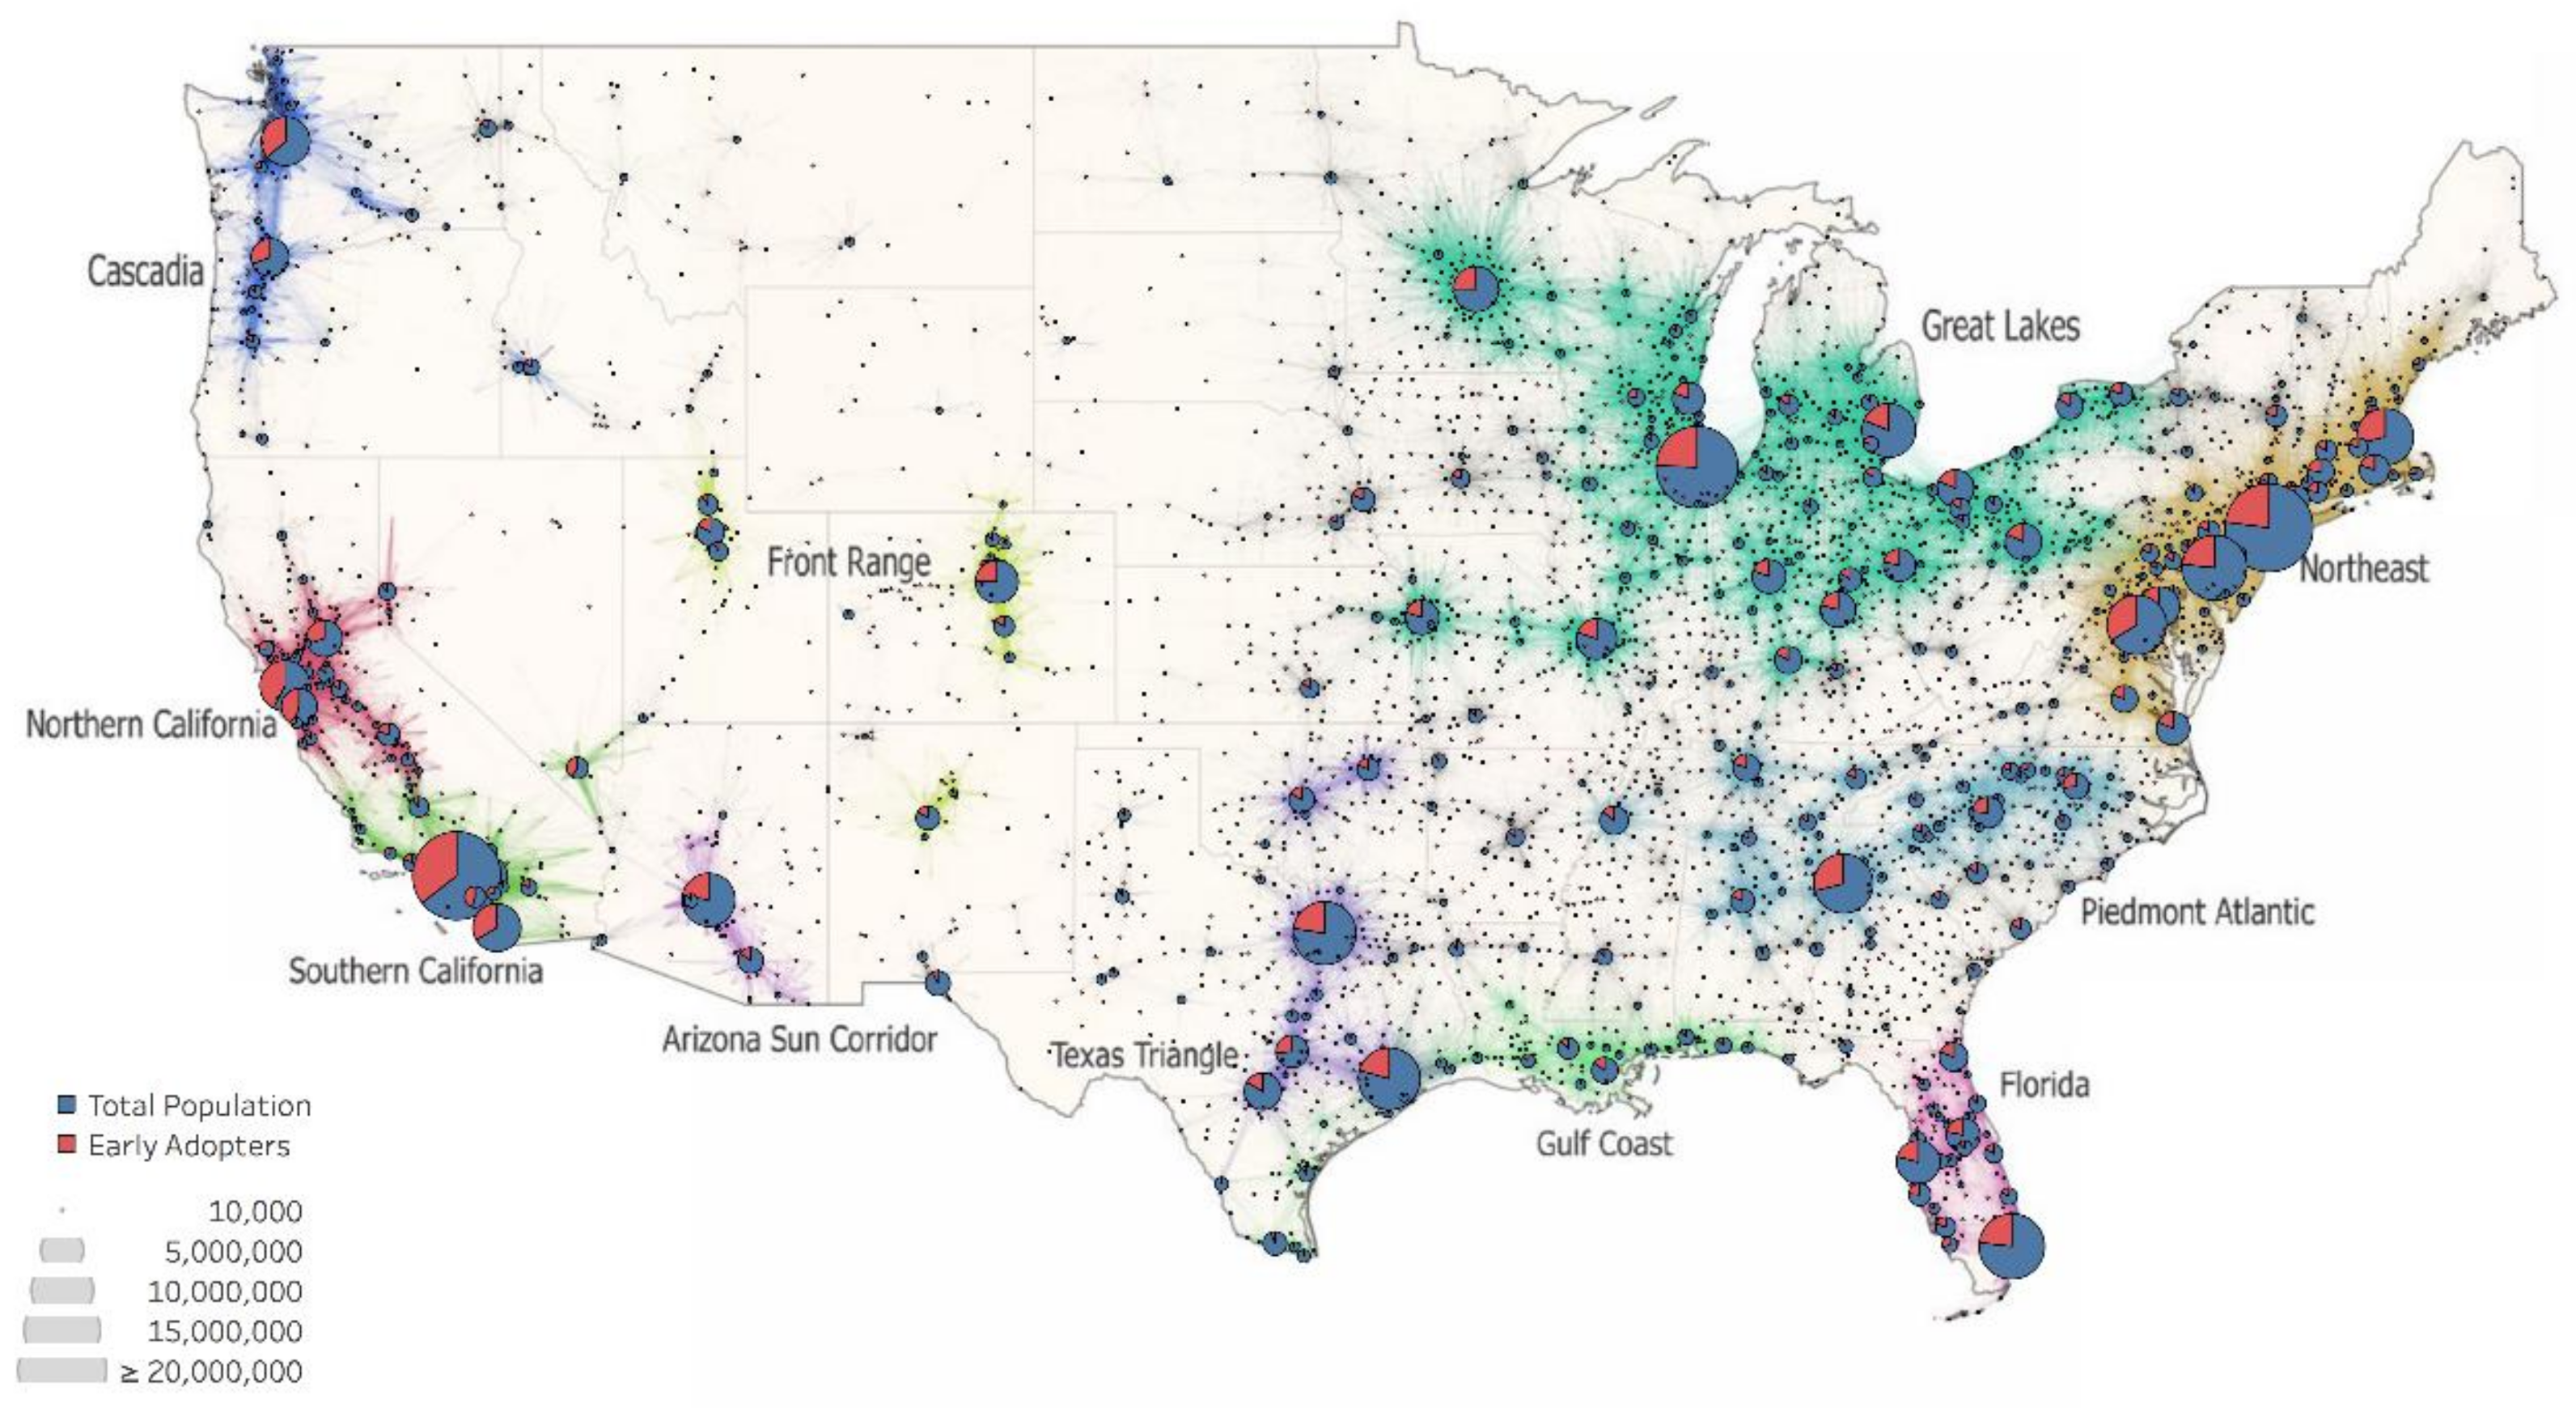
In particular, FCEV adoption over time in different U.S. urban areas [
45] relies on computing an “early adopters” metric (EAM) that is intended to capture the positive impact of several socioeconomic factors, such as population density and vehicle preference (based on adoption of alternative fuel and luxury vehicles [
44]), on FCEV adoption. EAM is the proxy metric used in the SERA analysis to predict the differential adoption of FCEVs over time. These EAM are computed from demographic and vehicle registration data, including estimated affinity of different neighborhoods for fuel cell vehicles (derived from historical sales of alternative fuel vehicles, such as hybrid electric vehicles (HEVs) and plug-in electric vehicles (PEVs). See [
44] for more details). Total population and number of early adopters are shown in
Figure 2 for the 621 largest urban areas in the United States considered in this study (including a total of 225 million people and a total of 63 million for the EAM). Results show how the EAM is not necessarily geographically correlated with population: Los Angeles, for example, has the highest total EAM in the country, but not the highest total EAM relative to population (San Francisco shows a higher EAM share), and cities in different areas of the country show very different EAM shares.
Based on the EAM described above and other considerations, an algorithm guides adoption sequencing: cities with higher population and population density introduce FCEVs earlier than other cities, in an effort to mimic realistic and effective adoption patterns for alternative transportation fuels.
3.1.2. Urban Market Sequencing
Different urban areas in the United States are characterized by different population density, and thus, the number of refueling stations required to guarantee access to a reliable refueling network to a market of early adopters varies (a certain number of stations is required both on a per-vehicle basis and on a per-mile base to guarantee access to a convenient refueling network). These stations are called “enabling stations” in the remainder of this paper. In particular, cities with lower population density require more stations per land area to achieve comparable levels of station availability, from a consumer perspective. For example, Pittsburgh and Sacramento have a similar total population, but Pittsburgh requires roughly 5 times more stations to achieve a similar level of coverage. A basic correlation, derived from Nicholas et al. [
31], is used to estimate the number of enabling stations required in any U.S. urban area. The result is the number of refueling stations that need to be deployed to open up FCEV markets (i.e., enable adoption) to early adopters in each city, cluster of cities, or region.
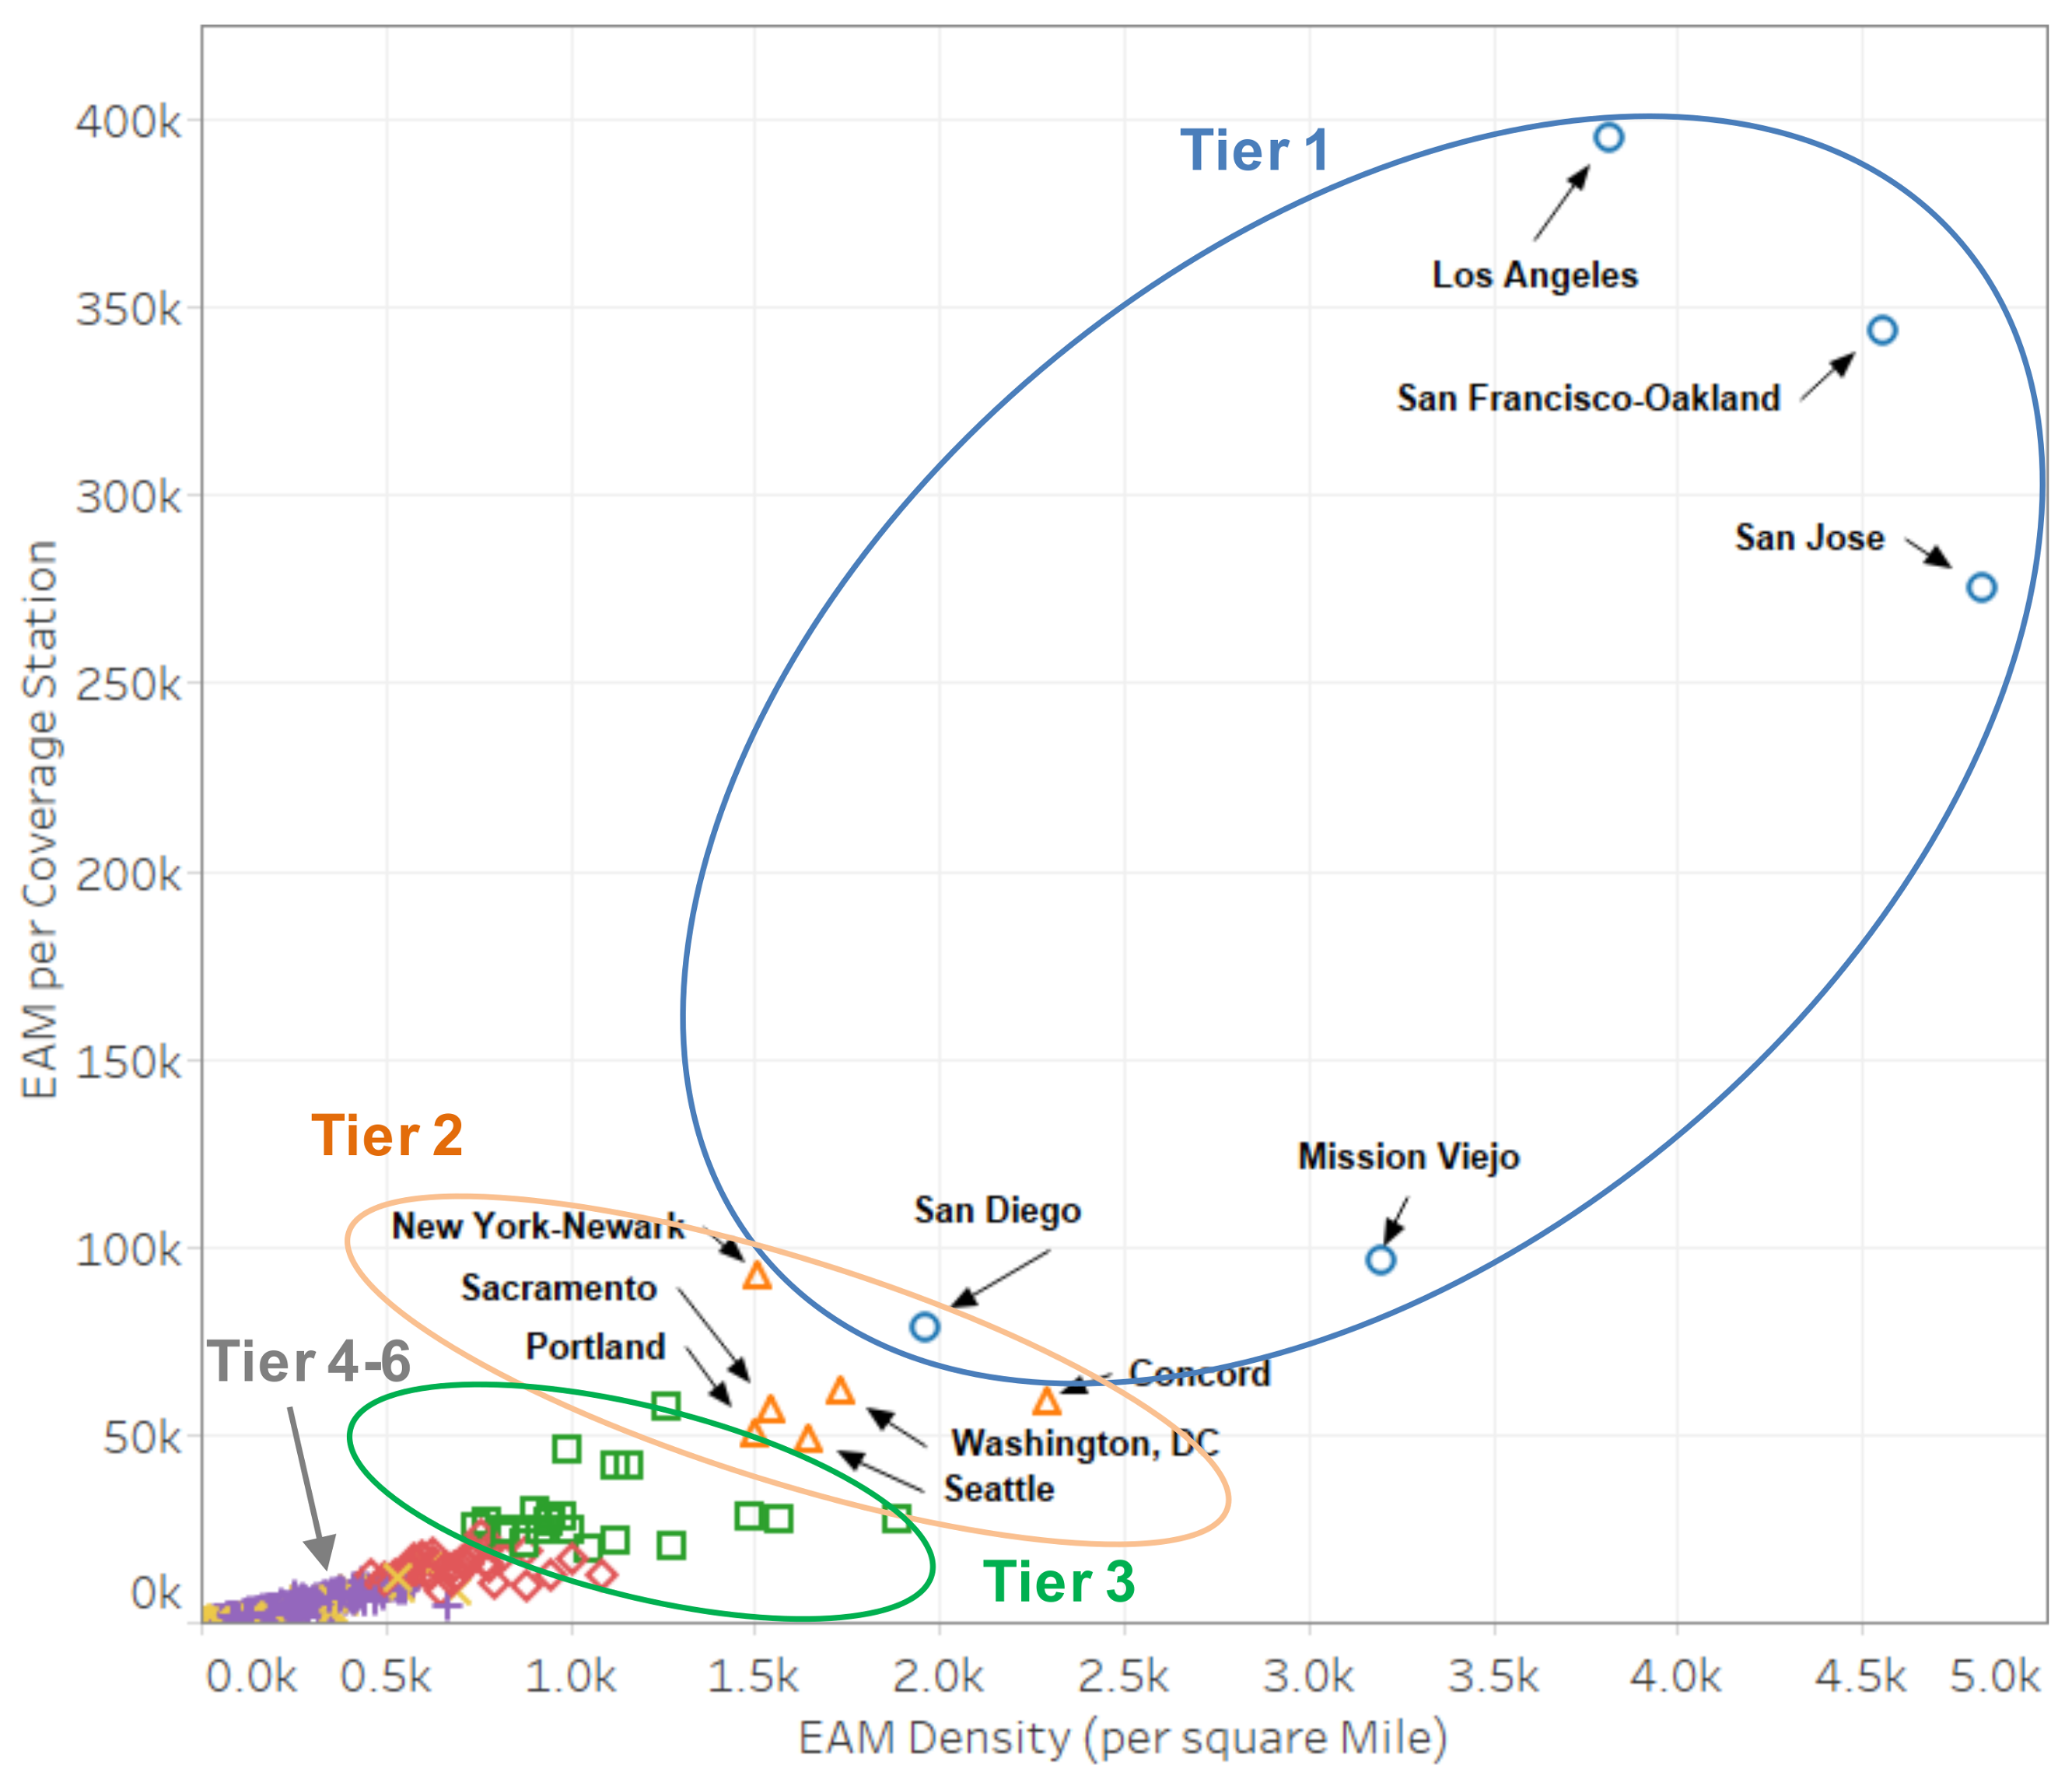
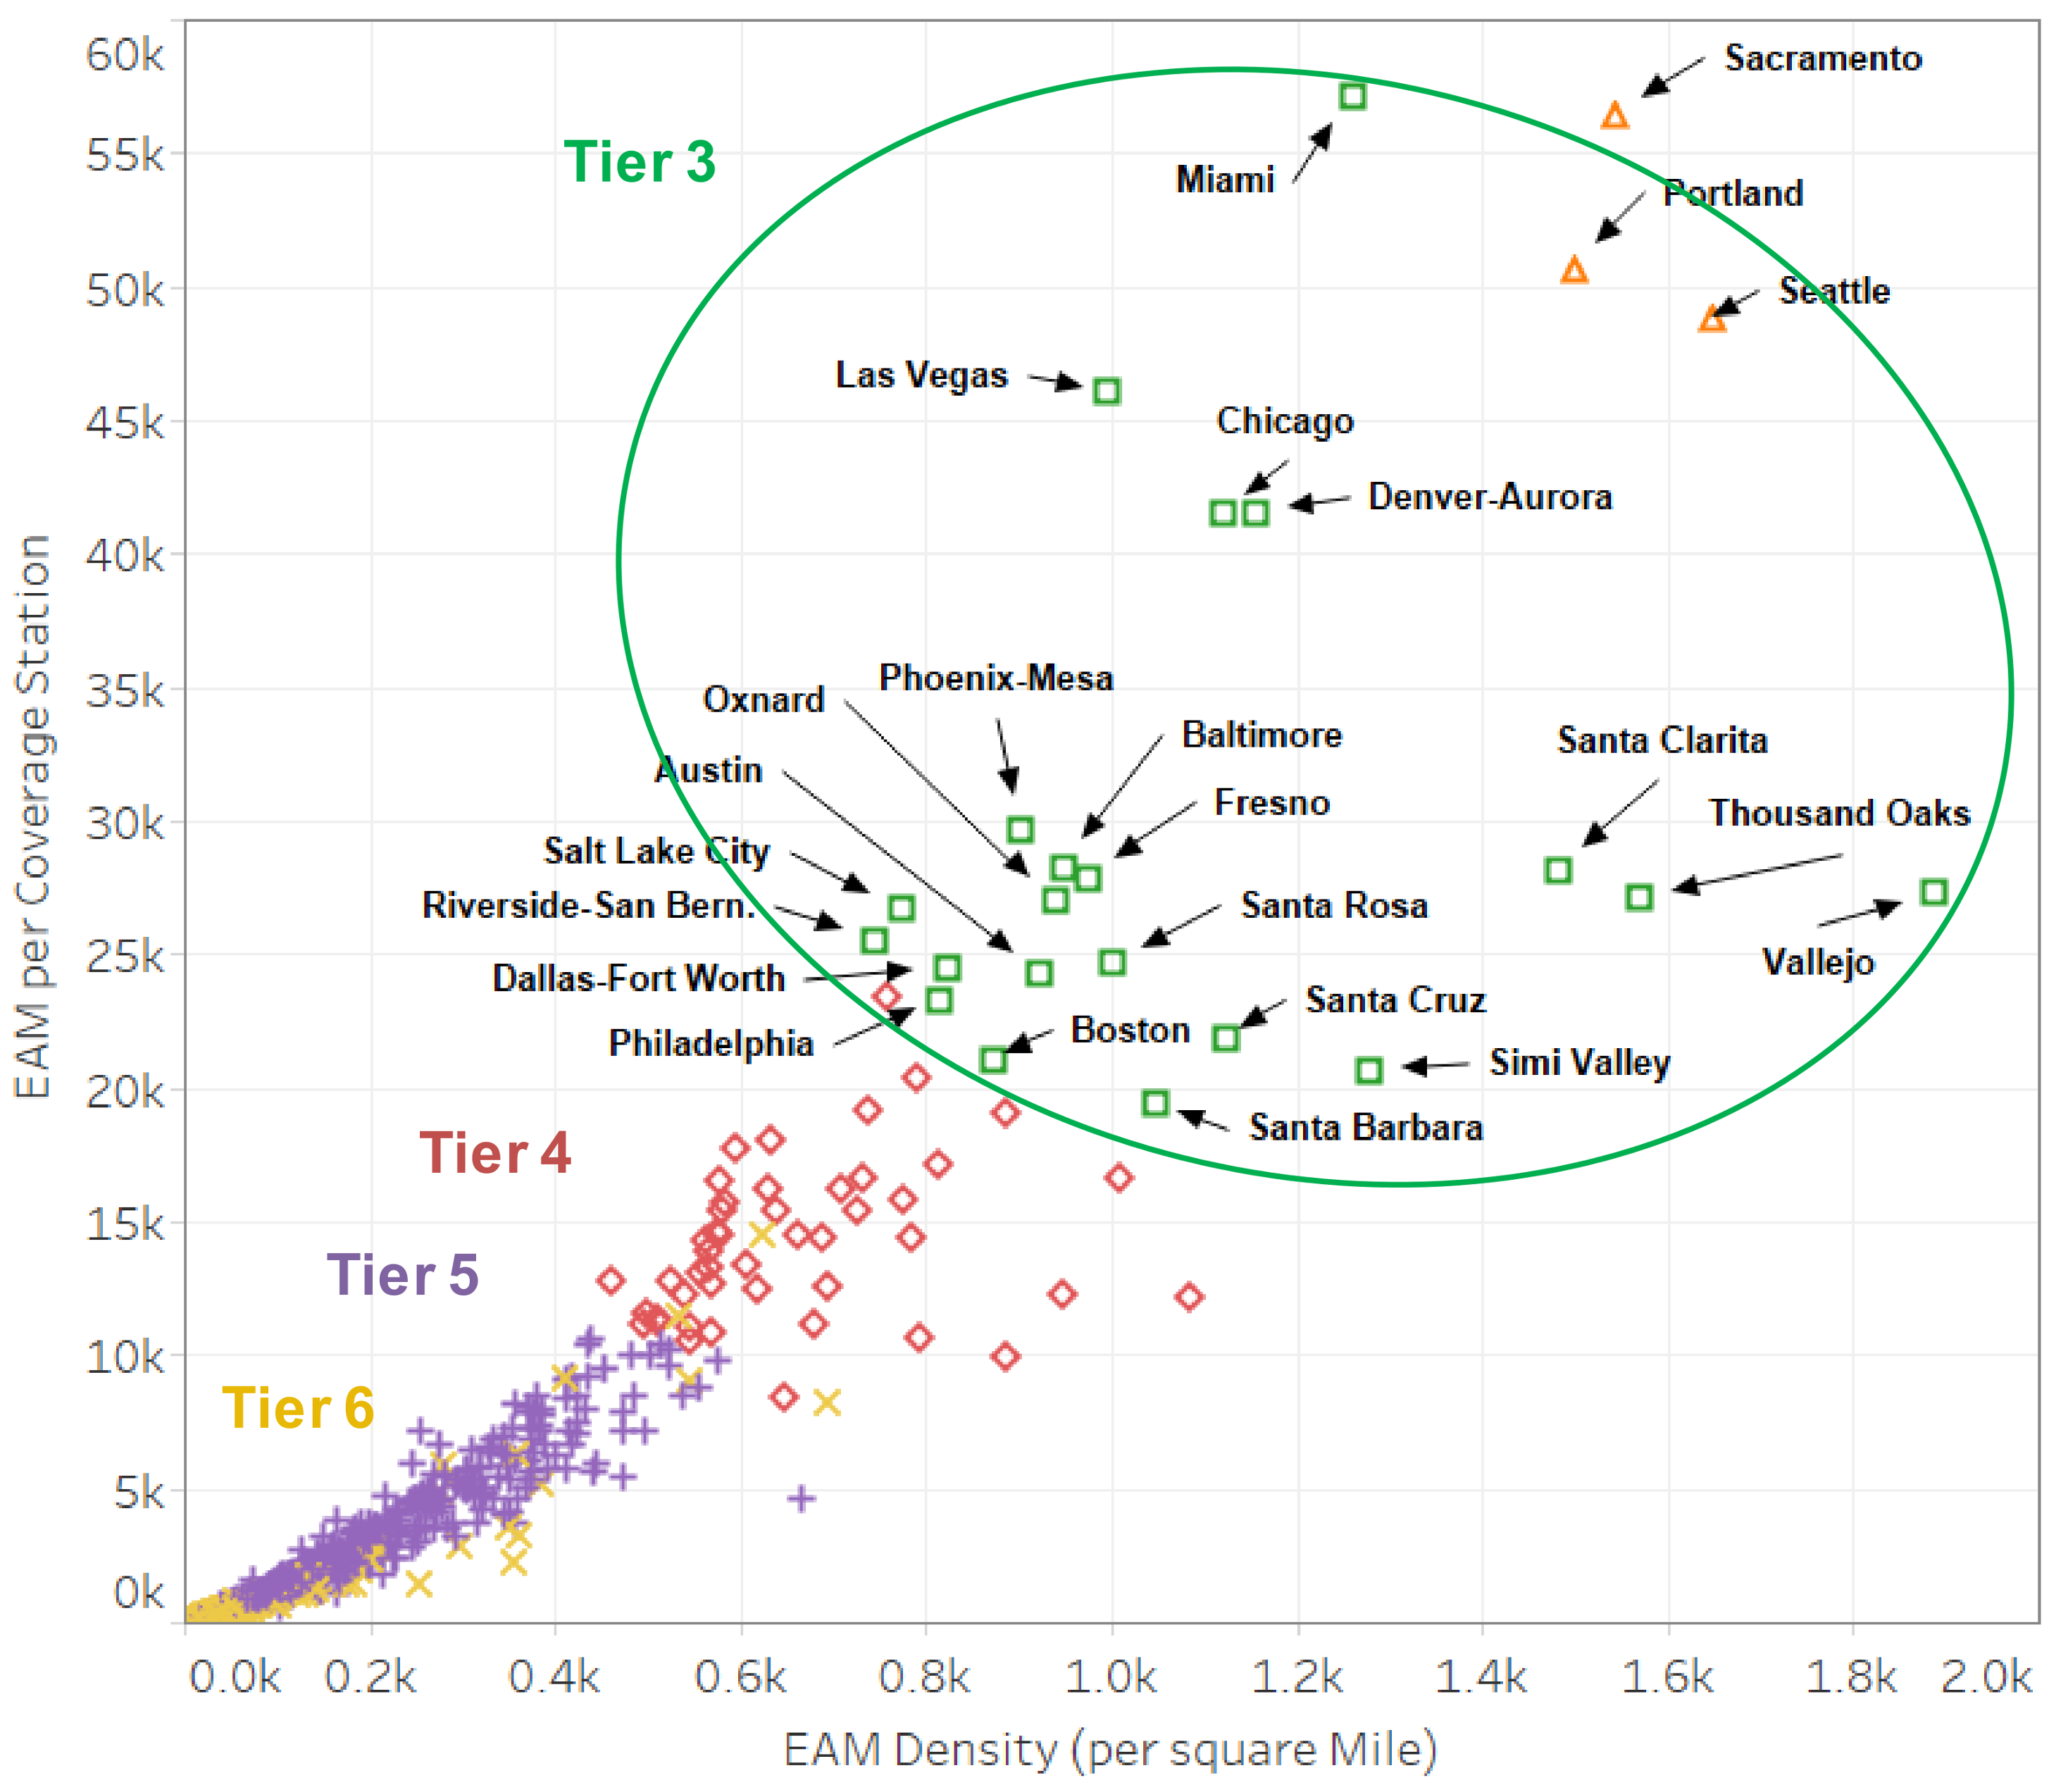
The order in which different urban markets will be opened to hydrogen depends upon a number of different factors, including local government support, private industry interests, and marketing strategies. For the scenarios developed here, the hydrogen refueling station adoption sequence is estimated to prioritize introduction in urban markets in terms of both the geographic density of early adopters (early adopters per square mile) and the number of early adopters per enabling station (potential costumers per refueling station). This prioritization is shown numerically in
Figure 3, with the EAM per station shown on the vertical axis, and the EAM density per square mile on the horizontal axis.
These two metrics can be interpreted as prioritizing urban markets in terms of the effectiveness of placing a limited total number of hydrogen stations (vertical axis) and serving the density of early adopters within each urban area market (horizontal axis). This suggests that urban areas in the top right corner (Tier 1) would be higher priority markets, and a limited number of coverage stations would be allocated to one urban area after another, moving downwards towards the bottom left corner of the figure (Tiers 2–6). Tier 1 is composed of a handful of cities in California. This prioritization of California cities is not surprising, given the large fraction of national HEV and PEV sales in California, as well as the generally high population density of many California urban areas compared to other major U.S. urban areas. Notably, three of the urban markets in Tier 2 are also cities in California: San Diego, Sacramento, and Concord. Additional Tier 2 cities with high population densities (and therefore, relatively few enabling stations required) and high concentrations of early adopters include Washington DC, New York, Miami, and Las Vegas. The early adopters per enabling station ratio drops by half moving downward into Tier 3, and by a factor of five, moving from Tier 2 to Tier 4. Many urban areas have a relatively high number of early adopters, due to a large share of HEV and PEV sales, but fall into Tier 3 or 4, due to low population density and a large number of enabling stations required. While it does not capture all the drivers of potential FCEV adoption sequencing in the country, this approach proposes a rational sequencing that strategically paces out the deployment of hydrogen refueling stations to maximize station utilization and FCEV market growth.
3.2. Refueling Network Buildout (Station Sizing and Placement)
SERA uses simplified representations of FCEV aging, vehicle-miles travelled (VMT), and other LDV stock-turnover assumptions, based on a modified version of the VISION algorithm [
47], to compute FCEV stock, VMT, and hydrogen demand in each region modelled (in this case, for each U.S. urban area). The demand for hydrogen is then used to compute hydrogen supply and infrastructure requirements, including hydrogen production and distribution networks.
FCEV refueling stations are sized according to an algorithm that mimics historical experience with gasoline refueling stations. Stations are geographically placed to maximize overall coverage within the area to which they are assigned (typically urban area or zip code). The spatiotemporal station placement technique relies on three algorithms that are applied in sequence: first, the time-dependent hydrogen demand for the urban area is used to estimate the number of stations that would be built in each year. Based on those station counts and on an average station capacity for the year, the stations are sized stochastically according to an empirically-determined capacity distribution. Finally, the stations are located stochastically within the urban area of interest according to EAM density. The station-count algorithm is deterministic, whereas the station sizing and location algorithms are stochastic.
Algorithm 1. Station Counts (deterministic):
Let
be the demand for hydrogen in year
(note that the demand for hydrogen is an exogenous input and is assumed to be known for every year). The number of hydrogen refueling stations at year
,
is
where
This algorithm results in a situation where the average station capacity is small in early years, but approaches the maximum size as time progresses. For each year , stations are built with capacity and location chosen according to the following two algorithms.
Algorithm 2. Station Capacity Sizing (stochastic):
Let
be uniform
independent, identically distributed random variables, where
is the station number. The capacity of the station
, which is constructed at time
, is given by
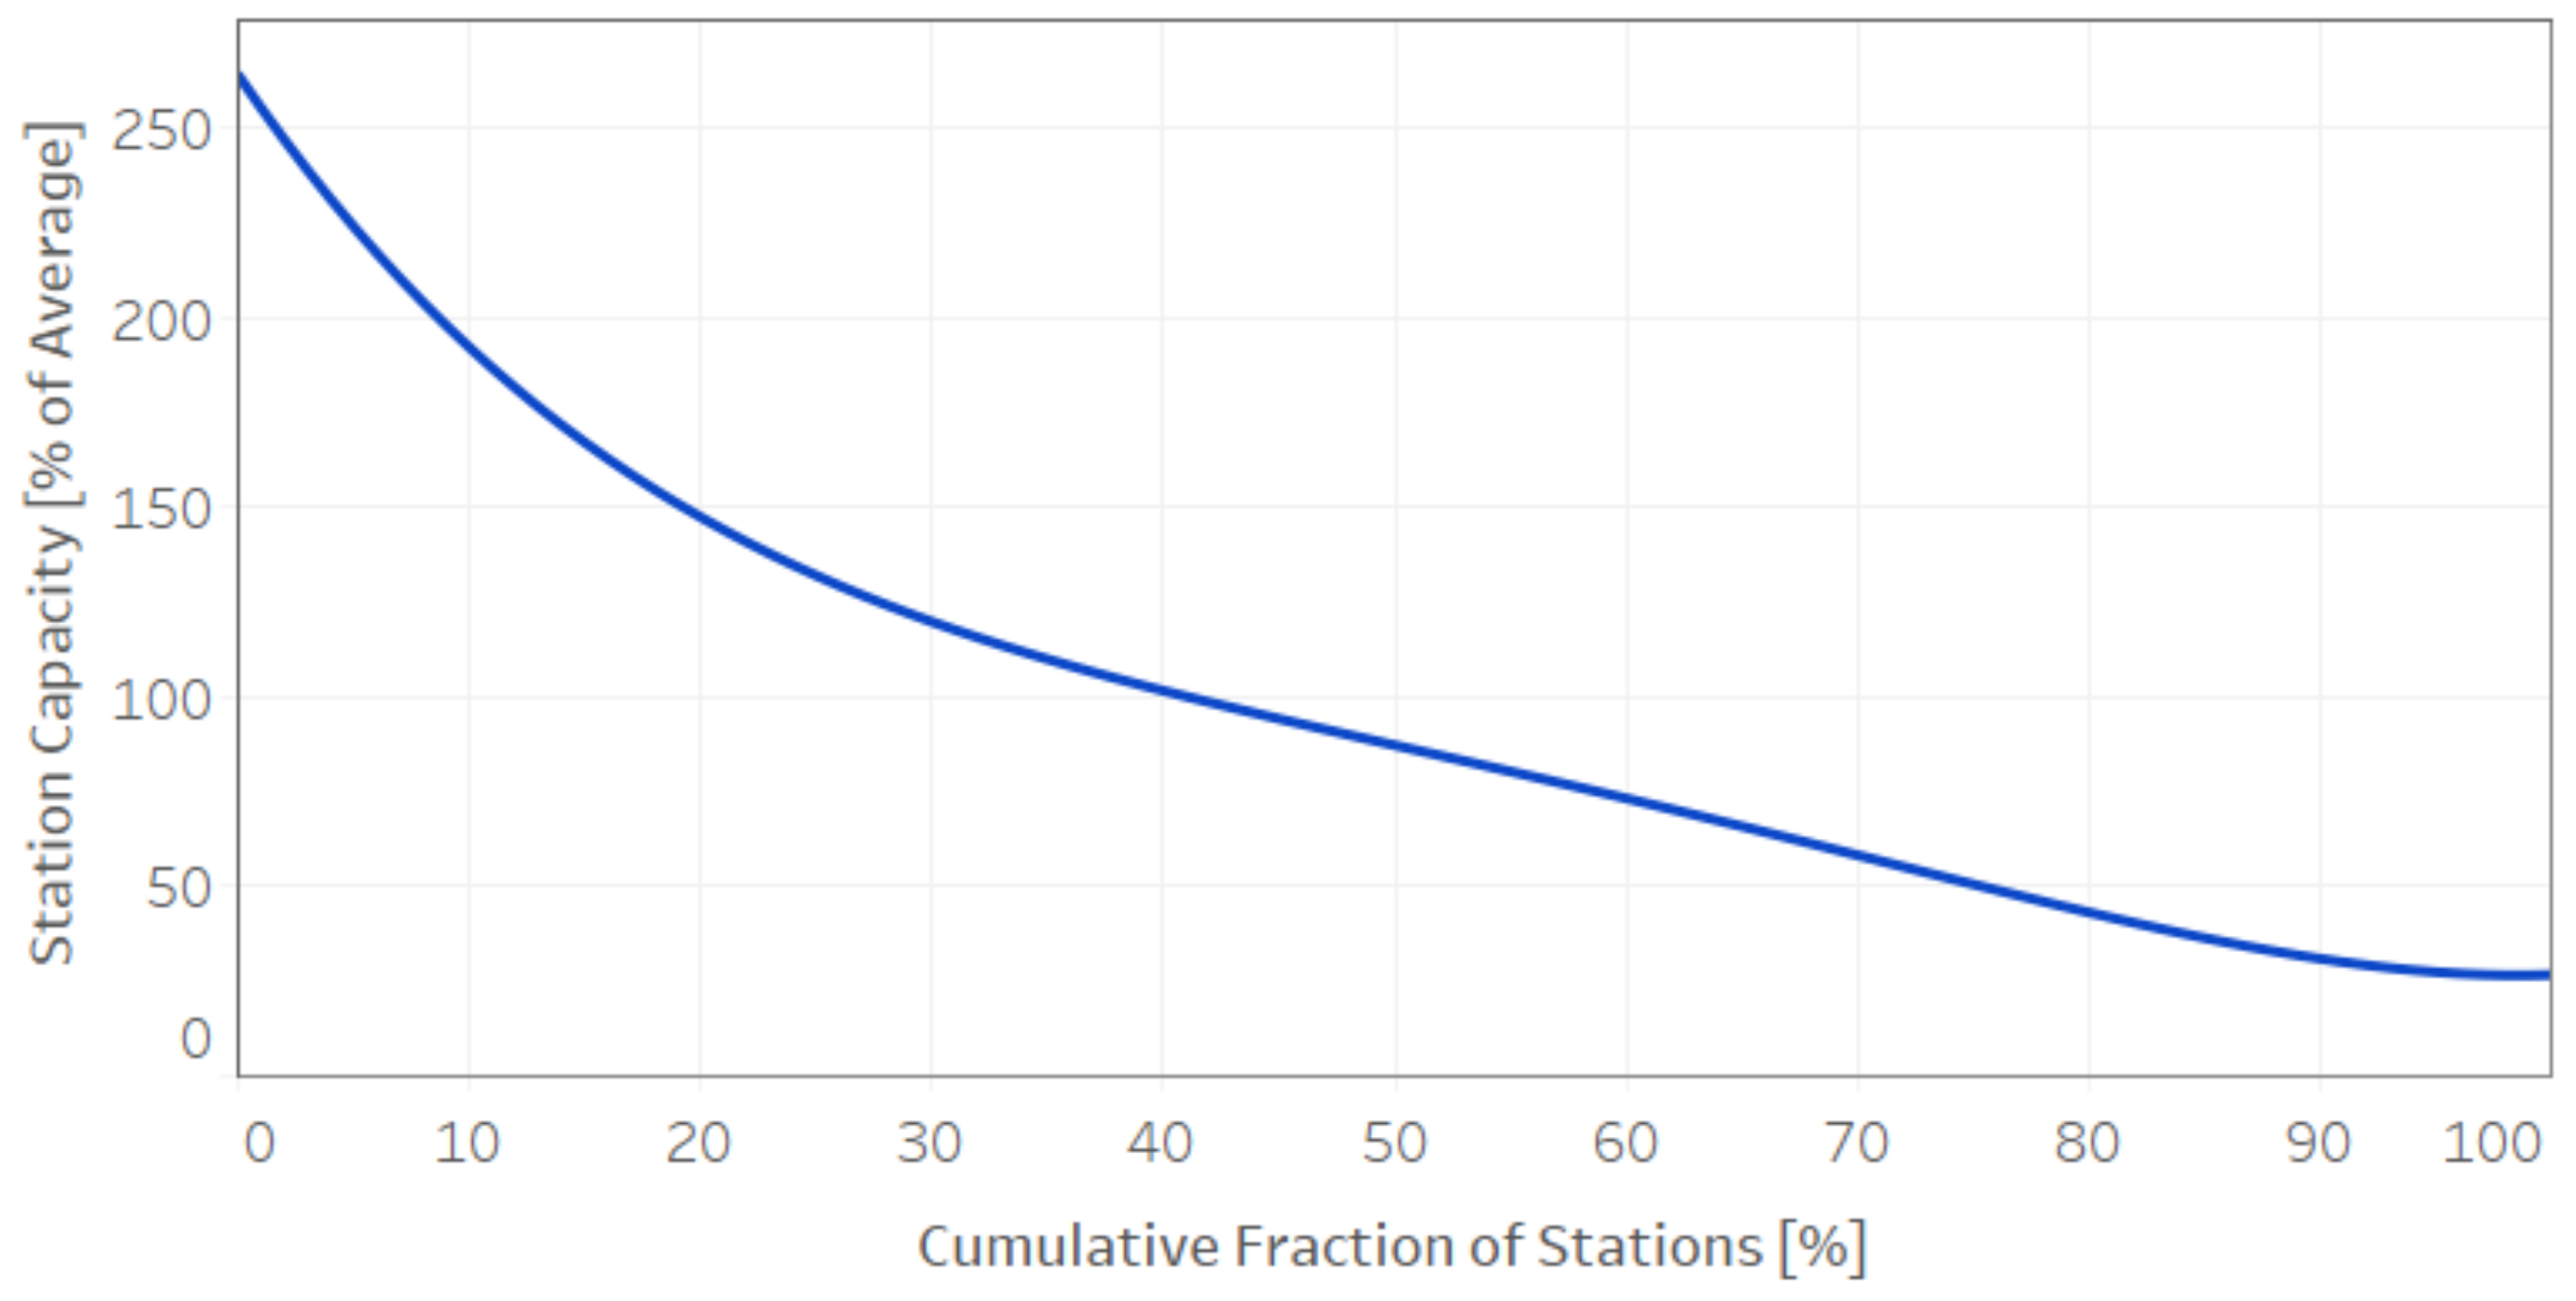
This results in the station capacity distribution shown in
Figure 4.
Algorithm 3. Station Fine-Grid Placement (stochastic):
While stations have been allocated to each region of interest (e.g., urban areas), there might be interest in further refining the geographical distribution of such stations at a finer grid. This problem, which is highly dependent on local conditions, such as traffic flow, availability and cost of space, marketing considerations, etc., has been approximated in SERA, where the probability of a station being located at a particular point depends upon population density, the affinity of different neighborhoods for FCEVs, the location of roadways, and the location and size of previous stations [
48]. In particular, to identify the latitude and longitude of the
ith station (
), non-uniform random variables are drawn over a finely gridded probability distribution that evolves over the region of interest as each station is placed.
4. Case Studies
In this paper, we propose two case studies to explore alternative example scenarios of FCEV adoption and deployment of related refueling infrastructure in the United States, based on a recent study [
49] (detailed results are available online at
http://maps.nrel.gov/hydra):
Urban Markets scenario—deployment focused in California, where the State has committed significant resources to promote FCEV adoption [
9], and in a limited number of big cities across the country. This scenario is intended to illustrate a somewhat limited national adoption of FCEVs that remain restricted to specific regions where greater market potential has been identified (mainly Tier 1 and 2 urban areas).
National Expansion scenario—widespread adoption of FCEVs across the entire country. This scenario is intended to illustrate an aggressive adoption of FCEVs in the entire United States, and a widespread deployment of hydrogen refueling stations covering the entire nation, taking advantage of significant economies of scale and successful market evolution.
While these scenarios are not in any way a forecast of FCEV deployment nor a projection of future markets, their comparison allows for understanding the requirements, both in terms of infrastructure deployment and government support, to promote early roll-out of refueling infrastructure, of alternative adoption schemes for FCEVs. A logistic function is used to quantify the market share of FCEVs over time in the two scenarios, based upon initial sales estimates in California [
9]. The general logistic equation applied is the following:
where
St = FCEV market share of annual LDV sales in year
t;
Sto = beginning FCEV market share in year
to, estimated based on expected near-term FCEV sales;
M = maximum FCEV market share (as
t approaches 2100);
r = rate of market share growth (% per year);
= Time constant.
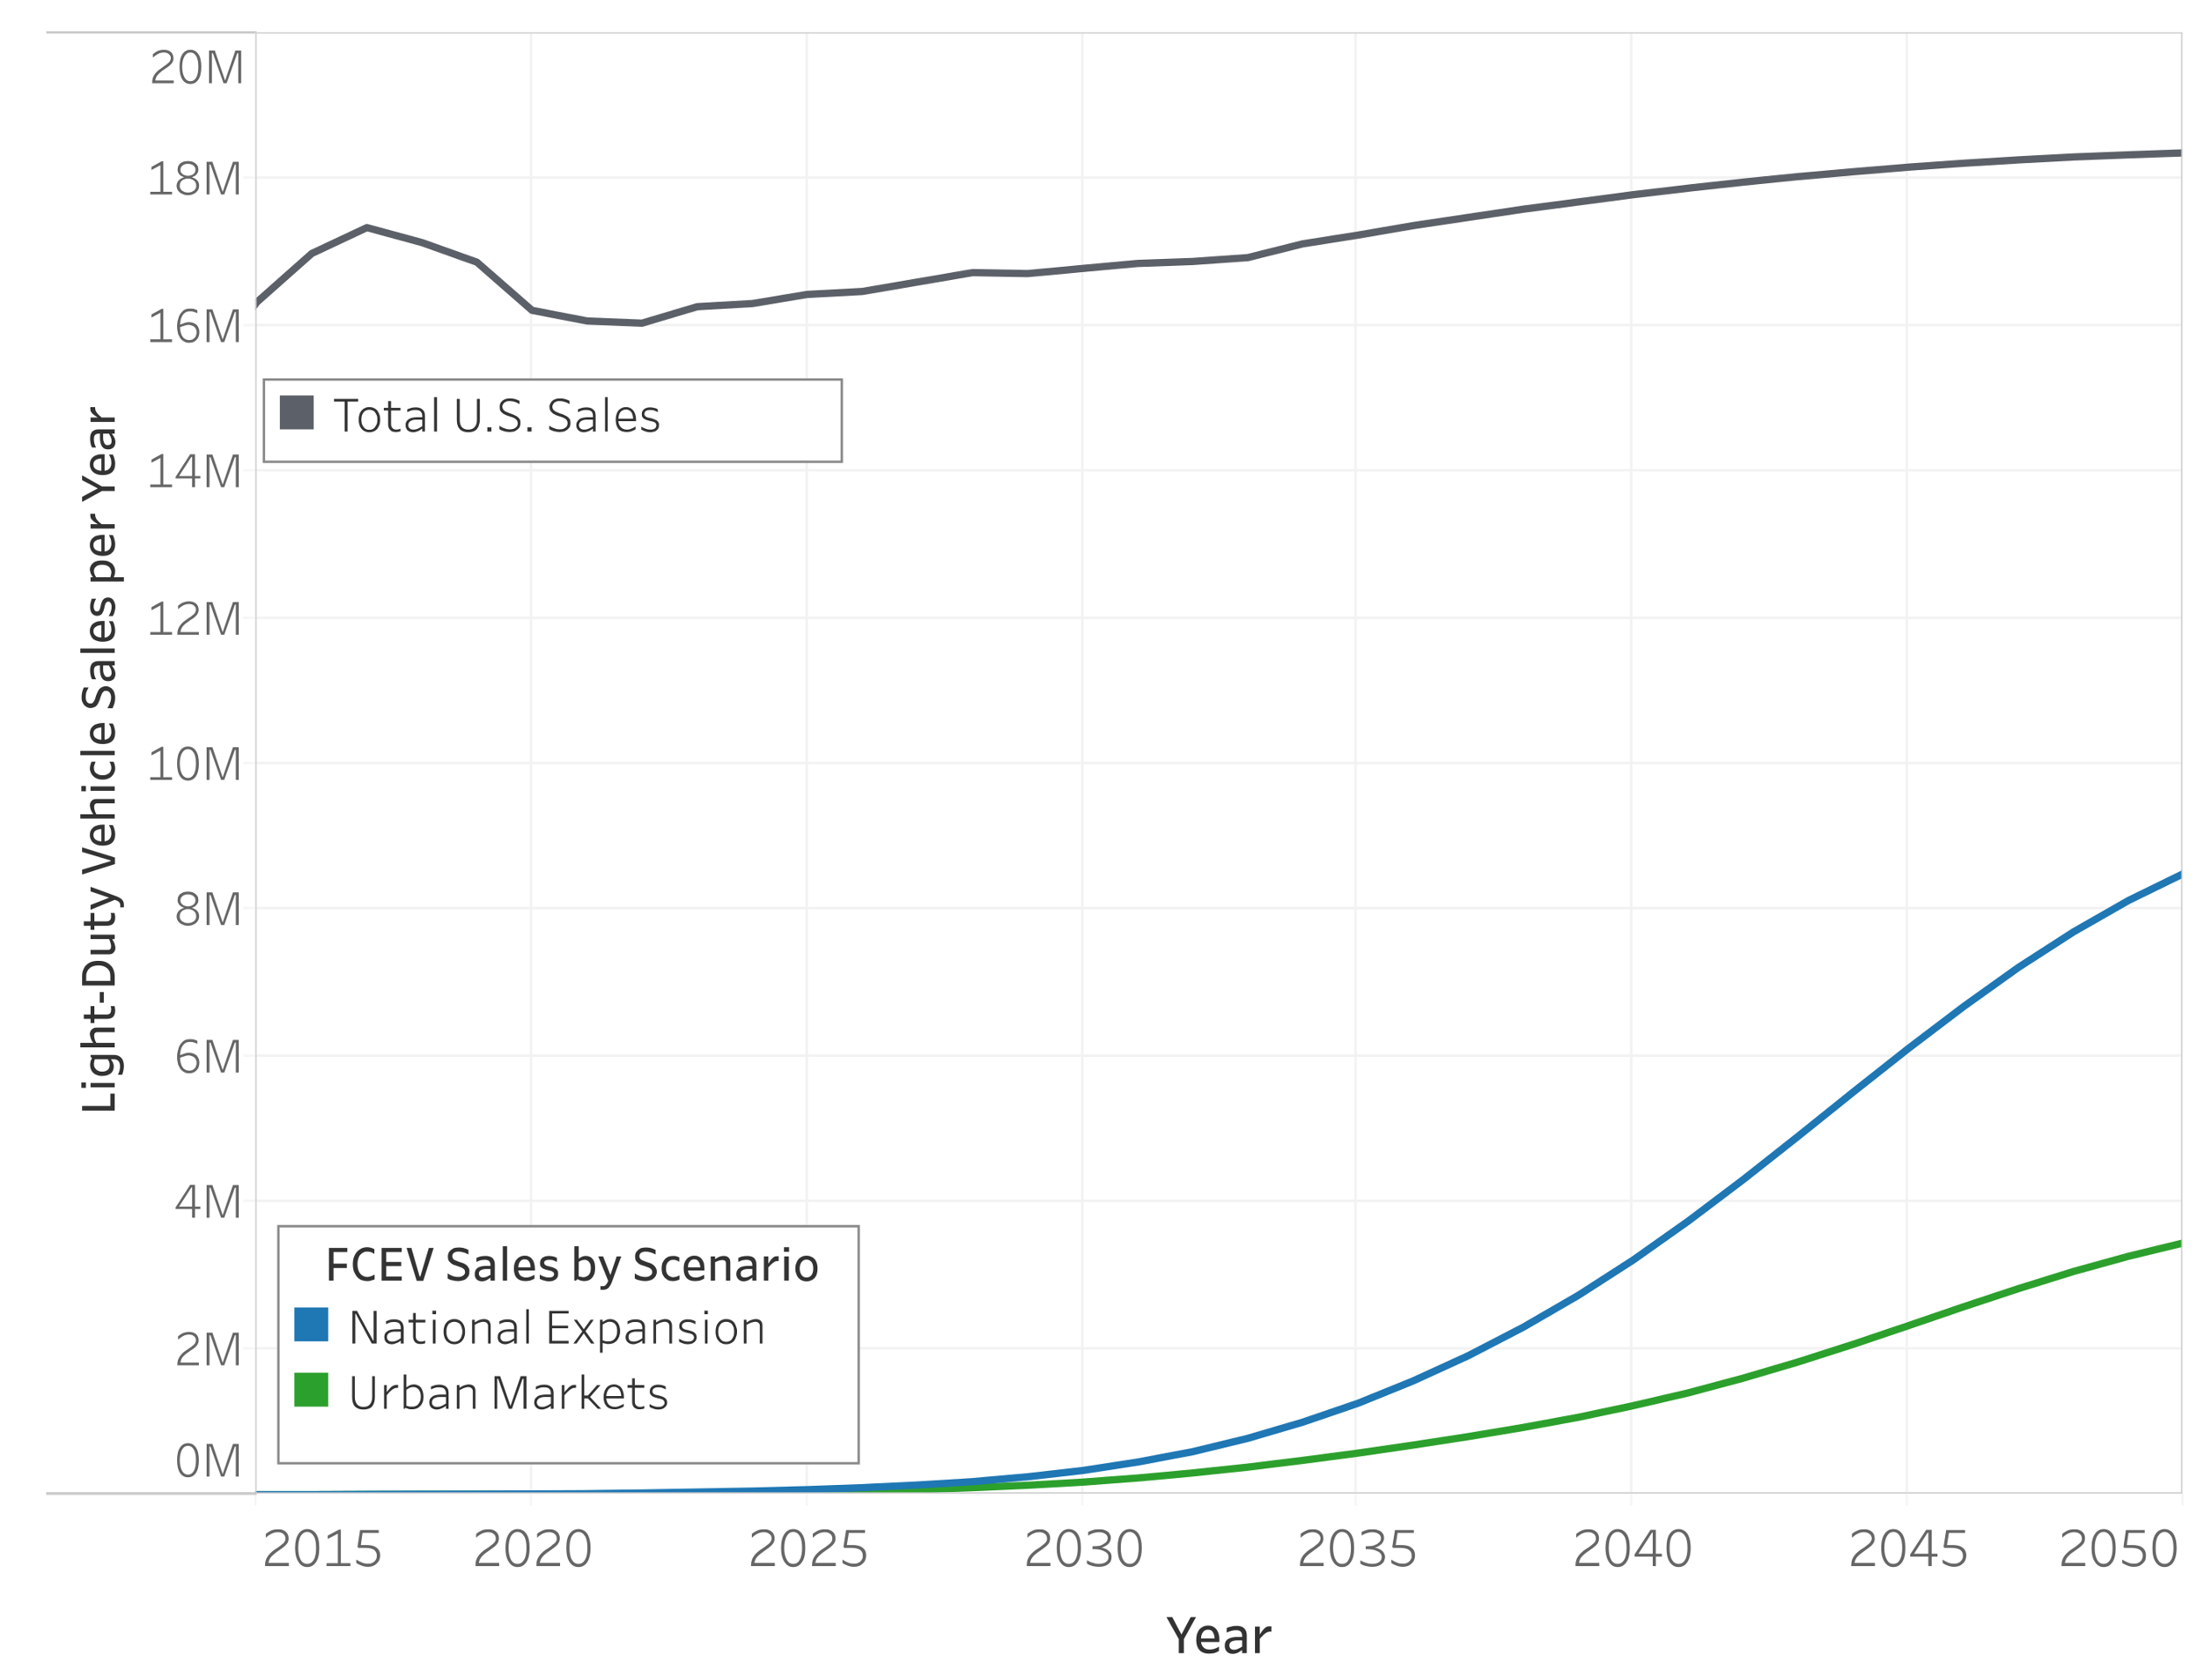
Figure 5 reports FCEV sales over time for the two scenarios considered in this paper, together with total LDV sales in the United States, as projected in the 2017 Annual Energy Outlook (AEO) [
50]. Note that near-term (2016–2020) FCEV sales match forecasts reported by the California Energy Commission [
2,
9], since California is the only U.S. state in which FCEVs are currently commercially available.
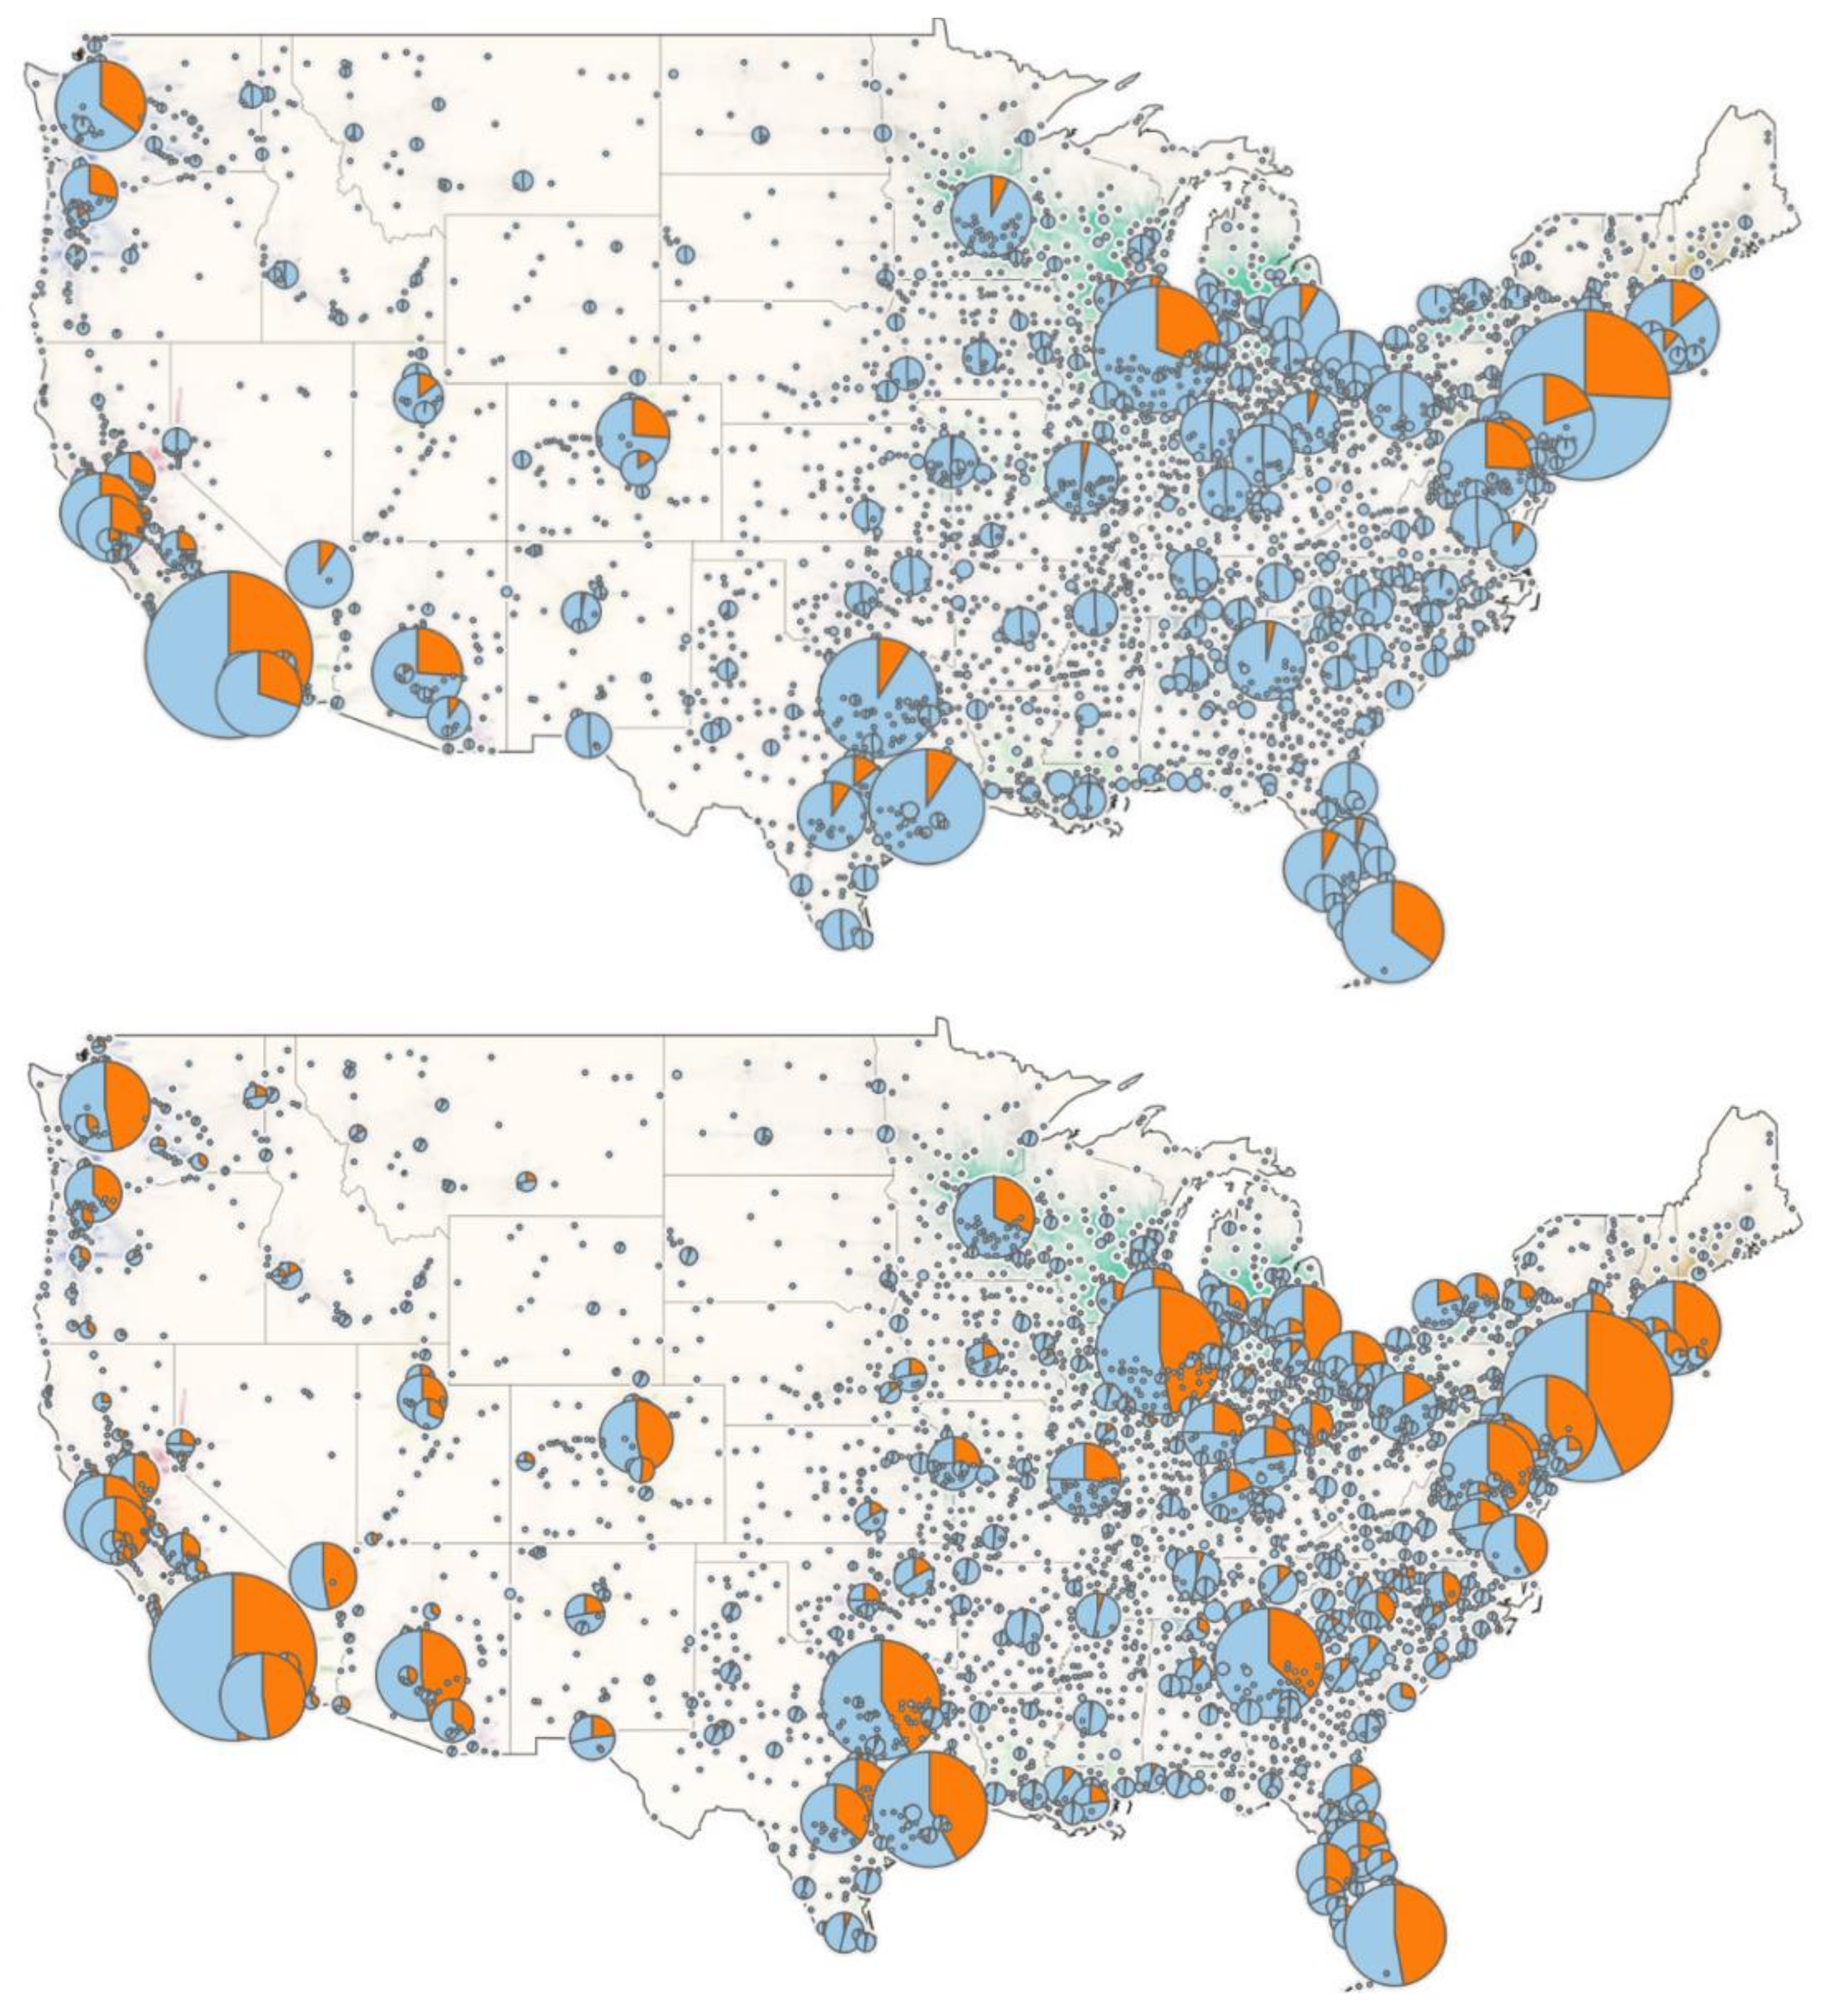
The two scenarios show a significantly different geographical adoption pattern, given the different markets available for FCEV deployment. The geographic distribution of FCEV sales in 2050, compared to total LDV sales, is illustrated in
Figure 6 for the two scenarios. FCEV sales are not only significantly higher in magnitude in the National Expansion scenario (bottom pane in
Figure 6) compared to the Urban Markets scenario (top pane in in
Figure 6), but are also distributed over more cities across the United States, rather than being limited to California and a few big cities serving as the only markets for hydrogen vehicles (which is the case for the Urban Markets scenario where sales are concentrated in the first adoption tiers shown in
Figure 3).
The scale and extent of the networks of hydrogen refueling stations required to support the FCEV adoption in the two case studies considered is fundamentally different, as summarized in
Table 2. In particular, the scale of FCEV deployment in the two case studies is driven by the different FCEV sales assumption, reported in
Figure 5. At the same time, the different spatial extent of the hydrogen refueling network, which is more concentrated in a smaller number of large cities in the Urban Markets scenario, determines the size of the stations deployed and their utilization rates.
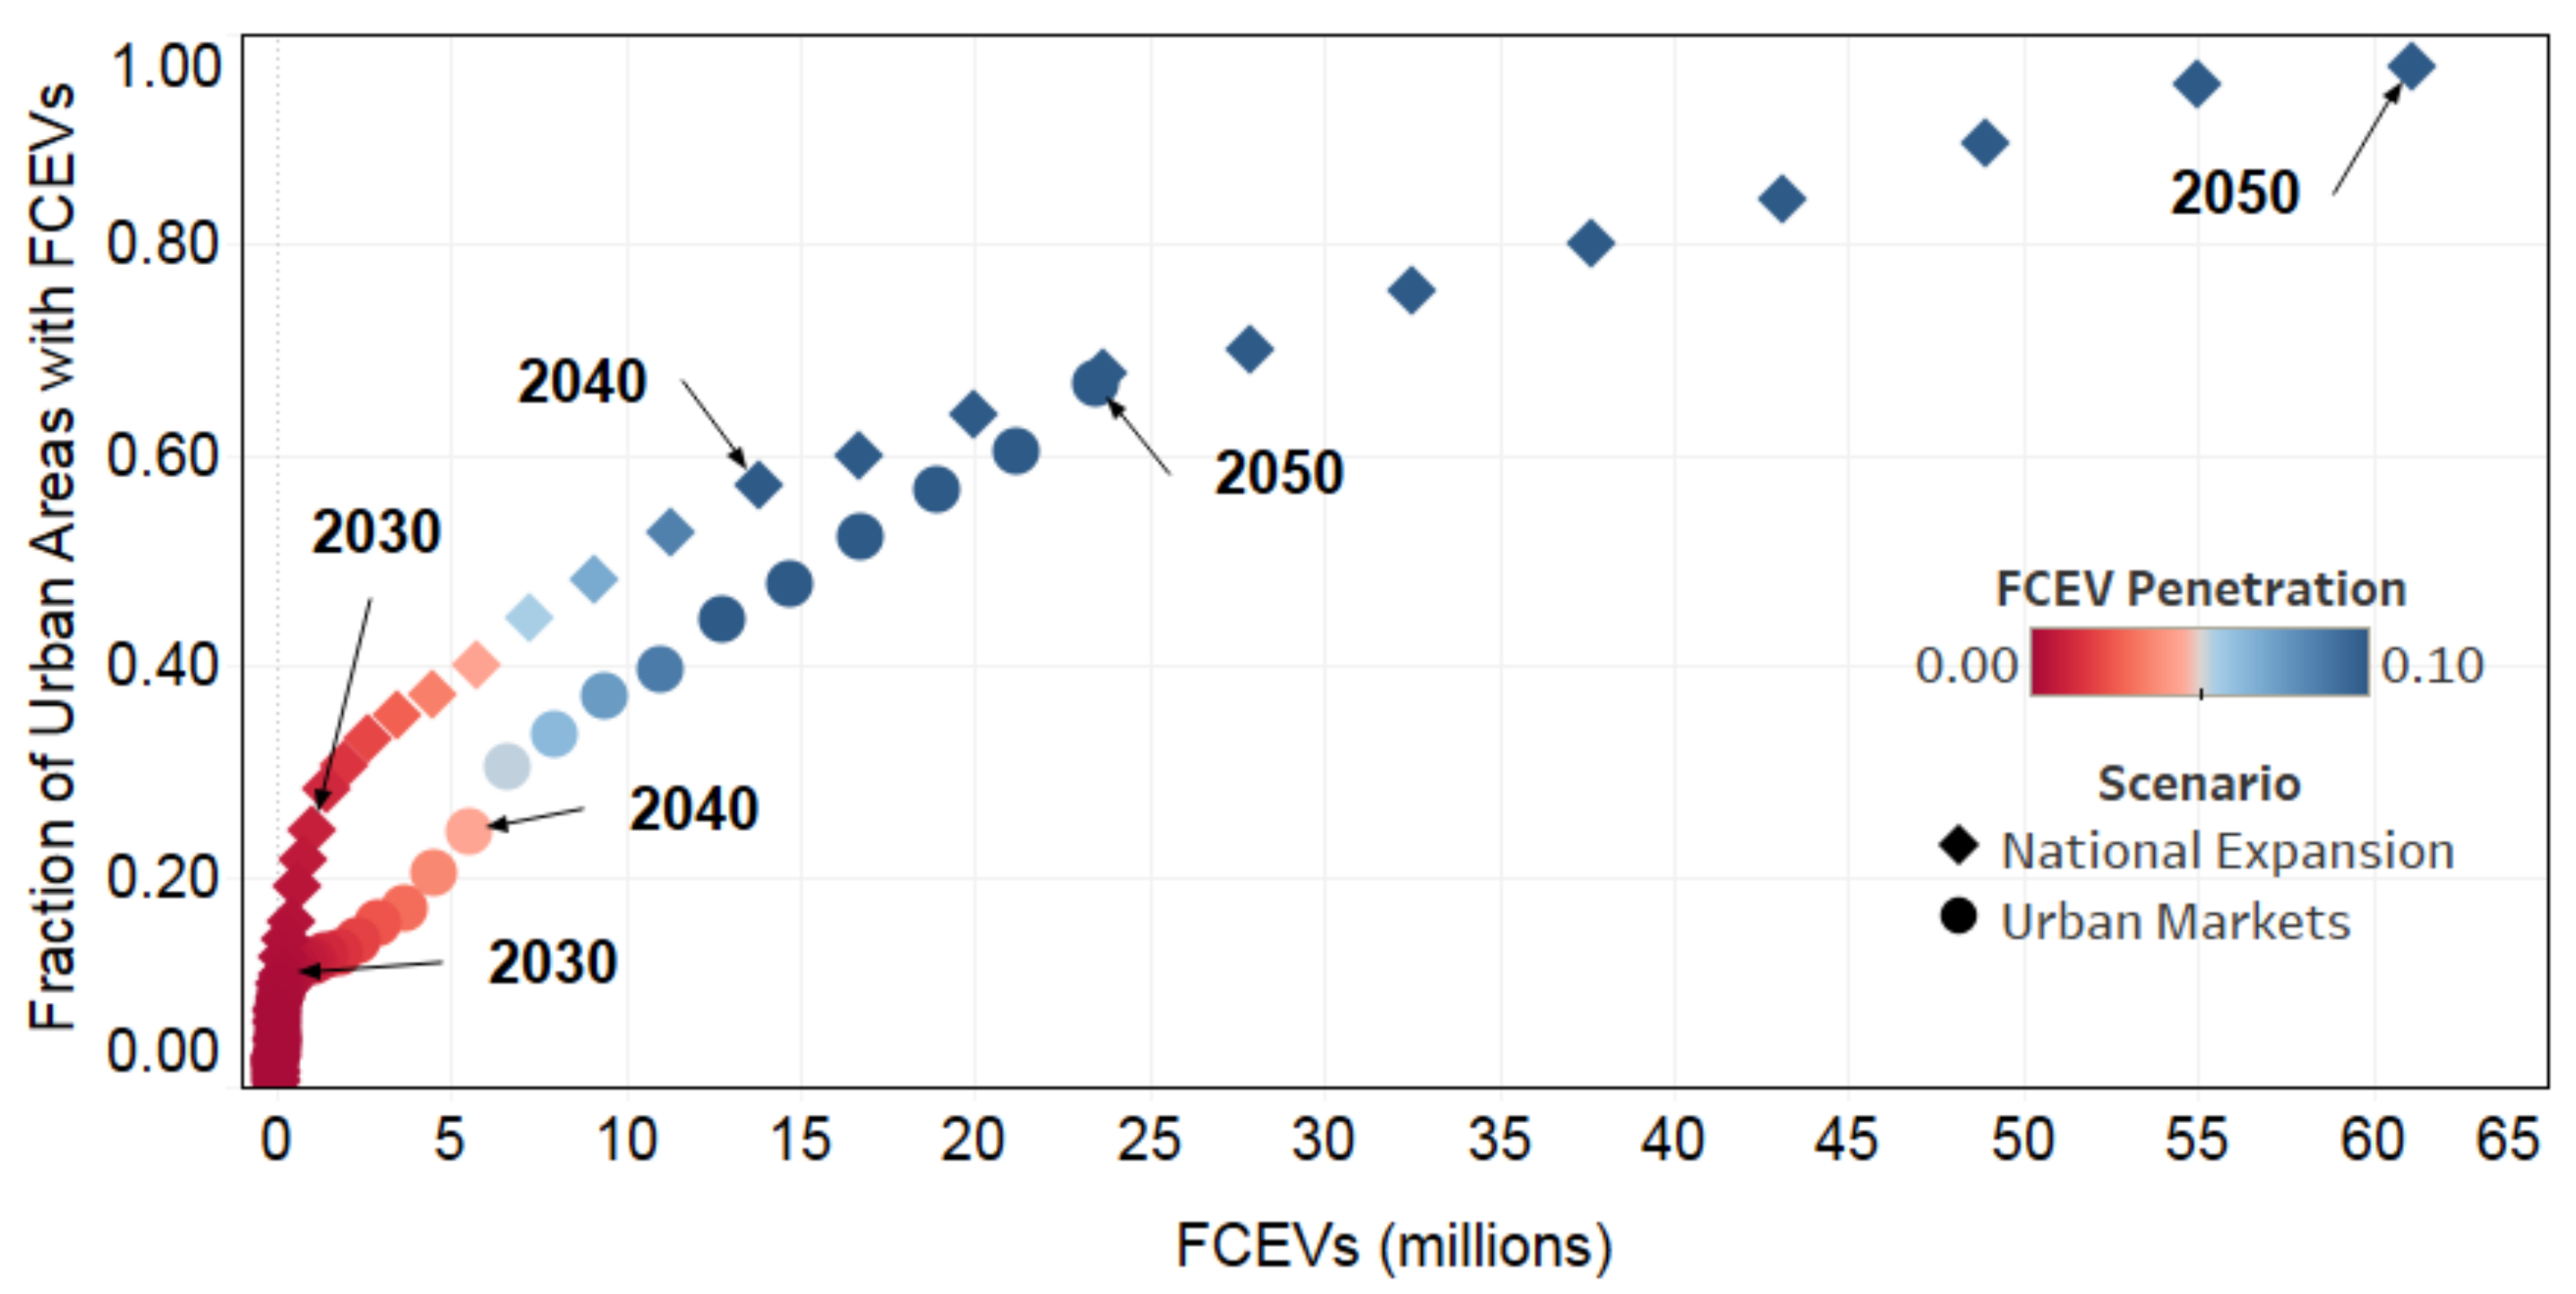
Figure 7 shows the share of urban areas in which FCEVs are adopted (and refueling stations built) as the overall national FCEV market evolves (both in terms of total FCEVs and over time). In the National Expansion scenario (diamonds), the network of stations expands more quickly, and the share of FCEV penetration increases more rapidly over time. However, the more concentrated expansion in the Urban Markets scenario (dots) allows for reaching a higher FCEV penetration share for a given number of total FCEVs. The more rapid network expansion in the National Expansion scenario leads to a dilution of FCEVs across multiple cities. This effect is mitigated over time by the more aggressive vehicle deployment trends. These scenarios illustrate alternative FCEV and hydrogen refueling station deployment scenarios, and can be used as bracketing cases for studying broader impacts of FCEV adoption.
5. Discussion and Conclusions
Alternative fuel vehicles have long been proposed to reduce oil dependency and increase energy security, reduce GHG emissions from the transportation sector, improve local air quality, and stimulate economic growth and job creation. Adoption of alternative fuels, however, hinges on the availability of a refueling infrastructure network that guarantees adequate coverage and expands in line with vehicle adoption, especially for hydrogen FCEVs that cannot be refueled at home like plug-in electric vehicles. Therefore, several models have been proposed to project hydrogen refueling infrastructure requirements to support FCEV adoption, especially as the market transition through the early phase in which low vehicle adoption combined with coverage requirements would lead to low refueling station utilization, also known as the “valley of death”. Modeling studies can inform and design hydrogen infrastructure deployment strategies that help transition through this early phase.
Generally, these models focus on specific regions characterized by a high probability of FCEV adoption and project station placement based on three main approaches: generalized, p-median, and flow-intercepting. These methods, however, focus on where these stations should be built and do not explicitly detail the sequence of when to build each station to provide insights on a synergistic evolution of the vehicle and infrastructure markets. In this paper, we describe the methods used in the SERA model to address these limitations, and provide an approach to prioritizing a nationwide FCEV infrastructure roll-out. Moreover, we provide two case studies to illustrate and bracket what a deployment roll-out strategy in the United States might look like, provide insights on the impact of different deployment strategies both in terms of overall market size and network coverage on the required hydrogen refueling infrastructure, and call for a more nuanced analysis of the infrastructure and financial requirements associated with the deployment of a refueling network that can enable different extents of FCEV adoption in the United States.
Author Contributions
M.M. conceived the paper; B.B. developed and implemented the SERA model; M.M., B.B., and M.W.M. analyzed the data for the case studies; C.H. contributed to the literature review; all authors contributed to writing the paper.
Acknowledgments
This work was supported by the U.S. Department of Energy under Contract No. DE-AC36-08GO28308 with Alliance for Sustainable Energy, LLC, the Manager and Operator of the National Renewable Energy Laboratory. Funding provided by U.S. Department of Energy Office of Energy Efficiency and Renewable Energy Fuel Cell Technologies Office. The authors particularly appreciate the support and guidance provided by DOE program manager Fred Joseck. The views and opinions of the authors expressed herein do not necessarily state or reflect those of the United States Government or any agency thereof. Neither the United States Government nor any agency thereof, nor any of their employees, makes any warranty, expressed or implied, or assumes any legal liability or responsibility for the accuracy, completeness, or usefulness of any information, apparatus, product, or process disclosed, or represents that its use would not infringe privately owned rights. The U.S. Government retains and the publisher, by accepting the article for publication, acknowledges that the U.S. Government retains a nonexclusive, paid-up, irrevocable, worldwide license to publish or reproduce the published form of this work, or allow others to do so, for U.S. Government purposes.
Conflicts of Interest
The authors declare no conflict of interest.
References
- Voelcker, J. First 2015 Hyundai Tucson Fuel Cell Delivered in California, Green Car Reports. 11 June 2014. Available online: https://www.greencarreports.com/news/1092640_first-2015-hyundai-tucson-fuel-cell-delivered-in-california (accessed on 11 June 2014).
- California Air Resources Board. 2017 Annual Evaluation of Hydrogen Fuel Cell Electric Vehicle Deployment and Hydrogen Fuel Station Network Development; California Air Resources Board: Sacramento, CA, USA, 2017.
- Kurtz, J.; Peters, M.; Muratori, M.; Gearhart, C. Renewable Hydrogen—Economically Viable. IEEE Electrif. Mag. 2018, 6, 8–18. [Google Scholar] [CrossRef]
- Pelacchi, P.; Poli, D. The influence of wind generation on power system reliability and the possible use of hydrogen storages. Electr. Power Syst. Res. 2010, 80, 249–255. [Google Scholar] [CrossRef]
- Zhang, G.; Wan, X. A wind-hydrogen energy storage system model for massive wind energy curtailment. Int. J. Hydrog. Energy 2014, 39, 1243–1252. [Google Scholar] [CrossRef]
- Meyer, P.E.; Winebrake, J.J. Modeling technology diffusion of complementary goods: The case of hydrogen vehicles and refueling infrastructure. Technovation 2009, 29, 77–91. [Google Scholar] [CrossRef]
- Melaina, M.; Muratori, M.; McLaren, J.; Schwabe, P. Investing in Alternative Fuel Infrastructure: Insights for California from Stakeholder Interviews. In Proceedings of the Transportation Research Board 96th Annual Meeting, Washington, DC, USA, 8–12 January 2017. Paper Number 17-05279. [Google Scholar]
- McKinney, J.; Bond, E.; Crowell, M.; Odufuwa, E. Joint Agency Staff Report on Assembly Bill 8: Assessment of Time and Cost Needed to Attain 100 Hydrogen Refueling Stations in California; Publication Number CEC-600-2015-016; California Energy Commission: Sacramento, CA, USA, 2015. [Google Scholar]
- Baronas, J.; Achtelik, G.; Butler, J.P., II; Kato, J.Y.; Oglesby, R.P. Joint Agency Staff Report on Assembly Bill 8: 2016 Annual Assessment of Time and Cost Needed to Attain 100 Hydrogen Refueling Stations in California; Publication Number CEC-600-2017-002; California Energy Commission: Sacramento, CA, USA, 2017. [Google Scholar]
- California Investing Nearly $50 Million in Hydrogen Refueling Stations, California Energy Commission News Release. 1 May 2014. Available online: http://www.energy.ca.gov/releases/2014_releases/2014-05-01_hydrogen_refueling_stations_funding_awards_nr.html (accessed on 1 May 2014).
- Melaina, M.W.; Muratori, M.; Zuboy, J.; Ellis, S. H2USA: Siting Refueling Stations in the Northeast; NREL/FS-5400-67401; National Renewable Energy Laboratory: Golden, CO, USA, 2017.
- National Research Council. Transitions to Alternative Vehicles and Fuels; National Academies Press: Washington, DC, USA, 2013. [Google Scholar]
- Barreto, L.; Makihira, A.; Riahi, K. The hydrogen economy in the 21st century: A sustainable development scenario. Int. J. Hydrog. Energy 2003, 28, 267–284. [Google Scholar] [CrossRef]
- Melendez, M.; Milbrandt, A. Geographically Based Hydrogen Consumer Demand and Infrastructure Analysis, Final Report; NREL/TP-540-40373; National Renewable Energy Laboratory: Golden, CO, USA, 2006.
- Ogden, J.M.; Yang, C.; Nicholas, M.; Fulton, L. The Hydrogen Transition, A NextSTEPS White Paper; NextSTEPS Program; Institute of Transportation Studies, University of California, Davis: Davis, CA, USA, 2014. [Google Scholar]
- Ogden, J.; Nicholas, M. Analysis of a “cluster” strategy for introducing hydrogen vehicles in southern California. Energy Policy 2011, 39, 1923–1938. [Google Scholar] [CrossRef]
- Nicholas, M.A.; Ogden, J.M. An Analysis of Near-Term Hydrogen Vehicle Rollout Scenarios for Southern California; Research Report UCD-ITS-RR-10-03; Institute of Transportation Studies, University of California, Davis: Davis, CA, USA, 2010. [Google Scholar]
- California Fuel Cell Partnership. A California Road Map: The Commercialization of Hydrogen Fuel Cell Vehicles; California Fuel Cell Partnership: West Sacramento, CA, USA, 2012. [Google Scholar]
- Greene, D.; Leiby, P.; James, B.; Perez, J.; Melendez, M.; Milbrandt, A.; Unnasch, S.; Rutherford, D.; Hooks, M. Analysis of the Transition to Hydrogen Fuel Cell Vehicles and the Potential Hydrogen Energy Infrastructure Requirements; Technical Report ORNL/TM-2008/30; Oak Ridge National Laboratory: Oak Ridge, TN, USA, 2008.
- Brey, J.J.; Carazo, A.F.; Brey, R. Using AHP and binary integer programming to optimize the initial distribution of hydrogen infrastructures in Andalusia. Int. J. Hydrog. Energy 2012, 37, 5372–5384. [Google Scholar] [CrossRef]
- Upchurch, C.; Kuby, M. Comparing the p-median and flow refueling models for locating alternative-fuel stations. J. Transp. Geogr. 2010, 18, 750–758. [Google Scholar] [CrossRef]
- Berman, O.; Larson, R.C.; Fouska, N. Optimal location of discretionary service facilities. Transp. Sci. 1992, 26, 201–211. [Google Scholar] [CrossRef]
- Kuby, M.; Lim, S. The flow-refueling location problem for alternative-fuel vehicles. Socio-Econ. Plan. Sci. 2005, 39, 125–145. [Google Scholar] [CrossRef]
- Upchurch, C.; Kuby, M.; Lim, S. A model for location of capacitated alternative-fuel stations. Geogr. Anal. 2009, 41, 85–106. [Google Scholar] [CrossRef]
- Kim, J.; Kuby, M. The deviation-flow refueling location model for optimizing a network of refueling stations. Int. J. Hydrog. Energy 2012, 37, 5406–5420. [Google Scholar] [CrossRef]
- Kitamura, R.; Sperling, D. Refueling behavior of automobile drivers. Transp. Res. Part A Gen. 1987, 21, 235–245. [Google Scholar] [CrossRef]
- Sperling, D.; Kitamura, R. Refueling and new fuels: An exploratory analysis. Transp. Res. Part A Gen. 1986, 20, 15–23. [Google Scholar] [CrossRef]
- Melaina, M.W.; Bremson, J.; Solo, K. Consumer Convenience and the Availability of Retail Stations as a Market Barrier for Alternative Fuel Vehicles, Preprint. Presented at the 31st USAEE/IAEE North American Conference, Austin, TX, USA, 4–7 November 2012; National Renewable Energy Laboratory: Golden, CO, USA, 2013. NREL/CP-5600-56898. [Google Scholar]
- Brey, J.J.; Brey, R.; Carazo, A. Eliciting preferences on the design of hydrogen refueling infrastructure. Int. J. Hydrog. Energy 2017, 42, 13382–13388. [Google Scholar] [CrossRef]
- Melaina, M. Initiating hydrogen infrastructures: Preliminary analysis of a sufficient number of initial hydrogen stations in the US. Int. J. Hydrog. Energy 2003, 28, 743–755. [Google Scholar] [CrossRef]
- Nicholas, M.; Handy, S.; Sperling, D. Using geographic information systems to evaluate siting and networks of hydrogen stations. Transp. Res. Rec. 2004, 1880, 126–134. [Google Scholar] [CrossRef]
- Stephens-Romero, S.; Cerreras-Sospedra, M.; Brouwer, J.; Dabdub, J.; Samuelsen, S. Determining Air Quality and Greenhouse Gas Impacts of Hydrogen Infrastructure and Fuel Cell Vehicles. Environ. Sci. Technol. 2009, 43, 9022–9029. [Google Scholar] [CrossRef] [PubMed]
- Stiller, C.; Bunger, U. Description and Results of the Infrastructure Model H2INVEST; NorWays Project Deliverable No. 8; NTNU; IFE; SINTEF: Trondheim, Norway, 2009. [Google Scholar]
- Yang, C.; Ogden, J.M. Determining the lowest-cost hydrogen delivery mode. Int. J. Hydrog. Energy 2007, 32, 268–286. [Google Scholar] [CrossRef]
- Moreno-Benitoa, M.; Agnoluccib, P.; Papageorgioua, L.G. Towards a sustainable hydrogen economy: Optimisation-based framework for hydrogen infrastructure development. Comput. Chem. Eng. 2017, 102, 110–127. [Google Scholar] [CrossRef]
- Nicholas, M. Hydrogen Station Siting and Refueling Analysis Using Geographic Information Systems: A Case Study of Sacramento County; University of California, Davis: Davis, CA, USA, 2004. [Google Scholar]
- Church, R.; ReVelle, C. The maximal covering location problem. Pap. Reg. Sci. 1974, 32, 101–118. [Google Scholar] [CrossRef]
- Welch, C. HyDIVE (Hydrogen Dynamic Infrastructure and Vehicle Evolution) Model Analysis. Presented at the 2010–2025 Scenario Analysis for Hydrogen Fuel Cell Vehicles and Infrastructure Meeting, Washington, DC, USA, 9–10 August 2006; U.S. Department of Energy: Washington, DC, USA, 2006. [Google Scholar]
- Hydrogen Fueling Infrastructure Assessments, California Hydrogen Infrastructure Tool (CHIT) and California Hydrogen Accounting Tool (CHAT). California Air Resources Board. Available online: https://www.arb.ca.gov/msprog/zevprog/hydrogen/h2fueling.htm (accessed on 1 September 2017).
- Lin, Z.; Ogden, J.; Fan, Y.; Chen, C. The fuel-travel-back approach to hydrogen station siting. Int. J. Hydrog. Energy 2008, 33, 3096–3101. [Google Scholar] [CrossRef]
- Lin, Z.; Chen, C.W.; Ogden, J.; Fan, Y. The least-cost hydrogen for Southern California. Int. J. Hydrog. Energy 2008, 33, 3009–3014. [Google Scholar] [CrossRef]
- Melaina, M. SERA Scenarios of Early Market Fuel Cell Electric Vehicle Introductions: Modeling Framework, Regional Markets, and Station Clustering. Presented at the ICEPAG Conference, Irvine, CA, USA, 23 March 2015; National Renewable Energy Laboratory: Golden, CO, USA, 2015. NREL/PR-5400-64395. [Google Scholar]
- Bush, B.; Melaina, M. National FCEV and Hydrogen Fueling Station Scenarios. Presented at the DOE Hydrogen and Fuel Cells Program 2016 Annual Merit Review and Peer Evaluation Meeting, Washington, DC, USA, 6–10 June 2016; National Renewable Energy Laboratory: Golden, CO, USA, 2016. NREL/PR-5400-66337. [Google Scholar]
- Bush, B.; Muratori, M.; Hunter, C.; Zuboy, J.; Melaina, M. Scenario Evaluation and Regionalization Analysis (SERA) Model: Demand Side and Refueling Infrastructure Build-Out, Supporting Documentation for the H2USA National Scenario Report; NREL/TP-5400-70090; National Renewable Energy Laboratory: Golden, CO, USA, 2017.
- Geography: 2010 Census Urban and Rural Classification and Urban Area Criteria. U.S. Census Bureau. Available online: https://www.census.gov/geo/reference/ua/urban-rural-2010.html (accessed on 1 September 2017).
- Nelson, G.D.; Rae, A. An economic geography of the United States: From communities to megaregions. PLoS ONE 2016, 11, e0166083. [Google Scholar]
- Singh, M.; Vyas, A.; Steiner, E. VISION Model: Description of Model Used to Estimate the Impact of Highway Vehicle Technologies and Fuels on Energy Use and Carbon Emissions to 2050; ANL/ESD/04-1; Argonne National Laboratory: Argonne, IL, USA, 2004.
- Bush, B.; Melaina, M.; Penev, M.; Daniel, W. Scenarios of Early Market Clustering of Fuel-Cell Electric Vehicle Introductions; NREL/TP-5600-56588; National Renewable Energy Laboratory: Golden, CO, USA, 2013.
- Melaina, M.; Bush, B.; Muratori, M.; Zuboy, J.; Ellis, S. National Hydrogen Scenarios: How Many Stations, Where, and When? Prepared by the National Renewable Energy Laboratory for the H2USA Locations Roadmap Working Group; National Renewable Energy Laboratory: Golden, CO, USA, 2017. Available online: http://h2usa.org/sites/default/files/H2USA_LRWG_NationalScenarios2017.pdf (accessed on 1 September 2017).
- Energy Information Administration. Annual Energy Outlook 2017; U.S. Department of Energy Energy Information Administration: Washington, DC, USA, 2017.
© 2018 by the authors. Licensee MDPI, Basel, Switzerland. This article is an open access article distributed under the terms and conditions of the Creative Commons Attribution (CC BY) license (http://creativecommons.org/licenses/by/4.0/).


