Experimental Study of the Pore Structure and Permeability of Coal by Acidizing

1
College of Resources and Environment Science, Chongqing University, Chongqing 400030, China
2
Gas Research Branch, China Coal Technology and Engineering Group Chongqing Research Institute, Chongqing 400037, China
3
State Key Laboratory of The Gas Disaster Detecting, Preventing and Emergency Controlling, Chongqing 400037, China
*
Author to whom correspondence should be addressed.
Energies 2018, 11(5), 1162; https://doi.org/10.3390/en11051162
Submission received: 5 April 2018
/
Revised: 2 May 2018
/
Accepted: 2 May 2018
/
Published: 6 May 2018
(This article belongs to the Section L: Energy Sources)
Abstract
:The permeability of coal reservoirs prominently determines methane flow in reservoirs. A large amount of coal reservoirs containing methane, however, have low permeability because pores in reservoirs are sealed. To solve this issue, we investigated the pore structure and permeability law of coal through contrastive analysis of the microstructure and macrostructure before and after acidizing, using ASAP 2020 and triaxial servo-controlled seepage equipment. An analysis of the experimental data revealed the mechanism and the key parameters of acidizing, such as acid mass fraction and acidizing time. In addition, we hold that the optimal mass fraction for the test specimens is about 12~15%. Furthermore, the acid reaction is divided into three stages according to characteristics of the reaction progress. An analysis of the reaction kinetics of “HCl-HF” states that the significant factors will impact the process of reaction, like the composition of coal, surface area of the acid-coal reaction, mass fraction of acids, and environment of the reaction system. The results provide a new idea and research method for further enhancing permeability and gas extraction.
1. Introduction
A gas disaster is one of the most crucial and influential factors affecting coal-mine safety in China [1]. Gas extraction can prevent coal and gas outbursts and the methane extracted can be used as a source of clean energy [2]. The natural pore structure in coal reservoirs is the primary conduit for water and gas flow in gas extraction. The permeability of coal reservoirs prominently determines methane flow in the reservoirs [3]. A number of coal reservoirs containing methane have, however, a low permeability of about (0.1~0.001) × 10−15 m2 [4]. In areas where the conduit is sealed, permeability routes are often restricted. With mining deepening, coal reservoirs tending to be complicated mining conditions, high in-situ stress, high gas pressure and heterogeneity, with low permeability and strength, further impact the permeability and gas extraction [5,6,7]. Therefore, in order to enhance gas extraction and guarantee mine safety, coal permeability must be improved.
Nowadays, there are several main methods to improve coal permeability [8,9,10]. Firstly, pure physical technologies are adopted to enhance coal permeability, including hydraulic fracturing, hydraulic slotting, and deep hole blasting, etc. Hydraulic fracturing is the most commonly used to improve permeability in coal mines [11]. A significant amount of researchers have expressed that coal permeability can be improved to a certain extent through injecting high pressure liquid mixed with guanidine gum, clean water or foam fracturing fluid, and proppant into coal reservoirs [8,12,13]. Hydraulic fracture is most widely used to enhance permeability at present. Secondly, carbon dioxide displacing methane can enhance gas extraction, such as carbon dioxide-ECBM (Enhanced Coal Bed Methane Recovery) [14]. Carbon dioxide competes with the adsorption capacity of methane, which can result in replaced methane. The carbon dioxide will be sealed in the coal reservoirs, which has very good economic and social benefits [10,15,16,17,18,19]. The prospect of carbon dioxide-ECBM in the future is brilliant. Thirdly, acoustic shock and electromagnetic fields are used to enhance coal permeability. The acoustic shock method uses sound waves of mechanical vibration and the heating effect of the coal to damage coal, resulting in increasing the temperature of coal, and accelerating gas desorption, reducing gas adsorption, and quickening the gas flow in the coal reservoirs [20]. This method is currently rarely applied and is in the research phase. Fourthly, a chemical solution is poured into the coal reservoirs, which is called a chemical method [8,9,21,22]. There are a large number of carbonate and silicate minerals in the cracks of coal reservoirs that seriously affect the gas migration in coal reservoirs and result in lower coal permeability. The penetration of drilling fluid and cement slurry in the completion process also reduced the permeability of coal reservoirs. The dissolution and/or modification of the mineral block can also potentially enhance permeability.
Mineral block in cleats is composed of authigenic minerals such as carbonates and aluminosilicates. Carbonaceous minerals dissolve in hydrochloric acid while aluminosilicates degrade in hydrofluoric acid, which can enhance permeability [23]. Previous studies have shown that HCl is effective in reducing coal mineralization. Balucan et al. presented an acidizing means consisting of a pre-flush (HCl), main flush (HCl-HF), and an overflush (HCl) to improve production in the oil and gas industry. Turner et al. launched for the first time an acid-induced mineral alteration of the microstructure of coal using scanning electron microscopy and X-ray [24,25]. It is conceivable that cleats demineralization using hydrochloric acid and hydrofluoric acid can be an effective means to overcome low permeability provided cleat connectivity and permeability are characterized.
Although acidizing is one of the most important mature means in oil and gas field extraction, acidizing in increasing coal permeability and enhancing gas extraction still need to be improved. Moreover, the mechanism and the key parameters of acidizing, such as acid mass fraction and acidizing time, are still unknown. Thus, on the basis of previous study, in this paper, we propose an acid system adapted to the coal reservoirs, using a dynamic seepage test (macrostructure) and a low temperature nitrogen experiment (microstructure) to intensively explore the mechanism and the key parameters of acidizing, including acid species, acid mass fraction, and acidizing time, to improve coal permeability and guarantee mine safety.
2. Experimental Devices, Coal Specimens, Acids
2.1. Theory
Cleats in coal reservoirs are the place and channels where materials exchange with the outside, which significantly impact coal permeability. However, cleats in coal reservoirs are full of carbonate minerals and silicate minerals, like calcite, dolomite, hematite, pyrite, quartz, and kaolinite. Acidizing means that one or several acids are injected into coal reservoirs to dissolve corrosion cement in coal reservoirs or blockages in cleats (Figure 1).
In the process of acidizing, a large amount of HCl are injected into the coal seam to react with the minerals.
Reaction kinetics formula:
where is the reaction rate, mol/s; CHCl is the mass fraction of HCl; D is the diffusion constant of HCl, cm2/s; A is the reaction area, cm2; L is the diffusion boundary layer thickness, cm.
In the reaction of HCl and minerals, H+ migration in acid solution is mainly controlled by flow, filtration et al.
The reaction kinetics formula of H+ migration:
where is the reaction rate; is the H+ migration constant; S is the area, cm2; is the volume of acid, cm3; is the H+ mass fraction gradient.
For a certain coal seam, the acid-coal reaction area is constant and the acid is generally excessive, so the acid volume of the acid coal reaction is basically unchanged. Therefore, the H+ transfer coefficient and H+ mass fraction gradient are the key factors to control the rate of acid coal reaction (Figure 2).
In HCl-HF system, HF has the priority to react with all minerals in coal. The kinetics equation of HF with quartz, feldspar, and clay is
where is reaction rate, mol/s; is diffusion constant of HF; A is area, cm2; is mass fraction of HCl; is mass fraction of HF; m and n are reaction order.
In HCl-HF system, HCl reaction order is mostly zero, and HF reaction order is 1. In the reaction with feldspar, HCl does not participate in the reaction, but it catalyzes the reaction of HF and feldspar, and its reaction rate increases with the mass fraction of HCl. Based on this mechanism, in the actual acidizing process, ‘low mass fraction HF–high mass fraction HCl system’ is used to acidify the coal seam containing abundant aluminosilicate.
2.2. Experiment Devices
Experiment devices include triaxial servo-controlled seepage equipment for thermo-fluid-solid coupling of gas-bearing coal (Figure 3), and the Micromeritics ASAP 2020 (Micromeritics, Shanghai, China) for low temperature nitrogen adsorption (Figure 4).
The low temperature nitrogen adsorption experiment was conducted by Micromeritics ASAP 2020 (Chongqing University, Chongqing, China), which includes a pressure transducer, cryogenic system, and a vacuum system. The gas seepage test was conducted by triaxial servo-controlled seepage equipment for thermo-fluid-solid coupling of gas-bearing coal (Chongqing University, Chongqing, China). It consists of four subsystems including a servo-controlled loading subsystem, triaxial compression chamber, water bath with thermostatic control subsystem, and a data measuring subsystem.
2.3. Coal Specimens
The specimens were collected from three different areas: the Qian Jiaying mine in Kailuan area, the Xiaonan mine in the Tiefa area, and the Liujia mine in the Pingzhuang area, China (Figure 5). Samples were drilled parallel to the beddings. The specimens with a diameter of 50 mm and length of 100 mm were included in the permeability experiment according to the standards of the International Society of Rock Mechanics (Figure 6), and grinding 50 g of pulverized coal with diameters between 0.2 mm and 0.3 mm was used in the low temperature nitrogen adsorption experiment (Figure 7). To guarantee the relative consistency and properties of the specimens, the specimens in each group were acquired from the same coal as much as possible. The mineral composition analysis was carried out by X-ray (Scienscope, Chino, CA, USA). The results showed that the mineral composition of coal specimens in the three mining areas mainly consisted of carbonates and silicates, including calcite, dolomite, and silica (Table 1).
2.4. Acids
For this experiment we selected hydrochloric acid as the key acid solution to dissolve carbonate minerals in the cleats of coal reservoirs. We added 2% hydrofluoric acid (HF) solution as an auxiliary acid, dissolving a small amount of silicate minerals in coal reservoirs and added 2% ammonium chloride solution (NH4Cl) as an anti-swelling agent, which can effectively hinder the expansion and migration of clay minerals [26].
3. Experiment Design
3.1. Low Temperature Nitrogen Adsorption Experiment and Brunauer–Emmett–Teller Method
The cleats of coal were determined according to the adsorption-condensation principle of nitrogen at low temperature (77 K). Nitrogen has good chemical stability, which is not easy to be chemically adsorbed at low temperatures. Q (adsorbing capacity) is directly related to (the relative pressure of nitrogen). Where p is the partial pressure of nitrogen, is the saturated vapor pressure of nitrogen. , the relationship between Q and satisfies BET equation, and will measure specific surface area of coal. When , the nitrogen will condense in the microspores of coal, and the volume and diameter of pores of coal can be determined [27]. The specimens were dried to a constant weight at 105 °C, and they were put into the drying tower and cooled down to room temperature. Specimens acidized for 24 h were determined by degassing, quality precision measurement, and specimen analysis to measure the nitrogen adsorption capacity [28].
The Brunauer–Emmett–Teller method continues to be the most widely used procedure for evaluating the surface area of porous and finely-divided materials, in spite of the weakness of its theoretical foundations. Indeed, under certain carefully controlled conditions, the BET-area of a nonporous, macroporous, or a mesoporous solid can be regarded as the ‘probe accessible area’.
Two stages are involved in the application of the BET method. First, it is necessary to transform a physisorption isotherm into the ‘BET plot’ and from it derive a value of the BET monolayer capacity, nm. In the second stage, the BET-area, a (BET), is calculated from nm by adopting an appropriate value of the molecular cross-sectional area.
It is customary to apply the BET equation in the linear form
where n is the specific amount adsorbed at , and nm is the specific monolayer capacity.
According to the BET theory, the parameter C is exponentially related to the energy of monolayer adsorption. It is now generally agreed that the value of C gives a rather useful indication of the shape of the isotherm in the BET range.
An empirical way of studying microporosity is by the application of a number of molecular probes of progressively increasing molecular diameters. The method is based on the measurement of both adsorption rates and capacities. A sharp adsorption cutoff might be expected to correspond to a given micropore size, but this does not take account of the complexity of most microporous materials. Although the results are often quite difficult to interpret, generally it is possible to obtain useful information about the effective range of the window and/or pore entrance size.
These methods allow one to calculate for a series of particular adsorptive/adsorbent pair of theoretical isotherms, , in pores of different widths for a given pore shape. The series of theoretical isotherms is called the kernel, which can be regarded as a theoretical reference for a given class of adsorbent/adsorptive system. The calculation of the pore size distribution function f(W) is based on a solution of the general adsorption isotherm equation, which correlates the experimental adsorption isotherm with the kernel of the theoretical adsorption or desorption isotherms For this purpose, the GAI equation is expressed in the form:
For many years mesopore size analysis was firmly based on the application of the Kelvin equation. Thus, the shift of the gas-liquid phase transition of a confined fluid from bulk coexistence, is expressed in terms of the surface tension of the bulk fluid and the molar liquid volume . For cylindrical pores the modified Kelvin equation is:
where is the pore radius and the thickness of the adsorbed multilayer film, which is formed prior to pore condensation.
3.2. Seepage Experiment
Based on the theory of the single phase seepage flow and gas state equation, the seepage experiment was carried out. Thus, the permeability of the coal specimens is calculated based on Darcy-law [29].
where, K is permeability, × 10−15 m2; P1, P2 is inlet and outlet fluid pressure respectively, MPa; Q0 is gas flow in standard condition, cm3/s; μg is methane dynamic viscosity, ; L is specimen length, mm; A is the sectional area of specimens, mm2.
An example, Qian 1#’s original permeability, is given to describe the test process. Firstly, the gas pressure was increased 0.5 MPa by a rate of 0.01 MPa and the gas kept pressure stable and the gas flow rate was later recorded. Secondly, the gas pressure was increased to 1 MPa and the gas flow rate recorded. The gas flow rate was recorded at 1.5 MPa, 2 MPa, 2.5 MPa and 3 MPa, respectively. Qian 2#, 3#, and 4# specimens were simultaneously acidized for 3 h. The hydrochloric acid mass fraction was 9%, 12%, and 15%, with 2% hydrofluoric acid and 2%, controlling the 25 °C indoor temperature, keeping the acid container sealed. Three specimens are removed and placed into the clean beaker by tweezers and the three specimens are dried for 3 h, which determined the permeability of Qian 2#, 3# and 4#. In the same way, the 5#, 6#, and 7# specimens were reacted with the 9%, 12%, and 15% hydrochloric acid solution for 6 h, repeating the above steps. Finally, an acidized specimen for 9 h, 12 h, and 18 h were produced, respectively.
4. Result and Discussion
4.1. Pore Structure
The test results of the specific surface area (SSA) and pore volume after acidizing are shown in Table 2. After acidizing, specific surface area and pore volume increased. Specimens that are of moderate rank increase obviously in specific surface area (SSA) and pore volume.
Figure 8 shows that the different coal samples of the low temperature nitrogen adsorption isotherm form all belong to the II type. The figures show the first half of the curve rising slowly as convex, indicating the phase of the adsorption transition from the monolayer to the multi-molecular layer. While, in the second half, the curve rises sharply, indicating that there is a hair in the larger hole in the coal. The holes in the coal relatively range from molecular holes (about 0.86 nm) to upper limit holes, which means different coal has different pore distribution.
Figure 9 and Figure 10 display that SSA and pore volume are closely related to pore width. SSA and the pore volume of the coal experience an increase at first and then decrease with changing pore diameter. There are three main ranges—elevating area a, where SSA increases promptly, peak area b, where SSA peaks, and reducing area c, where SSA reduces slowly—in the relationship curve between SSA and pore width. The pore size of coal is concentrated at about 10 nm, which has important influence on SSA and pore volume. With coal rank, SSA and pore volume increase correspondingly. Moreover, the SSA and pore volume of coal effected by acidizing is obvious when the diameter of coal is less than 10 nm. Finally, the SSA and pore volume of low medium metamorphic coal is easily affected by acidizing, especially when it contains carbonate, which is the most suitable to carry out the acidizing. Therefore, it is possible to increase the permeability of coal by injecting acids in to cleats.
4.2. Permeability Laws
4.2.1. Permeability Laws under Constant Confining Pressure
We measured the gas flow rate under different gas pressures and calculated permeability. Retaining a confining pressure of 3 MPa, we regulated the gas pressure from 0.5 MPa slowly to 3 MPa at a rate of 0.01 MPa. Then, we analyzed permeability changes by acidizing with pore pressure. Take Qian Jiaying specimens for example, when the confining pressure is 3 MPa, the permeability laws are shown in Figure 11.
Figure 11 presents the permeability change laws with the gas pressure. The permeability of the coal specimens increased significantly under 3 h, 6 h, 9 h, 12 h, 15 h, and 18 h of acidizing. Using the acid mass fraction of 12% as an example: first, when the gas pressure is 0.5 MPa, the permeability rises from 1.762 × 10⁻¹⁵ m2 to 15.521 × 10⁻¹⁵ m2 after 9 h, and the multiple is 8.81 times. The permeability increases from 1.762 × 10⁻¹⁵ m2 to 14.234 × 10⁻¹⁵ m2 after 18 h, and the multiple is 8.08 times. Second, when the gas pressure is 1.5 MPa, the permeability rises from 1.439 × 10⁻¹⁵ m2 to 14.656 × 10⁻¹⁵ m2 after 9 h, and the multiple is 10.18 times. The permeability increases from 1.439 × 10⁻¹⁵ m2 to 12.656 × 10⁻¹⁵ m2 after 18 h, and the multiple is 8.79 times. Third, when the gas pressure is 3 MPa, the permeability rises from 0.923 × 10⁻¹⁵ m2 to 14.561 × 10⁻¹⁵ m2 after 9 h, and the multiple is 15.77 times. The permeability increases from 0.923 × 10⁻¹⁵ m2 to 9.568 × 10⁻¹⁵ m2 after 18 h, and the multiple is 10.37 times. Acidizing has boosted permeability and the optimum time is 12 h. In the later period of acidizing, permeability slightly decreases, because some mineral absorbing water results in expansion, which has a negative effect on pore development. Therefore, the acidizing time should be about 12 h.
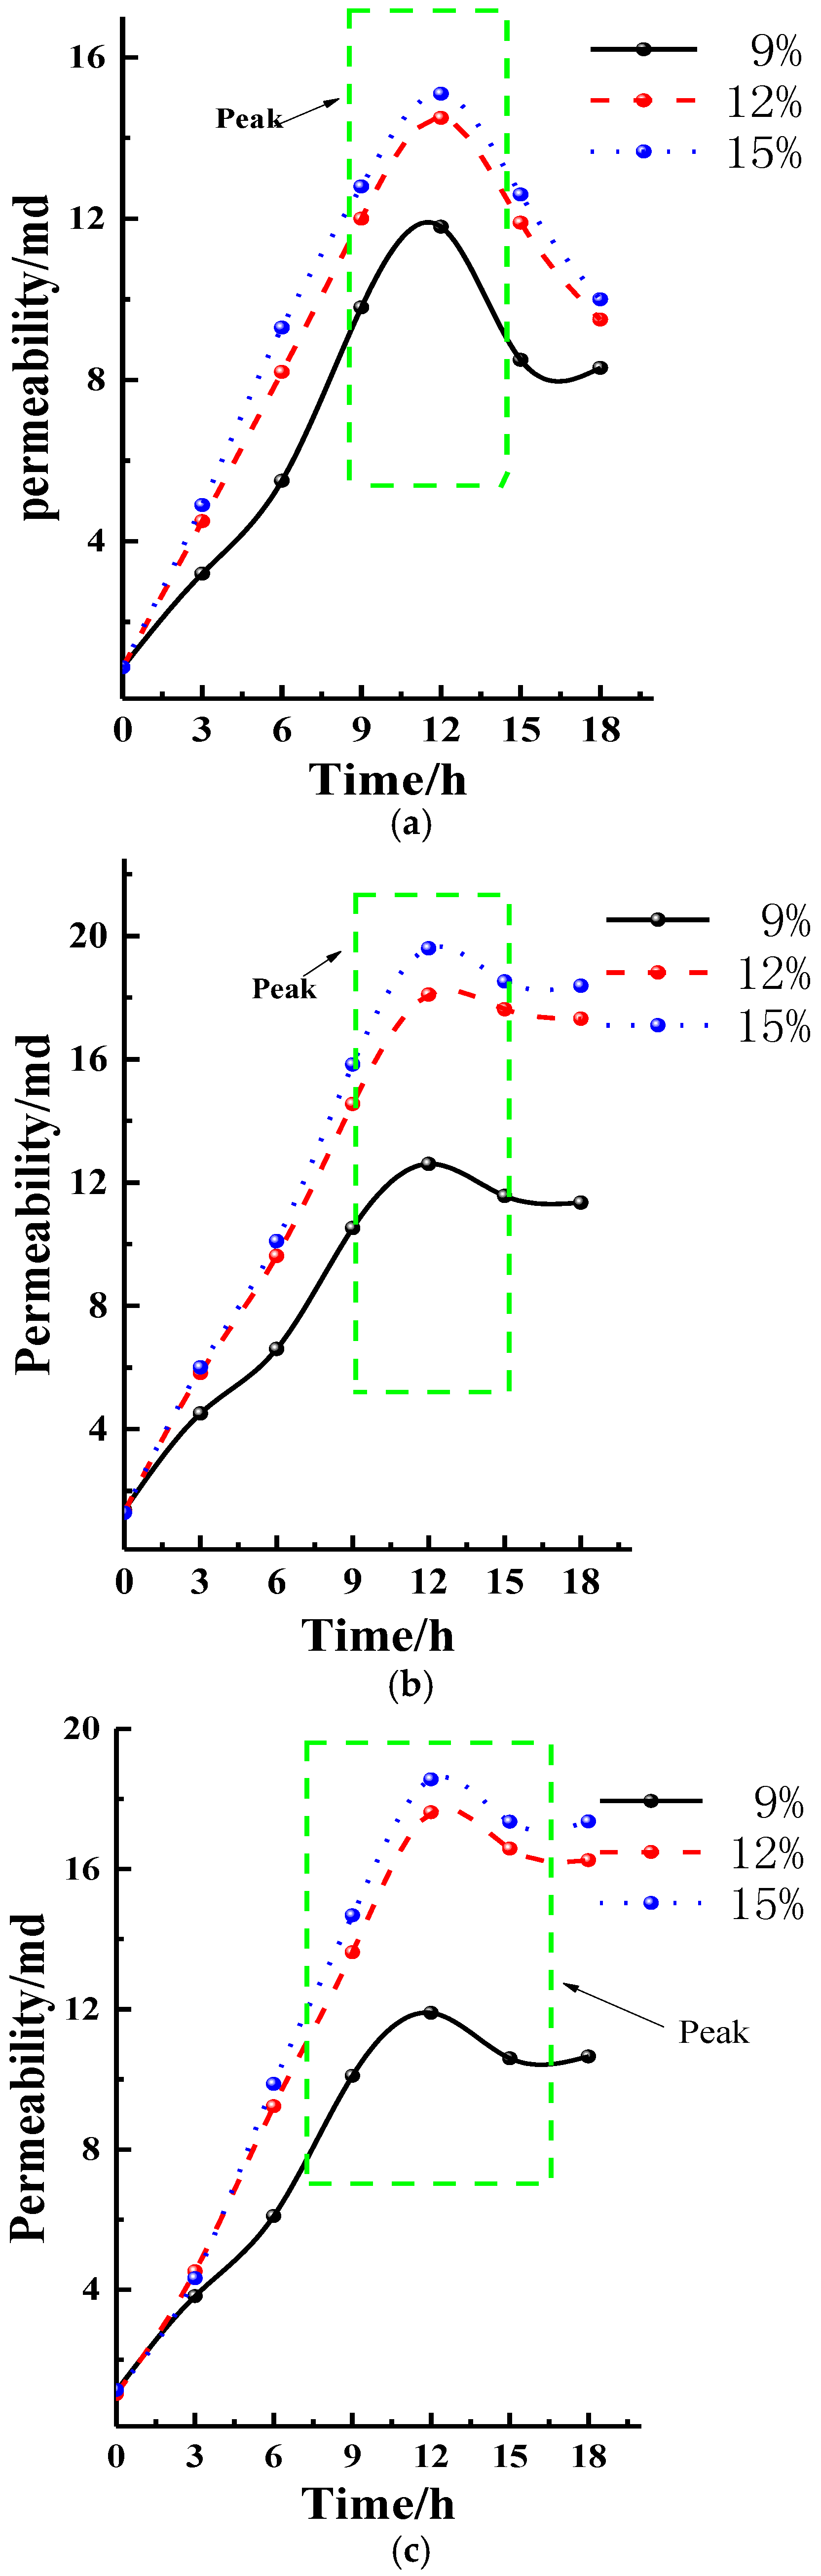
4.2.2. Permeability Laws under Constant Confining Pressure and Gas Pressure
Figure 12 and Table 3 demonstrate the permeability of coal specimens after acidizing has significantly improved. The testing results of the three groups of samples show good consistency. Using Qian Jiaying’s for example, Qian 1#’s permeability increases from initial 0.875 × 10⁻¹⁵ m2 to 11.863 × 10⁻¹⁵ m2 in 12 h, and decreases to 8.325 × 10⁻¹⁵ m2 after 18 h. The peak of permeability is 13.56 times as much as the original permeability. In Qian 2#, which is a 12% hydrochloric acid solution, permeability rises from initial 0.923 × 10⁻¹⁵ m2 to 14.561 × 10⁻¹⁵ m2 after 12 h, and later decreases to 9.568 × 10⁻¹⁵ m2 after 18 h. Thus the peak of permeability is 15.78 times as much as the original permeability. In Qian 3#, which is a 15% hydrochloric acid solution, permeability rises from initial 0.821 × 10⁻¹⁵ m2 to 15.122 × 10⁻¹⁵ m2 after 12 h, and decreases to 10.007 × 10⁻¹⁵ m2 after 18 h. The peak of permeability is 18.42 times as much as original permeability. The acid reaction is divided into three stages according to the progress of the reaction. In the first stage (0~12 h), the permeability of the coal specimens increases rapidly. In the second stage (12~15 h), the permeability of the coal specimens becomes stable. In the third stage (15~18 h), the permeability of the coal specimens slightly falls.
5. Conclusions
The major conclusions include the following:
- (1)
- Acidizing is an effective method to increase the permeability of coal reservoirs by injecting one or several kinds of acid solution into the cleats in the coal reservoirs. We propose an acidizing combination, which consists of hydrochloric acid (HCl), 2% hydrofluoric acid (HF), and 2% ammonium chloride solution (NH4Cl).
- (2)
- After acidizing, BET and pore volume increases, mainly concentrating at about 10 nm, but for high-rank coal this was not obvious. The permeability of the specimens increases, stabilizes, and then retreats during acidizing. The mass fraction for the test coal specimens is usually about 12~15%.
- (3)
- The acid reaction is divided into three stages according to the progress of the reaction. In the first stage (0~12 h), the permeability of specimens increases rapidly. In the second stage (12~15 h), the permeability of coal specimens becomes stable. In the third stage (15~18 h), the permeability of coal specimens becomes slightly fall.
- (4)
- The chemical reactions of the acid and the minerals in the coal are summarized. The reaction kinetics of the acid and the minerals in the coal and the influencing factors of the acid-coal reactions are analyzed. On account of the dynamic equation, the composition of coal, the surface area of the acid-coal reaction, the mass fraction of HF, and the environmental conditions of the reaction system will all impact the process of reaction.
Author Contributions
All authors contributed equally to this work. B.Z. is the main author of this work. G.W. wrote the paper. H.S., X.Z. supported the research in terms of both scientific and technical expertise. All authors have been involved in the manuscript preparation.
Acknowledgments
This work was financially supported by the National Key Research and Development Pro-gram (Grant No. 2016YFC0801402-4), the National Natural Science Foundation of China (Grant No. 51574280 No. 51774319), Chongqing Frontiers and Application based Research Program (Grant No. cstc2015jcyjBX0076), Chongqing science and technology innovation leader talent support program (Grant No. CSTCKJCXLJRC14) Meanwhile, the author would like to thank the reviewers of this paper for their constructive comments and suggestions to improve the publication.
Conflicts of Interest
The authors declare no conflict of interest.
References
- Lama, R.D.; Bodziony, J. Management of outburst in underground coal mines. Int. J. Coal Geol. 1998, 35, 83–115. [Google Scholar] [CrossRef]
- Bustin, R.M.; Clarkson, C.R. Geological controls on coalbed methane reservoir capacity and gas content. Int. J. Coal Geol. 1998, 38, 3–26. [Google Scholar] [CrossRef]
- Chen, D.; Pan, Z.J.; Liu, J.S.; Connell, L.D. An improved relative permeability model for coal reservoirs. Int. J. Coal Geol. 2013, 109, 45–57. [Google Scholar] [CrossRef]
- Meng, Y.; Li, Z.P.; Lai, F.P. Experimental study on porosity and permeability of anthracite coal under different stresses. J. Pet. Sci. Eng. 2015, 133, 810–817. [Google Scholar] [CrossRef]
- Lv, Y.M.; Tang, D.Z.; Xu, H.; Luo, H.H. Production characteristics and the key factors in high-rank coalbed methane fields: A case study on the Fanzhuang Block, Southern Qinshui Basin, China. Int. J. Coal Geol. 2012, 96–97, 93–108. [Google Scholar] [CrossRef]
- Yang, Y.; Zhang, C.W.; Tian, H.J.; Chen, W.G.; Peng, X.D.; Zhang, H. The pilot appraisal of acid fracturing of coalbed methane reservoir in southeast Qinshui Basin, China. Earth Sci. Res. J. 2016, 20, C1–C6. [Google Scholar] [CrossRef]
- Niu, S.W.; Zhao, Y.S.; Hu, Y.Q. Experimental Ivestigation of the Temperature and Pore Pressure Effect on Permeability of Lignite Under the In Situ Condition. Transp. Porous Media 2014, 101, 137–148. [Google Scholar] [CrossRef]
- Hou, P.; Gao, F.; Ju, Y.; Yang, Y.G.; Gao, Y.N.; Liu, J. Effect of water and nitrogen fracturing fluids on initiation and extension of fracture in hydraulic fracturing of porous rock. J. Nat. Gas Sci. Eng. 2017, 45, 38–52. [Google Scholar] [CrossRef]
- Gao, J.F.; Xing, H.L.; Turner, L.; Steel, K.; Sedek, M.; Golding, S.D.; Rudolph, V. Pore-Scale Numerical Investigation on Chemical Stimulation in Coal and Permeability Enhancement for Coal Seam Gas Production. Transp. Porous Media 2017, 116, 335–351. [Google Scholar] [CrossRef]
- Kumar, H.; Elsworth, D.; Liu, J.S.; Pone, D.; Mathews, J.P. Permeability evolution of propped artificial fractures in coal on injection of CO2. J. Pet. Sci. Eng. 2015, 133, 695–704. [Google Scholar] [CrossRef]
- Keshavarz, A.; Badalyan, A.; Carageorgos, T.; Bedrikovetsky, P.; Johnson, R. Stimulation of coal seam permeability by micro-sized graded proppant placement using selective fluid properties. Fuel 2015, 144, 228–236. [Google Scholar] [CrossRef]
- Li, Q.G.; Lin, B.Q.; Zhai, C. The effect of pulse frequency on the fracture extension during hydraulic fracturing. J. Nat. Gas Sci. Eng. 2014, 21, 296–303. [Google Scholar] [CrossRef]
- Colmenares, L.B.; Zoback, M.D. Hydraulic fracturing and wellbore completion of coalbed methane wells in the Powder River Basin, Wyoming: Implications for water and gas production. AAPG Bull. 2007, 91, 51–67. [Google Scholar] [CrossRef]
- Fujioka, M.; Yamaguchi, S.; Nako, M. CO2-ECBM field tests in the Ishikari Coal Basin of Japan. Int. J. Coal Geol. 2010, 82, 287–298. [Google Scholar] [CrossRef]
- Godec, M.; Koperna, G.; Petrusak, R.; Oudinot, A. Potential for enhanced gas recovery and CO2 storage in the Marcellus Shale in the Eastern United States. Int. J. Coal Geol. 2013, 118, 95–104. [Google Scholar] [CrossRef]
- Jiao, Z.S.; Surdam, R.C.; Zhou, L.F.; Stauffer, P.H.; Luo, T.T. A feasibility study of geological CO2 sequestration in the Ordos Basin, China. In Proceedings of the 10th International Conference on Greenhouse Gas Control Technologies, Amsterdam, The Netherlands, 19–23 September 2010; Gale, J., Hendriks, C., Turkenberg, W., Eds.; Elsevier Science Bv: Amsterdam, The Netherlands, 2011; Volume 4, pp. 5982–5989. [Google Scholar]
- Wu, Y.; Liu, J.S.; Elsworth, D.; Chen, Z.W.; Connell, L.; Pan, Z.J. Dual poroelastic response of a coal seam to CO2 injection. Int. J. Greenh. Gas Control 2010, 4, 668–678. [Google Scholar] [CrossRef]
- White, C.M.; Smith, D.H.; Jones, K.L.; Goodman, A.L.; Jikich, S.A.; LaCount, R.B.; DuBose, S.B.; Ozdemir, E.; Morsi, B.I.; Schroeder, K.T. Sequestration of carbon dioxide in coal with enhanced coalbed methane recovery—A review. Energy Fuels 2005, 19, 659–724. [Google Scholar] [CrossRef]
- Yan, F.Z.; Lin, B.Q.; Zhu, C.J.; Shen, C.M.; Zou, Q.L.; Guo, C.; Liu, T. A novel ECBM extraction technology based on the integration of hydraulic slotting and hydraulic fracturing. J. Nat. Gas Sci. Eng. 2015, 22, 571–579. [Google Scholar] [CrossRef]
- Lu, C.P.; Dou, L.M.; Zhang, N.; Xue, J.H.; Liu, G.J. Microseismic and acoustic emission effect on gas outburst hazard triggered by shock wave: A case study. Nat. Hazards 2014, 73, 1715–1731. [Google Scholar] [CrossRef]
- Terry, R.C. Methane Produced from Wet Coal Deposits—By Injecting Oxygen-Contg. Gas through Well-Bore, Removing Formation Water, and Producing Free and Desorbed Methane. U.S. Patent US4544037-A, 1 October 1985. [Google Scholar]
- Steel, K.M.; Patrick, J.W. The production of ultra clean coal by chemical demineralisation. Fuel 2001, 80, 2019–2023. [Google Scholar] [CrossRef]
- Vassilev, S.V.; Kitano, K.; Takeda, S.; Tsurue, T. Influence of mineral and chemical-composition of coal ashes on their fusibility. Fuel Process. Technol. 1995, 45, 27–51. [Google Scholar] [CrossRef]
- Balucan, R.D.; Turner, L.G.; Steel, K.M. Acid-induced mineral alteration and its influence on the permeability and compressibility of coal. J. Nat. Gas Sci. Eng. 2016, 33, 973–987. [Google Scholar] [CrossRef]
- Turner, L.G.; Steel, K.M. A study into the effect of cleat demineralisation by hydrochloric acid on the permeability of coal. J. Nat. Gas Sci. Eng. 2016, 36, 931–942. [Google Scholar] [CrossRef]
- Chen, S.; Hu, Y.; Lan, S.; Li, F.; Qiao, Q.; Sun, C.; Zhang, X. Anti-Swelling Agent Is Obtained by Mixing and Stirring, Clay Stabilizing Agent, Water and Cationic Polymer Which Is Copolymer of Dimethyl Diallyl Ammonium Chloride and Acrylamide. China Patent CN102786924-A, CN102786924-B, 21 November 2012. [Google Scholar]
- Day, R.E.; Parfitt, G.D. Characterization of surface of rutile by nitrogen and water vapour adsorption. Trans. Faraday Soc. 1967, 63, 708–716. [Google Scholar] [CrossRef]
- Thommes, M.; Kaneko, K.; Neimark, A.V.; Olivier, J.P.; Rodriguez-Reinoso, F.; Rouquerol, J.; Sing, K.S.W. Physisorption of gases, with special reference to the evaluation of surface area and pore size distribution (IUPAC Technical Report). Pure Appl. Chem. 2015, 87, 1051–1069. [Google Scholar] [CrossRef]
- Whitaker, S. Flow in porous media I: A theoretical derivation of Darcy’s law. Transp. Porous Media 1986, 1, 3–25. [Google Scholar] [CrossRef]
Figure 1.
Reaction mechanism between acid and coal.

Figure 2.
Reaction mechanism of minerals and acids.

Figure 3.
The triaxial servo-controlled seepage equipment for thermo-fluid-solid coupling of gas-bearing coal. (a) Schematic diagram; (b) Schematic diagram of the triaxial cell.
Figure 3.
The triaxial servo-controlled seepage equipment for thermo-fluid-solid coupling of gas-bearing coal. (a) Schematic diagram; (b) Schematic diagram of the triaxial cell.

Figure 4.
Micromeritics ASAP 2020.

Figure 5.
Locations of coal specimens.
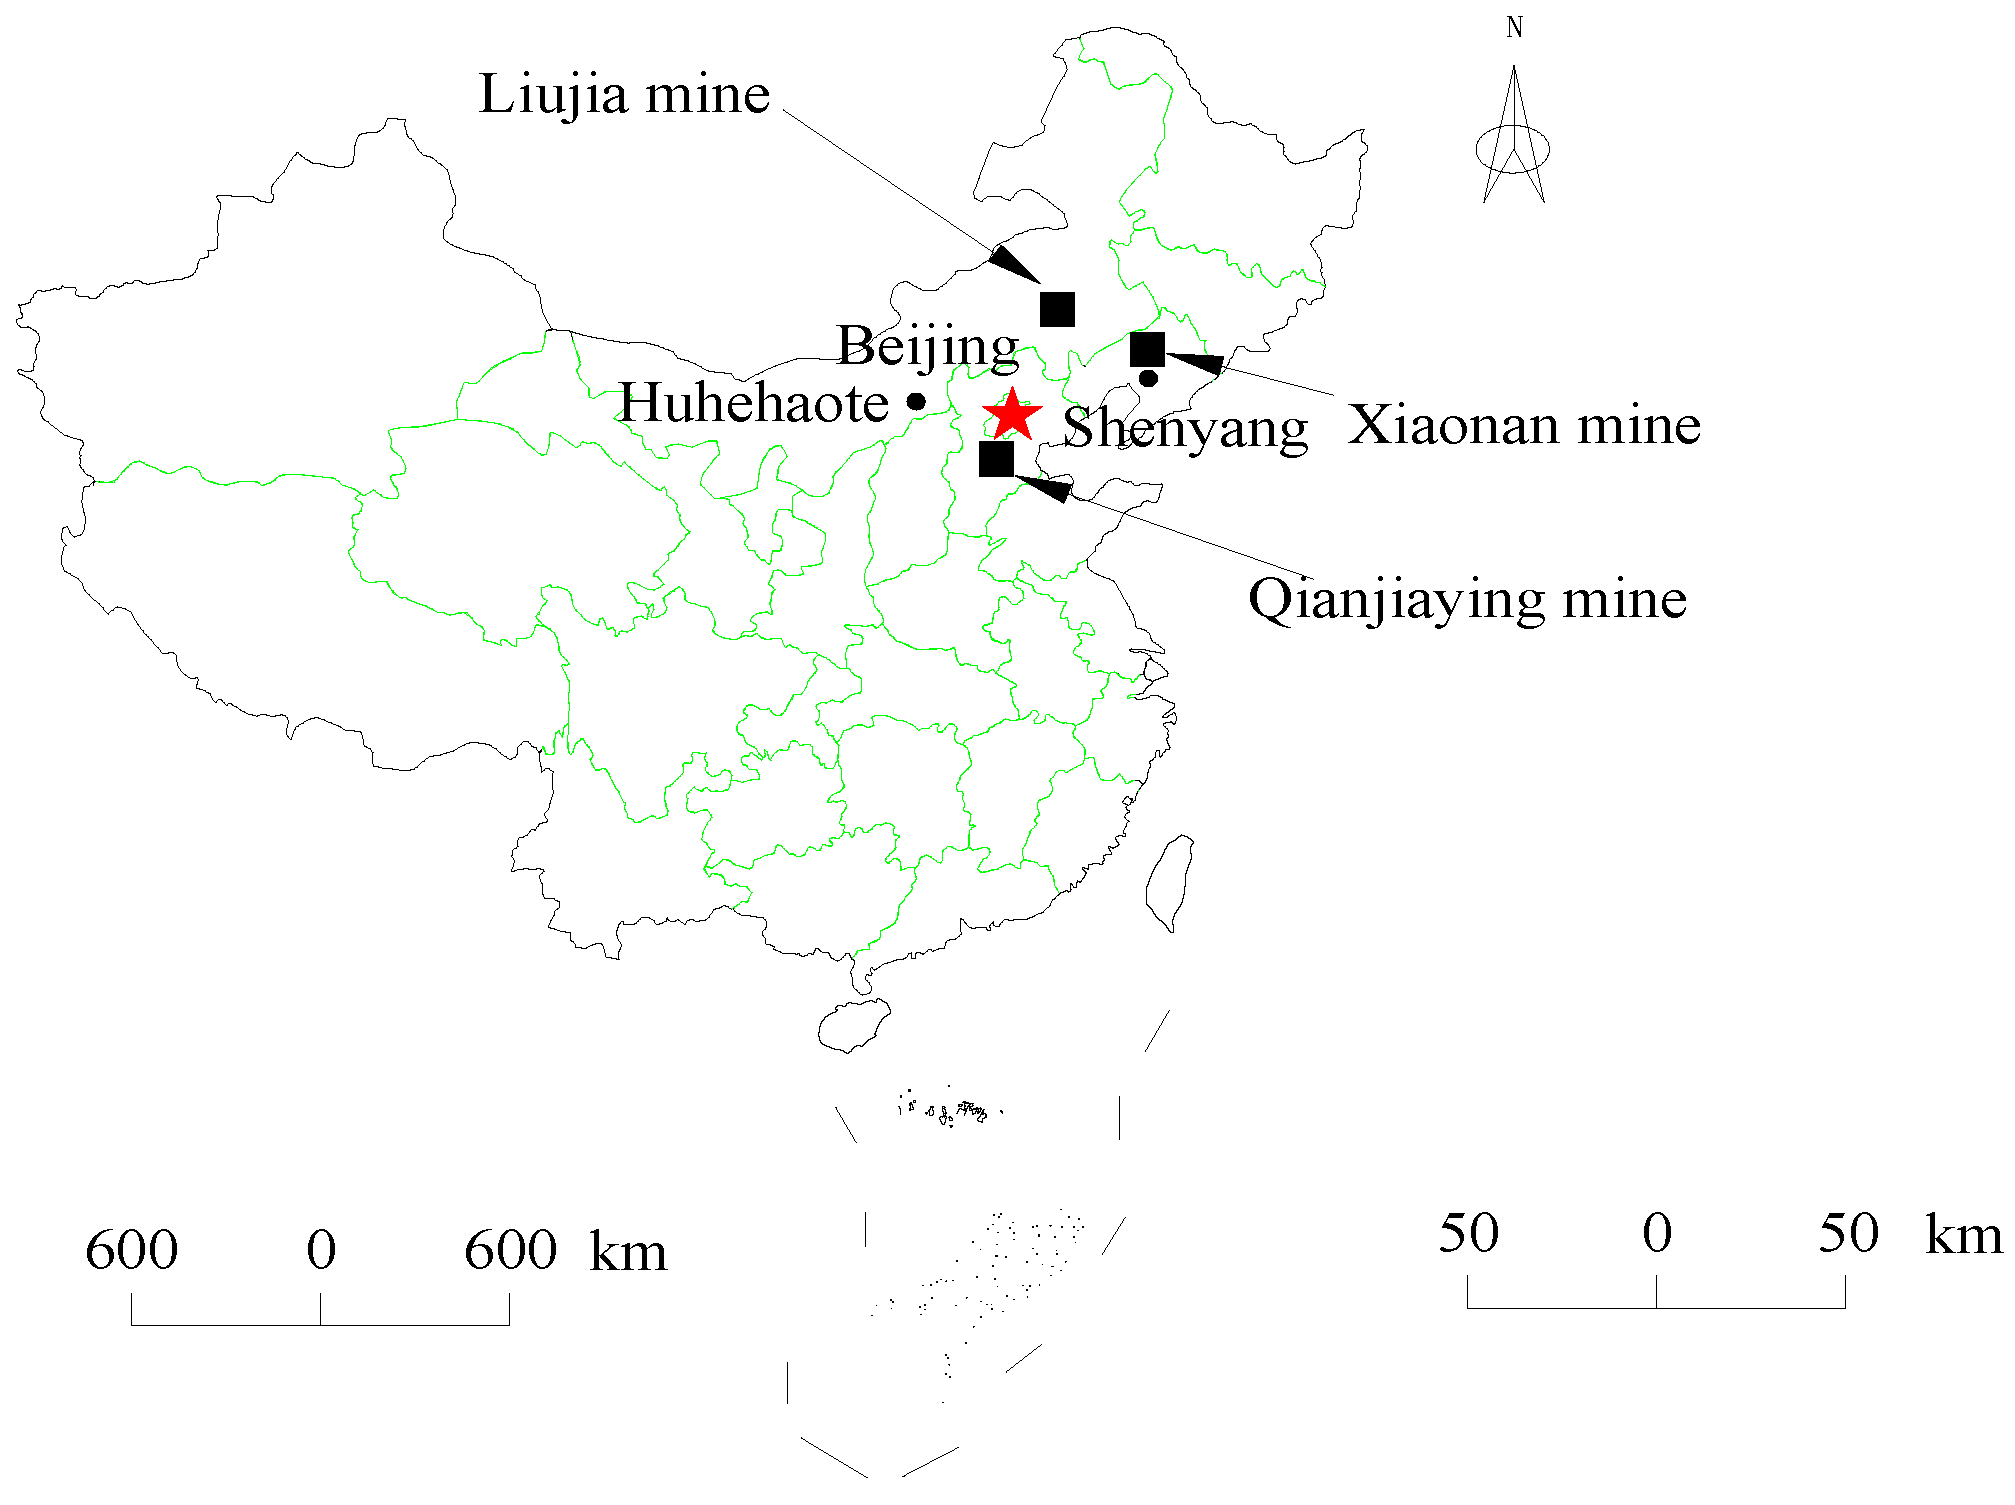
Figure 6.
Specimens.
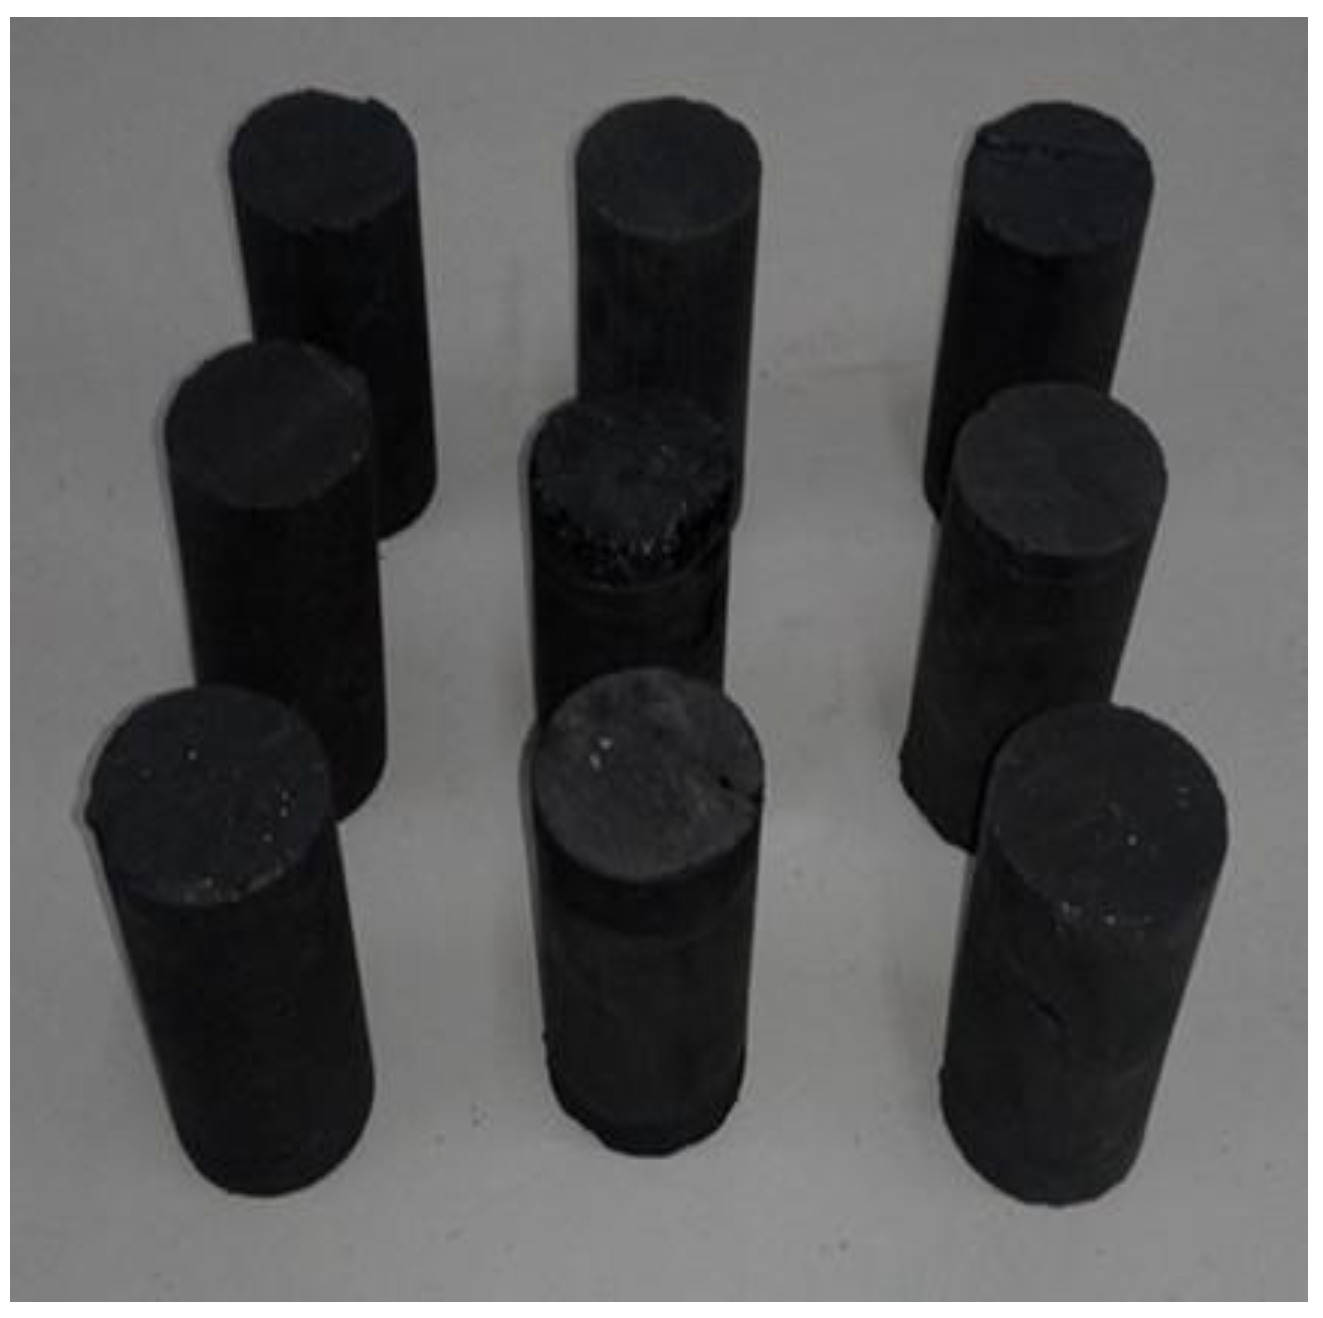
Figure 7.
Pulverized coal.

Figure 8.
Low temperature nitrogen adsorption isotherm. (a) Qianjiaying; (b) Xiaonan; (c) Liujia.
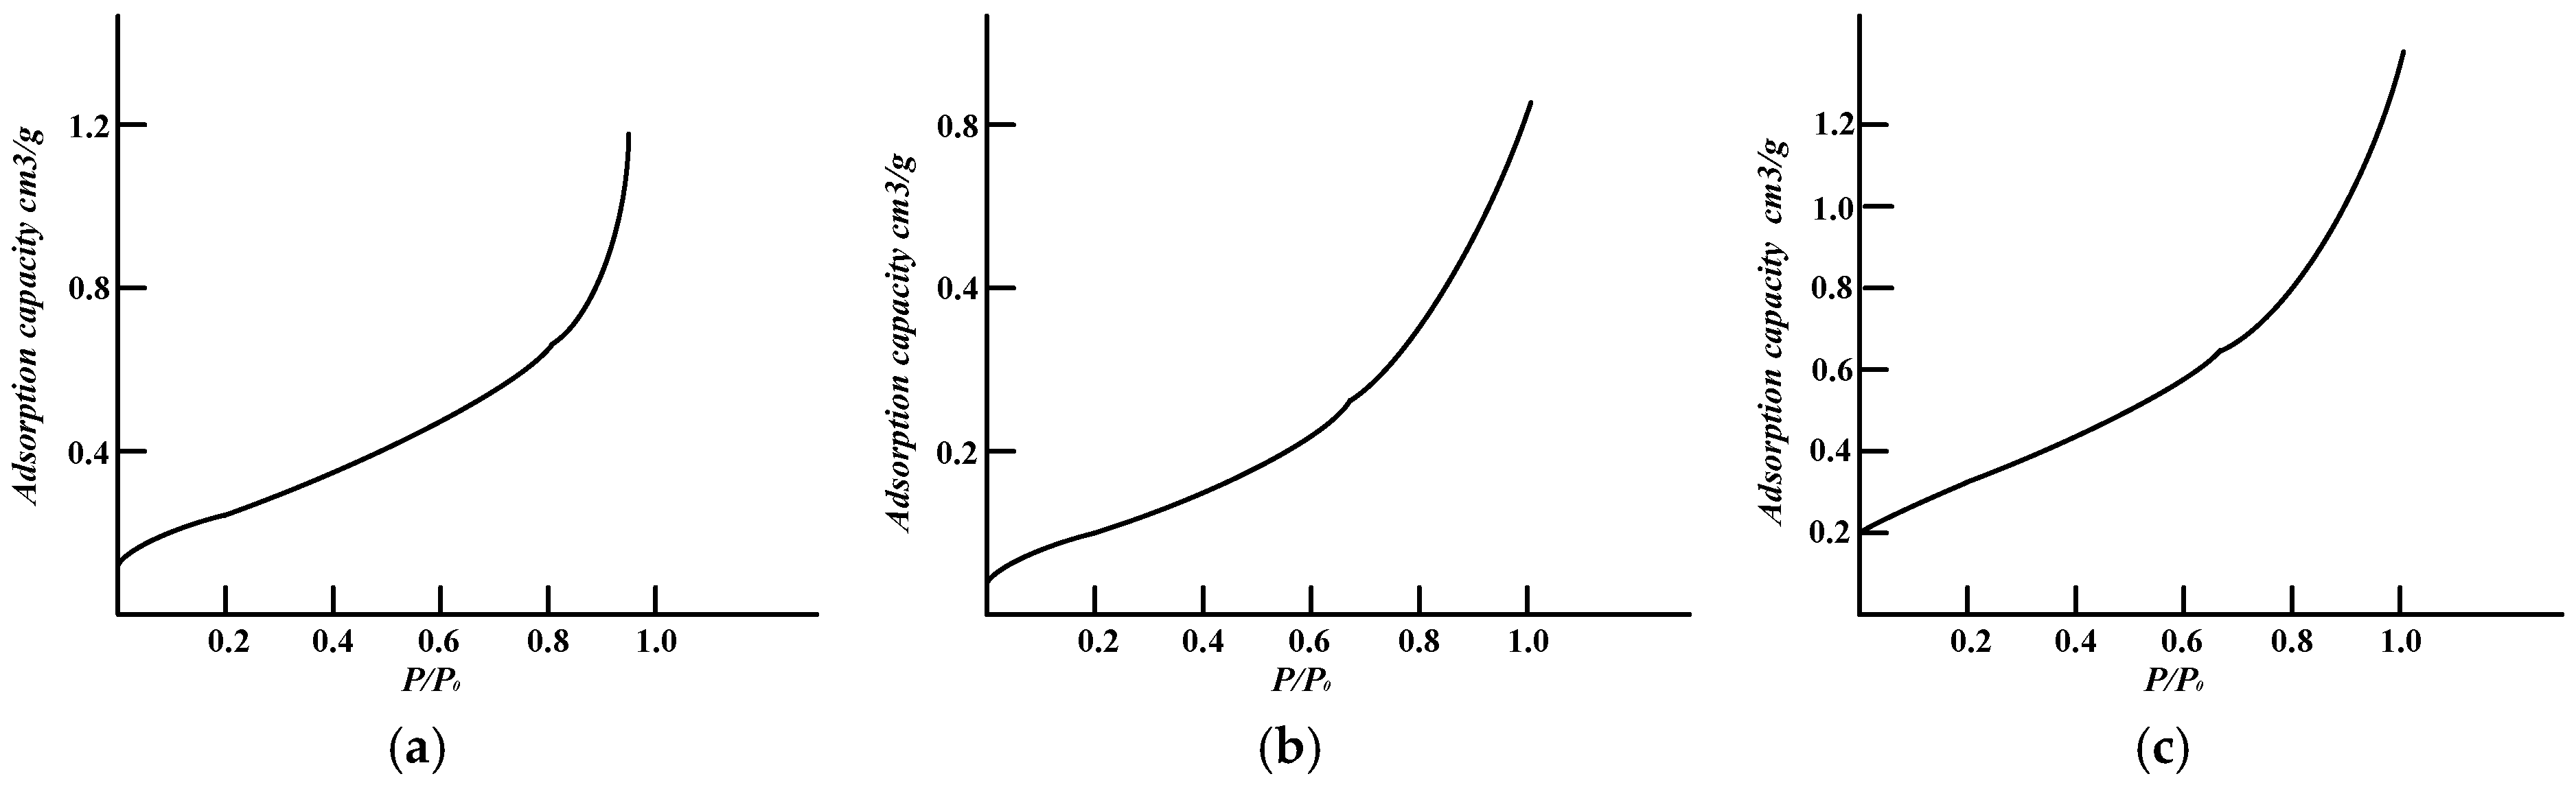
Figure 9.
Relationship between S and pore width. (a) Qian Jiaying specimens; (b) Xiaonan specimens; (c) Liujia specimens.
Figure 9.
Relationship between S and pore width. (a) Qian Jiaying specimens; (b) Xiaonan specimens; (c) Liujia specimens.
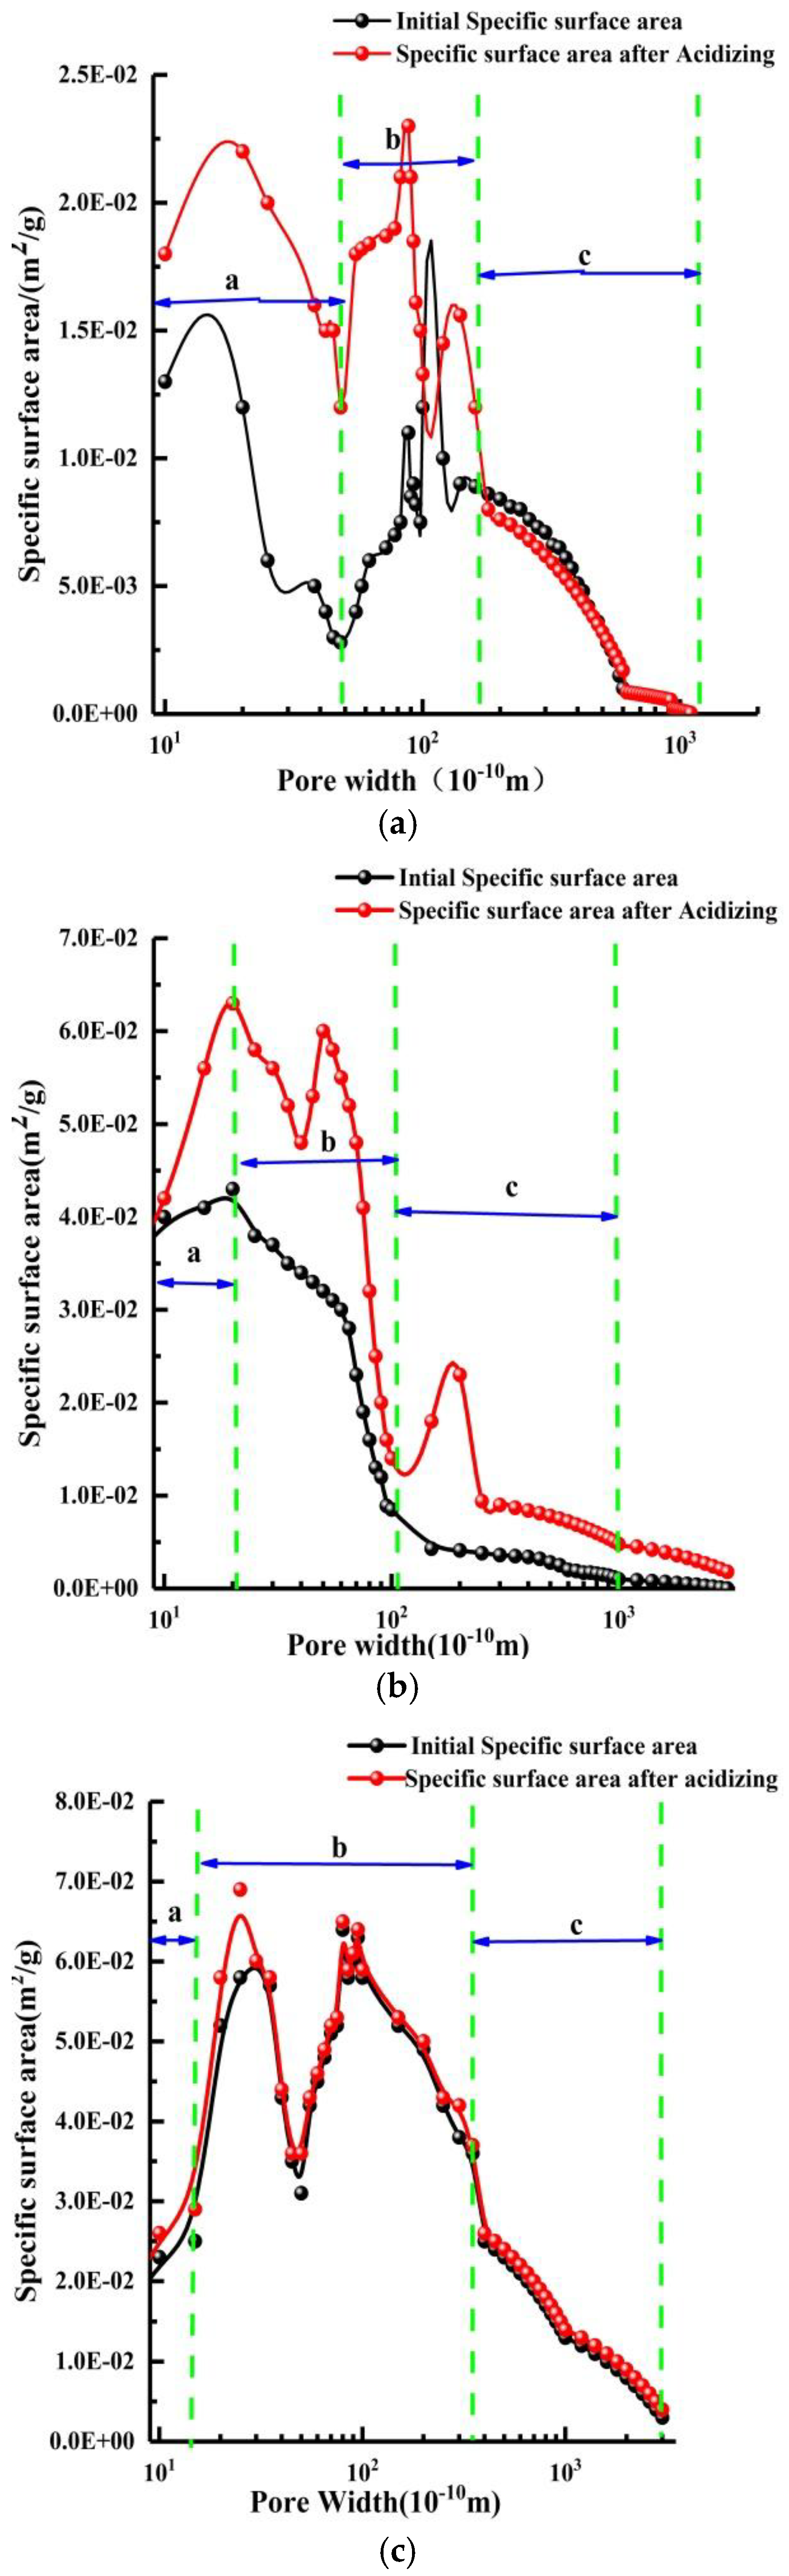
Figure 10.
Relationship between pore volume and pore width. (a) Qian Jiaying specimens; (b) Xiaonan specimens; (c) Liujia specimens.
Figure 10.
Relationship between pore volume and pore width. (a) Qian Jiaying specimens; (b) Xiaonan specimens; (c) Liujia specimens.
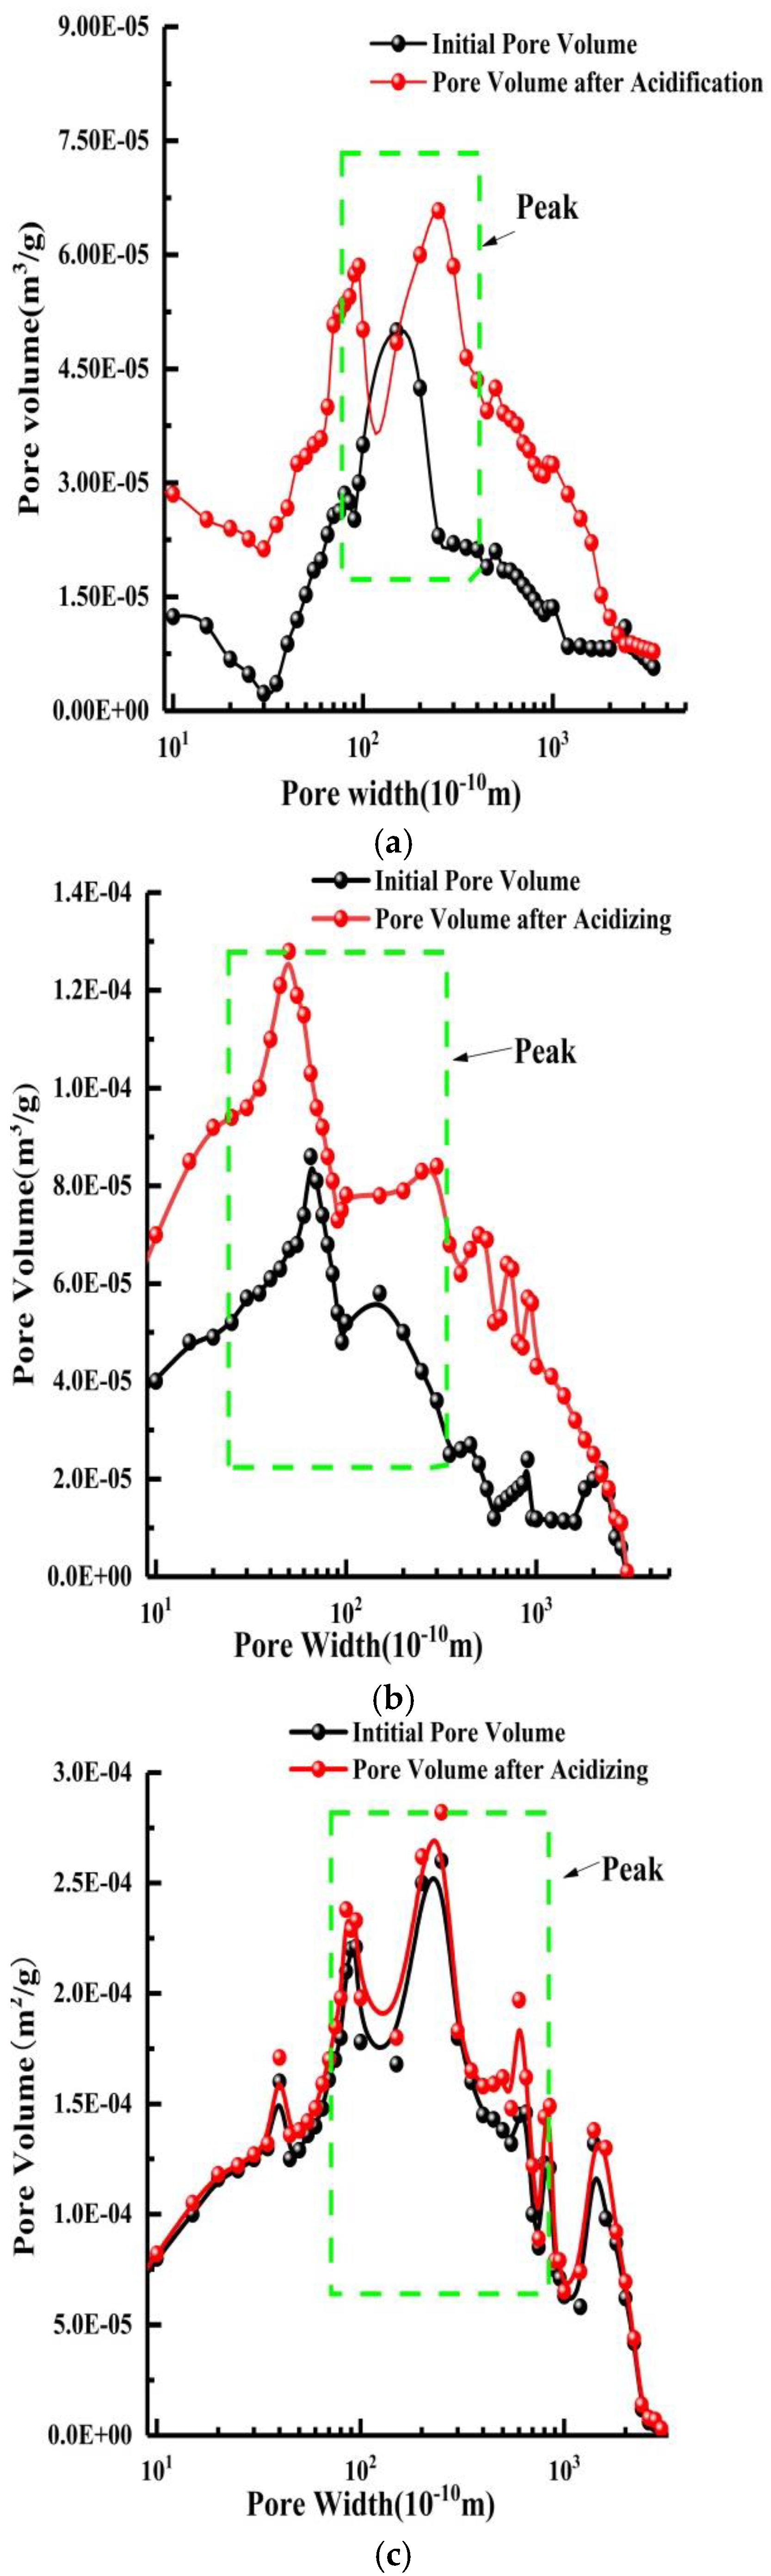
Figure 11.
Permeability change trend when acid mass fraction is (a) 9%, (b) 12%, (c) 15%.
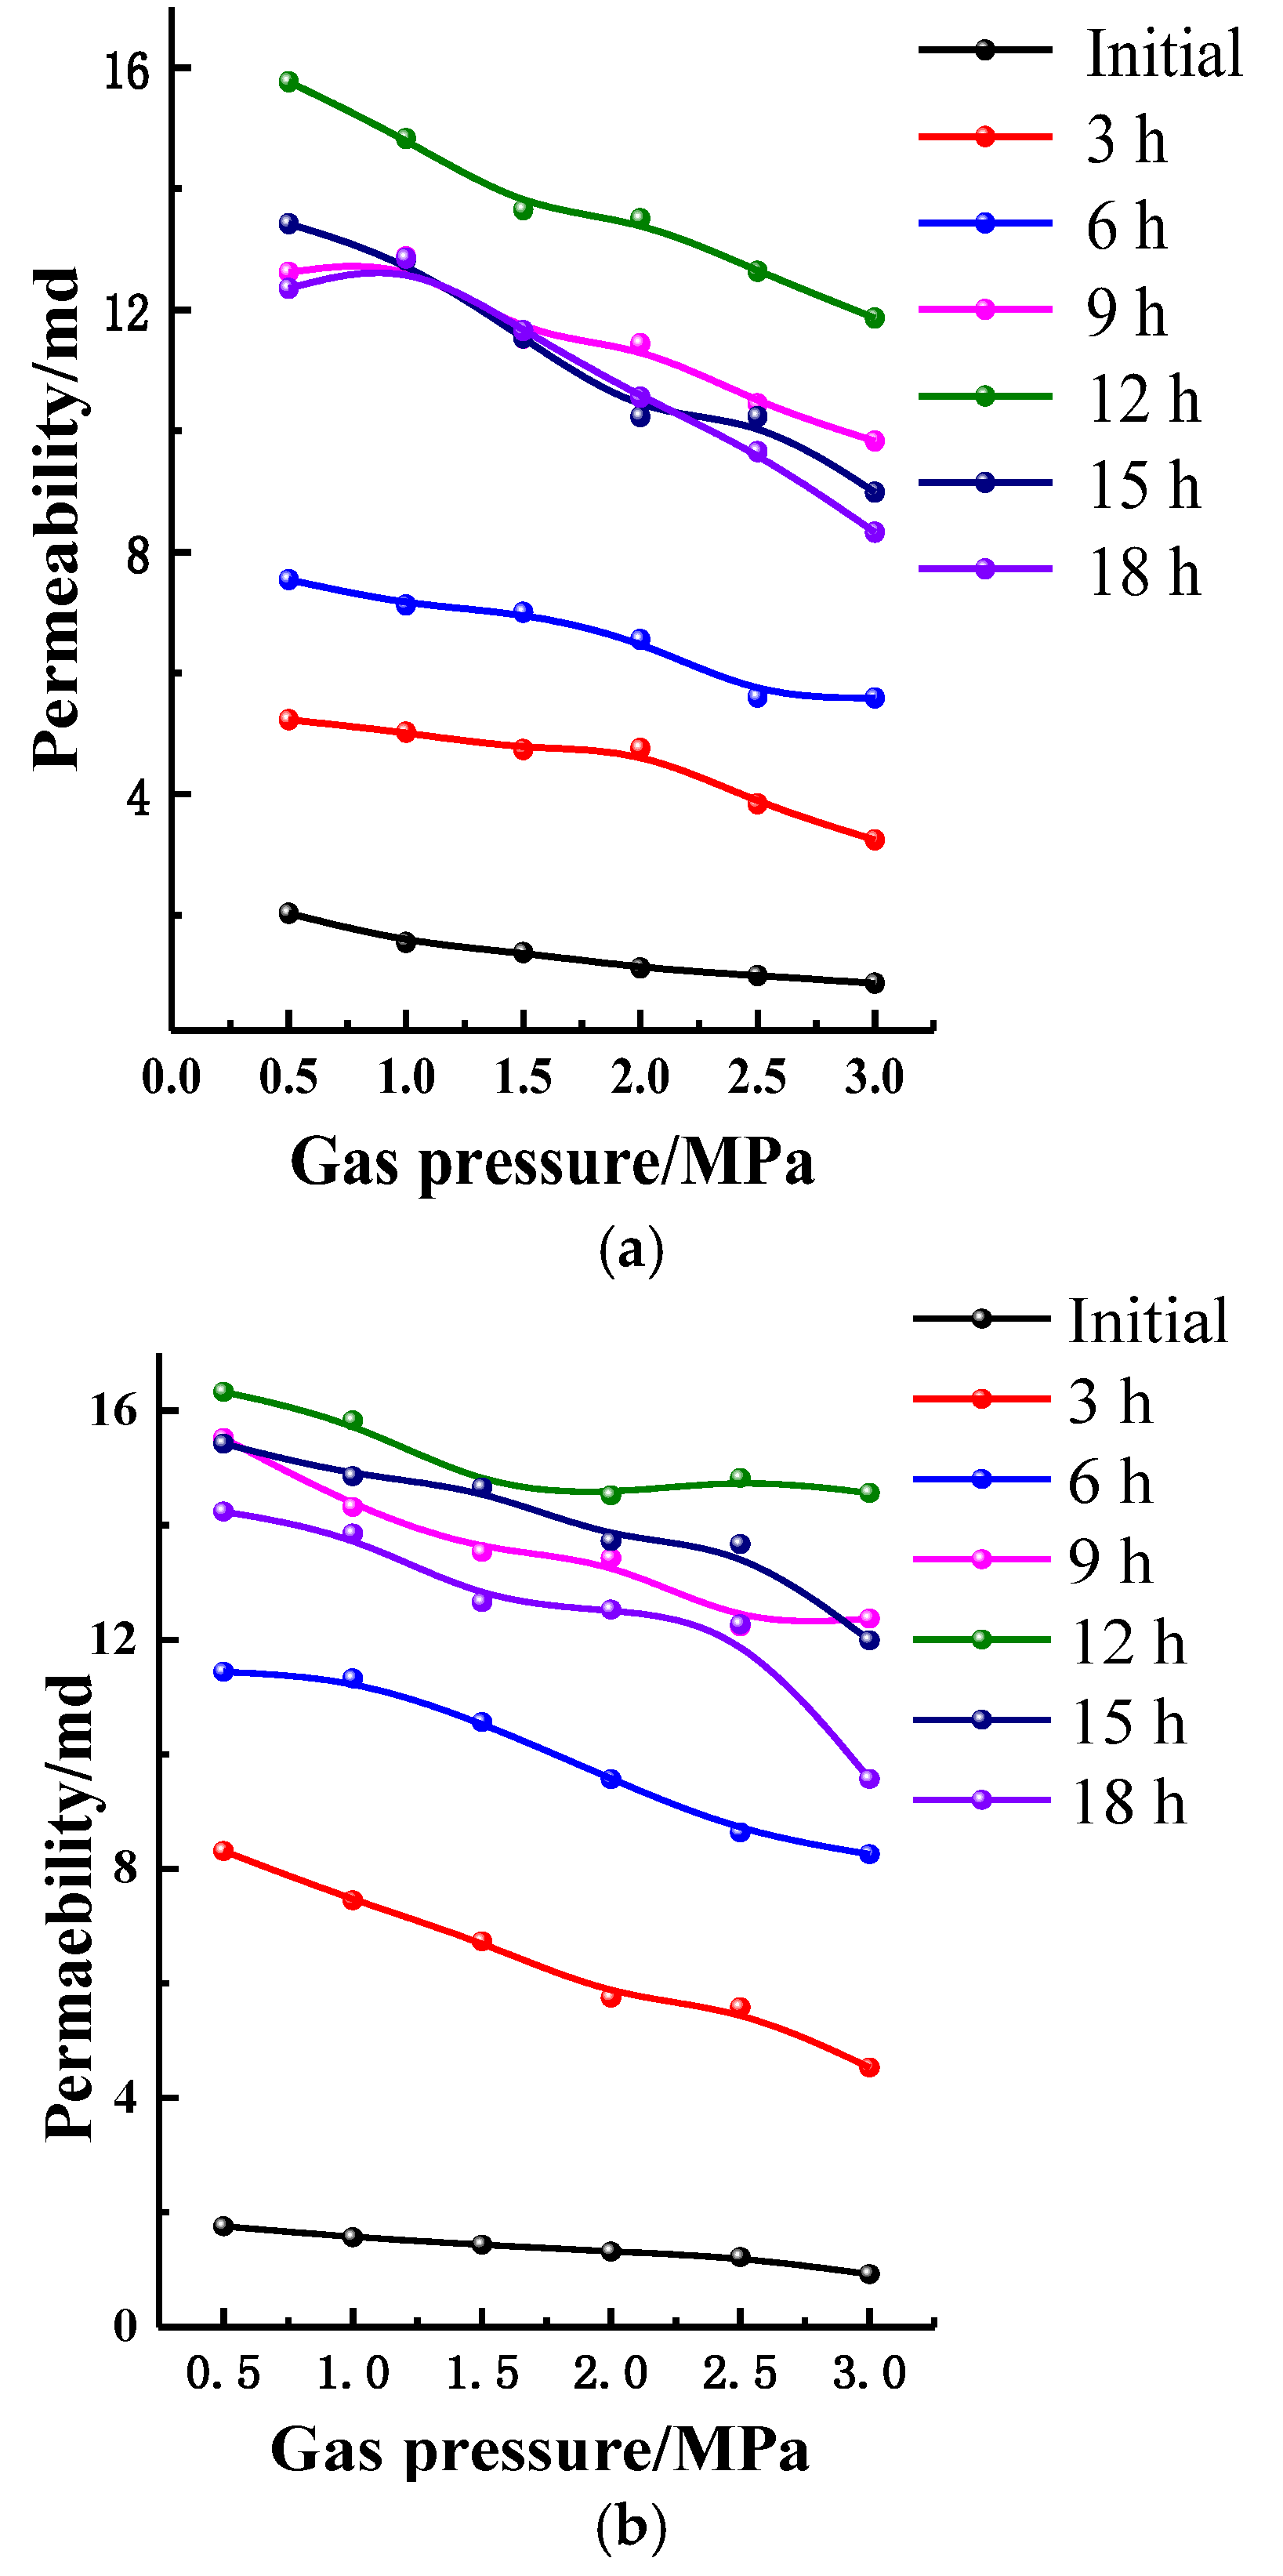

Figure 12.
Change rule of coal specimen’s permeability. (a) Qian Jiaying; (b) Xiao nan; (c) Liu jia.
Figure 12.
Change rule of coal specimen’s permeability. (a) Qian Jiaying; (b) Xiao nan; (c) Liu jia.

Table 1.
Mineral composition.
| Materials | Calcite | Dolomite | Kaolin | Quartz | Amorphous | |
|---|---|---|---|---|---|---|
| Specimens | ||||||
| Qian Jiaying | 11% | 3% | 8% | 4% | 74% | |
| Xiaonan | 18% | 6% | 4% | 3% | 69% | |
| Liujia | 12% | 2% | 4% | 3% | 79% | |
Table 2.
SSA and Pore Volume of Specimens by Acidizing.
| Specimens | Initial SSA () | SSA after Acidizing () | Initial Pore Volume () | Pore Volume after Acidizing () | Coal Rank |
|---|---|---|---|---|---|
| Qian Jiaying | 0.8258 | 1.3457 | 0.002891 | 0.008245 | Long flame coal |
| Xiaonan | 3.5151 | 6.2326 | 0.004258 | 0.018690 | Non-caking coal |
| Liujia | 6.4672 | 8.8345 | 0.013270 | 0.014250 | Coking coal |
Table 3.
Coal specimen permeability changes by acidizing.
| Specimen | Mass Fraction/% | Permeability/×10−15 m2 | ||||||
|---|---|---|---|---|---|---|---|---|
| Origin | 3 h | 6 h | 9 h | 12 h | 15 h | 18 h | ||
| Qian 1# | 9 | 0.875 | 3.243 | 5.589 | 9.834 | 11.863 | 8.987 | 8.325 |
| Qian 2# | 12 | 0.923 | 4.532 | 8.256 | 12.368 | 14.561 | 11.987 | 9.568 |
| Qian 3# | 15 | 0.821 | 4.952 | 9.311 | 12.886 | 15.122 | 12.635 | 10.007 |
| Xiao1# | 9 | 1.381 | 4.513 | 5.835 | 10.524 | 12.607 | 11.565 | 11.347 |
| Xiao 2# | 12 | 1.321 | 5.825 | 9.624 | 14.551 | 18.185 | 17.624 | 17.314 |
| Xiao3# | 15 | 1.287 | 6.005 | 10.104 | 15.831 | 19.624 | 18.523 | 18.387 |
| Liu 1# | 9 | 1.101 | 3.815 | 5.721 | 10.102 | 11.897 | 10.987 | 10.654 |
| Liu 2# | 12 | 1.023 | 4.532 | 9.235 | 13.627 | 17.263 | 16.587 | 16.254 |
| Liu 3# | 15 | 1.135 | 4.234 | 9.871 | 14.681 | 18.563 | 17.355 | 17.361 |
© 2018 by the authors. Licensee MDPI, Basel, Switzerland. This article is an open access article distributed under the terms and conditions of the Creative Commons Attribution (CC BY) license (http://creativecommons.org/licenses/by/4.0/).
Share and Cite
MDPI and ACS Style
Zhao, B.; Wen, G.; Sun, H.; Zhao, X. Experimental Study of the Pore Structure and Permeability of Coal by Acidizing. Energies 2018, 11, 1162. https://doi.org/10.3390/en11051162
AMA Style
Zhao B, Wen G, Sun H, Zhao X. Experimental Study of the Pore Structure and Permeability of Coal by Acidizing. Energies. 2018; 11(5):1162. https://doi.org/10.3390/en11051162
Chicago/Turabian StyleZhao, Bo, Guangcai Wen, Haitao Sun, and Xusheng Zhao. 2018. "Experimental Study of the Pore Structure and Permeability of Coal by Acidizing" Energies 11, no. 5: 1162. https://doi.org/10.3390/en11051162
Note that from the first issue of 2016, this journal uses article numbers instead of page numbers. See further details here.