Comparison of Thermal Models for Ground-Mounted South-Facing Photovoltaic Technologies: A Practical Case Study


 , ,
, ,  , and
, and
Abstract
:1. Introduction
2. Materials and Methods
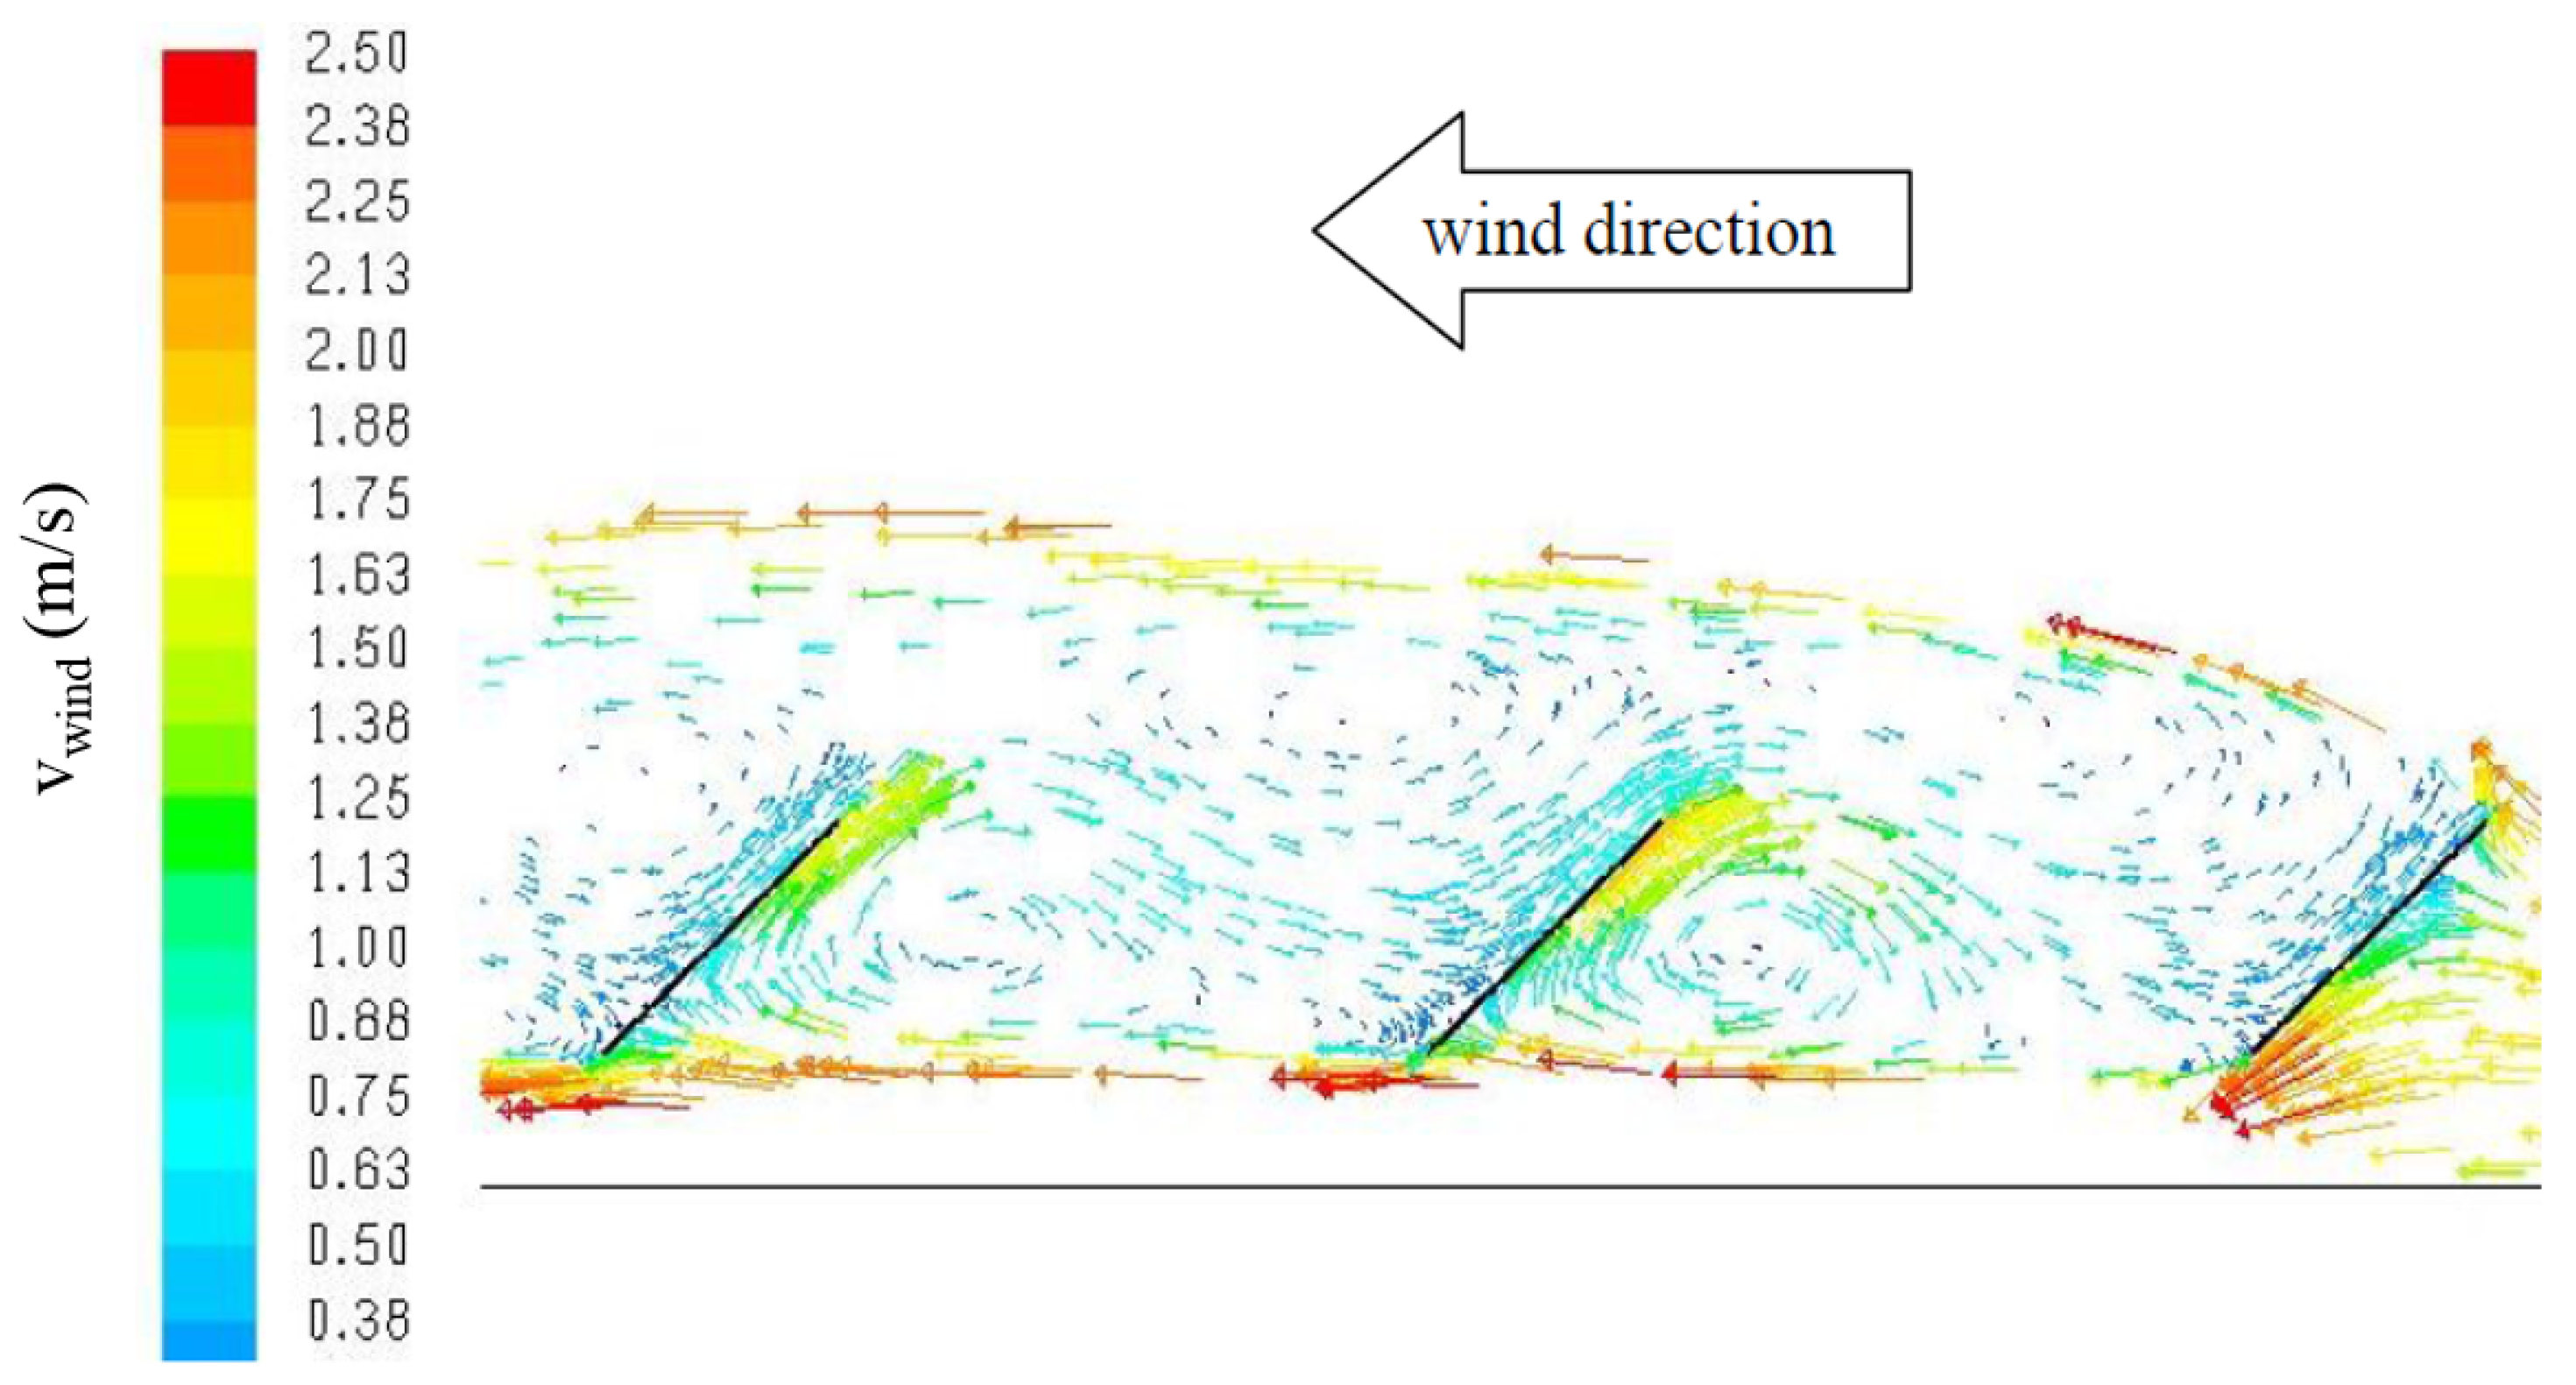
2.1. Thermal Dynamics for Photovoltaic Modules
- εsky = 0.95 for clear conditions; 1.0 for overcast conditions;
- εground = 0.95; and
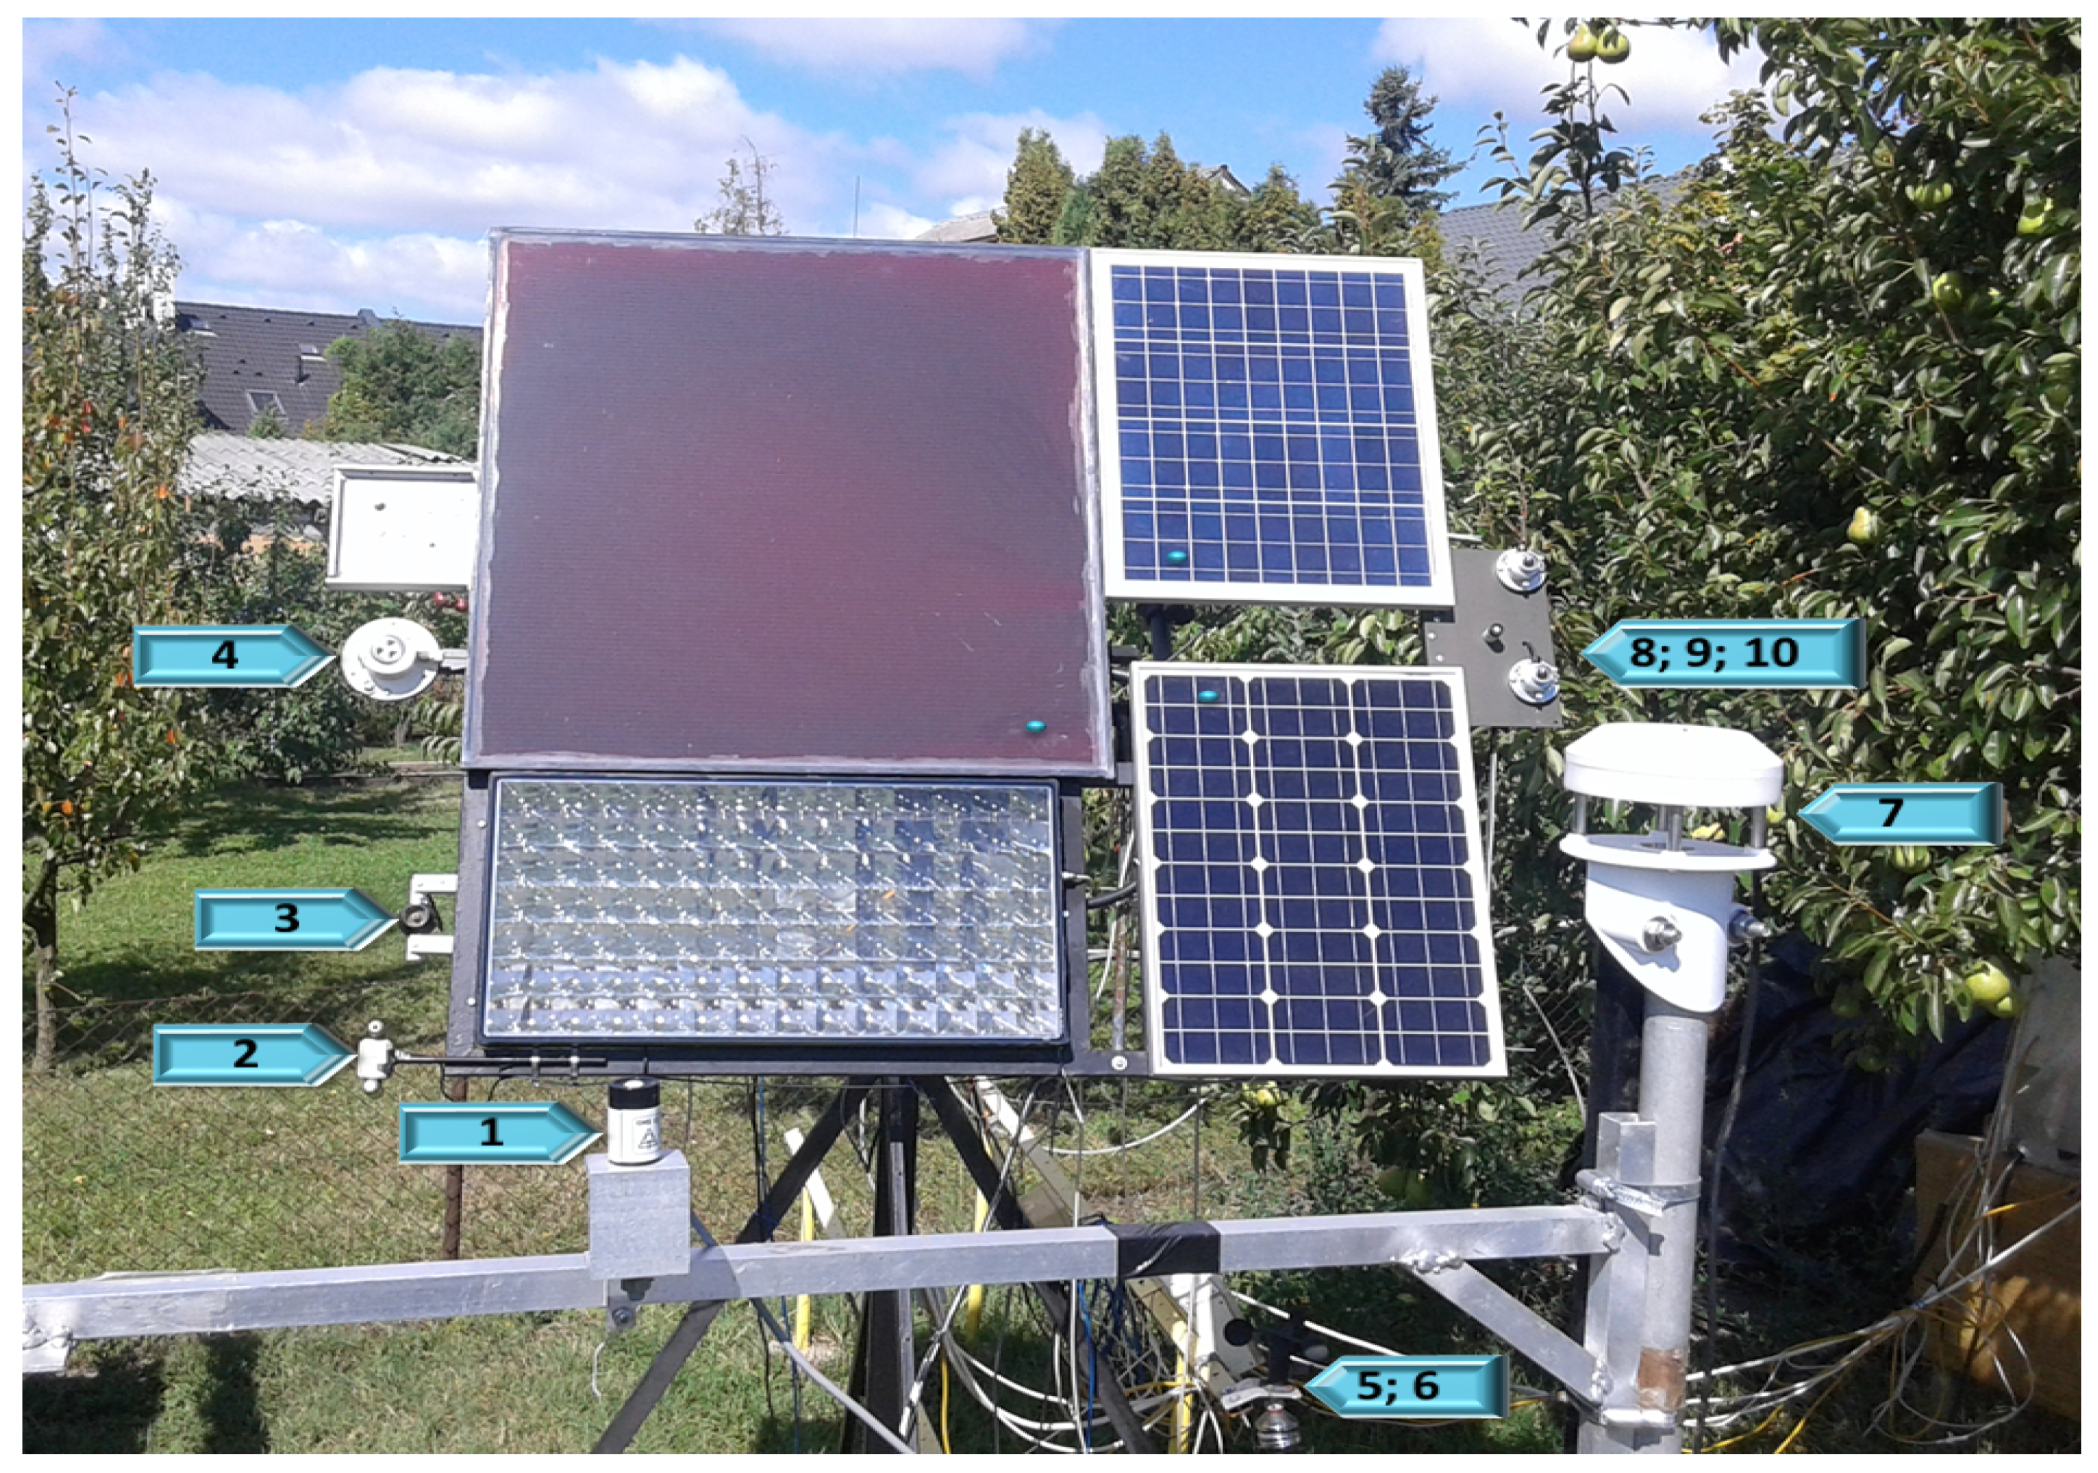
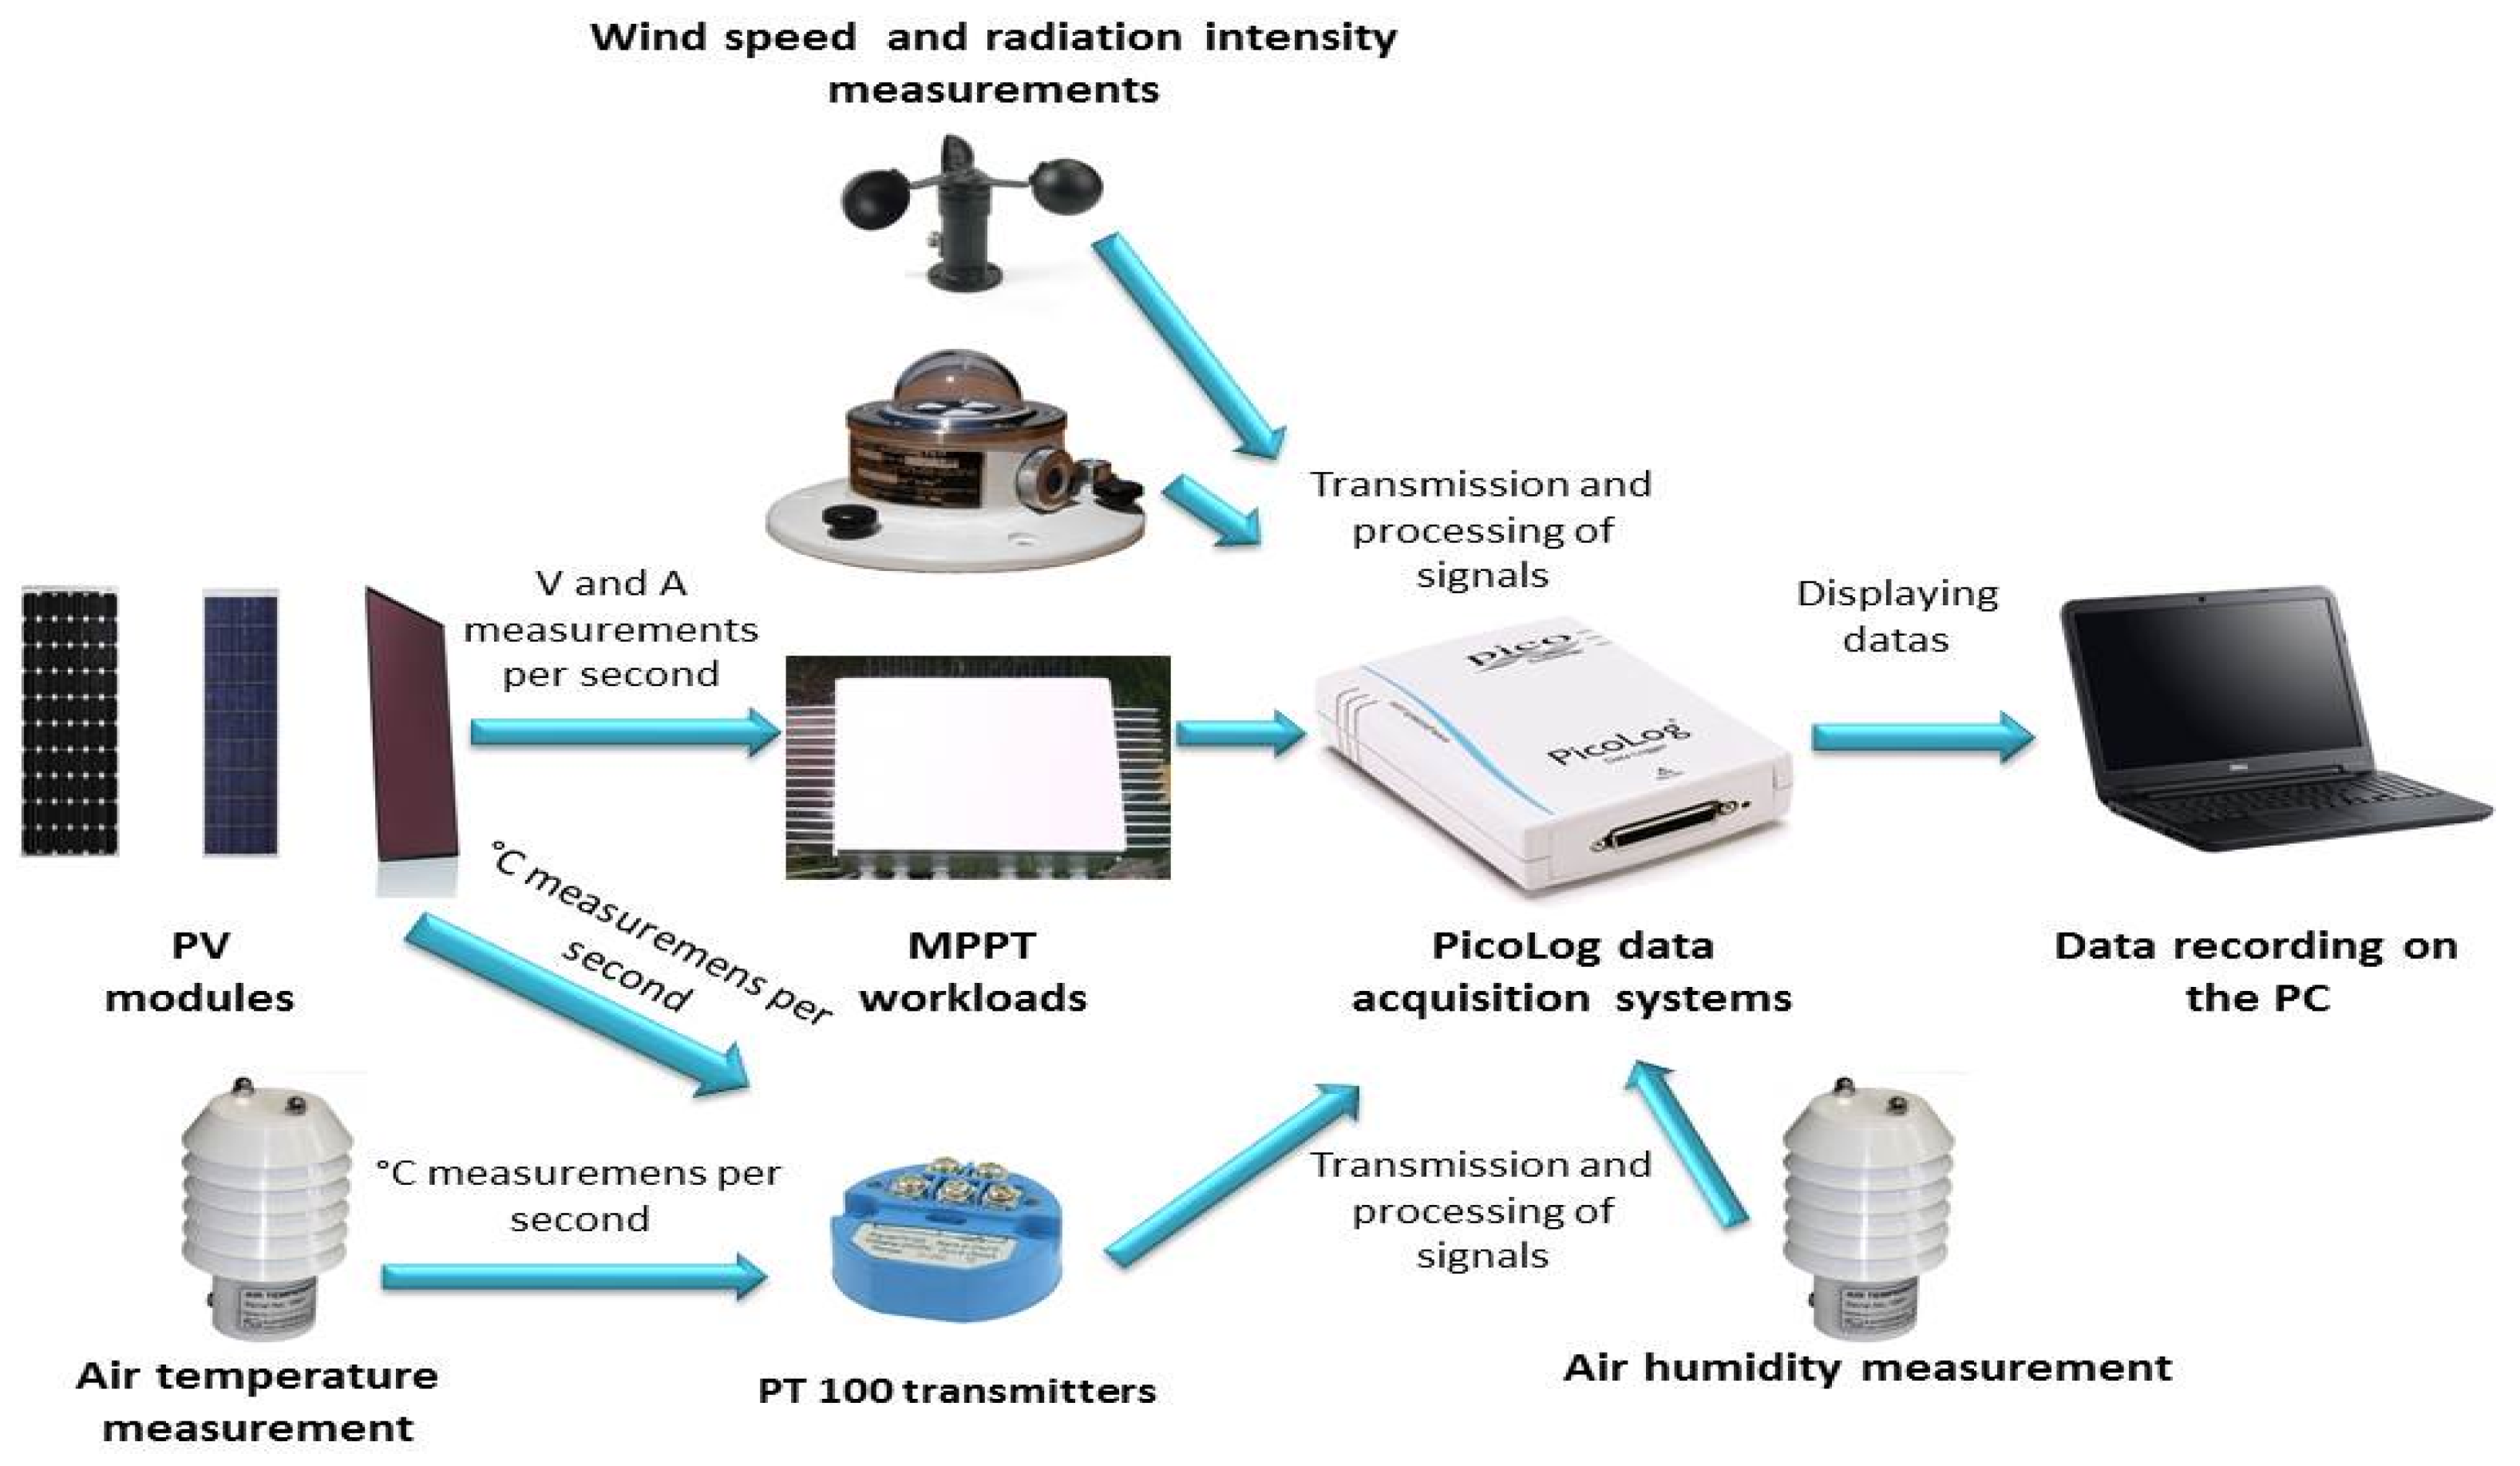
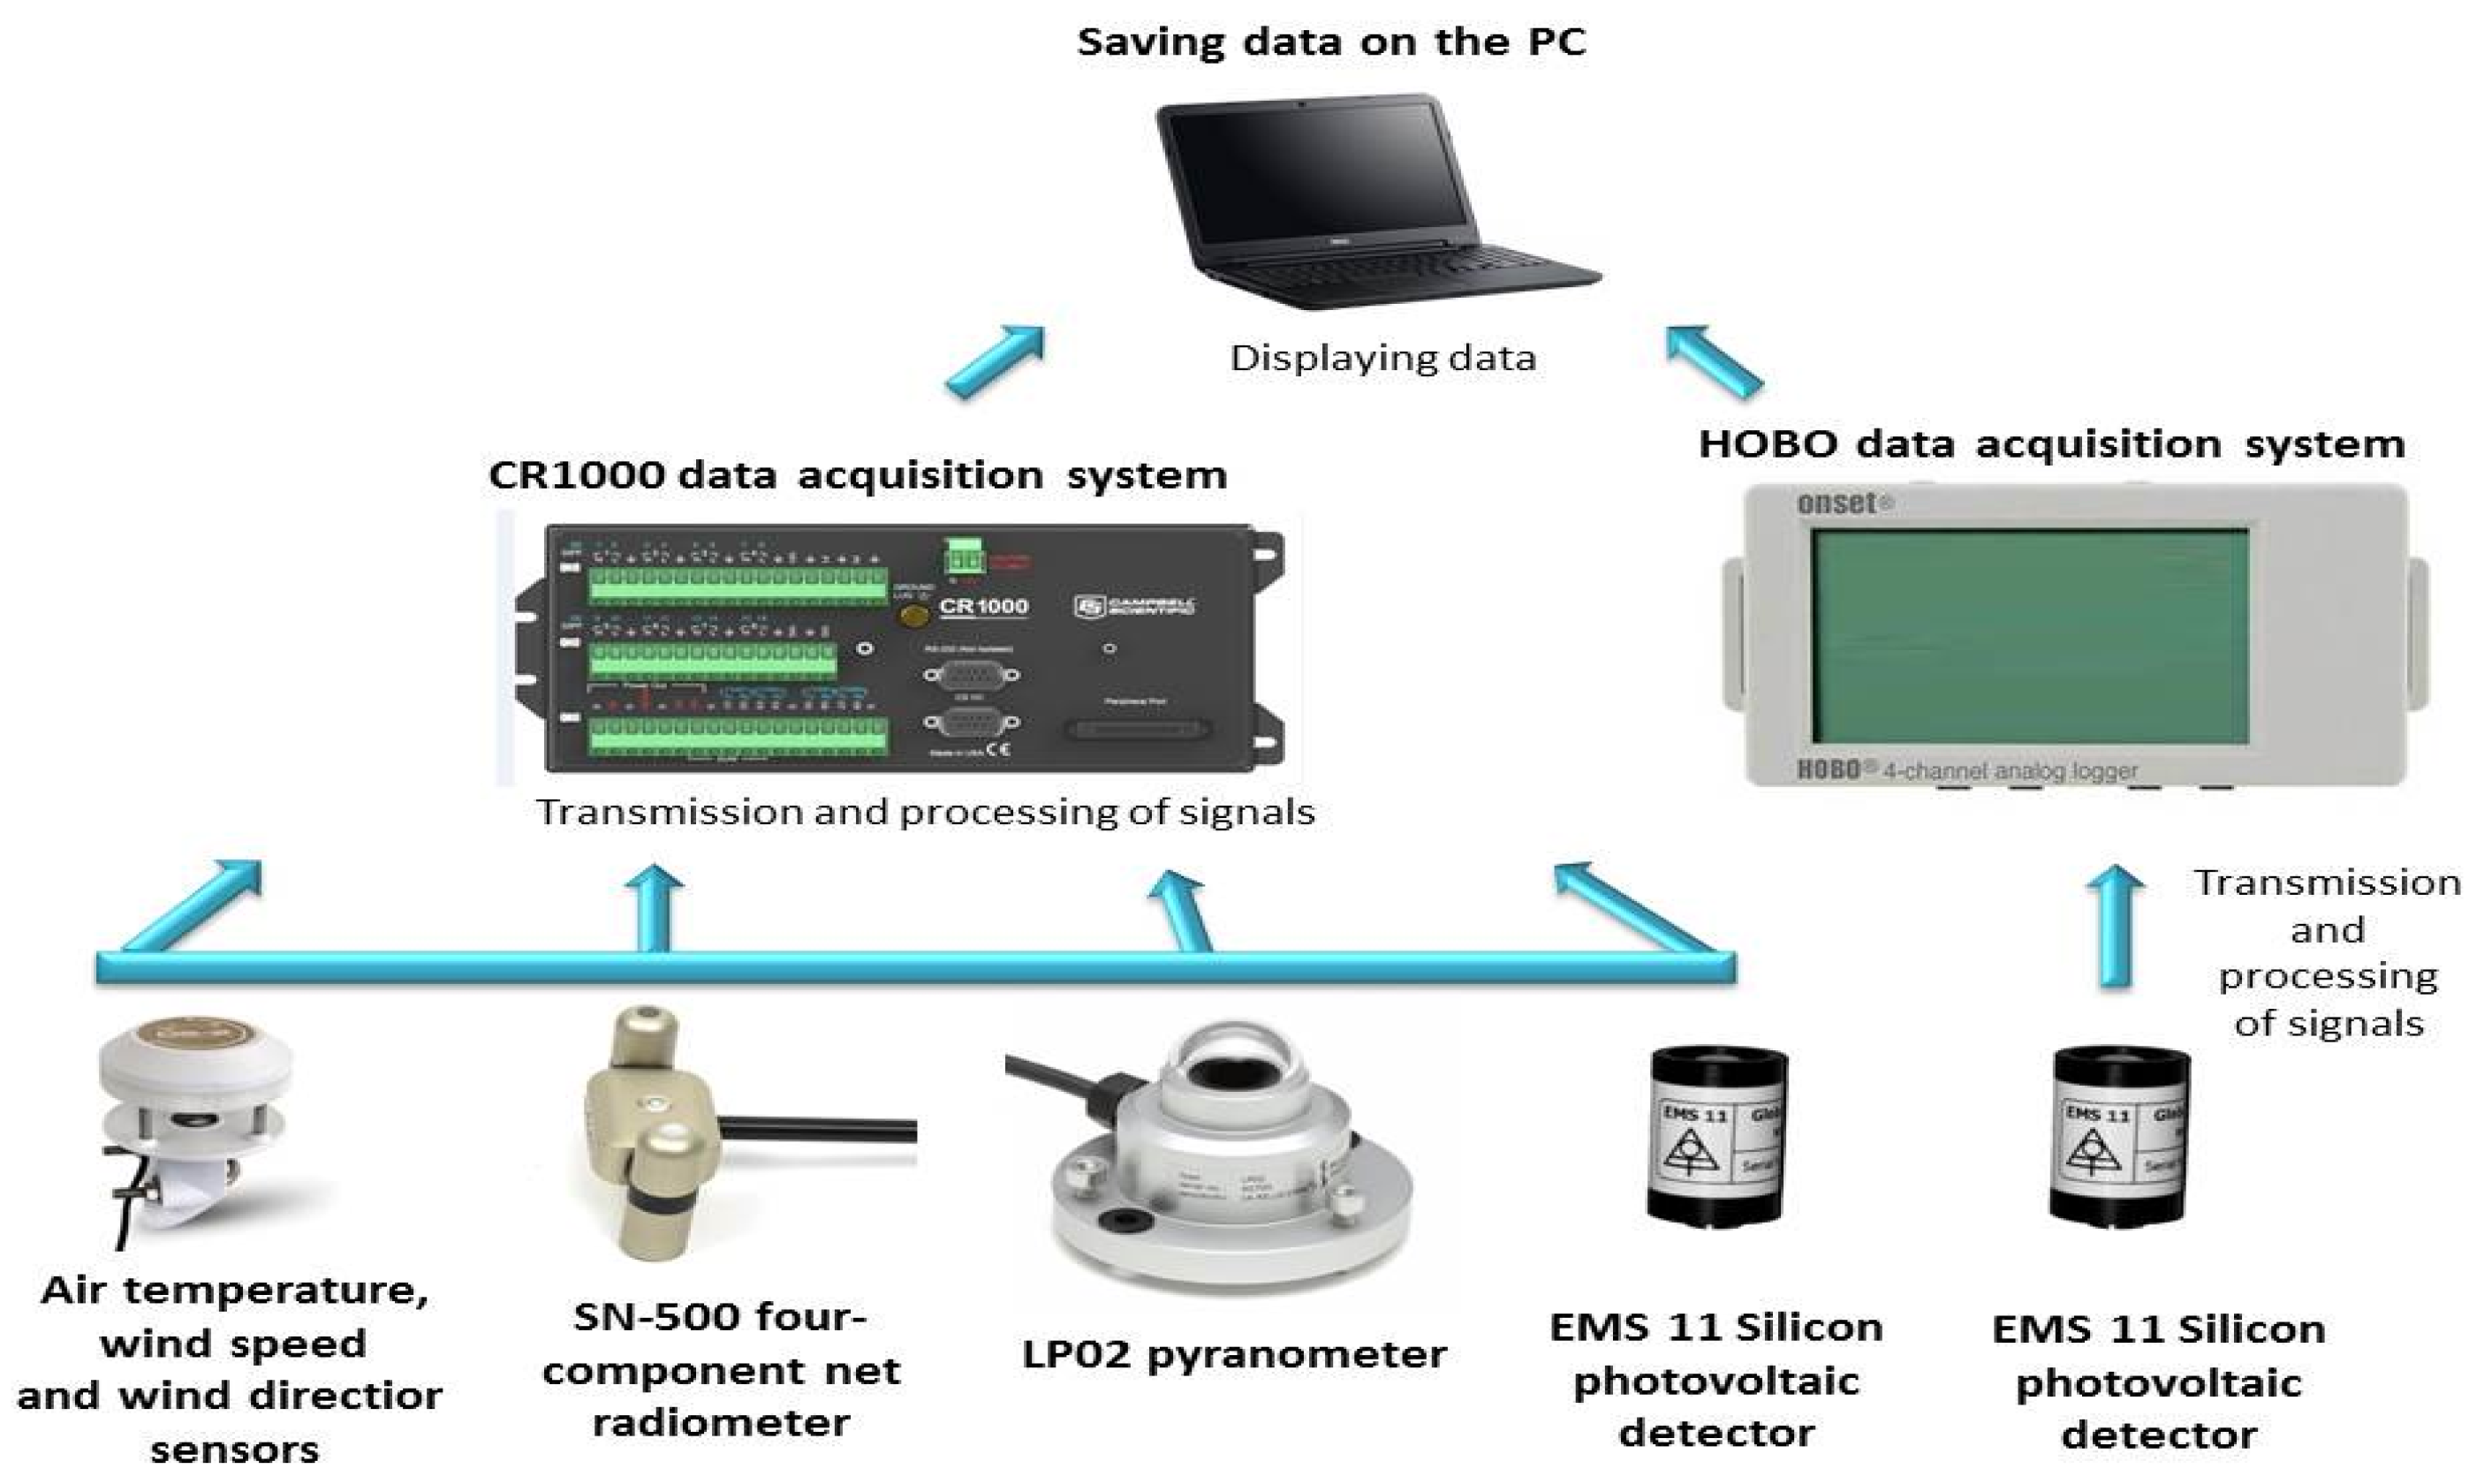
2.2. System Description
- One PicoLog 1012 data acquisition system (Pico Technology, St Neots, UK);
- One PicoLog 1216 data acquisition system; (Pico Technology, St Neots, UK);
- One CR1000 measurement and control datalogger (Campbell Scientific, Inc., Logan, UT, USA);
- One GB HOBO four-channel analog data logger (Onset Computer Corporation, Bourne, MA, USA).
3. Results and Discussion
3.1. Recommended Thermal Relationship for South-Facing Photovoltaic Modules
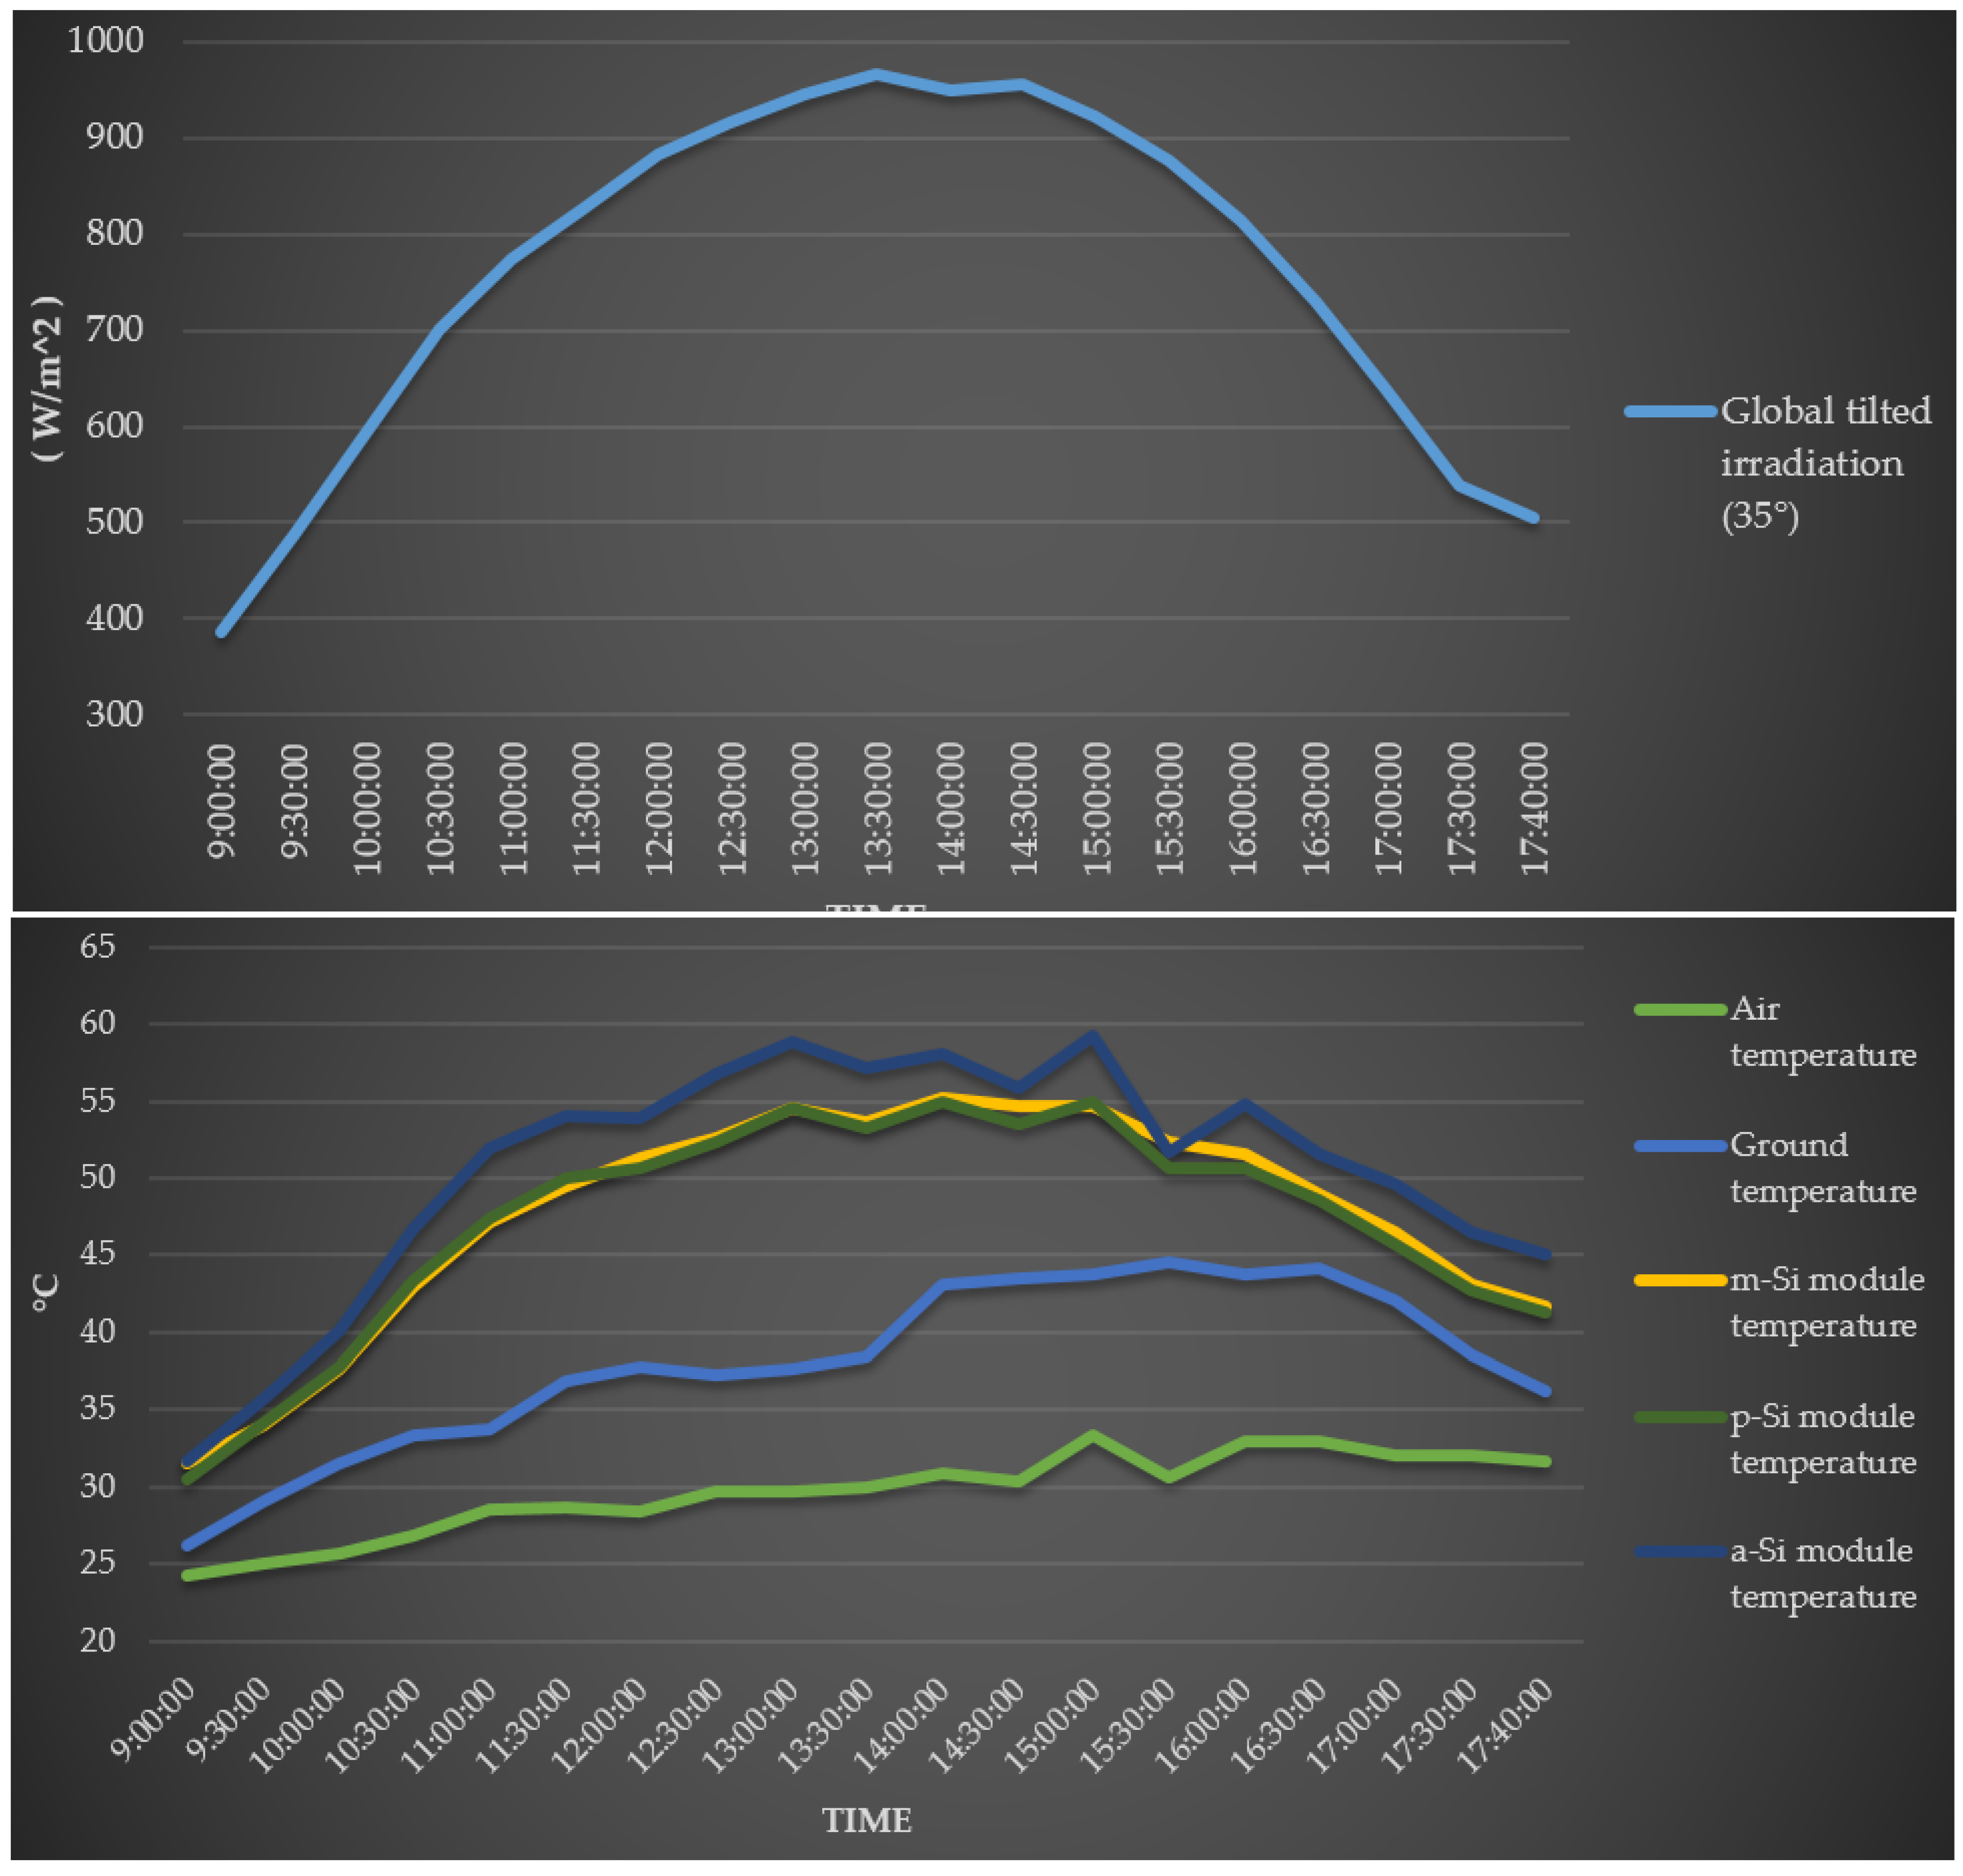
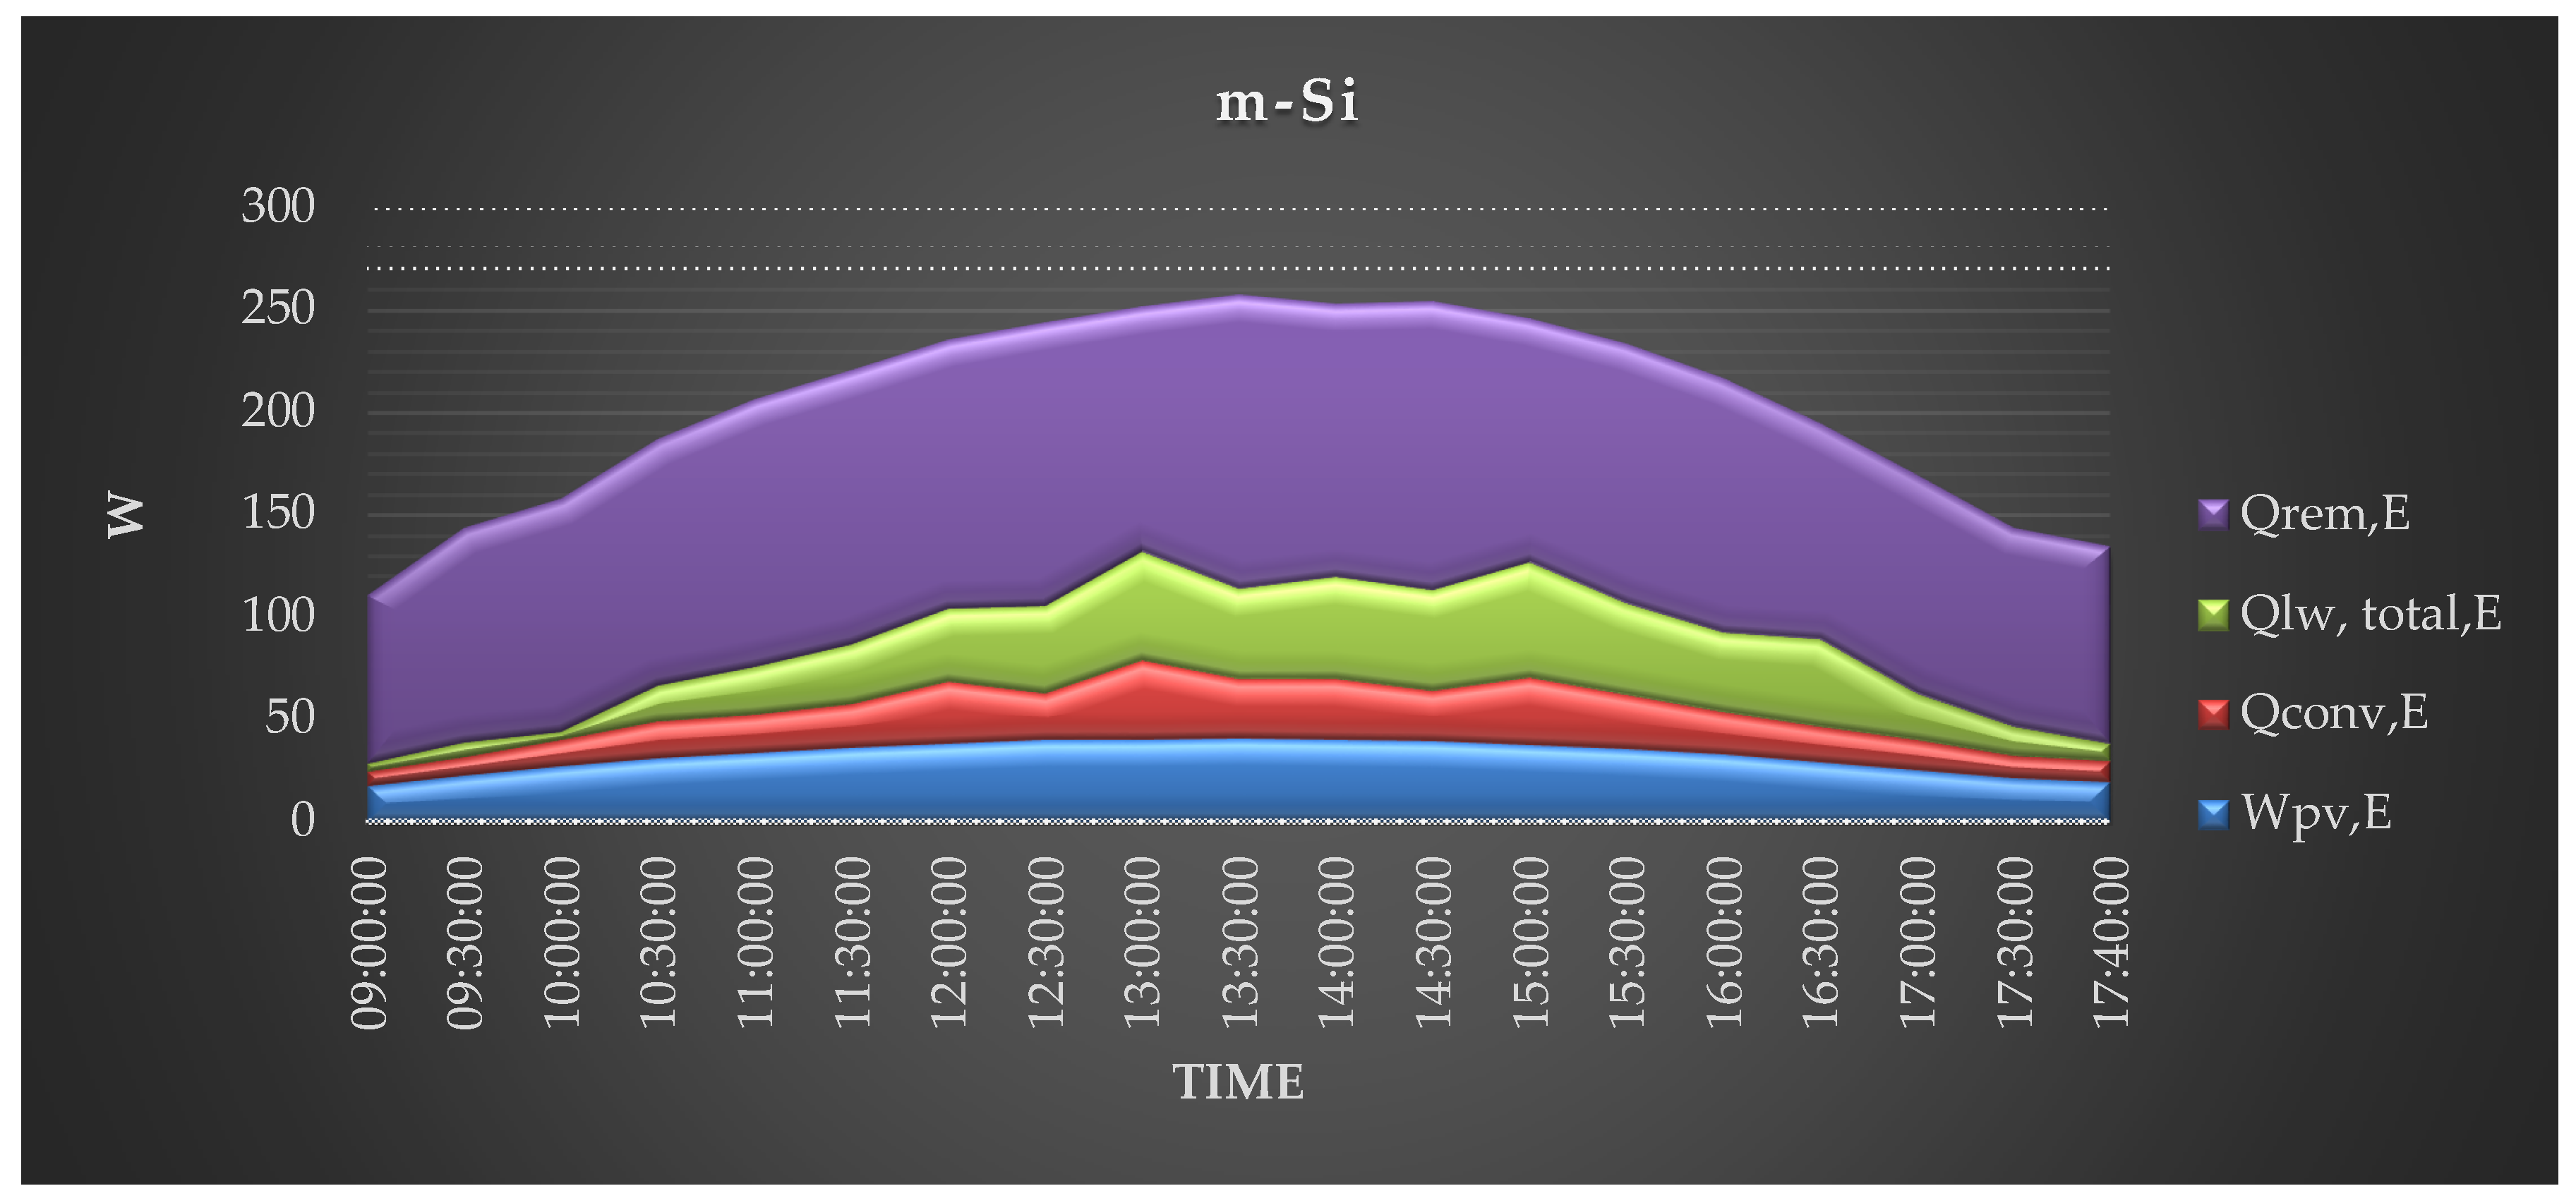
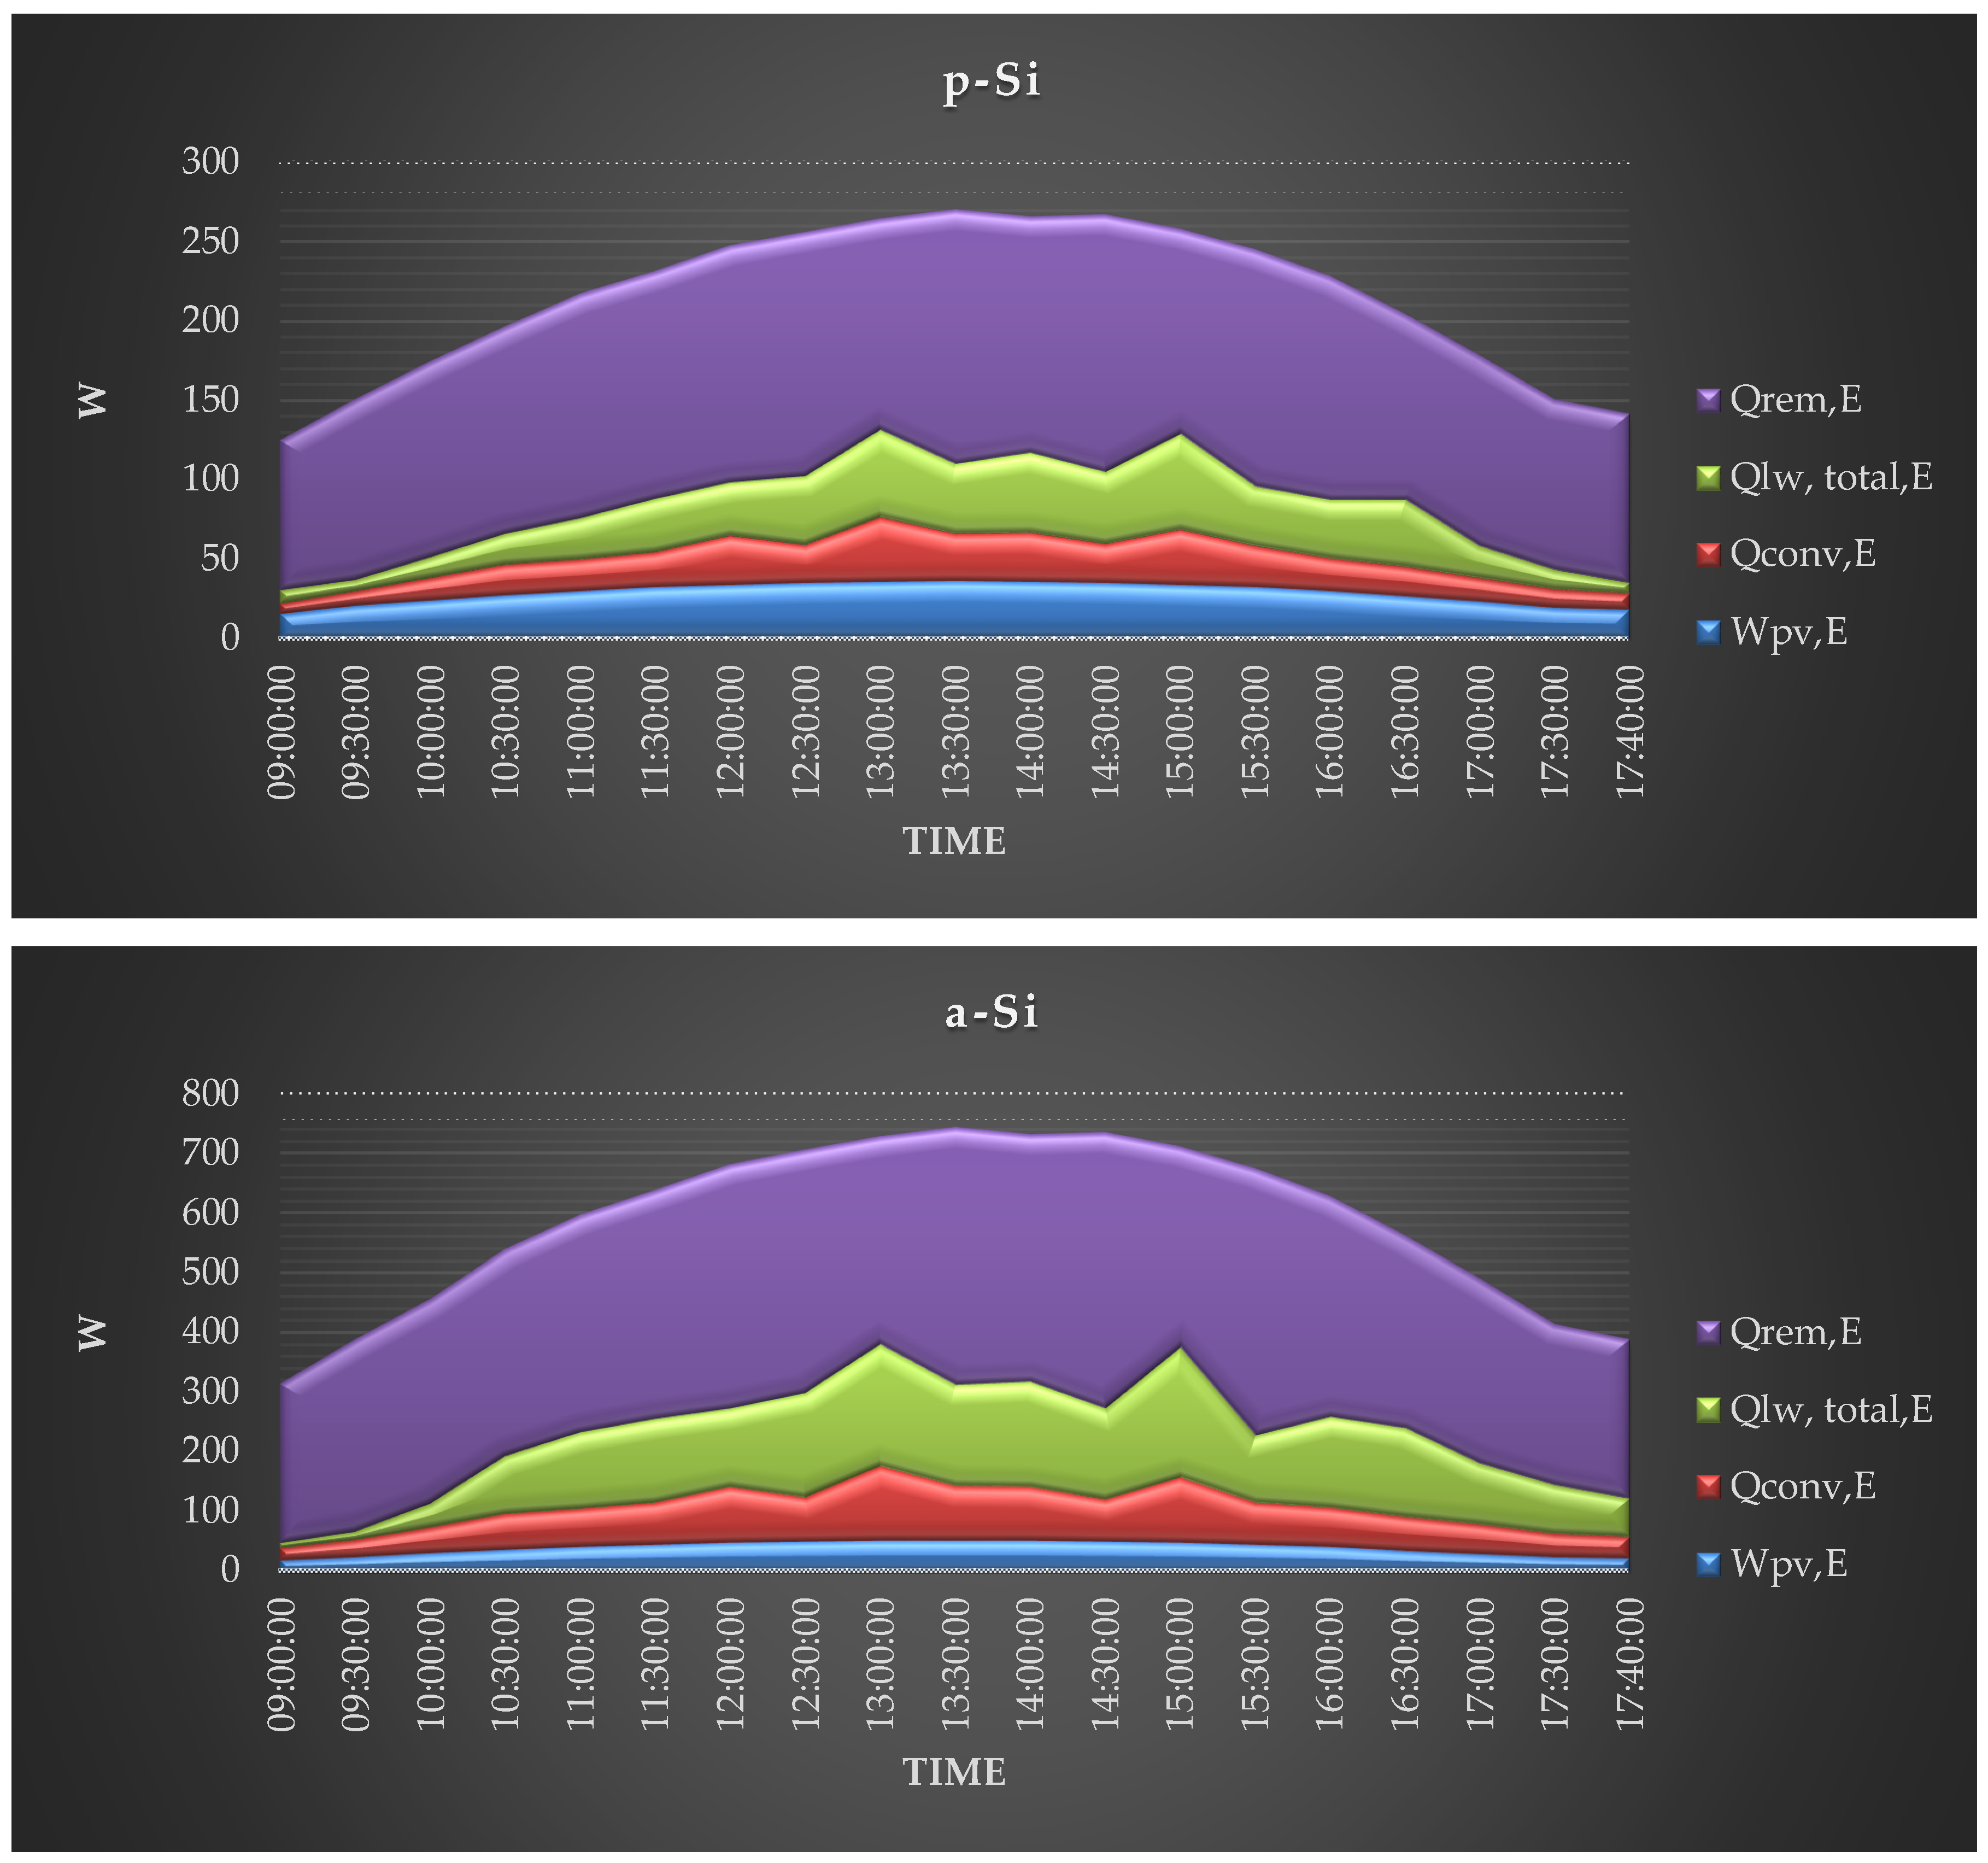
3.2. Experimental Results and Discussion
- m-Si modules: −13%,
- p-Si modules: −4.2%,
- a-Si modules: −12.2%.
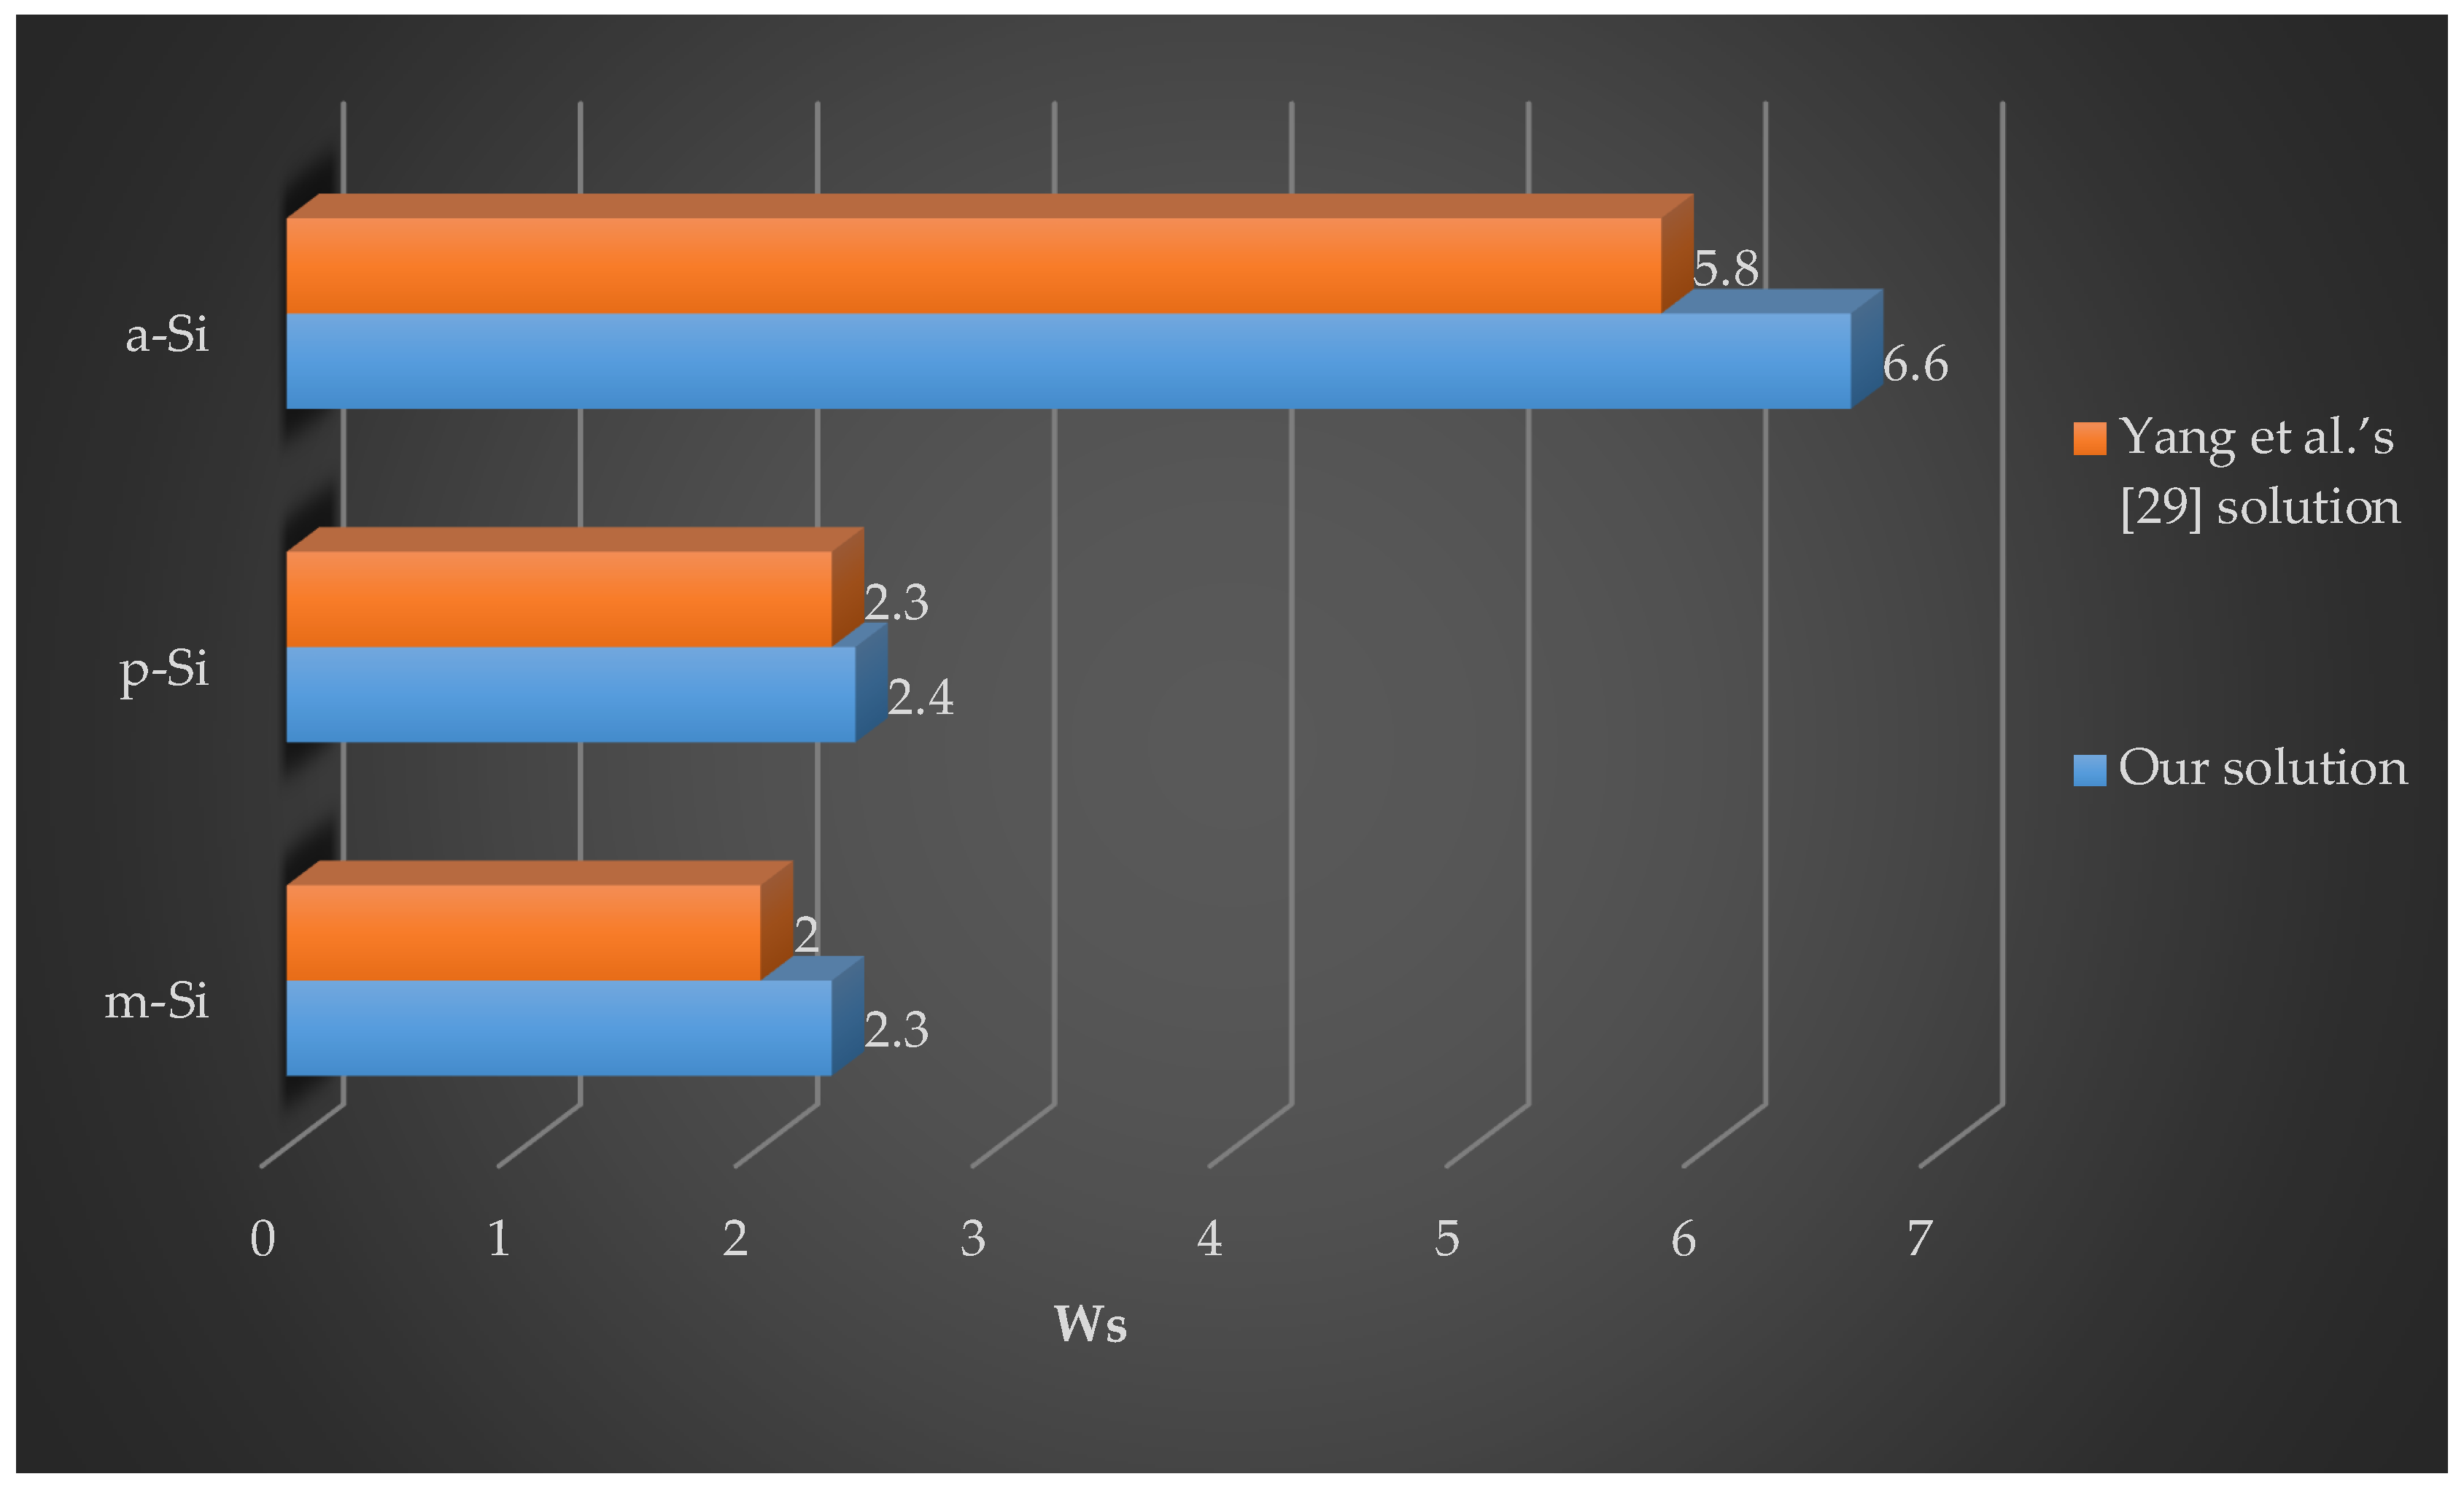
- for monocrystalline modules (m-Si modules), our model: −4.2%;
- for monocrystalline modules (m-Si modules), Yang et al.’s [29] model: −12.5%;
- for polycrystalline modules (p-Si modules), our model: −3.7%;
- for polycrystalline modules (p-Si modules), Yang et al.’s [29] model: −11.1%;
- for amorphous silicon solar modules (a-Si modules), our model: −4.2%;
- for amorphous silicon solar modules (a-Si modules), Yang et al.’s [29] model: −15.3%.
4. Conclusions
Author Contributions
Acknowledgments
Conflicts of Interest
Nomenclature
| Nomenclature | |
| Apv | PV module surface area (m2) |
| Cpv | Module heat capacity (J/(kgK)) |
| G | Incoming solar irradiance (W/m2) |
| hconv | Overall convection coefficient (W/(m2K)) |
| hForce | Forced convection coefficient (W/(m2K)) |
| hFree | Free convection coefficient (W/(m2K3/2)) |
| mpv | Mass of PV module (kg) |
| PPV | PV output power (W) |
| Qconv | Convective heat transfer on PV module (W) |
| Qconv,E | Convective energy exchange for the PV module (Ws) |
| Qlw,down | Emitted long-wave radiation at the bottom of the module surface (W) |
| Qlw,down,E | Net long-wave radiation at the bottom of the module surface (Ws) |
| Qlw,total | Total emitted long-wave radiation at the module surface (W) |
| Qlw,total,E | Total net long-wave radiation at the module surface (Ws) |
| Qlw,up | Emitted long-wave radiation at the top of the module surface (W) |
| Qlw,up,E | Net long-wave radiation at the top of the module surface (Ws) |
| Qrem | Remaining heat on PV module (W) |
| Qrem,E | Remaining heat energy on PV module (Ws) |
| Qsw | Effective irradiation on PV module (W) |
| Qsw,E | Net rate short-wave energy exchange at module (Ws) |
| Tamb | Ambient (air) temperature (K) |
| Tground | Ground temperature (K) |
| Tmodule | PV module temperature (K) |
| Tsky | Sky temperature (K) |
| vwind | Wind speed (m/s) |
| Wpv | PV energy output (Ws) |
| Greek letters | |
| α | PV module absorptivity (-) |
| εground | Emissivity of surface of ground (-) |
| εmodule | Emissivity of the PV module (-) |
| εsky | Emissivity of the sky dome (-) |
| σ | Stefan–Boltzmann’s constant (=5.669 × 10⁻⁸ W/(m2 K4)) |
| Subscripts | |
| Levelized cost of electricity | LCOE (-) |
| PV | Photovoltaic (-) |
| TMPS | True Maximum Point Seeking (-) |
References
- Zsiborács, H.; Pályi, B.; Pintér, G.; Popp, J.; Balogh, P.; Gabnai, Z.; Pető, K.; Farkas, I.; Baranyai, N.H.; Bai, A. Technical-economic study of cooled crystalline solar modules. Sol. Energy 2016, 140. [Google Scholar] [CrossRef]
- Roth, W. General Concepts of Photovoltaic Power Supply Systems; Fraunhofer Institute for Solar Energy Systems ISE: Freiburg, Germany, 2005; pp. 1–23. [Google Scholar]
- Fraunhofer Institute for Solar Energy Systems. ISE Photovoltaics Report; ISE: Freiburg, Germany, 2017; pp. 1–45. [Google Scholar]
- Sawin, J. Renewable Energy Policy Network for the 21st Century Renewables 2017 Global Status Report; REN21 Secretariat: Paris, France, 2017; pp. 1–302. [Google Scholar]
- Bai, A.; Popp, J.; Balogh, P.; Gabnai, Z.; Pályi, B.; Farkas, I.; Pintér, G.; Zsiborács, H. Technical and economic effects of cooling of monocrystalline photovoltaic modules under Hungarian conditions. Renew. Sustain. Energy Rev. 2016, 60. [Google Scholar] [CrossRef]
- Cucchiella, F.; D’Adamo, I.; Gastaldi, M. Economic Analysis of a Photovoltaic System: A Resource for Residential Households. Energies 2017, 10, 814. [Google Scholar] [CrossRef]
- Leccisi, E.; Raugei, M.; Fthenakis, V. The Energy and Environmental Performance of Ground-Mounted Photovoltaic Systems—A Timely Update. Energies 2016, 9, 622. [Google Scholar] [CrossRef]
- Benick, J.; Richter, A.; Muller, R.; Hauser, H.; Feldmann, F.; Krenckel, P.; Riepe, S.; Schindler, F.; Schubert, M.C.; Hermle, M.; et al. High-Efficiency n-Type HP mc Silicon Solar Cells. IEEE J. Photovolt. 2017, 7, 1171–1175. [Google Scholar] [CrossRef]
- Cosme, I.; Cariou, R.; Chen, W.; Foldyna, M.; Boukhicha, R.; Roca i Cabarrocas, P.; Lee, K.D.; Trompoukis, C.; Depauw, V. Lifetime assessment in crystalline silicon: From nanopatterned wafer to ultra-thin crystalline films for solar cells. Sol. Energy Mater. Sol. Cells 2015, 135, 93–98. [Google Scholar] [CrossRef]
- Green, M.A.; Emery, K.; Hishikawa, Y.; Warta, W.; Dunlop, E.D. Solar cell efficiency tables (version 48). Prog. Photovolt. Res. Appl. 2016, 24, 905–913. [Google Scholar] [CrossRef]
- Green, M.A.; Hishikawa, Y.; Dunlop, E.D.; Levi, D.H.; Hohl-Ebinger, J.; Ho-Baillie, A.W.Y. Solar cell efficiency tables (version 51). Prog. Photovolt. Res. Appl. 2018, 26, 3–12. [Google Scholar] [CrossRef]
- International Energy Agency. International Energy Agency Technology Roadmap Solar Photovoltaic Energy, 2014th ed.; International Energy Agency: Paris, France, 2014; pp. 1–60. [Google Scholar]
- Krempasky, J. Semiconductors, Questions and Answers; Technical Publishing House: Budapest, Hungary, 1977. [Google Scholar]
- Panasonic Corporation. Solar Cell Achieves World’s Highest Energy Conversion Efficiency of 25.6% at Research Level. Available online: http://news.panasonic.com/global/press/data/2014/04/en140410-4/en140410-4.html (accessed on 20 February 2018).
- Verlinden, P.; Deng, W.; Zhang, X.; Yang, Y.; Xu, J.; Shu, Y.; Quan, P.; Sheng, J.; Zhang, S.; Bao, J. Strategy, development and mass production of high-efficiency crystalline Si PV modules. In Proceedings of the 6th World Conference on Photovoltaic Energy Conversion, Kioto, Japan, 24–27 November 2014. [Google Scholar]
- Zsiborács, H.; Pályi, B.; Baranyai, H.N.; Veszelka, M.; Farkas, I.; Pintér, G. Energy performance of the cooled amorphous silicon photovoltaic (PV) technology. Idojaras 2016, 120, 415–430. [Google Scholar]
- Kondo, M.; Yoshida, I.; Saito, K.; Matsumoto, M.; Suezaki, T.; Sai, H.; Matsui, T. Development of Highly Stable and Efficient Amorphous Silicon Based Solar Cells. In Proceedings of the 28th European Photovoltaic Solar Energy Conference, Villepinte, France, 30 September–4 October 2013; pp. 2213–2217. [Google Scholar] [CrossRef]
- Cornaro, C.; Renzi, L.; Pierro, M.; Di Carlo, A.; Guglielmotti, A. Thermal and Electrical Characterization of a Semi-Transparent Dye-Sensitized Photovoltaic Module under Real Operating Conditions. Energies 2018, 11, 155. [Google Scholar] [CrossRef]
- Chandrasekar, M.; Rajkumar, S.; Valavan, D. A review on the thermal regulation techniques for non integrated flat PV modules mounted on building top. Energy Build. 2015, 86, 692–697. [Google Scholar] [CrossRef]
- Skoplaki, E.; Palyvos, J.A. Operating temperature of photovoltaic modules: A survey of pertinent correlations. Renew. Energy 2009, 34, 23–29. [Google Scholar] [CrossRef]
- Skoplaki, E.; Palyvos, J.A. On the temperature dependence of photovoltaic module electrical performance: A review of efficiency/power correlations. Sol. Energy 2009, 83, 614–624. [Google Scholar] [CrossRef]
- Alami, A.H. Effects of evaporative cooling on efficiency of photovoltaic modules. Energy Convers. Manag. 2014, 77, 668–679. [Google Scholar] [CrossRef]
- Radziemska, E.; Klugmann, E. Thermally affected parameters of the current–voltage characteristics of silicon photocell. Energy Convers. Manag. 2002, 43, 1889–1900. [Google Scholar] [CrossRef]
- Krauter, S. Increased electrical yield via water flow over the front of photovoltaic panels. Sol. Energy Mater. Sol. Cells 2004, 82, 131–137. [Google Scholar] [CrossRef]
- Abdolzadeh, M.; Ameri, M. Improving the effectiveness of a photovoltaic water pumping system by spraying water over the front of photovoltaic cells. Renew. Energy 2009, 34, 91–96. [Google Scholar] [CrossRef]
- Calise, F.; Figaj, R.; Vanoli, L. Experimental and Numerical Analyses of a Flat Plate Photovoltaic/Thermal Solar Collector. Energies 2017, 10, 491. [Google Scholar] [CrossRef]
- First Solar. First Solar Series 4™ PV Module—Advanced Thin Film Solar Technology. Available online: http://www.firstsolar.com/-/media/First-Solar/Technical-Documents/Series-4-Datasheets/Series-4V3-Module-Datasheet.ashx (accessed on 29 March 2018).
- Jones, A.D.; Underwood, C.P. A thermal model for photovoltaic systems. Sol. Energy 2001, 70, 349–359. [Google Scholar] [CrossRef]
- Yang, H.; Zhou, W.; Lu, L.; Fang, Z. Optimal sizing method for stand-alone hybrid solar–wind system with LPSP technology by using genetic algorithm. Sol. Energy 2008, 82, 354–367. [Google Scholar] [CrossRef]
- Tsai, H.-F.; Tsai, H.-L. Implementation and verification of integrated thermal and electrical models for commercial PV modules. Sol. Energy 2012, 86, 654–665. [Google Scholar] [CrossRef]
- Tsai, H.-L. Design and Evaluation of a Photovoltaic/Thermal-Assisted Heat Pump Water Heating System. Energies 2014, 7, 3319–3338. [Google Scholar] [CrossRef]
- Xu, G.; Deng, S.; Zhang, X.; Yang, L.; Zhang, Y. Simulation of a photovoltaic/thermal heat pump system having a modified collector/evaporator. Sol. Energy 2009, 83, 1967–1976. [Google Scholar] [CrossRef]
- Zsiborács, H.; Weihs, P.; Trimmel, H.; Oswald, S.; Pályi, B. A Thermal Model for Monocrystalline Solar Modules. In Proceedings of the 22nd Workshop on Energy and Environment, Gödölllő, Hungary, 1–2 December 2016; pp. 1–28. [Google Scholar]
- Van Helden, W.G.J.; van Zolingen, R.J.C.; Zondag, H.A. PV thermal systems: PV panels supplying renewable electricity and heat. Prog. Photovolt. Res. Appl. 2004, 12, 415–426. [Google Scholar] [CrossRef]
- Santbergen, R.; van Zolingen, R.J.C. The absorption factor of crystalline silicon PV cells: A numerical and experimental study. Sol. Energy Mater. Sol. Cells 2008, 92, 432–444. [Google Scholar] [CrossRef]
- Liu, B.Y.H.; Jordan, R.C. A Rational Procedure for Predicting The Long-Term Average Performance of Flat-Plate Solar-Energy Collectors with Design Data for the U. S., Its Outlying Possessions and Canada. Sol. Energy 1963, 7, 53–74. [Google Scholar] [CrossRef]
- Schott, T. Operation temperatures of PV modules: A theoretical and experimental approach. In Proceedings of the EC Photovoltaic Solar Energy Conference, London, UK, 15–19 April 1985; pp. 392–396. [Google Scholar]
- Acciani, G.; Falcone, O.; Vergura, S. Analysis of the thermal heating of poly-Si and a-Si photovoltaic cell by means of Fem. In Proceedings of the International Conference on Renewable Energies and Power Quality (ICREPQ’10), Granada, Spain, 13–15 April 2010; pp. 1–5. [Google Scholar]
- Hodges, B. Heat Budget and Thermodynamics at a Free Surface: Some Theory and Numerical Implementation (Revision 1.0d) ED 1300 BH; University of Western Australia: Crawley, Australia, 1999. [Google Scholar]
- Holman, J. Heat Transfer, 10th ed.; The McGraw Hill Companies: New York, NY, USA, 2010. [Google Scholar]
- The American Society of Heating, Refrigerating and Air-Conditioning Engineers. 1989 ASHRAE Handbook: Fundamentals; ASHRAE: Atlanta, GA, USA, 1989; ISBN 9780910110570. [Google Scholar]
- Anis, W.R.; Mertens, R.P.; van Overstraeten, R.J. Calculation of solar cell operating temperature in a flat plate PV array. In Proceedings of the Photovoltaic Solar Energy Conference, Athens, Greece, 17–21 October 1983; pp. 520–524. [Google Scholar]
- Pratt, A.W. Heat Transmission in Buildings; Wiley: Hoboken, NJ, USA, 1981; ISBN 0471279714. [Google Scholar]
- Palyvos, J.A. A survey of wind convection coefficient correlations for building envelope energy systems’ modeling. Appl. Therm. Eng. 2008, 28, 801–808. [Google Scholar] [CrossRef]
- Haber, I.E.; Farkas, I. Numerical determination of the heat transfer of free standing solar modules. In Proceedings of the Seventh International Conference on Engineering Computational Technology, Valencia, Spain, 14–17 September 2010; Civil-Comp Press: Valencia, Spain, 2010; pp. 1–13. [Google Scholar]
- Haber, I.; Farkas, I. Monitoring the energy properties of photovoltaic modules. EEA Electroteh. Electron. Autom. 2012, 60, 13–18. [Google Scholar]
- Haber, I.; Farkas, I. Analysis of the air-flow at photovoltaic modules for cooling purposes. Pollack Period. 2012, 7, 113–121. [Google Scholar] [CrossRef]
- Háber, I.E.; Kistelegdi, I.; Farkas, I. Investigation of the solar and wind energy usage of a positive energy factory. Teh. Vjesn. Gaz. 2014, 21, 1243–1248. [Google Scholar]
- Haber, I. Energy Modelling of Phoptovoltaic and Photovoltaic-Thermal Systems. Ph.D. Thesis, Szent István University, Gödölllő, Hungary, 2016. [Google Scholar]
- Wang, Z.; Li, Y. Layer pattern thermal design and optimization for multistream plate-fin heat exchangers—A review. Renew. Sustain. Energy Rev. 2016, 53, 500–514. [Google Scholar] [CrossRef]
- Wang, Z.; Sundén, B.; Li, Y. A novel optimization framework for designing multi-stream compact heat exchangers and associated network. Appl. Therm. Eng. 2017, 116, 110–125. [Google Scholar] [CrossRef]
- Wang, Z.; Li, Y. Irreversibility analysis for optimization design of plate fin heat exchangers using a multi-objective cuckoo search algorithm. Energy Convers. Manag. 2015, 101, 126–135. [Google Scholar] [CrossRef]
- Xu, J.; Tang, J. Modeling and analysis of piezoelectric cantilever-pendulum system for multi-directional energy harvesting. J. Intell. Mater. Syst. Struct. 2017, 28, 323–338. [Google Scholar] [CrossRef]
- Xu, J.; Tang, J. Linear stiffness compensation using magnetic effect to improve electro-mechanical coupling for piezoelectric energy harvesting. Sens. Actuators A Phys. 2015, 235, 80–94. [Google Scholar] [CrossRef]
- Xu, J.W.; Liu, Y.B.; Shao, W.W.; Feng, Z. Optimization of a right-angle piezoelectric cantilever using auxiliary beams with different stiffness levels for vibration energy harvesting. Smart Mater. Struct. 2012, 21, 65017. [Google Scholar] [CrossRef]
- Wei, Z.; Lim, T.M.; Skyllas-Kazacos, M.; Wai, N.; Tseng, K.J. Online state of charge and model parameter co-estimation based on a novel multi-timescale estimator for vanadium redox flow battery. Appl. Energy 2016, 172, 169–179. [Google Scholar] [CrossRef]
- Wei, Z.; Tseng, K.J.; Wai, N.; Lim, T.M.; Skyllas-Kazacos, M. Adaptive estimation of state of charge and capacity with online identified battery model for vanadium redox flow battery. J. Power Sources 2016, 332, 389–398. [Google Scholar] [CrossRef]
- Wei, Z.; Meng, S.; Tseng, K.J.; Lim, T.M.; Soong, B.H.; Skyllas-Kazacos, M. An adaptive model for vanadium redox flow battery and its application for online peak power estimation. J. Power Sources 2017, 344, 195–207. [Google Scholar] [CrossRef]
- Li, H.; Liu, Z.; Liu, K.; Zhang, Z. Predictive Power of Machine Learning for Optimizing Solar Water Heater Performance: The Potential Application of High-Throughput Screening. Int. J. Photoenergy 2017, 2017, 1–10. [Google Scholar] [CrossRef]
- Breyer, C.; Schmid, J. Global Distribution of Optimal Tilt Angles for Fixed Tilted PV Systems. In Proceedings of the 25th European Photovoltaic Solar Energy Conference and Exhibition/5th World Conference on Photovoltaic Energy Conversion, Valencia, Spain, 6–9 September 2010; pp. 4715–4721. [Google Scholar]
- Santbergen, R.; Rindt, C.C.M.; Zondag, H.A.; van Zolingen, R.J.C. Detailed analysis of the energy yield of systems with covered sheet-and-tube PVT collectors. Sol. Energy 2010, 84, 867–878. [Google Scholar] [CrossRef]
- Szűcs, I. Applied Statistics; Agroinform Publishing Office: Budapest, Hungary, 2002. [Google Scholar]


| PV Module Installation Characteristics | Context | Wind Direction | Ref. |
|---|---|---|---|
| PV modules installed on facades | north | [48,49] | |
| south | |||
| PV modules installed on angled roofs | north | [46,47,49] | |
| south | |||
| PV modules installed on flat roofs | north | [49] | |
| south | |||
| Free standing PV modules | north | [45,49] | |
| south | |||
| All installation modes | cross-wind | [49] |
| Characteristics | Polycrystalline Solar Module | Monocrystalline Solar Module | Amorphous Silicon Solar Module |
|---|---|---|---|
| Manufacturer/Distributer | Energiesolaire100 | Prevent GmbH | Kaneka |
| Country of origin | Italy | Germany | Japan |
| Model | SL50TU-18P | SM636-50 | G-EA050 |
| Nominal performance (Pm) (W) | 50 | 50 | 50 |
| Performance tolerance (%) | ±3% | ±3% | ±10% |
| MPP current (Imp) (A) | 2.62 | 2.8 | 0.75 |
| MPP voltage (Vmp) (V) | 19.12 | 18.18 | 67 |
| Short circuit current (Isc) (A) | 2.80 | 3.08 | 1.19 |
| Open circuit voltage (Voc) (V) | 22.68 | 23.17 | 91.8 |
| Module size (mm): (width × height × depth) | 545 × 668 × 28 | 510 × 680 × 35 | 960 × 990 × 40 |
| Description | Context | |
|---|---|---|
| Remaining heat on PV module (Qrem, [W]) | ||
| Effective irradiation on PV module (Qsw, [W]) | ||
| * Emitted long-wave radiation (Qlw, [W]) | ) | |
) | ||
) | ||
| Convective heat transfer on PV module (Qconv, [W]) | ||
| Overall convective heat transfer (W/(m2K)) | , | north wind direction |
| south wind direction | ||
| , | cross-wind | |
| Description | m-Si (Ws) | p-Si (Ws) | a-Si (Ws) | ||||||
|---|---|---|---|---|---|---|---|---|---|
| Ws | Relation (%) | CV% | Ws | Relation (%) | CV% | Ws | Relation (%) | CV% | |
| Three-day average, measured (Ws) | 2.4 | 100 | 2 | 2.7 | 100 | 1.9 | 7.2 | 100 | 0 |
| Three-day average, our model calculation (Ws) | 2.3 | 95.8 | 0 | 2.6 | 96.3 | 0 | 6.9 | 95.8 | 3.4 |
| Three-day average, Yang et al.’s [29] model solution (Ws) | 2.1 | 87.5 | 2.3 | 2.4 | 88.9 | 2.0 | 6.1 | 84.7 | 6.3 |
| Description | m-si | p-Si | a-Si | |||||||||
|---|---|---|---|---|---|---|---|---|---|---|---|---|
| Qrem | Qlw,total | Qconv | Wpv | Qrem | Qlw,total | Qconv | Wpv | Qrem | Qlw,total | Qconv | Wpv | |
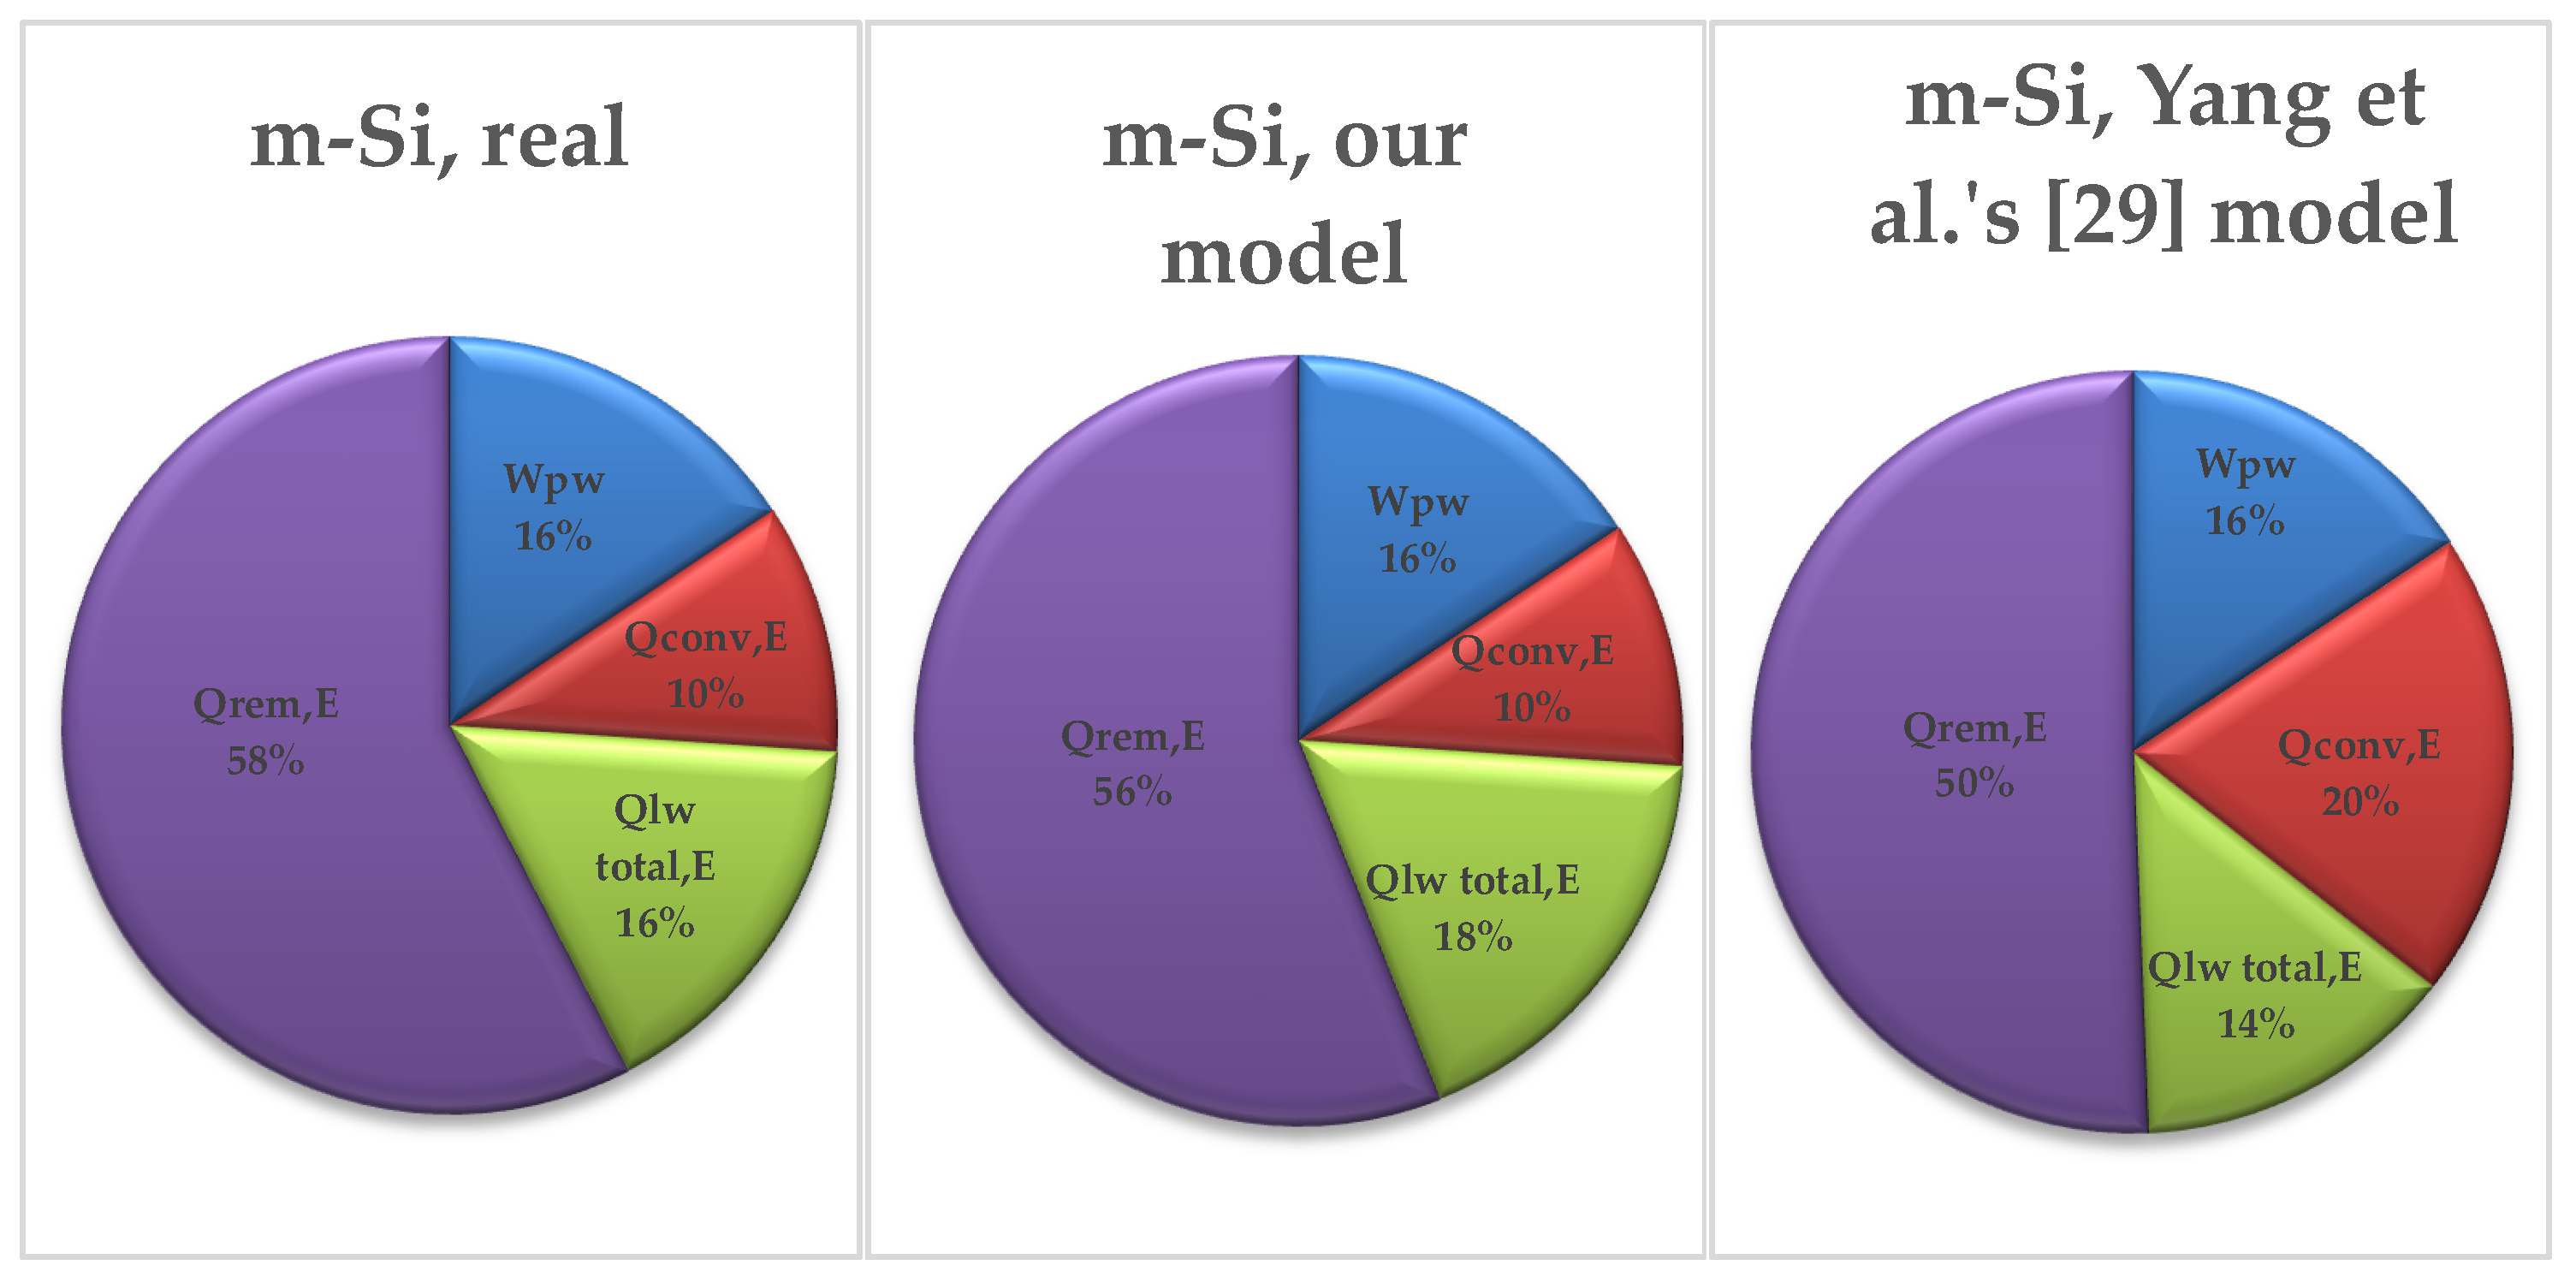
| Three day average, measured (%) | 58 | 16 | 10 | 16 | 62 | 16 | 9 | 13 | 62 | 21 | 10 | 7 |
| Three day average, our model solution (%) | 56 | 18 | 10 | 16 | 61 | 17 | 9 | 13 | 61 | 22 | 10 | 7 |
| Three day average, Yang et al.’ model solution (%) | 50 | 14 | 20 | 16 | 54 | 14 | 19 | 13 | 54 | 17 | 22 | 7 |
| Average deviation from our model calculation (%) | −2 | +2 | 0 | 0 | −1 | +1 | 0 | 0 | −1 | +1 | 0 | 0 |
| Average deviation from Yang et al.’s [29] model solution (%) | −8 | −2 | +10 | 0 | −8 | −2 | +10 | 0 | −8 | −4 | +12 | 0 |
© 2018 by the authors. Licensee MDPI, Basel, Switzerland. This article is an open access article distributed under the terms and conditions of the Creative Commons Attribution (CC BY) license (http://creativecommons.org/licenses/by/4.0/).
Share and Cite
Zsiborács, H.; Pintér, G.; Bai, A.; Popp, J.; Gabnai, Z.; Pályi, B.; Farkas, I.; Baranyai, N.H.; Gützer, C.; Trimmel, H.; et al. Comparison of Thermal Models for Ground-Mounted South-Facing Photovoltaic Technologies: A Practical Case Study. Energies 2018, 11, 1114. https://doi.org/10.3390/en11051114
Zsiborács H, Pintér G, Bai A, Popp J, Gabnai Z, Pályi B, Farkas I, Baranyai NH, Gützer C, Trimmel H, et al. Comparison of Thermal Models for Ground-Mounted South-Facing Photovoltaic Technologies: A Practical Case Study. Energies. 2018; 11(5):1114. https://doi.org/10.3390/en11051114
Chicago/Turabian StyleZsiborács, Henrik, Gábor Pintér, Attila Bai, József Popp, Zoltán Gabnai, Béla Pályi, István Farkas, Nóra Hegedűsné Baranyai, Christian Gützer, Heidelinde Trimmel, and et al. 2018. "Comparison of Thermal Models for Ground-Mounted South-Facing Photovoltaic Technologies: A Practical Case Study" Energies 11, no. 5: 1114. https://doi.org/10.3390/en11051114
APA StyleZsiborács, H., Pintér, G., Bai, A., Popp, J., Gabnai, Z., Pályi, B., Farkas, I., Baranyai, N. H., Gützer, C., Trimmel, H., Oswald, S., & Weihs, P. (2018). Comparison of Thermal Models for Ground-Mounted South-Facing Photovoltaic Technologies: A Practical Case Study. Energies, 11(5), 1114. https://doi.org/10.3390/en11051114