Sizing Hydrogen Energy Storage in Consideration of Demand Response in Highly Renewable Generation Power Systems


Abstract
:1. Introduction
2. Methodology
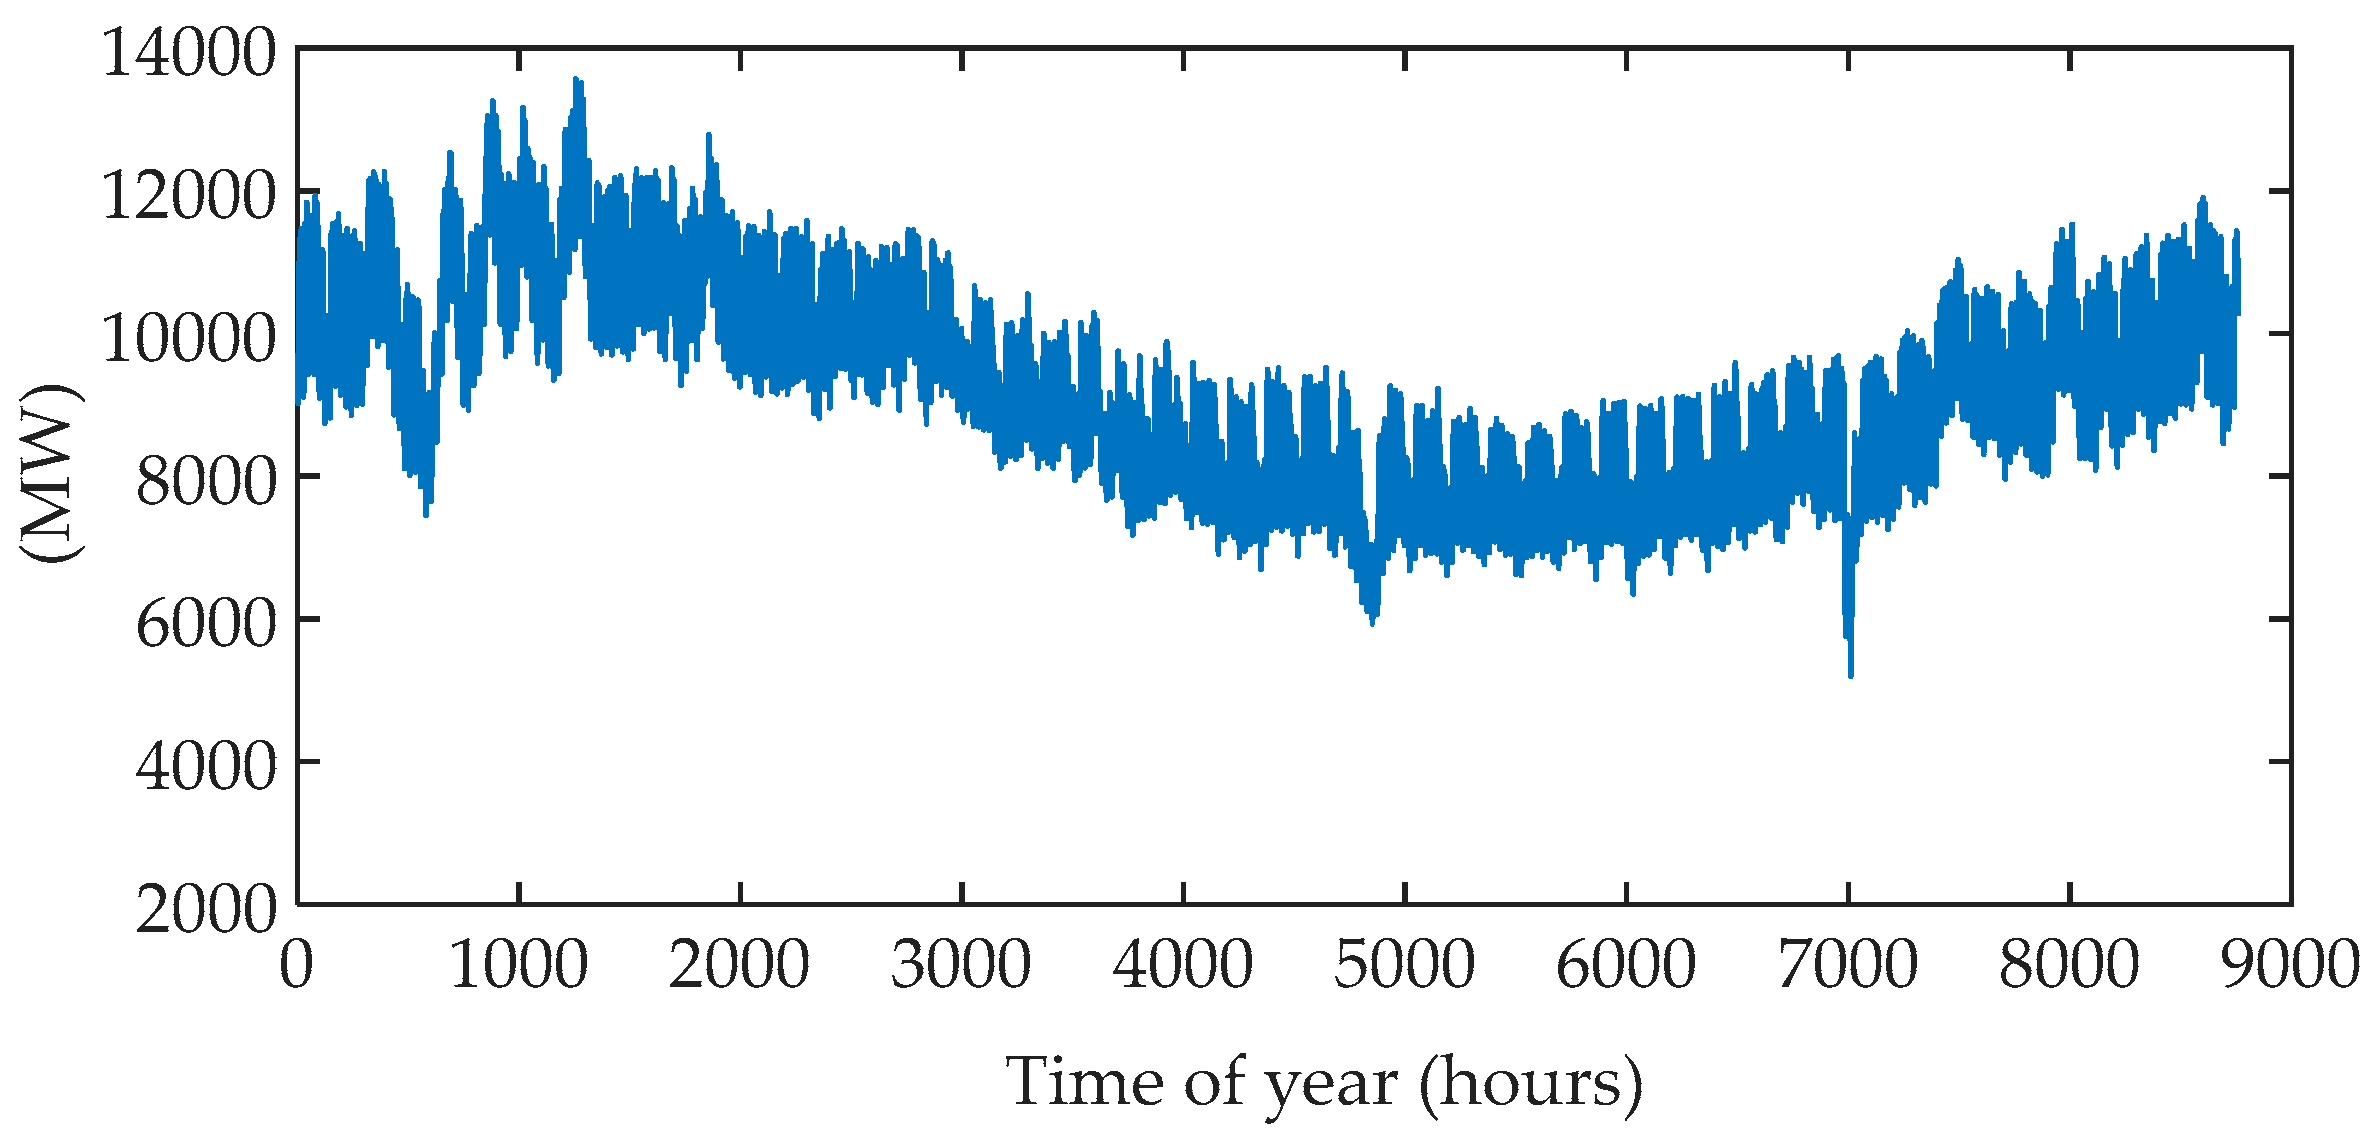
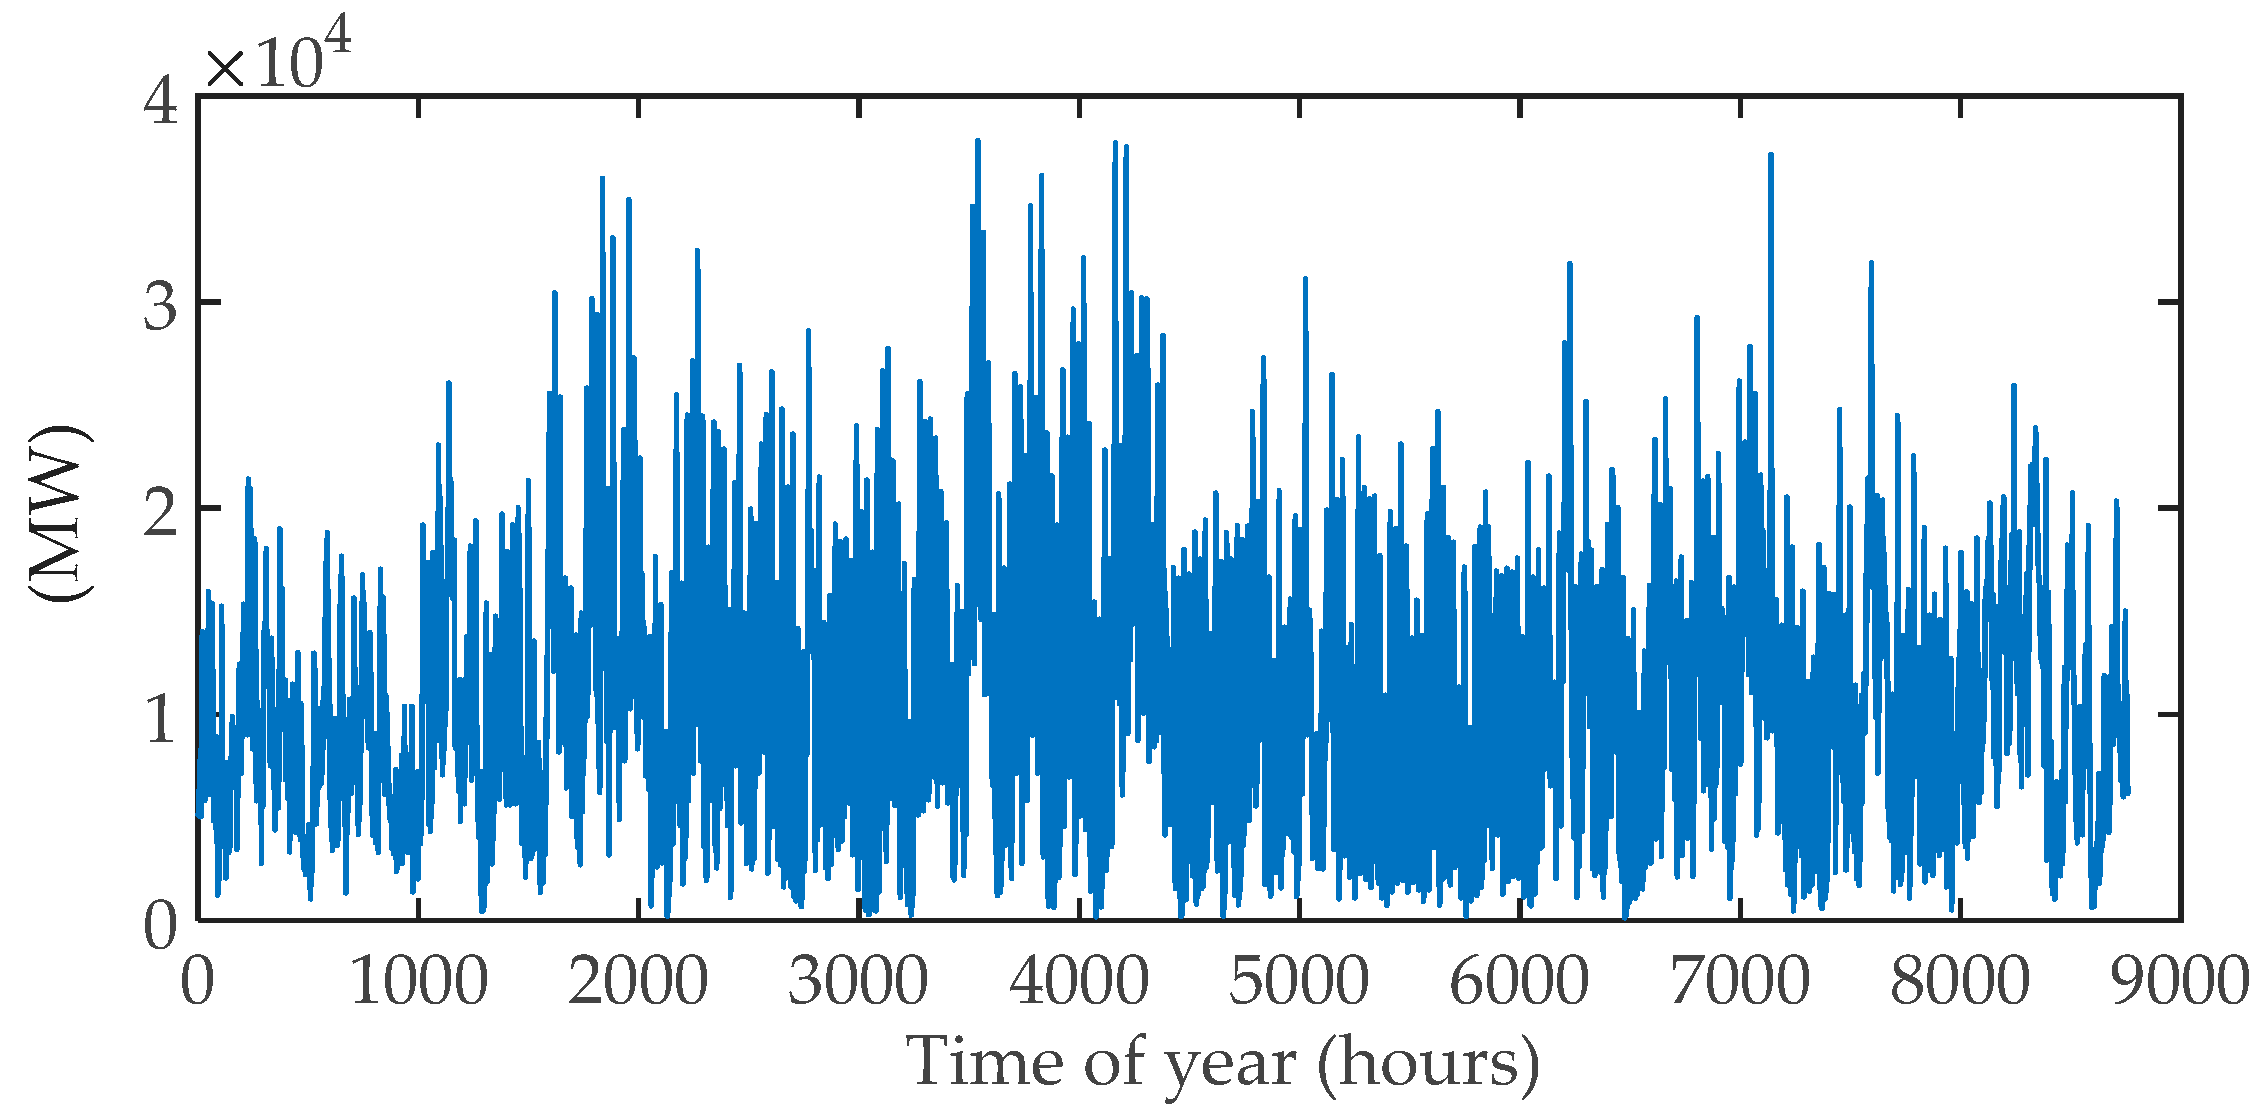
2.1. Renewable Generation Modelling
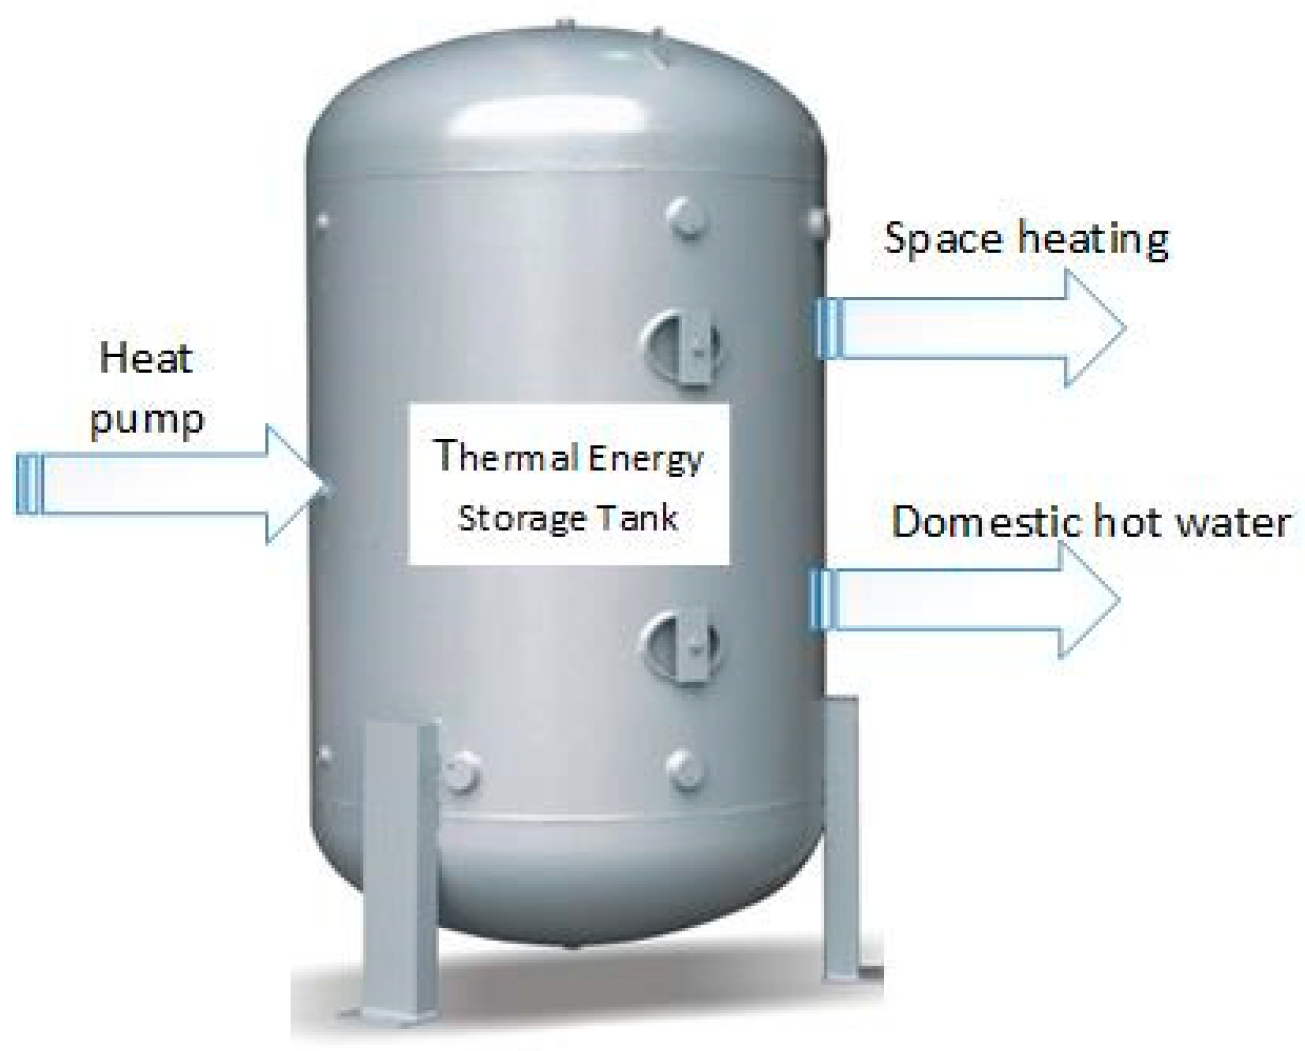
2.2. Electric Storage Space Heating System
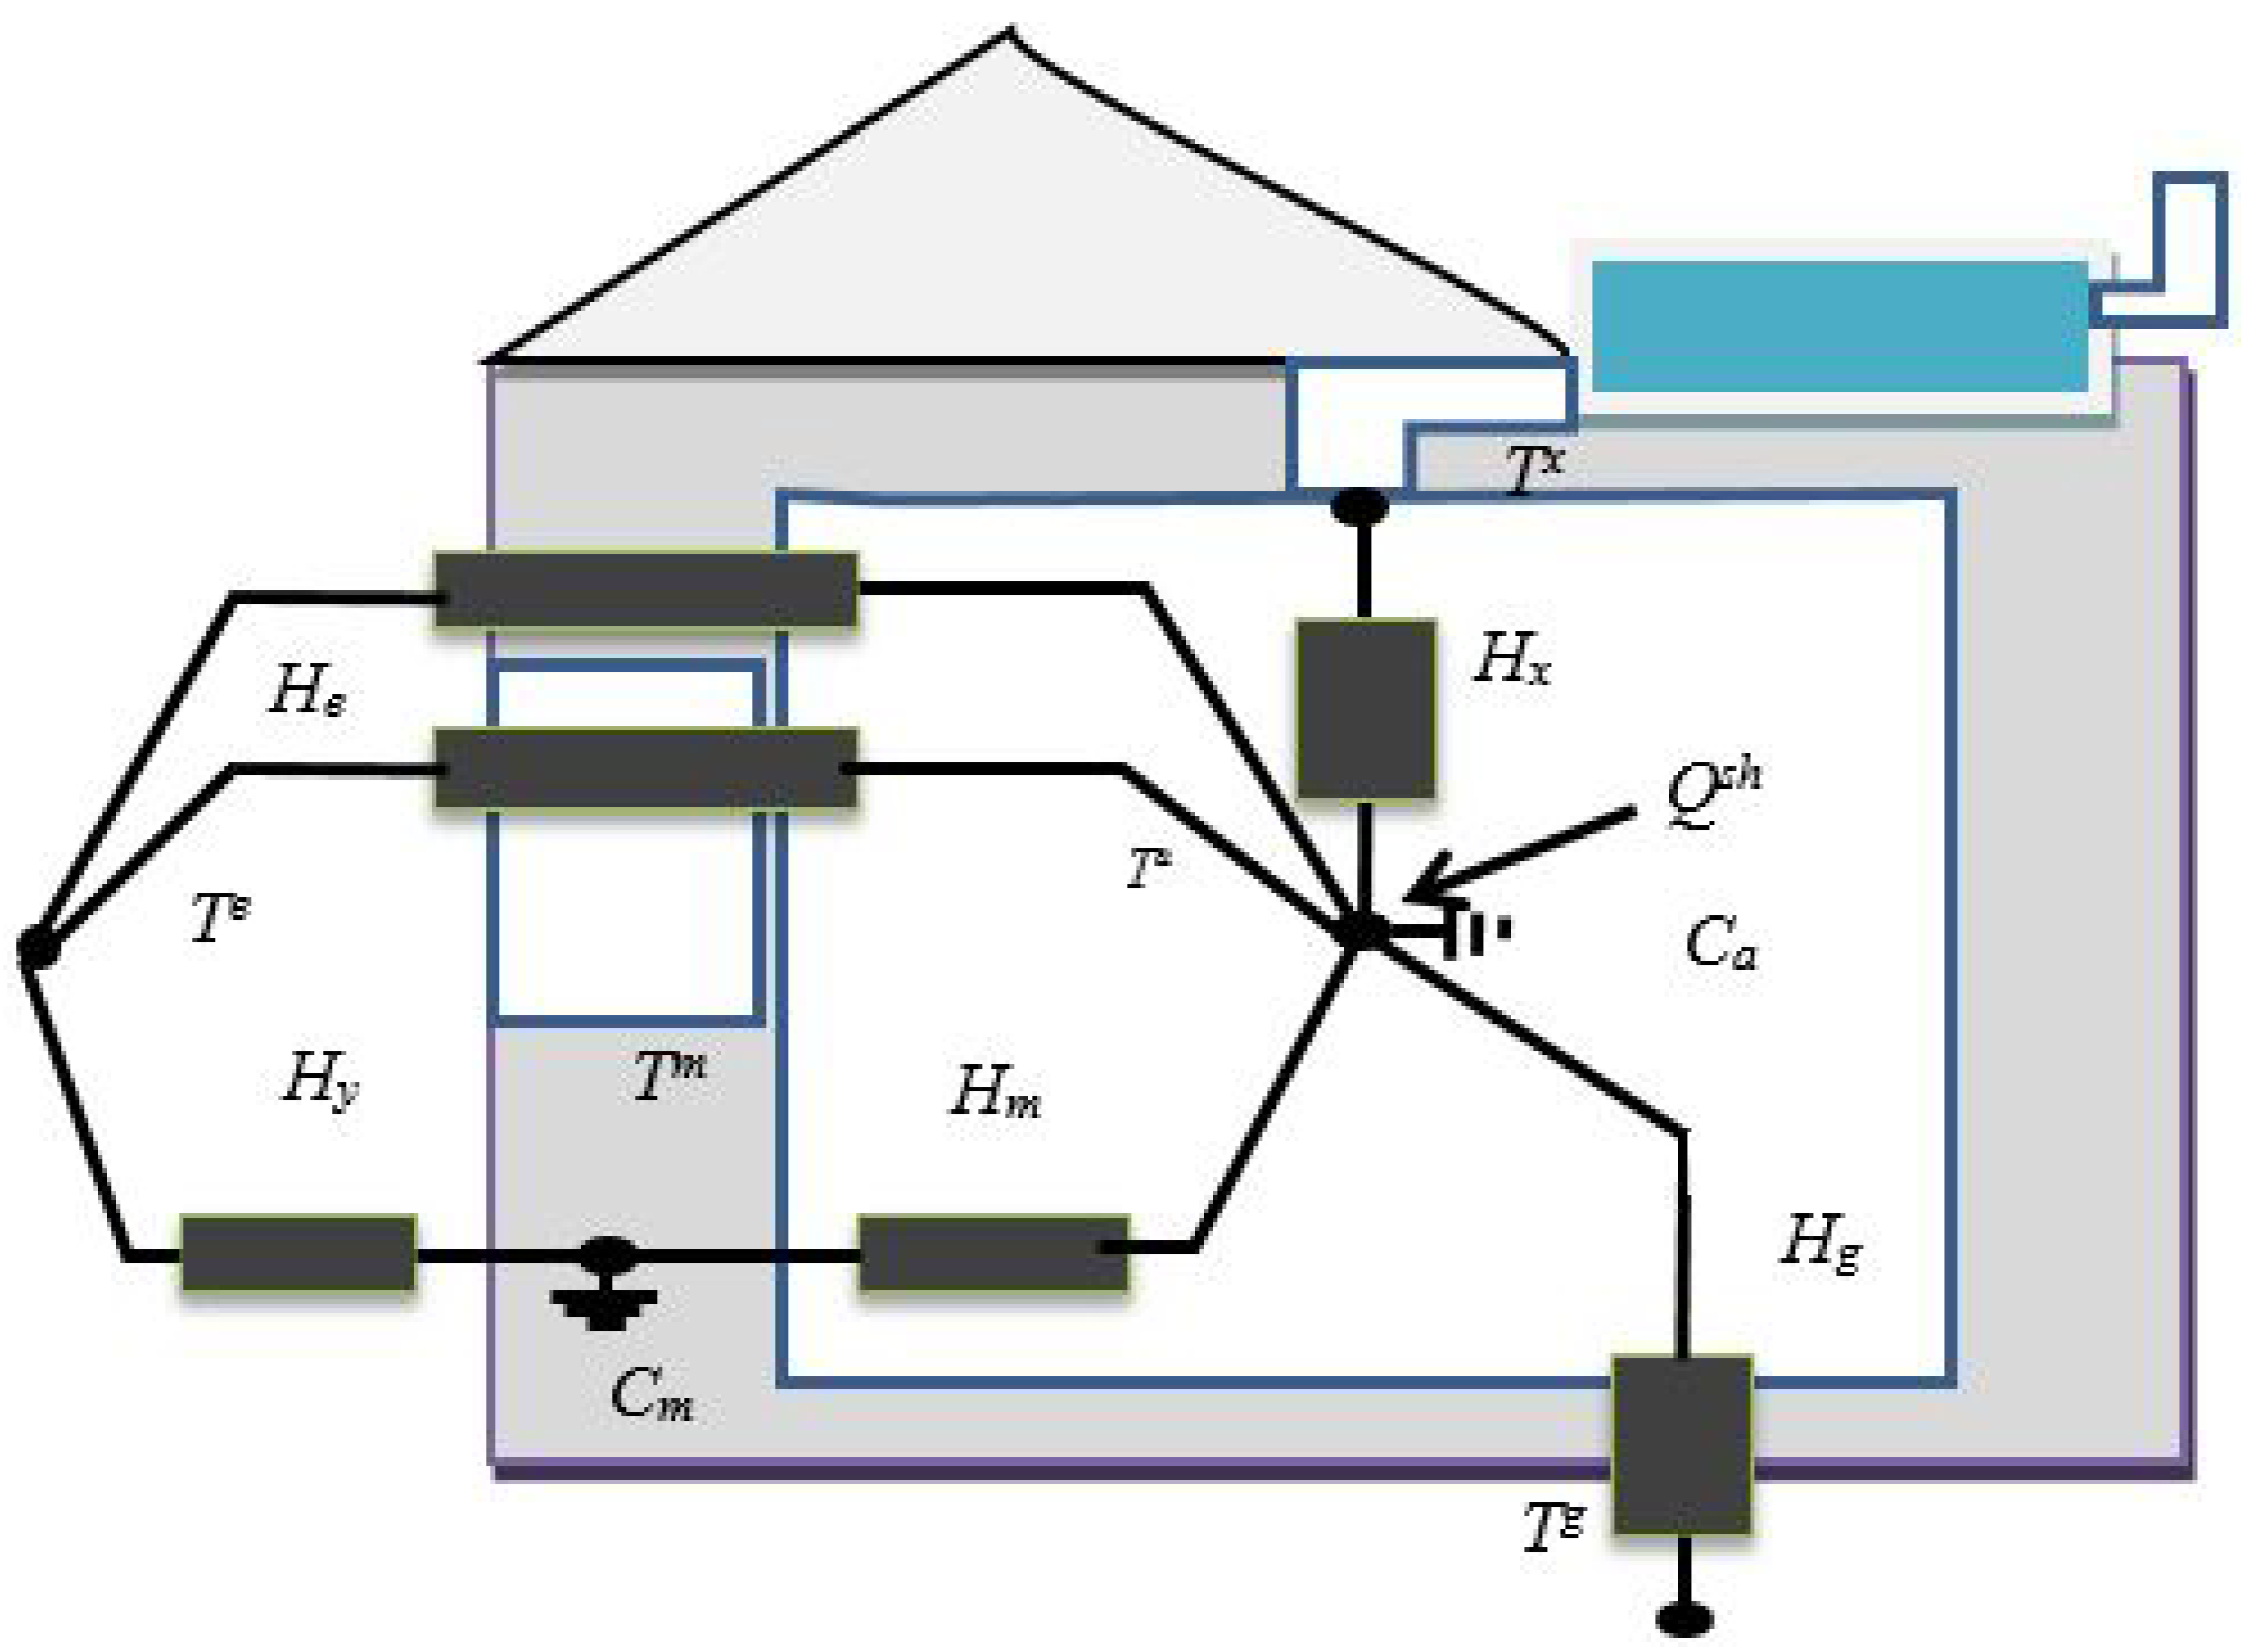
Space Heating Estimation
3. Sizing Energy Storage to Firm up Intermittent Renewable Generation
4. Case Studies and Results
4.1. Input Data
- Case 1
- This represents a base case, in which hydrogen energy storage capacity is optimized to accommodate renewable generation without coordinating with demand response.
- Case 2
- This represents a case of hydrogen energy storage sizing in the presence of demand response through domestic thermal storages. Demand response enrollment was considered to be 100%.
- Case 3
- This represents a case of hydrogen energy storage sizing in the presence of 25% of base-load generation in the system.
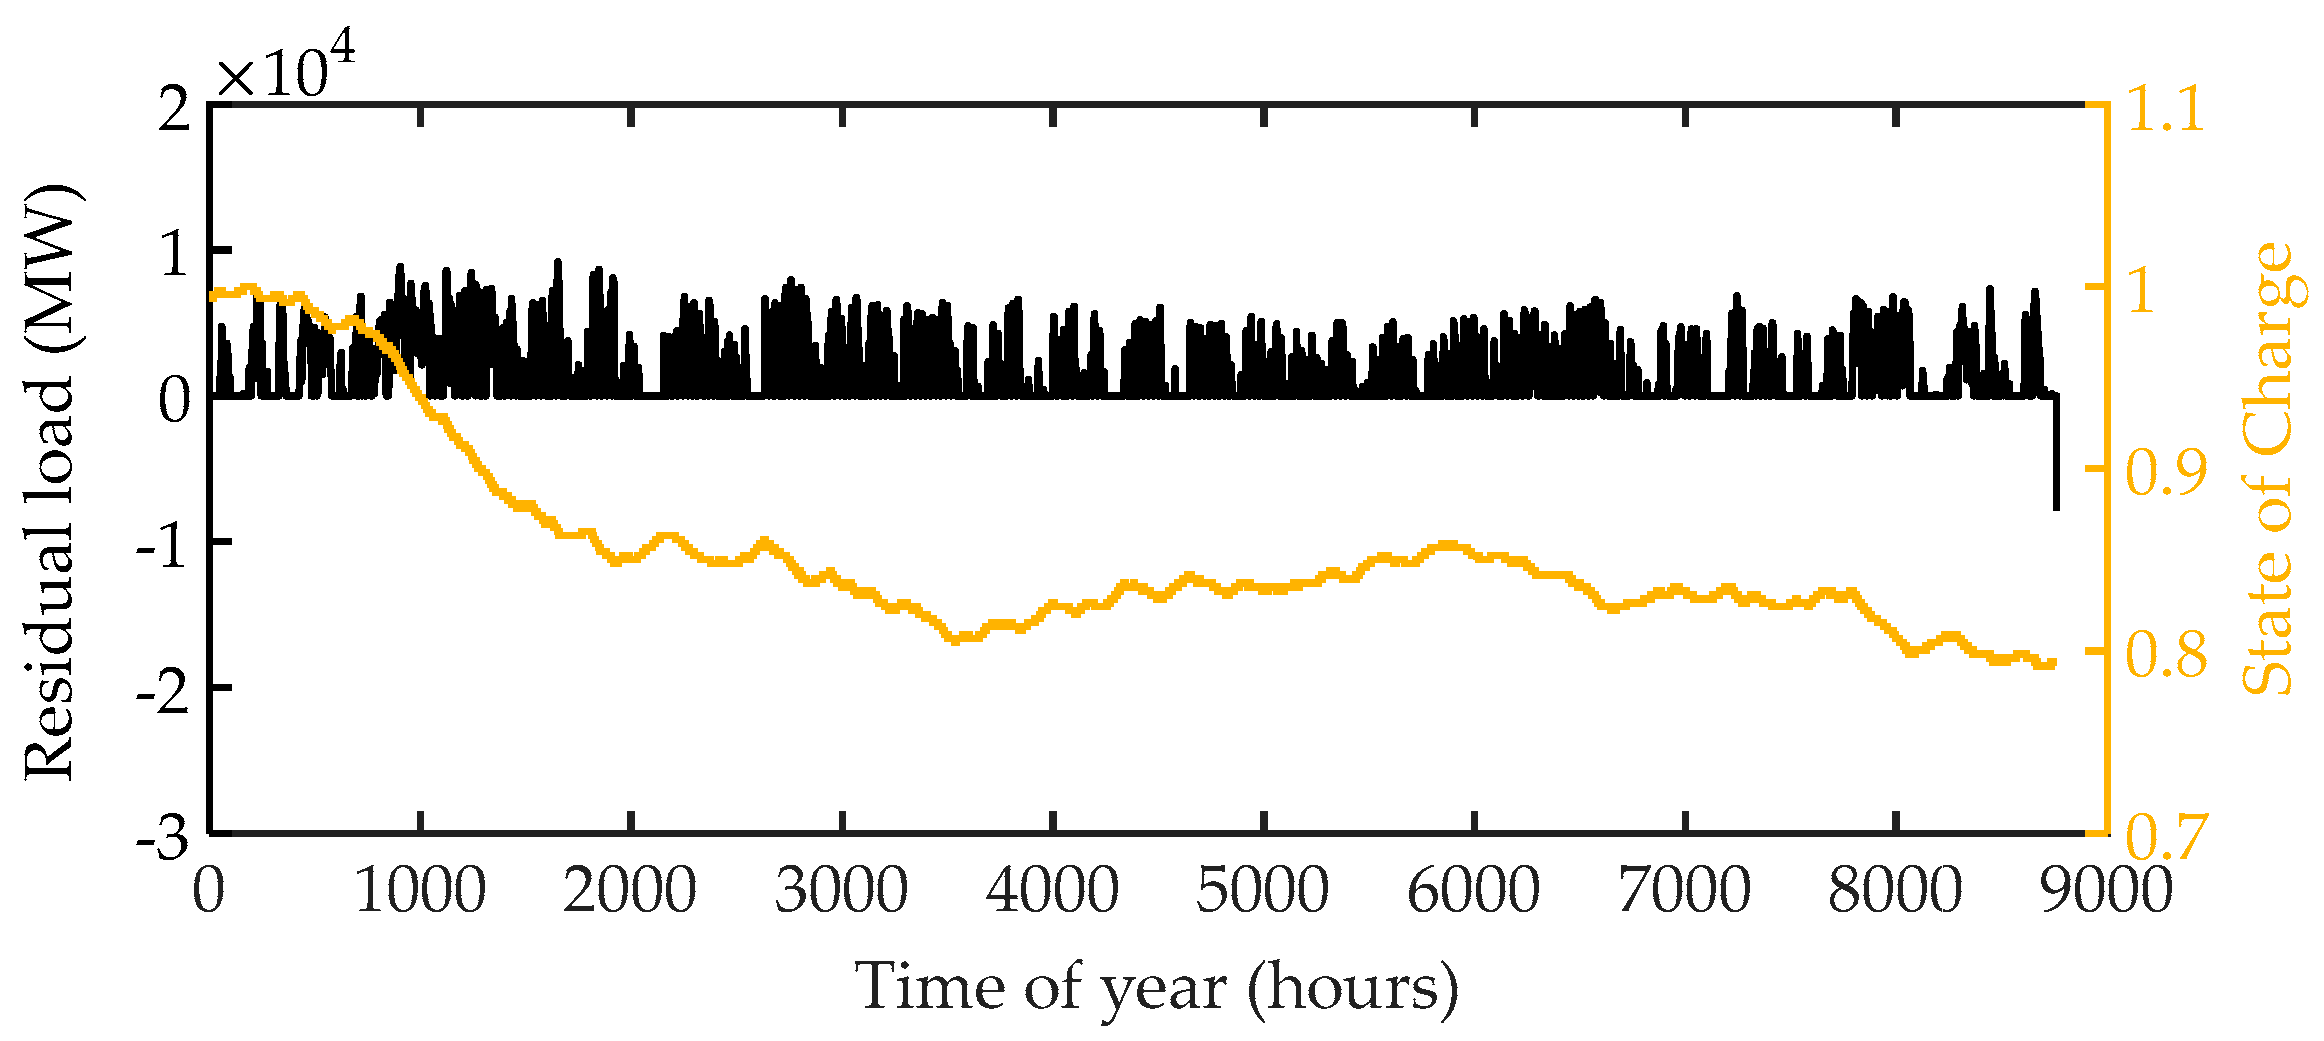
4.2. Simulation Results
Sensitivity Analyses
5. Conclusions
Author Contributions
Acknowledgments
Conflicts of Interest
Nomenclature
| Indices and Sets | |
| n, N | Index and set of customers |
| t, T | Index and set of time e.g., hours |
| Parameters and Constants | |
| Ca | Heat capacity of the indoor air (MJ/°C) |
| Cm | Heat capacity of the building fabric (MJ/°C) |
| He | Summation of the infiltration heat capacity flow and house’s window heat conductance (W/°C) |
| Hg | Floor heat conductance (W/°C) |
| Hm | Thermal conductance which allows Cm to be lumped in the mass node point (W/°C) |
| Hx | Ventilation air heat conductance (W/°C) |
| Hy | Heat conductance in the solid walls and convection of surface (W/°C) |
| Power rating of thermal storage (kW) | |
| Power of all critical appliances at time t of customer n (kW) | |
| Domestic hot water consumption of customer n at time t | |
| Maximum allowable state of charge of thermal storage (of customer n) | |
| Minimum allowable state of charge of thermal storage (of customer n) | |
| Temperature of dwelling at time t (of customer n) (°C) | |
| Outside temperature at time t (°C) | |
| Ground temperature at time t (°C) | |
| Ventilation supply air temperature (°C) | |
| Renewable generation at time t (kW) | |
| Conventional generation at time t (kW) | |
| Duration of time slot (hours) | |
| Charging/Discharging efficiency of hydrogen energy storage | |
| Demand limit (kW) | |
| Internal temperature dead-band (of customer n) (°C) | |
| Maximum thermal energy storage capacity (kWH) | |
| Space heating load at time t | |
| Domestic heating load at time t | |
| Thermal energy storage heat loss rate | |
| Thermal energy storage heat loss coeff. | |
| Functions and Variables | |
| Critical demand at time t (kW) | |
| Heating demand at time t (kW) | |
| Total demand at time t (kW) | |
| Electrical power supplied to storage space heating unit at time t (of customer n) (kW) | |
| HVAC thermal output power at time t (of customer n) (kW) | |
| State of charge of Energy storage at time t | |
| Indoor ambient temperature of dwelling at time t (of customer n) (°C) | |
| Thermal mass temperature at time t (°C) | |
| Thermal Storage losses at time t (of customer n) (kWh) | |
| Variable to regulate renewable generation | |
| Charging rate of thermal energy storage | |
| Power of energy storage at time t | |
| Charge level of thermal energy storage at time t | |
| Maximum power capacity of hydrogen energy storage | |
| Maximum energy capacity of hydrogen energy storage | |
References
- IEA PVPS. Available online: http://www.iea-pvps.org/fileadmin/dam/public/report/statistics/IEA-PVPS_-_A_Snapshot_of_Global_PV_-_1992-2016__1_.pdf (accessed on 1 July 2017).
- WindEurope. Available online: https://windeurope.org/about-wind/statistics/european/wind-in-power-2016/ (accessed on 10 March 2017).
- NREL. Available online: https://www.nrel.gov/docs/fy14osti/61721.pdf (accessed on 1 July 2017).
- Bird, L.; Lew, D.; Milligan, M.; Carlini, E.M.; Estanqueiro, A.; Flynn, D.; Gomez-Lazaro, E.; Holttinen, H.; Menemenlis, N.; Orths, A.; et al. Wind and solar energy curtailment: A review of international experience. Renew. Sustain. Energy Rev. 2016, 65, 577–586. [Google Scholar] [CrossRef]
- Burke, D.J.; O’Malley, M.J. Factors Influencing Wind Energy Curtailment. IEEE Trans. Sustain. Energy 2011, 2, 185–193. [Google Scholar] [CrossRef]
- Alnaser, S.W.; Ochoa, L.F. Optimal Sizing and Control of Energy Storage in Wind Power-Rich Distribution Networks. IEEE Trans. Power Syst. 2016, 31, 2004–2013. [Google Scholar] [CrossRef]
- Ke, X.; Lu, N.; Jin, C. Control and size energy storage systems for managing energy imbalance of variable generation resources. IEEE Trans. Sustain. Energy 2015, 6, 70–78. [Google Scholar] [CrossRef]
- Cleary, B.; Duffy, A.; OConnor, A.; Conlon, M.; Fthenakis, V. Assessing the economic benefits of compressed air energy storage for mitigating wind curtailment. IEEE Trans. Sustain. Energy 2015, 6, 1021–1028. [Google Scholar] [CrossRef]
- Makarov, Y.V.; Du, P.; Kintner-Meyer, M.C.W.; Jin, C.; Illian, H.F. Sizing Energy Storage to Accommodate High Penetration of Variable Energy Resources. IEEE Trans. Sustain. Energy 2012, 3, 34–40. [Google Scholar] [CrossRef]
- Fazeli, R.; Davidsdottir, B.; Hallgrimsson, J.H. Residential energy demand for space heating in the Nordic countries: Accounting for interfuel substitution. Renew. Sustain. Energy Rev. 2016, 57, 1210–1226. [Google Scholar] [CrossRef]
- Ali, M.; Ekström, J.; Alahäivälä, A.; Lehtonen, M. Assessing the Upward Demand Response Potential for Mitigating the Wind Generation Curtailment: A Case Study. In Proceedings of the 14th International Conference on the European Energy Market, Dresden, Germany, 6–9 June 2017. [Google Scholar]
- Ali, M.; Ekström, J.; Lehtonen, M. Assessing the Potential Benefits and Limits of Electric Storage Heaters for Wind Curtailment Mitigation: A Finnish Case Study. Sustainability 2017, 9, 836. [Google Scholar]
- Ali, M.; Humayun, M.; Safdarian, A.; Degefa, M.; Lehtonen, M. A Framework for activating residential HVAC demand response for wind generation balancing. In Proceedings of the IEEE PES Innovative Smart Grid Technologies Conference Asia, Bangkok, Thailand, 4–6 November 2015. [Google Scholar]
- Lund, H.; Kempton, W. Integration of renewable energy into the transport and electricity sectors through V2G. Energy Policy 2008, 36, 3578–3587. [Google Scholar] [CrossRef]
- Guille, C.; Gross, G. A conceptual framework for the vehicle-to-grid (V2G) implementation. Energy Policy 2009, 37, 4379–4390. [Google Scholar] [CrossRef]
- Ali, M.; Safdarian, A.; Lehtonen, M. Demand Response Potential of HVAC Load Considering User Preferences. In Proceedings of the ISGT Europe, Istanbul, Turkey, 12–15 October 2014; pp. 1–6. [Google Scholar]
- Ekström, J.; Koivisto, M.; Mellin, I.; Millar, J.; Saarijärvi, E.; Haarla, L. Assessment of Large Scale Wind Power Generation with New Generation Locations without Measurement Data. Renew. Energy 2015, 83, 362–374. [Google Scholar] [CrossRef]
- Ekström, J.; Koivisto, M.; Millar, J.; Mellin, I.; Lehtonen, M. A Statistical Approach for Hourly Photovoltaic Power Generation Modeling with Generation Locations without Measured Data. Sol. Energy 2016, 132, 173–187. [Google Scholar] [CrossRef]
- Ekström, J.; Koivisto, M.; Mellin, I.; Millar, J.; Lehtonen, M. A Statistical Model for Hourly Large-Scale Wind and Photovoltaic Generation in New Locations. IEEE Trans. Sustain. Energy 2017, 8, 1383–1393. [Google Scholar] [CrossRef]


| Energy Storage Size | |||
|---|---|---|---|
| Mean | Standard Deviation | Lower 95% Confidence Interval | Upper 95% Confidence Interval |
| 73.9 TWh | 3.6 TWh | 73.1 TWh | 74.6 TWh |
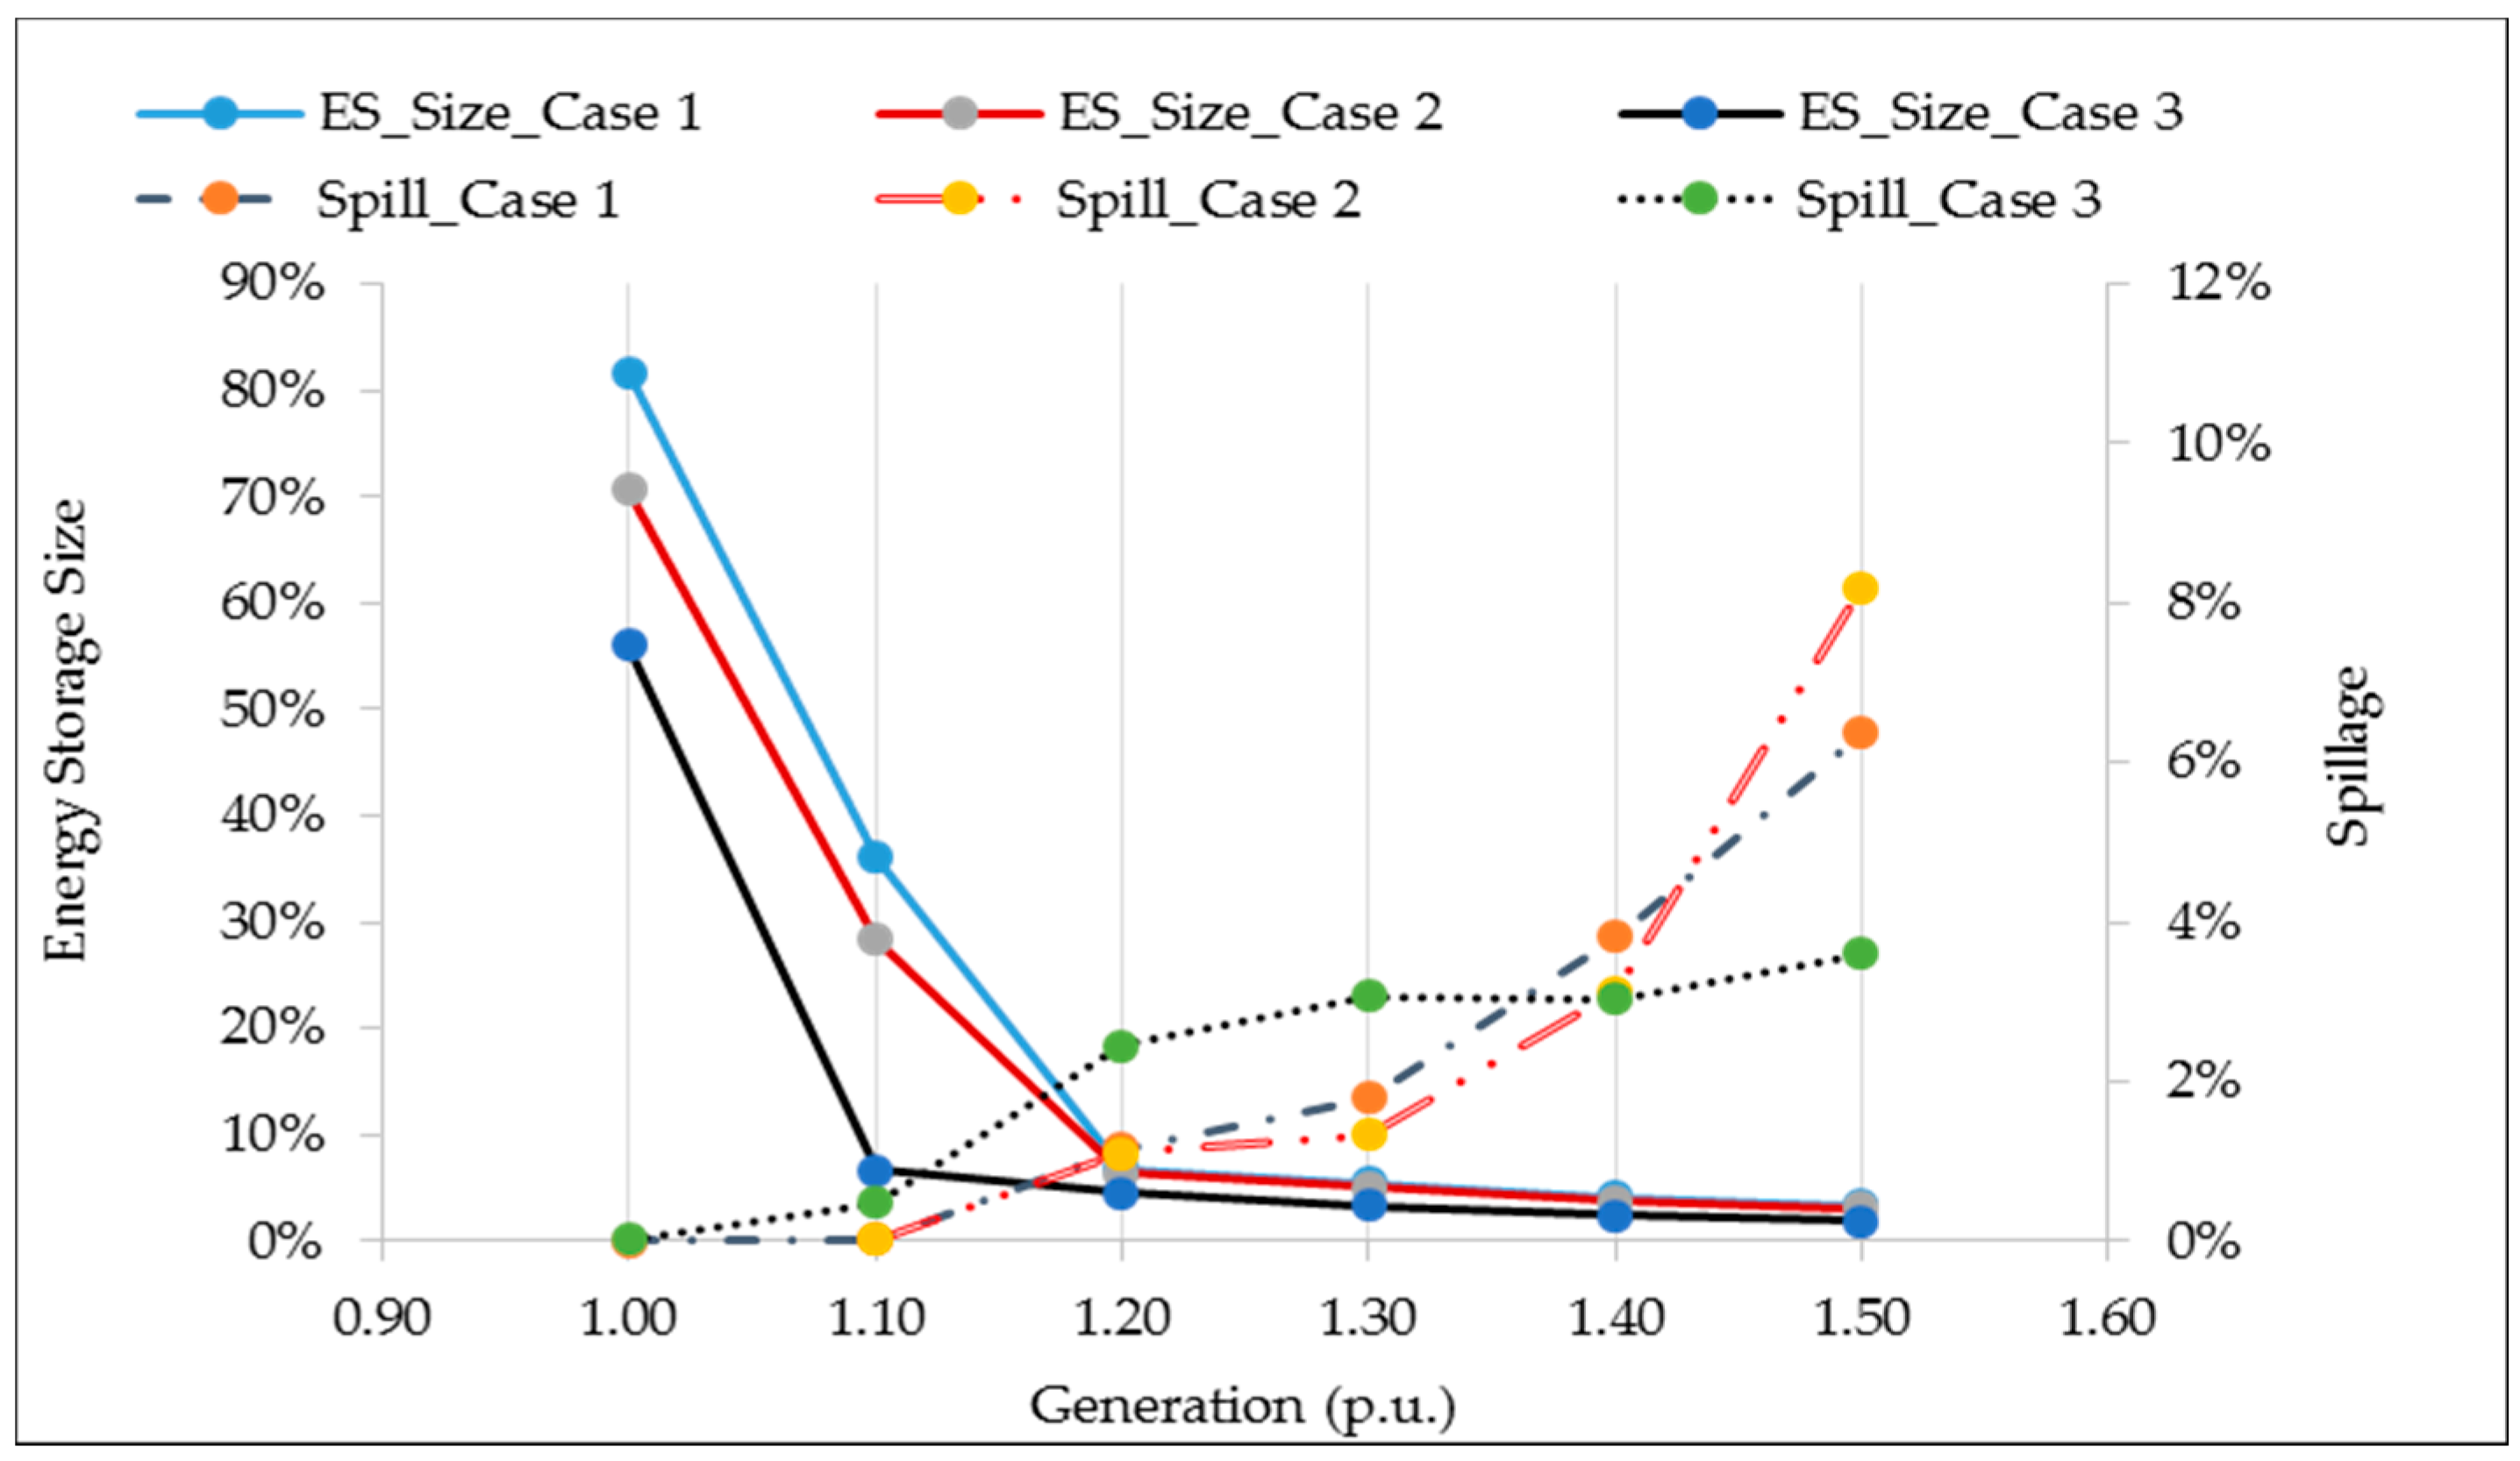
| Generation (p.u) | Hydrogen Storage Size (%) | Spillage (%) | ||||
|---|---|---|---|---|---|---|
| Case 1 | Case 2 | Case 3 | Case 1 | Case 2 | Case 3 | |
| 1 | 82% | 71% | 56% | 0% | 0% | 0% |
| 1.1 | 36% | 28% | 7% | 0% | 0% | 0% |
| 1.2 | 7% | 6% | 5% | 1% | 1% | 2% |
| 1.3 | 5% | 5% | 3% | 1.8% | 1.3% | 3% |
| 1.4 | 4.1% | 4% | 2% | 3.8% | 3.1% | 3% |
| 1.5 | 3.3% | 3.0% | 2% | 6.4% | 8.2% | 4% |
© 2018 by the authors. Licensee MDPI, Basel, Switzerland. This article is an open access article distributed under the terms and conditions of the Creative Commons Attribution (CC BY) license (http://creativecommons.org/licenses/by/4.0/).
Share and Cite
Ali, M.; Ekström, J.; Lehtonen, M. Sizing Hydrogen Energy Storage in Consideration of Demand Response in Highly Renewable Generation Power Systems. Energies 2018, 11, 1113. https://doi.org/10.3390/en11051113
Ali M, Ekström J, Lehtonen M. Sizing Hydrogen Energy Storage in Consideration of Demand Response in Highly Renewable Generation Power Systems. Energies. 2018; 11(5):1113. https://doi.org/10.3390/en11051113
Chicago/Turabian StyleAli, Mubbashir, Jussi Ekström, and Matti Lehtonen. 2018. "Sizing Hydrogen Energy Storage in Consideration of Demand Response in Highly Renewable Generation Power Systems" Energies 11, no. 5: 1113. https://doi.org/10.3390/en11051113
APA StyleAli, M., Ekström, J., & Lehtonen, M. (2018). Sizing Hydrogen Energy Storage in Consideration of Demand Response in Highly Renewable Generation Power Systems. Energies, 11(5), 1113. https://doi.org/10.3390/en11051113