Article

Fundamental Material Properties of the 2LiBH4-MgH2 Reactive Hydride Composite for Hydrogen Storage: (I) Thermodynamic and Heat Transfer Properties

1
Institute of Materials Research, Helmholtz-Zentrum Geesthacht, Max-Planck-Strasse 1, 21502 Geesthacht, Germany
2
Pavia H2 Lab, Department of Chemistry, Physical Chemistry Division, University of Pavia, Viale Taramelli 16, 27100 Pavia, Italy
3
Department of Physicochemistry of Materials, Consejo Nacional de Investigaciones Científicas y Técnicas (CONICET), Centro Atómico Bariloche, Av. Bustillo km 9500, R8402AGP S.C. de Bariloche, Argentina
4
Dipartimento dell’Innovazione Industriale e Digitale (DIID)—Ingegneria Chimica Gestionale Informatica Meccanica, Università degli Studi di Palermo, Viale delle Scienze—Ed. 6, 90128 Palermo, Italy
5
Istituto per le Tecnologie Avanzate (ITA), SS. 113 174, 91100 Trapani, Italy
6
BASF SE, Carl Bosch Str 38, 67056 Ludwigshafen, Germany
7
Institute for Thermodynamics, Leibniz Universität Hannover, Callinstraße 36, 30167 Hannover, Germany
*
Author to whom correspondence should be addressed.
Energies 2018, 11(5), 1081; https://doi.org/10.3390/en11051081
Submission received: 20 March 2018 / Revised: 4 April 2018 / Accepted: 18 April 2018 / Published: 27 April 2018
(This article belongs to the Section D: Energy Storage and Application)

Abstract

:
Thermodynamic and heat transfer properties of the 2LiBH4-MgH2 composite (Li-RHC) system are experimentally determined and studied as a basis for the design and development of hydrogen storage tanks. Besides the determination and discussion of the properties, different measurement methods are applied and compared to each other. Regarding thermodynamics, reaction enthalpy and entropy are determined by pressure-concentration-isotherms and coupled manometric-calorimetric measurements. For thermal diffusivity calculation, the specific heat capacity is measured by high-pressure differential scanning calorimetry and the effective thermal conductivity is determined by the transient plane source technique and in situ thermocell. Based on the results obtained from the thermodynamics and the assessment of the heat transfer properties, the reaction mechanism of the Li-RHC and the issues related to the scale-up for larger hydrogen storage systems are discussed in detail.

1. Introduction

The global energy need drastically increased from 5 × 10¹² kWh per year in 1860 to 1.6 × 10¹⁴ kWh per year today, that is, almost by two orders of magnitude. A fraction bigger than 80% of the energy originates from fossil fuels, such as oil, coal and gas [1,2]. The known reserves of these fuels are depleting, the concentration of greenhouse gases and of air pollutants is increasing due to their combustion, therefore a new energy concept, based on renewable sources and carriers is necessary.
Hydrogen (H2) could represent a very promising energy carrier in a holistic clean energy scenario, not only for mobile applications, but also for stationary ones [3,4]. Hydrogen storage methods generally used, such as compressed gas or liquefied hydrogen, cannot meet the target requirements set for the future use [5]. Storage in the solid state, such as by means of metal hydrides, has great potential in comparison to other storage methods [6]. Gravimetric and volumetric capacities, in addition to fast kinetic behaviour, are still some of the main issues for on-board hydrogen storage.
Due to some of the properties of magnesium hydride (MgH2), such as abundance, low cost and a hydrogen storage capacity of 7.6 wt %, it has been considered as one of the most attractive materials for H2 storage, although its high thermodynamic stability precludes its practical application [7,8]. A strategy to decrease the enthalpy is the combination of MgH2 with light-metal complex hydrides. This is the Reactive Hydride Composite (RHC) approach [9]. Lithium borohydride (LiBH4) is one of the complex hydrides with the highest theoretical gravimetric hydrogen density (18.5 wt %), which makes it very appealing [10]. The combination of LiBH4 together with MgH2 in a specific molar ratio (2:1) to form Li-RHC, the reaction enthalpy can be theoretically decreased to 46 kJ mol−1 H2 following Equation (1) and according to the theoretic values of the enthalpies of formation of the corresponding components [11,12]:
2 LiBH4 + MgH2 ⇆ 2 LiH + MgB2 + 4 H2
This Li-RHC system has several advantages such as its reduced thermodynamic stability, a high gravimetric hydrogen capacity amounting to 11.54 wt % (theoretical value, based on the absorbed state) and considerable potential for further cost reduction in a hydrogen storage system construction [13]. Nevertheless, regarding in the possibility to use it in larger storage tanks, the evaluation of the thermodynamic and kinetic behaviours, as well as heat transfer properties for larger quantities of Li-RHC is still lacking. Additional information about the heat transfer properties is also necessary, since the thermal management of larger amounts of metal hydride in a hydrogen storage reservoir is a key issue for a practical application (e.g., [14,15]).
This is the first study in a two-part investigation, which provides useful parameters necessary for the development of a solid-state hydrogen storage tank based on a comprehensive analysis on the technical and economic evaluation of the system [16]. This first study covers the thermodynamic and heat transfer properties, while the second study is focused on the kinetic properties.

2. Experimental Details

2.1. Sample Preparation

The elements presented in the right side of Equation (1), which represent the desorbed state of the composite, were chosen as starting materials, adding 0.05 mol of titanium trichloride (TiCl3) for enhancing the kinetics. Lithium hydride powder (LiH; ≥99.4% purity) and magnesium boride powder (MgB2, ~99.4% purity) were acquired from Alfa Aesar (Tewksbury, MA, USA) and TiCl3 powder (≥99.995% purity) from Sigma Aldrich (St. Louis, MO, USA). The materials were mixed and milled in stainless steel vials with a planetary ball mill (Pulverisette 5, Fritsch, Idar-Oberstein, Germany) for 20 h at 230 rpm with a ball to powder ratio of 10:1. All handling and milling was carried out in a glove box, under a continuously purified (~10 ppm of O2 and H2O) argon (Ar) gas atmosphere.

2.2. Experimental Methods

2.2.1. Thermodynamic and Kinetic Studies

The H2 absorption and desorption reaction rates and the hydrogen capacity were measured using a Sieverts apparatus from the now defunct company HERA (Longueil, QC, Canada) based on the differential pressure technique. A manometric instrument (PCTPro, Setaram, Caluire, France), which applies the absolute pressure technique was also used, in particular for the Pressure Concentration Isotherms (PCI) measurements. The hydrogen gas used for the experiments had a purity of 99.999% (5.0). The temperature and pressure conditions are provided in the text for each different experiment. The mass of sample for all measurements was about 150 mg.
The measurement of the PCI curves follows the van’t Hoff Equation [17]:
ln ( p e q p 0 ) = Δ H R R T + Δ S R
where R represents the gas constant, p0 and peq are, respectively, the standard pressure (~1 bar) and the equilibrium pressure. This last value is a function only of the temperature T and the thermodynamic properties (at least for a certain temperature): the reaction enthalpy ΔHR and the entropy ΔS. For each PCI measurement, the temperature was set constant at a certain desired value, which allows fast enough kinetics and the pressure was decreased stepwise (in the case when a desorption PCI was being measured). In this way, for each pressure step a kinetic measurement was carried out. Pressure steps, in which the transformed fraction changes considerably, identify reaction plateaus. The transformed fraction is considered as the ratio between the hydrogen desorbed (or absorbed) and the maximum amount of hydrogen that the material can desorb (or absorb). These PCI were repeated at several different temperatures. In the van’t Hoff plot that can be derived from the experiments, the natural logarithms of the plateau pressure values are plotted against 1000/T. Thus, the values of the enthalpy and entropy can be derived, respectively, from the slope (∆HR/R) and the intercept (∆S/R) of the segment fitting the data with a linear correlation. The corresponding equilibrium pressures for the calculation are taken as the mean of the experimental points in the plateau region, considering the error propagation theory to assign an error bar to each calculated value. The volume of the reservoir used in the measuring apparatus was 12.28 mL and the pressure steps 1 bar of H2. The starting pressure for the desorption measurements was set to 40 bar and the final one was 1 bar of H2. The maximum time allowed for each pressure value to reach equilibrium was set to 48 h. All these isotherm measurements were carried out with 250 mg of sample.
Coupled manometric-calorimetric experiments, carried out by connecting a PCTPro apparatus with a Sensys high-pressure Differential Scanning Calorimeter (HP-DSC, Setaram, Caluire, France) were an innovative way of characterizing the samples. The mass of the samples was about 30 mg. In each event that involves a change in energy, this change is calculated by measuring the area under the exothermal or endothermal peak of the heat flow curve plotted vs. time. Due to the two instruments being coupled, this energy can be related to the amount of hydrogen involved in the event and expressed as enthalpy per mole of hydrogen. In the desorption tests the samples underwent a temperature ramp from ambient temperature to 550 °C at different heating rates between 0.5 and 5 °C min−1 under 3 bar of H2 pressure, while in the absorption tests the heating rates were between 0.5 and 2 °C min−1 under 50 bar.

2.2.2. Heat Capacity Measurements

A DSC-1 Differential Scanning Calorimeter from Mettler Toledo (Greifensee, Switzerland), was used to determine heat flows during physical or chemical events when the samples were subjected to a temperature ramp at ambient pressure. The maximum temperature was 250 °C. The samples were loaded inside 40 µL aluminium pans and sealed with a suitable press. The sample charging and sealing procedures were carried out inside the glove box under Ar atmosphere with oxygen and moisture contents below 1 ppm. The amount of material was 16.5 mg. Previously, the DSC cell has been kept inside an oven at 500 °C for 15 min, to remove any possible volatile impurity. This preliminary procedure also guaranteed that the sensors and the rest of the equipment could reach a good thermal contact by expanding, enhancing the accuracy of the heat capacity experiments [18]. A low of compressed air was applied to eliminate any ash or dust carefully from the oven. Preciseness in the heat capacity values was improved by subtracting a baseline curve from the DSC signal. The first two baseline curves were treated as cell-conditioning runs. Finally, only the third baseline curve was considered.

2.2.3. Thermal Conductivity Measurements

Thermal conductivity tests were completed on powder samples in both absorbed (LiBH4/MgH2) and desorbed (LiH/MgB2) states using the modified transient plane source method [19,20] by means of a Thermal Conductivity Analyzer (TCi, from C-Therm, Fredericton, NB, Canada). Due to the reactivity of the studied hydrogen storage material with environmental contaminants (e.g., O2 and H2O), the thermal conductivity measurements were performed in an Ar filled glove box (Ar pressure 1.012 bar). The thermal conductivity sensor has a round, flat shape and its active area has a diameter of 16 mm. It is placed inside a glove box and it is connected to its electronics through a suitable flange; in this way, the control box and the computer are kept outside the argon atmosphere. The measurements were carried out with 1.0 g of powder, which was positioned on the sensor covering all its effective area. A metallic ring was used to keep the sample in place and avoid it spilling outside of the measuring zone. A calibrated weight of 500 g was used to reach uniform pressure conditions across the samples and the resulting set up was enfolded with a 2.5 cm wide and 10 cm high metallic heating band (National Plastic Heater, Schomberg, ON, Canada). The band was connected to a heat controller outside and used to bring the sample to the selected operating temperature. Care had to be taken to avoid that the powder samples could get in contact with the heating band to avoid false signals, due to the operating principle of the machine. The experiments were executed from ambient temperature to 180 °C, which is the highest operational temperature for the sensor. The actual temperature of the samples was measured by the thermal conductivity machine itself and directly monitored by the control software of the apparatus. At each temperature, which was set for a measurement, the samples were let stabilize for approximately 45 min, so that a steady temperature value could be reached. A set of 10 repetitions for each temperature was recorded (about 2 min were required for each repetition); the resulting mean value is provided further in the text. The relative standard deviation varies in a range between 0.4% and 0.6% of the resulting values.

3. Results

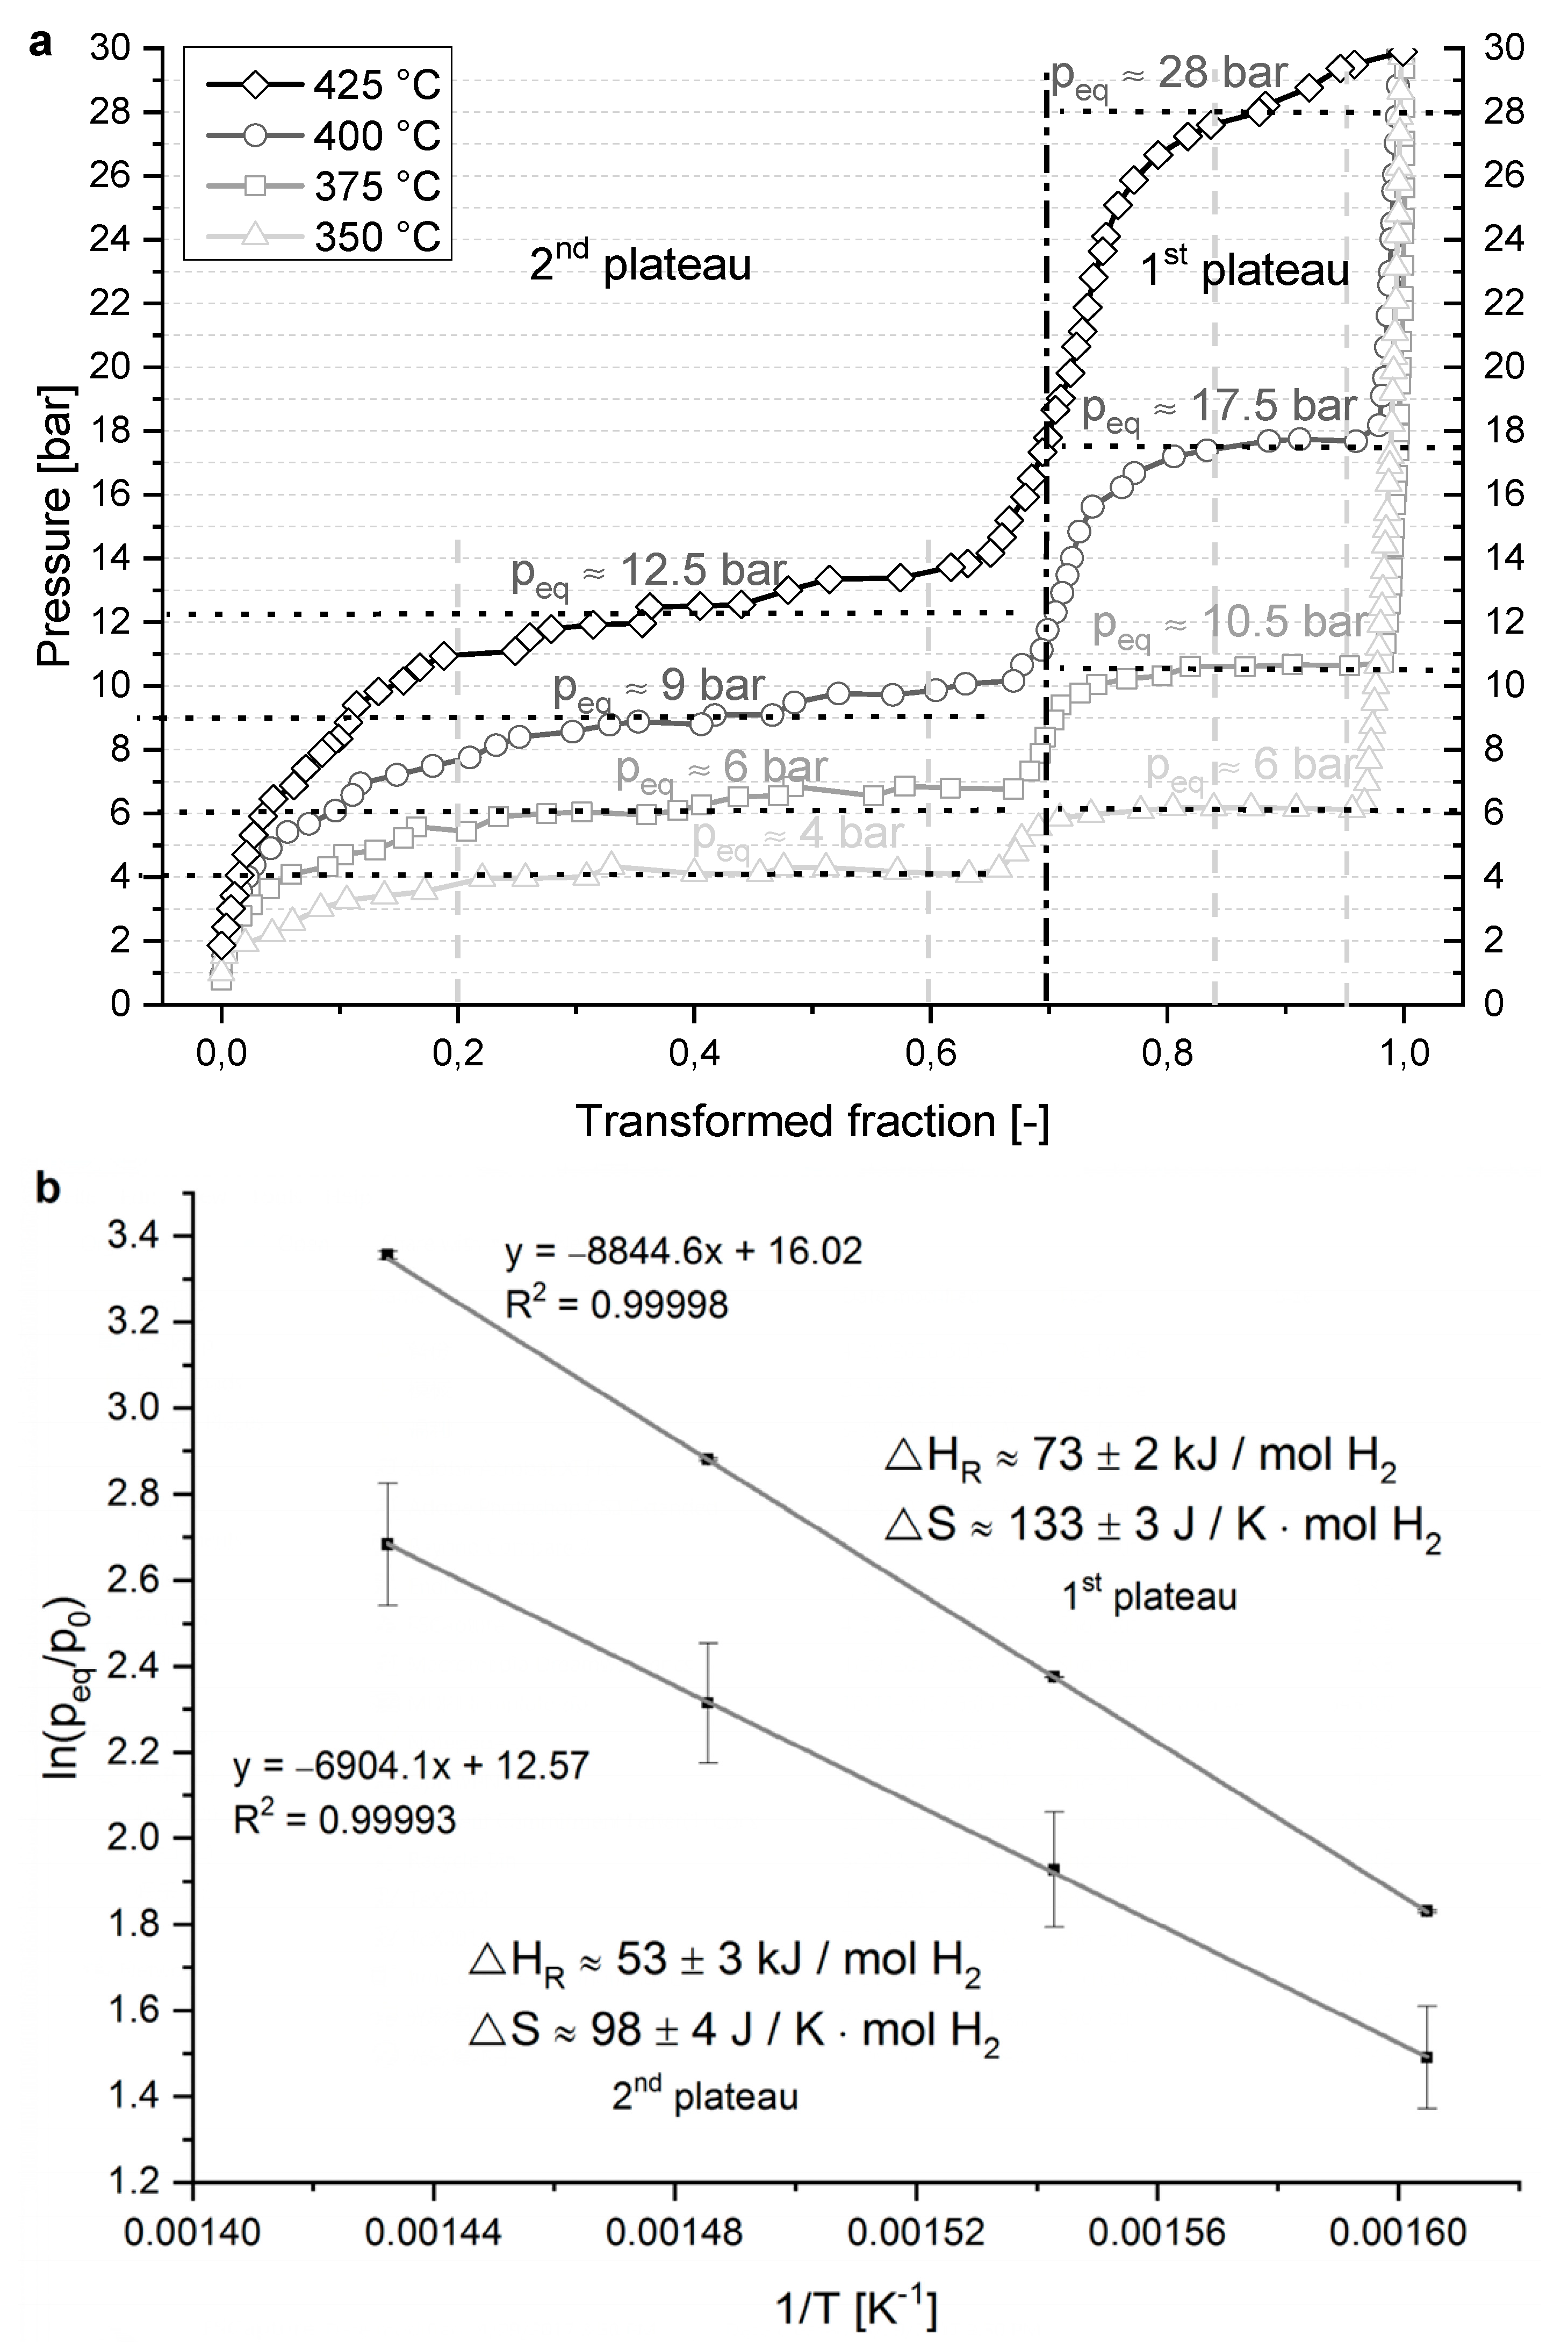
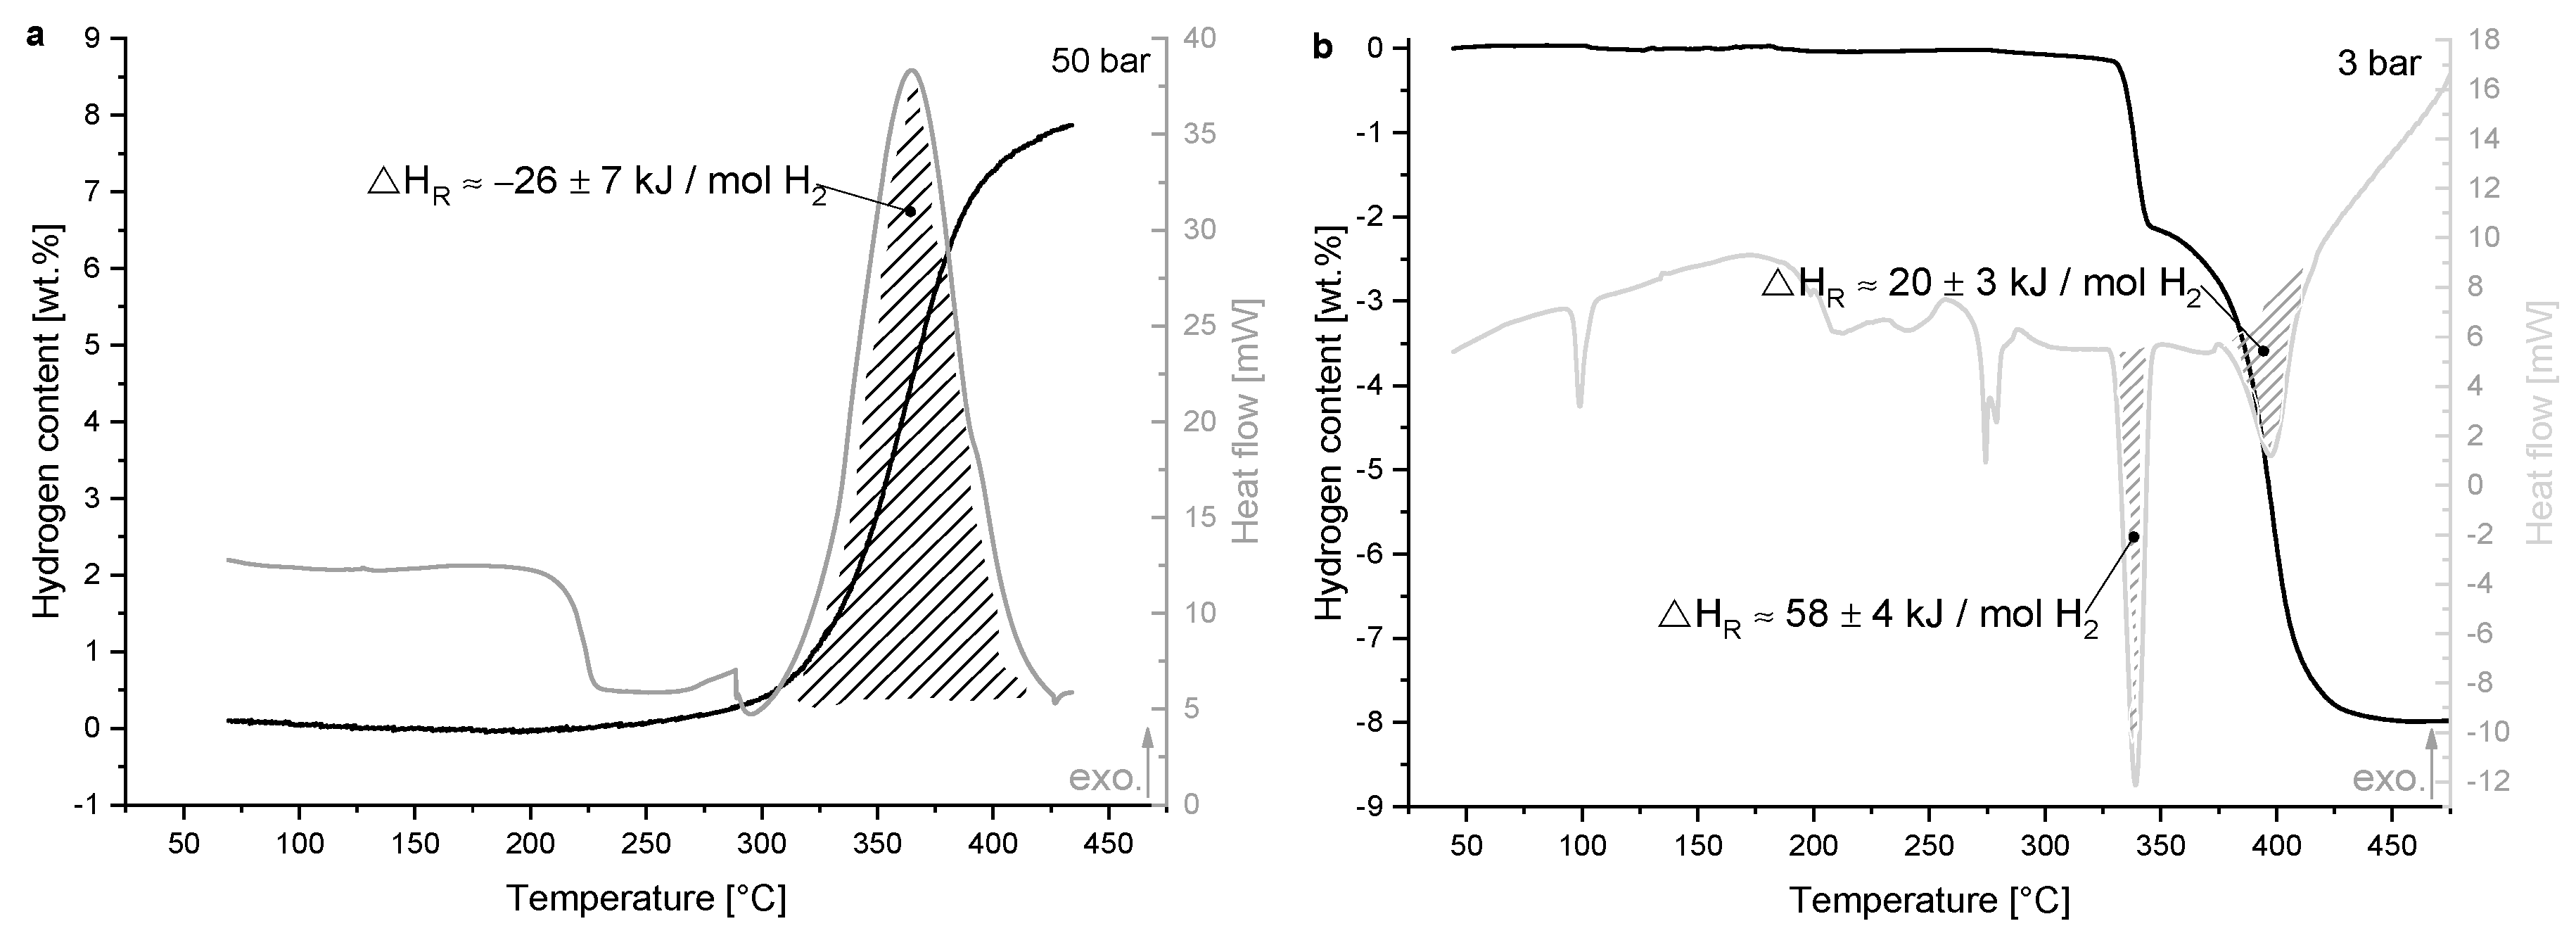
3.1. Thermodynamic Properties

The thermodynamic properties of the Li-RHC system have been evaluated through a measurement method, PCI, which could be considered indirect. This type of measurement is carried out under equilibrium conditions, or as close to them as experimentally possible. A direct experiment in non-equilibrium conditions (coupled manometric-calorimetric measurement) was also used. The left side of Figure 1 shows the dehydrogenation PCI curves in the range from 350 °C to 425 °C (Figure 1a), retrieved from a sample, which has been formerly hydrogenated at 350 °C and 50 bar of H2. The corresponding van’t Hoff plots for the first and second plateau is displayed in Figure 1b. In all the PCIs curves, it is possible to observe that the dehydrogenation in equilibrium conditions occurs in two steps. From the van’t Hoff plot, a value for the reaction enthalpy of 73 ± 2 kJ mol−1 H2 and one for the entropy of 133 ±3 J K−1 mol−1 H2 can be determined, as described above, for the first plateau. Similarly, an enthalpy value of 53 ± 3 kJ mol−1 H2 and an entropy value of 98 ± 4 J K−1 mol−1 H2 are calculated for the second plateau. The corresponding equilibrium pressures for the calculation are taken between a transformed fraction of 0.95 to 0.85 and 0.6 to 0.2 for the first and second plateau, respectively, as specified in Figure 1a (dashed lines). The determination coefficients (R2) for both the segments in the van’t Hoff plot are above 0.999.
As mentioned before, also a more direct calorimetric measurement has been performed, coupling the Sieverts apparatus together with the HP-DSC. Under either absorption at high pressure (Figure 2a) or desorption at low pressure (Figure 2b), and at constant heating rate, the heat flow due to the exothermic or endothermic or reactions in the Li-RHC system can be recorded directly. According to the integral calculation described in Section 2.2.1, for the absorption in Figure 2a, an enthalpy value of −26 ± 7 kJ mol−1 H2 is obtained. This measurement has been repeated twice. In case of the desorption, for the first and second step in Figure 2b, 58 ± 4 kJ mol−1 H2 and 20 ± 3 kJ mol−1 H2 are calculated, respectively. The measurement of the desorption reaction enthalpies has been repeated four times.
The endothermic reaction, which can be seen in Figure 2a before the absorption (exothermic event starting at 280 °C), may be associated with the fusion of some LiBH4, residual or initially formed, or to the changes in the thermal conductivity of the sample at the beginning of the reaction.

3.2. Heat Transfer Properties

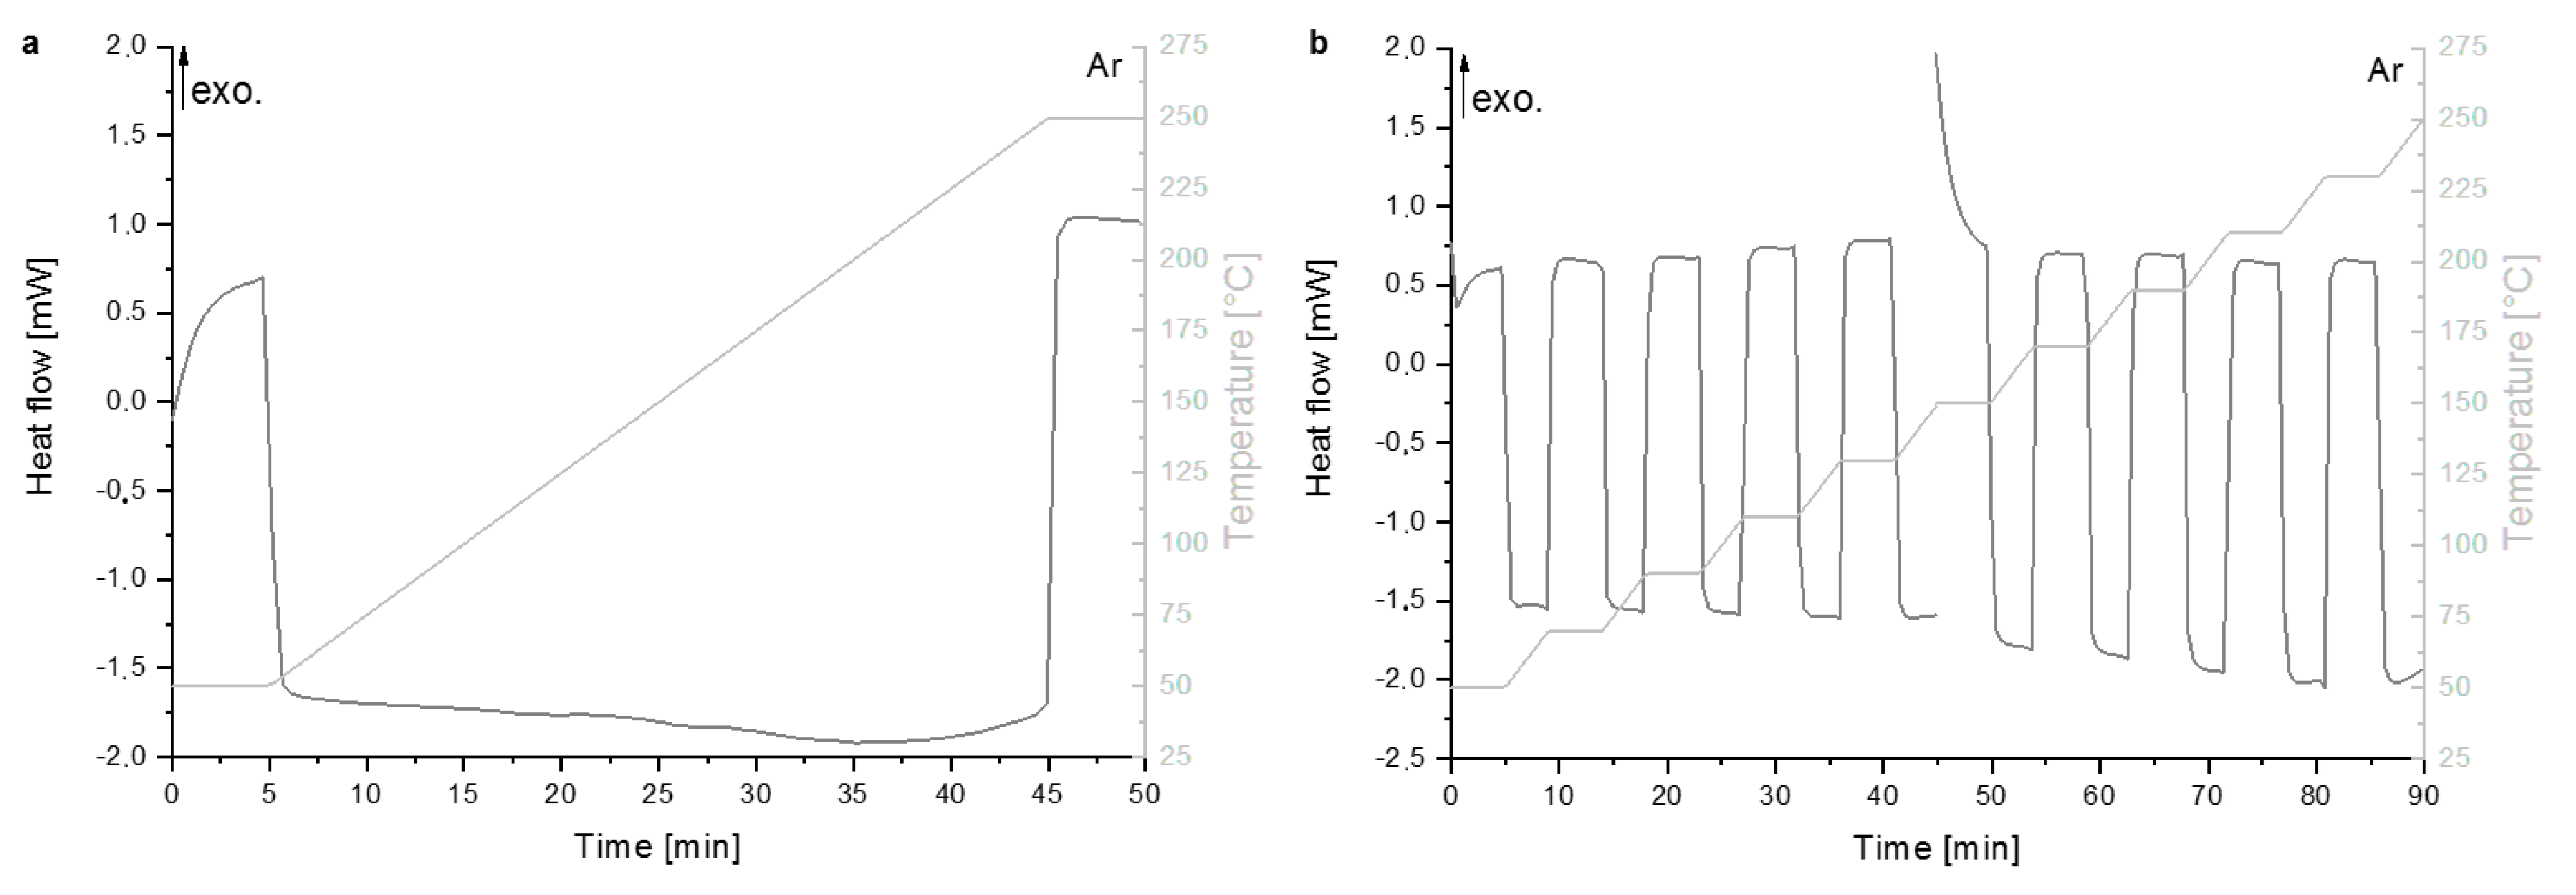
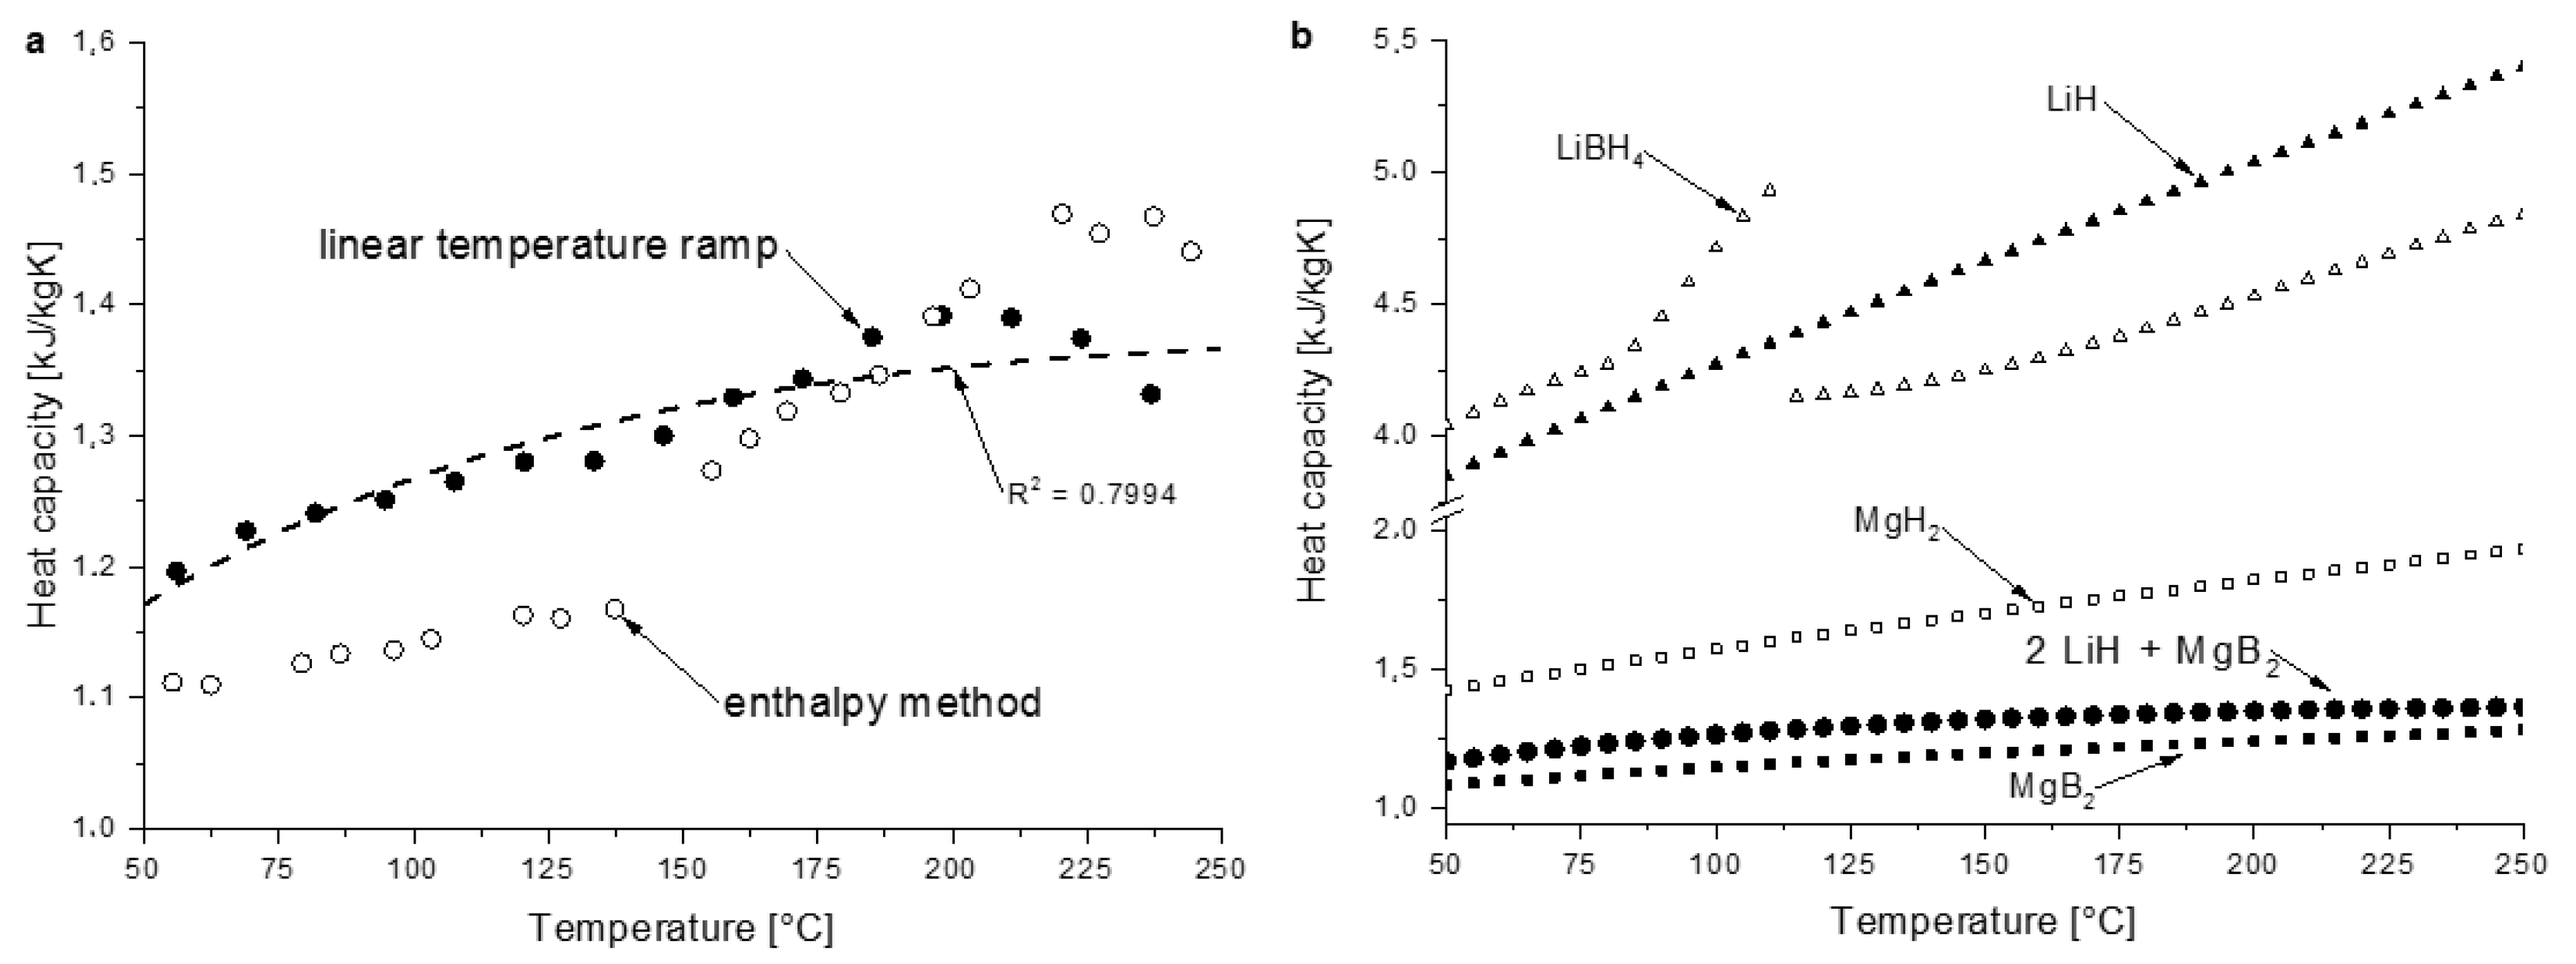
3.2.1. Heat Capacity

Several differential scanning calorimetry (DSC) measurements have been completed in the range of 50 °C to 250 °C to calculate the specific heat capacity of the material in the desorbed state (LiH/MgB2) under protective Ar atmosphere, hereafter indicated as cp. Correspondingly to what has been reported by in the work of El Kharbachi et al. for LiBH4 [21], the determination of heat capacity has been performed using two separate scanning methods: the first is the “linear temperature ramp” (Figure 3a) and the second is called “enthalpy method” (Figure 3b). The latter is a sequence of isothermal segments and heating ramps (20 °C each) leading to a stair-shaped temperature profile. In both methods, 5 min isothermal periods have been applied before starting the ramp to achieve steady-state dynamic equilibrium conditions. A heating rate of 5 °C min−1 has been utilised in all the heating ramps. In the “enthalpy method”, the desired temperature range between 50 °C and 250 °C cannot be measured in a single experiment. The reason is a restriction in the software: the instrument can be programmed with a maximum number of 10 consecutive segments. This can be distributed between isothermal steps and ramps, but cannot be exceeded. Therefore, two immediately consecutive experiments from 50 °C to 150 °C and from 150 °C to 250 °C have been carried out. After the tests, the sample mass has been measured on a scale inside the glove box and the value was in good agreement with the one recorded before the DSC experiments.
The standard equation for the heat capacity of solids is used to calculate the specific heat capacity; in this equation, the isobaric and isochoric heat capacities are equivalent and the volume is assumed constant. In this way, the heat capacity Cp is defined as the ratio between the transferred heat energy ΔQ and ΔT, which is the resulting change in temperature at constant pressure (p):
C p = Δ Q Δ T | p
The heat flux Φ is defined as variation of the heat energy Q over the time t:
Φ = d Q d t t s t a r t t e n d d Q = t s t a r t t e n d Φ d t Δ Q = Φ Δ t
and the heating rate β is correspondingly defined as variation of the temperature T over the time t:
β = d T d t t s t a r t t e n d d T = t s t a r t t e n d β d t Δ T = β Δ t
Equation (3) becomes:
C p = Φ β
In addition and by considering the instrument’s characteristics, the heat flux of the blank tests Φb has to be subtracted from the one of the sample measurement Φs (Φ = Φs − Φb) in order to eliminate possible systematic errors of the machine. The sample mass ms is added in the denominator to express the result per unit of mass (Cp = cp × ms), that is, as specific heat capacity. Hence, the cp of the considered sample can be calculated following the equation:
c p = Φ s Φ b m s β
The two heat capacities calculated by means of the two different methods are displayed in Figure 4a as a function of the temperature.
Figure 3 shows exothermic events as peaks pointing upwards; this means that a reduction in the heat flow signal is correlated to an increase in the heat capacity of the sample. This way, taking into account the DSC profiles in Figure 3, the specific heat capacity of the Li-RHC system is increasing slowly before approaching the temperature of 150 °C (see Figure 4a). For temperatures higher than that, this increase becomes more rapid. A local maximum is located at approximately 200 °C and at about 230 °C in case of the “linear temperature ramp” method and for the “enthalpy method”, respectively. The two separate methods present a good agreement in the range of temperatures between 150 °C and 200 °C. Below 150 °C, where the faster increase of cp for both methods happened, the values calculated by the “enthalpy method” are lower than those derived from the “linear temperature ramp” method. Above temperatures of 200 °C, this correlation is reversed. A nonlinear fitting has been performed for the “linear temperature ramp” method using the Shomate equation:
c p ( T ) = A + B T + C T 2 + D T 2
The determination coefficient is only around 0.80, owing to the polynomial underestimating the local maximum (Figure 4a). In Figure 4b the fitting curve for the cp of the composite material LiH/MgB2 is matched with the heat capacity vs. temperature curves of other compounds (borides and hydrides), taken from publications. The cp vs. T curve for LiH, MgB2 and MgH2 has been retrieved from Kubaschewski et al. [22]. The curve for LiBH4 refers to the paper by El Kharbachi et al. [21]. The parameters for the polynomial fit are listed in Table 1.
The cp of the materials containing lithium is greater by a factor of approximately 3 if compared to the one of the materials containing magnesium. The need for several parameters for LiBH4 (resulting in a discontinuous function) is due to the phase change at 113.45 °C from the orthorhombic to the hexagonal phase. The increase of the value of cp before this polymorphic phase transformation is termed an “abnormal” phenomenon. An hypothesis behind this trend could be the intensification of crystal defects [21]. More details are discussed in Section 0.

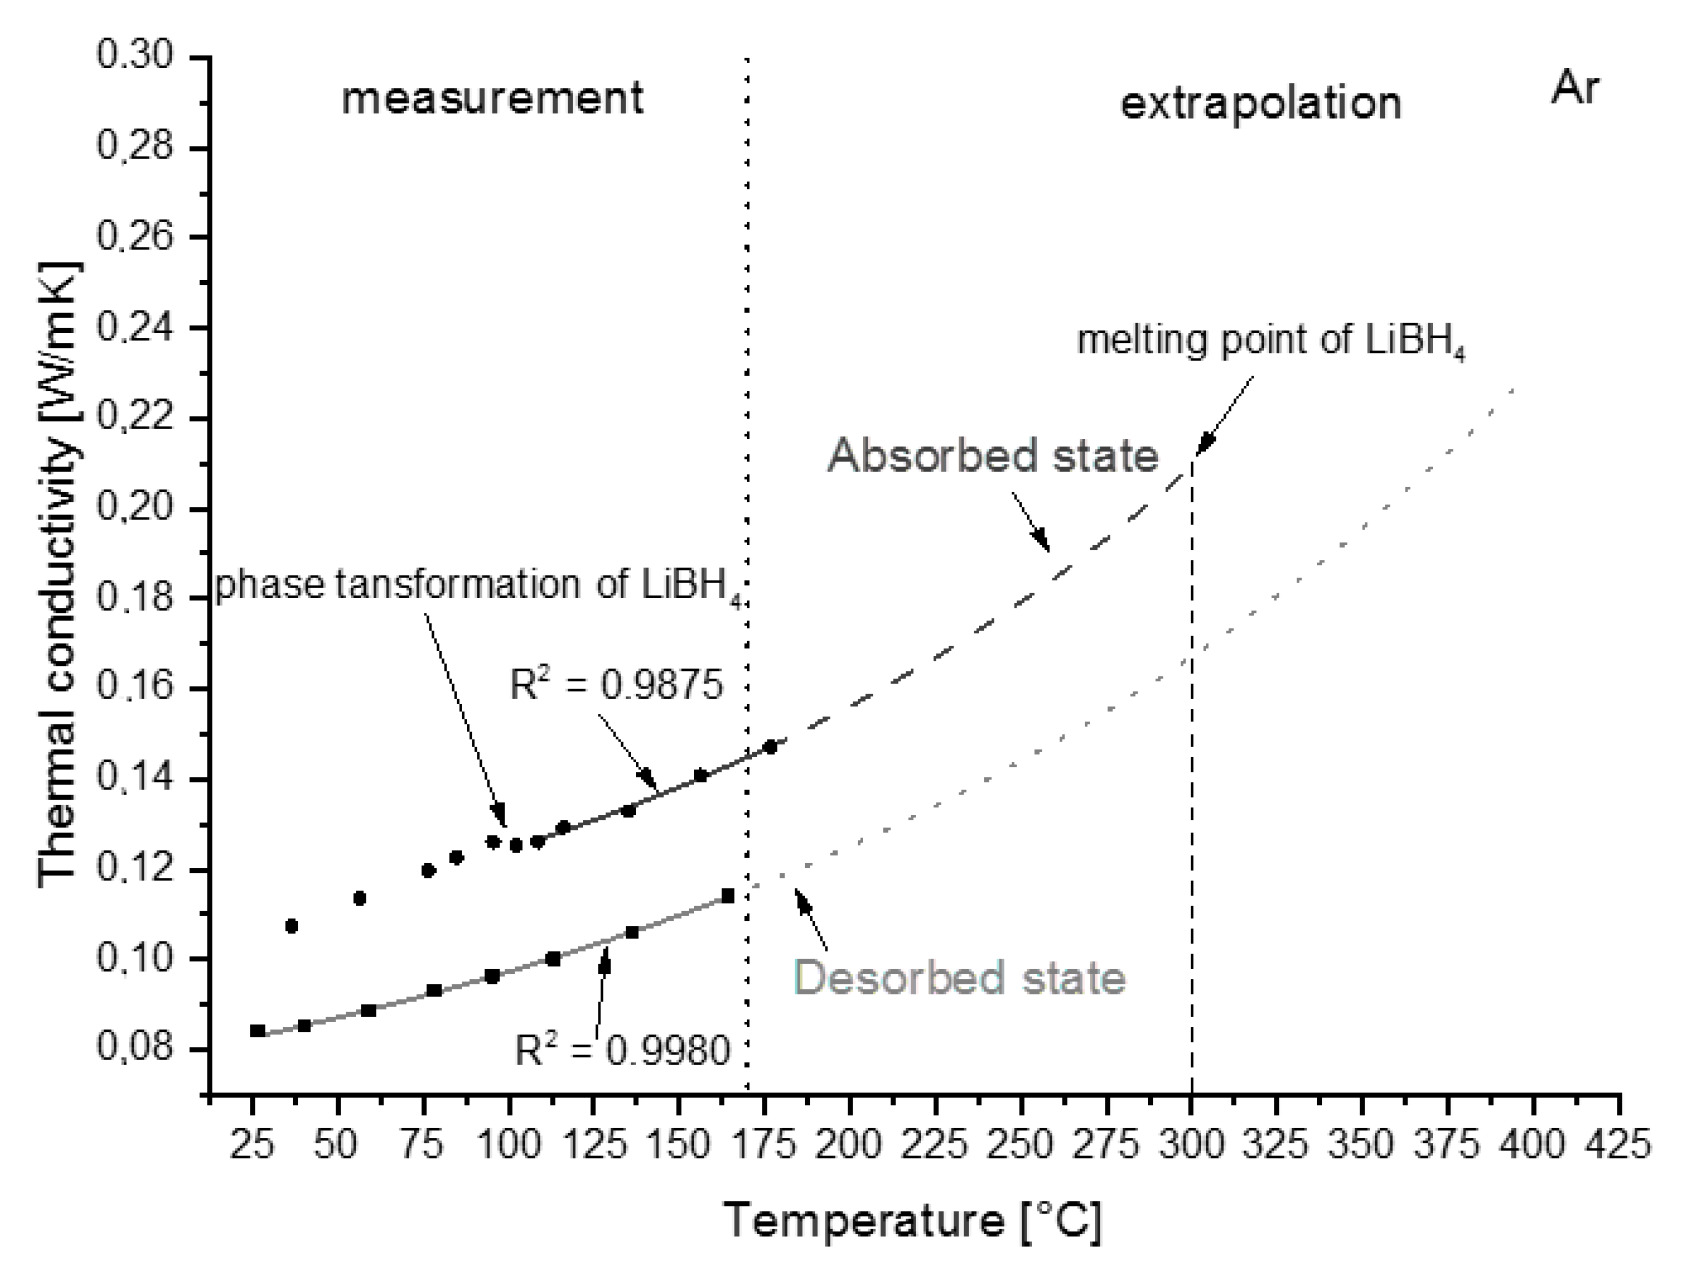
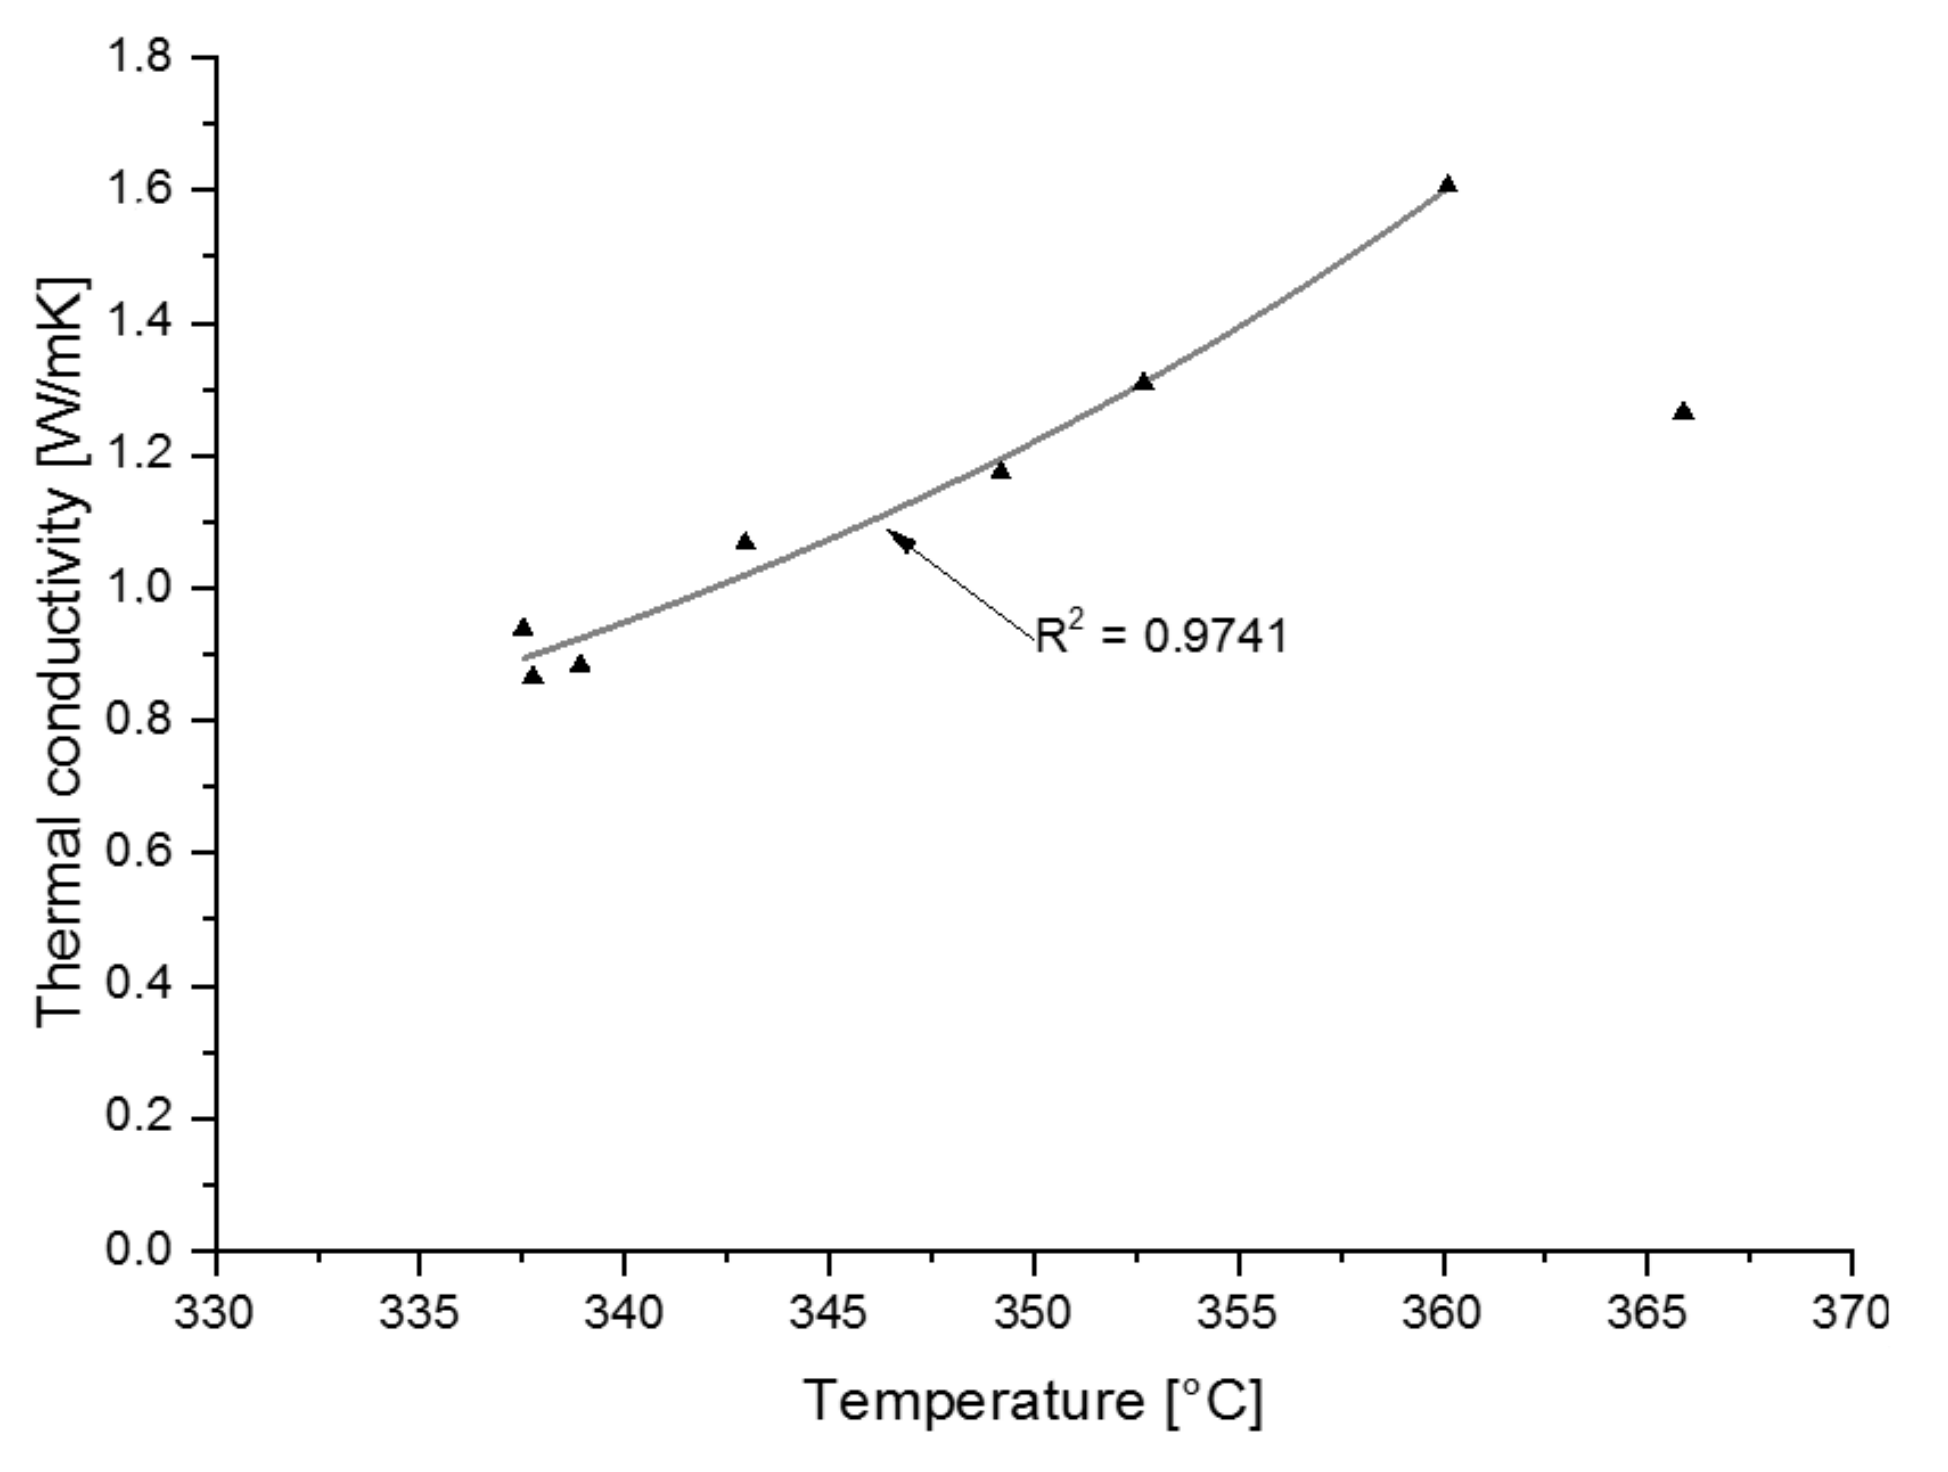
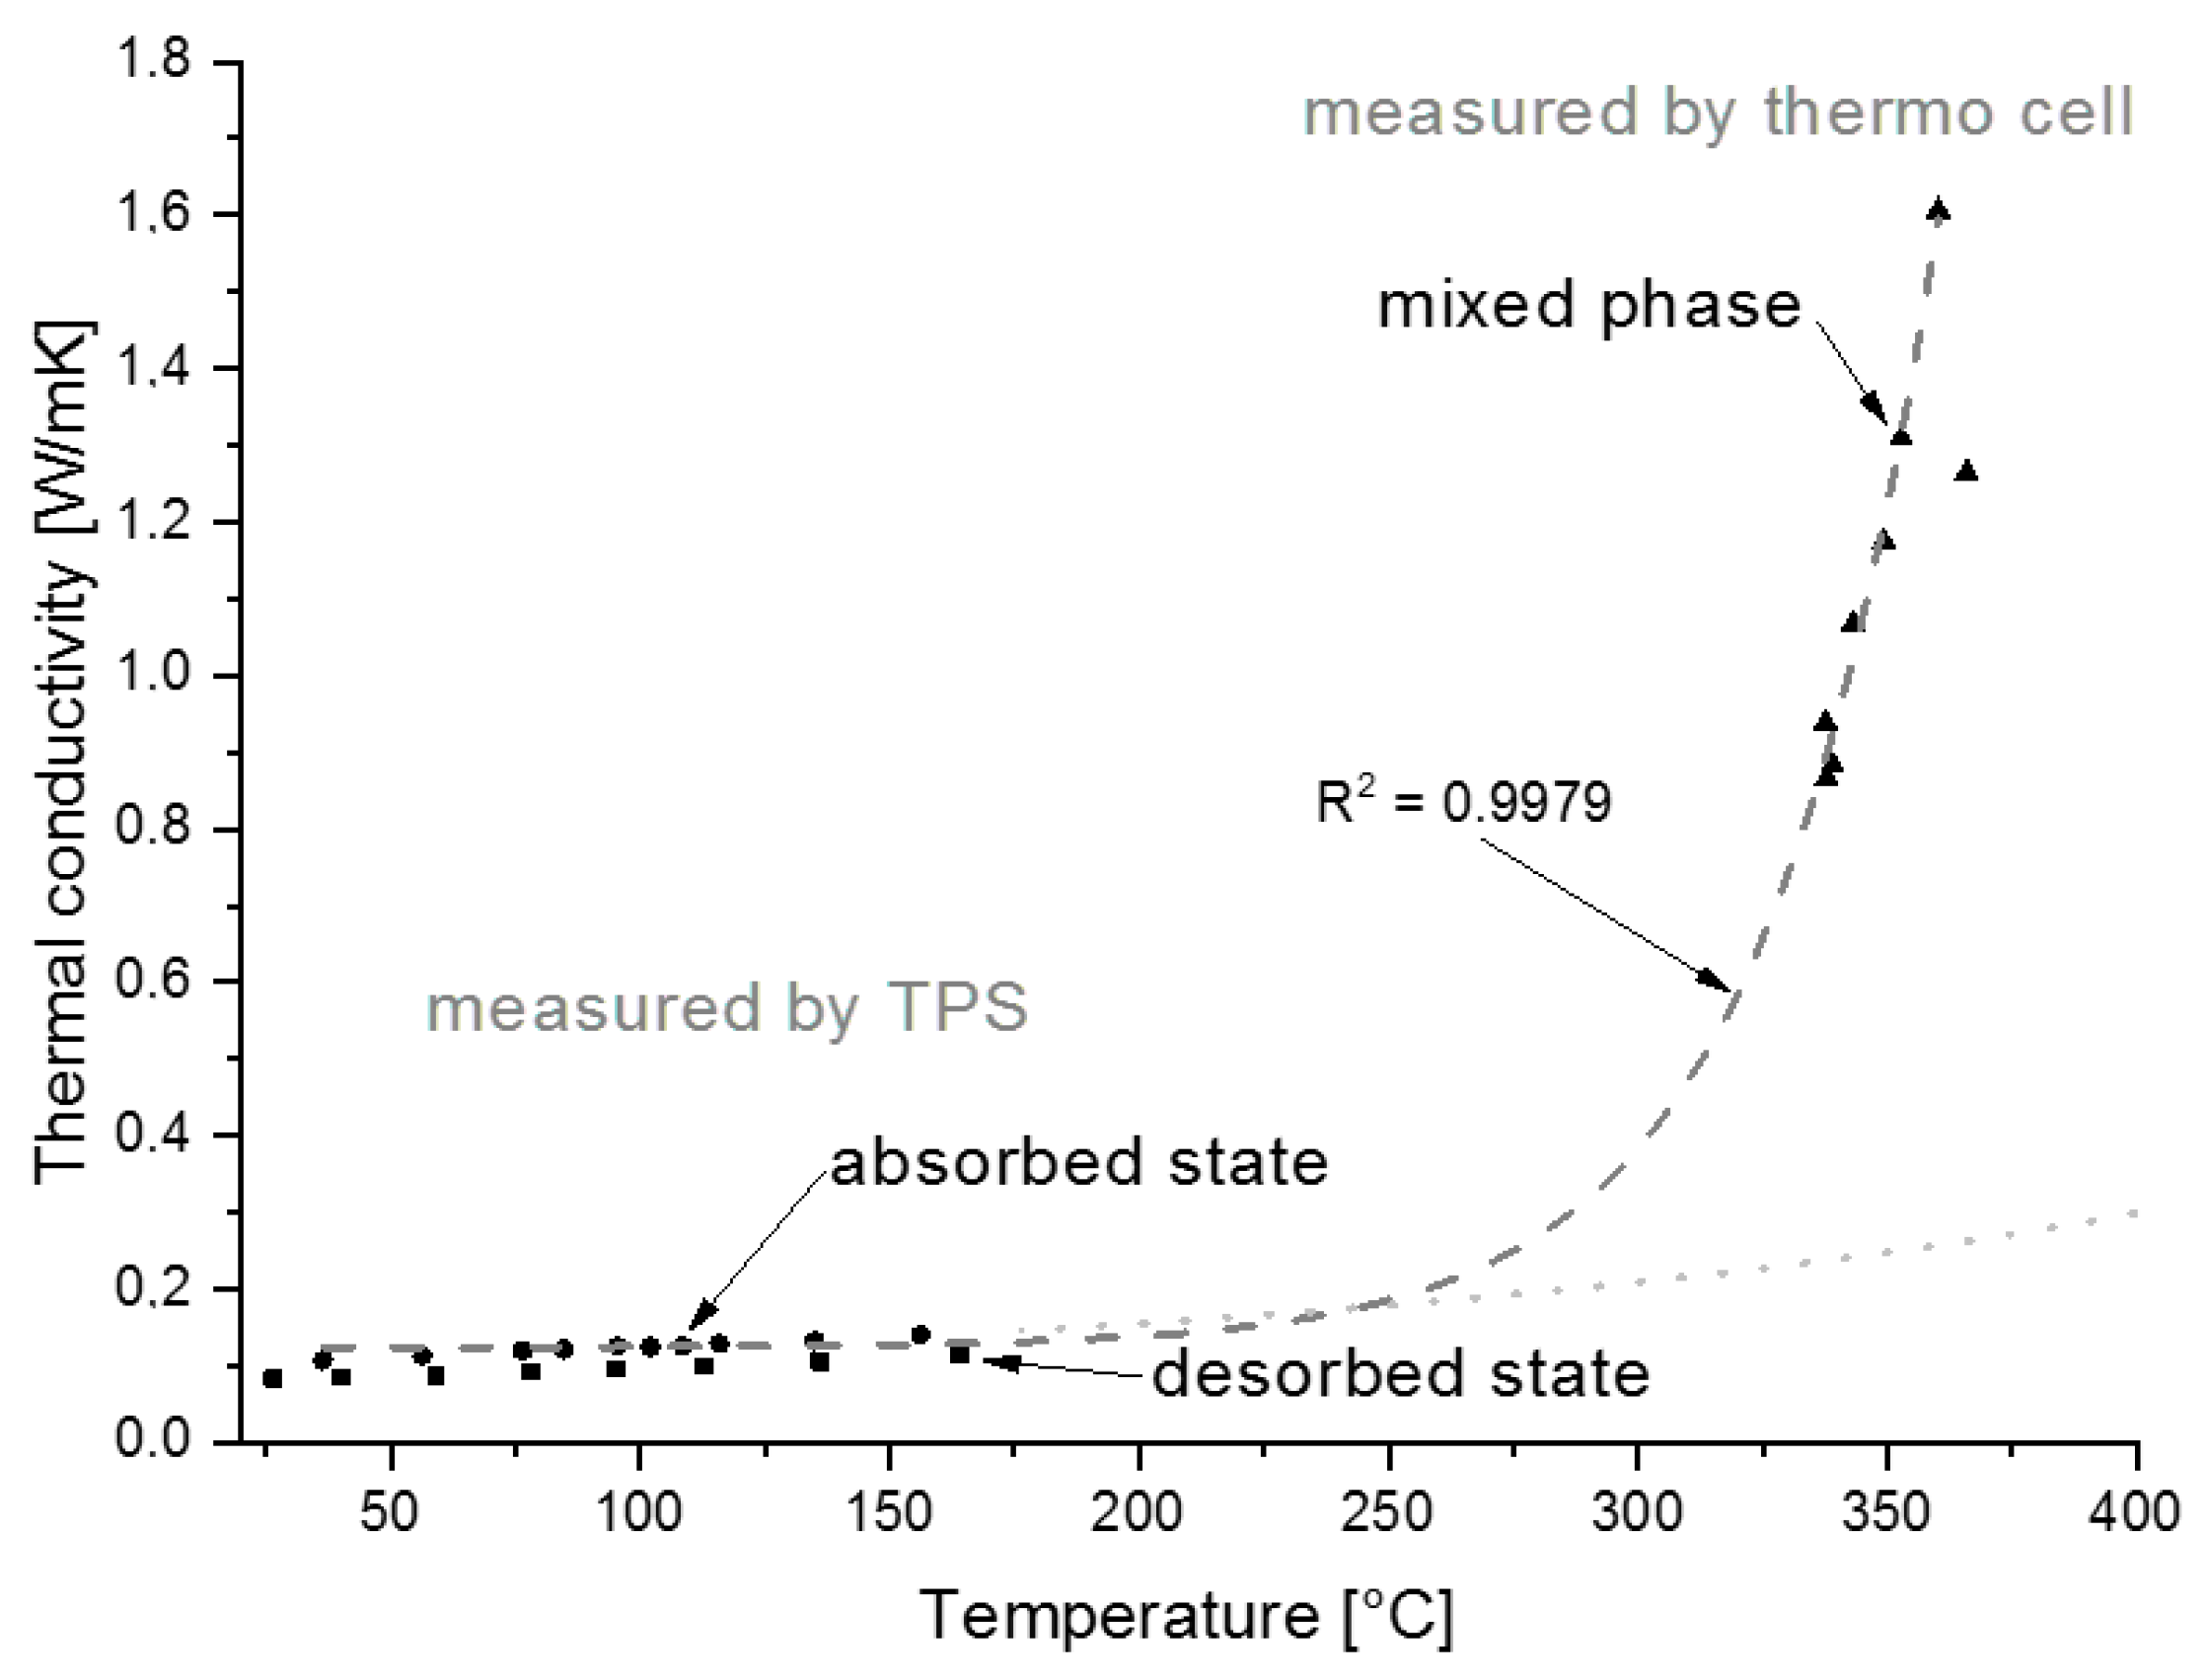
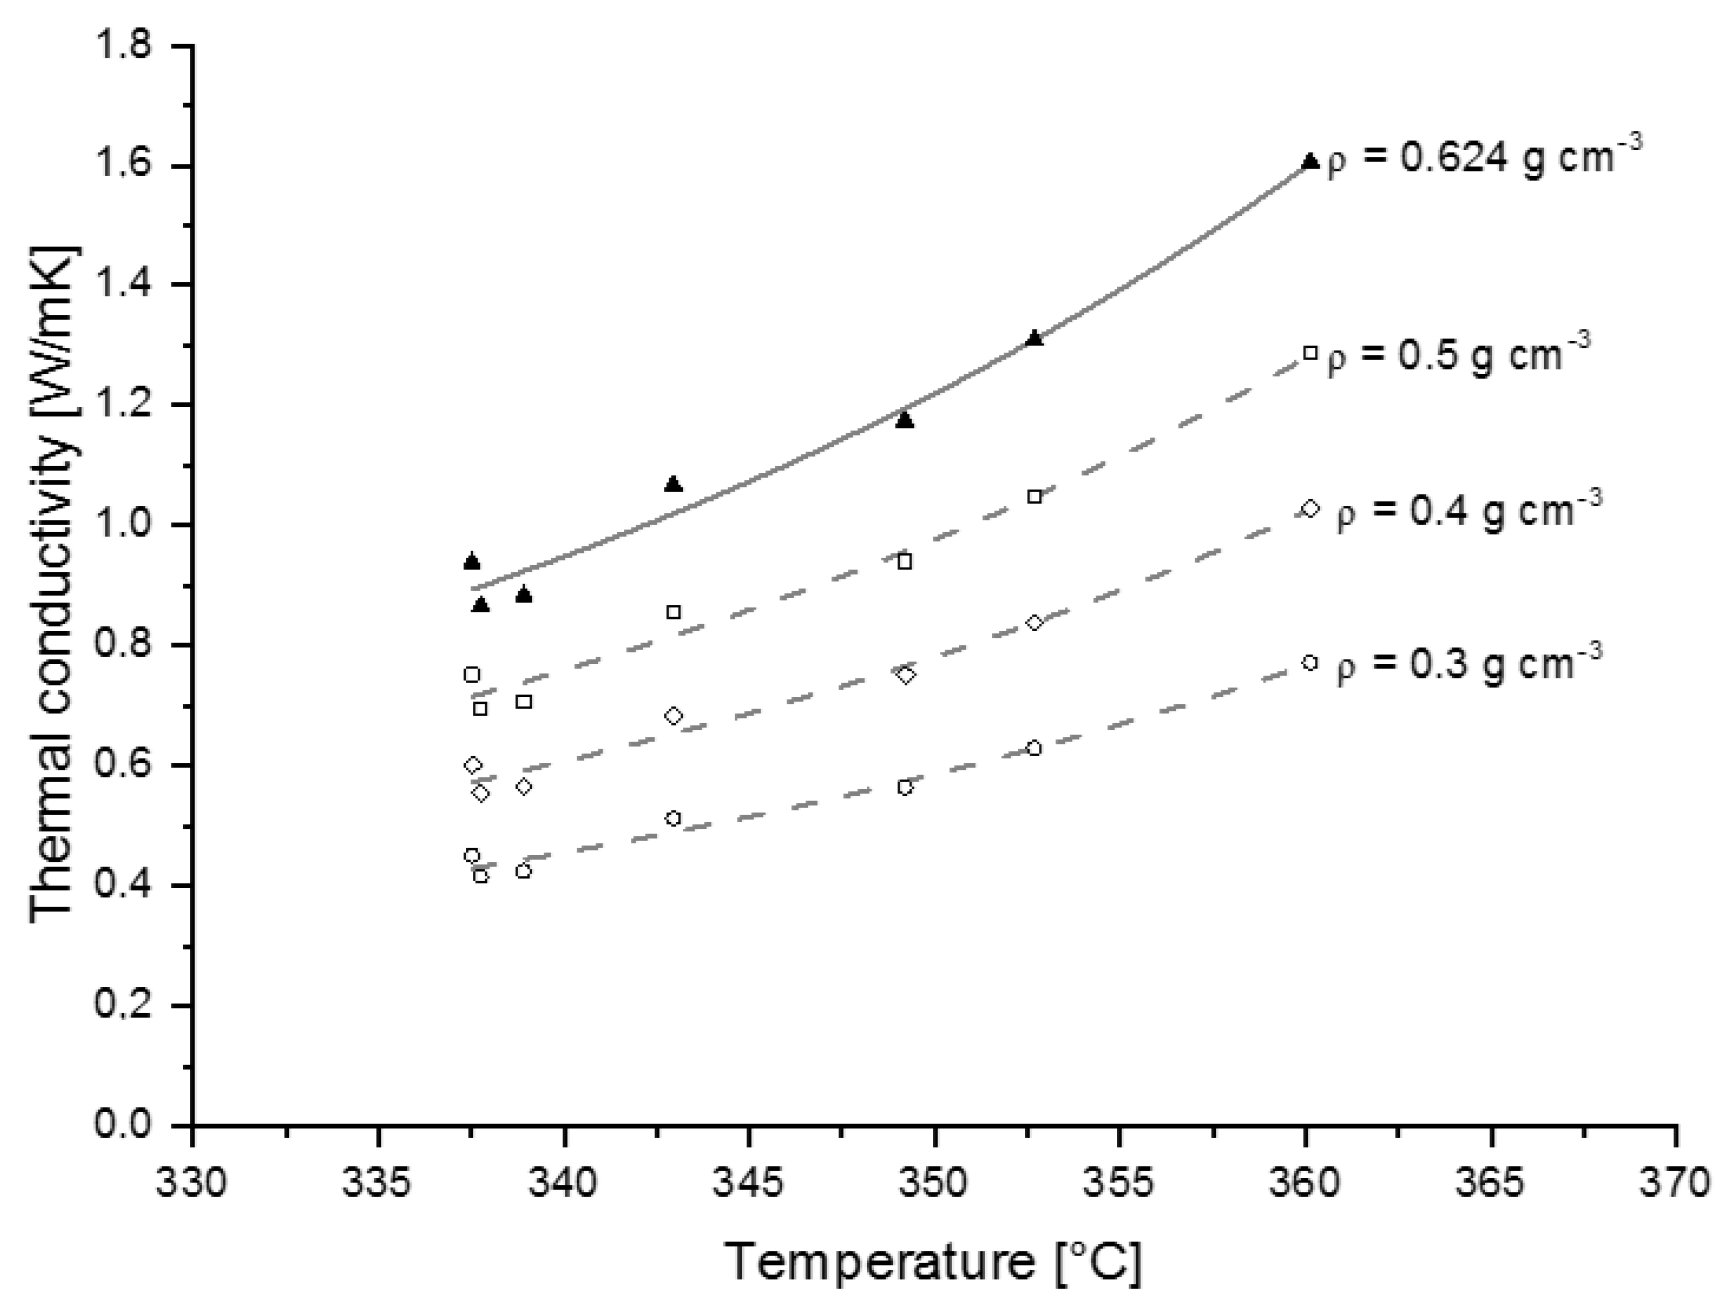
3.2.2. Thermal Conductivity

The effective thermal conductivity λeff has been measured using the above described transient plane source (TPS) method. The measurements were done under Ar atmosphere. The sensor and the sample have been surrounded by a heating band to achieve temperatures up to 180 °C. The effective thermal conductivity has been measured for absorbed (LiBH4/MgH2) and desorbed (LiH/MgB2) materials. Figure 5 shows the results of these measurements together with functions interpolating the experimental points. The curves were as well extrapolated up to 300 °C and 400 °C at the far end of the temperature range.
The thermal conductivity of the system is clearly affected by the phase transformation of LiBH4 (absorbed material) from the orthorhombic crystal structure at low temperature, to the hexagonal one at around 100 °C [23]. Therefore, the interpolation (using an exponential function) has been calculated for the experimental points only after this phase transition and then only up to a temperature of 300 °C. At higher temperatures, LiBH4 melts [23] and it is predictable that the development of the curve could change extremely after this point. For the desorbed material, the interpolating function has been calculated for the complete range, since no phase transition is known for this mixture from literature.
These measurements have been performed ex situ. Therefore, the atmosphere was the one in the argon glove box. They give a first good notion of the possible values for λeff. However, during the hydrogenation or dehydrogenation reaction, a mixture of both states, absorbed and desorbed, exists: just at the beginning or at the end of the reaction the values previously measured for the thermal conductivity can be assumed to hold true to a great extent. Lozano et al. [14] provided a new experimental technique that takes place while the reaction (in this case the desorption) is occurring under H2 atmosphere. The method exploits three thermocouples inserted at defined distances around a central one in a radial arrangement, in a modified sample holder called thermocell. The thermocouples, in this way, have their measuring tips directly inside the powder bed itself. The sample holder can be connected to a Sieverts apparatus as the one described in the sections above and thus both hydrogenation and dehydrogenation reactions can be carried out while recording the temperatures at different positions inside the bed, giving a temperature profile. The value of the effective thermal conductivity, λeff, can be determined, with the assumption of a homogeneous cylinder in steady state. The calculation is based on Fourier’s law and on the acquisition of the local heat flux q ˙ :
q ˙ = λ 2 T
The temperature gradient 2 T can be conceived as an expression of the distance r (owing to the steady state assumption) reducing the number of dimensions to 1 and the gradient function to a simple differential:
0 = d T d r + q ˙ λ
In order to find the solution for this differential equation, the operator of Laplace for cylindrical coordinates is applied [24]:
0 = d 2 T d r 2 + 1 r d T d r + q ˙ λ
Assuming a constant heat source ( d q ˙ / d t = 0 ) the result for the integration of Equation (10) is:
T ( r ) = c 0 + c 1 ln ( r r 0 ) q ˙ r 2 4 λ
The boundary conditions defined for the thermocell are used to solve the two constants c0 and c1, by assuming a value for central temperature T0, which is known and constant:
T ( r = 0 ) = T 0   and   d T d r | r = 0 = 0
After resolving the constants c0 and c1, Equation (12) can be rewritten as:
T ( r ) T 0 = Δ T = q ˙ r 2 4 λ   or   λ = q ˙ r 2 4 Δ T
Lastly, using the powder bed density ρ the effective thermal conductivity λeff can be calculated:
λ e f f = q ˙ ρ r 2 4 Δ T
where ∆T is the temperature difference between any pair of thermocouples during the experiment in the thermocell and r is the radial distance between those two thermocouples. Equation (16) is used to calculate the specific heat rate q ˙ , per unit of mass:
q ˙ = d α d t Δ H R
It is expressed as product of the reaction enthalpy times the change of the transformed fraction α in time t (the hydrogenation/dehydrogenation rates). Assuming that there are actually temperature differences different from zero inside the bed, ∆T is shown to be a function of the squared radius as described in Equation (17) (parabolic temperature profile):
Δ T = T T C = n r 2
where the constant n is a factor that can be calculated using Equation (15):
n = q ˙ ρ 4 λ e f f
The value of n can be obtained by plotting the experimental values of ∆T for the different positions of the thermocouples against the radial distances of these thermocouples from the centre of the thermocell (Figure 6b). The hydrogenation/dehydrogenation rates and ∆T values are measured during the thermocell experiment (Figure 6a).
The density of the loose powder has been measured in a previous study [25]. For the reaction enthalpy the value of the first plateau, determined in Section 3.1, has been chosen. As an example, the results for the 5th desorption experiment in the thermocell and the resultant calculation (Figure 6a,b) are displayed. The determination coefficient showing the goodness of the fit to the parabolic profile for this calculation has been above 0.99. Several dehydrogenation reactions at different temperatures have been carried out. The resulting thermal conductivity is plotted in Figure 7. For the other experiments carried out with the thermocell, the determination coefficient has also been over 0.99, except the test at about 338 °C (>0.92). Finally, the experiment above 365 °C has not been included in the fitting because the reaction was so fast that no stable values could be kept for long enough. The same measurements have been also carried out for the second step of the reaction and in absorption conditions (the results are not reported here). However, in this case it was impossible to obtain a good fit for the ∆T parabolic function of the radial distance.
The two methods used to measure/calculate the effective thermal conductive of the materials in question can be used together to picture the development of the thermal conductivity with increasing temperature. The prediction to elevated temperatures, extrapolated from the measurements by the TPS method (Figure 5), should be modified in order to achieve a smooth connection with the measurement at high temperatures using the thermocell method. This will be further discussed in Section 4.3. In Figure 8 the dotted line represents the extrapolation previously shown in Figure 4 for the TPS method, together with the dashed line interpolating the data from the thermocell high temperature measurements. The profile of the curve indicating this trend will be discussed in Section 4.3, together with the influence of the density.

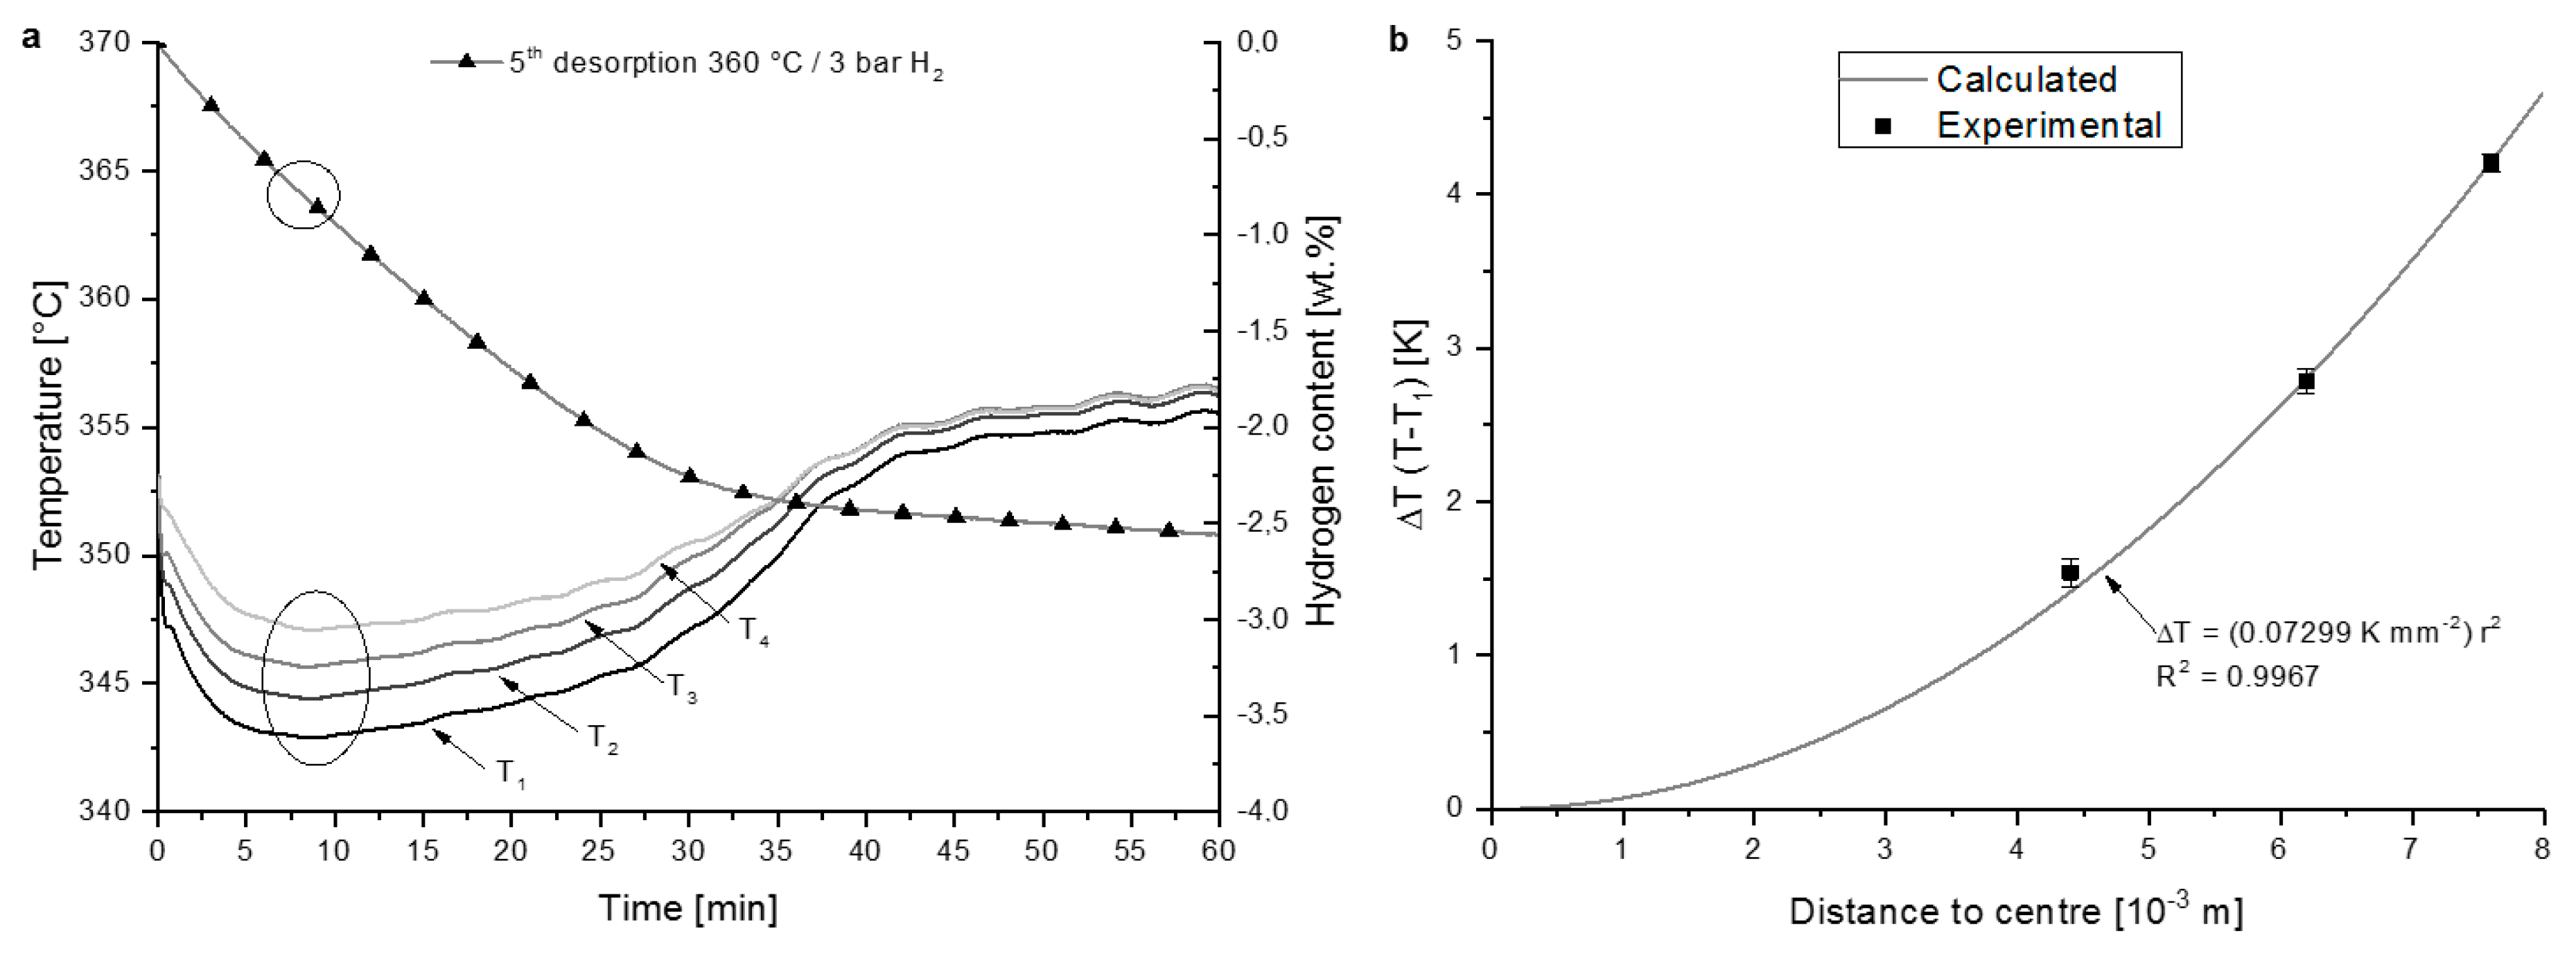
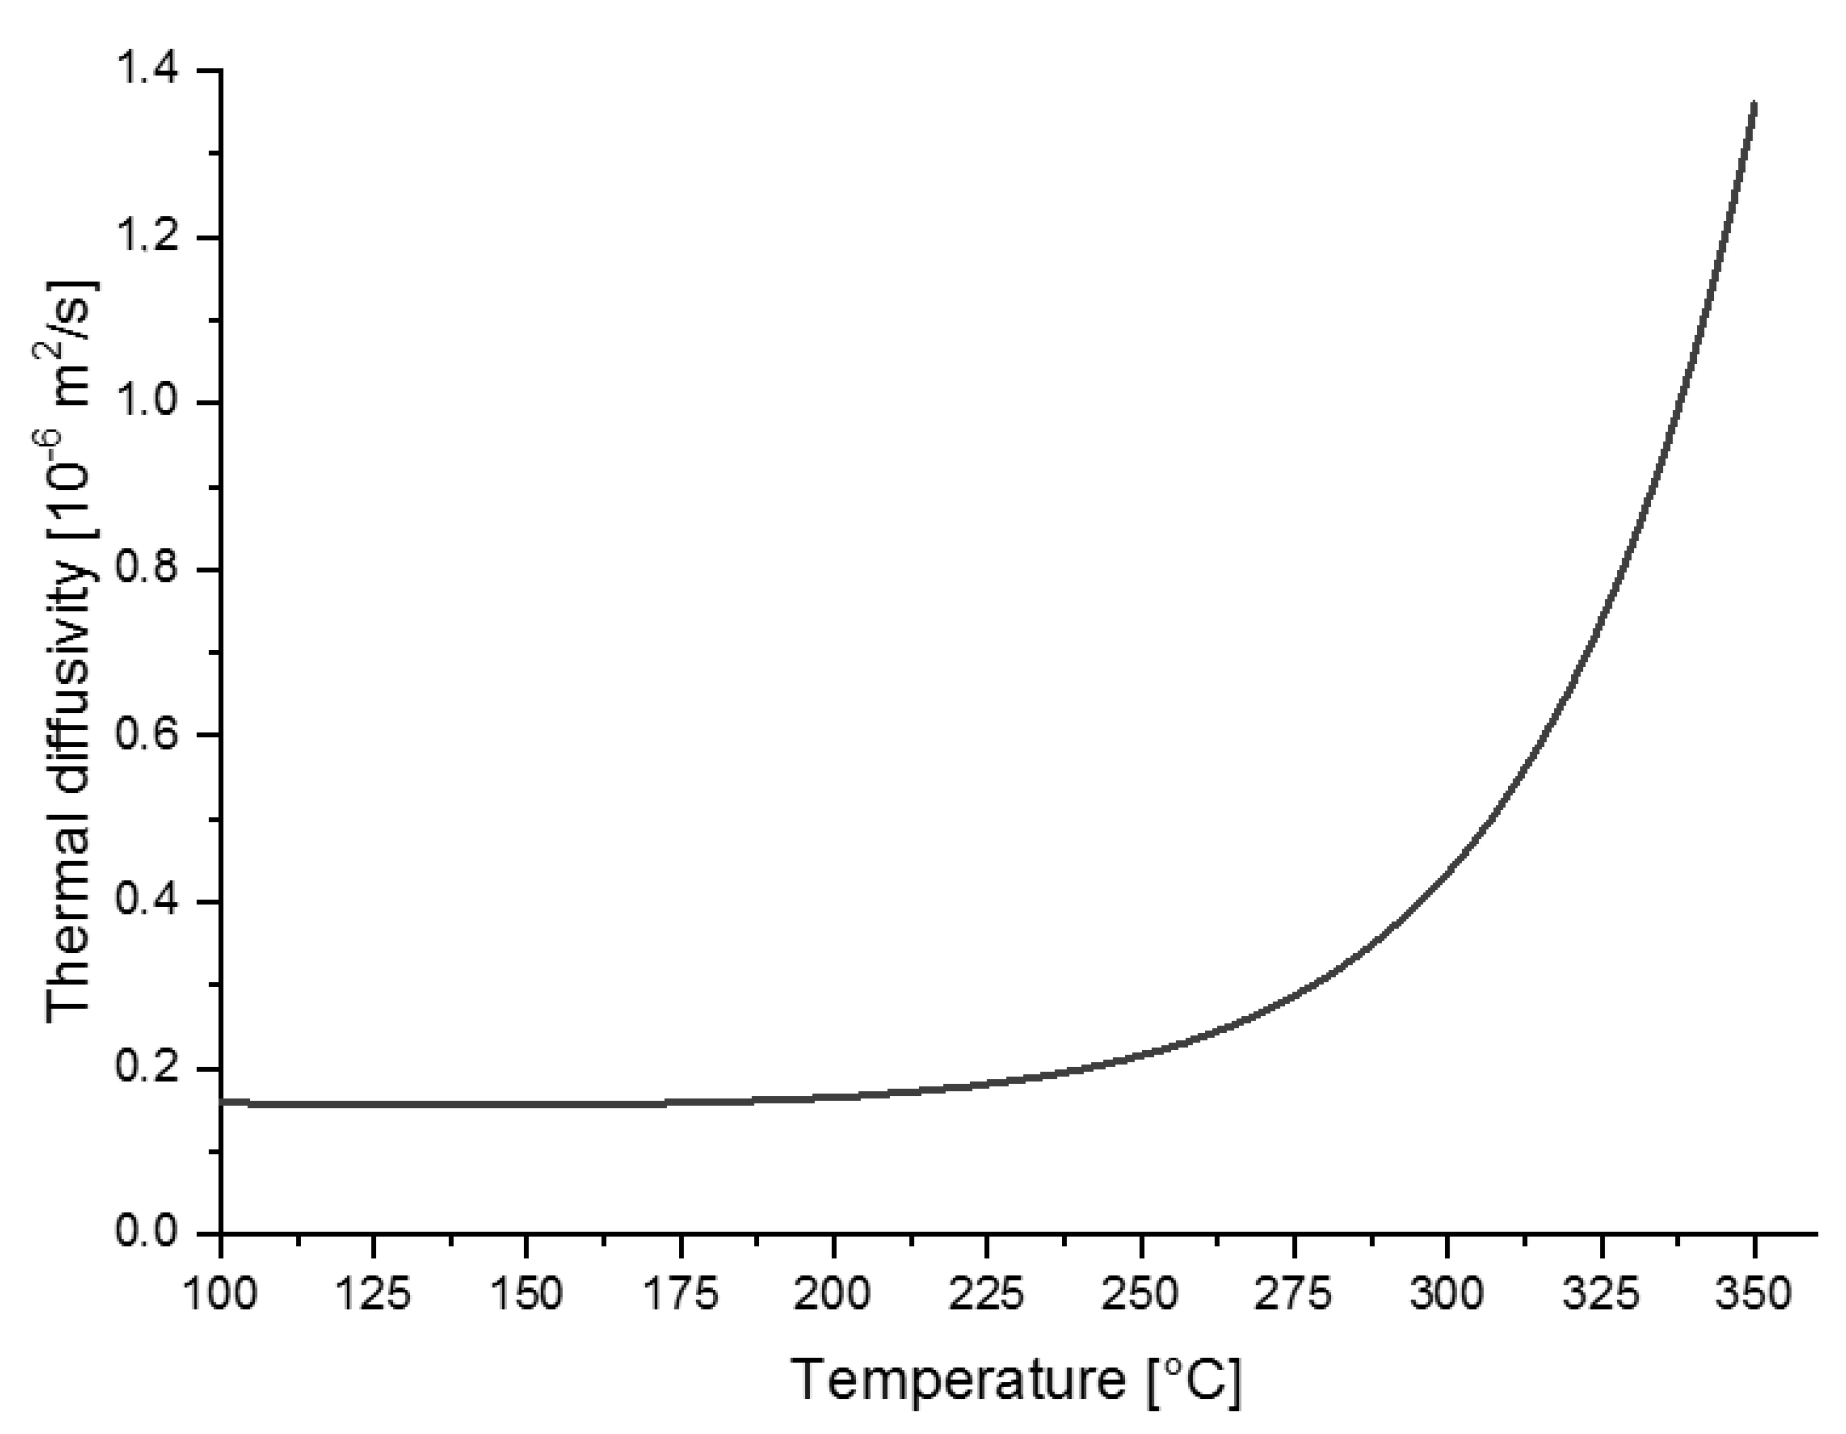
3.2.3. Thermal Diffusivity

The value of the thermal diffusivity a provides information on the temporal and spatial changes in temperature inside the powder bed and cannot be measured directly. It is obtained from the heat capacity cp, the effective thermal conductivity λeff, and the material density ρ. Their relationship is described in Equation (19):
a = λ e f f ρ c P
The calculation to obtain the value of the thermal diffusivity against temperature has been done using the functions fitting the thermal conductivity (Figure 8) and the heat capacity (Figure 4b). The temperature range was between 100 °C and 350 °C, since the data available from this study correspond to this range (Figure 9). For the calculations of the thermal diffusivity, the assumption is that the material density does not vary in the temperature interval defined above.
The calculations show the thermal diffusivity with a value in an interval between 0.150 × 10⁻⁶ m2 s−1 and 1.350 × 10⁻⁶ m2 s−1. Beginning with a temperature of about 225 °C, this value grows exponentially, a trend clearly caused by the increase of the thermal conductivity, which also rises exponentially as shown in Figure 8. In juxtaposition with other materials, pure metals in particular (e.g., aMg ≈ 87.0 × 10⁻⁶ m2 s−1), the thermal diffusivity value, is rather low even at high temperatures [11].

4. Discussion

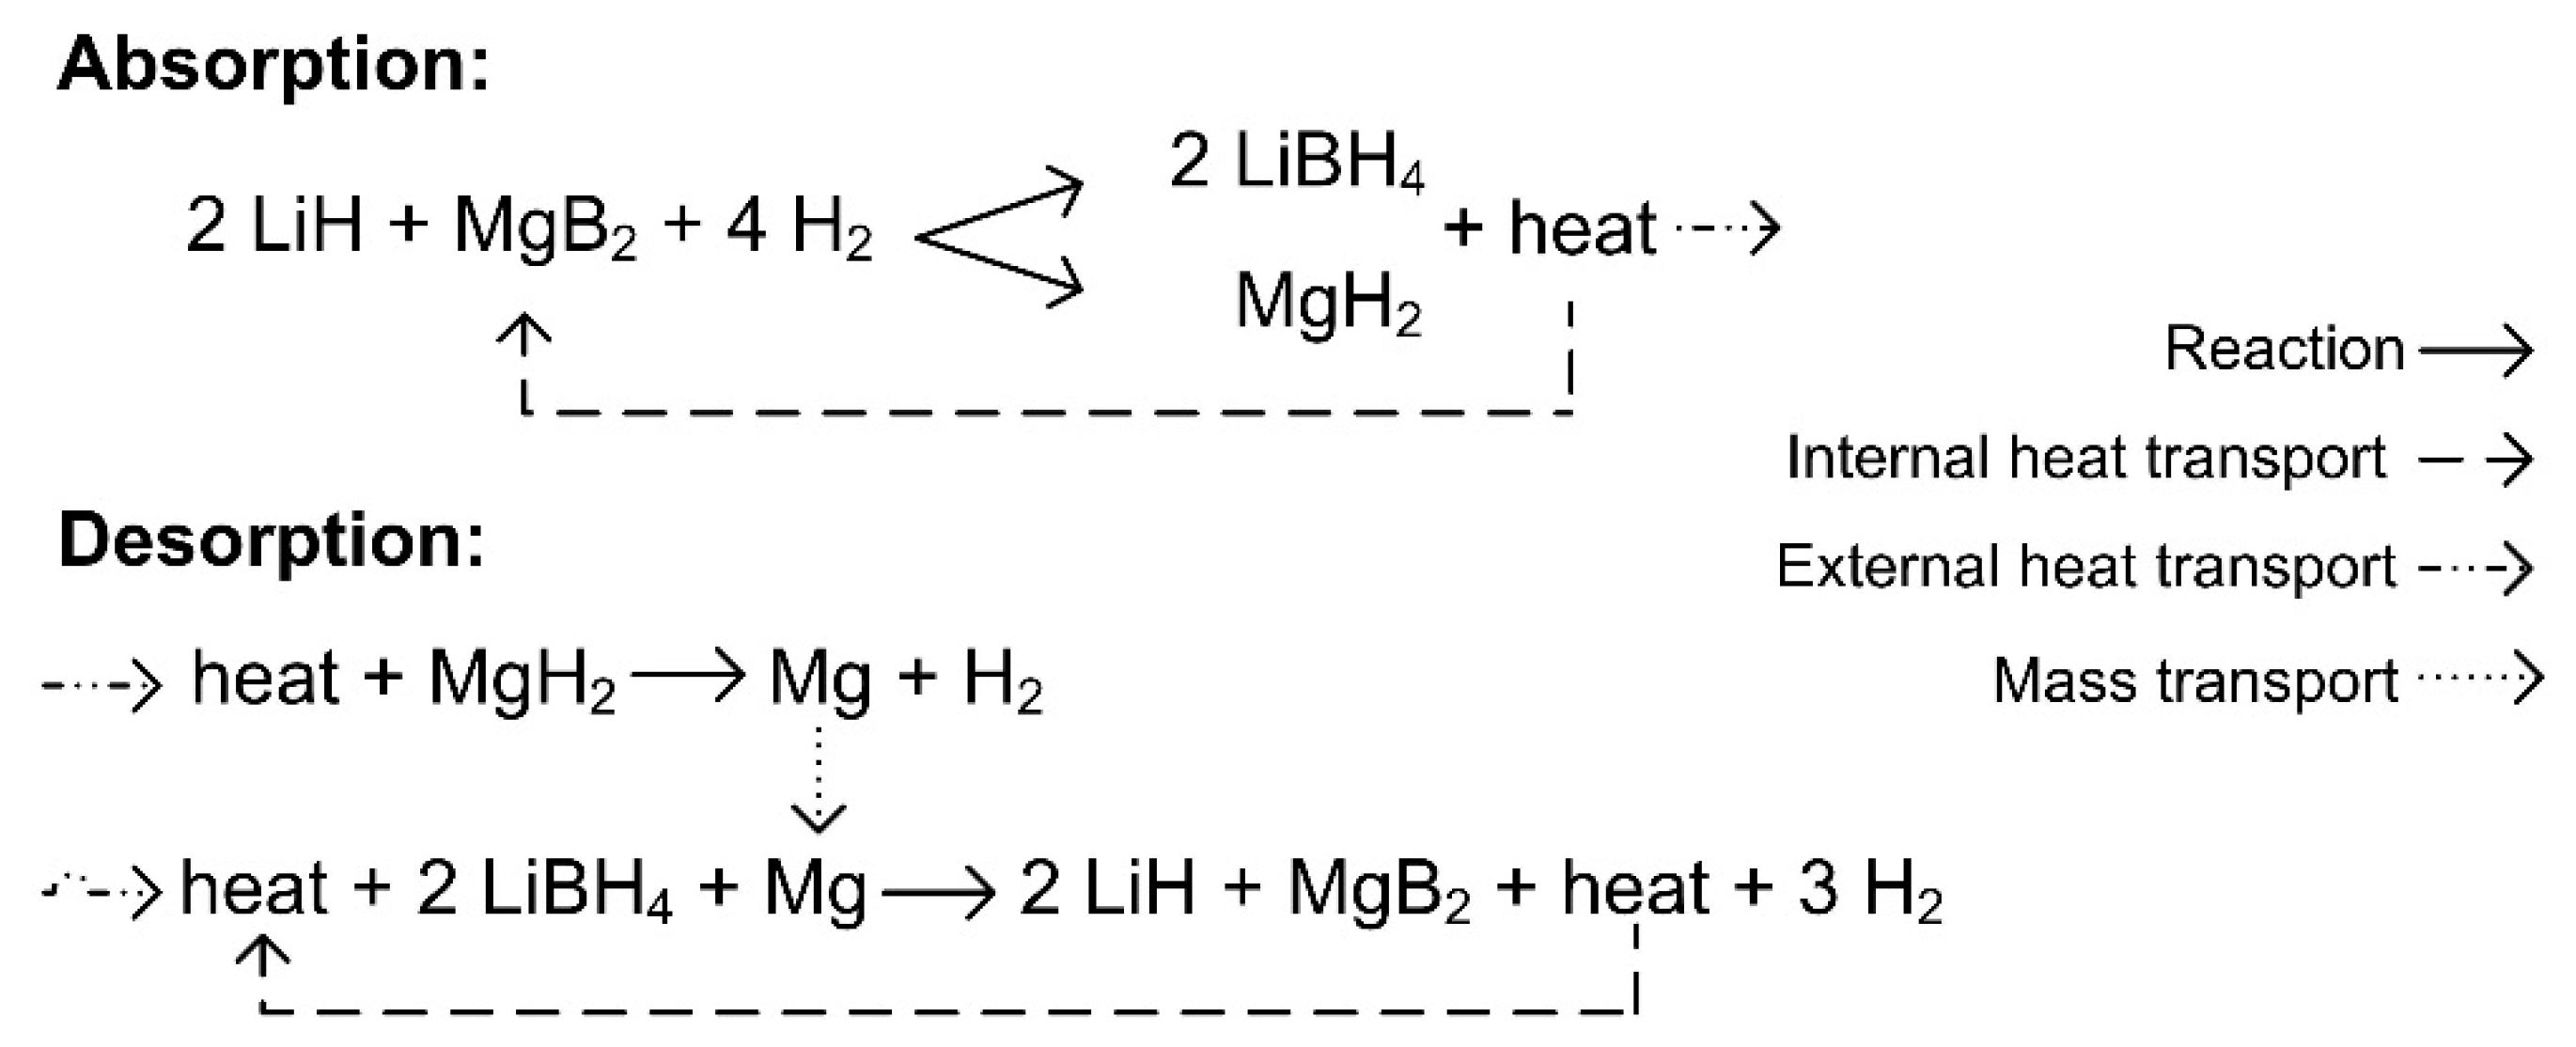
4.1. Reaction Mechanism

In situ XRD experiments for the Li-RHC have already shown the dehydrogenation reaction developing in two-steps, while the hydrogenation takes place in a single step [23]. These reactions have been assessed by means of the coupled manometric-calorimetric measurements and the PCI tests in the present work. However, the values for enthalpy and entropy measured here might not be deduced correctly, because the mechanism for the absorption reaction is still not fully understood. Theoretically, the thermodynamic parameters, i.e., enthalpy and entropy, should not be affected by the reaction mechanism if the initial and final products are the same.
For the absorption reaction mechanism it is assumed that the exothermic formation reactions for the MgH2 and LiBH4 species compensate, at least to a certain degree, the endothermic combination of MgB2 with LiH and H2. However, the reasons behind the single-step absorption and two-steps desorption reactions may not be inferred by thermodynamically considerations alone. In several works, the reaction mechanism of the Li-RHC has been investigated in dynamic conditions [23,26,27,28,29]. In particular, the existence of a ternary specie such as (Mg1−xLi2x)B2, which has been confirmed using nuclear magnetic resonance (NMR) [27,28,29], is an interesting evidence concerning the diffusion processes that are suspected to play a fundamental role in the Li-Mg ion exchange that needs to take place for the reaction to occur at all.
In summary: during absorption the exothermal energy of formation of both MgH2 and LiBH4 and the existence of LiH allow the splitting of the otherwise rather stable compound MgB2 (∆HF = −92.0 kJ mol−1 [22]). Upon desorption, the very energy of formation of MgB2, which is now exothermal because the process is the opposite from above, decreases the reaction enthalpy value that corresponds to the second reaction step, since the first step of this desorption is taken to be a straightforward decomposition of MgH2. The motivation for having separate reaction mechanism for desorption and absorption is almost certainly that kinetic constraints dominate which reactions take place and which don’t, owing mainly to slow diffusion processes [23].
Taking into account the described transfer of thermal energy both for absorption and for desorption, a reaction mechanism is proposed and schematically summarised in Figure 10.
It is possible that concurrent, multiple running steps (overlapped reactions) lead to the measurement procedures used in this study reaching their limits, when used to determine the distinct enthalpy and entropy values of the reaction of LiH with B and H2 (as well as Mg with H2) during absorption. A possible way to circumvent this can be achieved by smaller particle sizes and better contacting of the reacting phases, achieved for instance by nanoconfinement [30,31,32,33].

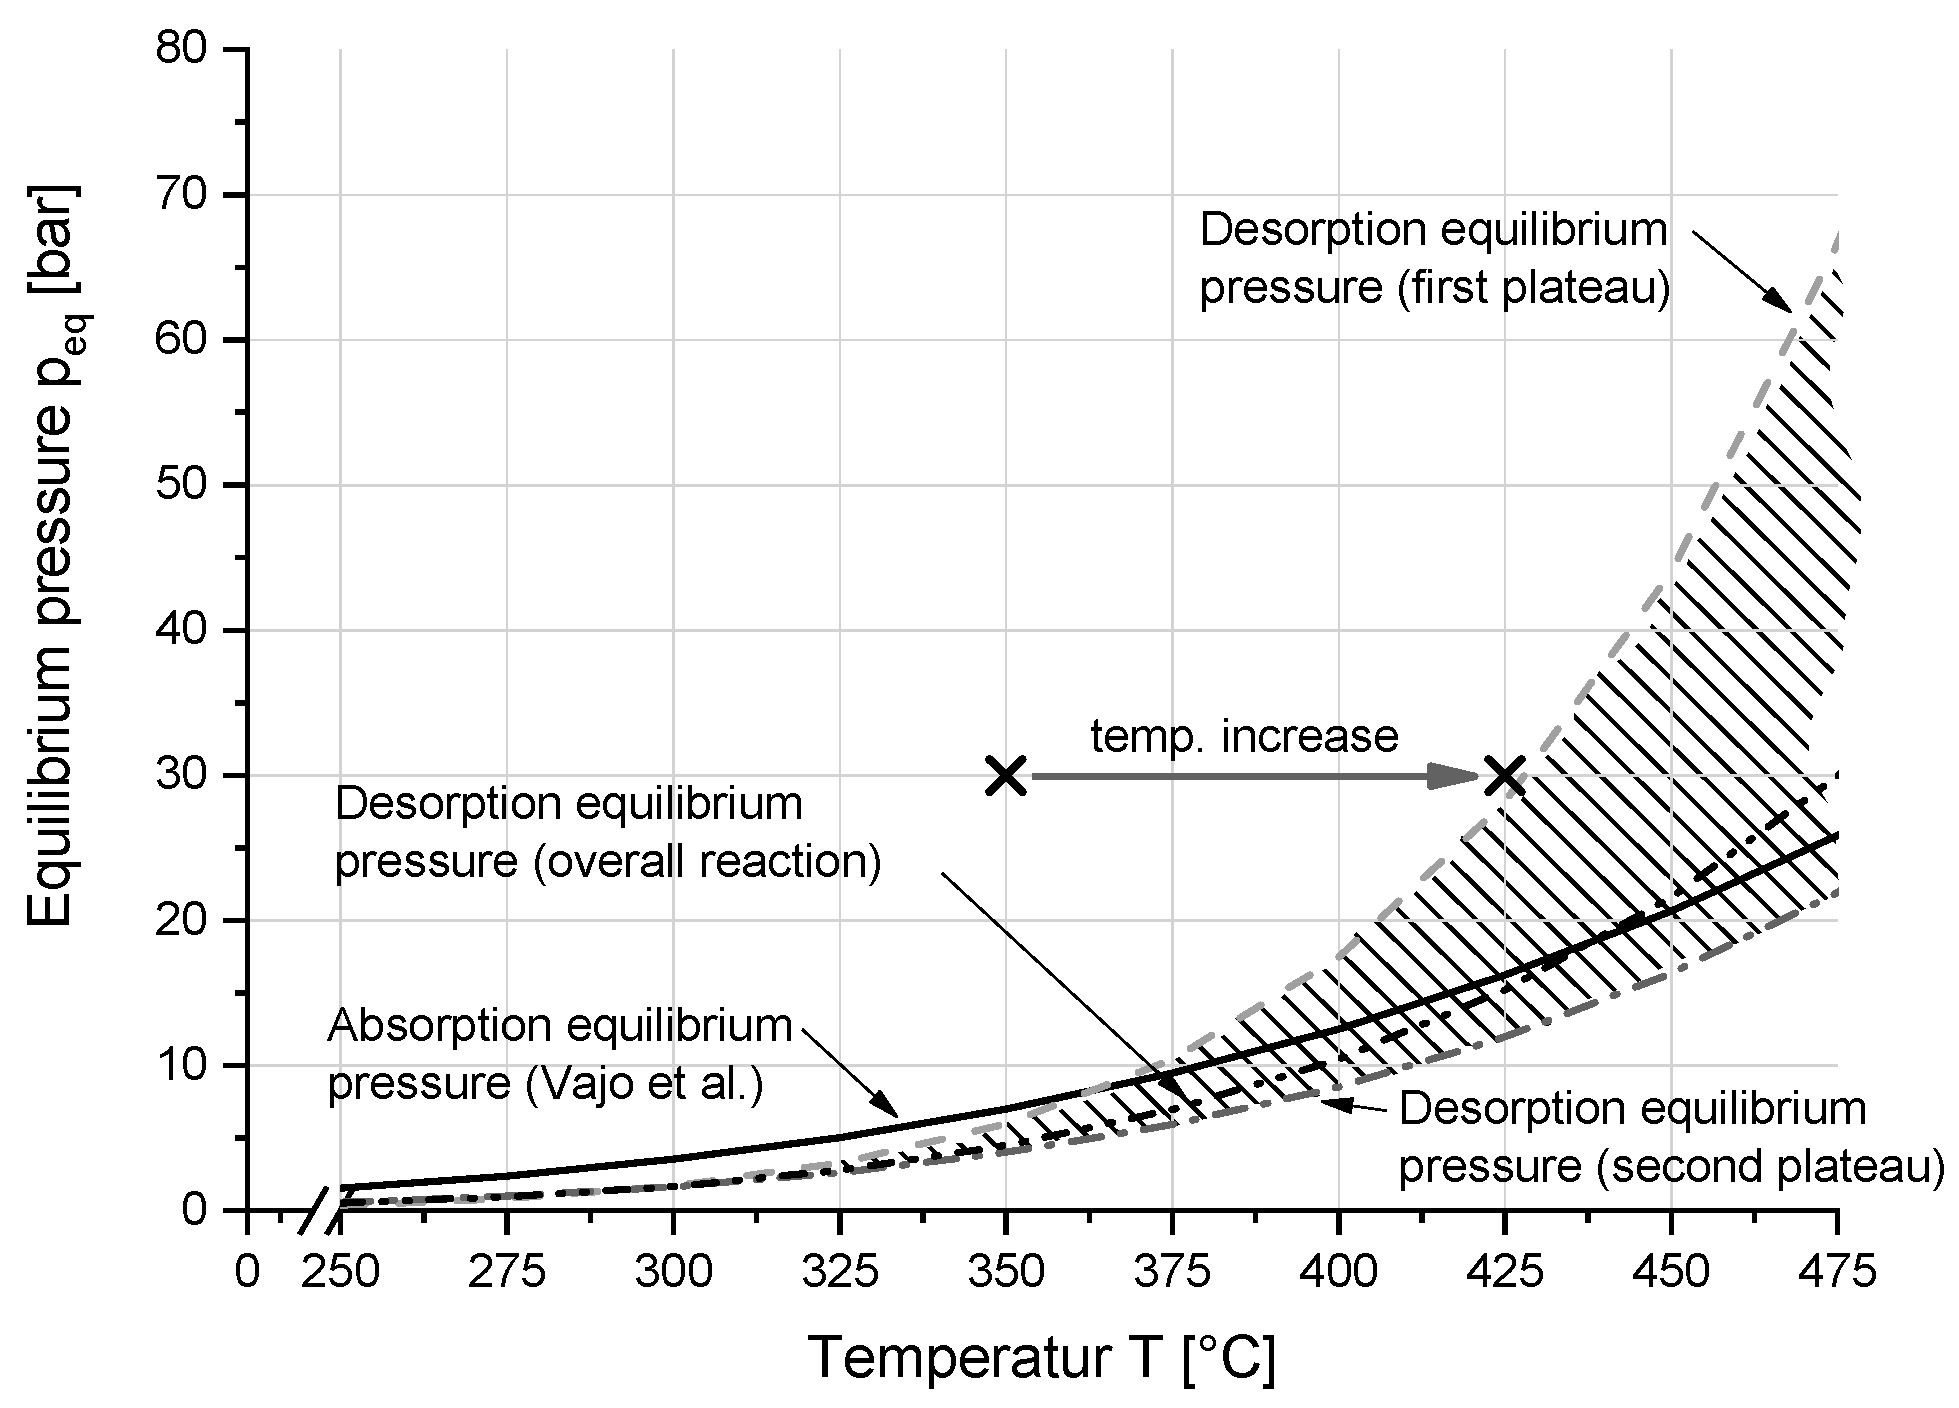
4.2. Thermodynamic Properties

The reaction enthalpy and entropy values obtained by Vajo et al. for the same material as in this study, were −40.5 kJ mol−1 H2 and −81.3 J K−1 mol−1 H2 respectively [34]. They were calculated from PCI measurements under absorption conditions. Those measurements [34] have been carried out in the temperature range from 315 °C to 400 °C. However, in this experiments the material preparation has been slightly altered (milling for shorter time, but at higher speed) [35]. Moreover, the quantity of additive has been 0.06 instead of 0.05 mol of TiCl3 per mol of MgB2 in the present work [34]. Nevertheless, the results should be comparable because the differences are slight and should affect principally (and theoretically) the kinetic behaviour, but not the thermodynamic properties.
For the desorption reaction, the thermodynamic parameters of the “overall reaction” are calculated according to the Hess’s law for the two steps of desorption. For the enthalpy and for the entropy the values of 58 ± 2 kJ mol−1 H2 and 106 ± 4 J K−1 mol−1 H2 are calculated. These values are reported in Table 2 and Table 3 as well as the theoretical ones [22] together with the enthalpy and entropy values for each reaction step as obtained in this work and reported in the literature [34].
Both values for the reaction enthalpy of the absorption, both the one measured by HP-DSC and the one from the PCI (literature), lie below the theoretical value, which is −45.9 kJ mol−1 H2. However, liquid LiBH4 can be formed directly upon absorption since the reaction temperature is clearly above the melting point of this borohydride. Thus the enthalpy of fusion of LiBH4, which is around 4 kJ mol−1 H2 [36,37], is compounded into the calculated enthalpy. The enthalpy of fusion (or melting) of LiBH4 in this case, then, needs to be subtracted from the theoretical value, since this theoretical enthalpy is given at standard conditions of temperature and pressure (STP). The theoretical value ends up being −41.9 kJ mol−1 H2. This values falls in the vicinity of the one calculated by Vajo et al. as described above (−40.5 kJ mol−1 H2) [34], but still not in good agreement with the one obtained here by the coupled measurement (−26 ± 7 kJ mol−1 H2). The same applies for the values measured for both the two steps of the desorption reaction (58 ± 4 kJ mol−1 H2 and 20 ± 3 kJ mol−1 H2). All the values obtained by the measurement method of the coupled Sieverts apparatus with the HP-DSC are, for this system, underestimated of around 15 to 20 kJ mol−1 H2, with respect to the theoretical ones. The reason for this constant difference may lie in the sensitivity of the measurement method [38] and in particular on the underestimation of the peak area, due to the slow reaction kinetics.
The hysteresis, defined as a small difference between the values of the equilibrium pressure as shown in Figure 1 for absorption and desorption, is in the case of the values measured by HP-DSC comparable to other metal hydride systems such as MgH2 [39,40] or NaAlH4 [41]. Schwarz et al. [42] attributed the hysteresis and slope phenomena to the strain and surface tensions between the dehydrogenated and hydrogenated phases. In Figure 1a, the slope of the plateaus can be attributed to two main reason: first, the ideal equilibrium conditions are never reach, and second the strain and surface tensions upon dehydrogenation. The coexistence of two different hydride phases with own equilibrium pressures, as in the case of the Mg-Fe-H hydride system, is another contribution to the hysteresis phenomenon [43,44].
The values obtained for the desorption reaction by PCI are in better agreement with the theoretic values (76.1 kJ mol−1 H2 and 35.8 kJ mol−1 H2 for the first and second reaction step respectively) at least for the first reaction step (73 ± 2 kJ mol−1 H2). The reason for the much higher value of the second step will be discussed later. Furthermore, the entropy values obtained in this work from the PCI-measurement for desorption (134.3 J K−1 mol−1 H2 and 96.3 J K−1 mol−1 H2 for the first and second reaction step respectively) are in good agreement with the theoretic values (132.3 J K−1 mol−1 H2 and 94.8 J K−1 mol−1 H2) as shown in Table 3.
The phenomenon of molecular hydrogen from the gaseous phase going into dissolved hydrogen in the crystal structure of a hydride during absorption and vice versa during desorption dominates the entropy value in most cases with metal hydrides (e.g., Equation (20)). Theoretically, this value is approximately 130 J K−1 mol−1 H2 [22] and thus in good agreement with the measured value of the first reaction step. The measured entropy value by PCI of the second step (96.3 J K−1 mol−1 H2) and for pure LiBH4 evolving into LiH, B and H2 (115 J K−1 mol−1 H2 [45]) is lower. The variance between these reactions, and therefore also a probable reason for the entropy value being lower, is mainly due to the phase transformation of hydrogen from BH4 cluster in liquid phase into the gaseous phase and additionally due to the formation of a different phase (MgB2). The phase transformation of LiBH4 melting is taking place between 280 °C [21] and 300 °C [23] according to literature.
The two measurement methods for this storage system are not in good agreement. The method of the coupled Sieverts apparatus with the HP-DSC machine is confirmed to be a useful device to achieve easily and quickly a reasonable approximation of the thermodynamic properties [38,46]. However, at least for this system the PCI measurement seems to be a more precise measurement method for the calculation of the reaction enthalpy (and entropy). In previous works [47,48,49] dehydrogenation PCIs measurements have provided entropy and enthalpy values that are in quite good concordance with the herein obtained ones.
The two steps reported for the desorption reaction are shown in the following together with the corresponding values obtained for enthalpy and entropy, calculated from the PCI reported in this work:
2 LiBH4 + MgH2 → 2 LiBH4 + Mg + H2
HR ≈ 73 ± 2 kJ mol−1 H2; ∆S ≈ 133 ± 3 J K−1 mol−1 H2
2 LiBH4 + Mg → 2 LiH + MgB2 + 3 H2
HR ≈ 53 ± 3 kJ mol−1 H2; ∆S ≈ 98 ± 4 J K−1 mol−1 H2
The enthalpy and the entropy for the first step of the reaction (Equation (20)) are both in excellent agreement with the values reported for the hydrogenation reaction of MgH2 alone (different theoretical calculation and experimentally derived values are listed in Bogdanovic et al. [39]). The second step (Equation (21)) helps explaining the basilar concept of the RHC. The enthalpy of LiBH4 in the desorption reaction evolving into LiH, B and H2 of approximately 74 kJ mol−1 H2, which was experimentally measured [45,50], is lowered through the exothermic reaction to MgB2 to 53 ± 3 kJ mol−1 H2. However, this value is higher than the theoretical one calculated using the formation enthalpy from the literature [22]. This value amounts to 35.8 kJ mol−1 H2. The reason can be ascribed to the poor characteristic of the second plateau and in particular the slow drop at the end of the plateau. It seems as if the effect of the formation of MgB2 cannot be accomplished in total by this measurement method.
By determining the equilibrium pressures (Equation (2)) in agreement with the PCIs measured in this work, and plotting these equilibrium pressures with the temperature on the x-axis, an area between the two curves corresponding to the first and the second desorption step can be observed (Figure 11). It is assumed that inside this area the reaction cannot proceed at all or only partially. Both the complete absorption or desorption can only happen following Equation (1) above or below this area, respectively. The calculated equilibrium pressure, according to Vajo et al. [34] under absorption conditions, is inside the area marked with diagonal lines in Figure 11 only for temperatures values higher than 362 °C. The overall equilibrium pressure function is also plotted in Figure 11 and results similar to the equilibrium pressure calculated in the mentioned study [34].

4.3. Heat Transfer Properties

As mentioned already in Section 3.2.3, the value of the thermal diffusivity provides information about the temporal and spatial change of the temperature field inside the powder bed. This is because, as stated above, this parameter combines heat capacity and thermal conductivity. They are the determining factor for the distribution of heat inside a hydride powder bed, which is a specific concern for larger volumes. In larger beds of hydrides (and this is in common with other gas-solid reactions where the reaction enthalpy is large), the ratio between the mass of the hydride powder (which normally has a low thermal diffusivity) and the mass of the tank hull (usually high thermal diffusivity) increases. A low thermal diffusivity combined with a great increase in temperature (this, in turn, caused by the high reaction enthalpy of the reactions with hydrogen, both absorption and desorption) can cause the concentration of heat. At these higher temperatures, the equilibrium pressure is also higher, so that for absorption the equilibrium conditions can be easily reached. Under this conditions by definition the reaction rate is zero, so near them the overall reaction rate can slow down dramatically [14]. An example is given in Figure 11: beginning with 350 °C and 30 bar of H2, an increase of just 75 °C can send the system into a situation approaching the equilibrium pressure of the first plateau, therefore slowing the reaction down. A further increase in temperature cannot be reached through the chemical reaction, which stops under these circumstances. This is only feasible providing additional energy from outside. Such an increase would even lead to a detrimental reaction rate: despite the high pressure inside the reaction vessel, there would be a partial dehydrogenation. This leads to the decomposition of MgH2 as it could be seen in the previous section. In this study, the heat transfer characteristics are obtained and the results will be debated in the ongoing section in order to be able to estimate the behaviour of the compound in a large volume.
Two different methods have been used to measure the heat capacity: the “linear temperature ramp” and “enthalpy method” (Section 3.2.1). The discontinuity in the heat capacity as calculated using the “enthalpy method” found its reason in the measurement being interrupted at about 150 °C due to software operative reasons of the measuring rig. Except for this small hitch, the two different experimental techniques are in good agreement.
The heat capacity of 2 LiH + MgB2 is clearly controlled by the heat capacity of MgB2. The average value in the interval from 50 °C to 250 °C for LiH is approximately 4.65 kJ kg−1 K−1 and only 1.2 kJ kg−1 K−1 for MgB2. This means that the hydride has a higher heat capacity by a factor of 3. The mean value for the composite LiH/MgB2 is approximately 1.3 kJ kg−1 K−1. The explanation lies in the higher molar mass of MgB2 (45.93 g mol−1) in comparison to LiH (7.95 g mol−1). In order to maintain the correct molar ratios to achieve the proper reaction conditions, the purely mass ratio is considerably skewed: only about one third of the sample is LiH (~35 wt %).
An ex situ direct experiment as well as an in situ indirect experiment (Section 3.2.2) are used to measure the thermal conductivity. The first measurement type was applied on the hydrogenated state and the dehydrogenated one separately. The second type of measurement was applied on a mixture of both states, since the measurement took place during the reaction. Relatively low mean values were recorded ex situ in a temperature interval up to 180 °C (λØ,abs.state = 0.12 W m−1 K−1; λØ,des.state = 0.09 W m−1 K−1). For comparison, the value recorded in situ (which was, by necessity, obtained in the much higher temperature interval from 335 °C to 365 °C) was λØ,mixed.state = 1.14 W m−1 K−1. It is still quite low as solids go, but represents almost an order of magnitude more than the values registered with the other method. One motivation for the higher values can be the 3 bar of hydrogen pressure in the in situ measurement. There was just 1 bar of argon in the ex situ one and, coincidentally enough, hydrogen has a higher thermal conductivity than argon by one order of magnitude [51]. Note that the in situ approach using the thermocell assumes only conduction in the radial direction; therefore, the axial direction is not contemplated in the model. This may cause problems because the hydrogen does flow axially much faster than radially, as a rule, the axial direction being the route for the hydrogen to go out of the vessel during dehydrogenation. A constant and homogeneous heat generation is also assumed. Not only that, the stationary state assumption leads additionally to consider the density and heat conduction of the powder bed as constants as well. As displayed in Figure 6a, the generation of heat due to the reaction between hydrogen and hydride is almost constant in the period marked in the graph, due to the linear sorption rate. This is the reason for using just this one part of the curve for the calculations However, whether the density of the powder is steady in this period is not clear. It is known that there are differences in density between the desorbed to absorbed state; therefore variations due to the phase transition from one to the other (and vice versa) are to be expected. In this case, the timeframe considered for the calculations of the thermal conductivity is of just 2 min in the first step of a reaction that lasts about 30 min. This should keep the density changes to a minimum. However, the thermal conductivity could need a correction toward lower values, since the number used for the density in the calculations is the one for the desorbed state. In the measured mixed compound, the share of the absorbed state will outweigh since the conversion to the desorbed one is just starting. According to the comparison between the solid densities in a previous publication [25], the loose powder density of the absorbed materials is assumed to be lower than the same parameter for the desorbed state. According to Equation (15), the conductivity is directly proportional to the density. Figure 12 displays the graph of thermal conductivity vs. temperature for several values of powder densities (dashed lines), which can vary also depending on the compaction of the bed, compared to the value used in this study (solid line).
Neglecting the axial heat conduction, which cannot be discounted, may make the measured values for the thermal conductivity even slightly lower.
The change in density is an additional problem for the calculation of the thermal diffusivity, since in this study the calculated temperature interval varies from 100 °C to 350 °C. This range goes over the phase transition temperatures of the LiBH4, which, as will be remembered, goes from orthorhombic to hexagonal at approximately 115 °C. The phase change from solid to liquid, occurring at around 300 °C, is even more important. Although the absolute value for density is far from certain, it is estimated to be constant for the calculation of the thermal conductivity. For the thermal diffusivity, the change with temperature adds a level of uncertainty.
However, the values that have been obtained in this study provide a first approach to tackle the problem of the expected heat distribution as well as its change with temperature. By combining the values shown here with appropriate finite elements method (FEM) simulation, a prediction of the behaviour of such a hydride bed can be accomplished and the need for further improvements of e.g., the thermal conductivity can be ascertained. This improvement could be done through engineering measures taken in the design of the vessel [52]. Also for example, by the addition of materials to improve the thermal conductivity without unduly reducing the capacity or otherwise adversely affecting the behaviour of the hydride, for instance expanded natural graphite [14]. An additional way to achieve improvements in the behaviour of hydrides as hydrogen storage materials is their compaction [25].

5. Conclusions

The reaction mechanism of the Li-RHC system consisting of a single-step hydrogenation and a two-step dehydrogenation has been proved by this study. The explanation furthered by the authors relies on the diverse diffusion processes occurring while absorbing and desorbing H2. This leads to different rate-limiting steps. In case of the first desorption reaction and the corresponding plateau in the PCI diagram (decomposition of MgH2), enthalpy and entropy values of 73 ± 2 kJ mol−1 H2 and 133 ± 3 J K−1 mol−1 H2 are obtained, respectively. The breakdown of LiBH4 with concomitant creation of MgB2 defines the second plateau, for which an enthalpy of 53 ± 3 kJ mol−1 H2 and entropy of 98 ± 4 J K−1 mol−1 H2 are calculated. Both the couples of values are obtained by PCI experiments. In contrast, lower values are retrieved from the coupled measurements using the manometric-calorimetric equipment. They are 58 ± 4 kJ mol−1 H2 for the first and 20 ± 3 kJ mol−1 H2 for the desorption second step, and −26 ± 7 kJ mol−1 H2 for the absorption single step. In general, the reaction enthalpy is underestimated by the measurement method of the coupled Sieverts apparatus with the HP-DSC probably due to the slow kinetics of the involved processes.
The heat capacity of the Li-RHC system results in 1.30 kJ kg−1 K−1, its variation with temperature being quite small. It is clearly controlled by MgB2. At lower temperatures in the range up to 180 °C, the thermal conductivity is, respectively, 0.12 W m−1 K−1 and 0.09 W m−1 K−1 for the absorbed and desorbed state. These values are rather low if compared to 1.14 W m−1 K−1, which is the value obtained at higher temperature values. The presence of hydrogen is a possible explanation for this. In addition, the simplified concept of steady density and the use of the radial conductivity alone when using the equations for the applied measurement methods, contribute to influence the result. The increase of the value calculated for the thermal diffusivity, starting exponentially from about 225 °C, is clearly dominated by the increment of the conductivity. The values before and after this increase, respectively of 0.15 × 10⁻⁶ m2 s−1 and 1.35 × 10⁻⁶ m2 s−1, are relatively low and could slow the overall reaction rate down during the absorption process in a bigger tank system.

Author Contributions

Julian Jepsen and Chiara Milanese conceived and designed the experiments; Benedetto Schiavo performed the experiments to measure the heat capacity; Alessandro Girella and Gustavo A. Lozano supported the measurements of the thermal conductivity by TPS method and thermocell; Stephan Kabelac analyzed the thermodynamic data of the PCI measurement; José M. Bellosta von Colbe, Amedeo Marini, Martin Dornheim and Thomas Klassen contributed by analyzing and discussing the data; Julian Jepsen, Julián Puszkiel and Giovanni Capurso wrote the paper.

Acknowledgments

The authors appreciate the partial financial support of the DAAD (German Academic Exchange Service) in the frame of the Project “VIGONI” and in cooperation with the Ministerio de Educación de la Nación Argentina in the frame of the Sandwich Grant Program “ALEARG” (Grant number A/09/75212), CONICET (Consejo Nacional de Invetigaciones Científicas y Técnicas) as well as the COST Action MP1103 (“Nanostructured materials for solid-state hydrogen storage”).

Conflicts of Interest

The authors declare no conflict of interest.

Nomenclature

SymbolDescription
aThermal diffusivity
c0/c1Constant
cpSpecific heat capacity
CpHeat capacity
HEnthalpy
mMass
nConstant
pPressure
QHeat energy
q ˙ Heat flux (reaction)
rDistance
RGas constant
R2Coefficient of determination
SEntropy
tTime
TTemperature
αTransformed fraction
βHeating rate
λThermal conductivity
ΦHeat flux
ρDensity
Indexes
IndexDescription
0Normal/Initial
bBlank
effEffective
endFinal
eqEquilibrium
FFormation
RReaction
SSample
startInitial

References

  1. Züttel, A.; Borgschulte, A.; Schlapbach, L. Hydrogen as a Future Energy Carrier; WILEY-VCH Verlag: Weinheim, Germany, 2008. [Google Scholar]
  2. BP Statistical Review of World Energy; BP: London, UK, June 2017.
  3. Dornheim, M.; Eigen, N.; Barkhordarian, G.; Klassen, T.; Bormann, R. Tailoring Hydrogen Storage Materials Towards Application. Adv. Eng. Mater. 2006, 8, 377–385. [Google Scholar] [CrossRef]
  4. Schlapbach, L.; Zuttel, A. Hydrogen-storage materials for mobile applications. Nature 2001, 414, 353–358. [Google Scholar] [CrossRef] [PubMed]
  5. Züttel, A. Materials for hydrogen storage. Mater. Today 2003, 6, 24–33. [Google Scholar] [CrossRef]
  6. Sakintunaa, B.; Weinbergera, B.; Lamari-Darkrim, F.; Hirscher, M.; Dogan, B. Comparative study of Hydrogen Storage Efficiency and Thermal Effects of Metal Hydrides vs. Carbon Materials. In Proceedings of the WHEC, Lyon, France, 13–16 June 2006. [Google Scholar]
  7. Dornheim, M.; Doppiu, S.; Barkhordarian, G.; Boesenberg, U.; Klassen, T.; Gutfleisch, O.; Bormann, R. Hydrogen storage in magnesium-based hydrides and hydride composites. Scr. Mater. 2007, 56, 841–846. [Google Scholar] [CrossRef]
  8. Westerwaal, R.J.; Haije, W.G. Evaluation Solid-State Hydrogen Storage Systems; Energy Council of the Northeast: Bedford, NH, USA, 2008. [Google Scholar]
  9. Barkhordarian, G.; Klassen, T.; Dornheim, M.; Bormann, R. Unexpected kinetic effect of MgB2 in reactive hydride composites containing complex borohydrides. J. Alloys Compd. 2007, 440, L18–L21. [Google Scholar] [CrossRef]
  10. Züttel, A.; Wenger, P.; Rentsch, S.; Sudan, P.; Mauron, P.; Emmenegger, C. LiBH4 a new hydrogen storage material. J. Power Sources 2003, 118, 1–7. [Google Scholar] [CrossRef]
  11. Lide, D.R. Handbook of Chemistry and Physics; CRC Press: London, UK, 1994. [Google Scholar]
  12. Siegel, D.J.; Wolverton, C.; Ozoliņš, V. Thermodynamic guidelines for the prediction of hydrogen storage reactions and their application to destabilized hydride mixtures. Phys. Rev. B 2007, 76, 134102. [Google Scholar] [CrossRef]
  13. Jepsen, J.; Bellosta von Colbe, J.M.; Klassen, T.; Dornheim, M. Economic potential of complex hydrides compared to conventional hydrogen storage systems. Int. J. Hydrogen Energy 2012, 37, 4204–4214. [Google Scholar] [CrossRef]
  14. Lozano, G.A.; Eigen, N.; Keller, C.; Dornheim, M.; Bormann, R. Effects of heat transfer on the sorption kinetics of complex hydride reacting systems. Int. J. Hydrogen Energy 2009, 34, 1896–1903. [Google Scholar] [CrossRef]
  15. Delhomme, B.; de Rango, P.; Marty, P.; Bacia, M.; Zawilski, B.; Raufast, C.; Miraglia, S.; Fruchart, D. Large scale magnesium hydride tank coupled with an external heat source. Int. J. Hydrogen Energy 2012, 37, 9103–9111. [Google Scholar] [CrossRef]
  16. Jepsen, J. Technical and Economic Evaluation of Hydrogen Storage Systems Based on Light Metal Hydrides; HZG Report 2014-2; Helmut-Schmidt-University: Hamburg, Germany, 2014. [Google Scholar]
  17. Varin, R.A.; Czujko, T.; Wronski, Z.S. Nanomaterials for Solid State Hydrogen Storage; Springer: New York, NY, USA, 2009. [Google Scholar]
  18. Mettler-Toledo. Measuring Specific Heat Capacity; Mettler-Toledo: Greifensee, Switzerland, June 1998. [Google Scholar]
  19. Gustafsson, S.E.; Karawacki, E.; Khan, M.N. Transient hot-strip method for simultaneously measuring thermal conductivity and thermal diffusivity of solids and fluids. J. Phys. D Appl. Phys. 1979, 12, 1411. [Google Scholar] [CrossRef]
  20. Gustafsson, S.E. Transient plane source techniques for thermal conductivity and thermal diffusivity measurements of solid materials. Rev. Sci. Instrum. 1991, 62, 797–804. [Google Scholar] [CrossRef]
  21. El Kharbachi, A.; Nuta, I.; Hodaj, F.; Baricco, M. Above room temperature heat capacity and phase transition of lithium tetrahydroborate. Thermochim. Acta 2011, 520, 75–79. [Google Scholar] [CrossRef]
  22. Kubaschewski, O.; Alcock, C.B.; Spencer, P.J. Materials Thermochemistry; Pergamon Press: Oxford, UK, 1993; Volume 6. [Google Scholar]
  23. Bösenberg, U.; Doppiu, S.; Mosegaard, L.; Barkhordarian, G.; Eigen, N.; Borgschulte, A.; Jensen, T.R.; Cerenius, Y.; Gutfleisch, O.; Klassen, T.; et al. Hydrogen sorption properties of MgH2-LiBH4 composites. Acta Mater. 2007, 55, 3951–3958. [Google Scholar] [CrossRef]
  24. Baehr, H.D.; Stephan, K. Heat and Mass Transfer; Springer: Berlin, Germany, 2006. [Google Scholar]
  25. Jepsen, J.; Milanese, C.; Girella, A.; Lozano, G.A.; Pistidda, C.; Bellosta von Colbe, J.M.; Marini, A.; Klassen, T.; Dornheim, M. Compaction pressure influence on material properties and sorption behaviour of LiBH4–MgH2 composite. Int. J. Hydrogen Energy 2013, 38, 8357–8366. [Google Scholar] [CrossRef]
  26. Zhong, Y.; Zhu, H.; Shaw, L.L.; Ramprasad, R. Ab Initio Computational Studies of Mg Vacancy Diffusion in Doped MgB2 Aimed at Hydriding Kinetics Enhancement of the LiBH4 + MgH2 System. J. Phys. Chem. C 2010, 114, 21801–21807. [Google Scholar] [CrossRef]
  27. Hu, J.Z.; Kwak, J.H.; Yang, Z.; Wan, X.; Shaw, L.L. Direct observation of ion exchange in mechanically activated LiH + MgB2 system using ultrahigh field nuclear magnetic resonance spectroscopy. Appl. Phys. Lett. 2009, 94, 141905. [Google Scholar] [CrossRef]
  28. Hu, J.Z.; Kwak, J.H.; Yang, Z.; Wan, X.; Shaw, L.L. Detailed investigation of ion exchange in ball-milled LiH+MgB2 system using ultra-high field nuclear magnetic resonance spectroscopy. J. Power Sources 2010, 195, 3645–3648. [Google Scholar] [CrossRef]
  29. Shaw, L.L.; Wan, X.; Hu, J.Z.; Kwak, J.H.; Yang, Z. Solid-State Hydriding Mechanism in the LiBH4 + MgH2 System. J. Phys. Chem. C 2010, 114, 8089–8098. [Google Scholar] [CrossRef]
  30. Gosalawit-Utke, R.; Milanese, C.; Javadian, P.; Jepsen, J.; Laipple, D.; Karmi, F.; Puszkiel, J.; Jensen, T.R.; Marini, A.; Klassen, T.; et al. Nanoconfined 2LiBH4–MgH2–TiCl3 in carbon aerogel scaffold for reversible hydrogen storage. Int. J. Hydrogen Energy 2013, 38, 3275–3282. [Google Scholar] [CrossRef]
  31. Fichtner, M. Properties of nanoscale metal hydrides. Nanotechnology 2009, 20, 204009. [Google Scholar] [CrossRef] [PubMed]
  32. Nielsen, T.K.; Besenbacher, F.; Jensen, T.R. Nanoconfined hydrides for energy storage. Nanoscale 2011, 3, 2086–2098. [Google Scholar] [CrossRef] [PubMed]
  33. Capurso, G.; Agresti, F.; Crociani, L.; Rossetto, G.; Schiavo, B.; Maddalena, A.; Lo Russo, S.; Principi, G. Nanoconfined mixed Li and Mg borohydrides as materials for solid state hydrogen storage. Int. J. Hydrogen Energy 2012, 37, 10768–10773. [Google Scholar] [CrossRef] [Green Version]
  34. Vajo, J.J.; Skeith, S.L.; Mertens, F. Reversible Storage of Hydrogen in Destabilized LiBH4. J. Phys. Chem. B 2005, 109, 3719–3722. [Google Scholar] [CrossRef] [PubMed]
  35. Vajo, J.J.; Mertens, F.; Ahn, C.C.; Bowman, R.C.; Fultz, B. Altering Hydrogen Storage Properties by Hydride Destabilization through Alloy Formation:  LiH and MgH2 Destabilized with Si. J. Phys. Chem. B 2004, 108, 13977–13983. [Google Scholar] [CrossRef]
  36. Züttel, A.; Borgschulte, A.; Orimo, S.-I. Tetrahydroborates as new hydrogen storage materials. Scr. Mater. 2007, 56, 823–828. [Google Scholar] [CrossRef]
  37. Price, T.E.C.; Grant, D.M.; Telepeni, I.; Yu, X.B.; Walker, G.S. The decomposition pathways for LiBD4–MgD2 multicomponent systems investigated by in situ neutron diffraction. J. Alloys Compd. 2009, 472, 559–564. [Google Scholar] [CrossRef]
  38. Rongeat, C.; Llamas-Jansa, I.; Doppiu, S.; Deledda, S.; Borgschulte, A.; Schultz, L.; Gutfleisch, O. Determination of the heat of hydride formation/decomposition by High-Pressure Differential Scanning Calorimetry (HP-DSC). J. Phys. Chem. B 2007, 111, 13301–13306. [Google Scholar] [CrossRef] [PubMed]
  39. Bogdanović, B.; Bohmhammel, K.; Christ, B.; Reiser, A.; Schlichte, K.; Vehlen, R.; Wolf, U. Thermodynamic investigation of the magnesium–hydrogen system. J. Alloys Compd. 1999, 282, 84–92. [Google Scholar] [CrossRef]
  40. Oelerich, W. Sorptionseigenschaften von Nanokristallinen Metallhydriden für die Wasserstoffspeicherung; GKSS: Geesthacht, Germany, 2000. [Google Scholar]
  41. Bogdanovic, B.; Brand, R.A.; Marjanovic, A.; Schwickardi, M.; Tolle, J. Metal-doped sodium aluminium hydrides as potential new hydrogen storage materials. J. Alloys Compd. 2000, 302, 36–58. [Google Scholar] [CrossRef]
  42. Schwarz, R.B.; Khachaturyan, A.G. Thermodynamics of Open Two-Phase Systems with Coherent Interfaces. Phys. Rev. Lett. 1995, 74, 2523–2526. [Google Scholar] [CrossRef] [PubMed]
  43. Bogdanovic, B.; Reiser, A.; Schlichte, K.; Spliethoff, B.; Tesche, B. Thermodynamics and dynamics of the Mg-Fe-H system and its potential for thermochemical thermal energy storage. J. Alloys Compd. 2002, 345, 77–89. [Google Scholar] [CrossRef]
  44. Riktor, M.D.; Deledda, S.; Herrich, M.; Gutfleisch, O.; Fjellvåg, H.; Hauback, B.C. Hydride formation in ball-milled and cryomilled Mg–Fe powder mixtures. Mater. Sci. Eng. B 2009, 158, 19–25. [Google Scholar] [CrossRef]
  45. Mauron, P.; Buchter, F.; Friedrichs, O.; Remhof, A.; Bielmann, M.; Zwicky, C.N.; Zuttel, A. Stability and Reversibility of LiBH4. J. Phys. Chem. B 2007, 112, 906–910. [Google Scholar] [CrossRef] [PubMed]
  46. Cabo, M.; Garroni, S.; Pellicer, E.; Milanese, C.; Girella, A.; Marini, A.; Rossinyol, E.; Suriñach, S.; Baró, M.D. Hydrogen sorption performance of MgH2 doped with mesoporous nickel- and cobalt-based oxides. Int. J. Hydrogen Energy 2011, 36, 5400–5410. [Google Scholar] [CrossRef]
  47. Shao, H.; Felderhoff, M.; Weidenthaler, C. Kinetics Enhancement, Reaction Pathway Change, and Mechanism Clarification in LiBH4 with Ti-Catalyzed Nanocrystalline MgH2 Composite. J. Phys. Chem. C 2015, 119, 2341–2348. [Google Scholar]
  48. Puszkiel, J.A.; Castro Riglos, M.V.; Ramallo-Lopez, J.M.; Mizrahi, M.; Karimi, F.; Santoru, A.; Hoell, A.; Gennari, F.C.; Larochette, P.A.; Pistidda, C.; et al. A novel catalytic route for hydrogenation-dehydrogenation of 2LiH + MgB2 via in situ formed core-shell LixTiO2 nanoparticles. J. Mater. Chem. A 2017, 5, 12922–12933. [Google Scholar] [CrossRef]
  49. Ghaani, M.R.; Catti, M.; Nale, A. Thermodynamics of Dehydrogenation of the 2LiBH4–Mg2FeH6 Composite. J. Phys. Chem. C 2012, 116, 26694–26699. [Google Scholar] [CrossRef]
  50. Filippo, A.; Ashish, K.; Giovanni, C.; Sergio Lo, R.; Amedeo, M.; Giovanni, P. Improvement of dehydrogenation kinetics of LiBH4 dispersed on modified multi-walled carbon nanotubes. Nanotechnology 2010, 21, 065707. [Google Scholar]
  51. Dedrick, D.E.; Kanouff, M.P.; Replogle, B.C.; Gross, K.J. Thermal properties characterization of sodium alanates. J. Alloys Compd. 2005, 389, 299–305. [Google Scholar] [CrossRef]
  52. Kaplan, Y. Effect of design parameters on enhancement of hydrogen charging in metal hydride reactors. Int. J. Hydrogen Energy 2009, 34, 2288–2294. [Google Scholar] [CrossRef]
Figure 1. Pressure concentration isotherms under dehydrogenation conditions at 425 °C, 400 °C, 375 °C, and 350 °C (a) and (b) the resulting van’t Hoff plot for the first and for the second plateaus.
Energies 11 01081 g001
Figure 2. Hydrogen quantity and heat flow signal against sample temperature under 50 bar of H2 in absorption conditions (a) and at 3 bar of H2, in desorption conditions (b).
Energies 11 01081 g002
Figure 3. Temperature and heat flow in the range between 50 °C and 250 °C for 2 LiH + MgB2 in Ar atmosphere using the “linear temperature ramp” method at 5 °C min−1 (a) and the “enthalpy method” (b).
Energies 11 01081 g003
Figure 4. Graphs displaying cp, the specific heat capacity, vs. temperature. Both the data acquired using the “linear temperature ramp” with a rate of 5 °C min−1 (full circles) and the “enthalpy method” (hollow circles) for 2 LiH + MgB2 under Ar atmosphere (a); the data set plotted with other hydride values, for comparison (b).
Energies 11 01081 g004
Figure 5. Thermal conductivity plotted against temperature from room temperature to 175 °C in Ar atmosphere for materials in absorbed (LiBH4/MgH2) and desorbed (LiH/MgB2) state together with an extrapolation for T > 175 °C.
Energies 11 01081 g005
Figure 6. Temperature profiles and hydrogen content inside the hydride powder bed for desorption starting at 360 °C and 3 bar H2 (a) and the temperature profile relative to distance from the centre (b).
Energies 11 01081 g006
Figure 7. Effective thermal conductivity over temperature recorded in situ with a thermocell, at high temperatures in H2 atmosphere.
Energies 11 01081 g007
Figure 8. Variation of the thermal conductivity with increasing temperature measured ex situ by TPS method at elevated temperature (up to 180 °C under Ar) and in situ by thermocell at even higher temperatures (up to 360 °C in H2 atmosphere).
Energies 11 01081 g008
Figure 9. Evolution of the thermal diffusivity with temperature for the material in desorbed state (2 LiH/MgB2), assuming a constant density.
Energies 11 01081 g009
Figure 10. Schematic reaction mechanism proposed for the single-step absorption and the two-step desorption processes.
Energies 11 01081 g010
Figure 11. Equilibrium pressure for the two plateaus of the desorption reaction of the Li-RHC system estimated with the PCI measurements in desorption conditions as well as overall reaction of both and the curve determined by Vajo et al. [34] in absorption conditions.
Energies 11 01081 g011
Figure 12. Thermal conductivity measured at different temperature for several densities, calculated under H2 atmosphere with the in situ measurement technique.
Energies 11 01081 g012
Table 1. Parameters for the polynomial fit, according to Equation (8), of cp (in J K−1 mol−1) for different materials.
Material/CompositeA × 100B × 103C × 103D × 10−5Temp. RangeReference
LiH16.4052.720−2.93-[22]
LiBH423.479543.9−0.7885−30.125–81 °C[21]
LiBH4−29,738.586107,620−108.786724.681–113 °C[21]
LiBH4−494.0681594−1.13205113–280 °C[21]
MgB249.7922.720−7.61-[22]
MgH227.249.370−5.86-[22]
2 LiH + MgB2114.63-35.190−32.250–250 °Cthis study
Table 2. Comparison of the reaction enthalpy ΔHR values of the Li-RHC system obtained from different sources.
ΔHR [kJ mol−1 H2]AbsorptionDesorption
-1st Step2nd StepOverall Reaction
PCI- *73 ± 253 ± 358 ± 2
HP-DSC−26 ± 758 ± 420 ± 329 ± 3
PCI literature (Vajo et al. [34])−40.5- *- *- *
Theoretic value [22]−45.976.135.845.9
* not measured.
Table 3. Comparison of the entropy ΔS values of the Li-RHC system by different sources.
ΔS [J K−1 mol−1 H2]AbsorptionDesorption
-1st Step2nd StepOverall Reaction
PCI- *133 ± 398 ± 4106 ± 4
PCI literature (Vajo et al. [34])−81.3- *- *- *
Theoretic value [22]−104.2132.394.8104.2
* not measured.

