1. Introduction
At present, lithium ion batteries (LiBs) are widely used in electric vehicles (EVs) due to their high specific power and energy [
1]. In these EV applications, the core task of the battery management system (BMS) is the estimation of the lithium battery health status (SOH) and state of charge (SOC). [
2,
3]. In order to achieve accurate SOC and SOH estimation, the capacity of the battery plays a significant role. For instance, the most used SOH indicator in the literature is defined by the capacity loss rate [
4]. This definition is also widely used by automobile manufacturers. A battery for EVs is considered inappropriate when its nominal capacity is less than about 80% of its initial capacity [
5]. In addition, the battery capacity can affect SOC estimation by changing the dependencies between the SOC and the open circuit voltage (OCV). A simple battery circuit model with a modified OCV-SOC relationship has been proven to be effective and accurate in SOC estimation [
6,
7].
Recently, a large number of research approaches have been proposed to estimate battery capacity. The electrochemical method can accurately detect battery capacity [
8]. However, it is hard to provide a real-time reference in the electric vehicle because it requires complex detection technology. Another widely used method is the coulomb counting method, which can estimate battery capacity by the simple current integration over time [
9]. The disadvantage of this method is that it requires counting under the same conditions each time, such as the same external temperature. In addition, this method cannot avoid cumulative error and is not suitable for online estimation. As an artificial intelligence algorithm, neural network (NN) is also used to predict the capacity of a battery [
10]. This method enables real-time capacity evaluation by relying on simple input data, such as voltage and current. However, a sufficient amount of data needs to be collected if this method is used. Moreover, battery model-based dual/joint Kalman filters method can estimate the LiBs capacity and SOC concurrently [
11,
12]. This method can obtain an accurate SOC but the accuracy of the estimation of capacity cannot be guaranteed. This is because the battery voltage is the only measurable data in this approach and the battery capacity is weakly linked to this voltage. Furthermore, the literature [
13,
14] proposes an SOC and SOH method based on updating battery impedance parameters. This method is suitable for single cell batteries and battery packs. However, this method requires a constant current discharge within a certain SOC range, which presents some difficulties in practical use.
In this work, we propose a new battery capacity estimation method. Relative to the battery voltage, the battery internal resistance often shows a higher correlation with the capacity. For instant, the decrease in capacity is often accompanied by an increase in internal resistance in the aging process of batteries. At the same time, the online internal resistance measurement is easier to achieve than capacity detection. All of this information provides a strong guideline for determining the capacity through internal resistance. In a previous literature report, the battery internal resistance can be accurately measured by electrochemical impedance spectroscopy (EIS) [
15], but this detection method is too complicated to be suitable for online detection. In addition, the pulse discharge method is a commonly used detection method [
16], but the pulse time of this method is in units of seconds and cannot accurately obtain the battery internal resistance when the battery is loaded. In this paper, the battery internal resistance is measured using the direct current short-pulse (DCSP) method [
17]. This short pulse measurement method can accurately measure the internal resistance of the battery when the battery loads current changes. Moreover, the capacity calibration is performed by the constant current-constant voltage (CC-CV) charge and discharge test. After establishing the relationship between these two parameters by linear fitting, the capacity result obtained by the internal resistance measurement is proved to be effective in the SOC estimation by experiments.
2. Internal Resistance Measurement
In order to study the characteristics of the battery internal resistance, the equivalent circuit model (ECM) needs to be established. This model is also fundamental to battery parameters estimation, such as SOC and SOH.
Figure 1 shows one of the most widely used equivalent circuit models. In this equivalent circuit model, a lithium battery is considered as a circuit consisting of a DC power supply, an ohmic resistor, and a resistor/capacitor network in series. Here, the voltage value of the DC power supply (
ε) is equivalent to the OCV. The ohmic resistance (
Ri) in the model is the DC internal resistance of the battery. This parameter shown in previous studies is closely related to the SOC, temperature, and life of the battery [
17]. In addition, Reference [
6] indicates the model voltage estimation, shown in Equation (1). The calculation of cell equilibrium potential here depends on the modified OCV-SOC curve, which is determined by the battery nominal capacity (
Q). Therefore, the accuracy of the battery capacity in this model is significant because it will influence the battery parameter estimation through the OCV-SOC relationship.
It is not easy to test battery capacity directly, while the detection of internal resistance is much simpler. For example, the battery internal resistance can be easily obtained by the direct current internal resistance (DCIR) method or the hybrid pulse power characterization (HPPC) method [
18,
19]. However, these traditional internal resistance detection methods are not suitable for online measurement applications because the trigger condition is too complicated. Compared with these internal resistance measurement methods, the DCSP method in this work is not only simple but also easy to implement in real time.
A real-time internal resistance detection device is shown in
Figure 2a. The device triggers a controlled short discharge at the battery terminal by adding a pulse discharge loop between the battery electrodes. The pulse discharged current value is controlled by the current source (
I) in the circuit, and the pulse time is determined by the switch (
K) in the circuit. Since the internal resistance of the battery is generally only a milliohm-class parameter, the detection device needs to generate a discharge response voltage that can be accurately measured through a large discharge current. At the same time, a large discharge current can counteract the interference of the battery load in the measurement. In addition, the whole measurement circuit cannot make a great impact on the battery. The pulse time here is very short, to ensure that the battery power does not change significantly during the detection process. All discharge, switch, and voltage detection processes in the device are managed by the microcontroller unit (MCU). The experimental setup is shown in
Figure 2b. The battery used in the experiment was a Panasonic NCR18650B (Panasonic, Osaka Prefecture, Japan). From the manufacturer’s battery manual, its nominal voltage is 3.6 V and its minimum rated capacity is 3200 mAh at 20 °C. The battery load and detection device are connected in parallel across the battery. The electronic load used here was ITECH IT8512B+ (ITECH, Nanjing, China). The internal resistance detection device uses self-made DCSP testing equipment. The electronic load and test equipment are connected to the computer via a serial interface. Experimental data are transmitted to the computer via these serial ports for storage. In the self-made internal resistance detection device, the pulse switch
K is implemented with a high-current high-speed MOSFET. Voltage detection and current control in the device are implemented using the 12-bit ADC and DAC blocks in the same MCU (STM32F103, STMicroelectronics, Geneva, Switzerland).
In the internal resistance test, not only can the discharge pulse width be adjusted, the discharge current can also be controlled by the MCU. Changes in the battery voltage caused by the controlled pulse discharge can be observed by an oscilloscope (
Figure 2c). The oscilloscope model used in the experiment was the RIGOL DS1102E (RIGOL, Beijing, China). After the pulse discharge switch is turned on, the detection device uses two currents of 5 A and 10 A to discharge. The battery voltage appears to be changed for the two discharge currents, which are illustrated by the two voltage step signals (A and B) appearing in
Figure 2c. The difference between the two voltage steps is the internal resistance response to the difference between the discharge currents. The internal resistance of the battery can be obtained by differential voltage and controlled current difference.
In this paper, the internal resistance of the battery is observed at different SOCs by using the DCSP approach.
Figure 3a shows the internal resistance measurement results for four fresh 18650 batteries at room temperature. The cells in the experiment belong to the same batch of Panasonic NCR18650B batteries. All samples were discharged at a 0.5 C-rate from 100% SOC to 0 SOC in the test. The test results show that the difference in internal resistance of the same batch of new batteries can be distinguished by the DCSP method.
Further, the internal resistance of different aging battery samples was detected by this method. In order to obtain different aging batteries, sample cells were cycled continuously at a 1 C-rate between 2.5 V and 4.2 V at 25 °C. In
Figure 3b, we tested the batteries with cycles 0, 200, 400, 600, and 900. The results indicate that the internal resistance measurement achieved by the DCSP approach can also effectively differentiate between aging batteries.
The advantage of the DCSP method is that the short pulse technique is well suited for online resistance monitoring. The above internal resistance detection is implemented at the same time as the battery load is discharged. Short pulse detection current and battery load current are divided into two current loops after passing through the battery. The pulse detection circuit can ensure the accuracy of battery internal resistance as long as the battery voltage does not fluctuate greatly with the load current in the test. In practical applications, battery voltage oscillations caused by external loads can affect the internal resistance detection accuracy. However, this can be effectively improved by reducing the pulse time and increasing the pulse current in the device.
3. Correlation between Internal Resistance and Capacity
The aging of lithium batteries is often accompanied by the loss of capacity and the increase of internal resistance [
20]. Studying the correlation between internal resistance and capacity facilitates the conversion between these two parameters. In order to study this correlation, we investigated the variation in battery capacity and internal resistance.
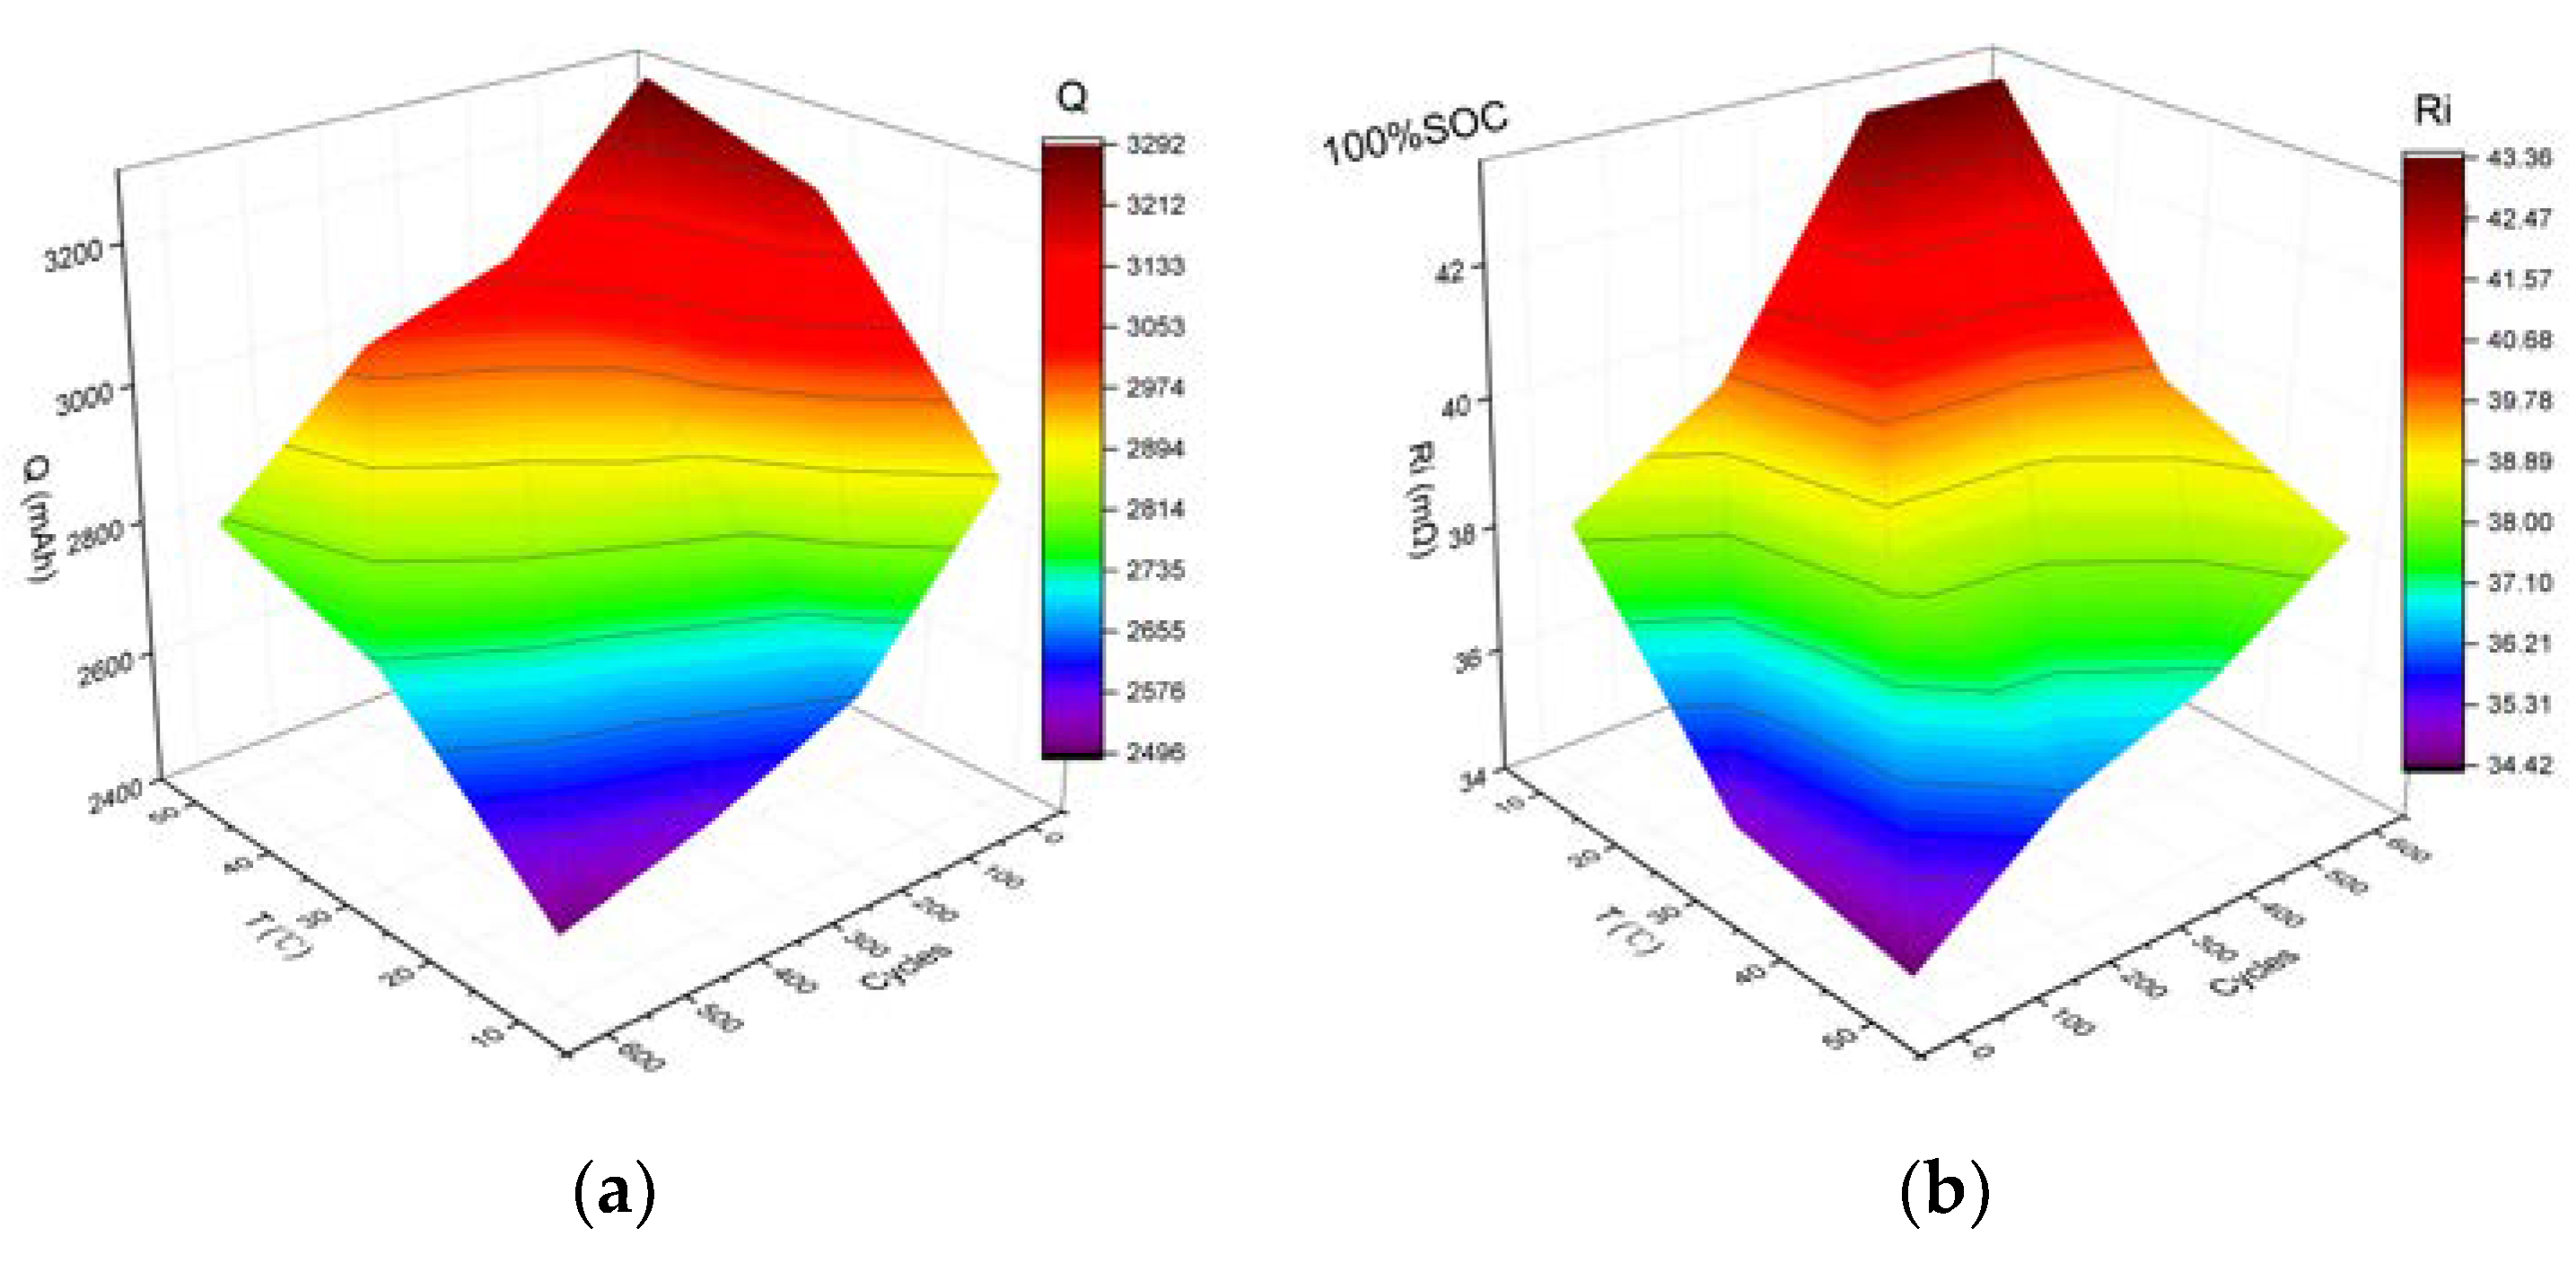
The capacity of different aged battery samples was tested under the selected temperature environment. The nominal capacity (
Q in
Figure 4a) was measured by the constant current (CC) discharging method with coulomb counting.
Figure 4a shows the capacity change with battery life and temperature. The experiment results indicate that the value of
Q of LiBs decreases monotonically with the decrease of battery life at a specific temperature. On the other hand, a value of
Q with a certain battery lifetime drops with the decrease of the test temperature.
In addition, the internal resistance was measured by the DCSP method in this discharge process for all battery samples. As the value of internal resistance also changes with SOC, here we only use a fixed SOC value, for example 100% SOC in
Figure 4b. This internal resistance shows the opposite variation characteristics compared with the capacity. At a given temperature, the value of
Ri was found to increase as the battery aging increased. On the other hand, this resistance also rose when the temperature decreased for every battery sample.
Comparing
Figure 4a and b, it can be found that the internal resistance and the capacity are both related to battery life and external temperature. At the same time, the internal resistance and capacity changes have their own laws, which can be verified from the capacity lines and internal resistance lines in
Figure 4a,b. This provided a foundation for study of the correlation of the two parameters.
Correlation is a non-deterministic relationship, and the correlation coefficient is the amount of linear correlation between research variables. The correlation coefficient expression is described in (2). Here, Cov(X,Y) is the covariance of X and Y, and Var[X] and Var[Y] are the variance of X and the variance of Y, respectively. The correlation coefficient r can be used to indicate the linear relationship between two variables. The range of r is from −1 to 1. A positive correlation is indicated when r is positive, and a negative correlation is indicated when r is negative. If the absolute value of r tends to 1, it means that there is a highly linear relationship between the two variables.
The relations between various battery parameters can be found through this correlation research [
21,
22], which can thus be used to establish the algorithm model to estimate the SOC and SOH of a battery. According to the internal resistance and capacity analysis results, the battery parameters selected in this paper include: voltage, internal resistance, temperature, capacity, SOC, and cycles. The correlation between battery parameters is shown in
Table 1. Highly correlated parameters of the battery parameters facilitate the induction method to create a simple and accurate predictive model. For instance, a high correlation between the battery voltage and SOC indicates that voltage is an indispensable factor in the SOC estimation model.
In the experiment, we first studied the correlation between capacity and battery life (cycles), as well as the correlation between internal resistance and battery life (cycles). Since one of the two correlations is a positive correlation and the other is a negative correlation,
Figure 5 uses the absolute value of the correlation to compare them. Then, the correlation between internal resistance and capacity was also investigated via experimental tests. The experimental data include both full-range SOC samples and fixed-point SOC (100%) samples.
The correlation analysis of the test data revealed the following results. First of all, the correlation between capacity and battery life is higher than the correlation between internal resistance and battery life. This shows that under the same conditions, the capacity is more suitable than the internal resistance as a parameter for battery life prediction. Second, the determined external temperature helps to increase these two correlations. This indicates that battery life estimation at a fixed external temperature can often lead to higher accuracy. Third, there is a high degree of correlation between capacity and internal resistance. This provides a basis for capacity estimation through internal resistance testing. Finally, the correlation between internal resistance and capacity is improved when the SOC is fixed. For instance, when the battery is fully charged, the internal resistance without SOC change can show a high degree of correlation with the capacity.
4. Linear Fitting Application
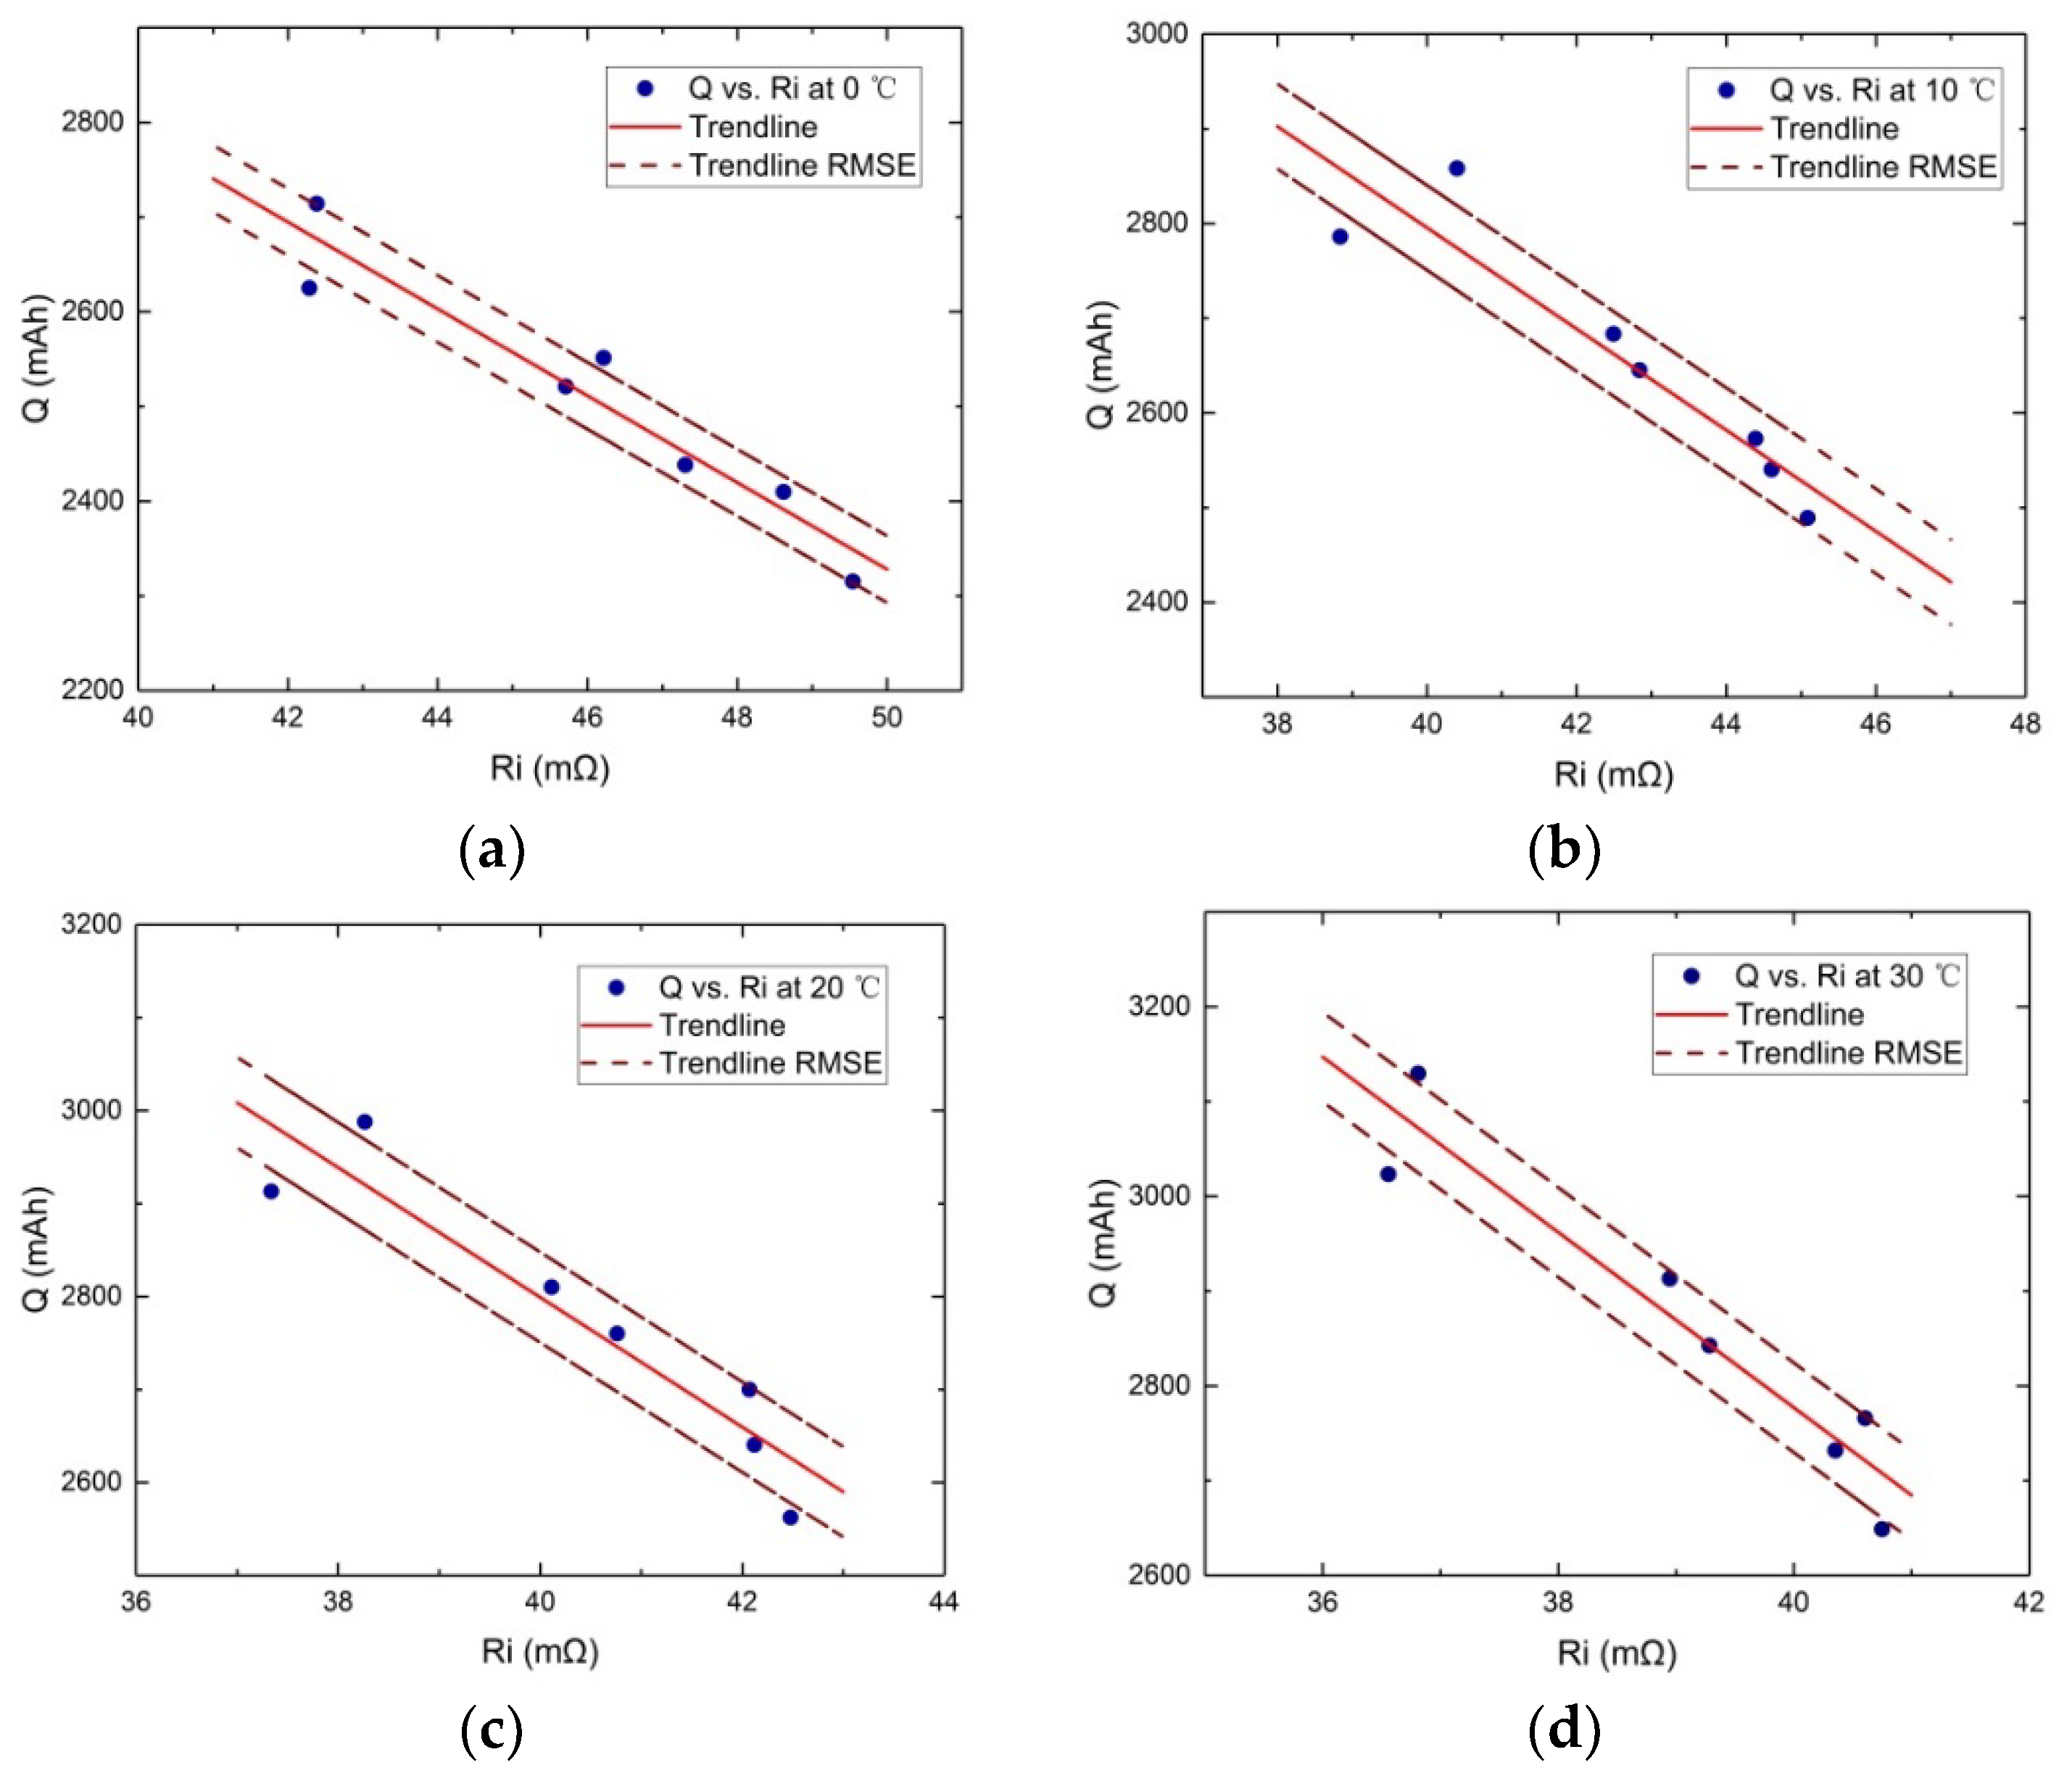
Through the above correlation analysis, it can be found that the internal resistance and capacity have a strong correlation under certain conditions, such as fixed temperature and SOC conditions. This strong correlation lays the foundation for building a bridge between internal resistance and capacity. In this work, we establish this connection by means of linear fitting.
Figure 6 shows the linear fit of internal resistance and capacity at different temperatures. The sample battery here contains different battery lifecycles (0, 100, 200, 300, 400, 500, and 600). The SOC of the sample battery is 100%. This fully charged state of battery is also a state that is easy to achieve and recognize in the actual applications. The empirical formula of internal resistance and capacity can be obtained by linear fitting. The general form of the formula is as follows:
Here, Q indicates the battery capacity, Ri indicates the internal resistance of the fully charged battery, and p1 and p2 are the linear fitted coefficients. These results show that at the same temperatures, the battery capacity and internal resistance have a good linear relationship. This also proves that it is feasible to obtain the capacity by detecting the internal resistance with the DCSP method.
5. Fitting Capacity Application in SOC Estimation
Accurate estimation of battery SOC is the main function of a BMS. The extended Kalman filter (EKF) algorithm based on the ECM is a widely used SOC online estimation method [
23]. In the ECM (as Equation (1)), the OCV-SOC relationship changes with the battery capacity. Here, the battery capacity acquired through the internal resistance fitting method is brought into the EKF calculation for SOC estimation.
In the experiment, the discharge tests of the battery were carried out under the current profile shown in
Figure 7. Here, the discharge current uses pseudo-random processing to simulate the actual environment. The lithium-ion batteries used were 18650-type with a nominal capacity of 3200 mAh. A fresh battery and a battery aged by 600 cycles were used as experimental samples. The battery samples were discharged at 10 °C and 50 °C, respectively. The difference in test temperature and battery life leads to a difference in the capacity of these battery samples. According to a previous theory, the difference in capacity will affect the accuracy of the SOC evaluation through the SOC-OCV relationship.
Then, the EKF algorithm was applied to estimate the battery SOC. In fact, all parameters in the battery model (
Figure 1) should be functions of the SOC or SOH [
13,
14]. Here, we set the other parameters in the model, such as
Ri,
Rp, and
Cp, as constants to highlight the impact of the nominal capacity on the SOC estimation. These constants in the EKF algorithm were set to the initial parameters of the fresh battery. In order to study the influence of the capacity on the SOC estimation, the OCV-SOC relationships of the fixed capacity and the fitting capacity were respectively used in the EKF evaluation. The fixed capacity here uses the nominal initial capacity of the battery (3200 mAh). The fitting capacity was obtained from the fitting curve (in
Figure 6) and the fully charged cell internal resistance.
Figure 8 shows the SOC estimation results for three different capacities. When the battery capacity changes due to factors such as temperature and aging, there is a larger estimation error with the fixed battery’s initial nominal capacity. At same time, if the fitting capacity is used to adjust the OCV-SOC relationship in the model, better accuracy can be obtained under the same EKF algorithm.
Table 2 gives an error analysis of the SOC obtained using fixed capacity and fitted capacity. When the battery capacity changes due to the aging of the battery and the ambient temperature, the fixed capacity can result in an approximately 10% SOC error. While the fitting capacity SOC error is effectively controlled within 1.5%.
The application of linearly fitted capacity in SOC estimation has the following advantages. First of all, it is easy to achieve the corresponding capacity through internal resistance detection. The DCSP device can be easily integrated into an EV’s BMS. Second, the capacity obtained by the linear fitting here comes from the internal resistance of the battery that is strongly correlated with the capacity, rather than the weak correlation voltage in the dual/joint Kalman filters method. This guarantees the accuracy of the capacity. Finally, the SOC estimation by fitting capacitances can streamline the estimation algorithm. This is helpful for the real-time estimation of a large number of batteries.


