Design Optimization of a Complex Polygeneration System for a Hospital


Department of Energy Technology, KTH Royal Institute of Technology, 100 44 Stockholm, Sweden
*
Author to whom correspondence should be addressed.
Energies 2018, 11(5), 1071; https://doi.org/10.3390/en11051071
Submission received: 11 February 2018
/
Revised: 19 April 2018
/
Accepted: 19 April 2018
/
Published: 26 April 2018
Abstract
:Small-scale decentralized polygeneration systems have several energetic, economic and environmental benefits. However, using multiple energy sources and providing multiple energy services can lead to complicated studies which require advanced optimization techniques for determining optimal solutions. Furthermore, several parameters can influence the design and performance of a polygeneration system. In this study, the effects of heat load, renewable generation and storage units on the optimal design and performance of a polygeneration system for a hypothetical hospital located in northern Italy are investigated. The polygeneration system shows higher performance compared to the reference system, which is based on the separate generation of heat and power. It reduces fuel consumption by 14–32%, CO2 emissions by 10–29% and annualized total cost by 7–19%, for various studied scenarios. The avoided fuel and electricity purchase of the polygeneration system has a positive impact on the economy. This, together with the environmental and energetic benefits if the renewable generation and use of storage devices, indicate the viability and competitiveness of the system.
1. Introduction
Residential and commercial buildings consume about 20% of the total useful energy delivered to end users [1] and about 31% of primary energy consumption worldwide [2]. In the International Energy Outlook 2016 (IEO2016) reference case, this consumption is predicted to increase by an average of 1.5% worldwide annually from 2012 to 2040 [1]. In Europe, half of total final energy consumption is used for heating and cooling purposes. 45% of this energy is utilized in the residential sector, and 37% and 18% in to the industrial and service sectors, respectively [3].
Due to the relatively high share of energy utilization in the building sector, there is a significant potential for fossil fuel consumption reduction. This, accordingly, can mitigate the negative environmental and societal impacts of fossil fuel consumption. One of the alternative solutions to reduce energy consumption in this sector is the implementation of small-scale polygeneration energy systems.
Simultaneous production of heating, cooling and power in a combined cooling heating and power system (CCHP), also called polygeneration, results in higher overall efficiency in comparison with the separate heat and power production [4]. Furthermore, having the energy supply system close to end users offers several other advantages such as lower distribution and transmission cost, less power loss through the transmission and distribution line, alleviated environmental impacts, and enhanced resilience of the utility grid [5,6,7].
Several aspects of polygeneration systems including design, optimization, performance evaluation, decision-making variables and benefits achieved are addressed in comprehensive reviews [6,8]. Mancarella et al. studied the status of existing models and evaluation methods for performance investigation of multi-energy systems (MES) [9]. A complete overview of MES considering various perspectives was provided. Jana et al. presented the status of polygeneration technologies and their capacity to provide a sustainable energy solution [10]. This study highlighted the necessity to conduct more research on multi-criteria optimization of polygeneration systems. Furthermore, the incorporation of innovative storage and generation units in complex polygeneration systems were suggested. A short review on optimization of polygeneration systems in urban applications was presented by Ghaem Sigarchian et al. [11]. The study emphasizes the necessity of further investigation on complex polygeneration systems to achieve results as close as possible to reality.
Small-scale polygeneration systems have been the focus of various studies. The results demonstrated their energetic, economic and environmental benefits and drawbacks. An advance polygeneration system consisting of an absorption chiller (17 kW cooling capacity) and a micro gas turbine (28 kW electric and 60 kW heating capacity) was investigated through an experimental setup by Moya et al. [12]. The techno-economic performance of the system for a medium-sized hotel and a large residential building in Barcelona was investigated. The payback periods for the large residential building and medium-sized hotel were estimated to be six years and 10 years, respectively. However, the primary energy saving relative to the conventional separate heat and power generation was not attractive.
Performance of a hybrid power system for an identical building in different climates in Spain was investigated by Romero Rodríguez et al. [13]. The system achieved higher benefits in terms of energy and environment compared to the separate heat and power generation, while the economy of the system was relatively poor. An innovative polygeneration system consisting of solar power and thermal units, concentrating parabolic trough (CPVT), an absorption chiller, a desalination system and a biomass heater was investigated by Calise et al. to cover the demand of an isolated community [14]. The results showed that a larger solar field area resulted in a higher exergy efficiency. In general, in the proposed polygeneration system the economy and exergy efficiency were improved.
The benefits of polygeneration systems can be maximized through the correct sizing and operating strategy of a system [4]. Therefore, optimization of polygeneration systems has been explored by many researchers. An optimization model using the non-dominated sorting genetic algorithm II (NSGA-II) for size optimization of a solar-assisted polygeneration system was developed by Yousef et al. [15]. The model aimed to identify the optimal solution with the lowest cost and fossil fuel consumption. The results showed the performance of the CCHP system was significantly better than an internal combustion-driven energy system in terms of energy and emission reduction while the net present cost was increased slightly. Optimization of a complex polygeneration system using exergy analysis was performed by Di Somma et al. [16]. The results showed 21–36% of reduction of primary exergy input compared to separate heat and power generation. A Pareto frontier of the results provided information for the planners to choose a balancing solution considering both sustainability and economy.
P. Arcuri et al. used a mixed integer programming model for optimal planning and energy management of a hospital [17]. The results emphasized the importance of the optimization in achieving higher energetic, economic and environmental benefits. A genetic algorithm (GA) was used for optimizing a polygeneration system for a residential and an office building in China by Li et al. [18]. The implementation of the system in the office building attained higher performance in comparison with the residential building. Rubio-Maya et al. presented an optimization method to optimize a small-scale polygeneration system for a tourist center located in Spain [19]. The result of this study showed the economic and environmental advantages of implementation of a polygeneration system. For example, a primary energy saving of 18% was reported for the case study.
In spite of the available research, more investigation on complex polygeneration systems is required to overcome the shortcomings in the literature. Models including all the critical components such as cold storage, thermal chiller, photovoltaic (PV) modules, solar thermal units and batteries require further development with more realistic assumptions. Adding these components to a conventional combined cooling, heating and CCHP system create complexity. Therefore, identifying how the integration of these components can influence the performance of the system in terms of energy, economy and environment is critical. Moreover, the outcome of such studies can identify the role of adding innovative components in such a complex system.
A novel method for optimization of complex polygeneration systems is proposed by the authors in previous studies [11,20]. The model considers the interaction of several generation (electricity, heating and cooling) and storage units (cold, hot and battery) including the critical components mentioned in the previous paragraph. Similar studies are missing one or more of the components that are of interest. Multiple energy sources including renewables and non-renewables are aslo included. Moreover, the effect of part-load operation and outdoor temperature on the power output and efficiency of the combined heat and power (CHP) system are considered. This is often omitted for simplification purposes in optimal design of complex polygeneration systems. Moreover, the effect of size on the cost of the electric and thermal chillers and CHP units are taken into account for optimization search space. The purpose of the model is to optimize a semi self-sufficient polygeneration system, which maximizes the use of renewable energy and minimizes fossil fuel consumption. Hence, utilization of renewable heat and power are given priority in the operating strategies. The grid has a balancing role and participating in the day-ahead market and maximizing the profit by generating excess power for merely trading in the power market is beyond the scope of this work. The method, details of the optimization model and operating strategies are available in the method paper [11] and a case study focused on the evaluation of operating strategies [20]. However, a general overview of the method including the main principles of the optimization process, operating strategies and performance evaluation method are presented in this paper.
Amongst the possible applications of polygeneration systems, end users with simultaneous heating, cooling and power demands and with a relatively stable load profile (such as industries or hospitals) are very attractive [21,22,23]. On the other hand, hospital loads are considered as critical, which require high self-sufficiency in the case of a power outage. Therefore, in this study, the optimal design of a polygeneration system for a hypothetical hospital is identified and its performance in terms of energy, economy and environment has been investigated. In order to explore the effect of heat demand and its fluctuations on the performance of the system, two different types of load are investigated. Moreover, for investigating the effect of adding thermal chiller, cold storage, PV panels, solar heating units, batteries and wind turbines on the performance of the system, three design scenarios are investigated. Furthermore, the effect of electricity and gas prices on the feasibility and performance of the optimization system has been evaluated briefly through a sensitivity analysis.
2. Problem Statement
One common approach in the evaluation of a polygeneration system is through its comparison with a reference energy system [24,25,26,27,28]. This approach provides a comparative analysis for performance evaluation of a polygeneration system. The reference system and the polygeneration system and mathematical equations are given briefly in this section; however, details of the mathematical modeling can be found in previous studies [11,20].
2.1. Reference System
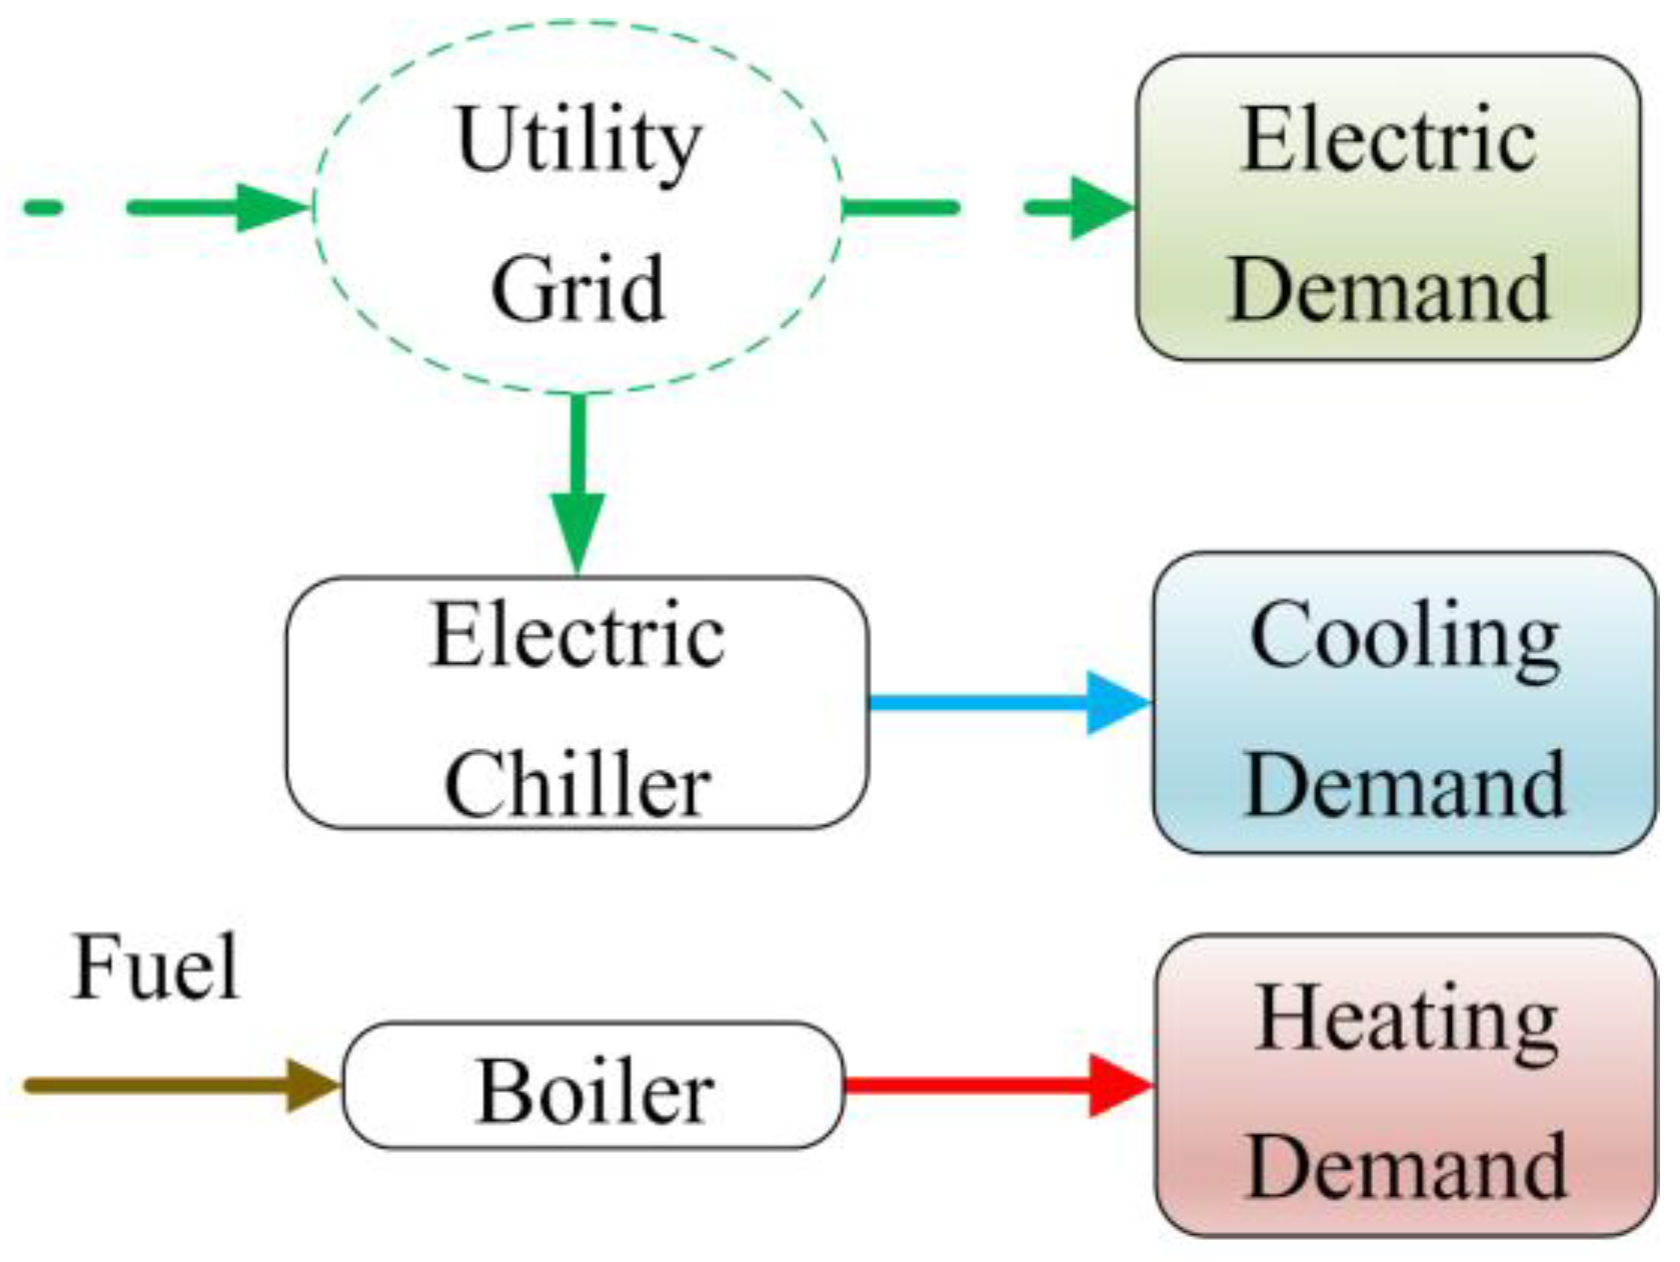
The reference system, which is business as usual in many energy systems around the world, uses a utility grid that is based on a conventional fossil fuel-driven power plant to provide electricity to cover electricity demand. Heating and cooling demands are provided by a boiler and an electric chiller, respectively. A block diagram of the reference system is shown in Figure 1.
The losses in the grid correspond to additional fuel consumption that should be considered in the calculation. The equivalent energy of the fuel consumption by the grid is given as below:
where:
- is the amount of electricity provided by the grid, is the electricity used directly in the building excluding the power demand of the electric chiller and is the power demand of the electric chiller;
- is the efficiency of the power plant and is the efficiency of the grid, which takes into account the distribution and transmission losses and is the time step.
The total equivalent energy of the fuel consumption in the reference system can be calculated as below:
where and are the equivalent energy of the total fuel consumption of the boiler and the grid, respectively.
2.2. Polygeneration System Configuration
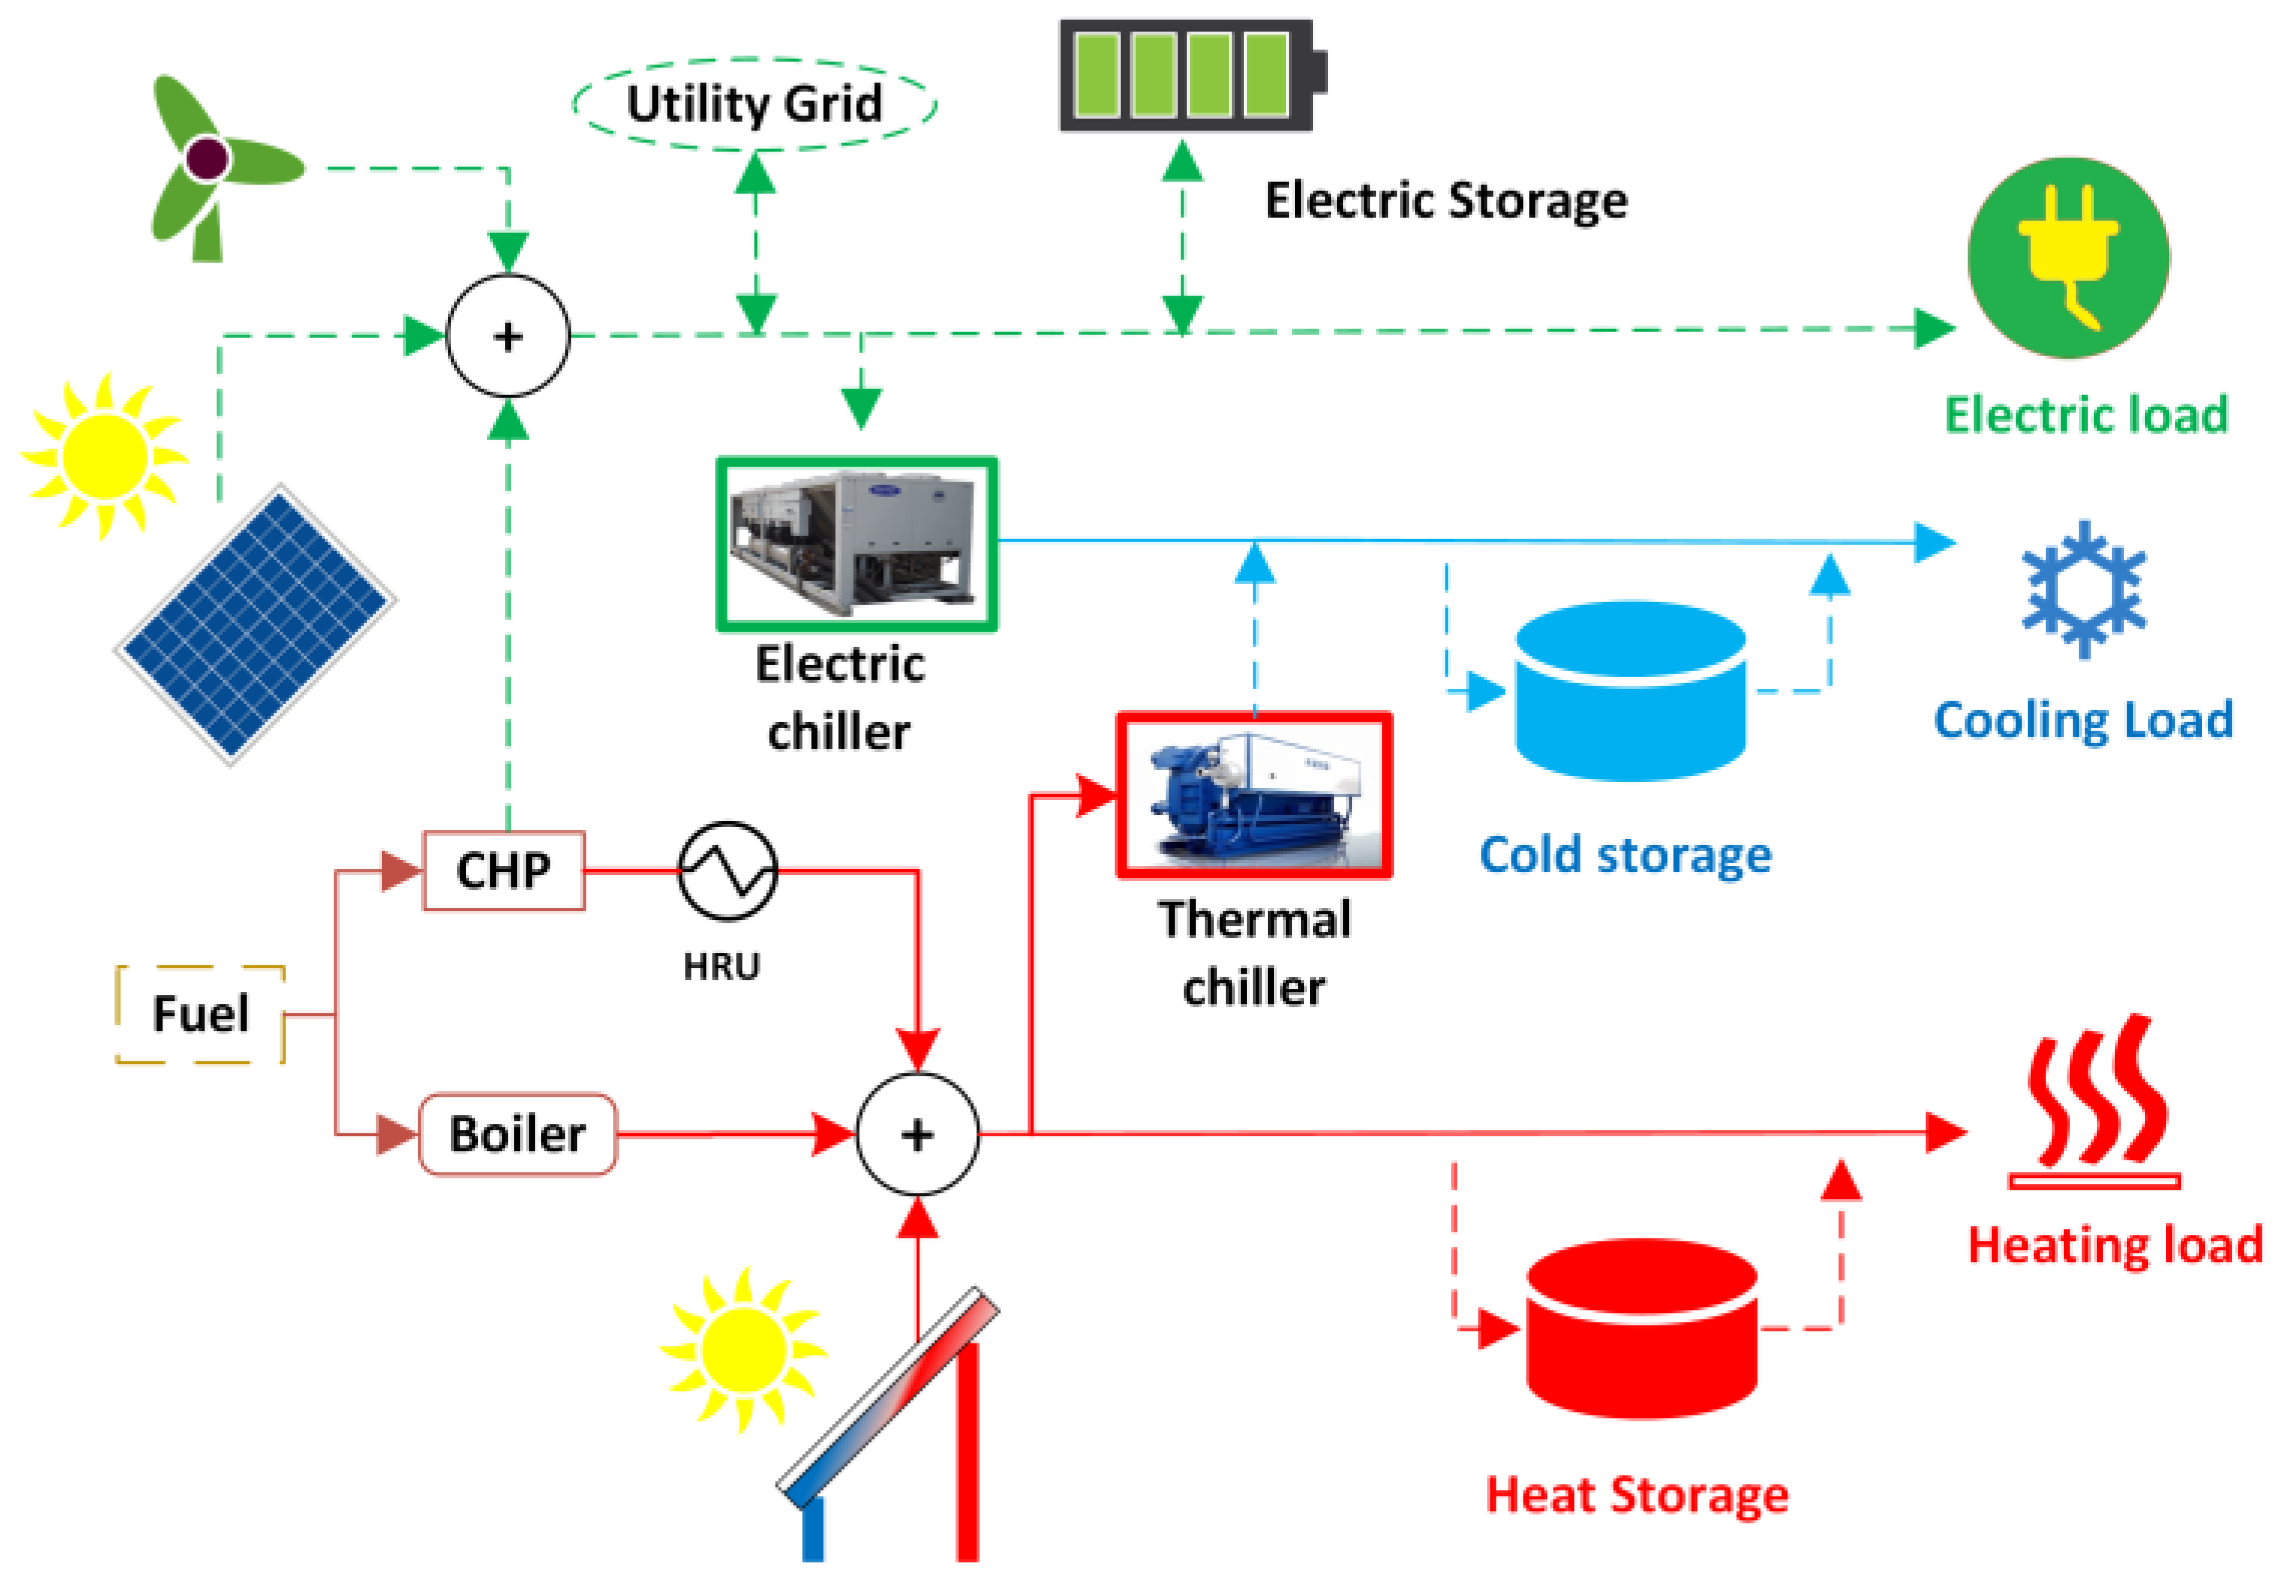
The polygeneration system consists of several electricty, heating and cooling generation units as well as thermal and electric storage devices. A block diagram of the system is shown in Figure 2. The power system comprises a CHP system, wind turbines and PV modules. The heating system includes a heat recovery unit (HRU) which is connected to the CHP, solar heating units (SHU) and a boiler. A thermal chiller (Tch) and an electric chiller (Ech) are implemented for cooling purposes. Thermal and electric storages are used to overcome the sporadic nature of renewable energy sources as well as to maximize the exploitation of excess heat and electricity. In the presented case study, the system is grid-connected; however, it can be easily switched to off-grid mode if required.
The equivalent energy of the fuel consumption in the polygeneration system () is the summation of the fuel energy consumption of the boiler (), the CHP () and the imported electricity from the utility grid () as presented below:
The equivalent energy of the fuel consumption of the imported power from the utility grid () is calculated from the equation below:
where and are the efficiency of the power plant and grid’s distribution and transmission lines, respectively, and is the time-step of the simulation.
Operating Strategy Description
Three operating strategies have been embedded in the model, namely following thermal load (FTL), following electric load (FEL) and modified base load (MBL) [20]. In the FEL strategy, the electricity demand of the building including the electricity demand of the electric chiller is provided by the CHP. In the MBL, which is derived from an FEL strategy, the CHP provides a base load at its nominal power if the electricity demand is above or equal to the base load. Otherwise, if the power demand is below the base load, the CHP follows the electricity demand to minimize excess power. In the FTL strategy, the CHP provides the total heating demand of the building including the thermal chiller’s heating load.
All the demands are initially supplied by the renewable energy sources. The remaining required heat or electricity will be supplied primarily by the storage and the CHP. If there is deficit/excess power, the electricity will be exported/imported to/from the utility grid. In case of heat supply shortage, the boiler will be in operation and in case of excess heat, the storage will be charged. More details of the operating strategies are available in the previous work [11,20]. In [20], the operation strategies and their effect on the optimal solutions and performance of polygeneration systems have been explored. The results showed that each of the operating strategies has their own advantages and drawbacks. Hence, the choice of operating strategy depends on the purpose of the project as well the energy market situation. For example, while in one case the FTL is economic, the FEL might be chosen for its minimum dependency on the grid. In this study, the FEL operating strategy is chosen since a high degree of self-sufficiency in terms of electricity is critical in hospitals due to their importance in case of power outage.
2.3. Performance Evaluation
In order to investigate whether a polygeneration system as an alternative solution is beneficial, its performance should be compared with existing solutions. Therefore, the evaluation of the system relative to a defined reference system has been performed in terms of energy, economy and environment. The metric used for the evaluation are fuel saving ratio (FSR) for energy evaluation, annualized total cost saving ratio (ATCSR) for economic evaluation and CO2 emission reduction ratio (CO2ERR) for environmental evaluation. These metrics are frequently used in comparative analysis of energy systems [24,25,26,27,28]. Below, the method is described briefly, however, details of the calculation can be found in previous studies [11,20].
The CO2 emission reduction ratio (CO2ERR) is defined as:
where and are the CO2 emissions of the polygeneration and reference system respectively.
The fuel saving ratio (FSR) is given as below:
where and are the equivalent energy of the consumed fuel in the reference and polygeneration system, respectively.
The annualized total cost saving ratio (ATCSR) is expressed as:
where and are the annualized total cost of the reference and polygeneration system through a project’s lifetime, respectively.
Other metrics used in this study for the economic analysis and feasibility study are the net present value (NPV), payback period (PBP), internal rate of return (IRR) and levelized cost of electricity (LCOE).
3. Optimization Problem Formulation
In this section, the general structure of the optimization tool, as well as the optimization technique, has been explained. Additional details are given in the previous studies [11,20].
3.1. Optimization Model Overview
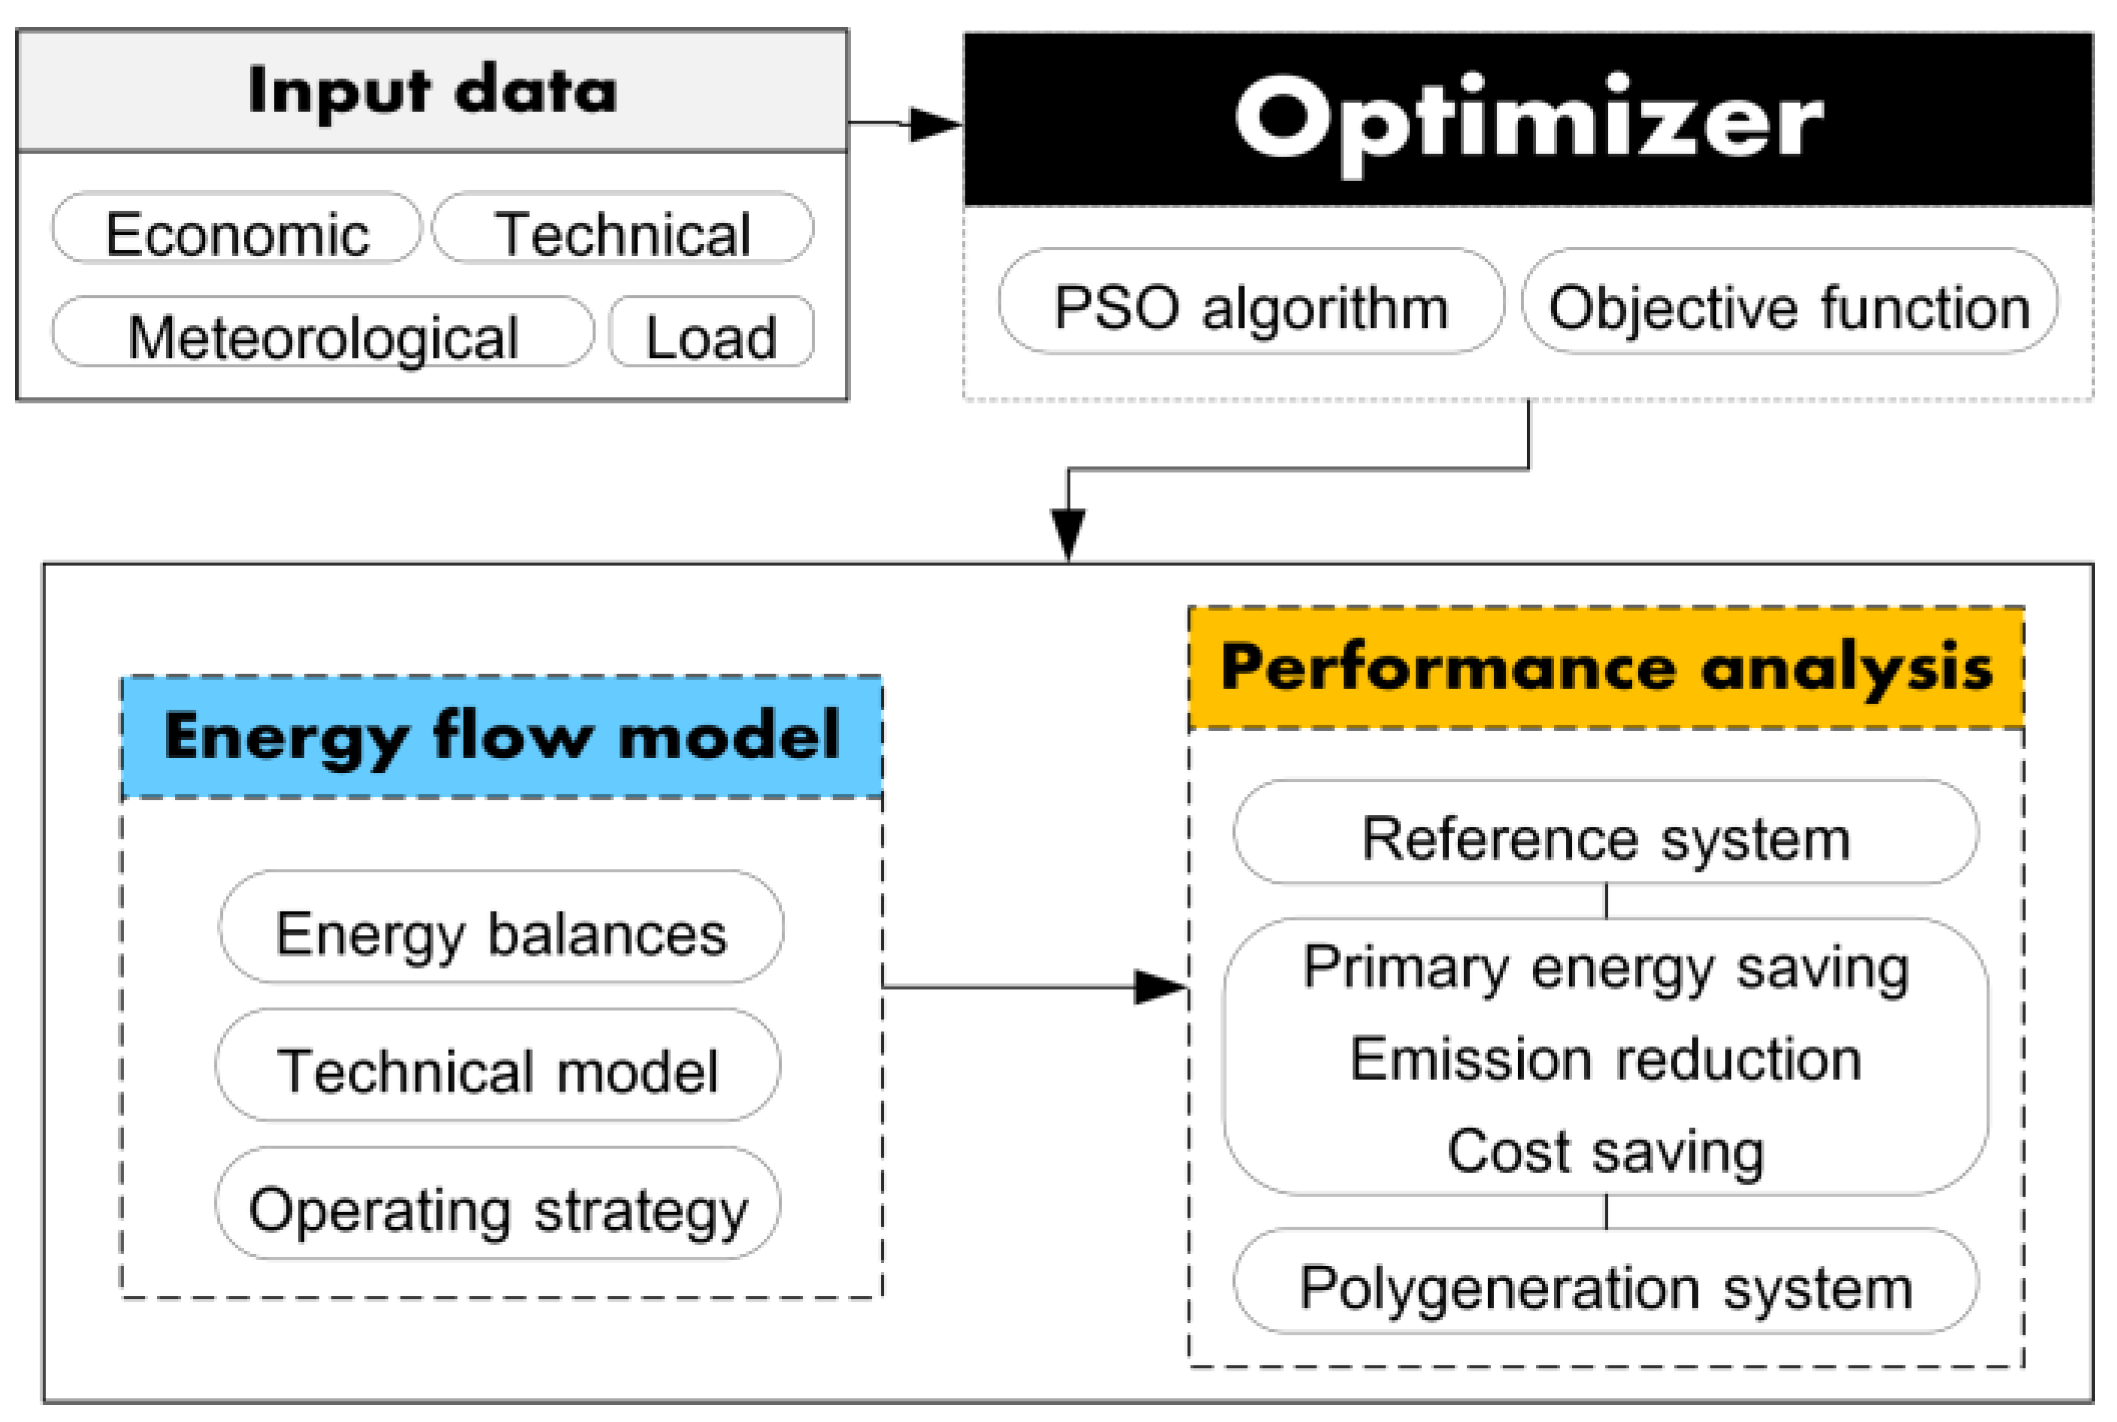
A particle swarm optimization (PSO) algorithm is used as the optimization technique. PSO is a population-based algorithm introduced by Kennedy and Eberhart [29]. This technique is proven to be an efficient technique to solve the multi-dimensional non-linear problems [27,30]. The PSO mechanism can be found in original work by Kennedy and Eberhart [29,31]. The optimization model consists of three main parts; the performance analysis, PSO algorithm and energy-flow model as shown in Figure 3. In the energy-flow model, the energy balance equations, as well as the operating strategies, are embedded. Evaluation of the system in terms of energy, economy and environment is carried out in the performance analysis part.
3.2. Objective Function
The objective function is defined with the intention of maximizing the fuel saving, cost saving as well as CO2 emission reduction relative to the identified reference system. It is constrained to the energy balance equation following the rules and limitations of the operating strategies. The goal of optimization is to determine the size of components and the cooling demand ratio, which are defined as decision-making variables. The cooling demand ratio is the ratio of the cooling demand provided by the electric chiller to the total cooling production at each time-step. The total cooling production is the summation of the cooling production by the electric chiller and thermal chiller. This ratio is identified in order to calculate the electricity and heating demand of the chillers, which are not known at the initial stage of the optimization process.
The aim of the objective function is to maximize an integrated saving ratio which considers, energetic, economic and environmental criteria (3-E analysis) [32] as defined in the performance evaluation section (Section 2.3). The integrated saving ratio (ISR) is given as follows:
where , and are the weighting factors.
The mathematical equation of the objective function is formulated as a minimization problem as follows:
Assuming equal weighting factors has been applied in other studies resulting in sensible solutions [4,5,6], in order to intensify the impact of one of the criteria, a higher weighting factor can be assigned to that criterion. Due to importance of economy in the feasibility of a polygeneration system, in this study a higher value is assigned to the economic weighting factor. Moreover, the weighting factors can be optimized to attain a certain objective. This is beyond the scope of this study and can be included in future studies. In principle, this optimization model considers only constant weighting which can be changed according to the type of application. Hence, the results of the model are only valid for the identified weighting factors. Accordingly, changing the weighting factors can change the results.
Here, as a default, the economic weighting factor is assumed to be 0.5 and the energetic and environmental weighting factors are assumed to be 0.25 since these two values are interdependent and one partially involves the other.
The constraints in the optimization problem are as follows:
- At each time-step, the electricty, heating and cooling demand should be covered. The required energy balances are shown in the equations below.where the subscripts, sup and dem, are supply and demand, respectively.
- The operation of the CHP is limited to a minimum load factor to increase its efficiency and lifetime and decrease the emissions. This is identified as a constraint in the optimization problem as follows:where, is the part-load factor of the CHP unit.
- The sizes of the components are limited to the identified optimization search space. The values of search space are identified according to the demand and the available area or space for each component.
The operation of the storage devices are limited to a maximum and minimum depending on the types of the storage. Energy storage devices are limited to their maximum and minimum state of charge. Furthermore, the input and output of the storage elements are limited to a maximum charge rate, which is dependent on the technical characteristics of the storage.
4. Application to a Case Study
The load characteristics have an important impact on the optimal solution of a polygeneration energy system. For example, a residential building usually has high heat and power fluctuations and the heat-to-power ratio changes significantly on a daily and seasonal basis. However, public buildings such as schools, hospitals or hotels have different load characteristics. In a hospital, the loads are relatively smooth during the day and the load fluctuation through the whole year is smoother compared to residential buildings. In this study, the design of a polygeneration system for a hypothetical hospital is investigated. Since self-sufficiency in terms of power is an important issue in hospitals, especially in case of power failures, the FEL has been chosen as the operating strategy [20].
4.1. Case Study Description
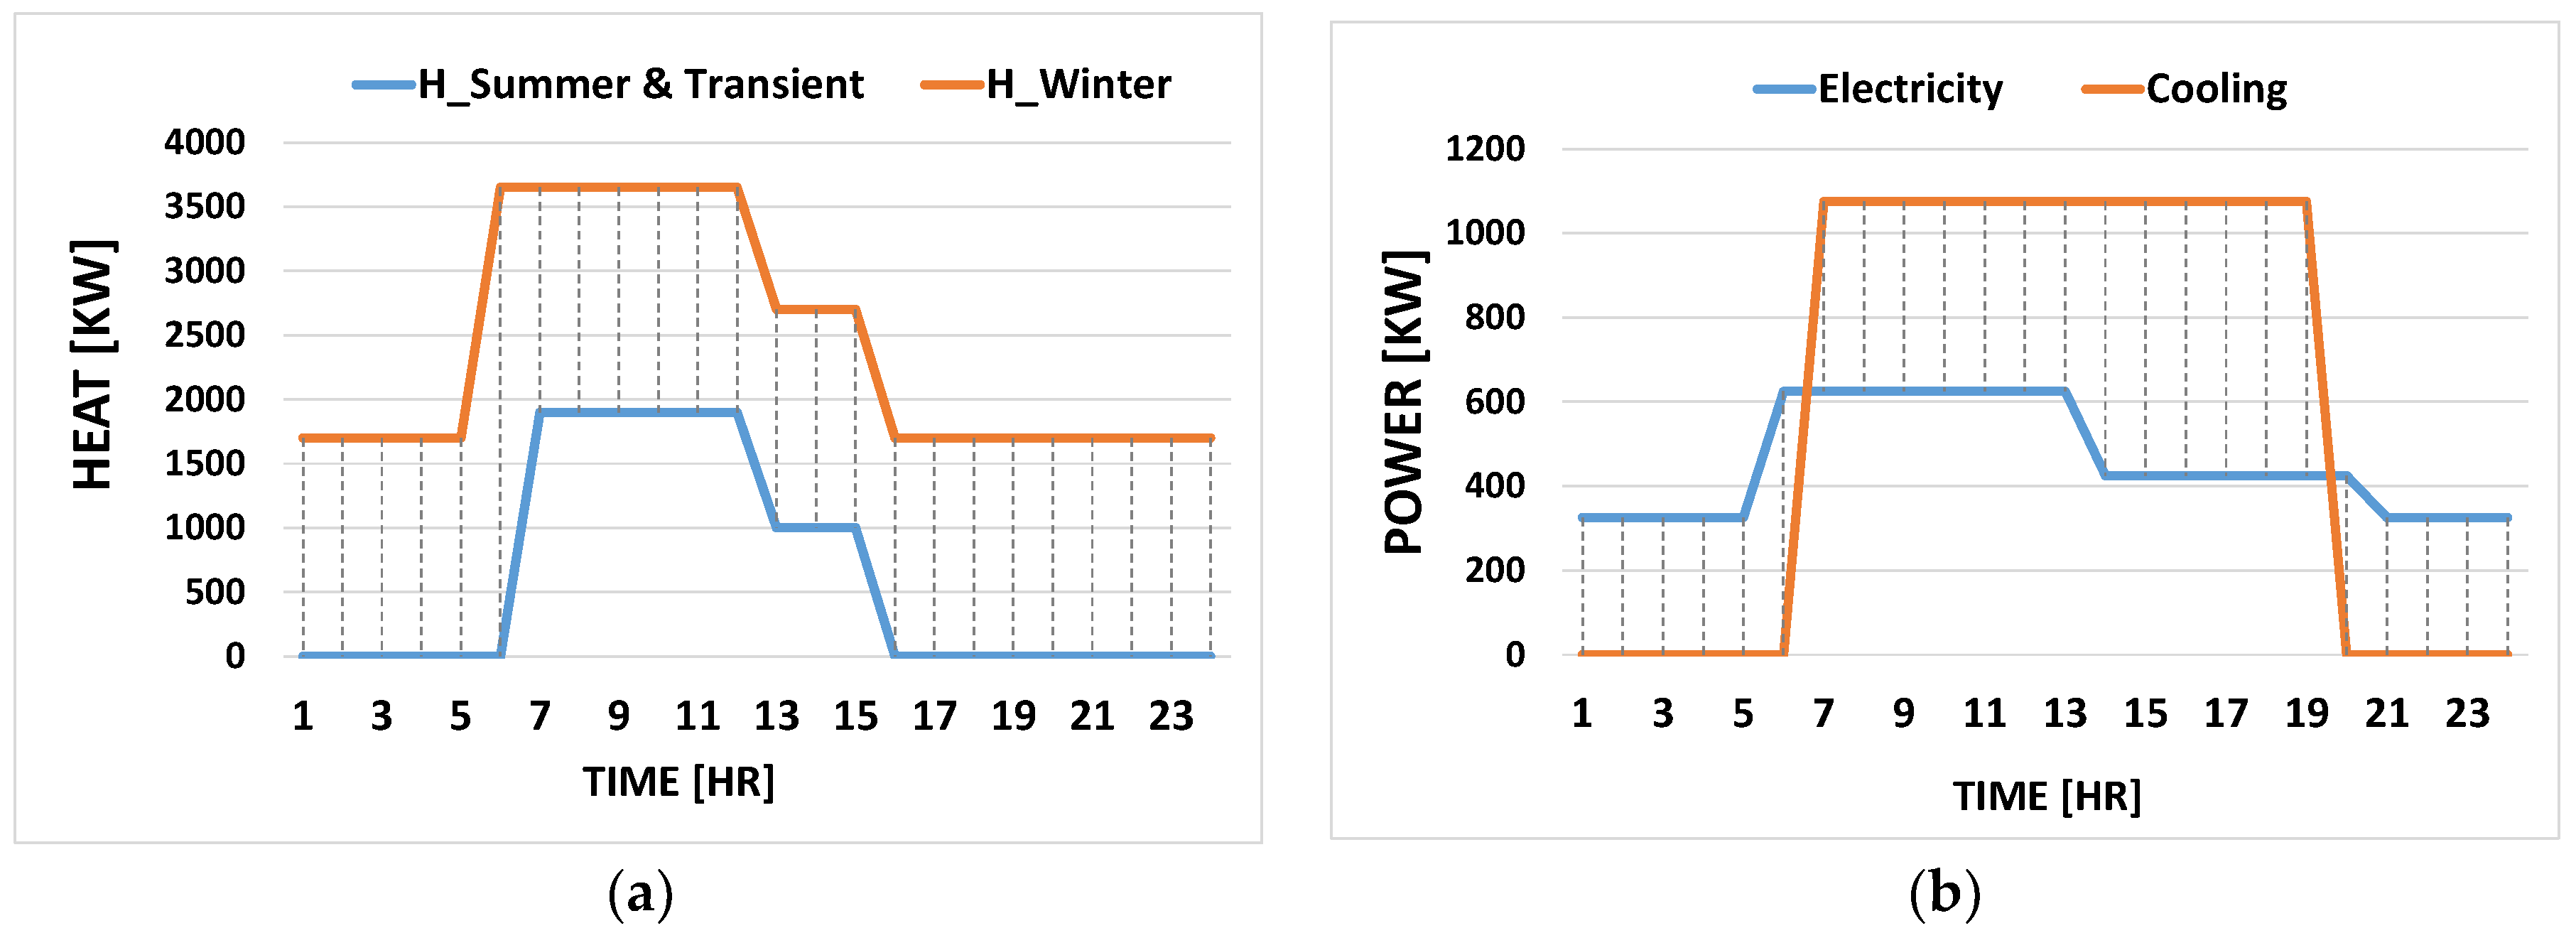
The demand load profile and its resolution have a significant influence on the system operation. However, identifying the exact load demand is out of the scope of this work and, therefore, in the present work the load specification is obtained from a literature source. The case study presented in this paper is a hypothetical 930-bed hospital complex located in Italy. The demands are based on a study previously performed by P. Arcuri et al. [17]. The representative load profiles during summer, winter and transient time are shown in Figure 4 which are similar to the presented loads by P. Arcuri et al. [17]. However, due to the lack of accurate information, generating loads with the exact values presented in the study was not possible. Therefore, the author has synthesized the yearly load based on the available information. In the present study, working day and non-working days are assumed to have the same load characteristics, unlike the original work. The electric load profile (excluding the electricity demand of the electric chiller) is assumed constant during the whole year. The cooling months are assumed to be June, July and August. The model is simulated for one-year operation with one-hour resolution (8760 h). The peak heat, power and cooling demands of the building are 3650 kWth, 625 kWel and 1075 kWc, respectively.
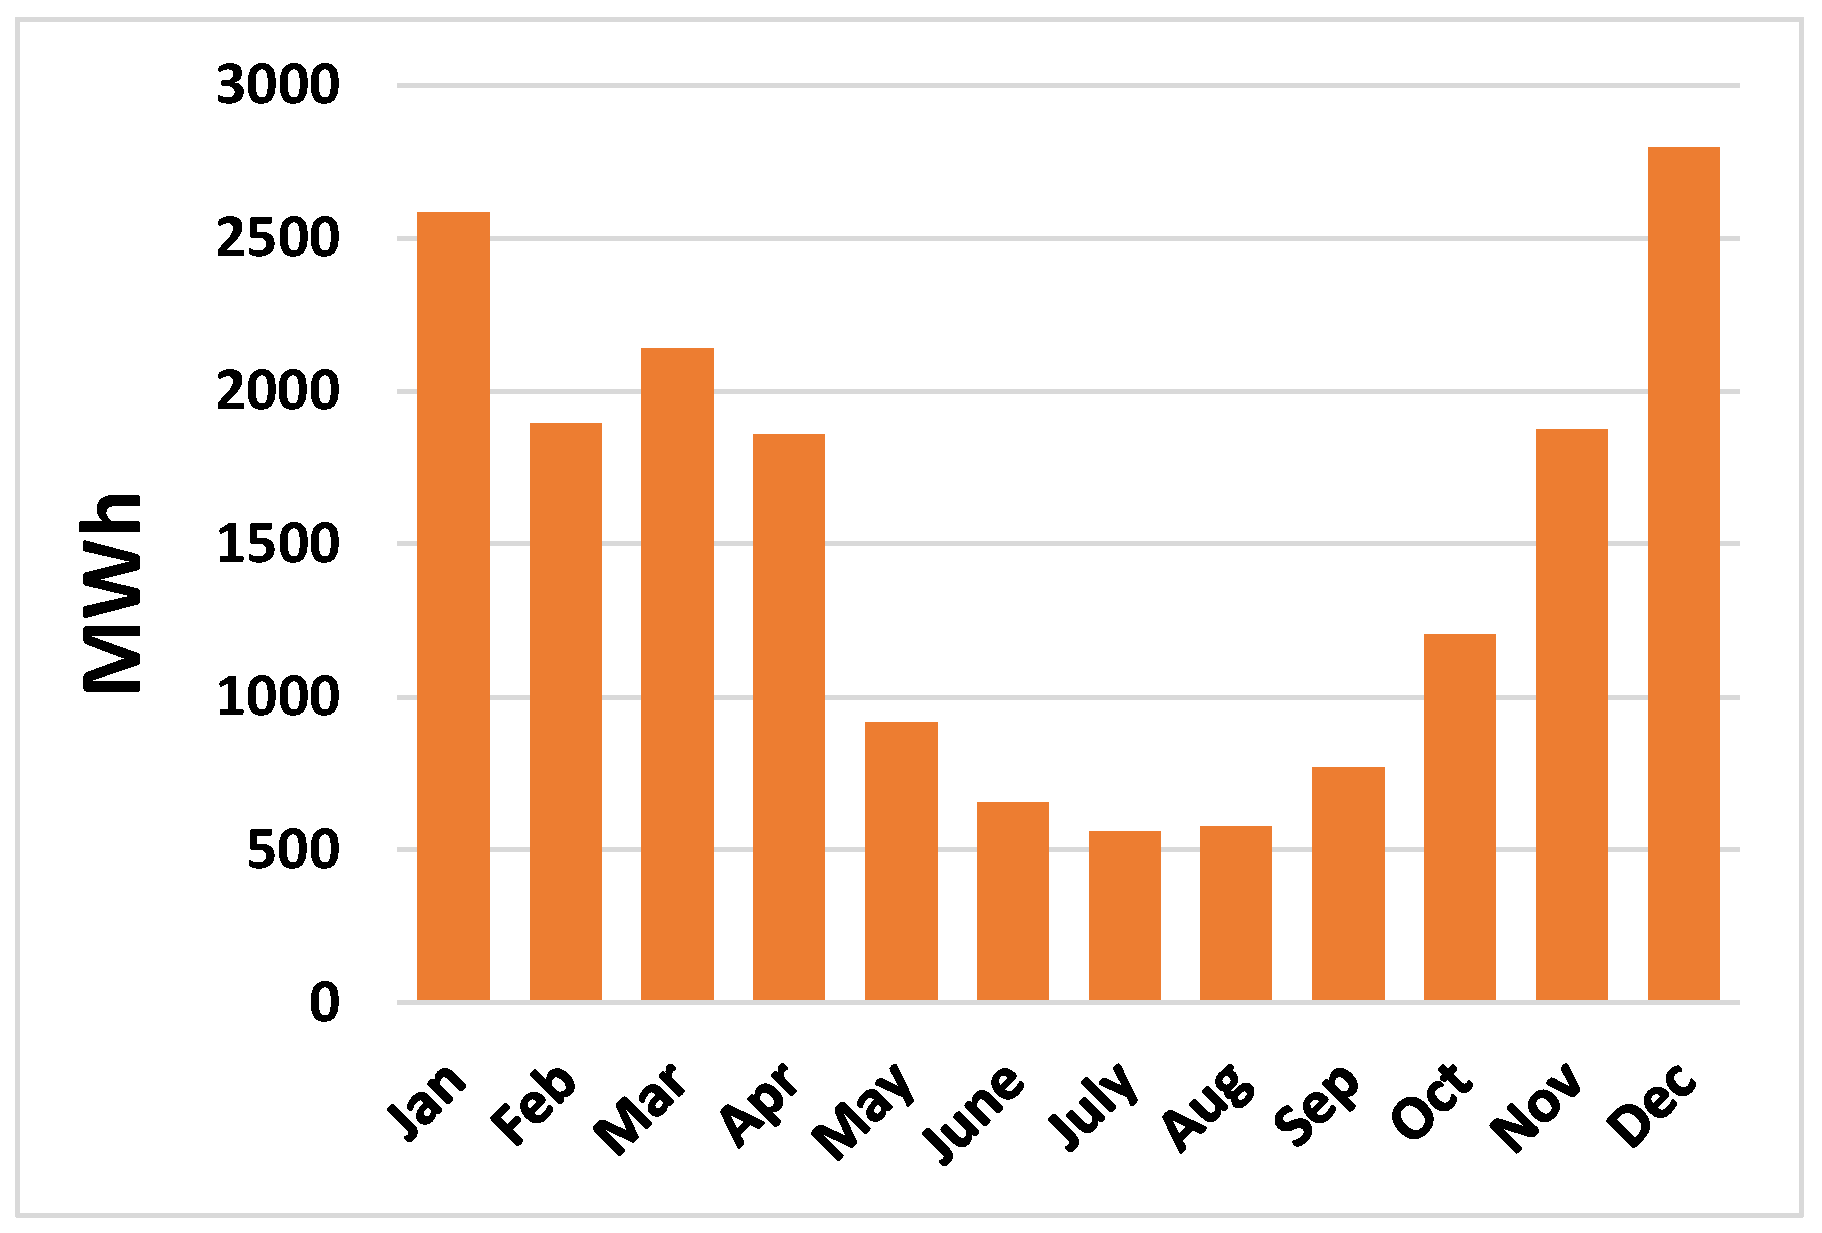
To understand the effect of heating load fluctuation, two different load profiles are considered. In the first type, here denominated as L01, it is assumed that the load profiles are as shown in Figure 4. In the second load type, called L02 here, the electricity and cooling load profile are similar to L01; however, the heating demand changes according to the monthly heating demand shown in Figure 5 which is based on the study performed by P. Arcuri et al. [17]. This monthly load change results in a lower aggregated heating demand in load type L02. To explore the effects of the critical components including the thermal chiller, cold storage, solar PV units, solar heating units and wind turbines, three design scenarios are considered. These scenarios are shown in Table 1. Scenario 1 consists of a CHP system, a boiler, an electric chiller and a heat storage unit. In scenario 2, a thermal chiller and a cold storage unit are added to the first scenario. In scenario 3, PV models, solar thermal units, a battery bank and wind turbines are added to the second scenario. The presence of the components in each scenario does not guarantee their existence in the optimal solution. It only shows the available options in the optimization search space.
The annual aggregated electricity and cooling demand for both load types are 4 GWhel and 1.3 GWhc. The annual aggregated heating demands for L01 and L02 are 13.1 GWhth and 8.9 GWhth, respectively. The ratios of heating to power demand for L01 and L02 are 3.3 and 2.2, respectively. The ratios of heating to cooling demand for L01 and L02 are 10 and 6.8, respectively.
4.2. Input Data
The efficiency of the power plant and utility grid in the reference system are assumed to be 40% and 92%, respectively. The lifespan of the project is projected to be 20 years with an inflation rate of 2% and interest rate of 6%. The technical specification of the components and their cost, the electricity and gas price and the emission factors are presented in Table 2, Table 3, Table 4 and Table 5.
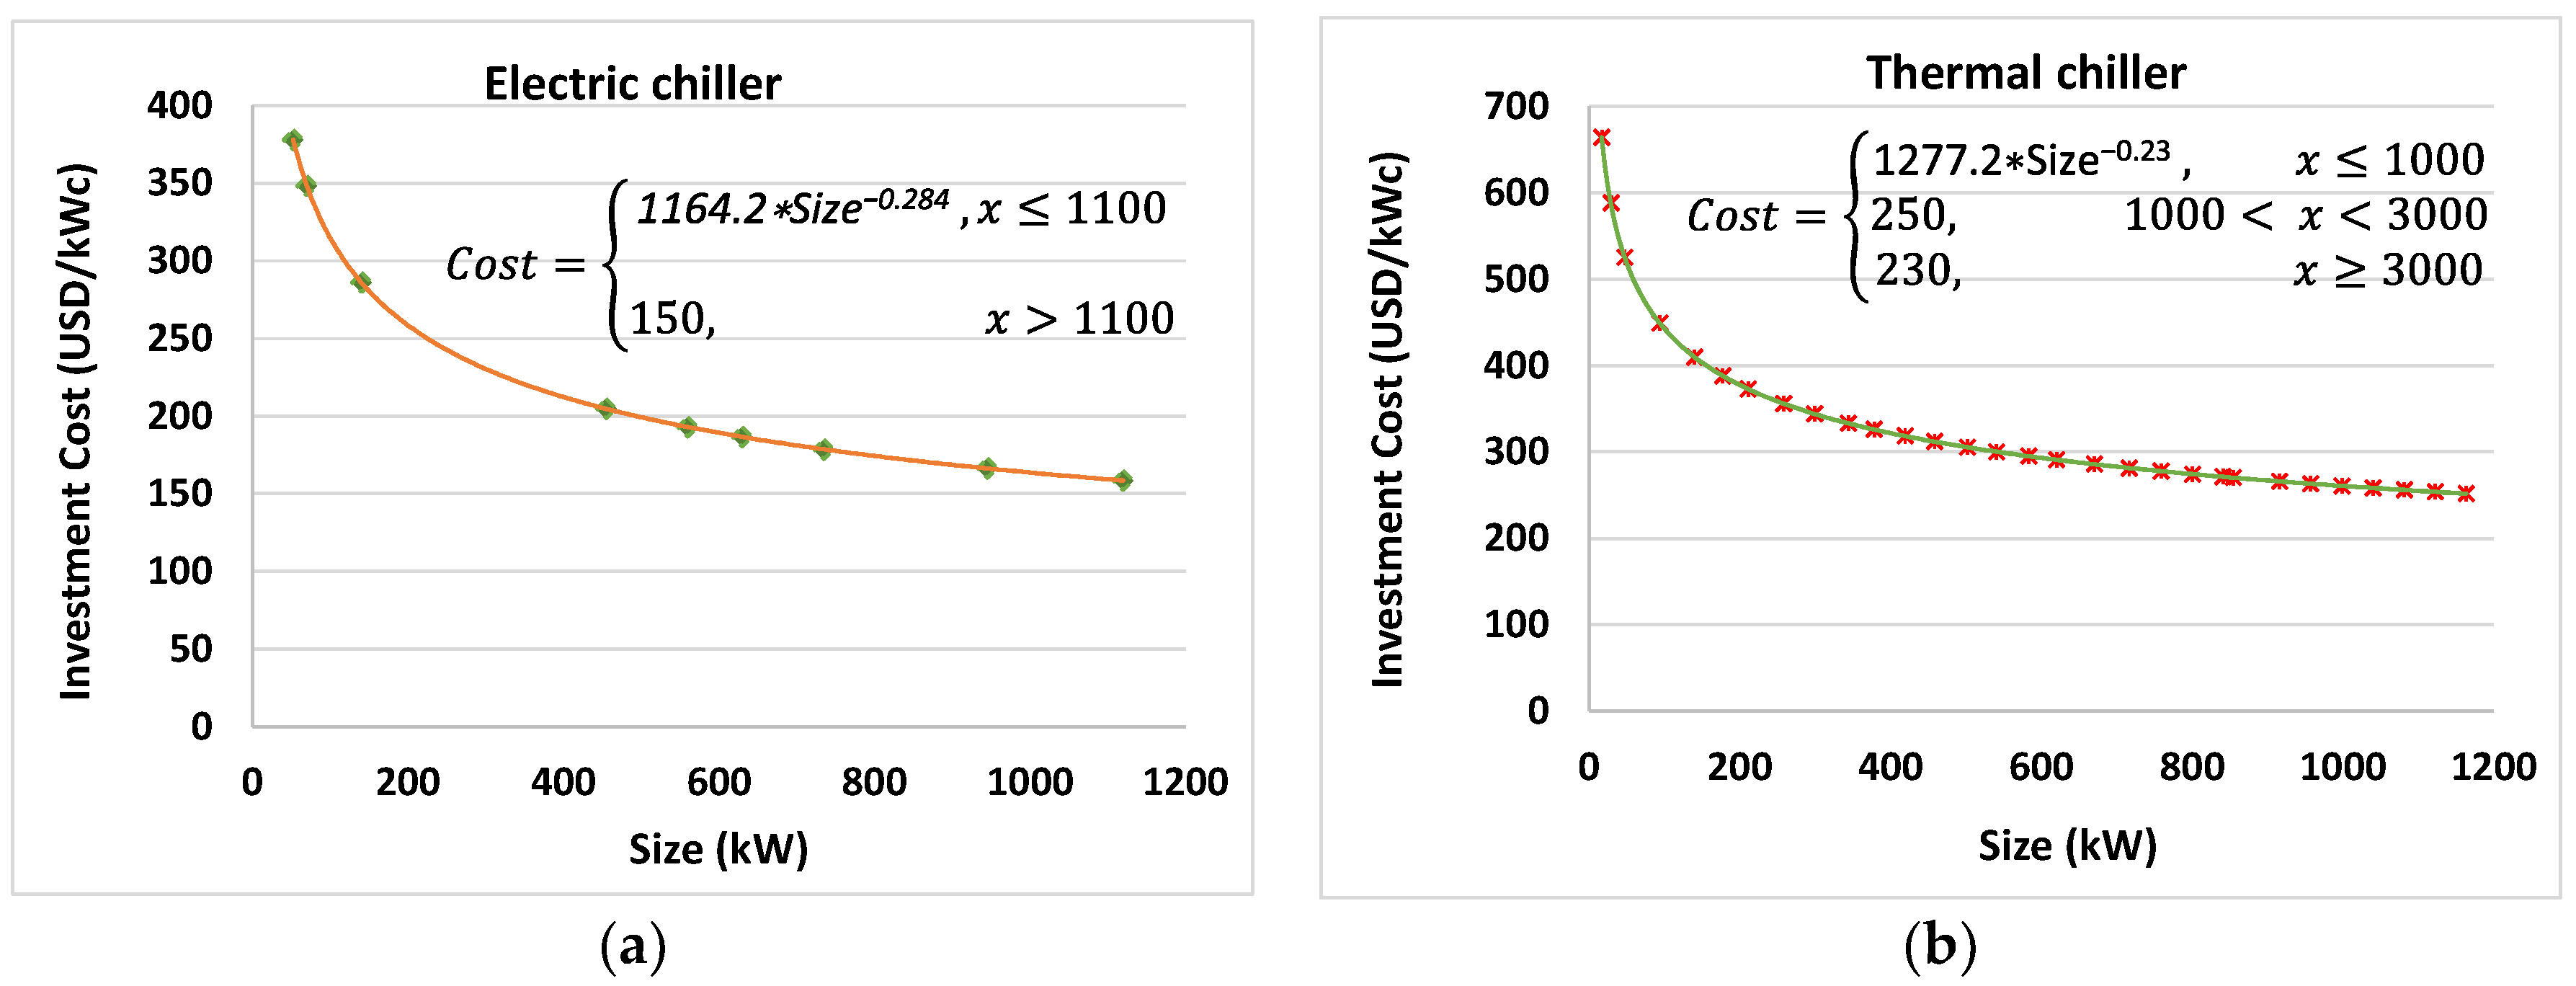
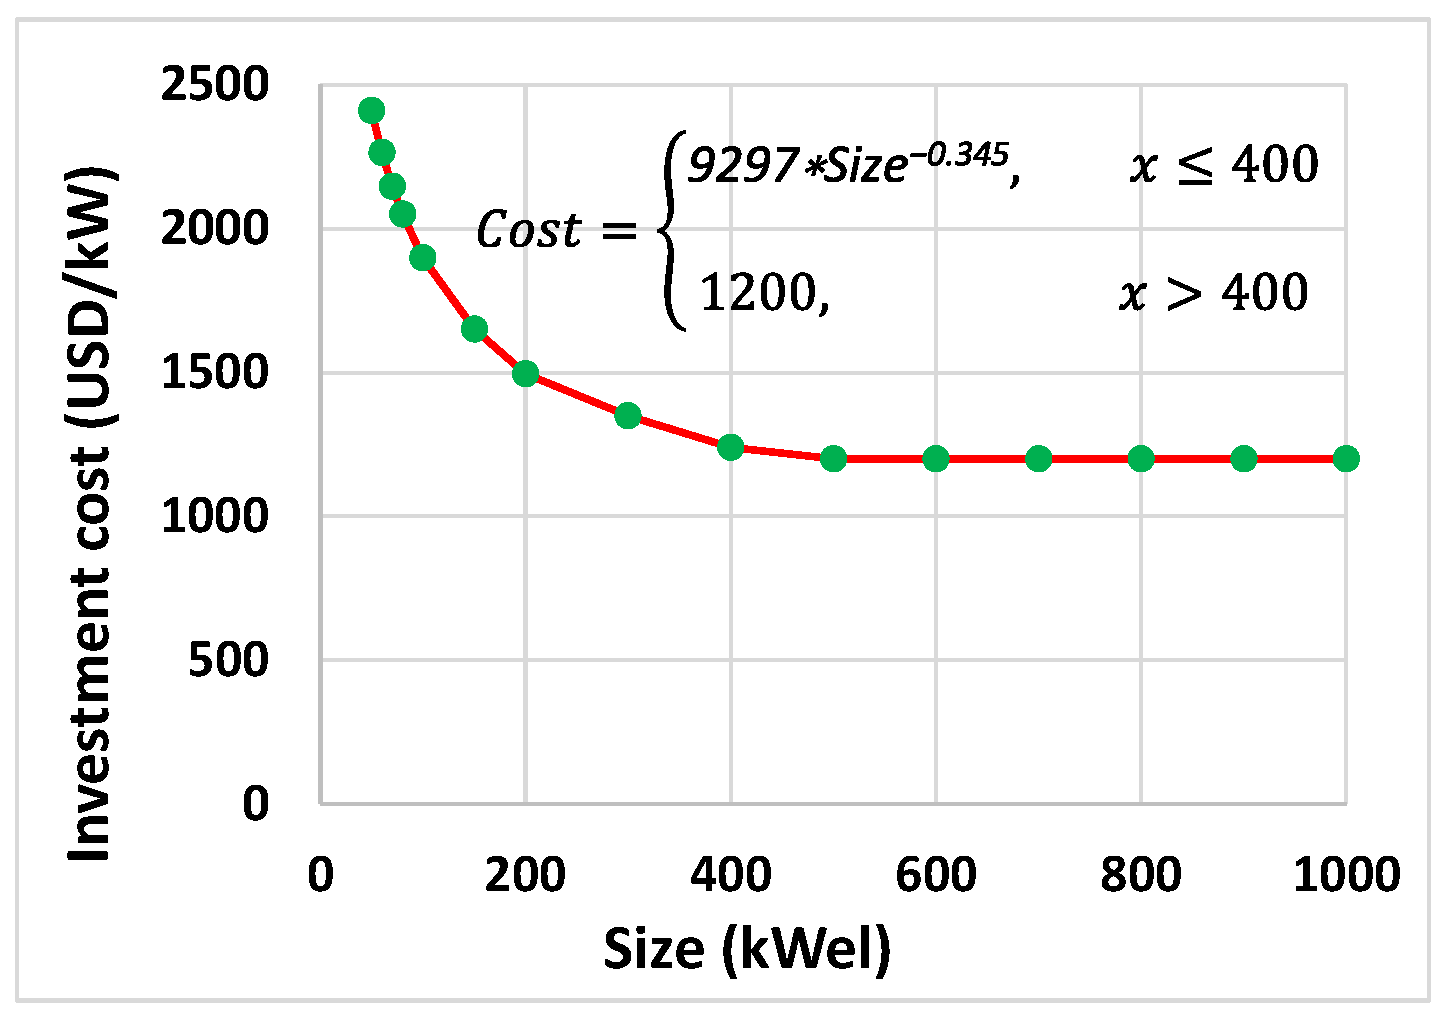
The costs of most of the components are assumed constant as shown in Table 3. However, the costs of the CHP units and chillers are size dependent, as shown in Figure 6 and Figure 7.
Costs of most of the components are relatively stable in the market. However, the capital cost of solar heating units is reported to be from USD 175 /m2 to USD 1680 /m2 [38], which varies considerably worldwide. In this study, flat plate collectors (FPC) are selected and a unit cost of USD 250 /m2 is assumed, which is relatively optimistic. In general, due to the lack of a scientifically collected database, for most of the components, the assumed costs are gained according to searches in the current market and available literature. Hence, this is considered as one limitation of this study.
The search space of each variable is shown in Table 6. As shown in the table, the size of the thermal storages as well as the solar power and heating units are limited. This is due to the limited available space and land area. It is assumed that the available areas for solar power and heating units are 2000 m2 and 4000 m2, respectively. This corresponds to a peak electric and heat power of 920 kW and 1400 kW, respectively.
5. Results and Discussions
The simulation was performed for one-year with a time resolution of one hour. The FEL operating strategy was chosen for higher self-sufficiency, as mentioned in Section 4. The polygeneration system was optimized for the three design scenarios and two load types L01 and L02, as described previously. A comparative analysis has been performed taking into account the following:
- size of the components;
- system performance;
- system economy.
Furthermore, to have a better picture of the energy flow, the operational behavior of the system is investigated in detail during one representative day.
5.1. Component Size
The optimal solutions for each scenario and each load type are shown in Table 7. There is no wind turbine in the optimal solution due to its high cost and low amount of wind energy in the region. The battery is only selected in scenario 3 with L01. The size of the battery is small and can be ignored. This is due to the high cost of the battery and limited available excess power from the CHP and PV modules. According to the FEL operating strategy, the CHP follows the electricity demand and, therefore, there is no or little excess power to be stored in the battery. Moreover, the size of the PV installation is relatively small compared to the demand and most of the generated power goes directly to meet the demand. Hence, there will be little excess power to be stored in the battery.
In scenario 1, the sizes of the components for both load types are similar with a slightly smaller heat storage unit and auxiliary boiler in L02 due to the lower heating demand in this load type. In scenario 2, due to a lower heating demand in L02, the thermal chiller can exploit more heat for cooling purposes. This results in a smaller electric chiller in L02. The demand cooling ratio in all the cases is 1, except in L02 in scenario 2 and 3, in which it is 0.29 and 0.49, respectively. Having a thermal chiller increases the performance of the system in terms of energy and environment and, therefore, it is included in both scenarios. A smaller electric chiller decreases the total power demand and, consequently, a smaller CHP is required in scenario 2 in L02. In scenario 3, since part of the power demand is provided by the PV panels, the sizes of the CHP unit in both load types are smaller compared to the previous scenarios.
In scenarios 2 and 3, the solar PV panels, solar heating units and thermal storage units appeared in the optimal solution. This means that these components improve the performance of the system; however, due to the limited space for the storage units and limited rooftop or floor area for the PV panels and solar heating units, the sizes are limited to the maximum values of the search space, as shown in Table 6. The only exception is scenario 1 with load type L02 in which the size of the heat storage is lower than the search space. This is mainly due to a lower heating demand in L02 and lack of a thermal chiller, which can exploit the stored heat. As mentioned in the previous section, the cost of solar heating units varies by a factor of 10 around the world. To consider the economy of scale and being optimistic about the future of solar heating market, the cost of solar heating units is assumed to be close to the lowest price in the current market. This is why solar heating units appear in the optimal solutions. The other reasons are the high price of natural gas and electricity in the Italian market. Solar heating units can decrease the fuel consumption, which has a positive impact on the performance of the system.
5.2. Performance Analysis
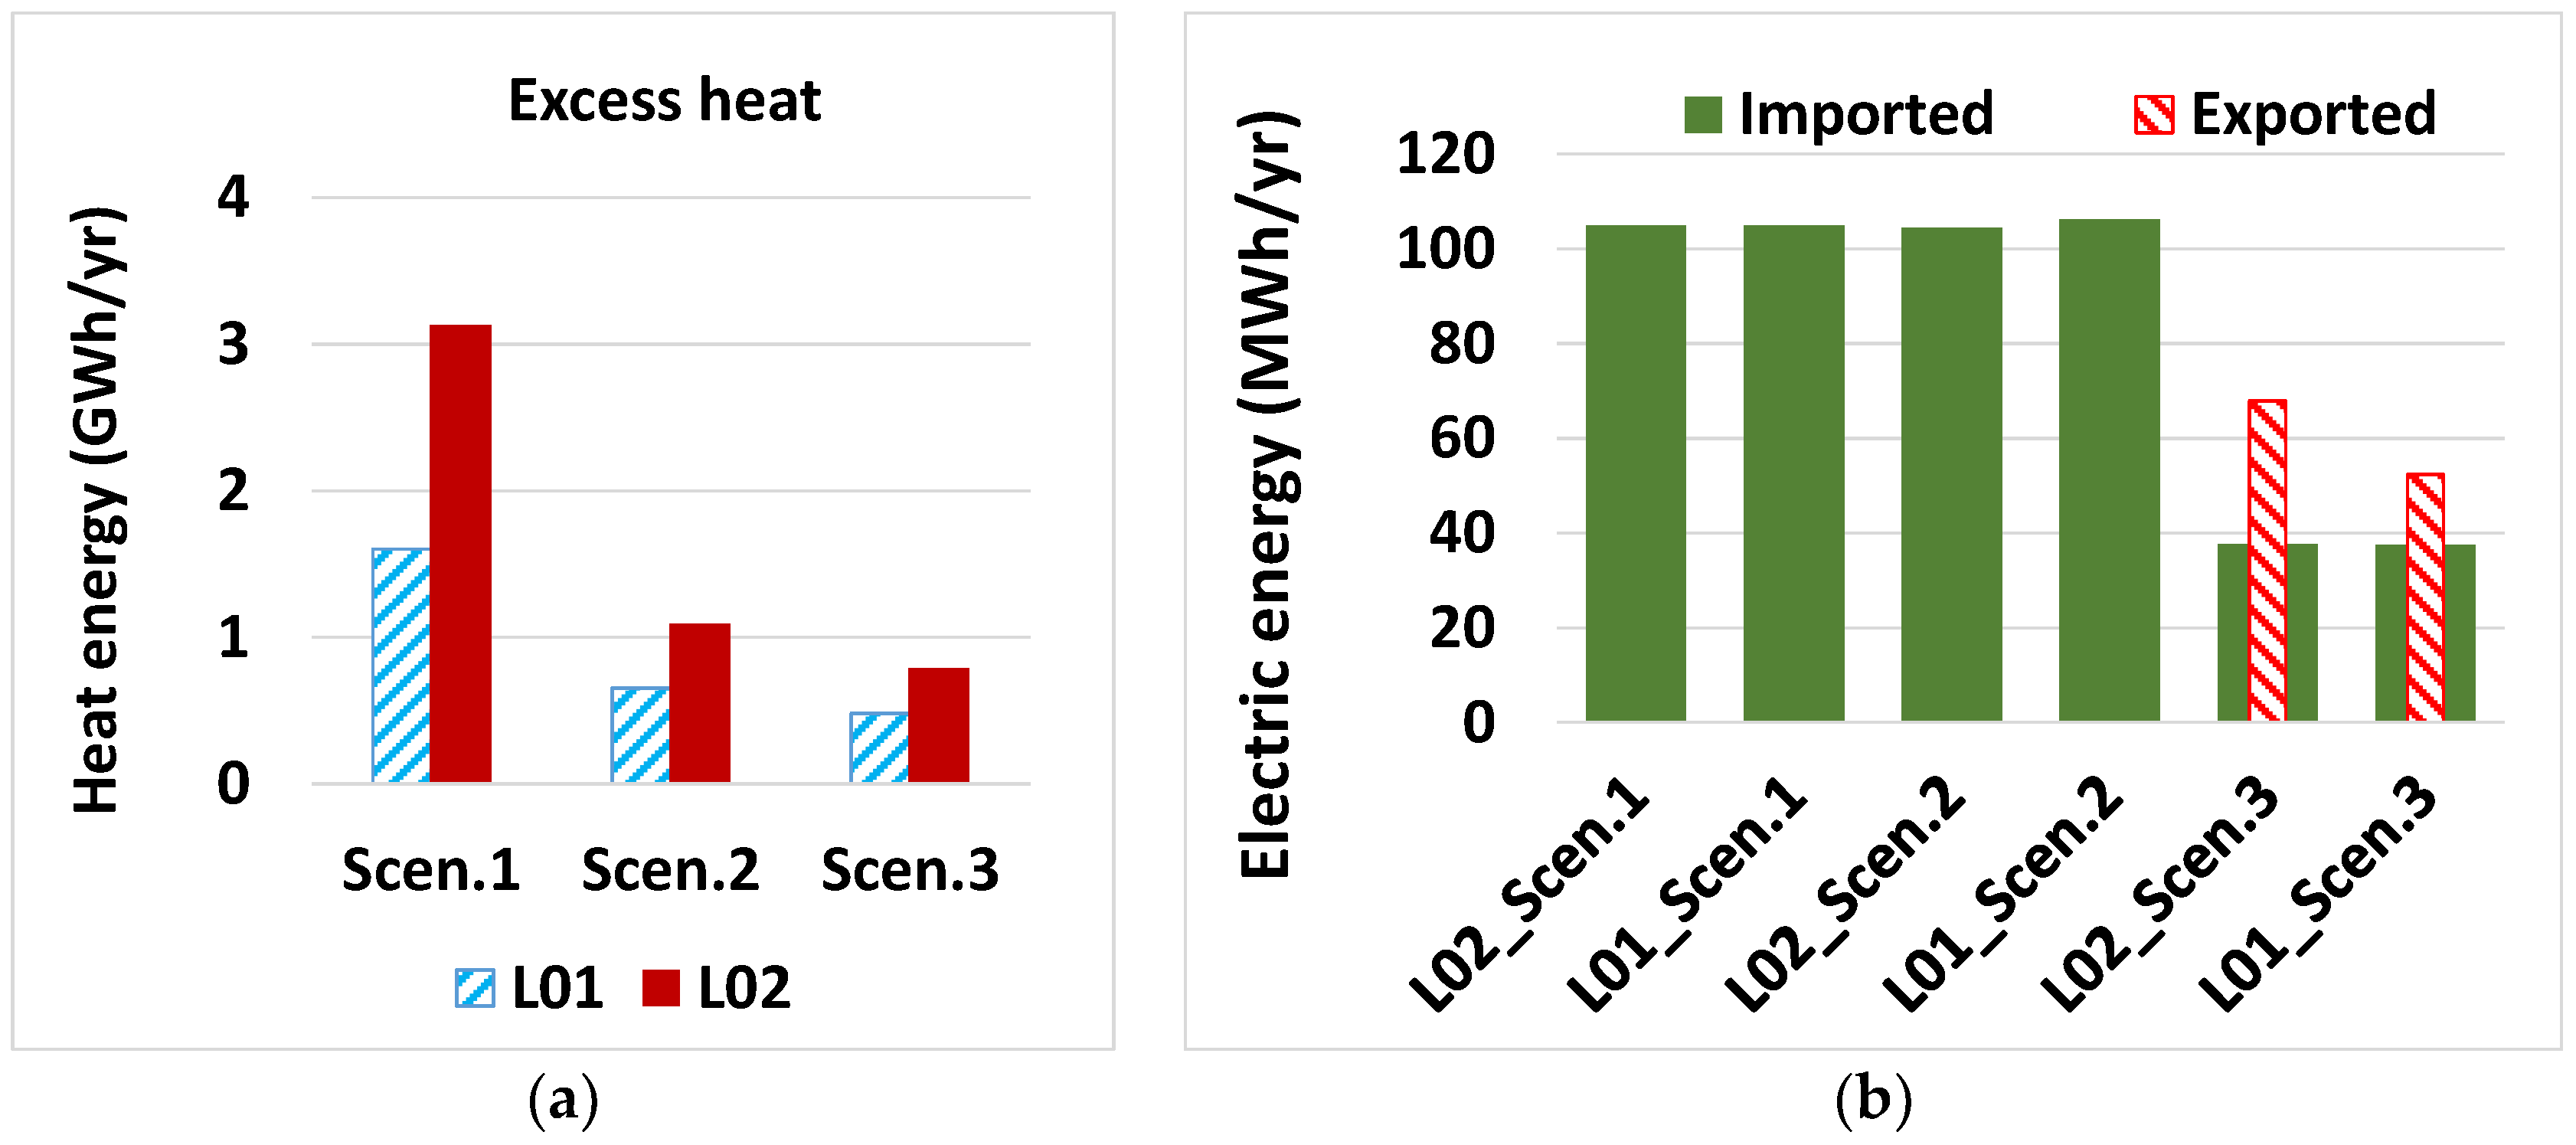
In this section, the performance of the polygeneration system relative to the reference system is presented. The fuel-saving ratio, CO2 emission reduction and annualized total cost are the three metrics used in this study. The objective of the optimization is to identify the optimal solutions with the highest integrated saving ratio, as described in Section 2. The scenarios and load types are compared with each other in order to identify the effect of heating load types as well as the impact of various components in the three scenarios. Moreover, the amount of excess heat and exported and imported power to/from the grid are also compared. Investigating these values is important to make a better choice while choosing between various scenarios. For example, in a system with high excess heat, utilization of the excess heat for deferrable loads can increase the performance of the system. The amount of excess heat in the system with L02 is higher than that in L01 in all the scenarios due to the lower heating demand in L02 (Figure 8). For each load type, the amount of excess heat is the highest in scenario 1 and the lowest in scenario 3.
In scenarios 1 and 2, there is no exported power since the CHP follows the electric load and, therefore, there will be no or little excess power. In scenario 3, however, due to the presence of solar power, there is excess power, which is exported to the grid. The amount of exported power in load type L02 is higher due to the smaller size of the electric chiller, and consequently its lower power demand. The amount of imported power in scenario 1 and scenario 2 are approximately the same. The amount of imported power from the grid in scenario 3 is significantly lower due to the existence of PV units. If exporting the power to the grid is not possible or not desirable, the electricity can be utilized in deferrable load such as a water purification system or batteries in the system. However, the added costs might decrease the economic performance of the system and, therefore, requires more economic investigation in advance.
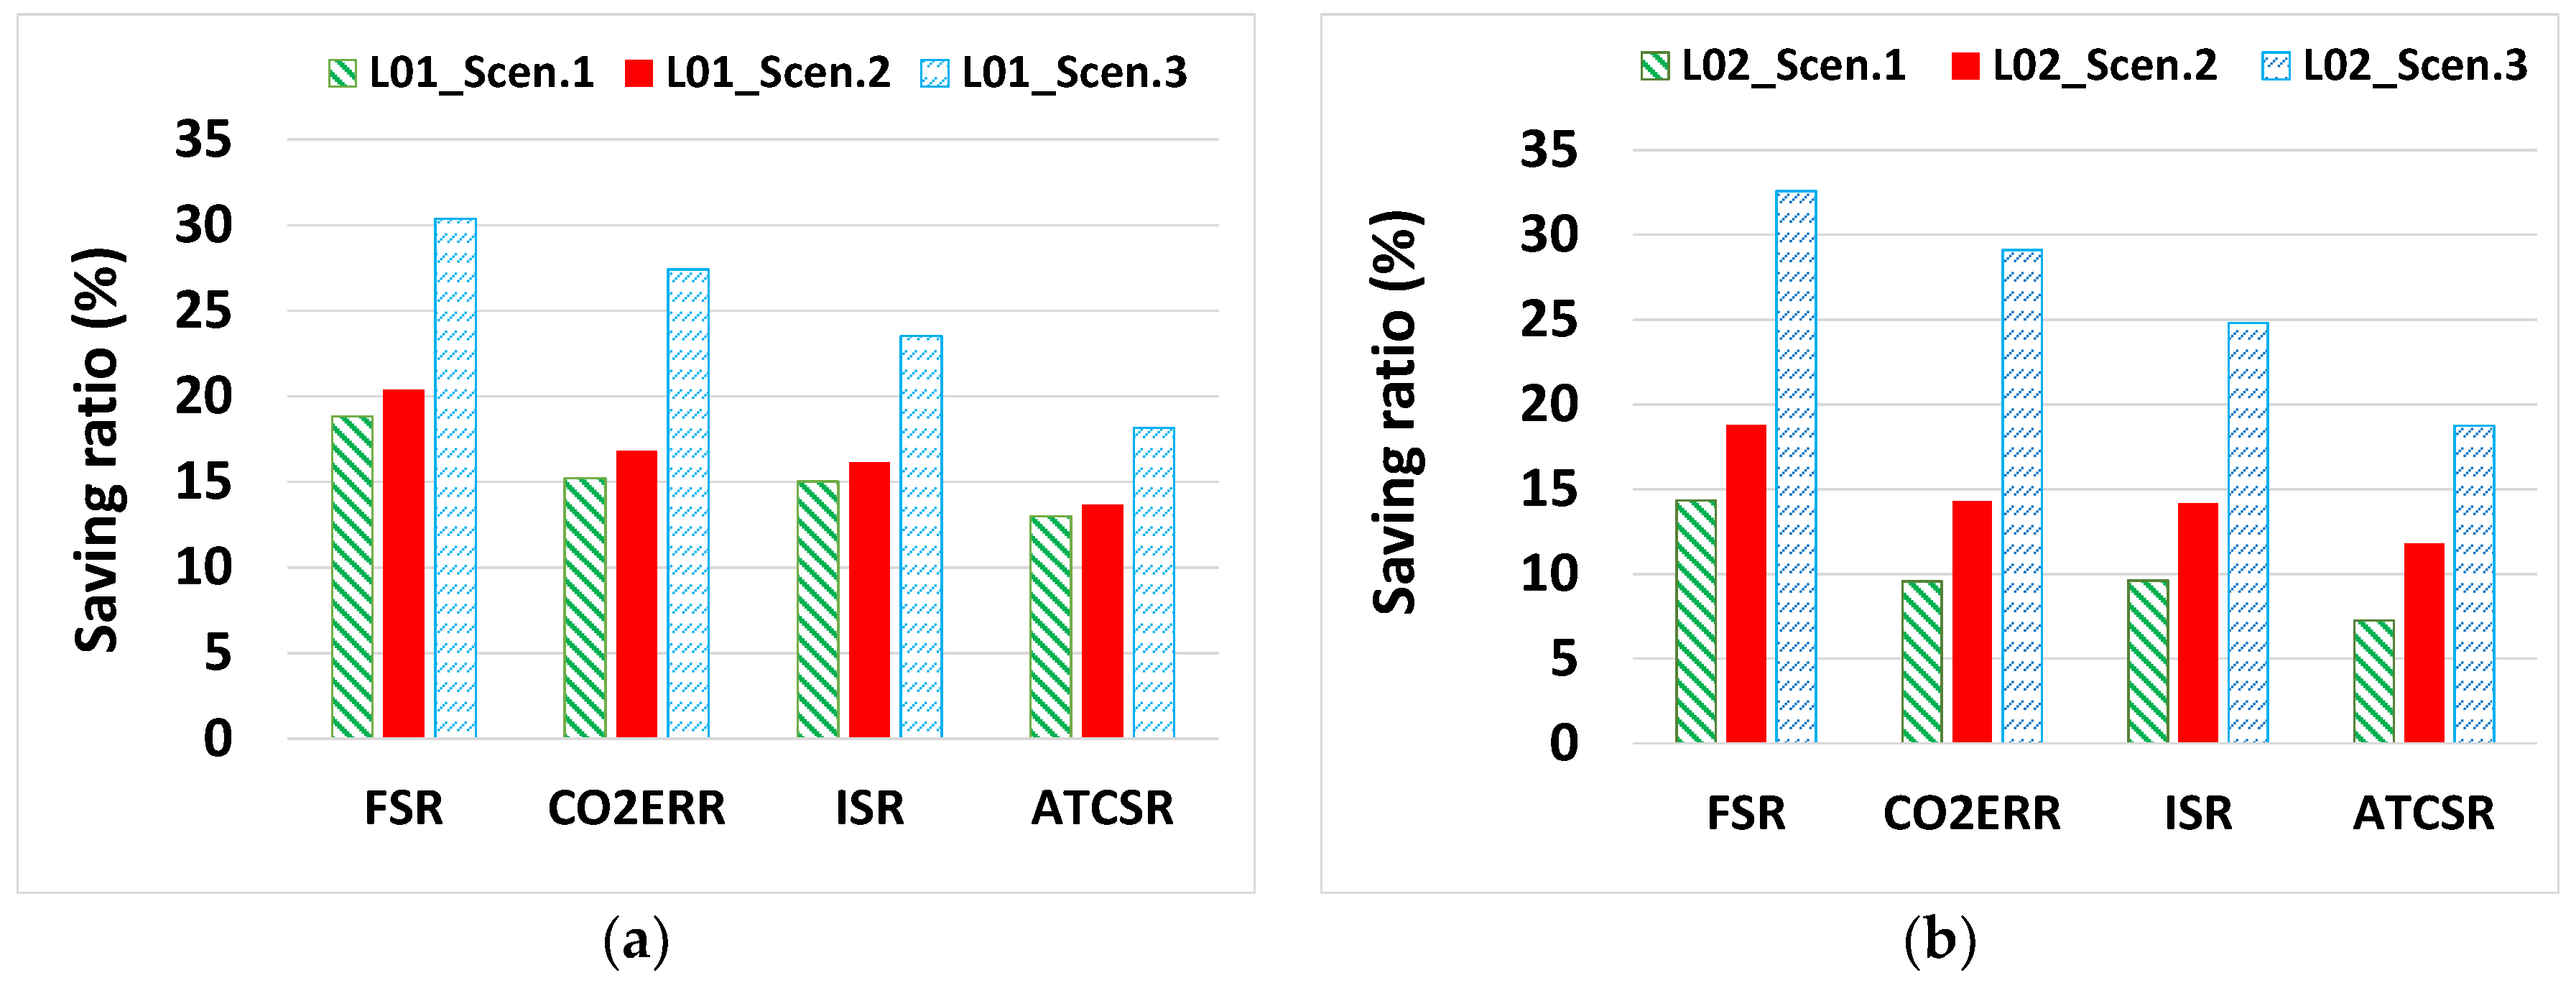
The performance of the optimal solutions for the scenarios and both load types is shown in Figure 9. The results show that all the polygeneration systems, regardless the scenario and load type, demonstrate economic, environmental and energetic benefits compared to the reference system. For both load types, the performance of the system regarding economy, energy and environment is the highest in scenario 3 and the lowest in scenario 1. In scenarios 1 and 2, the performance of the system for L01 is higher than that for L02, while in scenario 3 the performance for both load types is approximately the same.
As a general observation, in this case study, the performance of the polygeneration systems in the hospital with lower heating demand (L02) is lower than L01 in scenarios 1 and 2. The difference between the performance of the systems with L01 and L02 is greatest in scenario 1 and lowest in scenario 3. The effective exploitation of the excess heat and power for cooling purposes through the thermal and electric chiller as well as the cold storage in scenario 2 has improved the performance of the system. The presence of PV modules and solar heating units (scenario 3) decreases the fuel consumption and, consequently, increases the energetic and environmental performance of the system, which reduces the effect of the heat load profile on the performance criteria.
The existence of the PV units increases the excess power during hours with high solar radiation. However, adding cold storage to the system provides the possibility for producing extra cooling in case of excess power. This can balance the operation of the system by using the excess power in the system rather than exporting it to the grid. Furthermore, the solar heating units provide heating for the thermal chiller, which has significant impacts on CO2 emission reduction. It also boosts the economy of the system by avoiding electricity and fuel purchase costs. Therefore, the performance of the system in scenario 3 is significantly higher than the other two scenarios. Moreover, CO2 emission reduction in scenario 2 and 3 demonstrates the positive impact of the thermal chiller, thermal storage, as well as solar heat and power units. Emission mitigation is considered one of the most important features of a polygeneration system.
5.3. Hourly Operational Behavior
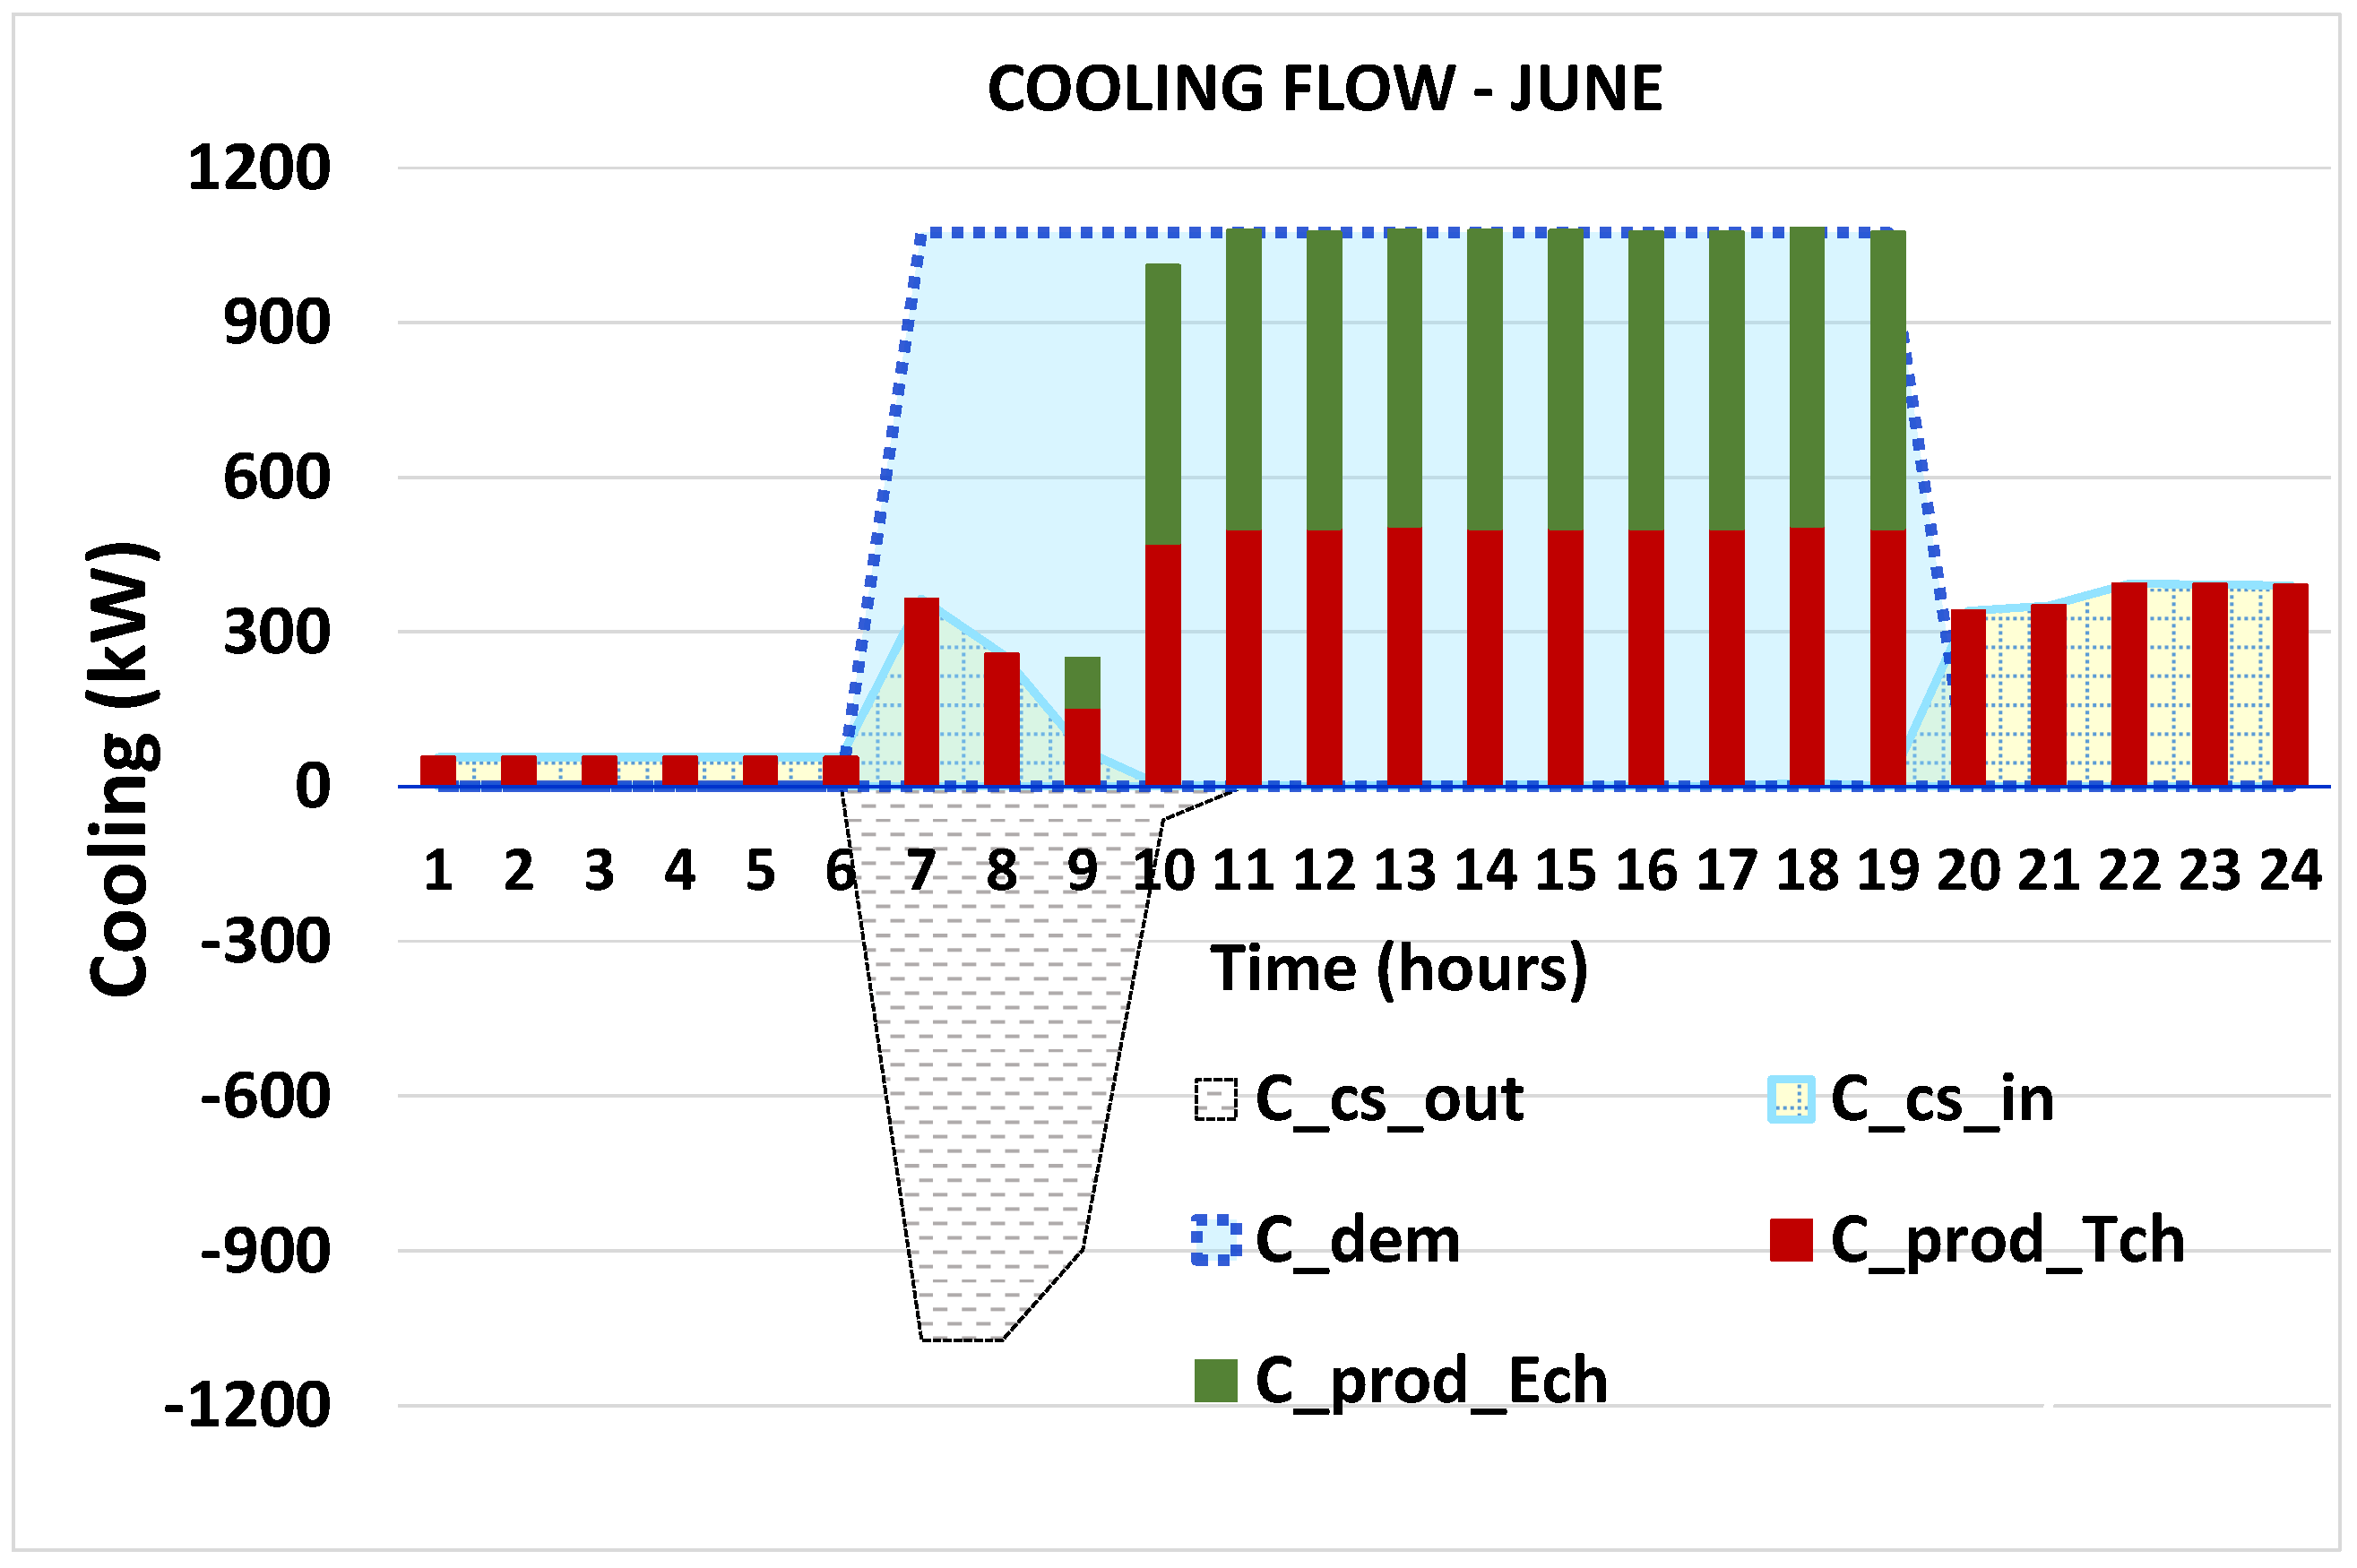
The operation of the system under scenario 3 is relatively complex due to the interaction of several components. This results in a complex energy flow in the system. To have a better picture of the system’s behavior, the energy flows and operation of the storage devices and CHP system are described for a representative day. The optimal solution of the load type L02 in scenario 3, which has the best performance amongst other cases, is chosen for further investigation. Operation of the system for a representative day (15 June) with an hourly resolution is examined. This day is chosen due to the co-existence of power, heating and cooling demand, which give a more comprehensive picture of the system’s behavior. The cooling, power and heating flows are presented in Figure 10, Figure 11 and Figure 12, respectively.
As shown in Figure 10, cold storage is given higher priority for cooling supply. The remaining cooling demand will be provided by the thermal chiller and/or electric chiller. The excess heat and power in the system will be used for extra cooling production. The cold storage plays a significant role in supplying the cooling demand. Between 6:00 and 10:00, a large portion of the cooling demand is provided by discharging the cold storage unit. The remainder is provided by the thermal chiller and electric chiller. Since heating and power demand are reduced in the evening, the excess heat and power are used to produce extra cooling, which is stored in the cold storage unit.
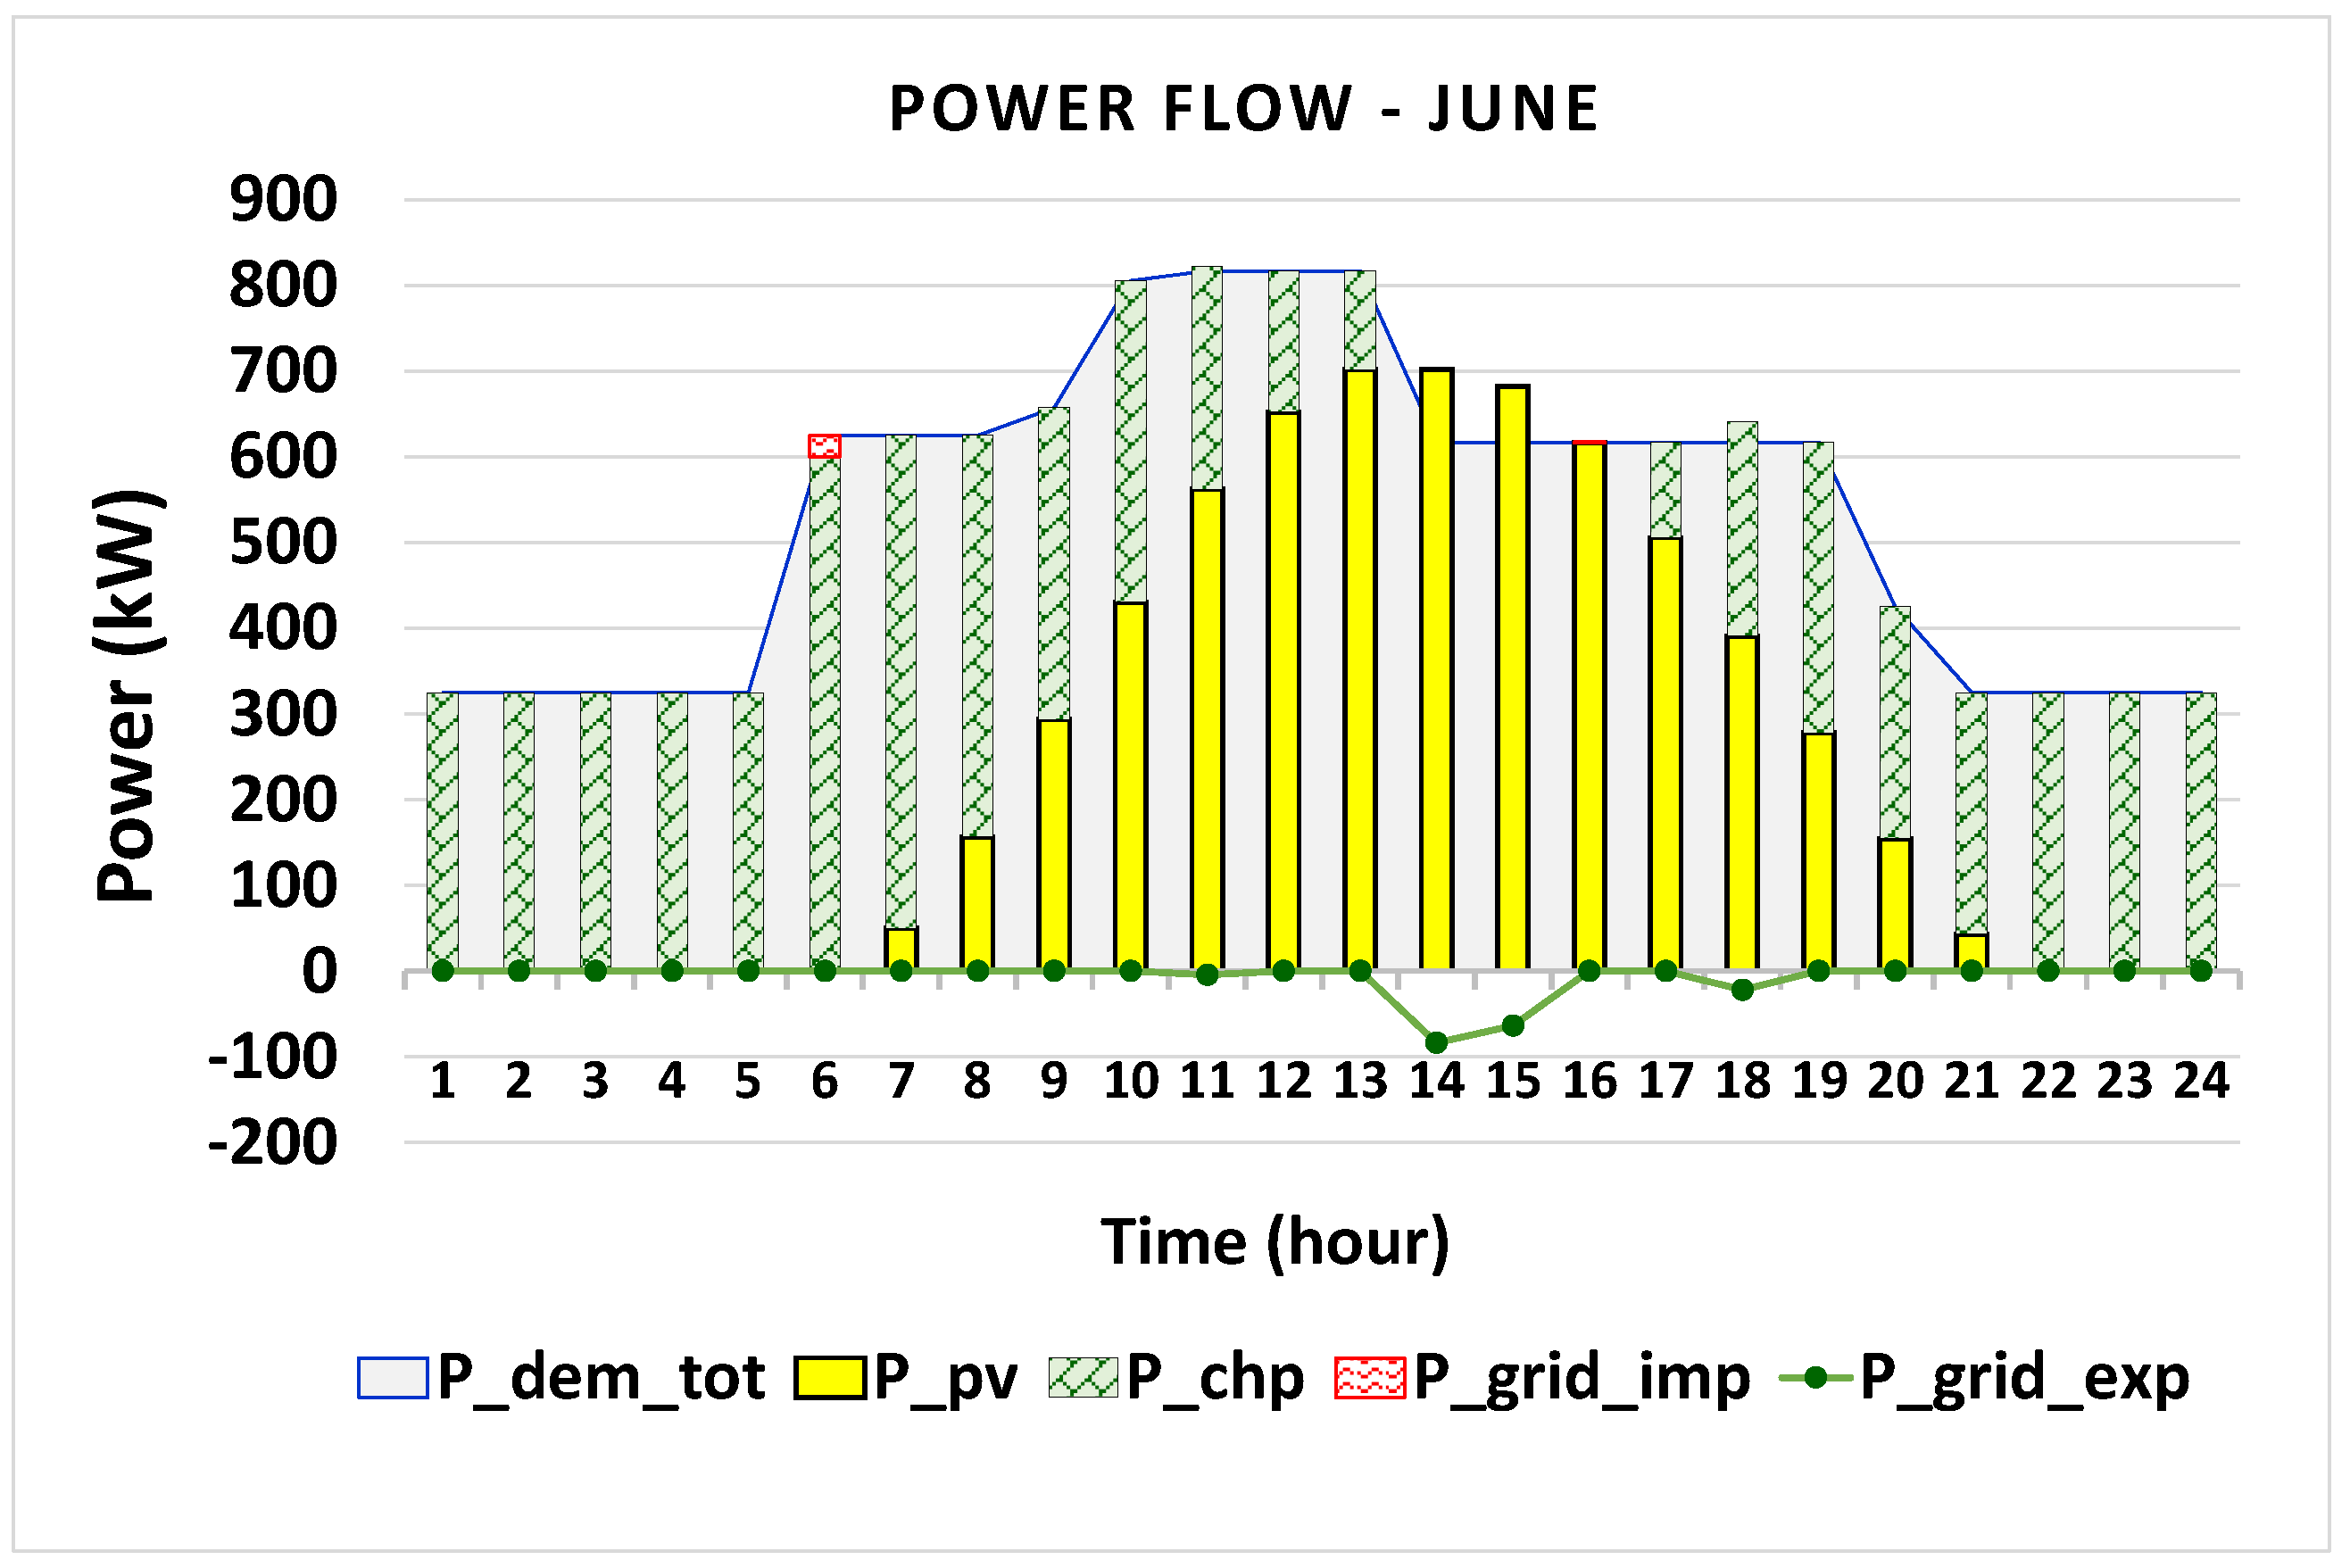
The power flow of the representative day is shown in Figure 11. Based on the FEL operating strategy, the PV units are given higher priority for power supply. The remaining power will be provided by the CHP unit. If there is a power deficit, power will be imported from the grid. During a few hours, for example at 14:00, the CHP is not in operation since the amount of power generated by the PV modules is enough. Since the power production by the CHP follows total electricity demand, there is no or little excess power from the CHP system, which can be exported to the grid. Most of the excess power is produced by the PV units, which is used for extra cooling production. The remaining excess power is exported to the grid.
Heating flow is shown in Figure 12. Based on the FEL operating strategy, the solar heating units are given a higher priority for heat supply. The remaining heating demand will be supplied by the CHP unit (H_chp) and the thermal storage (H_hs_out). If there is excess heat in the system, it will be initially used for cooling purposes and the remainder will be stored in the thermal storage.
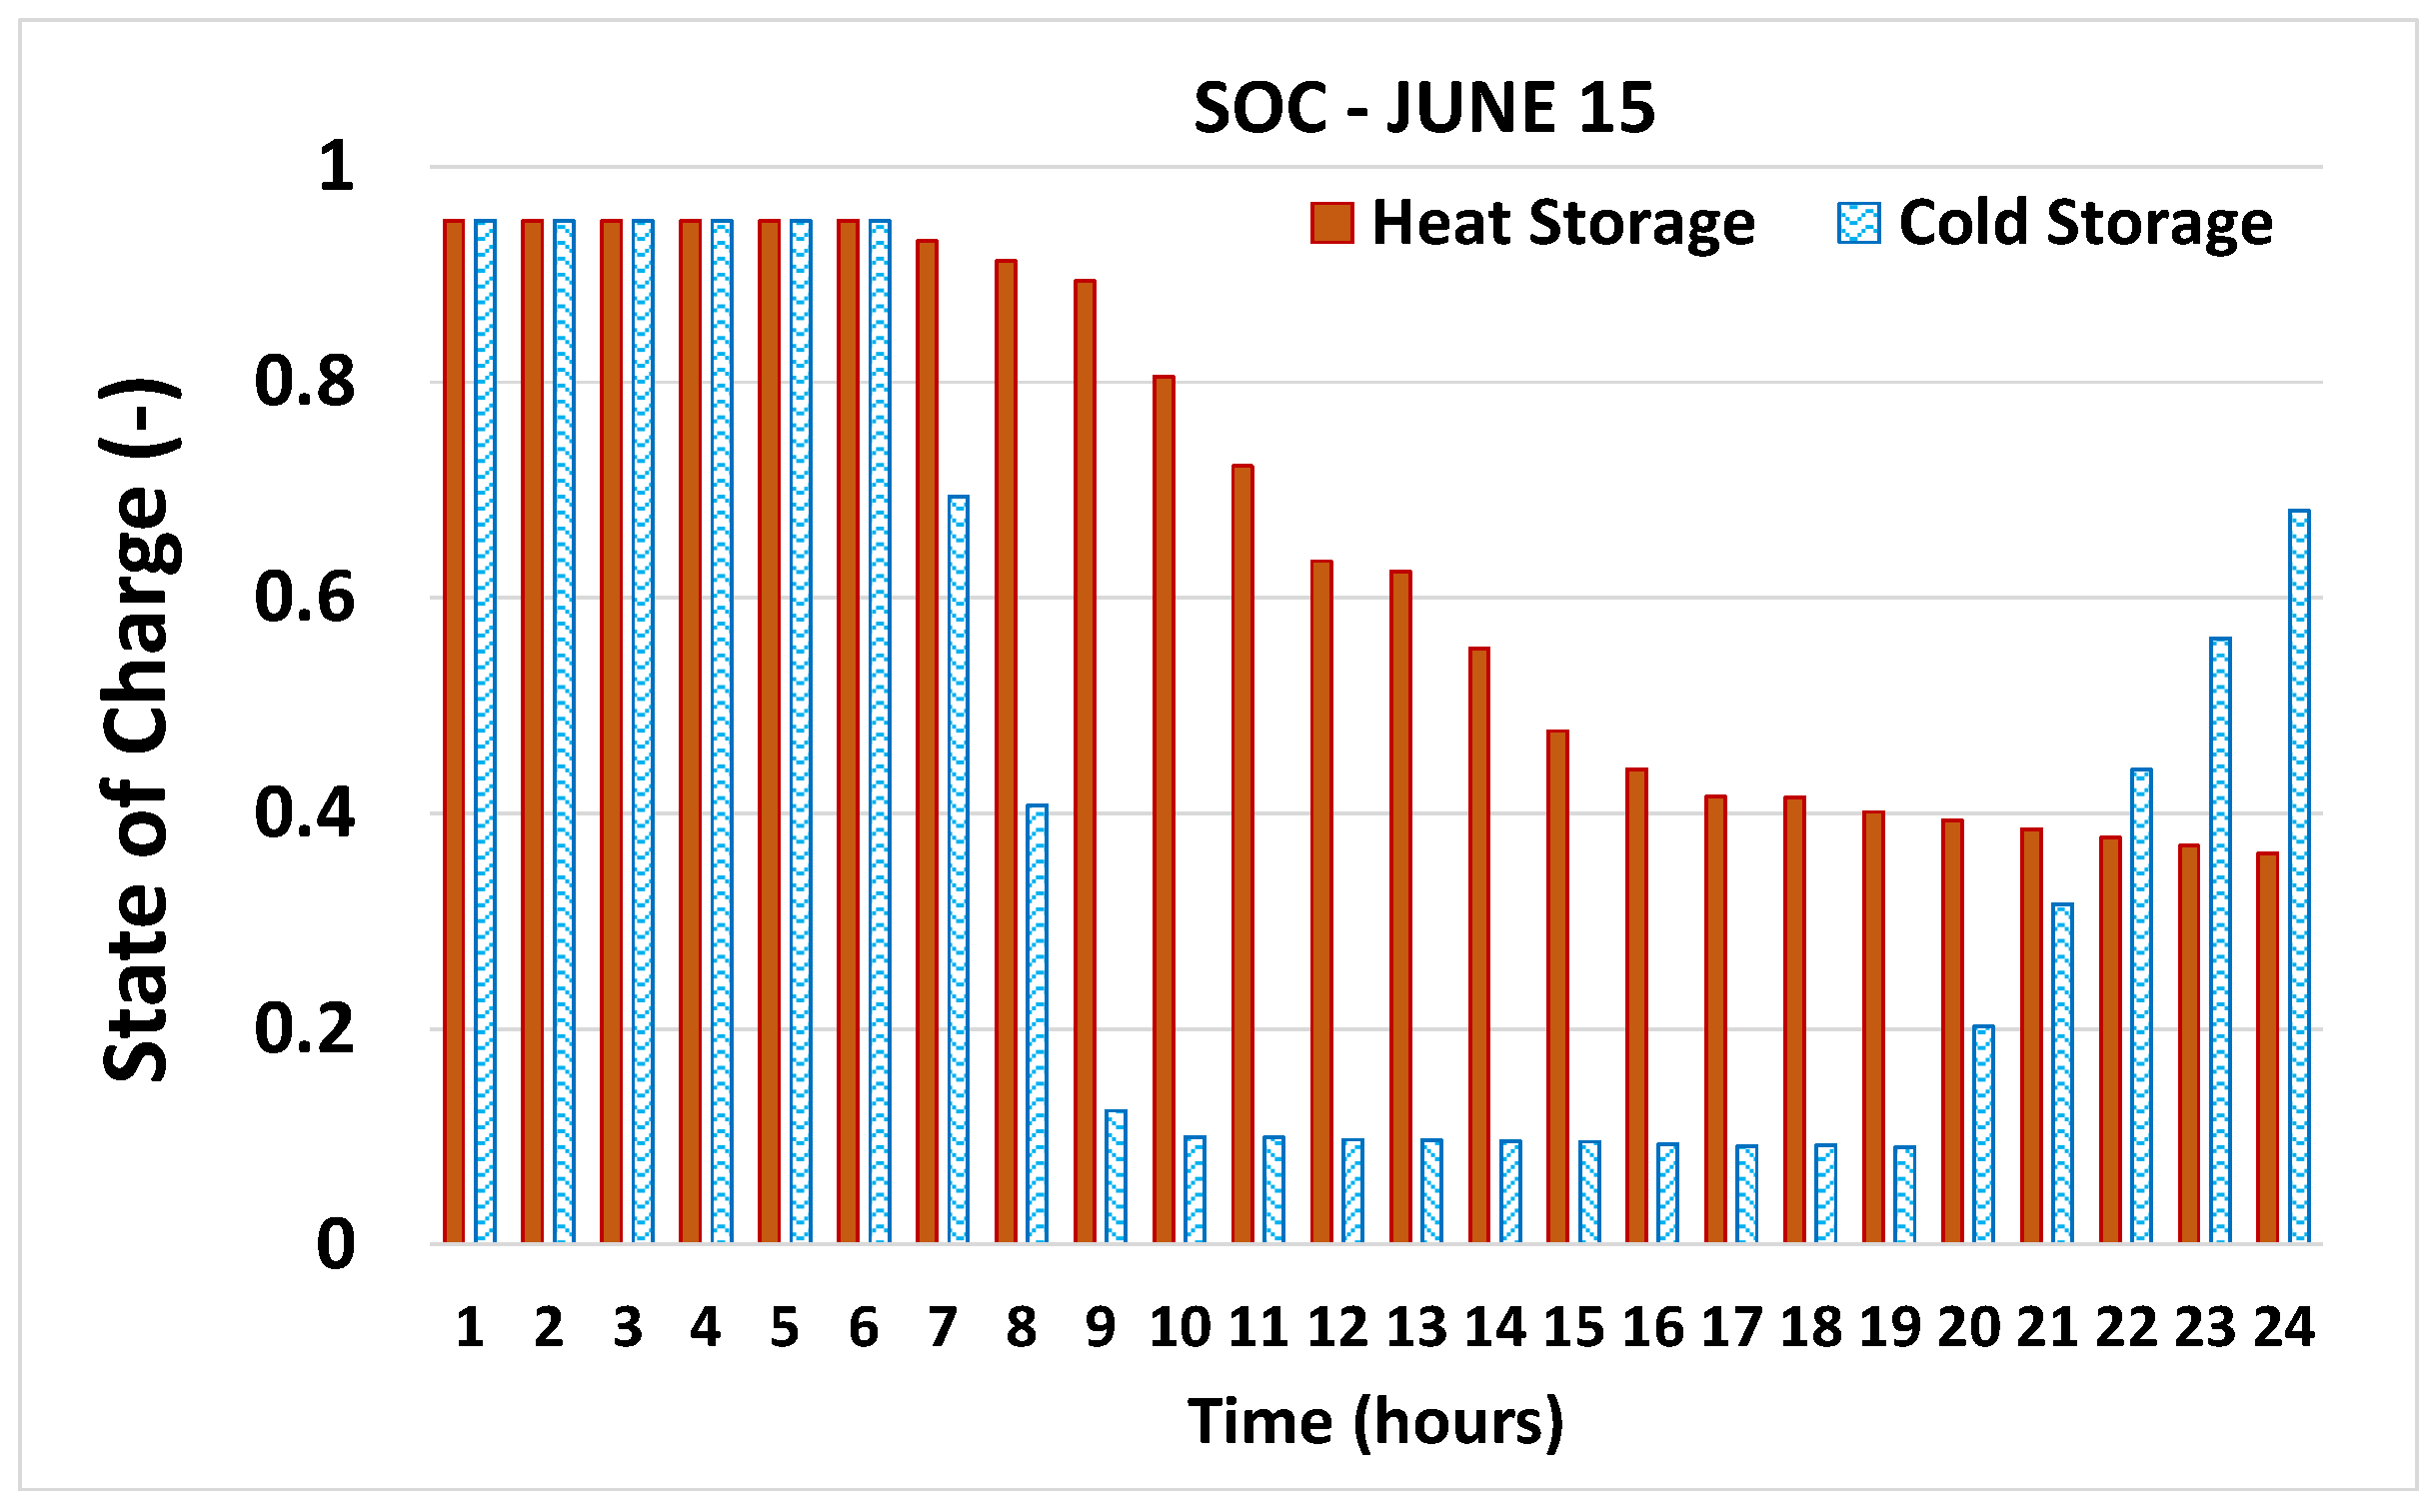
As shown in Figure 12, in the initial hours of the day (i.e., 1:00 to 5:00) the excess heat from the CHP is partially used to produce extra cooling and/or stored in the thermal storage. If the cold storage is completely filled (Figure 13) the remainder is considered as excess heat. In this situation, heat from the flue gas of the CHP is divereted through a bypass unit rather than going through the exhaust gas heat exchanger. This heat could be utilized for other heating purposes (such as water purification or heating up a swimming pool) if applicable.
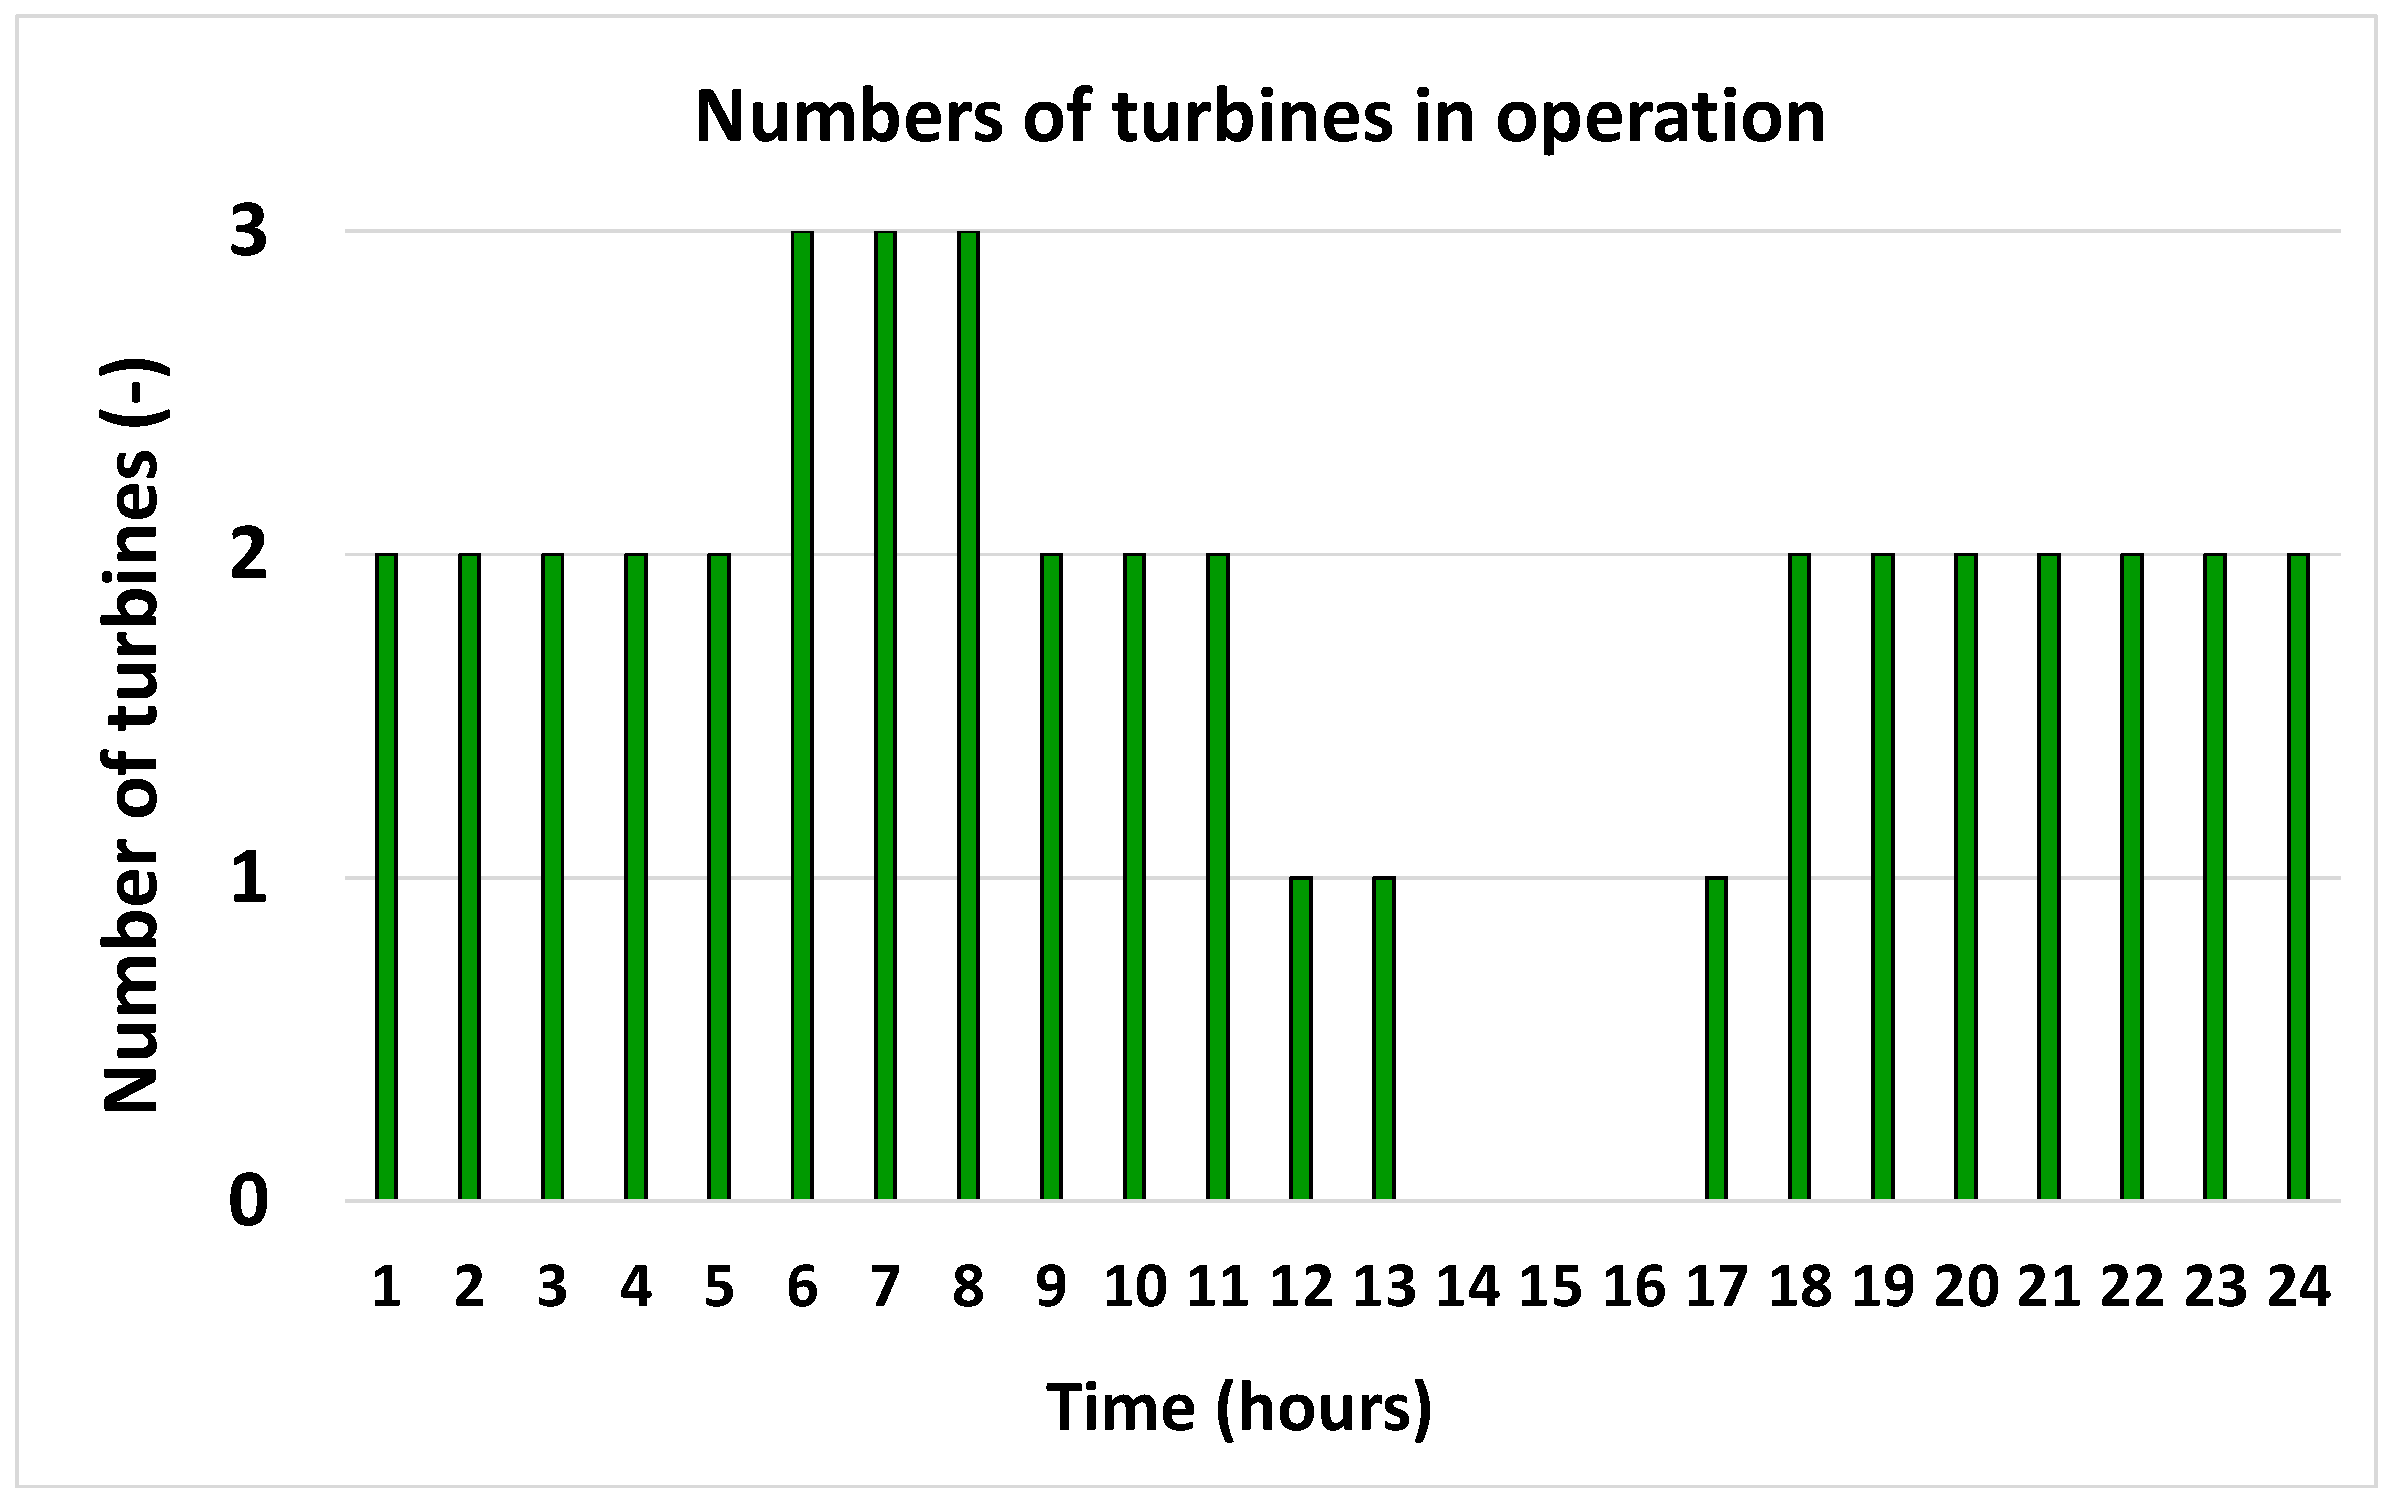
The operation of the CHP units as a prime mover has a significant effect on the performance of the system. In order to avoid operating the CHP at low load, a modular CHP system with a number of smaller CHP units was selected rather than a large CHP, which is operating at a low part-load. Therefore, the operation of the CHP units required frequent switching on-off with a minimum operation time. Since the time step of this simulation is one hour, the minimum operating time is equal to the time step. In this case, a 600 kW CHP system consisting of three 200 kWel CHP is selected. The number of CHP units in operation during the representative day is shown in Figure 14. As shown, in the majority of the hours of the day only two turbines are in operation. The third turbine is only operated for a few hours. When the production of the PV units is enough, the CHP system is not in operation.
The hourly operational behavior of the system indicates the complexity of interaction between various units in the polygeneration system and, consequently, the importance of the operating strategy. Moreover, it shows the role of the cold storage and thermal chiller in increasing the performance of the system by effective exploitation of the excess heat and power for cooling purposes. This consequently reduces waste heat and power consumption.
5.4. Economic Analysis
Economic feasibility is the main motivation for implementation of an energy system. Therefore, in-depth attention should be given to various economic metrics and criteria. The capital cost is one of these decision-making parameters. Many projects, despite their long-term economic benefits, are not attractive due to their higher capital cost. A lower capital cost does not necessarily imply a better overall economy, thus suggesting that other metrics such as NPV, IRR and PBP should be used for economic evaluation. In general, none of the economic metrics are flawless and using two or more metrics in the economic evaluation of a project gives a better understanding of the economic gain and losses [58]. In this case study, to perform a proper economic analysis, the above-mentioned metrics are investigated.
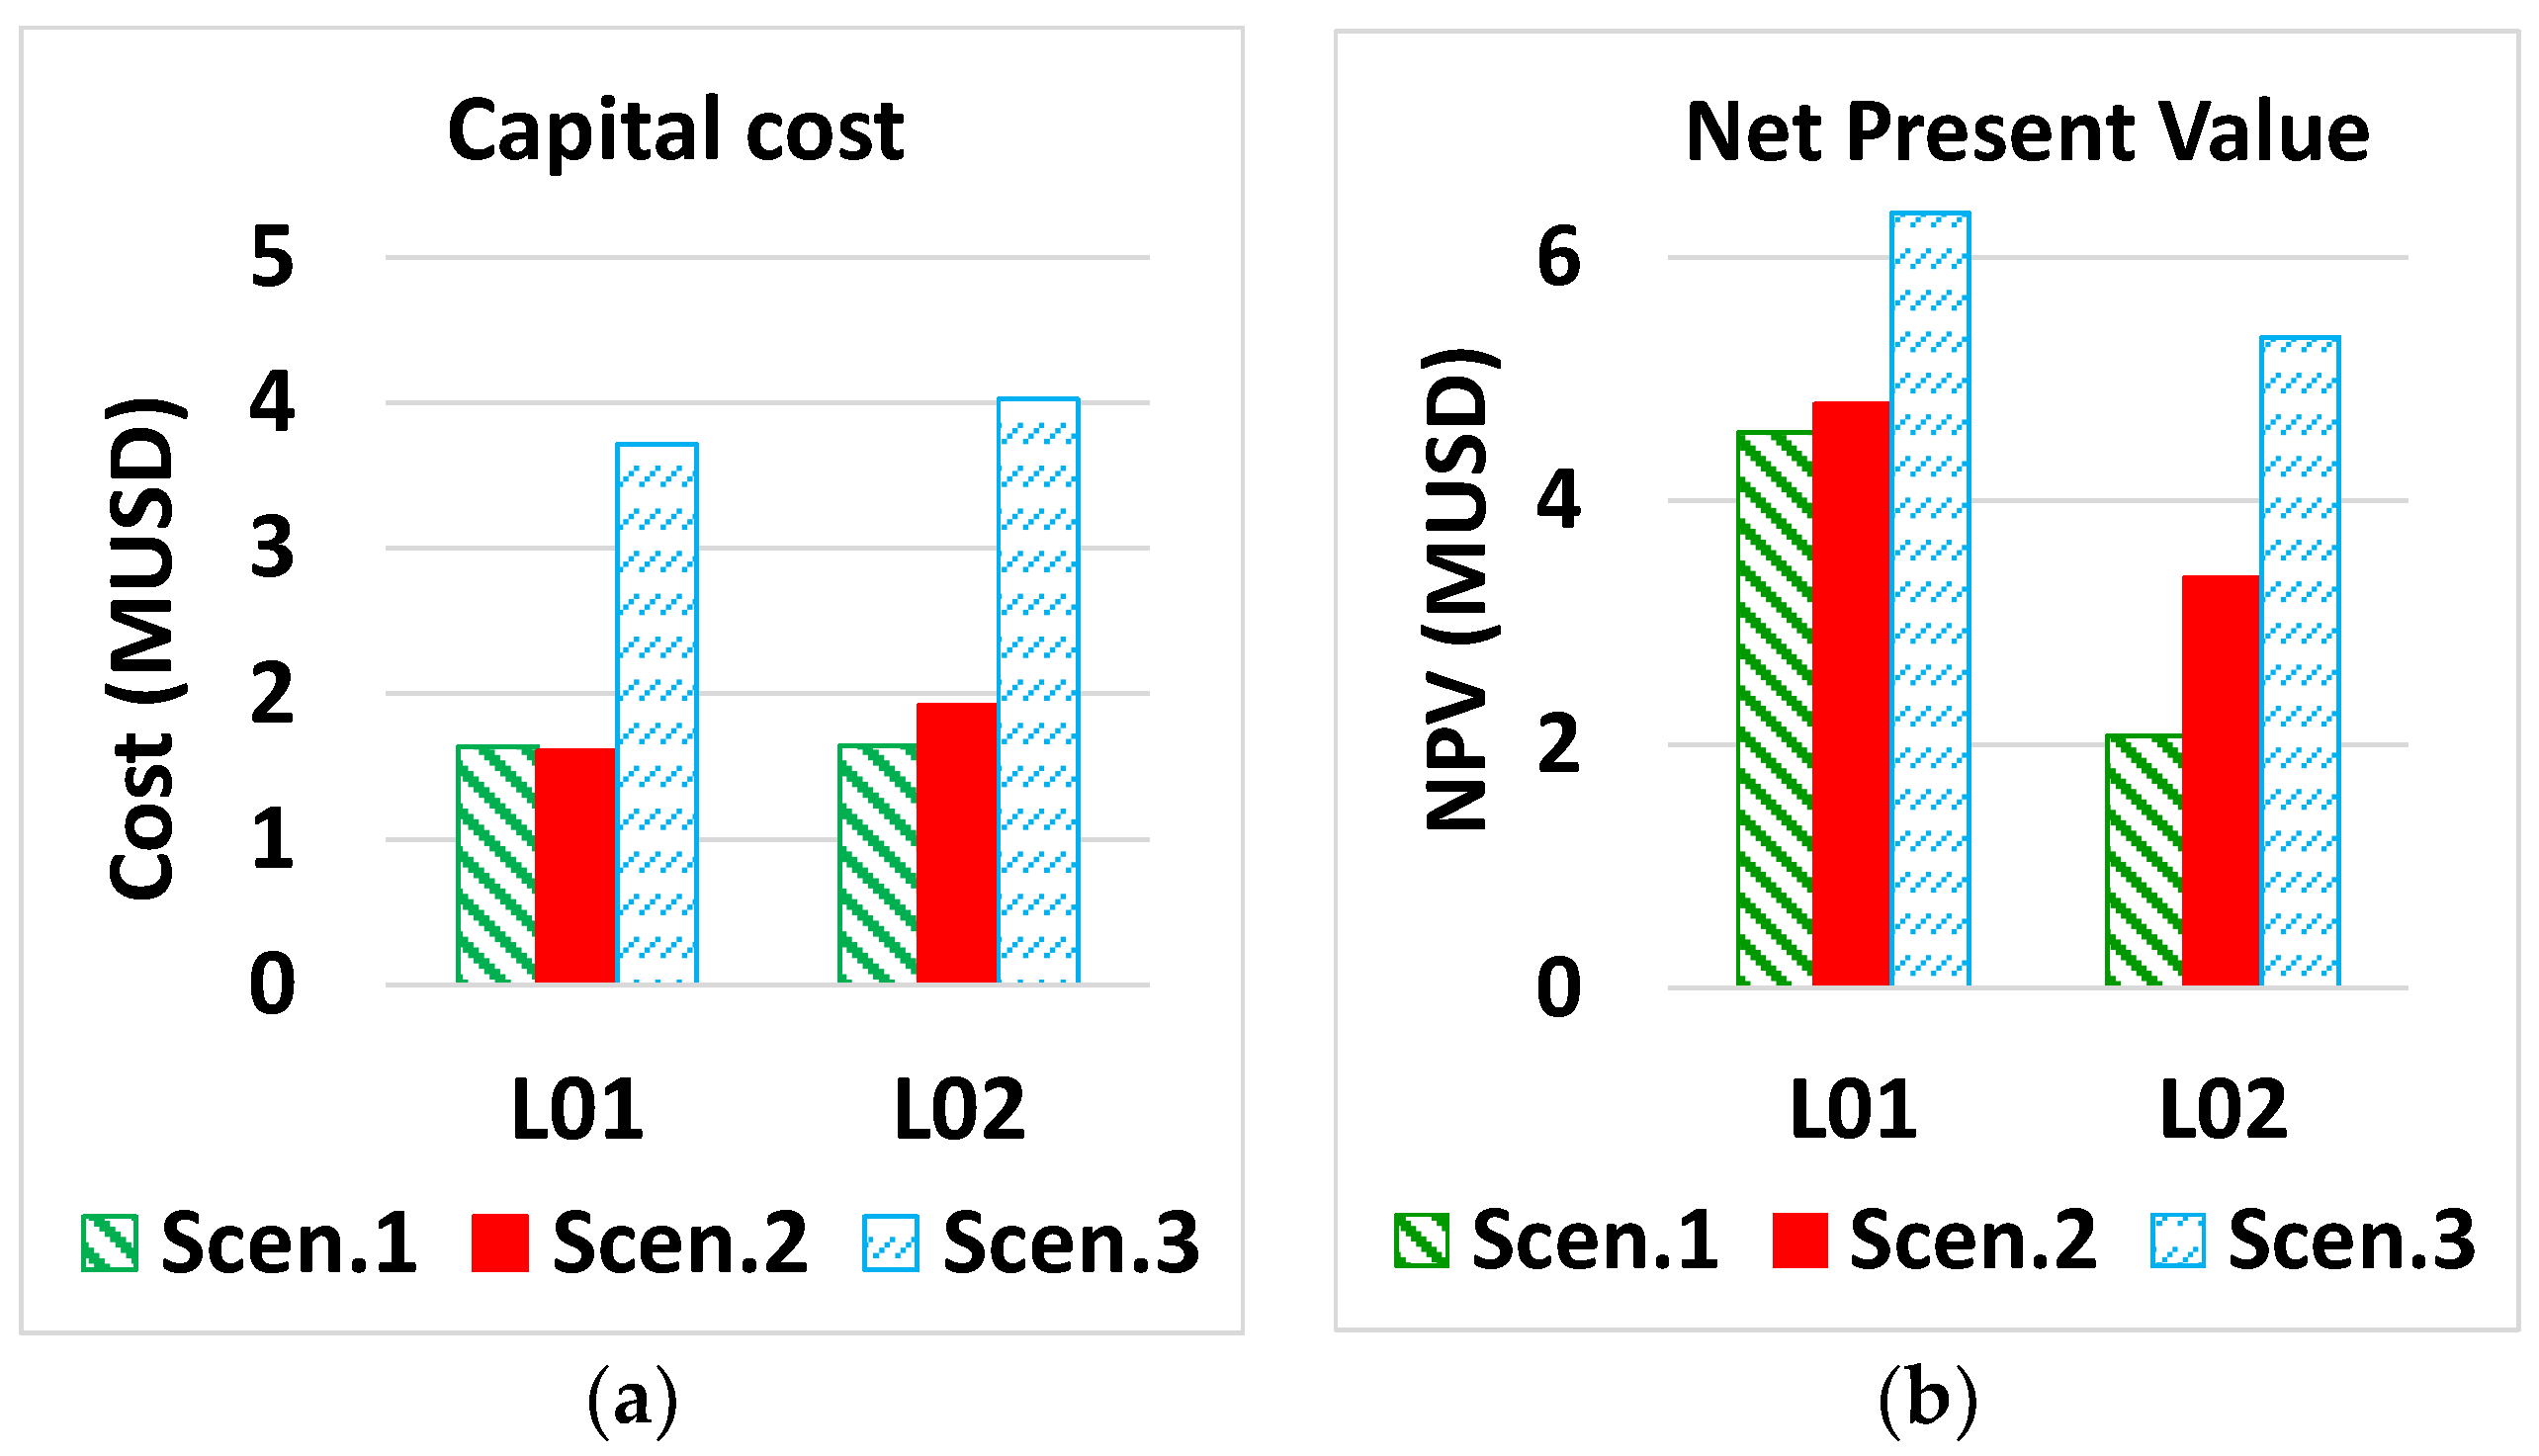
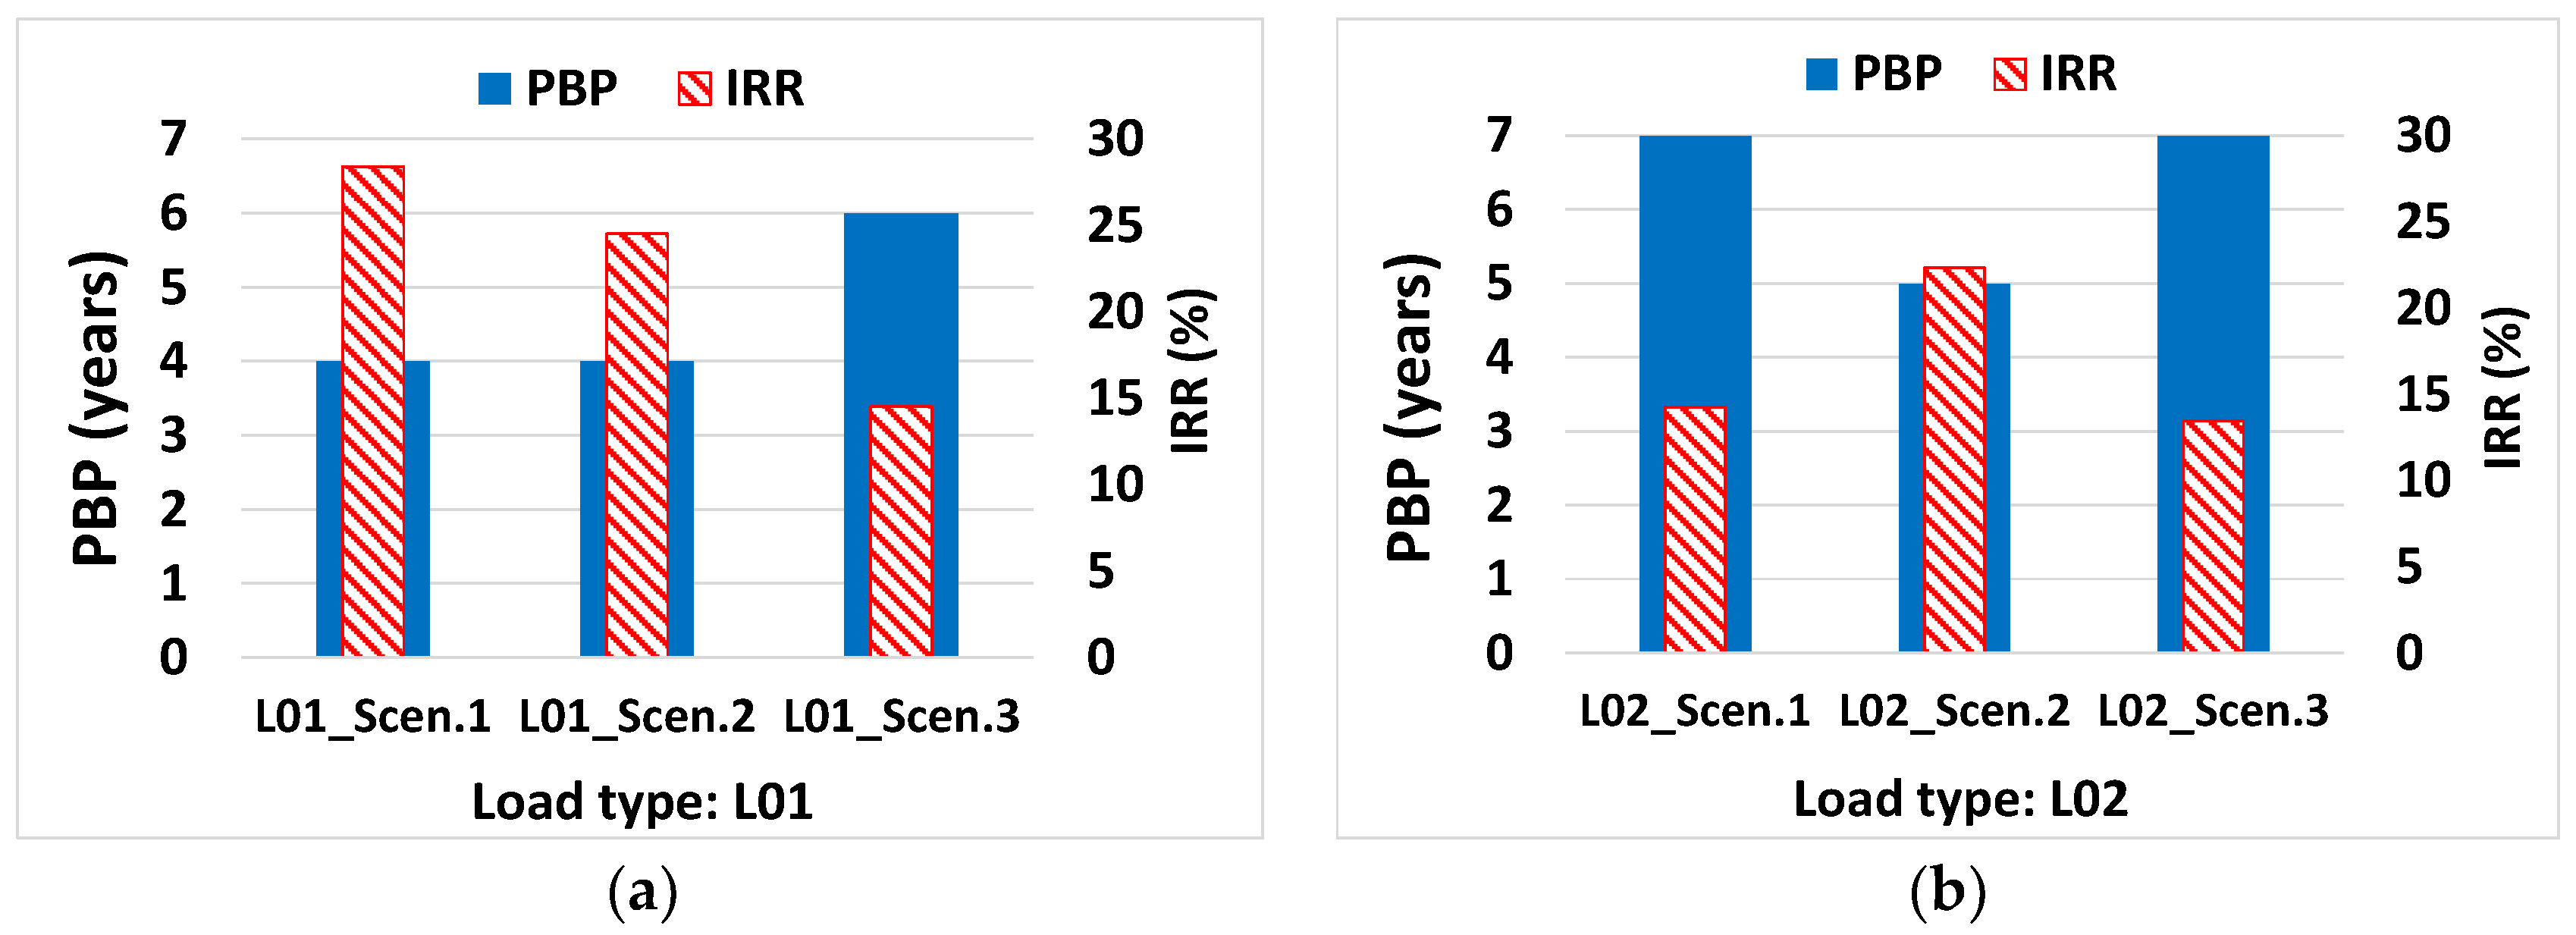
The capital cost of each scenario is shown in Figure 15. For both load types, scenario 3 has the highest capital cost. Therefore, this scenario is less attractive in the case of a limited budget. The differences between the capital costs of other scenarios are negligible and they are considered equally attractive if the initial budget is limited. The economy of the system for different scenarios and load types is presented in Figure 16. The payback period (PBP) of the scenarios for the system with load type L01 is lower than that in L02. In scenarios 1, 2 and 3 for L01, the PBPs are 4, 4 and 6 years, and in L02 they are 7, 5 and 7 years, respectively. When the two load types are compared, the difference between the payback periods and the internal rate of return is the highest in scenario 1.
Since L01 has a higher heat demand, the amount of fuel consumption is higher compared to L02. Therefore, since the system is compared with a reference system, which uses a boiler for heating purposes, there is a higher saving potential in a system with higher heating demand (L01) in scenarios 1 and 2. However, in scenario 3, since the heat and power demands are partially provided by the solar heating and PV units, the fuel consumption has a lower effect on the economy. In scenario 3, the effect of fuel consumption on the economy is reduced and the system with L01 has slightly better economic performance compared to L02. It can be concluded that the presence of the thermal chiller and cold storage (scenario 2), solar heating and power units (scenario 3) has positive impacts on the economy of the system. Furthermore, even though these components add more complexity to the system, their presence can minimize the effect of heat load type on the economy of the system through the avoided cost of fuel and electricity purchases as well as the benefits achieved by selling the excess power to the grid.
A shorter payback period does not necessarily demonstrate a better economy, and cash flow after the break-even point is very important in a feasibility study. Therefore, the value of NPV should also be considered in the economic analysis. Referring to Figure 15, in both load types the differences between the capital costs in scenario 1 and 2 are relatively low. Both scenarios with L01 have higher NPV compare to L02, and hence offer better economic options. Comparing the NPV of a scenario with different load types is reasonable since they have approximately equal initial costs. However, a higher value of NPV does not necessarily imply a better economic choice while comparing projects with different initial costs. In such a situation, the values of IRR should also be analyzed. The IRR is a good metric to rank investments on projects with different initial costs [58]. As shown in Figure 15, the NPV in scenario 3 is the highest. However, a higher payback period, slightly lower IRR and higher capital costs are the conflicting parameters, which one should consider in mutually exclusive investment decisions.
Since the output of polygeneration systems is heating, power and cooling, the value of the levelized cost of electricity (LCOE) is not an exhaustive metric in a polygeneration system. However, due to its frequent usage in the evaluation of power systems, it is presented here for comparative analysis. To estimate the value of LCOE, it is assumed that the electricity is the main commodity and the heat produced by the CHP and the cooling produced by the thermal chiller are considered as by-products. The effect of these by-products is reflected as an income as if the products could be sold in the market. The cost of heating is estimated based on an equal heat production cost by a boiler. The cost of cooling is calculated as if it is generated by an electric chiller powered by the grid. The calculated values are 0.07 USD/kWc for cooling and 0.08 USD/kWth for heating production.
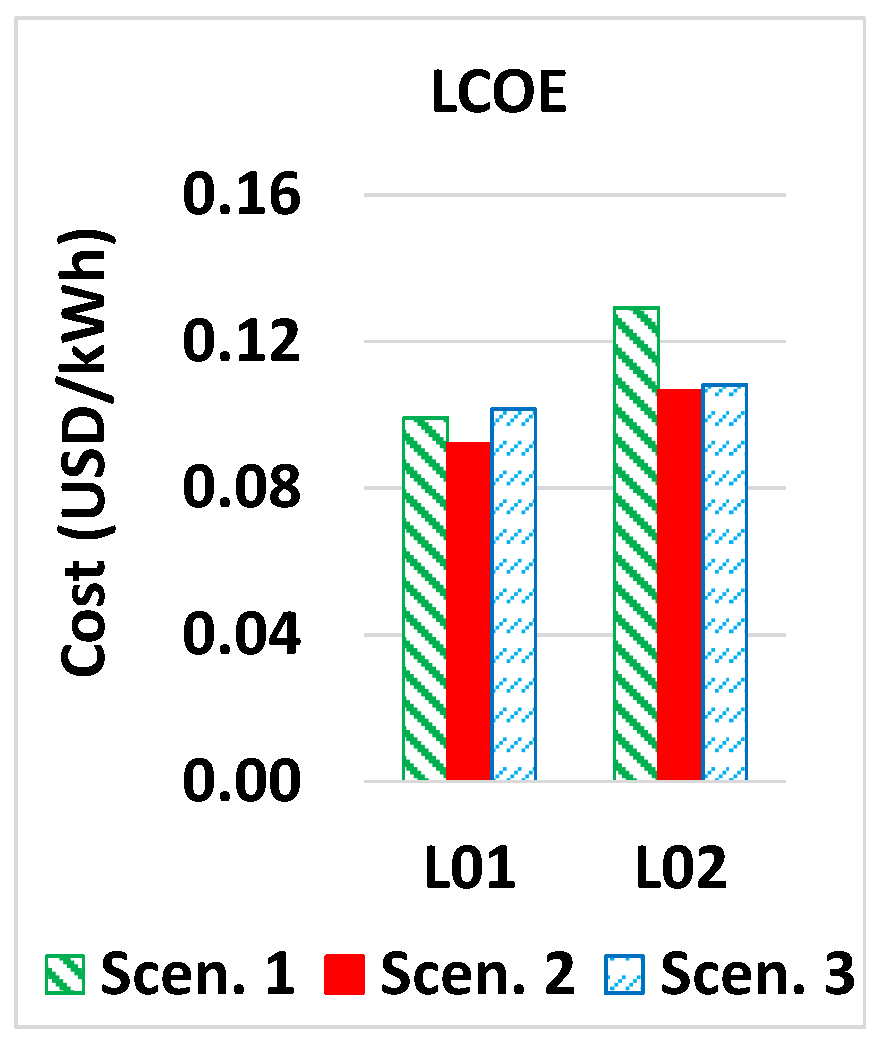
The LCOEs for the scenarios and load types are shown in Figure 17. As shown, the LCOEs are between 0.09 USD/kWel and 0.13 USD/kWel, which are competitive to the electricity price in the market (0.12–0.24 USD/kWel). The differences between the LCOEs for different scenarios in L01 are not significant. In L02, however, the LCOE for scenario 1 is 0.13 USD/kWel, which is higher than that in the other two scenarios. This means that the higher heating demand in L01 results in a lower cost of electricity production in scenario 1. For L02, the LCOE is scenario 2 and 3 is decreased. This means that the presence of thermal storage units, a thermal chiller, solar PV and solar heating units can decrease the cost of electricity production.
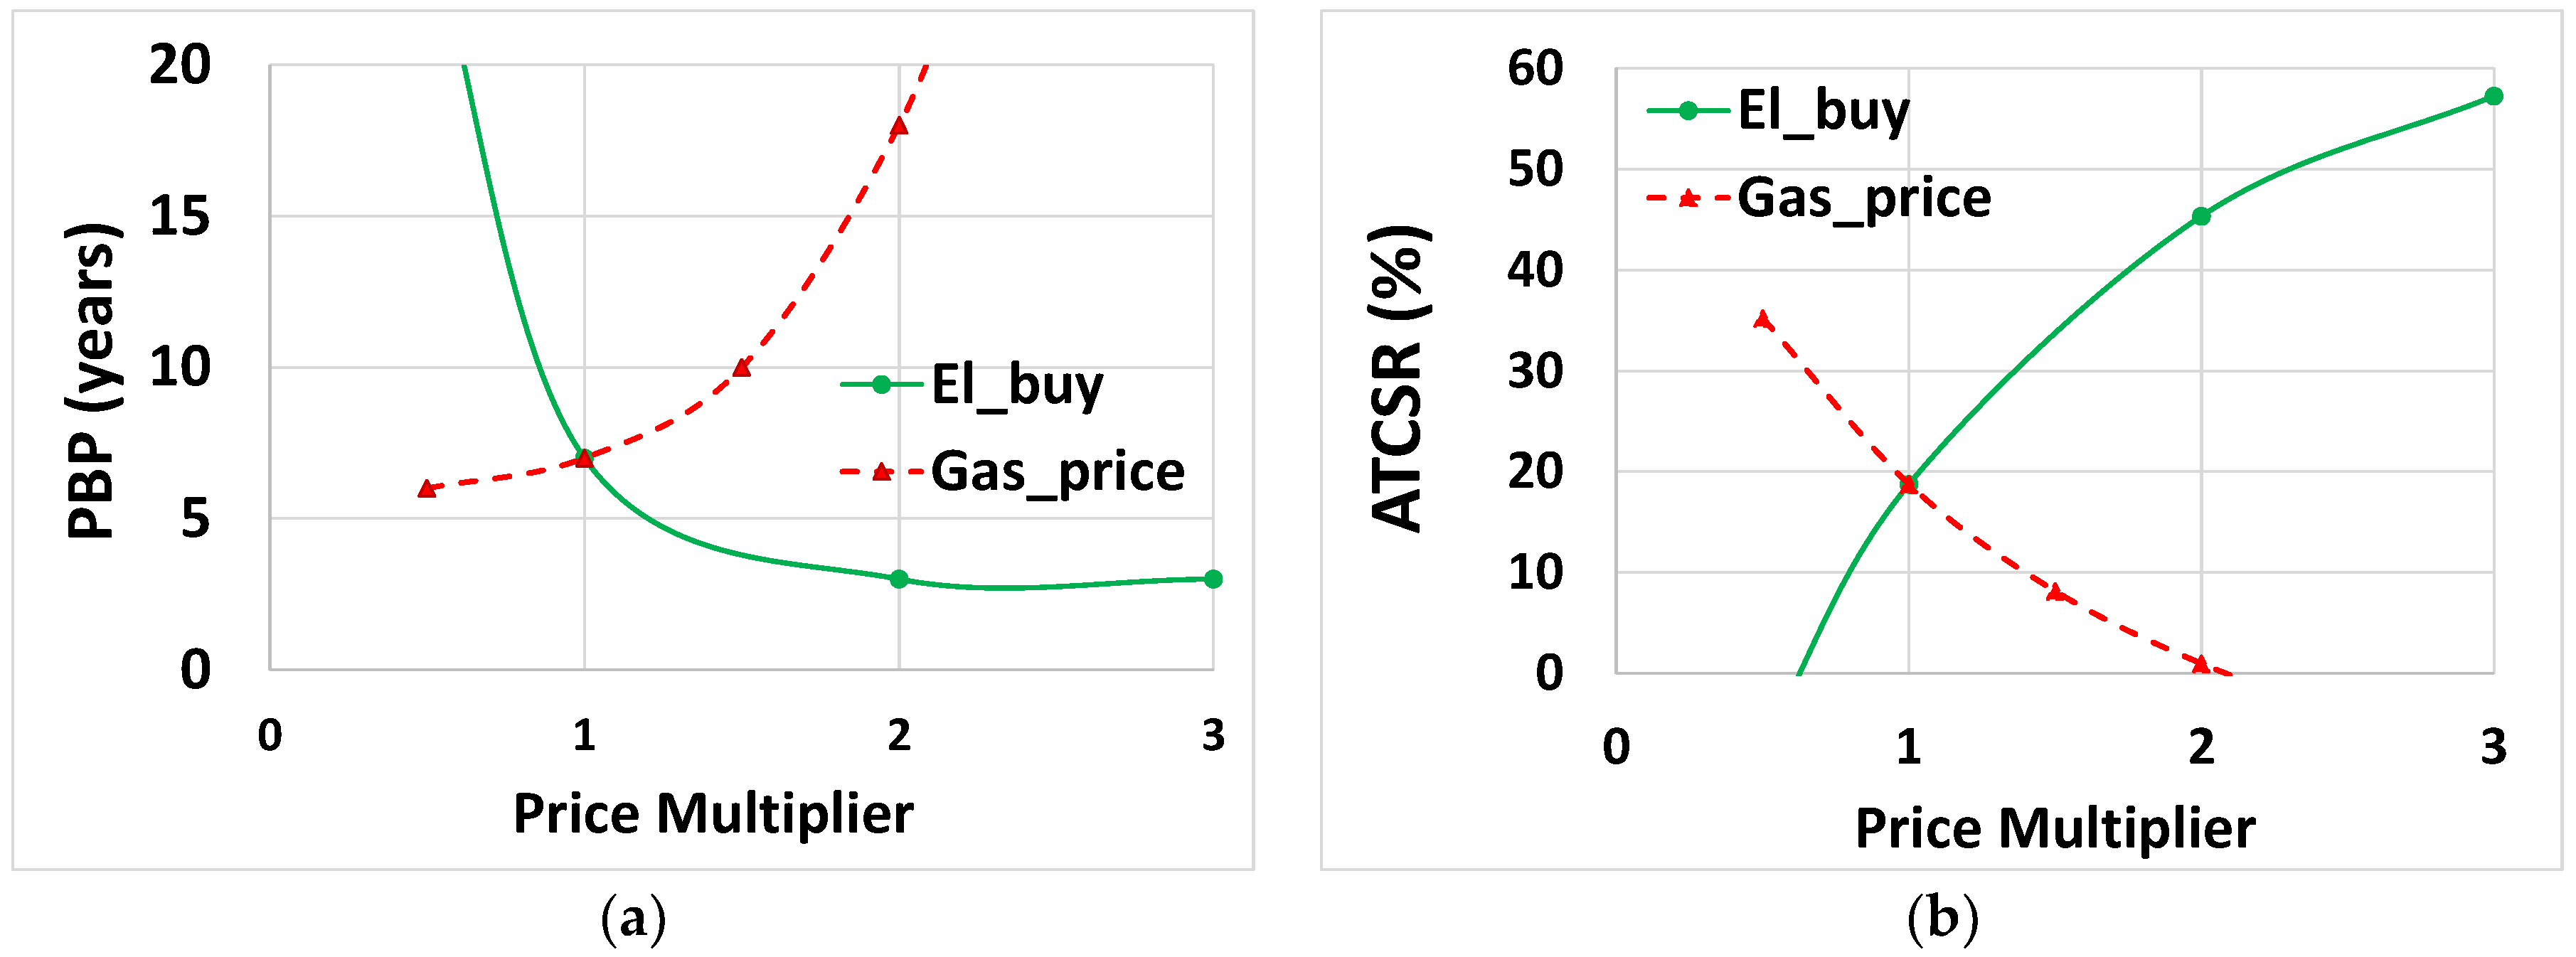
The results are highly sensitive to the basic assumptions for the characteristics of the reference system and the energy market in the region. The main reason for the economic viability of this case study is the high price of electricity in the Italian market and the specification of the identified reference system. The performance of the system will be different if located in a region with different assumptions. Electricity and gas prices have a significant impact on the economic viability of the system. The highest ISR belongs to scenario 3 and L02, as shown in Figure 9. Therefore, the operation of this scenario has been studied further in order to investigate the effect of electricity and gas price on the optimal solutions. In order to understand this effect, the electricity and gas prices are increased or decreased by a multiplier. As presented in Figure 18, by increasing the gas price and/or decreasing the electricity price, the payback period is increased while ATCSR is decreased.
However, the effects of gas price and electricity price are different. For example, a price multiplier of 2 in the electricity price can increase the ATCSR from 19% to 45%, while using the same multiplier in the gas price decreases the ATCSR from 19% to 1%. The result of the case study shows that a higher electricity price and a lower natural gas price will improve the economy of the system. Therefore, implementation of a polygeneration system in an energy market with a high electricity price and a low gas price is more attractive in terms of economy. However, the result cannot be generalized due to various parameters involved in the performance analysis. Thus, each case should be studied individually for a detailed evaluation.
6. Conclusions
In this study, the performance of a polygeneration system for three design scenarios and two load types was investigated. The first scenario included the basic components of a polygeneration system. In the second scenario, the thermal chiller and cold storage units were added to the first scenario. In the third scenario, solar heating and PV modules were added to the second scenario. Load type L01 has a higher heating demand with no seasonal changes, and load type L02 varies monthly and has lower heating demand.
The results show that application of such systems in a hospital can be very attractive from the economic, energetic and environmental perspective. The performance of the polygeneration system (ISR) is the highest in scenario 3 and the lowest in scenario 1 in both load types. Considering both load types, the differences between the ISR in scenario 3 are negligible. Adding a thermal chiller, a cold storage unit, PV modules and solar heating units increased the capital cost of the system. However, the added economic values during the lifetime of the project, such as the avoided electricity and fuel purchase, made the system economically competitive. For the system with the highest ISR (scenario 3), a fuel saving of 32% was obtained while an annualized total cost saving of 19% was achieved during the lifetime of the project. In addition, adding these components in scenarios 2 and 3 increased the payback period maximum two years, which is relatively low.
In scenarios without solar heating and solar power units (scenarios 1 and 2), the system with higher heating demand achieved higher performance. However, the presence of these components in scenario 3 decreased the fuel consumption, balanced the demand and supply, and smoothed the effect of heating load on the performance of the system. These facts together with 29% of CO2 emission reduction make the polygeneration system an attractive choice. Generally, it can be concluded that polygeneration systems in a market with a higher electricity price and a lower natural gas price offer better economic options. However, due to the various parameters involved in the performance evaluation, every polygeneration system should be investigated individually. In future, the effect of climate zones, which can influence the load demand profiles and availability of the energy sources, on the performance of polygeneration systems will be studied.
Author Contributions
Sara Ghaem Sigarchian conceived and designed the model; Anders Malmquist and Viktoria Martin contributed jointly by supervising the overall work and overall structure of the paper; Sara Ghaem Sigarchian wrote the paper.
Acknowledgments
The present research work was financially supported by the Swedish government’s strategic research area STandUP for Energy.
Conflicts of Interest
The authors declare no conflict of interest.
Nomenclature
| ATCSR | Annualized total cost saving ratio (%) | Superscripts | |
| C | Cooling (kW) | Poly | Polygeneration system |
| CCHP | Combined cooling, heating and power | Ref | Reference system |
| CHP | Combined heat and power | Subscripts | |
| CO2ERR | CO2 emission reduction ratio (%) | c | Cooling |
| COP | Coefficient of performance (-) | chp | Combined heat and power |
| CS | Cold storage | cs | Cold storage |
| F | Fuel energy (kWh) | dem | Demand |
| FEL | Following electric load | dl | Distribution line |
| FTL | Following thermal load | Ech | Electric chiller |
| FS | Fuel saving (USD) | el | Electricity |
| FSR | Fuel saving ratio (%) | exp | Export |
| H | Heating (kWth) | f | Fuel |
| Hs | Heat storage | grid | Utility grid |
| IRR | Internal rate of return (%) | hru | Heat recovery unit |
| ISR | Integrated saving ratio (%) | hs | Heat storage |
| LCOE | Levelized cost of electricity | imp | Import |
| MBL | Modified base load | in | Input |
| NPV | Net present value | pv | Photovoltaic panel |
| P | Power (kWel) | ||
| PV | Photovoltaic | shu | Solar heater unit |
| PBP | Payback period (year) | sup | Supply |
| PL | Part-load (%) | Tch | Thermal chiller |
| PSO | Particle swarm optimization | ||
| t | Time | th | Thermal |
| T | Temperature (°C) | tot | Total |
| ToU | Time of Use | wind | Wind turbine |
| W | Weighting factor | ||
| Greek letters | |||
| µ | Emission factor(g/kWh) | ||
| ƞ | Efficiency (%) | ||
References
- U.S. Energy Information Administration (EIA). International Energy Outlook 2016; U.S. Energy Information Administration (EIA): Washington, DC, USA, 2016.
- Dean, B.; Dulac, J.; Petrichenko, K.; Graham, P. Towards Zero-Emission Efficient and Resilient Buildings Global Status Report 2016; United Nations Environment Programme (UNEP): Nairobi, Kenya, 2016. [Google Scholar]
- European Commission Directorate-General for Energy. Communication from the Commission to the European Parliament, the Council, the European Economic and Social Committee and the Committee of the Regions: An EU Strategy on Heating and Cooling; European Commission, Directorate General for Energy: Brussels, Belgium, 2016.
- Calise, F.; D’Accadia, M.D. Simulation of polygeneration systems. Energies 2016, 9, 925. [Google Scholar] [CrossRef]
- International Energy Agency (IEA); Fraser, P. Distributed Generation in Liberalised Electricity Markets; OCEA/IEA: Paris, France, 2002; ISBN 9789264198029. [Google Scholar]
- El-Khattam, W.; Salama, M.M.A. Distributed generation technologies, definitions and benefits. Electr. Power Syst. Res. 2004, 71, 119–128. [Google Scholar] [CrossRef]
- Pepermans, G.; Driesen, J.; Haeseldonckx, D.; Belmans, R.; D’haeseleer, W. Distributed generation: Definition, benefits and issues. Energy Policy 2005, 33, 787–798. [Google Scholar] [CrossRef]
- Al Moussawi, H.; Fardoun, F.; Louahlia-Gualous, H. Review of tri-generation technologies: Design evaluation, optimization, decision-making, and selection approach. Energy Convers. Manag. 2016, 120, 157–196. [Google Scholar] [CrossRef]
- Mancarella, P. MES (multi-energy systems): An overview of concepts and evaluation models. Energy 2014, 65, 1–17. [Google Scholar] [CrossRef]
- Jana, K.; Ray, A.; Majoumerd, M.M.; Assadi, M.; De, S. Polygeneration as a future sustainable energy solution—A comprehensive review. Appl. Energy 2017, 202, 88–111. [Google Scholar] [CrossRef]
- Ghaem Sigarchian, S.; Malmquist, A.; Martin, V. Optimal planning and design method for complex polygeneration systems: A case study for a residential building in Italy. Energy Convers. Manag. under revision.
- Moya, M.; Bruno, J.C.; Eguia, P.; Torres, E.; Zamora, I.; Coronas, A. Performance analysis of a trigeneration system based on a micro gas turbine and an air-cooled, indirect fired, ammonia-water absorption chiller. Appl. Energy 2011, 88, 4424–4440. [Google Scholar] [CrossRef]
- Romero Rodríguez, L.; Salmerón Lissén, J.M.; Sánchez Ramos, J.; Rodríguez Jara, E.Á.; Álvarez Domínguez, S. Analysis of the economic feasibility and reduction of a building’s energy consumption and emissions when integrating hybrid solar thermal/PV/micro-CHP systems. Appl. Energy 2016, 165, 828–838. [Google Scholar] [CrossRef]
- Calise, F.; Dentice d’Accadia, M.; Piacentino, A.; Vicidomini, M. Thermoeconomic optimization of a renewable polygeneration system serving a small isolated community. Energies 2015, 8, 995–1024. [Google Scholar] [CrossRef]
- Yousefi, H.; Ghodusinejad, M.H.; Kasaeian, A. Multi-objective optimal component sizing of a hybrid ICE + PV/T driven CCHP microgrid. Appl. Therm. Eng. 2017, 122, 126–138. [Google Scholar] [CrossRef]
- Di Somma, M.; Yan, B.; Bianco, N.; Graditi, G.; Luh, P.B.; Mongibello, L.; Naso, V. Multi-objective design optimization of distributed energy systems through cost and exergy assessments. Appl. Energy 2017, 204, 1299–1316. [Google Scholar] [CrossRef]
- Arcuri, P.; Florio, G.; Fragiacomo, P. A mixed integer programming model for optimal design of trigeneration in a hospital complex. Energy 2007, 32, 1430–1447. [Google Scholar] [CrossRef]
- Li, L.; Mu, H.; Gao, W.; Li, M. Optimization and analysis of CCHP system based on energy loads coupling of residential and office buildings. Appl. Energy 2014, 136, 206–216. [Google Scholar] [CrossRef]
- Rubio-Maya, C.; Uche, J.; Martínez, A. Sequential optimization of a polygeneration plant. Energy Convers. Manag. 2011, 52, 2861–2869. [Google Scholar] [CrossRef]
- Ghaem Sigarchian, S.; Malmquist, A.; Martin, V. The choice of operating strategy for a complex polygeneration system: A case study for a residential building in Italy. Energy Convers. Manag. 2018, 163, 278–291. [Google Scholar] [CrossRef]
- Calise, F.; D’Accadia, M.D.; Libertini, L.; Quiriti, E.; Vicidomini, M. A novel tool for thermoeconomic analysis and optimization of trigeneration systems: A case study for a hospital building in Italy. Energy 2017, 126, 64–87. [Google Scholar] [CrossRef]
- Buonomano, A.; Calise, F.; Ferruzzi, G.; Palombo, A. Dynamic energy performance analysis: Case study for energy efficiency retrofits of hospital buildings. Energy 2014, 78, 555–572. [Google Scholar] [CrossRef]
- Buonomano, A.; Calise, F.; Ferruzzi, G.; Vanoli, L. A novel renewable polygeneration system for hospital buildings: Design, simulation and thermo-economic optimization. Appl. Therm. Eng. 2014, 67, 43–60. [Google Scholar] [CrossRef]
- Barbieri, E.S.; Spina, P.R.; Venturini, M. Analysis of innovative micro-CHP systems to meet household energy demands. Appl. Energy 2012, 97, 723–733. [Google Scholar] [CrossRef]
- Ehyaei, M.A.; Mozafari, A. Energy, economic and environmental (3E) analysis of a micro gas turbine employed for on-site combined heat and power production. Energy Build. 2010, 42, 259–264. [Google Scholar] [CrossRef]
- Bianchi, M.; De Pascale, A.; Spina, P.R. Guidelines for residential micro-CHP systems design. Appl. Energy 2012, 97, 673–685. [Google Scholar] [CrossRef]
- Wang, J.; Zhai, Z.J.; Jing, Y.; Zhang, C. Particle swarm optimization for redundant building cooling heating and power system. Appl. Energy 2010, 87, 3668–3679. [Google Scholar] [CrossRef]
- Wang, J.-J.; Zhang, C.-F.; Jing, Y.-Y. Multi-criteria analysis of combined cooling, heating and power systems in different climate zones in China. Appl. Energy 2010, 87, 1247–1259. [Google Scholar] [CrossRef]
- Kennedy, J.; Eberhart, R. Particle Sawrm Optimization. In Neural Networks Proceedings, Proceedings of the IEEE International Conference on Computational Intelligence, Anchorage, AK, USA, 4–9 May 1998; IEEE: Piscataway, NJ, USA, 1995; pp. 1943–1948. [Google Scholar]
- Ghaem Sigarchian, S.; Orosz, M.S.; Hemond, H.F.; Malmquist, A. Optimum design of a hybrid PV-CSP-LPG microgrid with Particle Swarm Optimization technique. Appl. Therm. Eng. 2016, 109, 1031–1036. [Google Scholar] [CrossRef]
- Hu, X. Particle Swarm Optimization. Available online: http://www.swarmintelligence.org (accessed on 15 May 2015).
- IEA EBC Annex 54. Methodologies for the Performance Assessment of Micro Hybrid Polygeneration Systems; IEA EBC Annex 54 Integration of Micro-Generation and Related Energy Technologies in Buildings, Technische Universität München: München, Germany, 2014; Volume 10. [Google Scholar]
- Capstone Technical Support Technical Reference Capstone C30 Microturbine 2006. Available online: https://www.capstoneturbine.com (accessed on 15 February 2016).
- Capstone Technical support Capstone Turbine Corporation, Capstone C1000 Series Microturbine Systems 2011. Capstone Turbine Corporation: Chatsworth CA, USA, 2011. Available online: https://www.capstoneturbine.com (accessed on 15 February 2016).
- Capstone Technical Support Technical Reference Capstone C200 Microturbine 2009. Available online: https://www.capstoneturbine.com (accessed on 15 February 2016).
- Tang, T.; Villarreal, L. Guideline: Absorption Chillers; New Buildings Institute: Fair Oaks, CA, USA, 1998. [Google Scholar]
- Polaris America, LLC. Available online: http://www.polarisamerica.com/turbines/20kw-wind-turbines/ (accessed on 15 Jnuary 2017).
- Beerepoot, M.; International Energy Agency (IEA). Technology Roadmap: Solar Heating and Cooling; OECD/IEA International Energy Agency IEA Publishing: Paris, France, 2012. [Google Scholar]
- Wu, D.W.; Wang, R.Z. Combined cooling, heating and power: A review. Prog. Energy Combust. Sci. 2006, 32, 459–495. [Google Scholar] [CrossRef]
- Majeski, J. Stirling Engine Assessment; EPRI, Energy International, Inc.: Bellevue, WA, USA, 2006; Volume 1, pp. 1–170. [Google Scholar]
- Angrisani, G.; Roselli, C.; Sasso, M. Distributed microtrigeneration systems. Prog. Energy Combust. Sci. 2012, 38, 502–521. [Google Scholar] [CrossRef]
- Simader, G.; Krawinkler, R.; Trnka, G. Micro CHP Systems: State-of-the-Art; Österreichische Energieagentur—Austrian Energy Agency: Vienna, Austria, 2006; Volume 8. [Google Scholar]
- Cogeneration Observatory and Dissemination Europe. Micro-CHP Potential Analysis European Level Report Partner Name: Energy Matters; European Commission (Intelligent Energy Europe—IEE): Brussels, Belgium, 2014. [Google Scholar]
- NREL Distributed Generation Renewable Energy Estimate of Costs. Available online: http://www.nrel.gov/analysis/tech-lcoe-re-cost-est.html (accessed on 15 January 2017).
- Capehart, B.L. Microturbines. Available online: https://www.wbdg.org/resources/microturbines.php (accessed on 15 May 2017).
- Eicker, U.; Pietruschka, D. Design and performance of solar powered absorption cooling systems in office buildings. Energy Build. 2009, 41, 81–91. [Google Scholar] [CrossRef]
- Selection, M.; Manual, D. BROAD X Absorption Chiller Model Selection & Design Manual; Broad Air Conditioning: Changsha, China, 2008. [Google Scholar]
- Faninger, G. Thermal Energy Storage; Facaulty of Interdiciplinary Research and Continuing Education, IFF-University of Klagenfurt: Klagenfurt, Austria, 2013. [Google Scholar]
- IEA-ETSAP and IRENA Technology Brief E17. Thermal Energy Storage Technology Brief. 2013. Available online: https://cleanenergysolutions.org/es/resources/thermal-energy-storage-technology-brief (accessed on 15 May 2016).
- Roth, K.; Zogg, R.; Brodreick, J. Cool thermal energy storage. ASHRAE J. 2006, 48, 94–96. [Google Scholar]
- Hampson, A.; Deaver, P.; Neff, B.; Bender, S.; Oglesby, R.; ICF International Inc. Combined Heat and Power: Policy Analysis and 2011–2030; California Energy Commission: Sacramento, CA, USA, 2012.
- Itron Inc. 2010–2012 WO017 Ex Ante Measure Cost Study Final Report; California Public Utilities Commission: Oakland, CA, USA, 2014.
- Torchio, M.F. Comparison of district heating CHP and distributed generation CHP with energy, environmental and economic criteria for Northern Italy. Energy Convers. Manag. 2015, 92, 114–128. [Google Scholar] [CrossRef]
- Eurostat Natural Gas Price Statistics. Available online: http://ec.europa.eu/eurostat/statistics-explained/index.php/Natural_gas_price_statistics (accessed on 15 October 2017).
- Eurostat Electricity Price Statistics. Available online: http://ec.europa.eu/eurostat/statistics-explained/index.php/Electricity_price_statistics (accessed on 15 October 2017).
- European Union. How to Develop a Sustainable Energy Action Plan (SEAP)—Guidebook; European Commission, Covenant of mayors, Publications Office of the European Union: Luxembourg, 2010. [Google Scholar]
- Greening, B.; Azapagic, A. Domestic solar thermal water heating: A sustainable option for the UK? Renew. Energy 2014, 63, 23–36. [Google Scholar] [CrossRef]
- Berk, J.; Peter, D. Corporate Finance, Global Edition, 3rd ed.; Pearson: New York, NY, USA, 2013; ISBN 9780273792062. [Google Scholar]


Figure 3.
Flowchart of the optimization model.

Figure 4.
Heating demand (a) for winter, summer and transient seasons; electricity demand (b) for all seasons and cooling demand for typical days during the summer.
Figure 4.
Heating demand (a) for winter, summer and transient seasons; electricity demand (b) for all seasons and cooling demand for typical days during the summer.

Figure 5.
Monthly heating demand in load type L02.

Figure 6.
Initial cost of generic electric chillers (a) and thermal chillers (b) [11].
Figure 6.
Initial cost of generic electric chillers (a) and thermal chillers (b) [11].

Figure 7.
Initial cost of generic micro gas turbines [11].
Figure 7.
Initial cost of generic micro gas turbines [11].

Figure 8.
Excess heat (a) and imported/exported power to/from the grid (b) for the two load profiles (L01 and L02) and the three scenarios.
Figure 8.
Excess heat (a) and imported/exported power to/from the grid (b) for the two load profiles (L01 and L02) and the three scenarios.

Figure 9.
Fuel saving ratio (FSR), CO2 emission reduction ratio (CO2ERR), annualized total cost saving ratio (ATCSR) and integrated savings ratio (ISR) for the design scenarios (Scen. 1 to 3) and the two load types; L01 (a) and L02 (b).
Figure 9.
Fuel saving ratio (FSR), CO2 emission reduction ratio (CO2ERR), annualized total cost saving ratio (ATCSR) and integrated savings ratio (ISR) for the design scenarios (Scen. 1 to 3) and the two load types; L01 (a) and L02 (b).

Figure 10.
Cooling provided by the electric chiller (C_prod_Ech) and thermal chiller (C_prod_Tch), cooling to/from the cold storage (C_cs_in, C_cs_out) and cooling demand (C_dem).
Figure 10.
Cooling provided by the electric chiller (C_prod_Ech) and thermal chiller (C_prod_Tch), cooling to/from the cold storage (C_cs_in, C_cs_out) and cooling demand (C_dem).

Figure 11.
The power from/to the grid (P_grid_imp/P_grid_exp), power generated by the CHP and solar PV (P_chp & P_pv), and total power demand (P_dem_tot).
Figure 11.
The power from/to the grid (P_grid_imp/P_grid_exp), power generated by the CHP and solar PV (P_chp & P_pv), and total power demand (P_dem_tot).

Figure 12.
Heat provided by the CHP, boiler, solar heating units, heat storage (H_chp, H_shu and H_hs_out), heat storage input rate (H_hs_in), heating used for heating (H_dem_h), and heating used for cooling (H_dem_c).
Figure 12.
Heat provided by the CHP, boiler, solar heating units, heat storage (H_chp, H_shu and H_hs_out), heat storage input rate (H_hs_in), heating used for heating (H_dem_h), and heating used for cooling (H_dem_c).

Figure 13.
State of charge of the heat storage and cold storage during the representative day.

Figure 14.
Number of turbines in operation during the representative day.

Figure 15.
Capital cost (a) and net present value (b) for the scenarios and the two load types.

Figure 16.
Payback period (PBP) and internal rate of return (IRR) for the scenarios and the two-load types; L01 (a); L02 (b).
Figure 16.
Payback period (PBP) and internal rate of return (IRR) for the scenarios and the two-load types; L01 (a); L02 (b).

Figure 17.
Levelized cost of electricity for the scenarios and the two load types.

Figure 18.
The effect of electricity and gas price on the payback period (PBP) (a) and annualized total cost saving ration (ATSCR) (b).
Figure 18.
The effect of electricity and gas price on the payback period (PBP) (a) and annualized total cost saving ration (ATSCR) (b).


Table 1.
Design scenarios.
| Components | Scenarios | ||
|---|---|---|---|
| 1 | 2 | 3 | |
| CHP unit | x | x | x |
| Boiler | x | x | x |
| Electricity from/to grid | x | x | x |
| Electric chiller | x | x | x |
| Thermal chiller | _ | x | x |
| Heat storage | x | x | x |
| Cold storage | _ | x | x |
| Solar photovoltaic (PV) | _ | _ | x |
| Solar heating unit | _ | _ | x |
| Battery | _ | _ | x |
| Wind Turbine | _ | _ | x |
Table 2.
Technical specification of each component.
| Component | Parameter | Value |
|---|---|---|
| CHP system | Nominal electrical efficiency (%) [33,34,35] | 26–34 |
| Heat recovery unit thermal efficiency (%) | 85 | |
| Heat loss in the CHP unit (%) | 3 | |
| Auxiliary boiler | Thermal efficiency (%) | 80 |
| Heat/cooling distribution | Cooling coil thermal efficiency (%) | 98 |
| Heating coil thermal efficiency (%) | 98 | |
| Battery storage | Round trip Efficiency (%) | 90 |
| Minimum/maximum state of charge (%) | 20/90 | |
| Thermal chiller [36] (single stage absorption chiller) | Coefficient of performance (COP) | 0.7 |
| Electric chiller | Coefficient of performance (COP) | 3 |
| Solar thermal | Optical efficiency at standard condition | 0.8 |
| Thermal storage | Loss coefficient of the storage at each time-step (%) | 2 |
| Solar PV system | Module efficiency (%) | 16 |
| Inverter efficiency (%) | 98 | |
| Wind turbine | Nominal power of one turbine (kWel) | 20 |
| Cut-in/out/rated speed (m/s) [37] | 4/16/11 |
| Component | Capital Cost | Unit | Maintenance Cost | Unit |
|---|---|---|---|---|
| Solar PV | 2000 | USD/kWel | 4 | USD/kWyr |
| Solar collector [38] | 250 | USD/m2 | 0.5 | USD/m2yr |
| Wind turbine | 4000 | USD/kWel | 25 | USD/kWyr |
| CHP (Micro gas turbine) [16,45] | 1200–2450 | USD/kWel | 0.005–0.016 | USD/kWhel |
| Auxiliary boiler | 80 | USD/kWth | 0.003 | USD/kWth |
| Battery storage | 350 | USD/kWth | 0.002 | USD/kWhel |
| Thermal chiller [16,47,51] | 230–700 | USD/kWc | 0.001 | USD/kWc |
| Electric chiller [51,52] | 150–380 | USD/kWc | 0.001 | USD/kWc |
| Heat storage [49] | 20 | USD/kWh | 0.002 | USD/kWhyr |
| Cold storage [50] | 30 | USD/kWh | 0.002 | USD/kWhyr |
* The available online data and stated references are used fort the cost estimation.
Table 4.
Electricity 1 and natural gas price.
| Commodity | Hourse | Unit Price (USD/kWh) |
|---|---|---|
| Electricity purchase | ||
| (22:00–5:00) (8:00–11:00) | 0.18 | |
| (5:00–8:00) (11:00–17:00) | 0.22 | |
| (17:00–22:00) | 0.24 | |
| Electricity sell | - | 0.12 |
| Natural gas [53,54] | - | 0.08 |
1 The defined tariff is hypothetical, considering the power market in Italy [55].
| Item | Standard Emission Factor (kg CO2/kWh) |
|---|---|
| Natural gas [56] | 0.202 |
| CHP (natural gas driven) [56] | 0.202 |
| Grid (Italy) [56] | 0.485 |
Table 6.
Optimization search space.
| Component | Search Space | |
|---|---|---|
| Min | Max | |
| PV units (kWel) | 0 | 920 |
| Solar collector (kWth) | 0 | 1400 |
| Wind turbine (kWel) | 0 | 500 |
| CHP (micro gas turbine) | 0 | 2000 |
| Auxiliary boiler | 0 | 5000 |
| Battery storage | 0 | 500 |
| Thermal chiller | 0 | 2000 |
| Electric chiller | 0 | 2000 |
| Thermal storage | 0 | 3000 |
| Cold storage | 0 | 3000 |
Table 7.
Optimal solution for each scenario and load type.
| Components | Load Type L01 | Load Type L02 | ||||
|---|---|---|---|---|---|---|
| Scenarios | Scenarios | |||||
| 1 | 2 | 3 | 1 | 2 | 3 | |
| Solar PV (kWel) | 0 | 0 | 920 | 0 | 0 | 920 |
| Wind | 0 | 0 | 0 | 0 | 0 | 0 |
| CHP (kWel) | 1000 | 1000 | 800 | 1000 | 800 | 600 |
| Auxiliary boiler (kWth) | 2721 | 2721 | 3130 | 2694 | 2708 | 3002 |
| Battery (kWhel) | 0 | 0 | 20 | 0 | 0 | 0 |
| Electric chiller (kWc) | 1101 | 1101 | 1101 | 1101 | 312 | 613 |
| Thermal chiller (kWc) | 0 | 689 | 519 | 0 | 777 | 542 |
| Cooling ratio (-) | 1 | 1 | 1 | 1 | 0.29 | 0.49 |
| Heat storage (kWhth) | 3000 | 3000 | 3000 | 2992 | 3000 | 3000 |
| Cold storage (kWhc) | 0 | 3000 | 3000 | 0 | 2815 | 3000 |
| Solar heating unit (kWhth) | 0 | 0 | 1400 | 0 | 0 | 1400 |
© 2018 by the authors. Licensee MDPI, Basel, Switzerland. This article is an open access article distributed under the terms and conditions of the Creative Commons Attribution (CC BY) license (http://creativecommons.org/licenses/by/4.0/).
Share and Cite
MDPI and ACS Style
Ghaem Sigarchian, S.; Malmquist, A.; Martin, V. Design Optimization of a Complex Polygeneration System for a Hospital. Energies 2018, 11, 1071. https://doi.org/10.3390/en11051071
AMA Style
Ghaem Sigarchian S, Malmquist A, Martin V. Design Optimization of a Complex Polygeneration System for a Hospital. Energies. 2018; 11(5):1071. https://doi.org/10.3390/en11051071
Chicago/Turabian StyleGhaem Sigarchian, Sara, Anders Malmquist, and Viktoria Martin. 2018. "Design Optimization of a Complex Polygeneration System for a Hospital" Energies 11, no. 5: 1071. https://doi.org/10.3390/en11051071
Note that from the first issue of 2016, this journal uses article numbers instead of page numbers. See further details here.