Article

Theoretical and Computational Analysis on Double-End Submerged Hollow Fibre Membrane Modules

Engineering Cluster, Singapore Institute of Technology, 10 Dover Drive, Singapore 138683, Singapore
*
Author to whom correspondence should be addressed.
Energies 2018, 11(5), 1042; https://doi.org/10.3390/en11051042
Submission received: 23 February 2018 / Revised: 15 April 2018 / Accepted: 16 April 2018 / Published: 24 April 2018
(This article belongs to the Section I: Energy Fundamentals and Conversion)

Abstract

:
This paper studies the potential increase in permeate output flow rate that submerged hollow fibres can achieve when operating in double-end suction. The flow dynamics of submerged hollow fibre membranes with different combinations of fibre inner diameter, membrane thickness, and membrane permeability were numerically simulated. Fibre features (fibre inner diameter, membrane thickness, and membrane permeability) are then characterised for their effects on the increment in permeate flow rate due to change in configuration. Concurrently, an analytical model of a fibre in double-end suction is modelled. Analysis on the double-end fibre model has indicated that the fibre characteristic ratio, λ, has a direct influence on the relative increase in output flow rate when both ends are open. Parametric investigations on the three fibre features have shown that their effects on relative output increase agree with the co-relations indicated by λ. For fibres with λ less than 4, a proportional relationship between a fibre’s λ value and the percentage increment in permeate flow rate is observed when adopting double-end suction. The fibre characteristic ratio, λ, in addition to characterising flux uniformity, can further be used to consider the effectiveness of applying double-end suction in Submerged Hollow Fibre Membrane Module (SHFMM) systems at the design stage.

1. Introduction

In designing a submerged hollow fibre membrane module (SHFMM) system for wastewater treatment, optimisation of the designed system to maximise filtration output is an important consideration that SHFMM system designers strive to fulfil. There are many ways to maximise filtration output. A common approach would be to finetune the fibre geometry (i.e., proportion of inner and outer diameter, membrane thickness, and length) [1]. This approach is most logical, as the hollow fibres within are the core of the operation, where the actual filtration process takes place. However, fibre design should not be the only factor to consider in optimising a submerged membrane system’s design. Another approach that can be considered is to adopt a double-end suction configuration, where both ends of a fibre are connected to the suction pump through header pipes instead of only at one end. Though this configuration, as compared to single-end suction, demands additional pressure head, a significant increase in filtration output can be achieved with the same amount of fibres and space available. This makes the latter approach worth the consideration.
As the idea of connecting fibres in double-end suction is not new, there have been studies that have considered the benefits of double-end fibre over single-end fibre [2,3]. Believed to be one of the pioneer studies on double-end fibres, Doshi et al. [2] theoretically predicted the increase in permeation rate of a “DuPont B-9 permeator” hollow fibre membrane module if it was open at both ends instead of only at one end. Based on their calculations, addition of the second outlet would theoretically increase the permeation rate by 47%. The increase is attributed to the decreasing pressure drop within the fibre lumen. Another similar study by Li et al. [4] revealed the benefits of submerged double-end fibres over single-end fibre experimentally. By segmenting the submerged fibres into working segments of equal length, the averaged local flux of each segment was measured and presented as a flux profile. Comparison between the flux profiles of double-end hollow fibre and their single-end counterpart showed that double-end fibres have a more uniform local flux distribution as compared to that of single fibres. In addition, fibres with shorter length were found to have a smaller difference between the maximum and minimum local flux, indicating that the fibre length also affects the uniformity in the flux profile of submerged hollow fibres.
As the separation between waste and water takes place at the hollow fibre membrane, the design of the hollow fibre is crucial to the filtration performance of submerged hollow fibre membrane systems. Due to the significant influence fibre designs have on filtration efficiency and fouling behaviour, the filtration process of SHFMMs has been modelled analytically to better understand factors contributing to output flow rate [5,6] and subsequently fouling behaviour [7,8,9].
In terms of understanding initial flux behaviour, both Carrol and Brooker [4] and Chang et al. [5] modelled membrane filtration based on Darcy’s equation for transmembrane flow and the Hagen–Poiseuille equation to describe permeate pressure loss. Carrol and Brooker [4] found that the permeate flow rate of a fibre is linearly proportional to the fibre’s length in instances of short fibres. For long fibres (fibres longer than 0.2 m in the context of their study), increase in fibre length did not result in any increase in permeate flow rate. This was caused by reduction in membrane flux that began as fibre length increased beyond 0.2 m. In terms of fibre diameter, the same study found the increase in permeate flow rate and flux profile to be proportional to the fibre inner diameter, similar to the findings on fibre length.
In Chang et al.’s studies [6], the modelling of initial flux distribution led to a fibre characteristic ratio named λ. λ is found to be a function of fibre inner diameter; fibre outer to inner diameter ratio; and membrane resistance, which is a factor of thickness and viscous resistance (inverse of material permeability) of the membrane. The use of λ allows for fibre characteristics to be quantified based on cross-sectional features and membrane material properties. The use of λ is further discussed in another of Chang’s studies [10] which mentioned that the product of a given fibre’s λ value and its length gives a dimensionless coefficient, ξ, which can be used to indicate the uniformity of the corresponding fibre’s flux profile. Fibres with a lower ξ value were found to have a more uniform flux profile, while a higher ξ value indicates a less uniform flux profile. As ξ is directly proportional to a fibre’s length, experimental findings presented in [4], which were mentioned earlier (in paragraph 2 of Section 1), are consistent with what the ξ value is meant to indicate.
Considering that a more uniform flux profile is preferred, fibres with larger inner diameter would be desirable, since inner diameter is found to have the largest influence in achieving uniformity in the flux profile [6,11]. In contrast, the use of hollow fibres with small diameter was found to aid in reducing flux decline during filtration. This claim stems from a study where two-phase flow (air–water) was considered [11]. Use of small-diameter fibre was also noted to be more effective at higher turbulent water flow. Since larger diameter and smaller diameter provide different benefits in the filtration process, selection of fibre will depend on the system’s needs. This brings up another reason for the emphasis on fibre design, which is in considering filtration requirements.
The findings presented provided insights on how fibre should be selected based on dimensions to maximise output flow rate. This placed emphasis on fibre design when considering which fibre to use in a submerged system.
With improvements in computing capabilities over the past decade, the use of numerical methods on the study of hollow fibres has become more favourable [12,13,14,15]. These methods present an alternative in analysing fibre designs, and allow for visualisation of the pressure and flow fields within. Using Computational Fluid Dynamics (CFD), the effects of fibre packing density on feed and permeate pressure profile have been established by Günther et al. [12]. This work [12] concluded that packing density—the measure of fibre volume as a fraction of total module volume—directly affects the flux profile along the fibre length. Sparsely packed fibres are observed to have higher flux near the outlet of the fibre, where densely packed fibres have higher flux near the sealed end of the fibre. Fibres with moderate packing density of 0.4 to 0.6 were observed to have good flux uniformity. The flux uniformity was later characterised by Zhuang et al. [13], by introducing the nonuniformity coefficient, N. A higher N value indicated larger nonuniformity in flux distribution. As mentioned in this work [13], N is affected by fibre design parameters, such as diameter, length, permeability, and packing density. In terms of modelling setup, both studies adopted similar methodology based on Happel’s free surface model [16]. By assuming that fibres within are homogeneously spaced out, the model allows for pressure and flow fields to be predicted using one representative fibre model.
The numerical methodologies used by Günther et al. [12] and Zhuang et al. [13] were adopted by Lim et al. [17]. A detailed CFD methodology was used to analyse and determine the optimum packing density that should be used in regards to fibre length. The findings indicated that fibres with shorter length allowed for a tighter optimum packing arrangement. When comparing the feed pressures of fibres with different packing density, the feed pressure profile was determined to be consistent in fibres of packing densities lower than 0.5. Another focus of Lim et al. [17] was to study the effects of enlarging inner diameter on permeate pressure profile. Findings indicate that as inner diameter increases, permeate pressure is reduced, and a more uniform pressure profile was observed. The findings also indicate increase in both flux and Transmembrane Pressure (TMP) profile as a result of the permeate pressure drop within the fibre lumen.
Based on the authors’ understanding, a majority of the literature gathered regarding flux enhancement of hollow fibre membranes placed emphasis on the optimisation of hollow fibre design. Given the merits of this approach, it is believed that adopting the double-end suction configuration, as recommended by Doshi et al. [2] and Soltanieh et al. [3], can further enhance the permeate output of optimised fibres. While it is recognised that additional pressure head will inevitably be required, the switch in configuration may be useful if the benefits outweigh the additional cost.
Since fibres of varied sizes and materials will have different permeate pressure profiles and uniformity, it is ascertained that the percentage increase in output flow rate resulting from the use of double-end suction will be dependent on the fibre design. This begs the question: “How can the use of double-end suction configuration be determined to be beneficial for a given submerged hollow fibre?” In work by Doshi et al., this question was answered on one fibre design that was studied, and there is substantial confidence (from the literature reviewed above) that this work can be further improved to ideally cover fibres of any proportion.
Considering then the arguments as stated above, the work presented in this paper aims to address four main objectives:
(1).
Analytically model hollow fibres in a double-end suction configuration;
(2).
Identify fibre design parameters affecting the permeate output of hollow fibres;
(3).
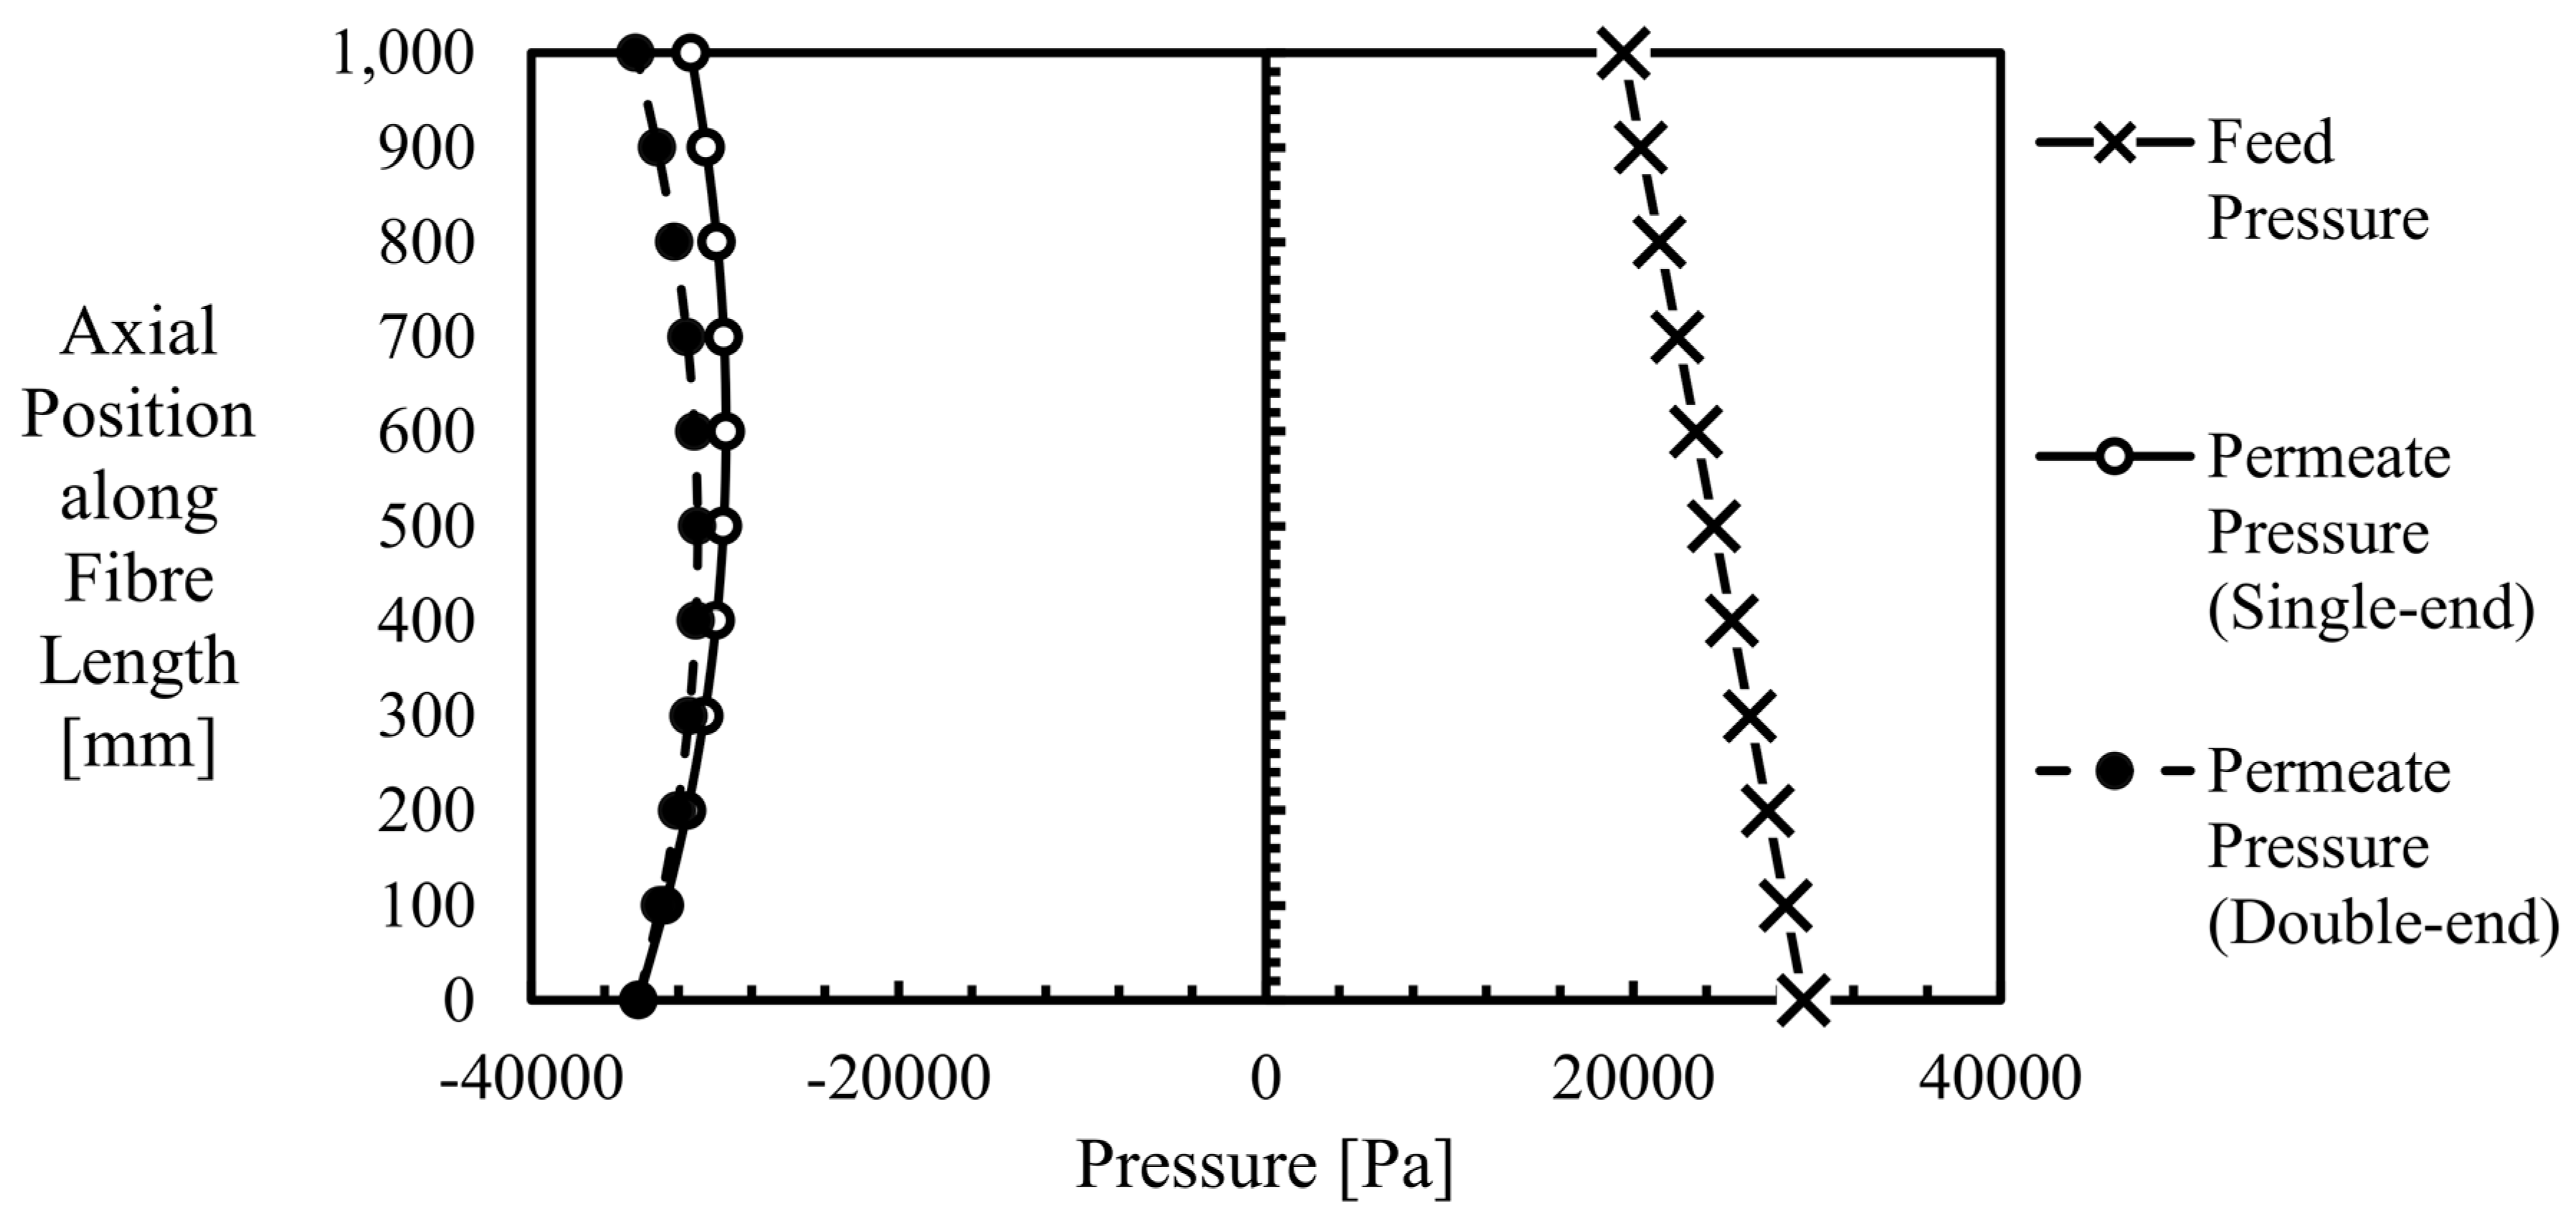
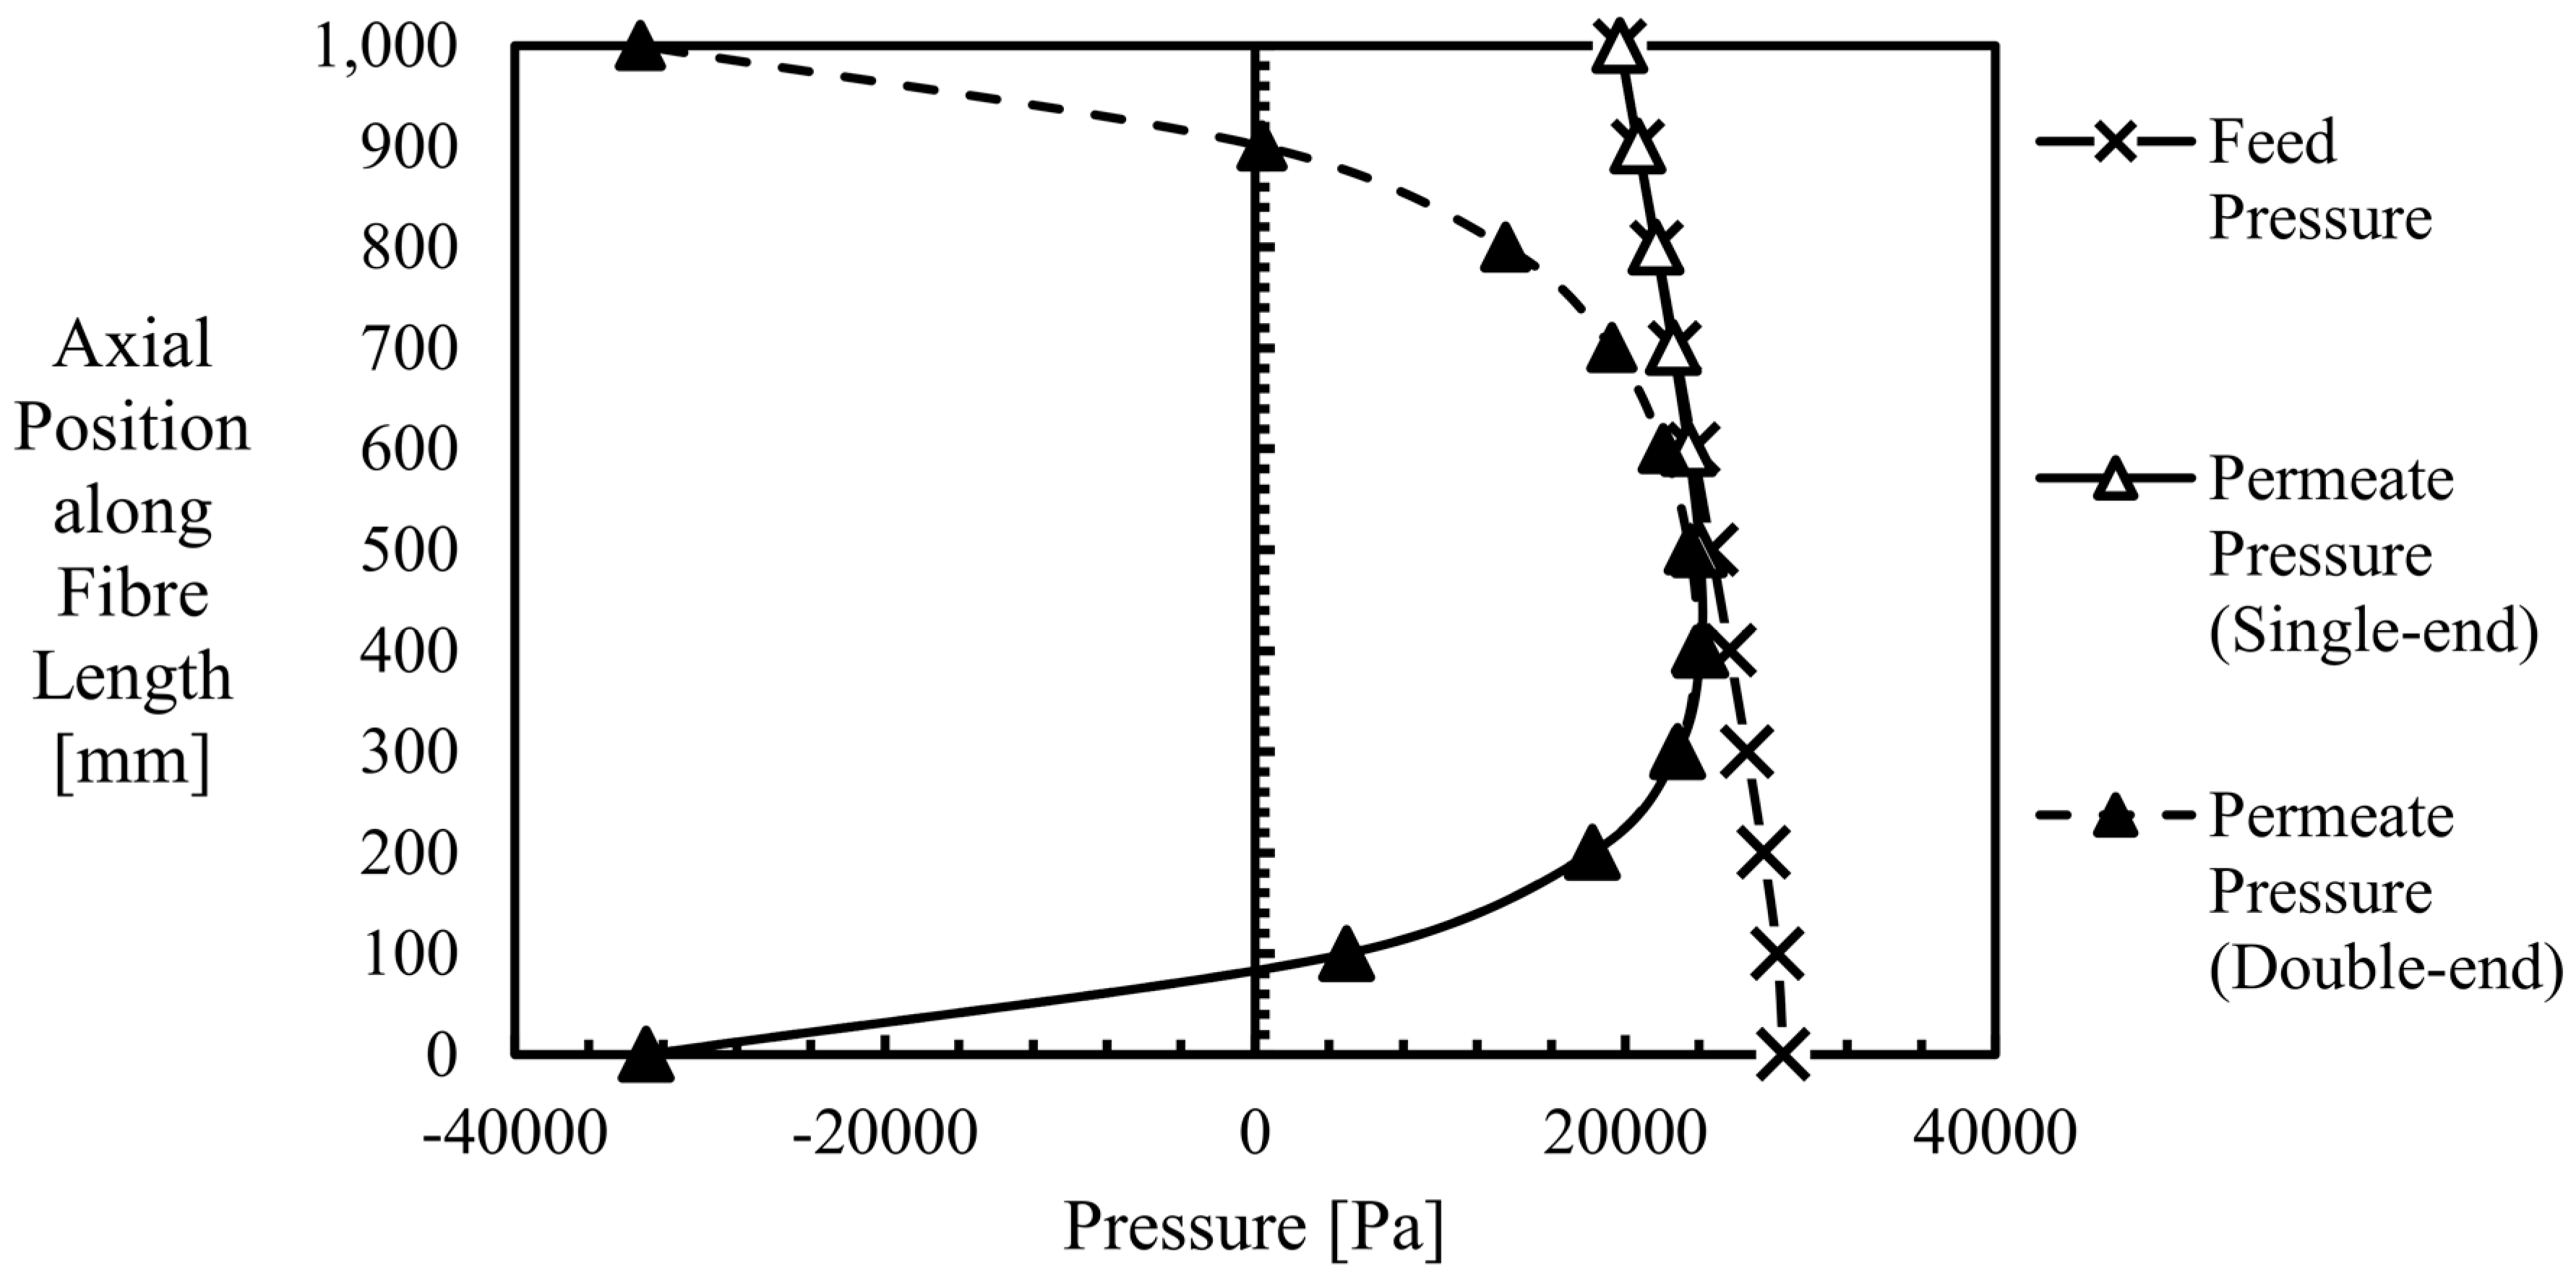
Analyse the changes to permeate pressure profile in relation to permeate output increase due to the change in configurations;
(4).
Correlate the relative output increase between single-end and double-end fibres, to geometrical parameters (i.e., fibre inner diameter, membrane thickness, and membrane permeability).
Analytical modelling of filtration flow within hollow fibre is largely inspired by the work of Chang et al. [6]. The good work done by them on the derivation on initial flux distribution could be studied to identify parameters found in hollow fibre membranes which influence the percentage increase if both ends of a fibre are open instead of only one.
To fulfil objectives (3) and (4), Computational Fluid Dynamics (CFD) will be used to numerically model and predict each scenario of submerged fibres with different combinations of parameters studied. The CFD approach is crucial in this study as it allows for the pressure profile within submerged fibres to be analysed.
To ensure the accuracy and apt use of the CFD model used in this work, a validations study will first be performed where the numerically predicted results will be compared against published experimental results from the literature. This ensures that the fluid dynamics of submerged hollow fibre membranes are accurately captured by the adopted numerical methodology.

2. Methodology

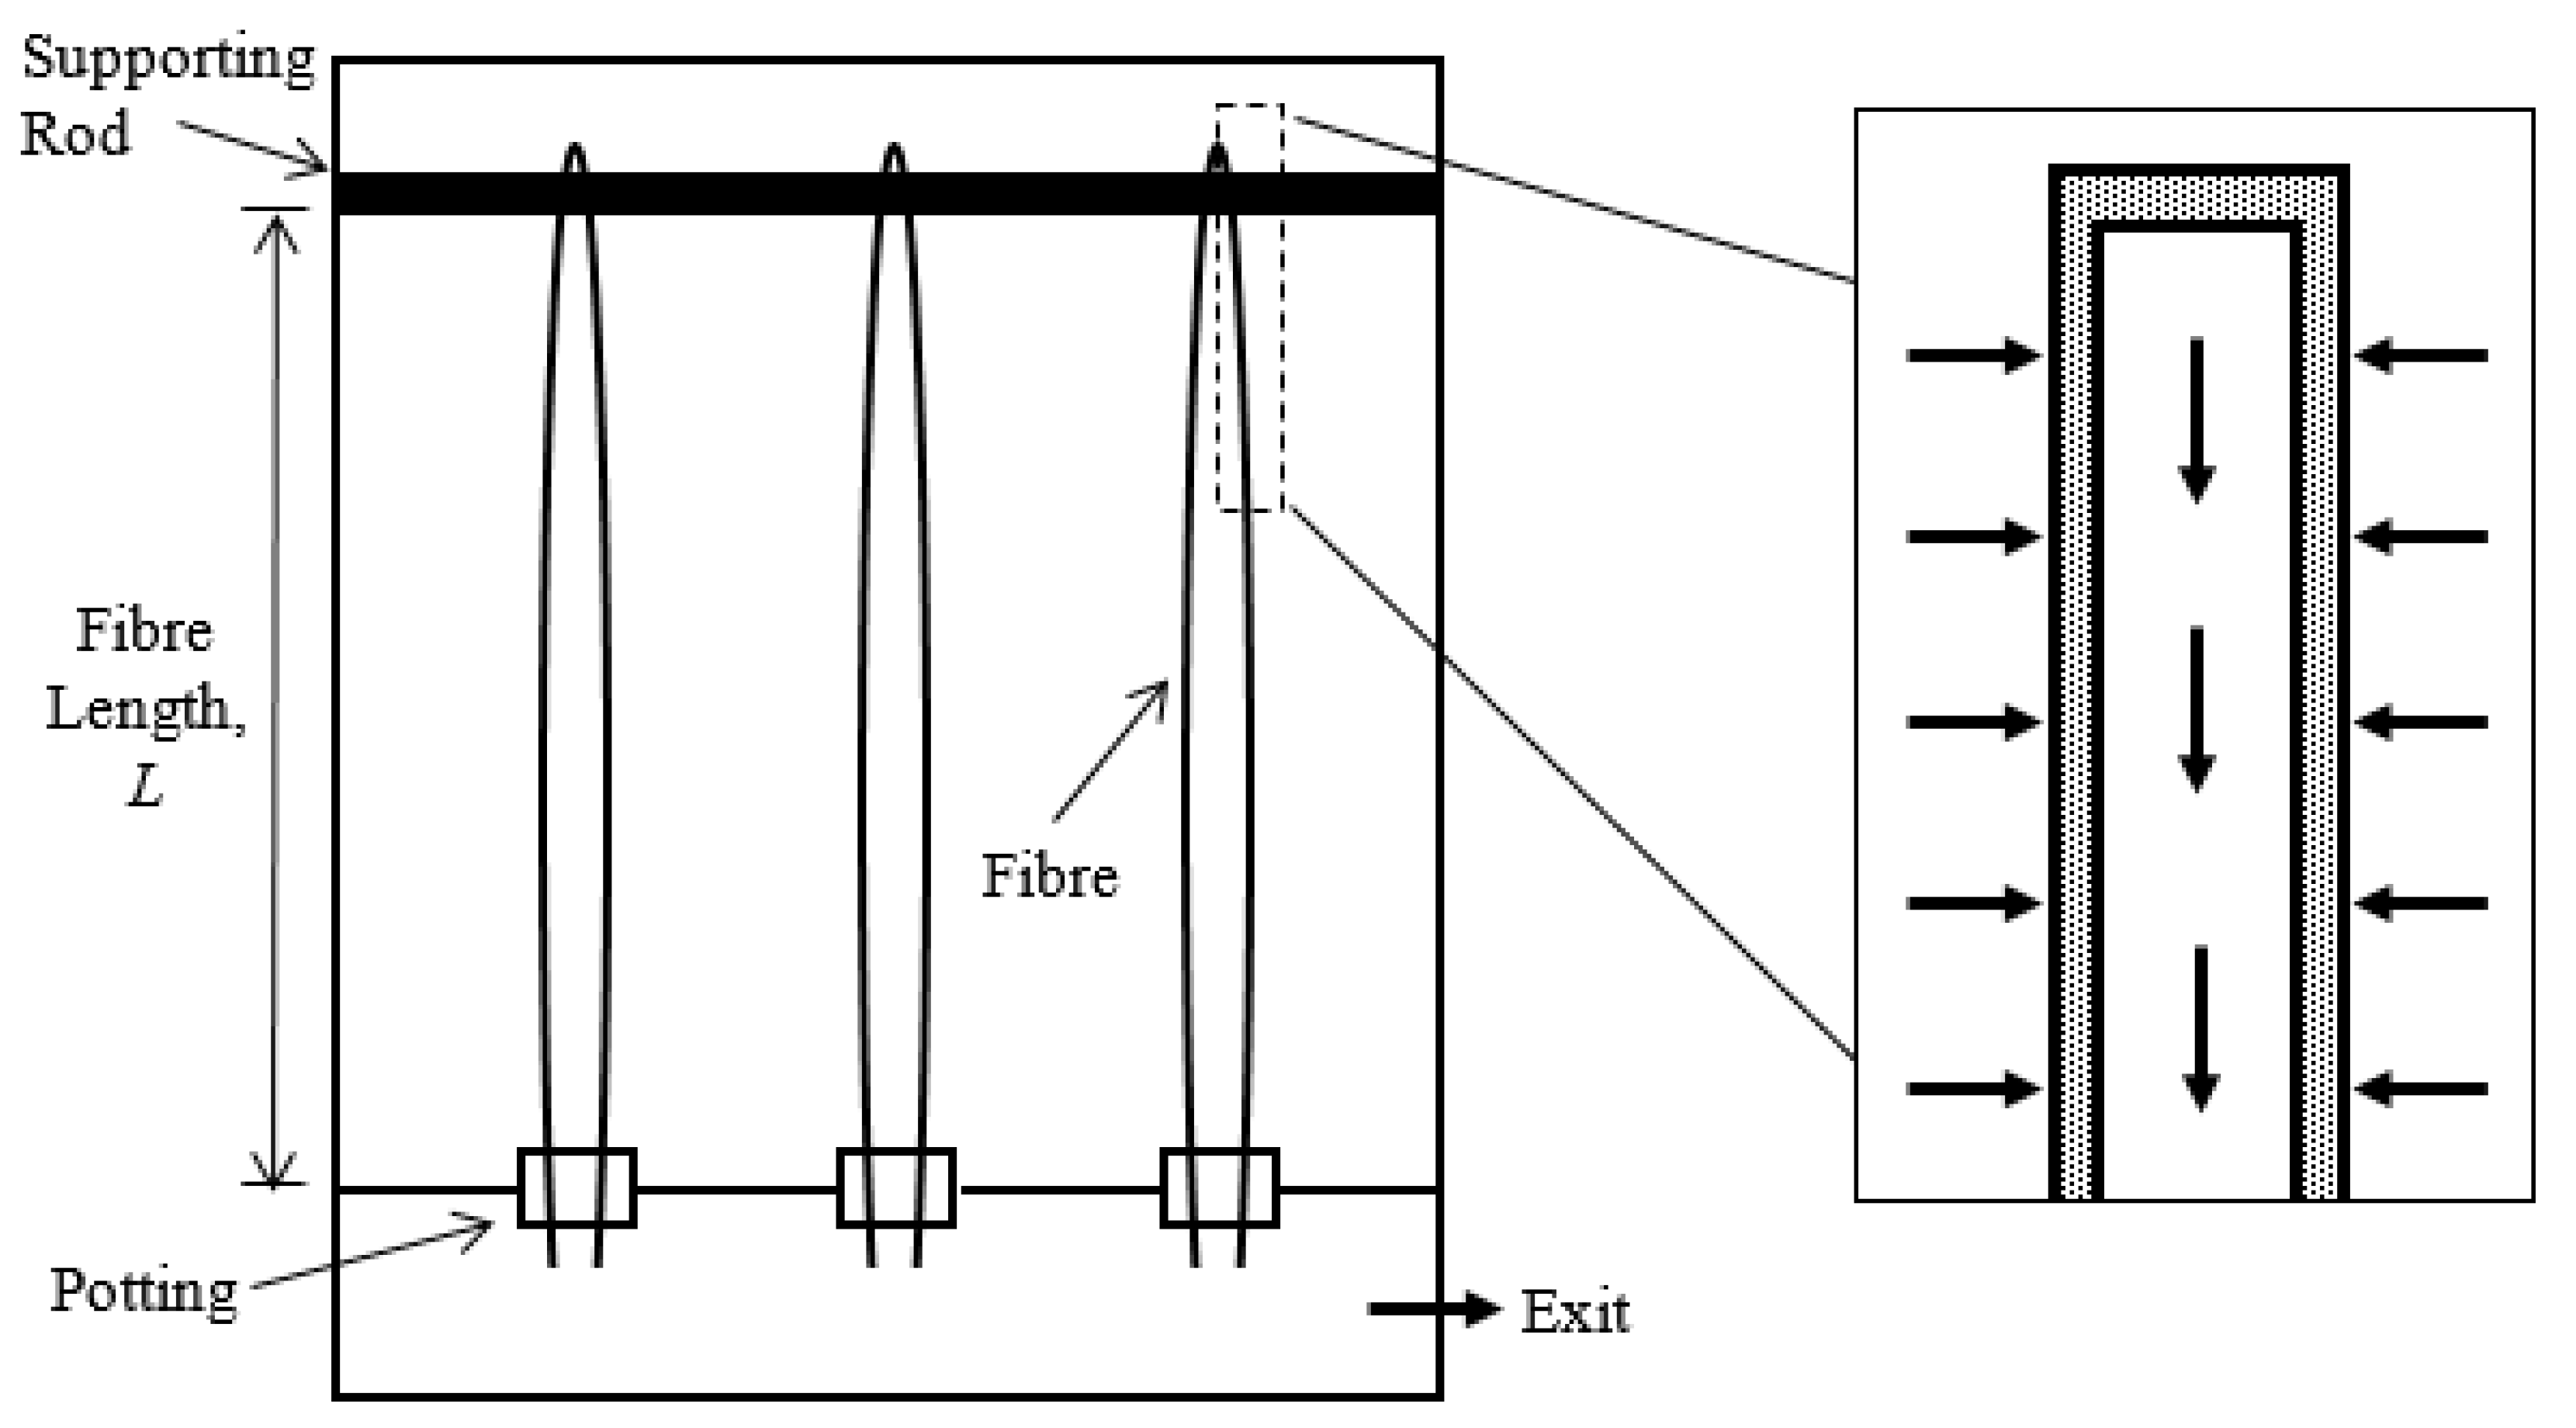
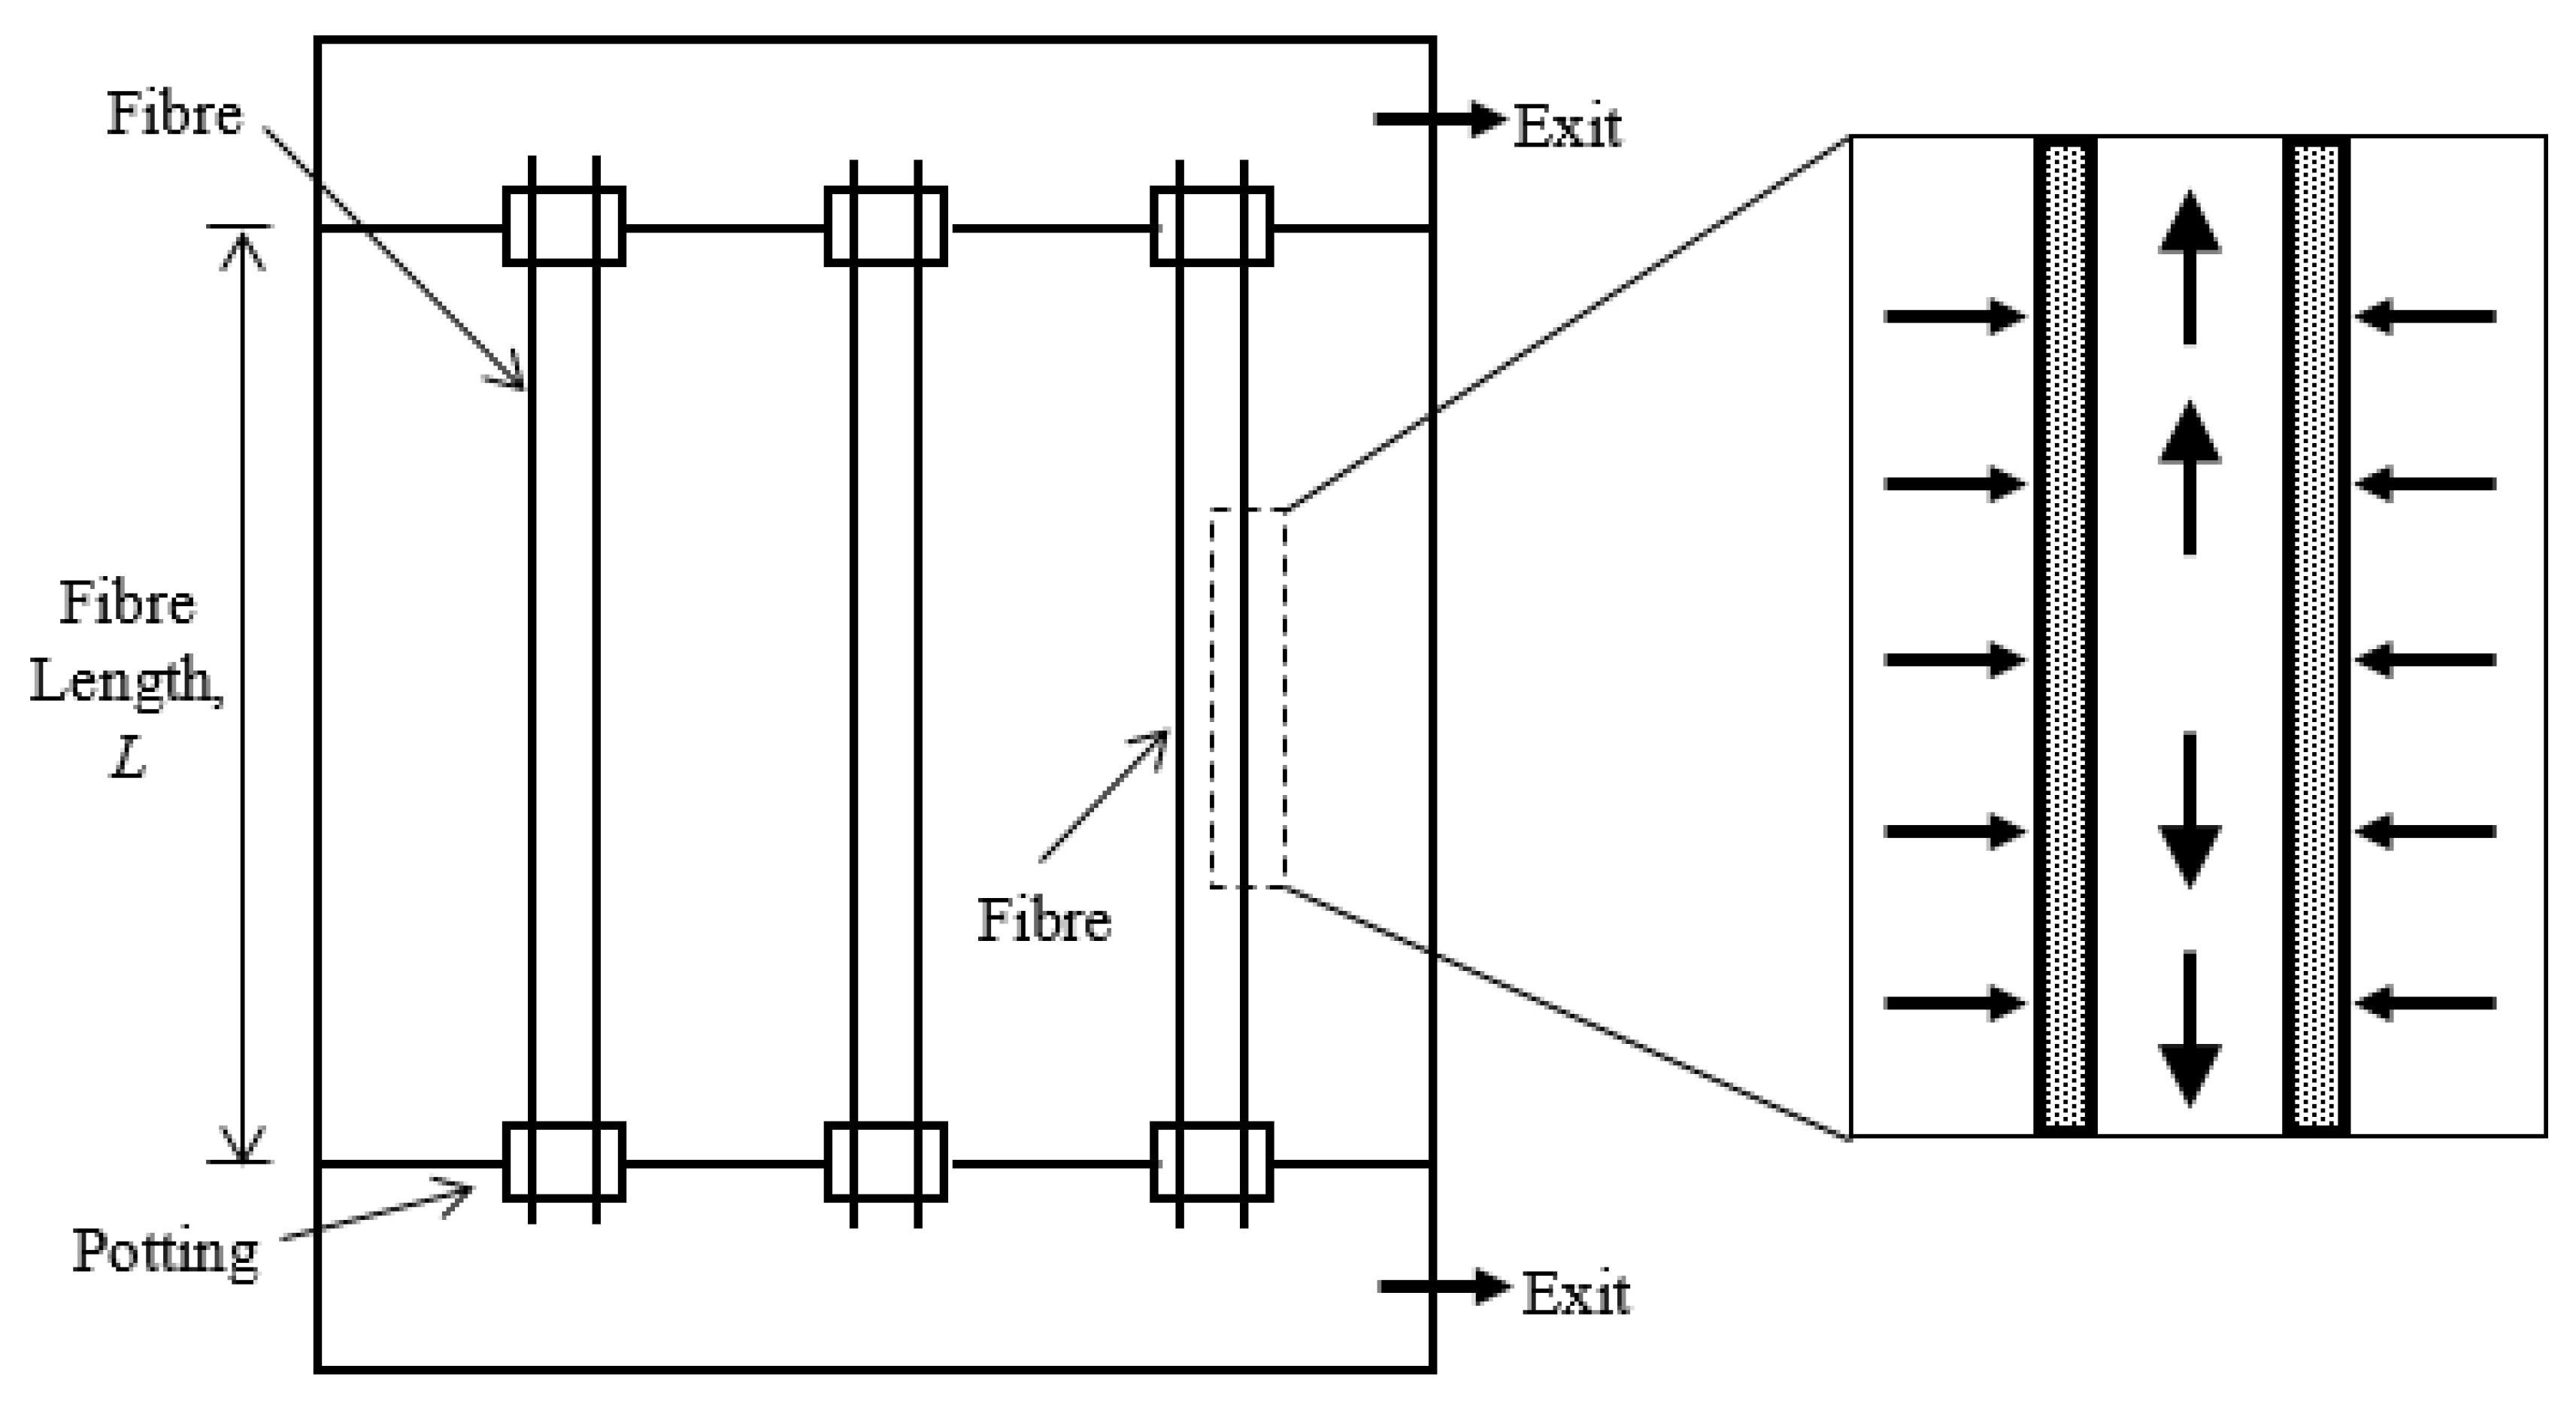
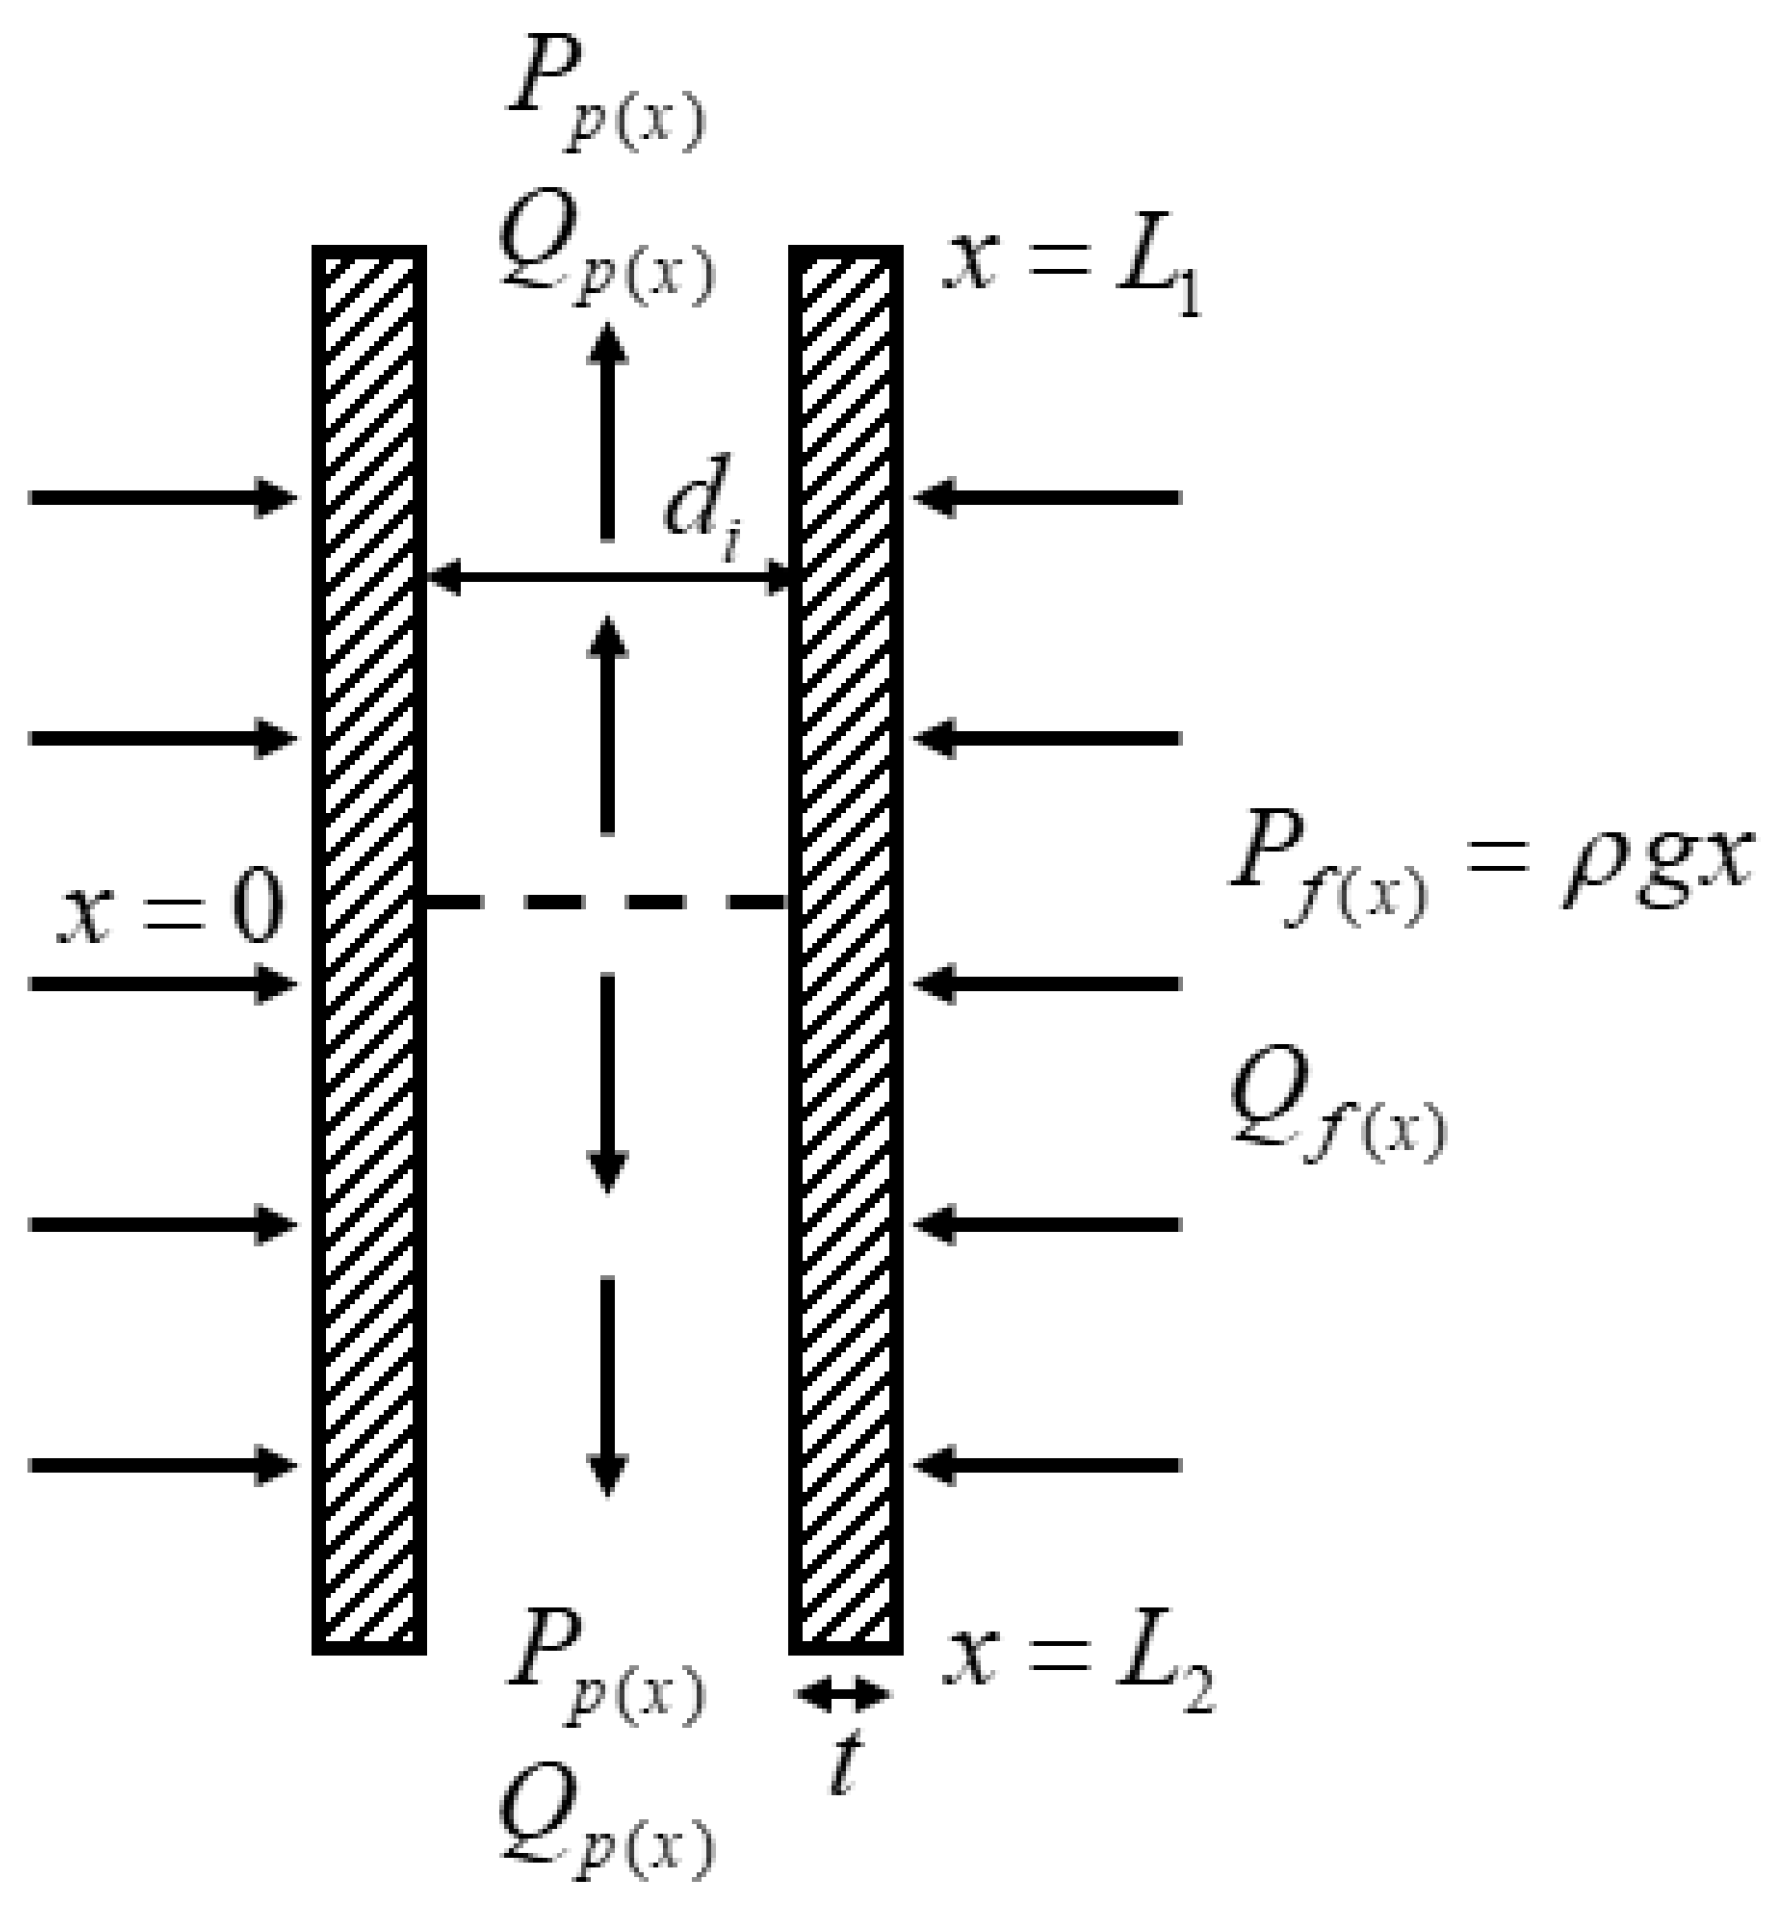
2.1. Theoretical Model and Assumptions

A typical submerged membrane filtration system purposed for wastewater treatment works by drawing wastewater through hollow fibres that are submerged in large wastewater catchments. The process effectively excludes most waste particles within, resulting in higher water quality. The hollow fibres used are housed in modular compartments that expose the wastewater to the membrane exterior when submerged. As these modules are also connected to suction pumps through the permeate outlet, the resulting pressure difference between the wastewater catchment’s hydrostatic pressure and the pumps’ suction pressure drives the flow of water through the hollow fibres in an outside-in configuration, where water enters from the membrane surface, into the fibre lumen, and exiting from the fibre end. The outside-in configuration is more widely used in wastewater treatment due to better reversibility of fouling as compared to the inside-out configuration [18]. As such, this configuration is used as an assumption for the hollow fibre model used in this paper.
Figure 1 shows a simplified layout of a typical housing arrangement of submerged hollow fibres within modules. In order to efficiently remove fouling by air scouring, fibres are housed in a vertical orientation, parallel to the trajectory of the rising air bubbles used in the concurrent cleaning process. This vertical arrangement causes the feed pressure acting on the outer membrane surface to be dependent on the water depth and its corresponding hydrostatic pressure. The end of each fibre is connected to the suction pump through header pipes. Depending on the system design, the fibre can either be housed in single-end (dead-end) suction or double-end suction configuration. In Figure 1, a supporting rod is used to keep the fibres vertical. As fibres are folded in the middle, each half of a fibre can be considered as a single-end suction fibre [5].
To convert the above layout into a double-end suction configuration, the following changes are made to the layout of the fibres:
  • Fibres with half the initial length will be used instead. These fibres will be ported on both ends, with the inner channel open for the permeate output from both the top and bottom end.
  • Another permeate channel will be placed on the top of the housing, and the supporting rod removed.
  • Pressure head required to operate per unit will be doubled due to the increase of permeate channel to 2.
These changes will result in a submerged membrane system like that shown in Figure 2.
The evidence gathered from the literature points the author to believe that the cross-sectional design of a hollow fibre significantly affects its suitability in adapting to a double-end suction configuration. It is, therefore, the aim of this study to evaluate the effects of fibre cross section on the effectiveness of converting single-end suction to double-end suction in terms of output flowrate increase. This makes the fibre’s inner radius, membrane wall thickness, and membrane permeability the variables of interest. Other parameters such as water depth, suction pressure, fibre length, and water properties will be kept constant.
For this study, only submerged hollow fibres of 1 m in length will be considered. The thickness of the potting is assumed to be negligible, as additional permeate pressure required to transport permeate through nonpermeable segments of the fibre is also not considered.
These submerged fibres are also assumed to be packed at 0.4 packing density, where 40% of the total volume is occupied by the fibres. The sparsely packed arrangements are typical of a submerged membrane system [6] as it helps reduce sludge accumulation between the fibres [9]. The sparse packing density factored into the system allows for pressure drop along the feed region to be neglected, since the pressure drop will be very small [5,12,13].

2.2. CFD Methodology

2.2.1. Numerical model

Numerical work in this study begins with modelling the submerged fibre system. The numerical simulation was conducted using ANSYS Fluent 17.2. The finite volume method adopted in Fluent ensures conservation of mass. This is crucial as mass balance is considered in derived analytical models of dead-end hollow fibres [5,6]. Ensuring mass balance is required for the numerical model to be consistent with analytical models found in the literature.
As fibres are found in large quantities in industrial systems, numerical simulation of a full module will be impractical with current computational capabilities and limitations. Hence, assumptions were imposed to simplify the numerical model. By applying Happel’s free surface model [16], submerged fibres were assumed to be equally spaced within the system. This assumes fibre homogeneity within the model, allowing for numerical results to be predicted with just a single fibre [12,13]. The modelled hollow fibre resembles the illustration in Figure 3 of two concentric cylinders representing membrane and inner lumen channel, respectively. To factor in spacing between fibres, a third region surrounding the outer membrane wall was introduced. The amount of allocated space is dependent on the packing density of fibres, which in this study is assumed to be 0.4, as mentioned above.
As the emphasis of this study is on fibre geometry, numerical cases will be simulated using pure water. This factors out the effects fouling may have on the model, eliminating any resulting time-dependent flux decline and, hence, simplifying all cases to be statistically stable. The temperature of the water is assumed to be 30 °C (303.15 K), with density and dynamic viscosity of water at 995.6 Kg/m3∙kg and 0.7972 × 10⁻³ Pa∙s, respectively.
The assumption of fluid flow within the fibres as an incompressible laminar flow, from previous work [17], is also applied in this current study. Compared with the fibre dimension used in the previous numerical study [17], the fibre inner diameters used in this current study are no larger than 0.5 mm as compared to the 0.625 mm used previously, and fibre length used is fixed at 1 m across all numerical cases. The highest membrane permeability used here is 1500 L/(m2∙h∙bar). Making these necessary changes gives the new estimated cumulative velocity of water at the fibre outlet to be 3.33 m/s, which translates to a Reynolds number of 2082 at the fibre outlet. Although the estimated Reynolds number is slightly above the indicative value of 2000 for laminar flow, note that this is an overestimated case and that it is highly unlikely for any of the numerical cases studied to have Reynolds number exceeding 2000. This is due to the following reasons:
The Reynolds number is estimated using a Transmembrane Pressure (TMP) of 1 bar. For the current study, it is assumed that the pressure difference between the hydrostatic pressure and suction pump is about 0.5 bar.
  • The above estimation neglects pressure loss within the fibre lumen. Hence, TMP along the entire fibre length of 1 m is consistent.
  • Having these assumptions overestimates the amount of water flowing through the membrane. Hence, in all actual cases simulated, the cumulative outlet velocity and the Reynolds number are expected to be lower.

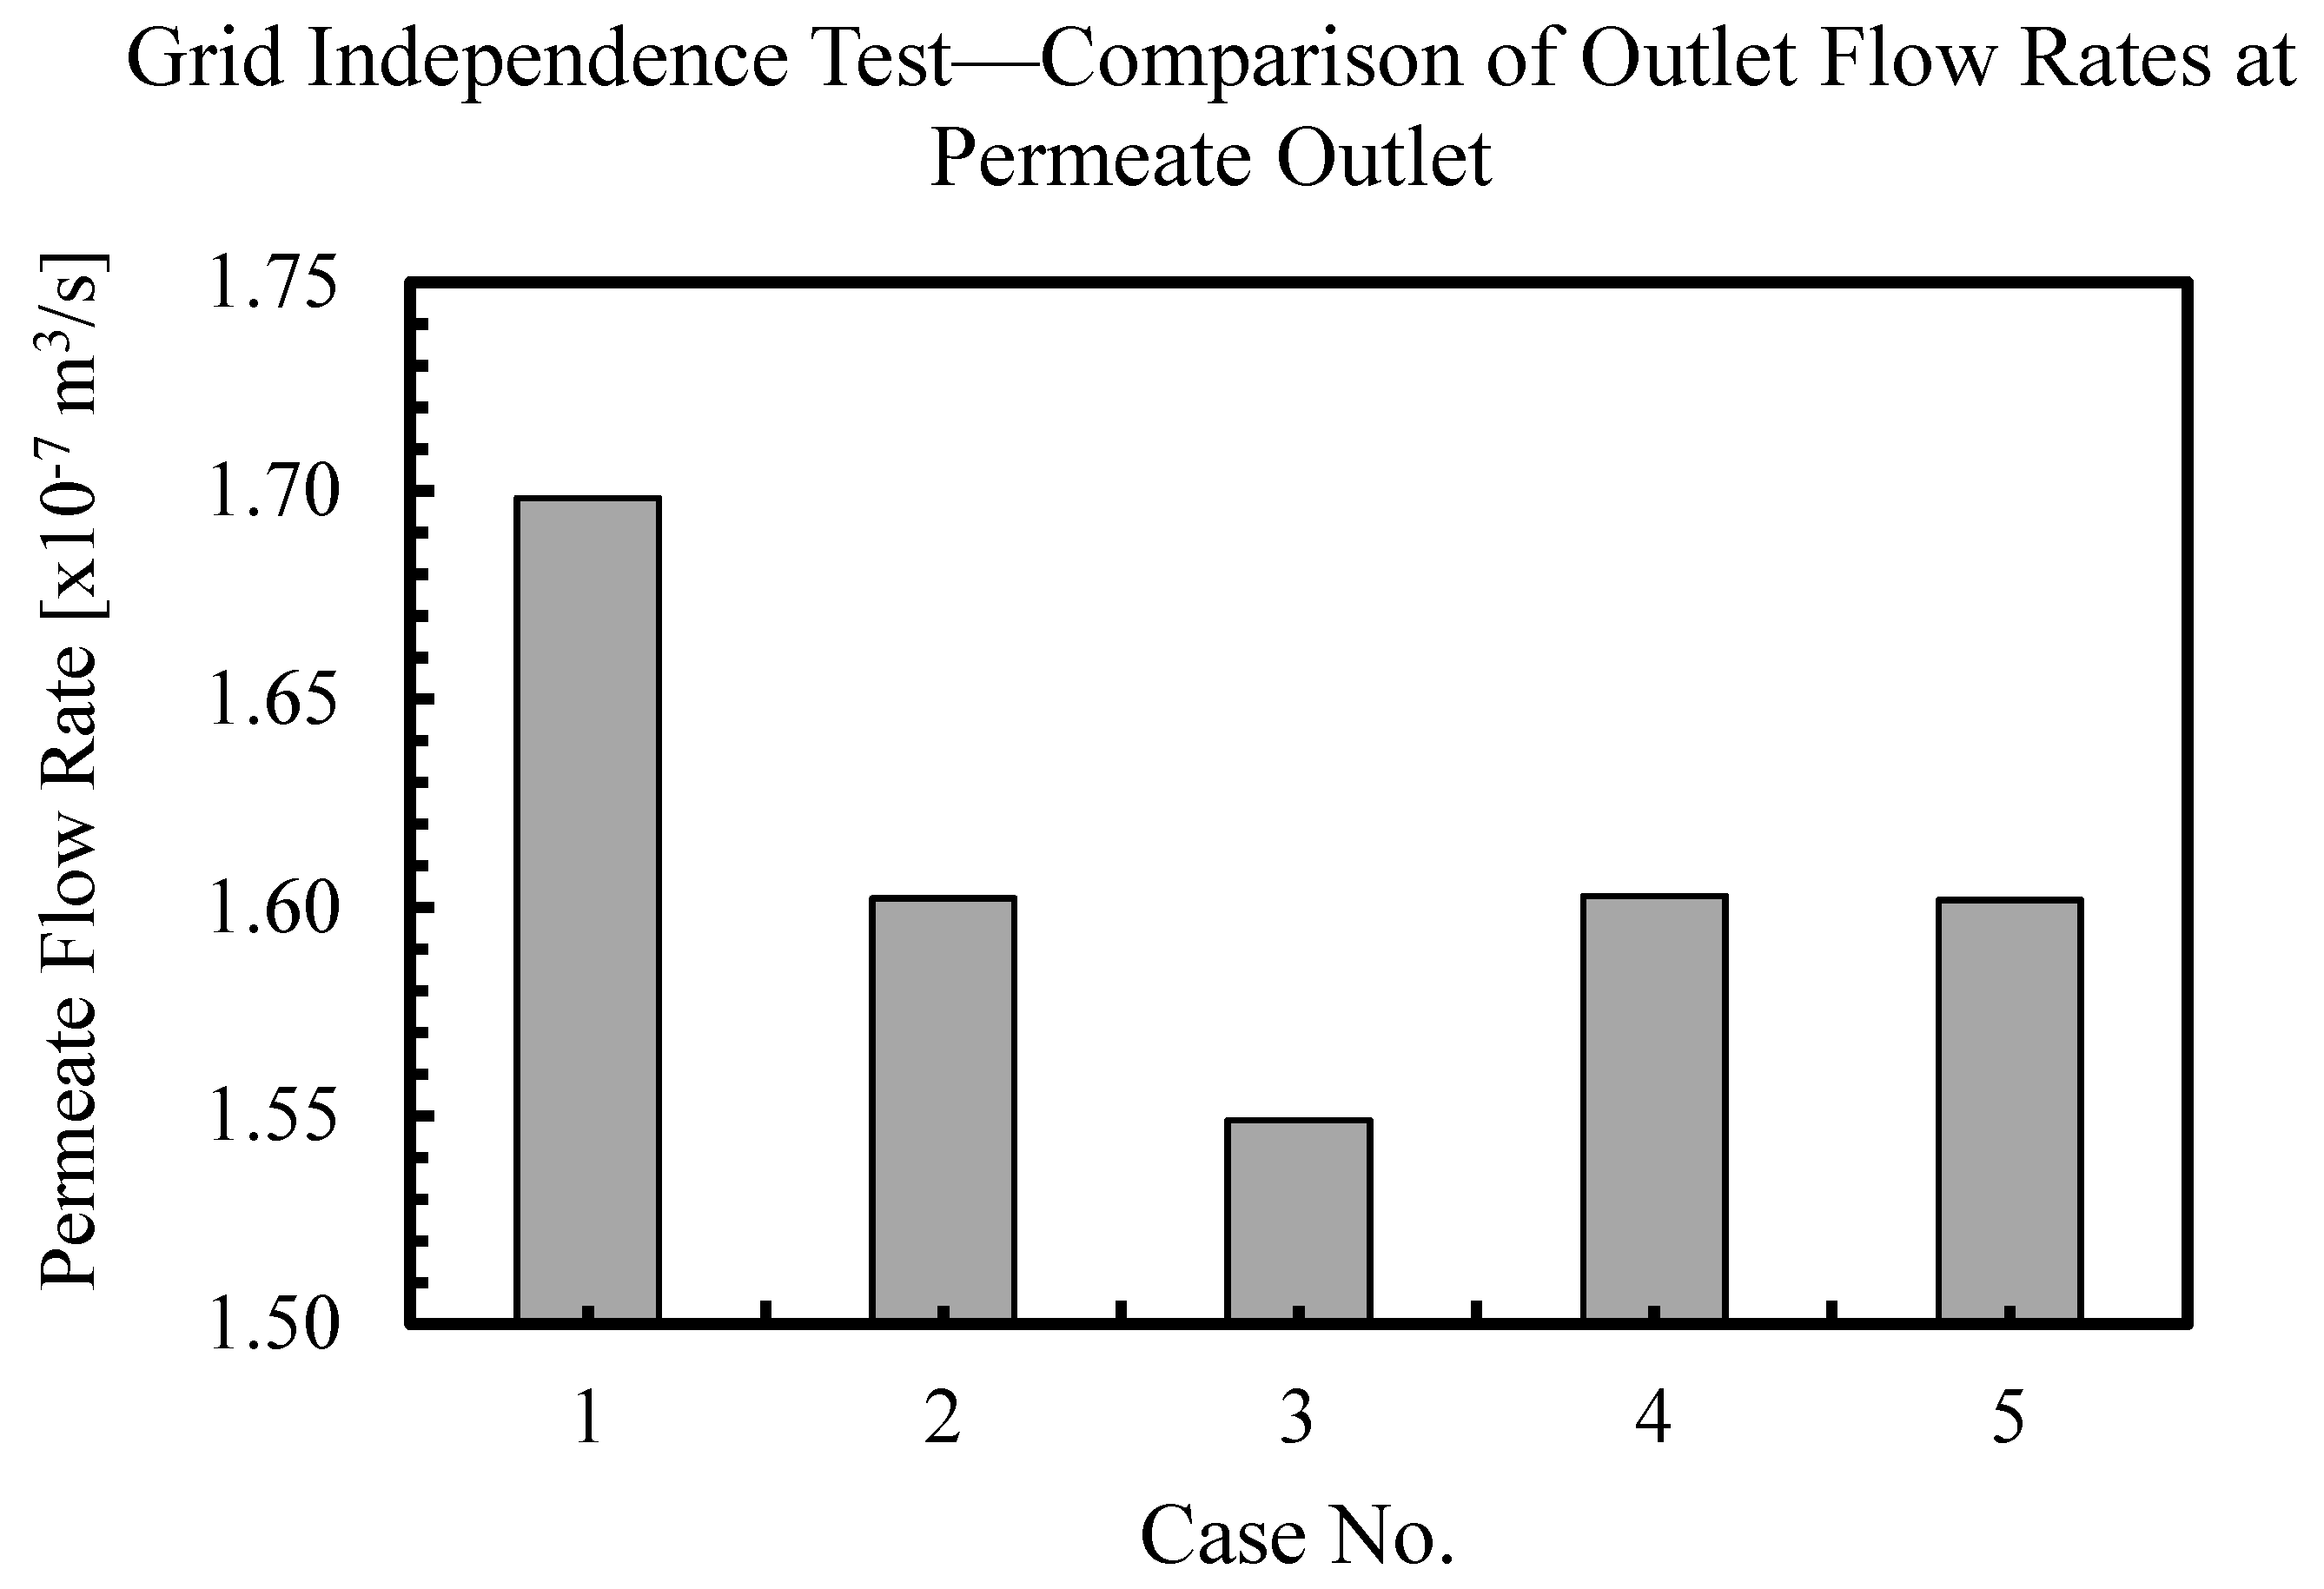
2.2.2. Meshing of CFD Model

The meshing methodology closely follows that described in [17]. The Grid Independence Test (GIT) was first performed to determine the mesh resolution required. For this purpose, the numerical model of fibres with 0.3 mm wide inner diameter, 0.1 mm membrane thickness, and membrane permeability of 6.55 × 10⁻¹⁴ m2 was selected as a sample test case for the GIT. A total of 5 different mesh resolutions were tested, with details of each mesh tested shown in Table 1. In addition, the mapped mashed function was applied to all 5 cases, ensuring that the resulting mesh is uniform with good orthogonal quality and skewness, improving rate of convergence.
Figure 4 shows the comparison of the permeate flow rate of each case tested in the GIT. The permeate flow rate is compared with the element count, which is the product of the mesh resolution. The plot gives a good indication of which mesh resolution is the most suitable. As there is no significant change in the resultant flow rate between Cases 4 and 5, Case 4 was deemed to achieve grid convergence. Hence, the mesh resolution used in Case 4 was selected.

2.2.3. Boundary Conditions and Solver Settings Used in CFD Simulations

As mentioned earlier in Section 2.2.1, steady-state, incompressible laminar flow is considered in our current study based on the estimation that the Reynolds number of flow within the fibre lumen stays within the range of laminar. The equations used in solving the laminar Reynolds-Averaged Navier–Stokes (RANS) model are as follows:
v = 0
( ρ v v ) = P + μ 2 v λ μ k v
where
  • v denotes the fluid velocity in m/s;
  • P denotes the static pressure in Pa;
  • ρ denotes the fluid density in kg/m3;
  • μ denotes the fluid viscosity in Pa∙s; and
  • k denotes membrane permeability in m2.
As the membrane wall is modelled as a porous medium, a momentum sink is included in Equation (2) in the form of λ μ k v . Since fluid flow is assumed to be laminar, inertial resistance is assumed to be negligible. As such, membrane resistance (inverse of permeability) is applied as viscous resistance within the simulation.
The numerical setup uses pressure–velocity coupling with the SIMPLE (Semi Implicit Method for Pressure Linked Equations) scheme to determine the pressure and velocity field. The PRESTO! (PREssure Staggering Option) scheme was used for interpolation of pressure due to its suitability for flows involving a steep pressure gradient (estimated to be at the membrane wall). This setup also uses the second upwind scheme to calculate the velocities.
As this is a submerged membrane system, the inlet pressure is dependent on the hydrostatic pressure of the water catchment. The inlet of the numerical model is located along the axial length of the feed region, at the outermost boundary of the feed region. A user-defined function is used to create an inlet pressure profile along the length which reflects the corresponding pressure value on each node along the fibre length. The model used in the case study, assumed to be 2 to 3 m under water, has a feed (gauge) pressure of about 20,000 Pa at the top end. This pressure increases downwards along the fibre length, up to about 30,000 Pa at the bottom end. The fibre outlet is modelled with a constant gauge pressure of −35,000 Pa. This is to simulate the suction pump pressure to which the fibre is connected.

2.2.4. Parameters Studied and Case Setup

Fibre inner diameter, membrane thickness, and membrane permeability were studied in this work. Fibre inner diameters used were 0.3, 0.4, and 0.5 mm. Membrane thicknesses used were 0.1, 0.2, and 0.3 mm. For viscous resistance, four different values were used: 9.86 × 10¹⁵, 1.8 × 10¹⁵, 9.83 × 10¹⁴, and 6.55 × 10¹⁴. The viscous resistance values used correspond to membrane permeability of 100, 550, 1000, 1500 LMH/bar (Liters/M2/Hr/bar), respectively. All combinations of the three different values of inner diameter, three different values of membrane thickness, and four different values of viscous resistance were numerically predicted. This translates to 36 cases simulated in the single-end configuration. Versions of the 36 cases with double-end configuration instead of single-end were also numerically configured. Results of these cases were then compared against their single-end counterparts to calculate the percentage increase in output flowrate.

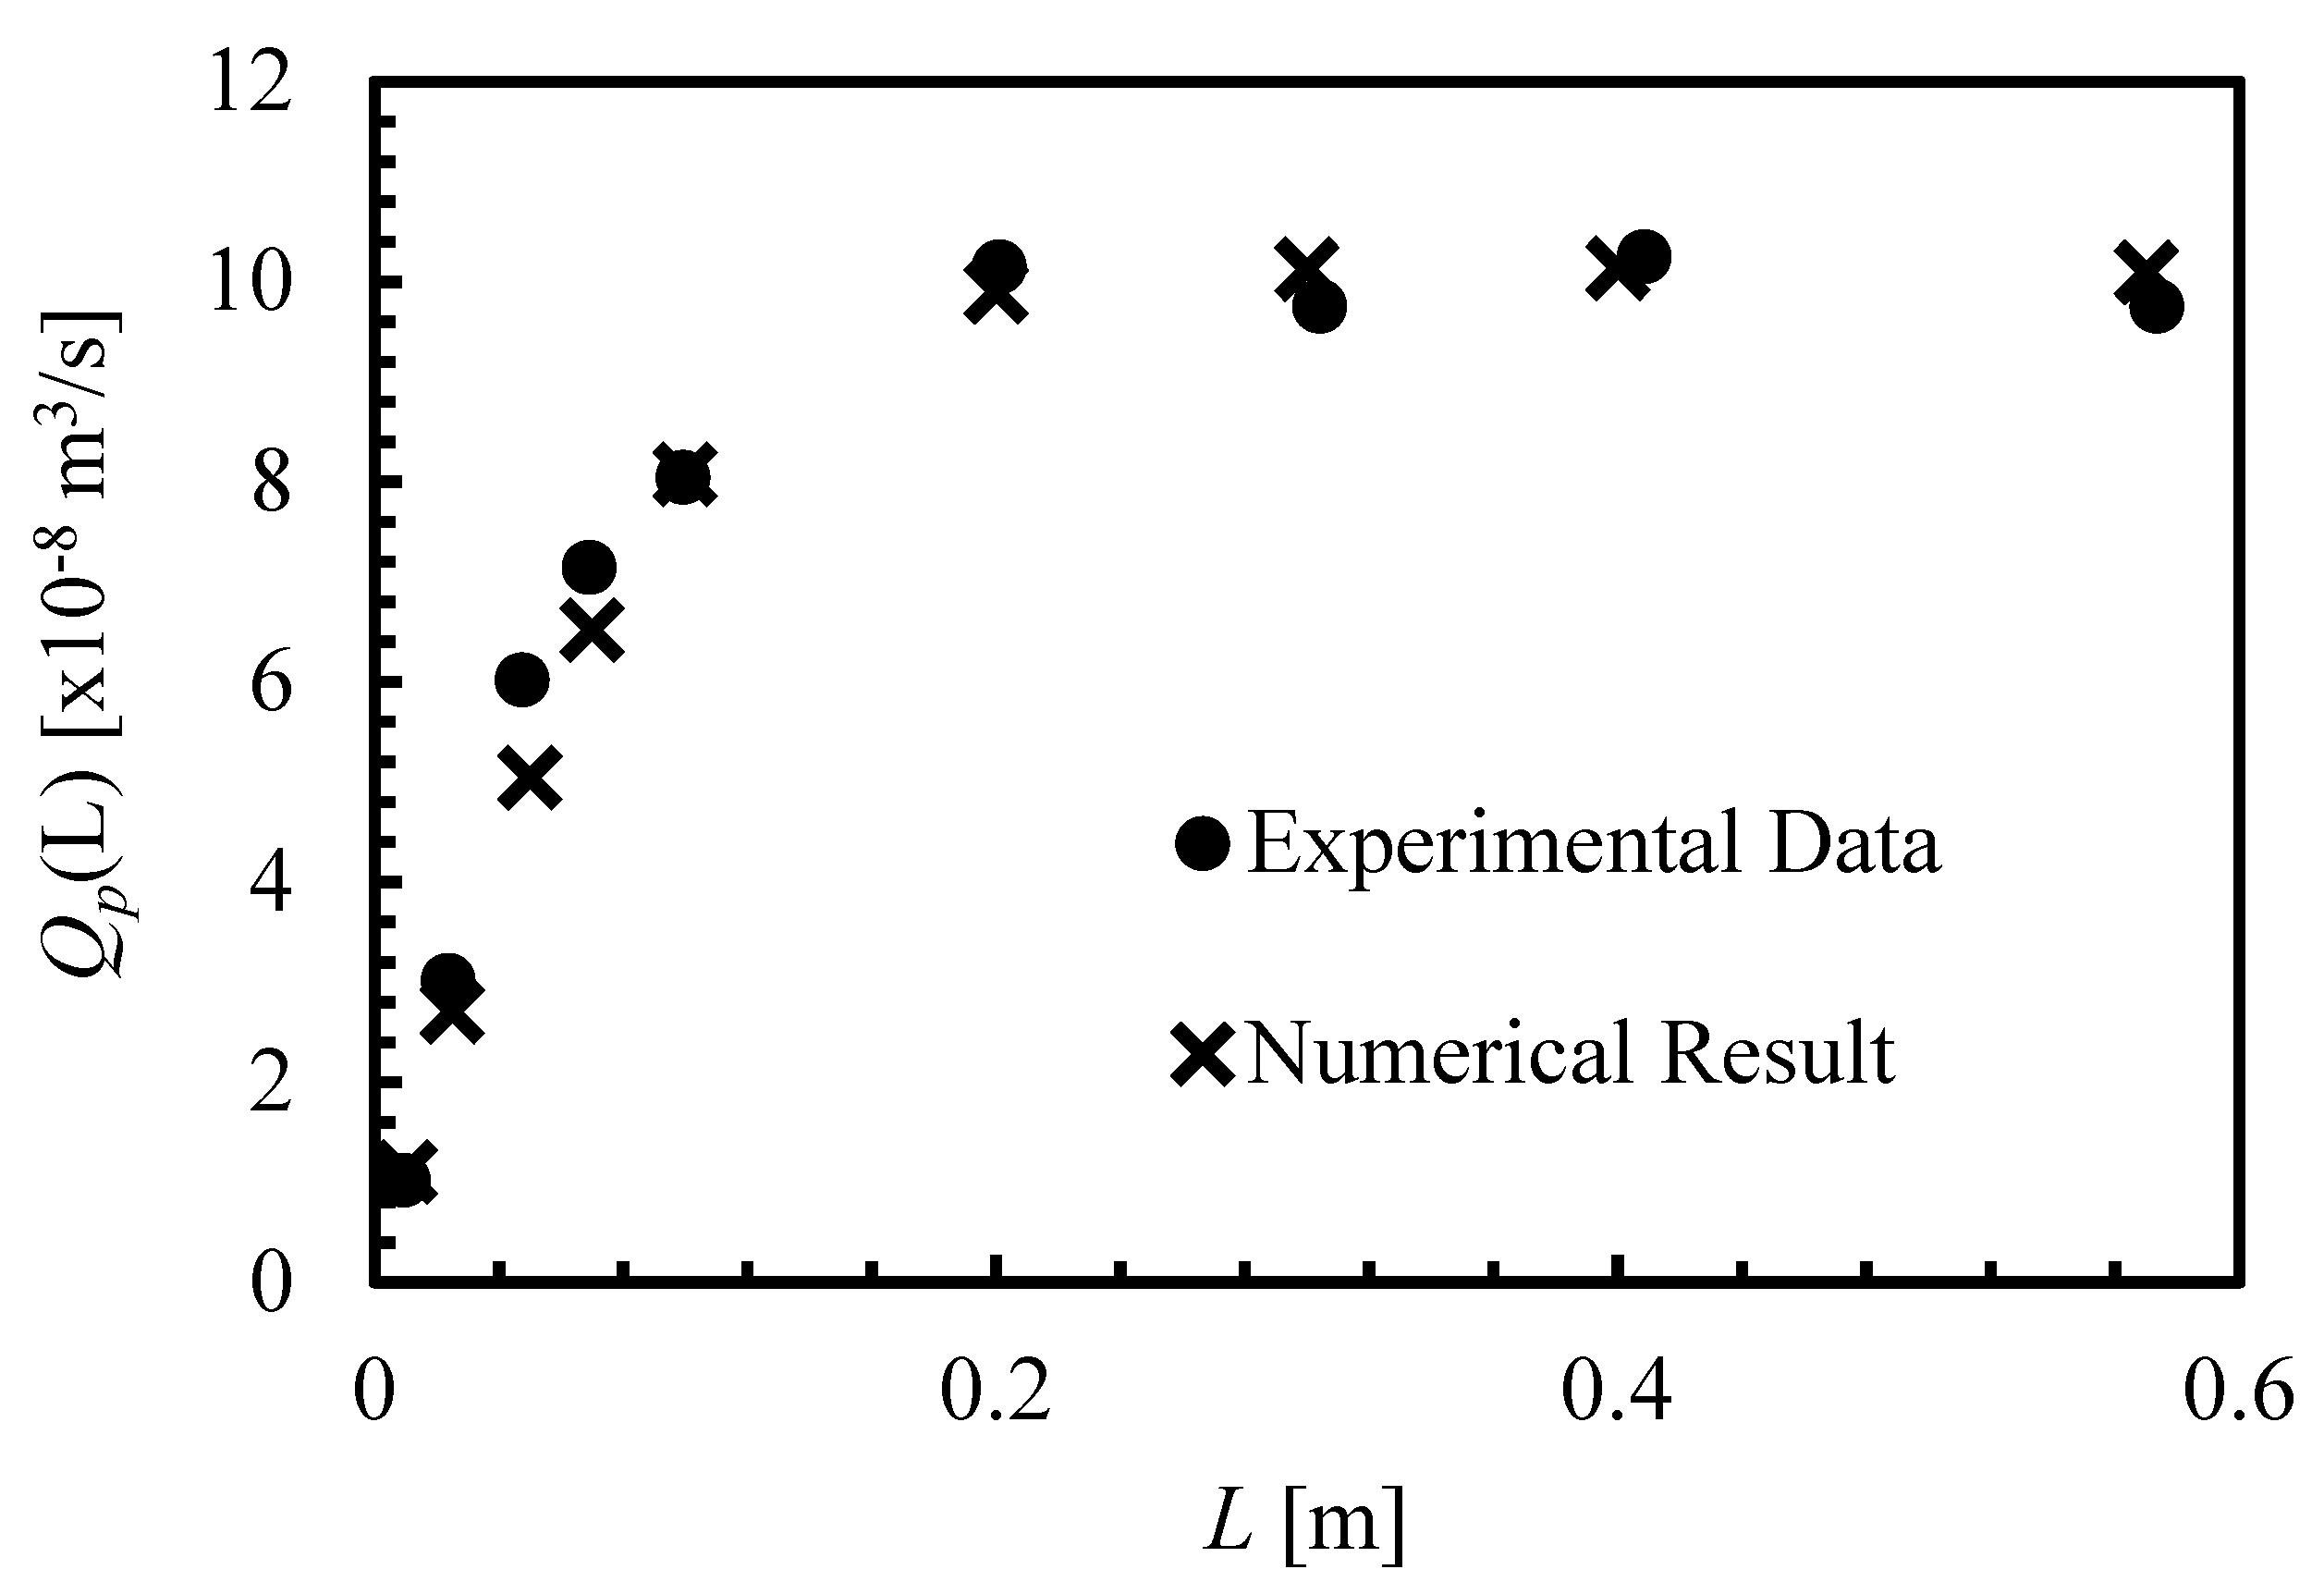
3. Validation of the Numerical Model

The validity and accuracy of the numerical models used in this study were validated through comparisons against published experimental data [5]. This set of experimental data was initially used by T. Carroll and N. A. Brooker to validate the analytical model of hollow fibre membranes that they derived.
As documented previously [5], properties of the hollow fibre and pure water used are as follows:
  • Hollow Fibre Membrane
    • Outer Diameter: 0.55 mm
    • Inner Diameter: 0.25 mm
    • Original Fibre Length: 0.6 m
  • Water Properties
    • Temperature: 20 °C
    • Viscosity: 0.0012 Pa∙s
Two different experiments were performed using their setup mentioned. The first experiment aimed to determine the permeability of the hollow fibre by measuring the permeate flow rate of the given hollow fibre at different feed pressure settings. As permeate flow rate is directly proportional to the TMP (feed pressure) when permeate pressure remains (0 gauge), the best-fit line fitted to the tabulated plot gives a permeability of 10−12 m3/Pa·s.
The second experiment explored the effects of fibre length on permeate flow rate. The same type of fibre used in the previous experiment was trimmed to a different length and tested using the same setup. It was determined that under constant feed pressure, the fibre tested has a threshold length of 0.2 m; fibre beyond this threshold length has the same permeate flow rate.
The validation process detailed here aims to replicate the experimental process using CFD, determining the accuracy of the numerical results when compared against the experiment data. In order to ensure consistency of results, parameters used in the numerical simulation adhered closely to those in the reference paper.
Following the methodology used [5], the permeability value used in the current CFD cases were set to follow as closely as possible to the documented permeability of 10−12 m3/Pa·s. It was noted that the interpretation of permeability is different between the CFD model and the referenced paper. In this paper, the currently used CFD model’s permeability is defined as a material’s ability to allow fluid to pass through and is measured in m2 based on Darcy’s law [18], while the referenced paper derives a hollow fibre’s permeability (in m3/Pa∙s) as an empirical value which correlates the TMP (pressure difference) to the permeate output flow rate from experimental data. Due to differences in the interpretation of permeability between the current CFD model and the reference paper, the documented permeability of 10−12 m3/Pa·s is translated using Darcy’s law to achieve the correct value used in the CFD model.
Figure 5 shows that the numerical results from the test cases are able to achieve a value of 1.0152 × 10⁻¹² m3/Pa·s, with a slight difference of about 1.5%. This could be attributed to rounding-off errors in the viscous resistance value used in the setup of the CFD simulation.
The settings used in the above test cases were applied in this part of the validation. Fibres of different lengths were numerically modelled to obtain their corresponding permeate flow rates under 1 bar TMP. The comparison presented in Figure 6 shows good agreement between the numerical results and the experimental data. The average error between points was found to be 6%.
Since the numerical model used was able to replicate results to a good degree of accuracy, the validation results provided sufficient confidence that the proposed numerical model to be used hereafter is adequately justified.

4. Results and Discussion

4.1. The Effects of Fibre Inner Diameter, Membrane Thickness, and Membrane Permeability on Permeate Pressure Profile and Output Permeate Flow Rate

To understand how each of the parameters studied affects the permeate pressure profile and output flow rate, the three subsections below will cover detailed parametric investigations on fibre inner diameter, membrane thickness, and membrane permeability, respectively. In each subsection, the parameter of focus will be presented as a variable in relation to permeate pressure profile and output flow rate, while the other two parameters are set as constant. As a large combination of parameters are studied, only three groups of fibres will be presented in each subsection.

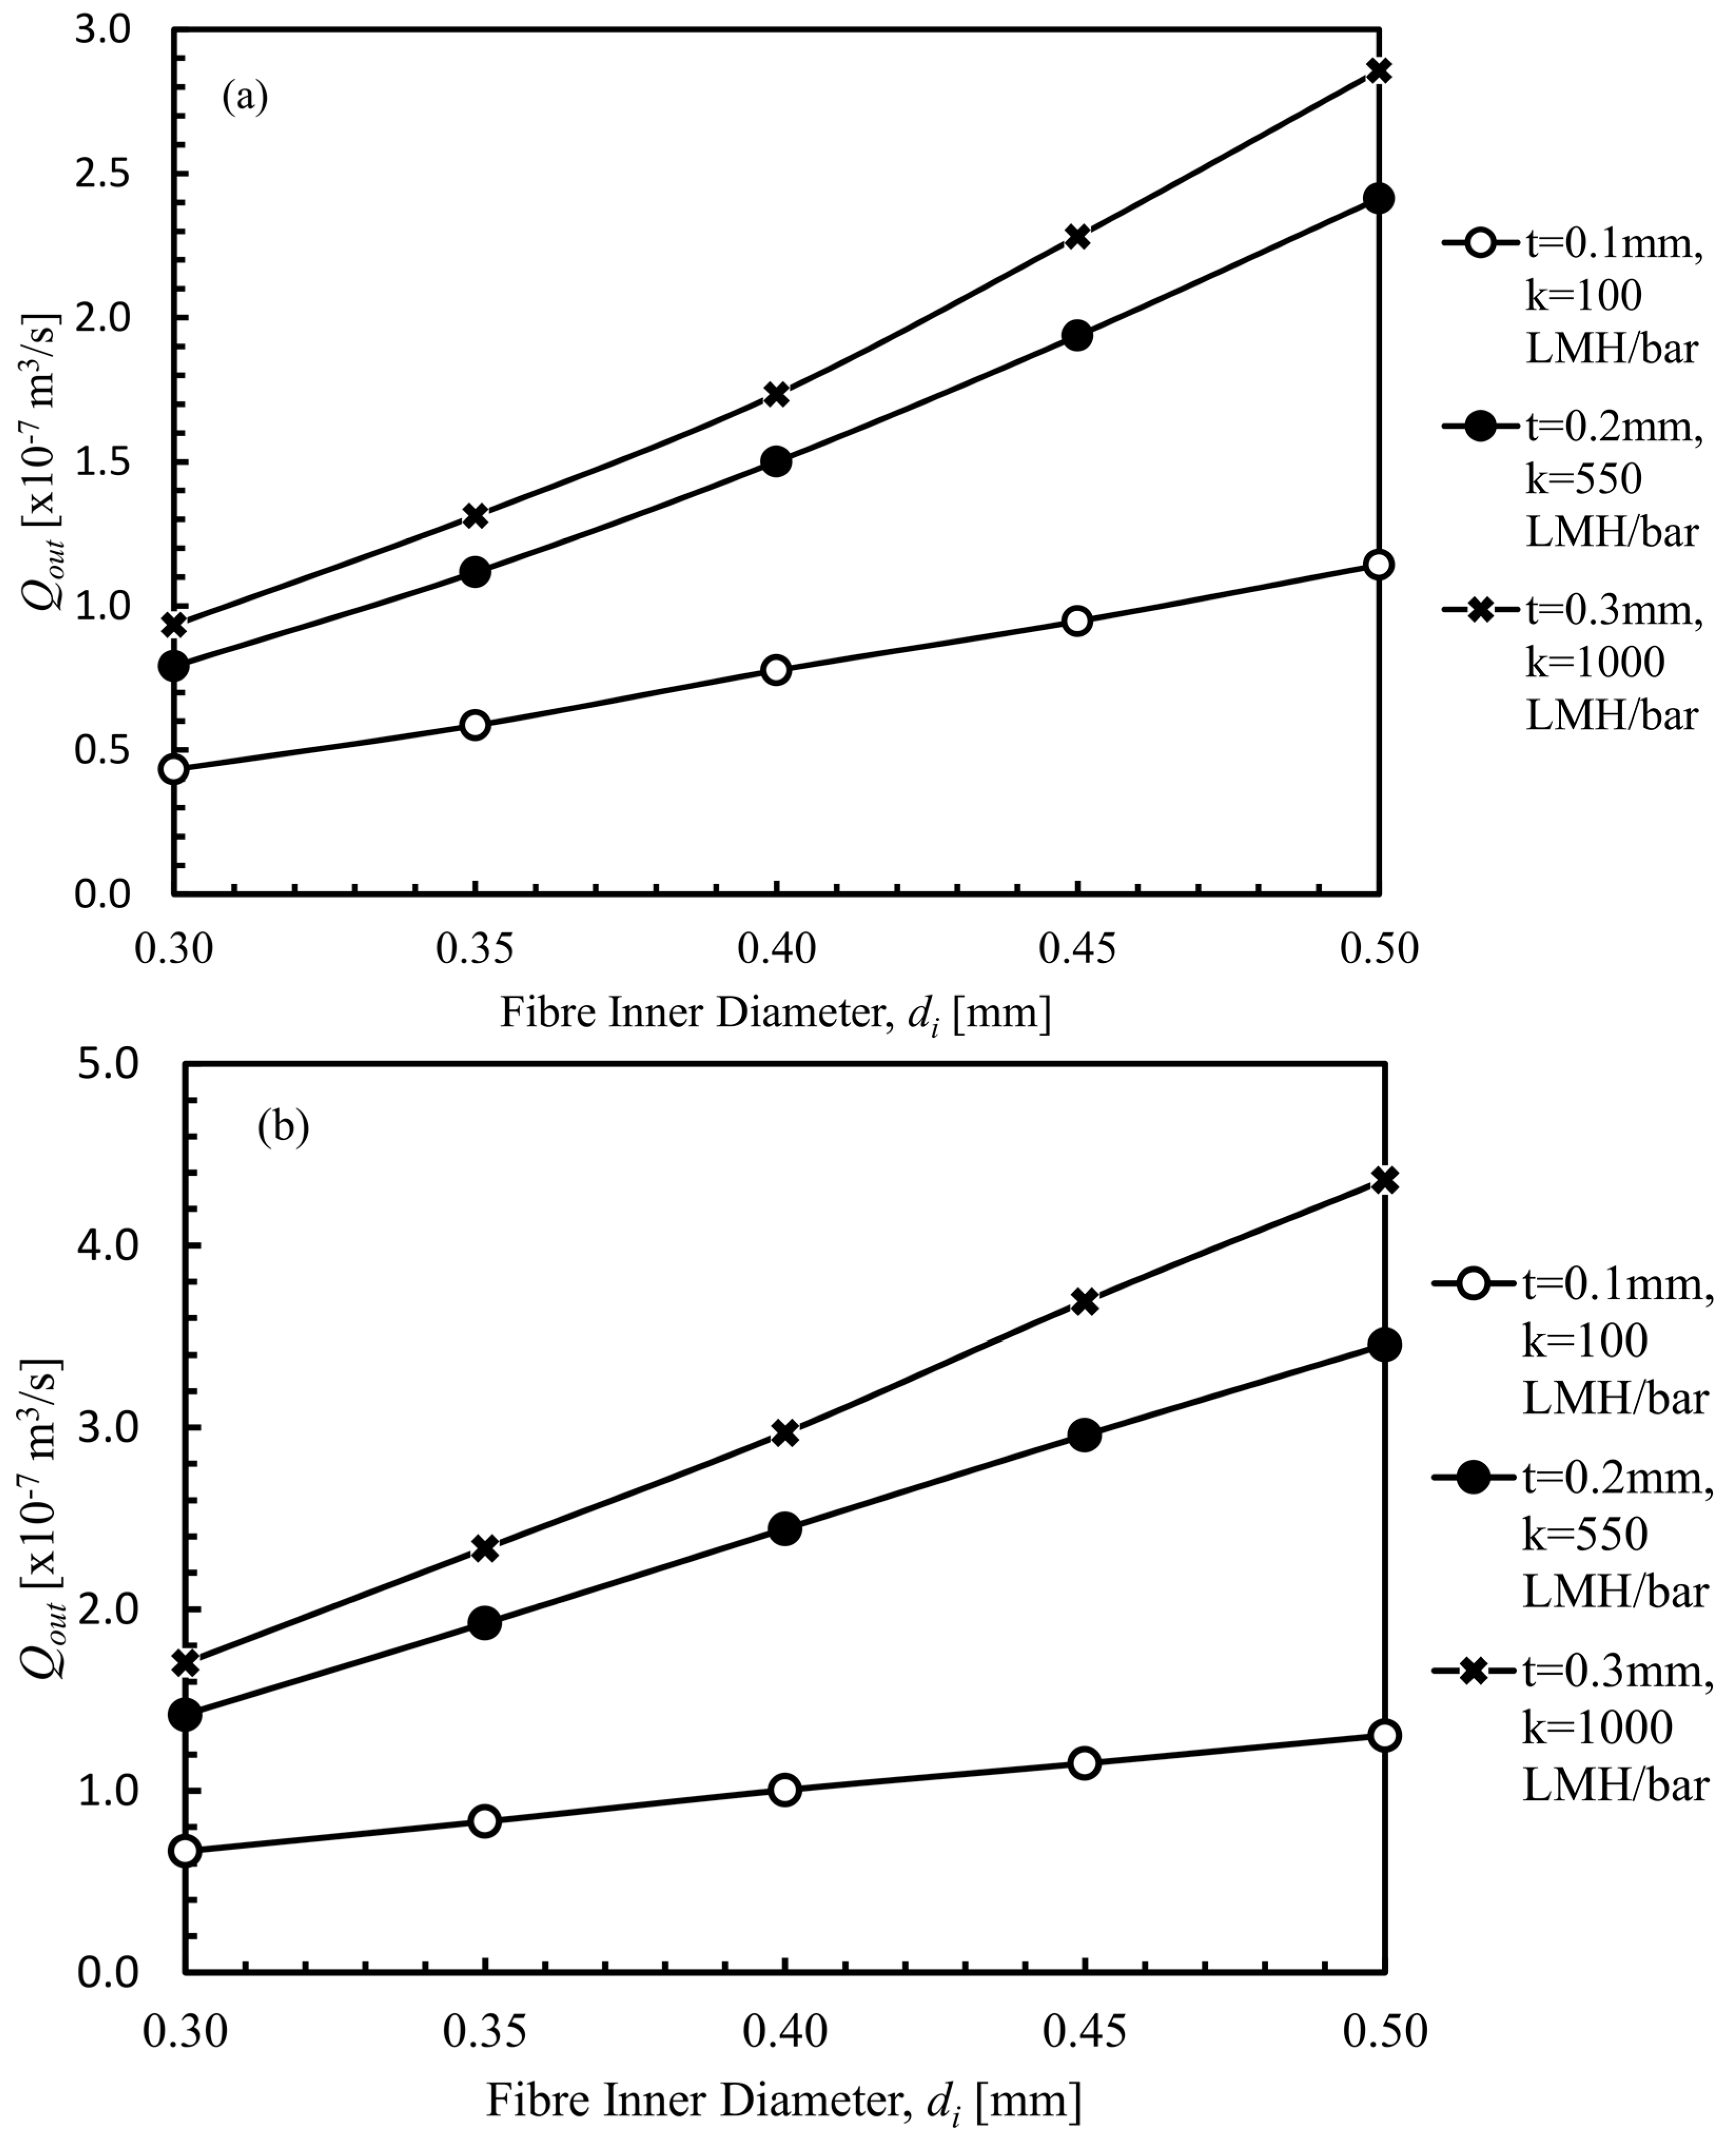
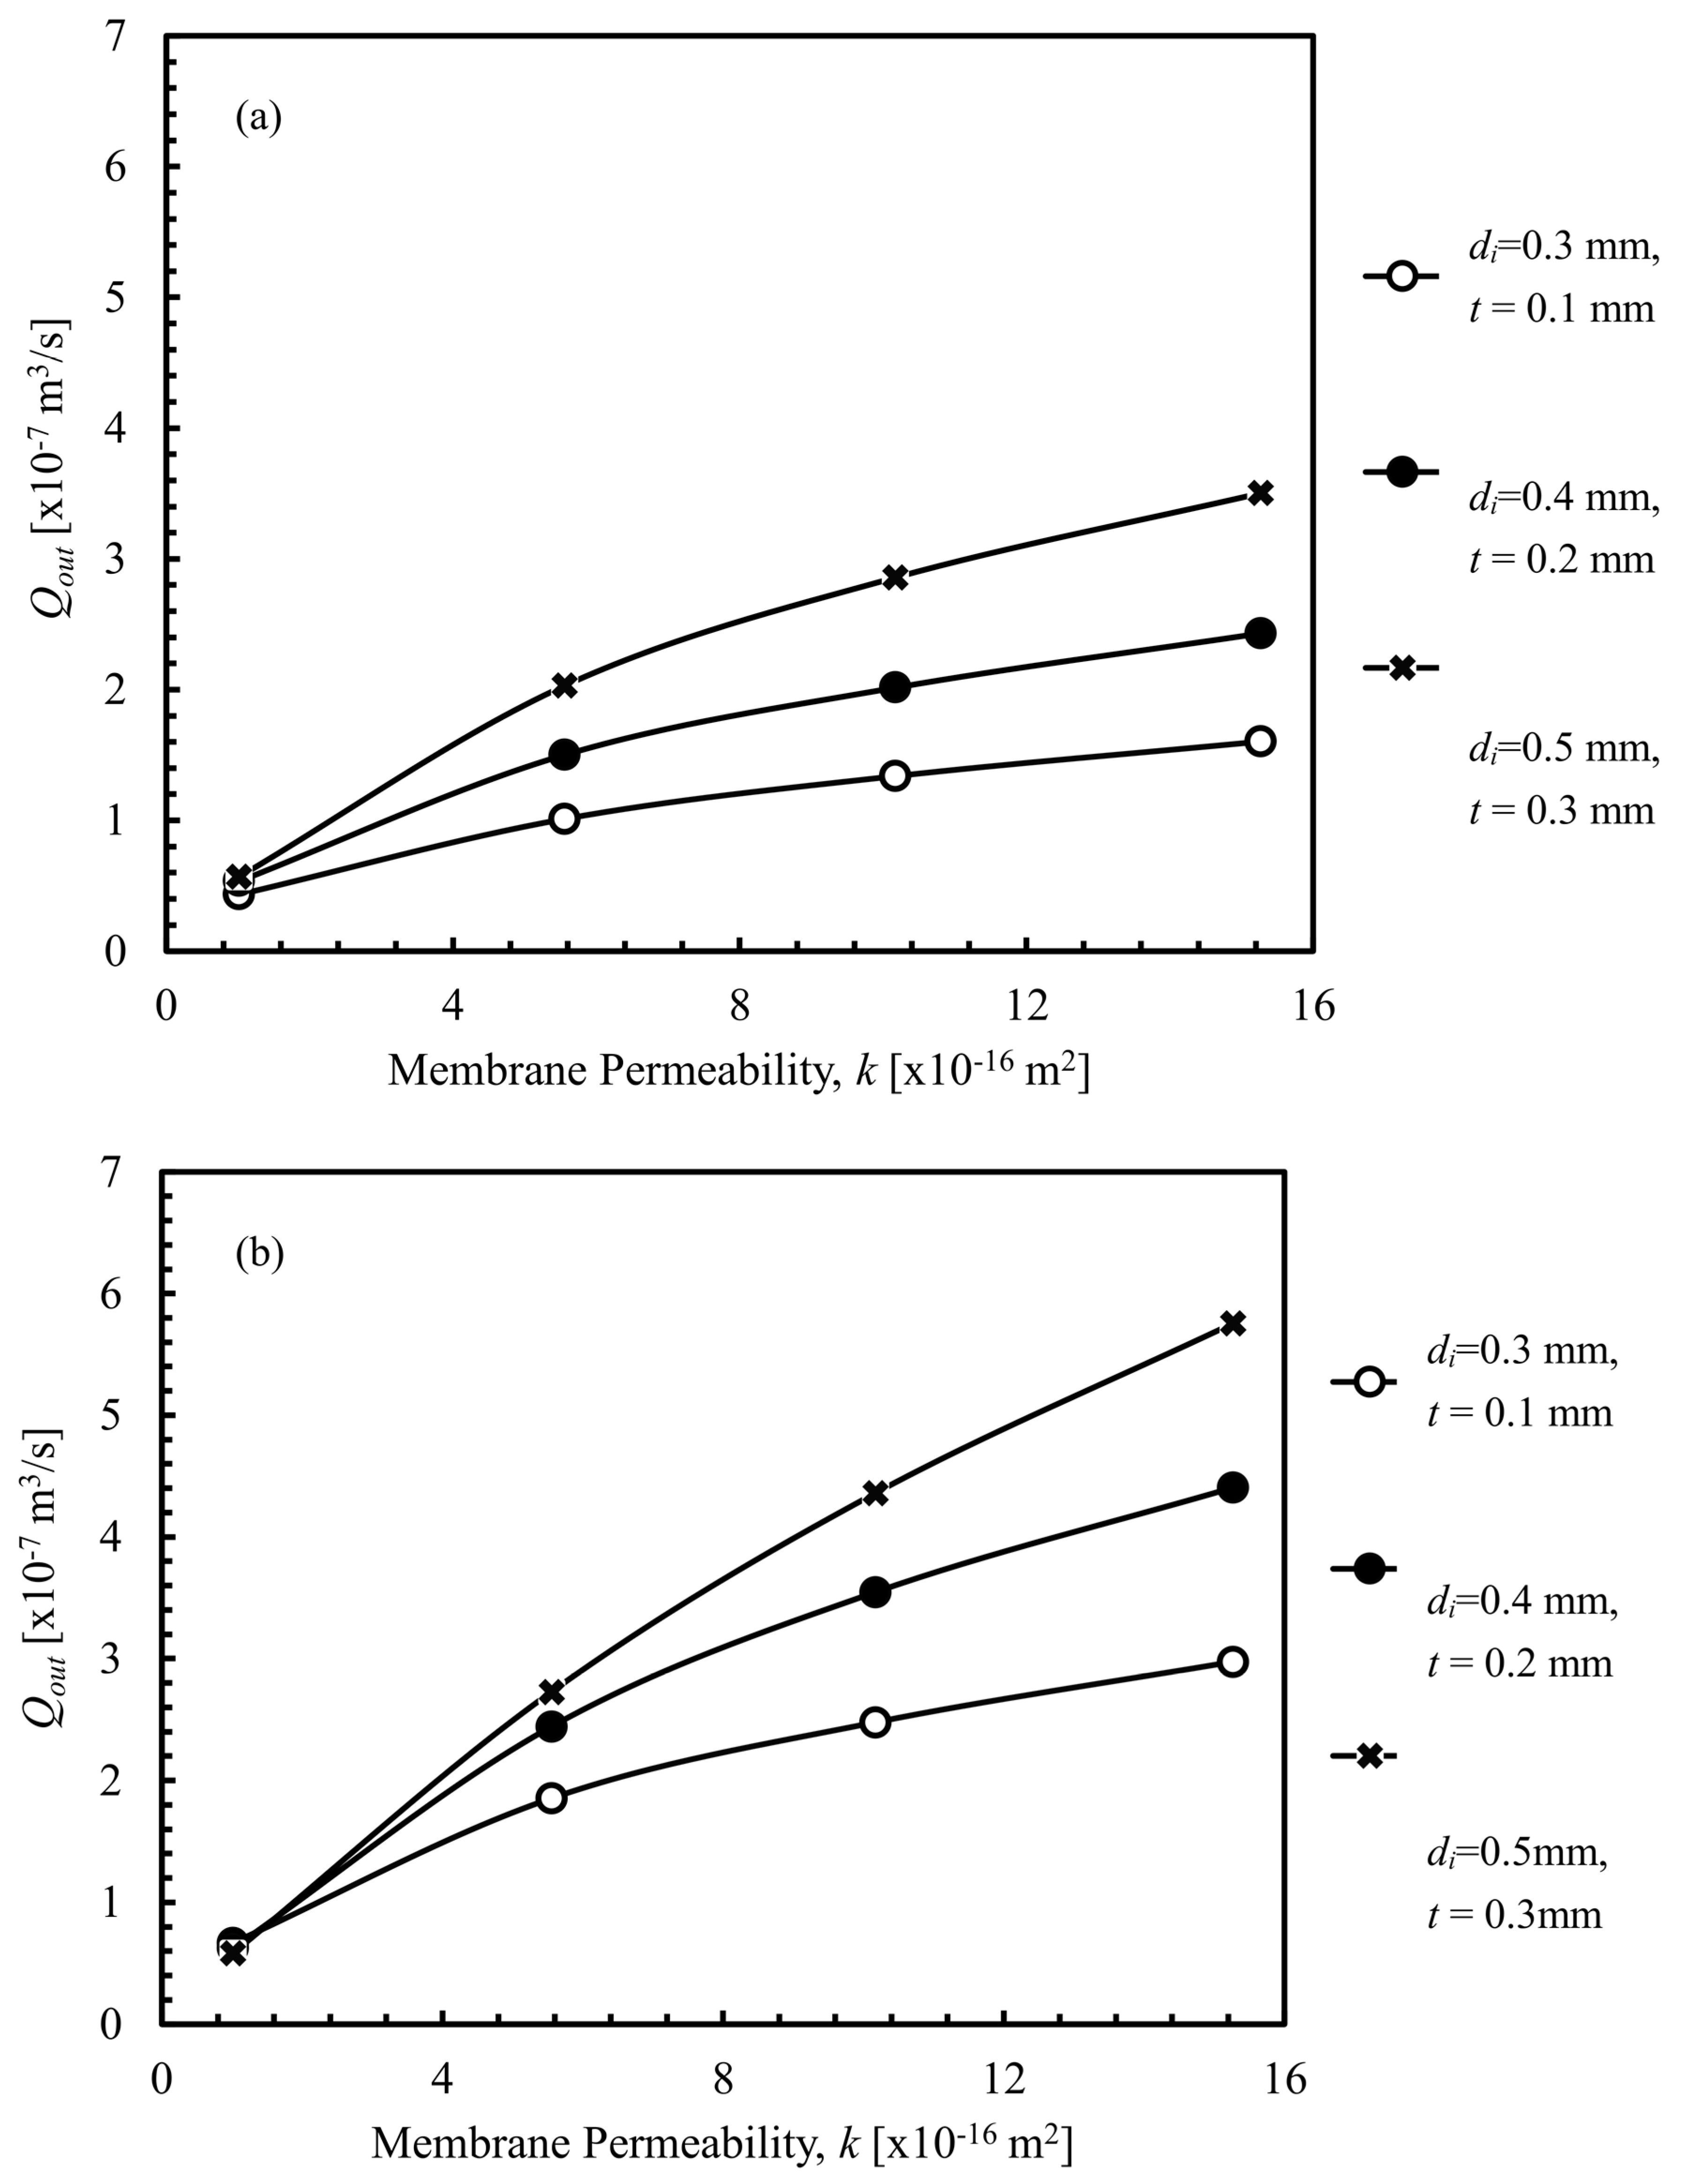
4.1.1. Fibre Inner Diameter

Figure 7a,b shows the output flow rate of fibres grouped according to the corresponding combination of membrane thickness and permeability. The output flow rate across all fibre groups increased in correspondence to the increase in inner diameter. This trend is present in both single-end and double-end suction configurations, as shown in Figure 7a,b, respectively. The output increase stems from the reduced resistance due to the enlargement of the lumen channel, resulting in the flow rate increase. Due to difference in membrane thickness and permeability used in each group, the amount of water entering the fibre lumen difers across the three groups presented. This explains the different rates of flowrate increment among each group even though the increase in inner diameter is consistent.
As the pressure difference required is also reduced, a reduction in effectiveness of the change in configuration is observed, shown by the drop in the percentage increase of the output flow rate (Figure 7c). As each of the fibre groups have different flow rates of water entering the fibre lumen, the permeate pressure profiles are different even when at the same inner diameter. This results in the profiles in percentage increase for each fibre group being different in comparison.

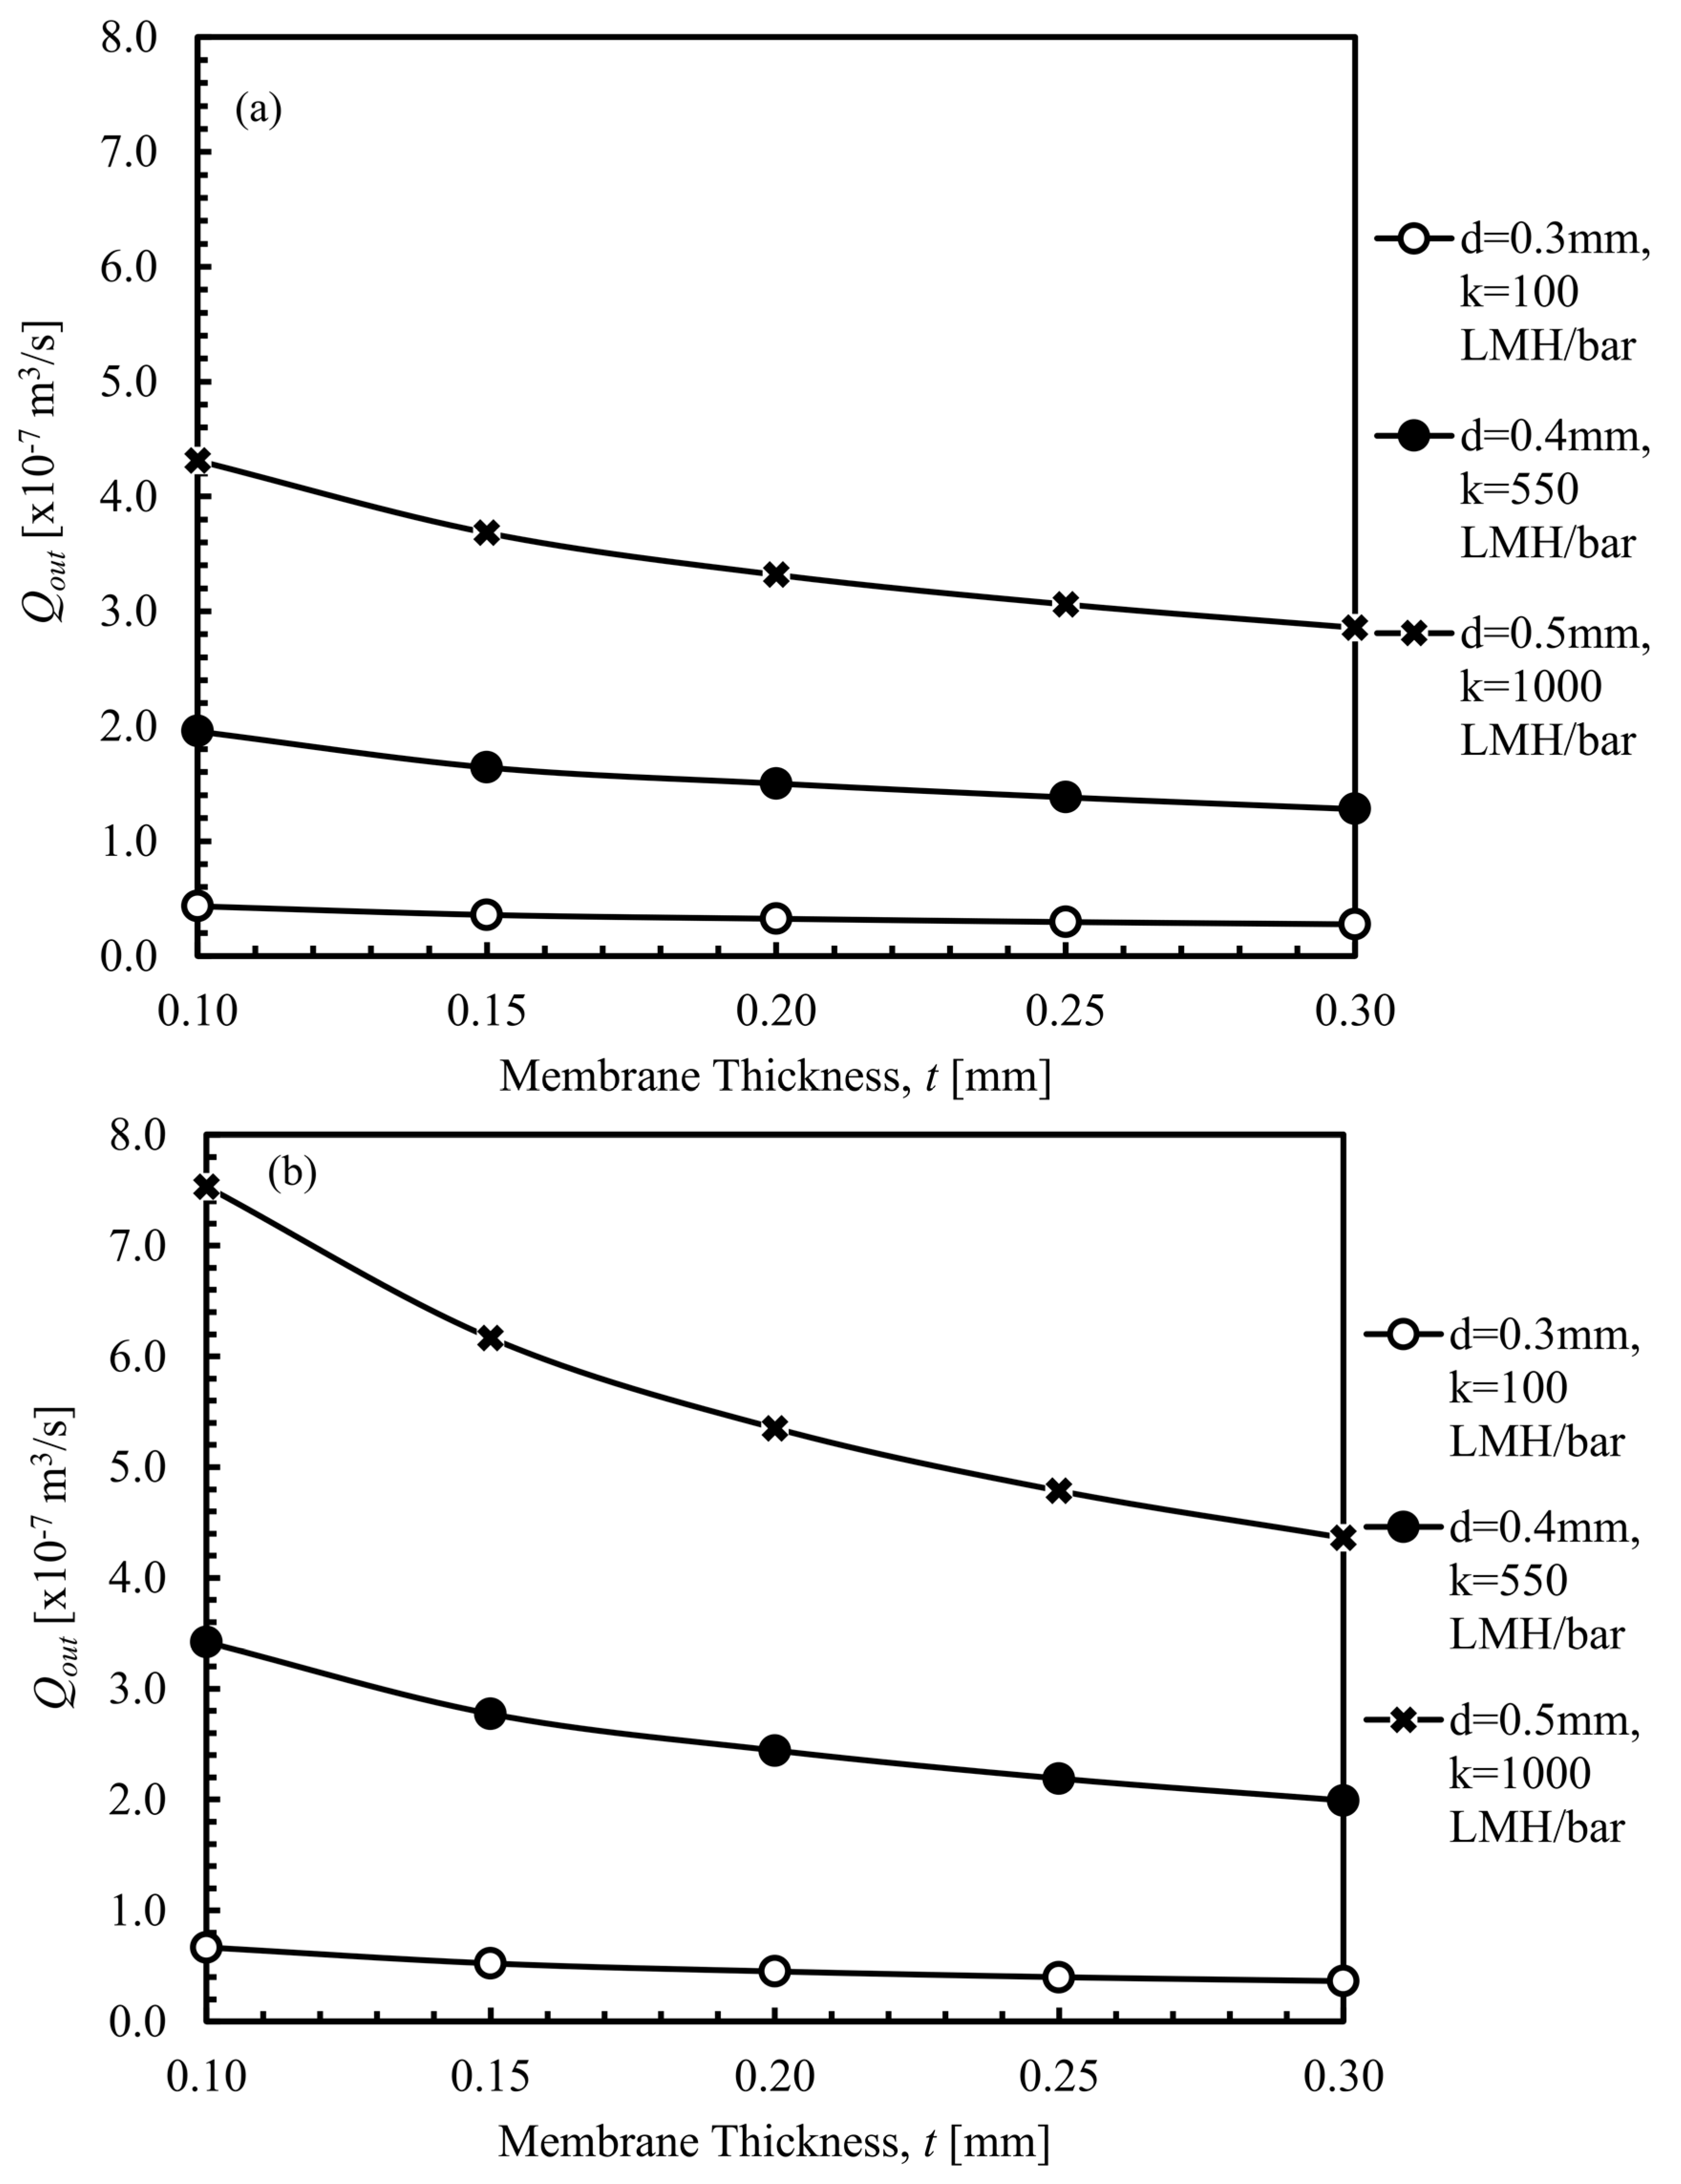
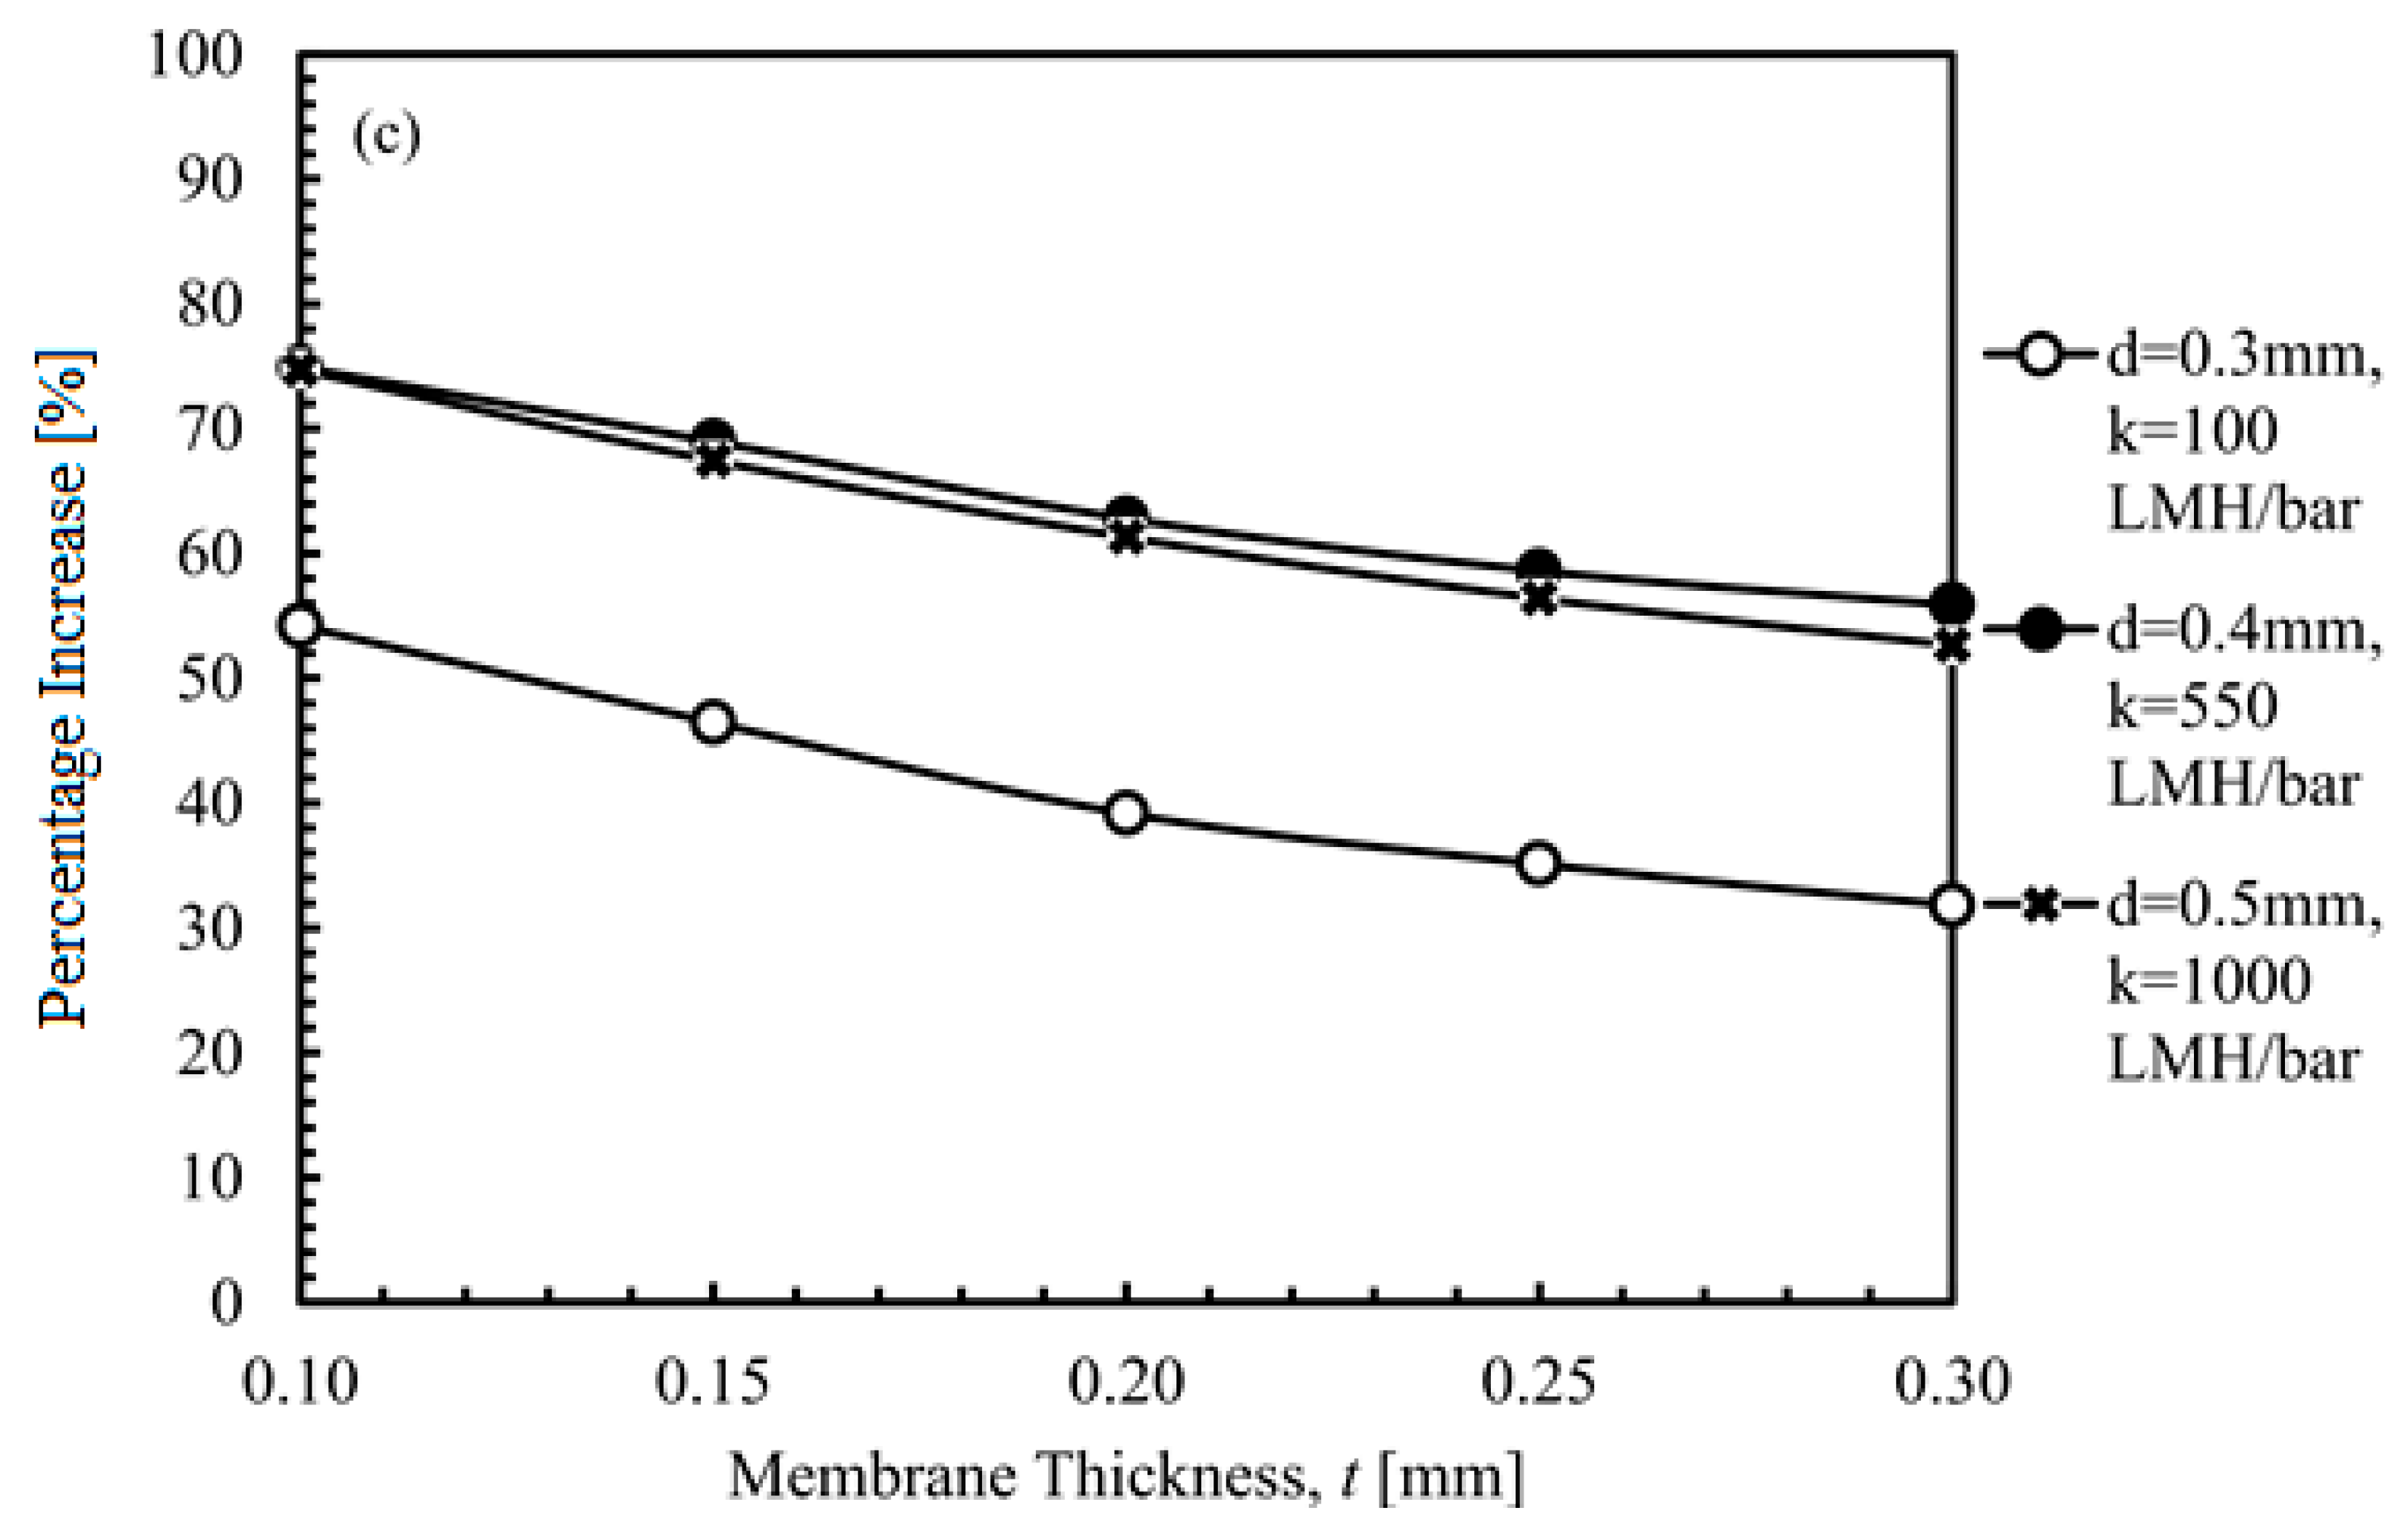
4.1.2. Membrane Thickness

Figure 8a,b shows the output flow rate of fibres grouped according to the corresponding combination of inner diameter and membrane permeability. As the membrane thickness increases, a reduction in output flow rate was observed. This is due to the increase in membrane resistance which reduces flow of water through the membrane walls. This reduction follows an inversely proportional relationship, but the rate of reduction is observed to be dependent on the other two parameters studied as well. The group of fibres with membrane permeability of 100 LMH/bar—expected to have the lowest membrane flux—coupled with the smallest inner diameter of 0.3 mm has the lowest permeate flow, as shown in Figure 8a,b. In contrast, the group of fibres with membrane permeability of 1000 LMH/bar and inner diameter of 0.5 mm has the largest permeate flow rate. The high permeate flow rate makes the effect of permeate reduction caused by membrane thickness significant in contrast to the former group of fibres.
As the increase in membrane thickness reduces the inflow of water into the fibre lumen, a lesser pressure difference is required to drive water towards the exit. This decrease in permeate pressure required leads to a reduction in effectiveness of the double-end configuration observed, shown as a reduction in percentage increase of output flow rate due to configuration change.

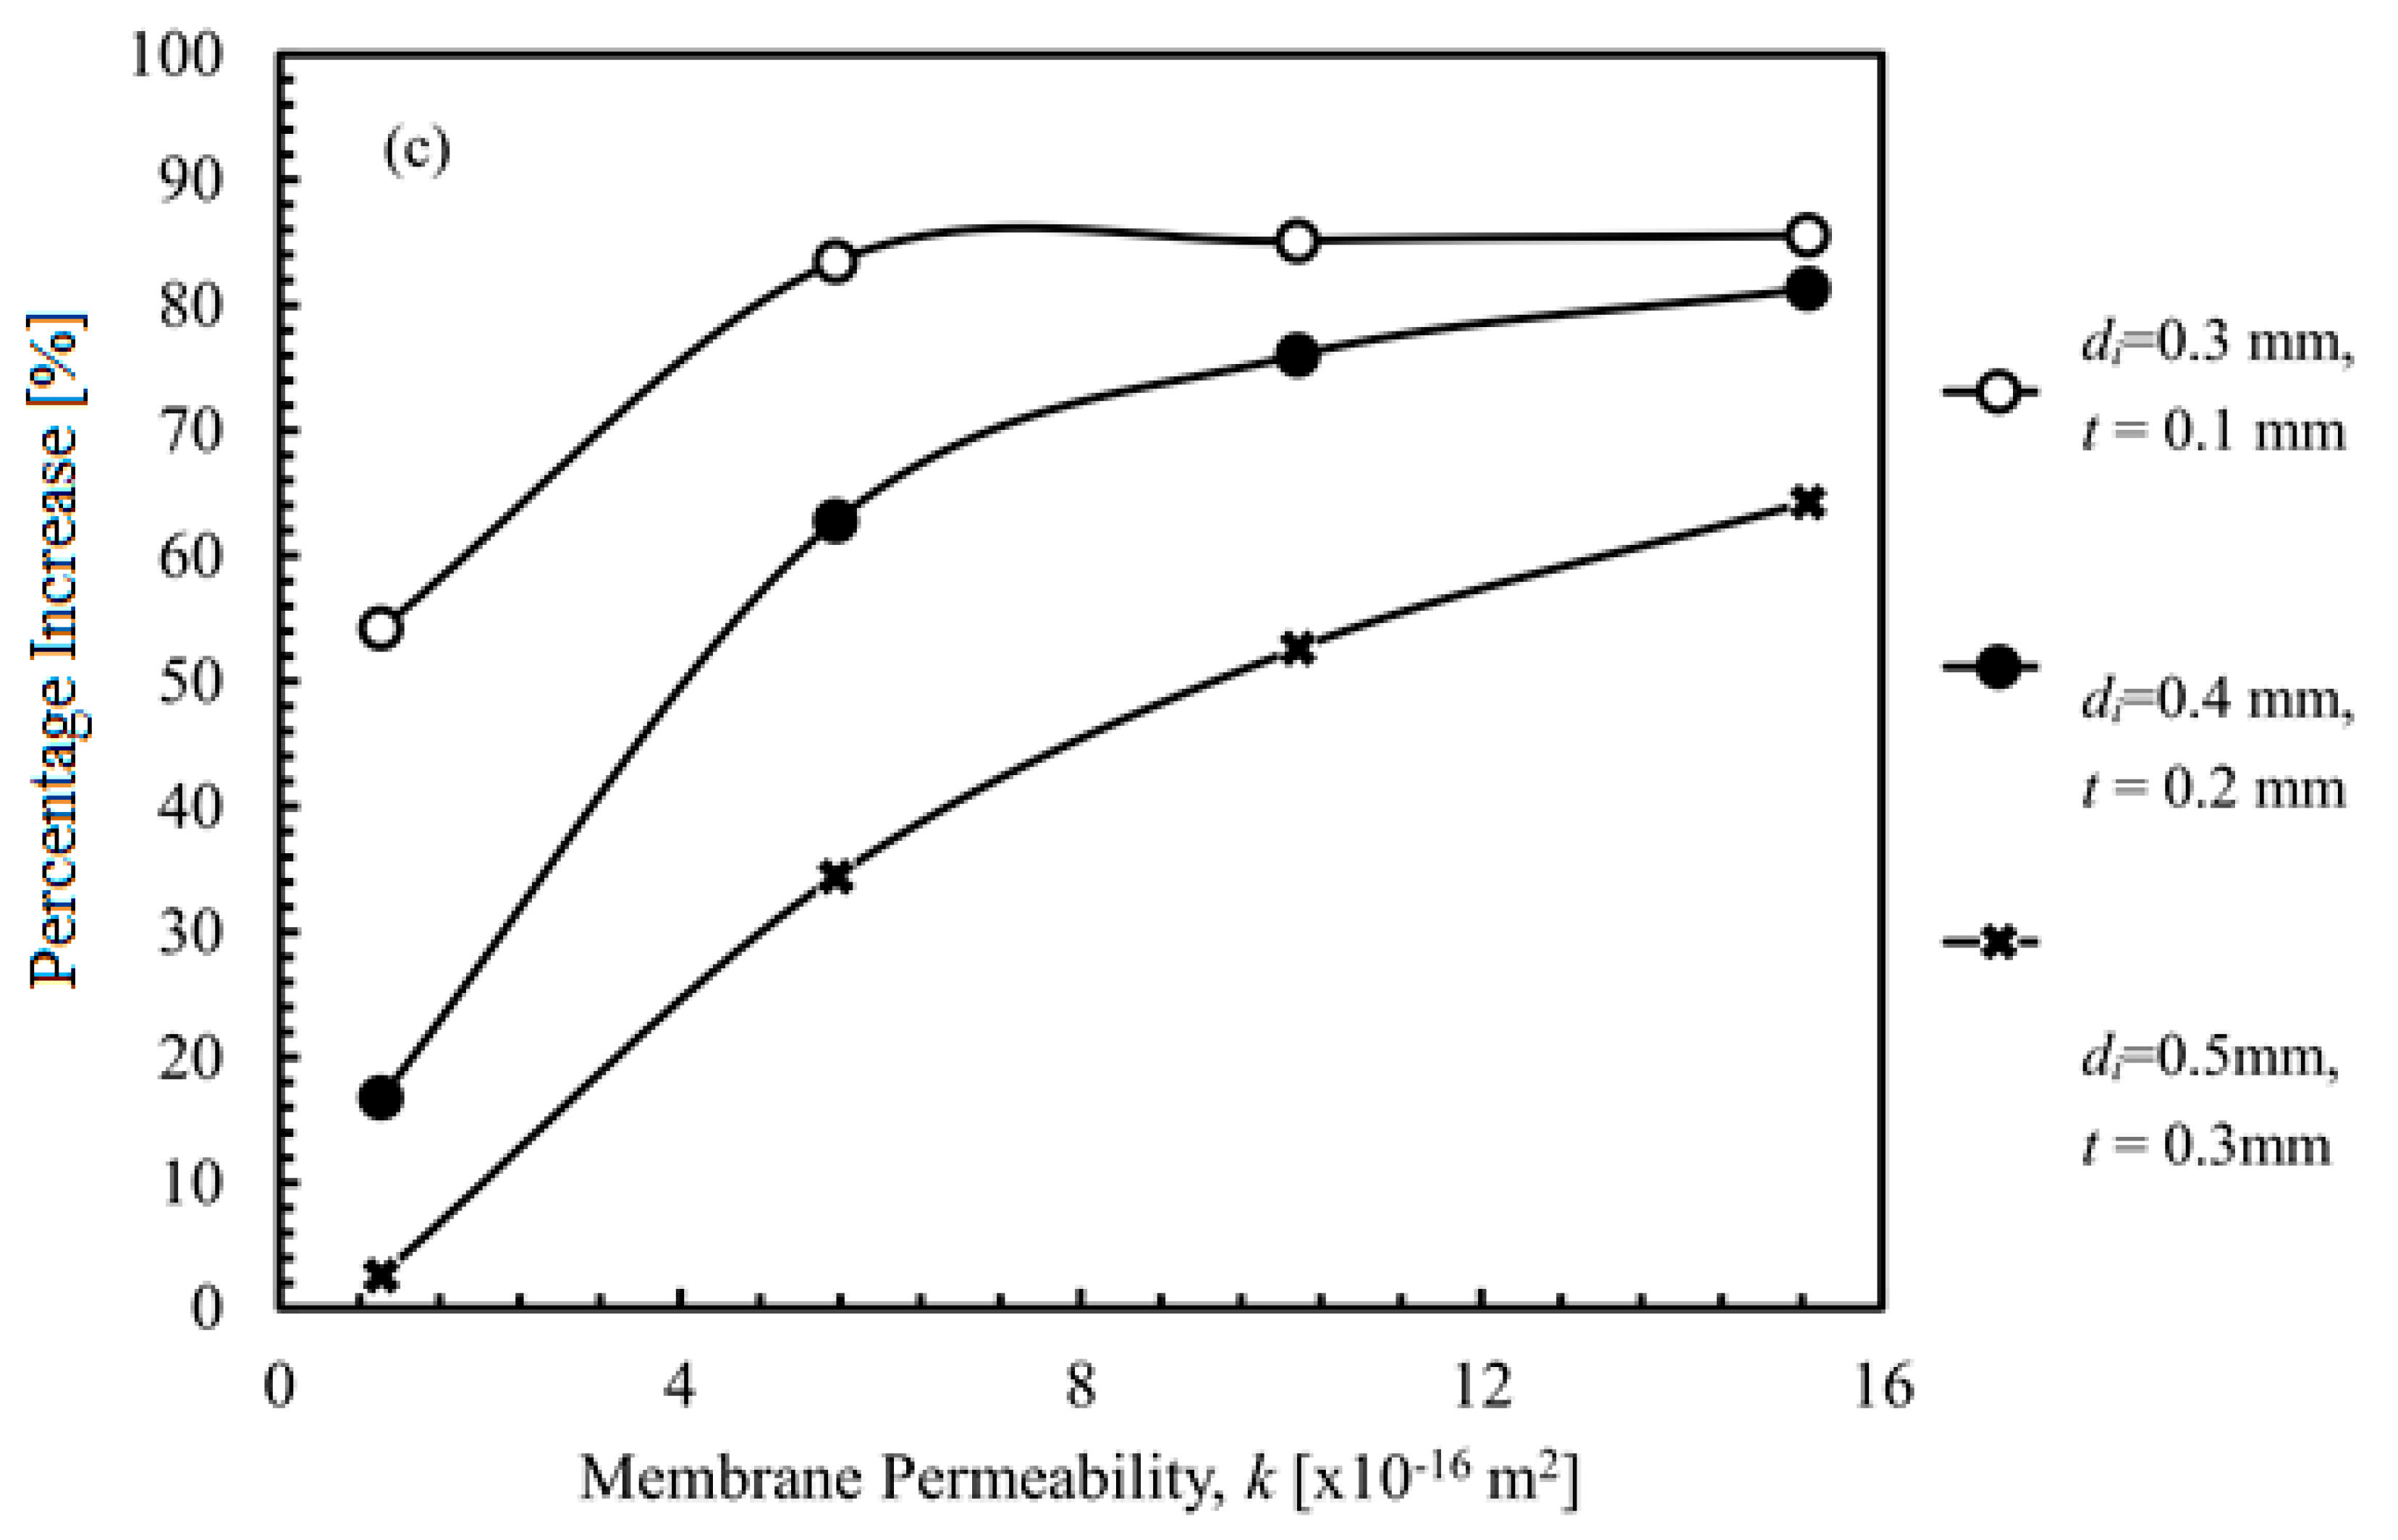
4.1.3. Membrane Permeability

A total of four different values of permeability were used to study its effects on output flow rate in both single-end and double-end fibres as well as the relative percentage increase, as shown in Figure 9. As membrane permeability increases, the flow rate of water per unit of transmembrane pressure increases proportionally. This led to an increase in permeate flow rate through the inner channel, and, subsequently, to an increase in permeate output flow rate. With the increase in permeate flow rate, the permeate pressure increases in response. As the increase in permeate pressure is tied to the increase in membrane permeability, the percentage increase of double-end suction fibres relative to that of single-end suction fibres is observed to increase with membrane permeability. However, for fibres with inner diameter of 0.3 mm and membrane thickness of 0.1 mm, the percentage increase stops at around 85%. This indicates that this group of fibres has a very high permeate pressure profile, and the effectiveness of using the double-end suction configuration is the largest in this fibre group.

4.2. Derivation of a Single Quantifiable Parameter to Identify Fibre Cross-Sectional Geometry

4.2.1. The Need for a Single Quantifiable Parameter

In summarising the parametric study from the previous section, it is evident that each of the different parameters studied affects both output flow rate and percentage increment due to configuration change differently. It is interesting to note that fibre inner diameter effects output flow rate positively, but percentage increment negatively. This could indicate that the effect of inner diameter is directed at the permeate pressure profile, in contrast to the direct increase or decrease of water flow through the membrane wall influenced by membrane thickness and permeability.
Due to the number of parameters involved and differing effects that each parameter studied has on percentage increase due to configuration change, prediction of the tangible increase in flow rate can be difficult. Hence, a single parameter which can be used to quantify a fibre’s characteristics in both single-end and double-end configurations is needed. Doing so will allow for percentage increase due to configuration change to be preliminarily determined based solely on fibre dimensions.

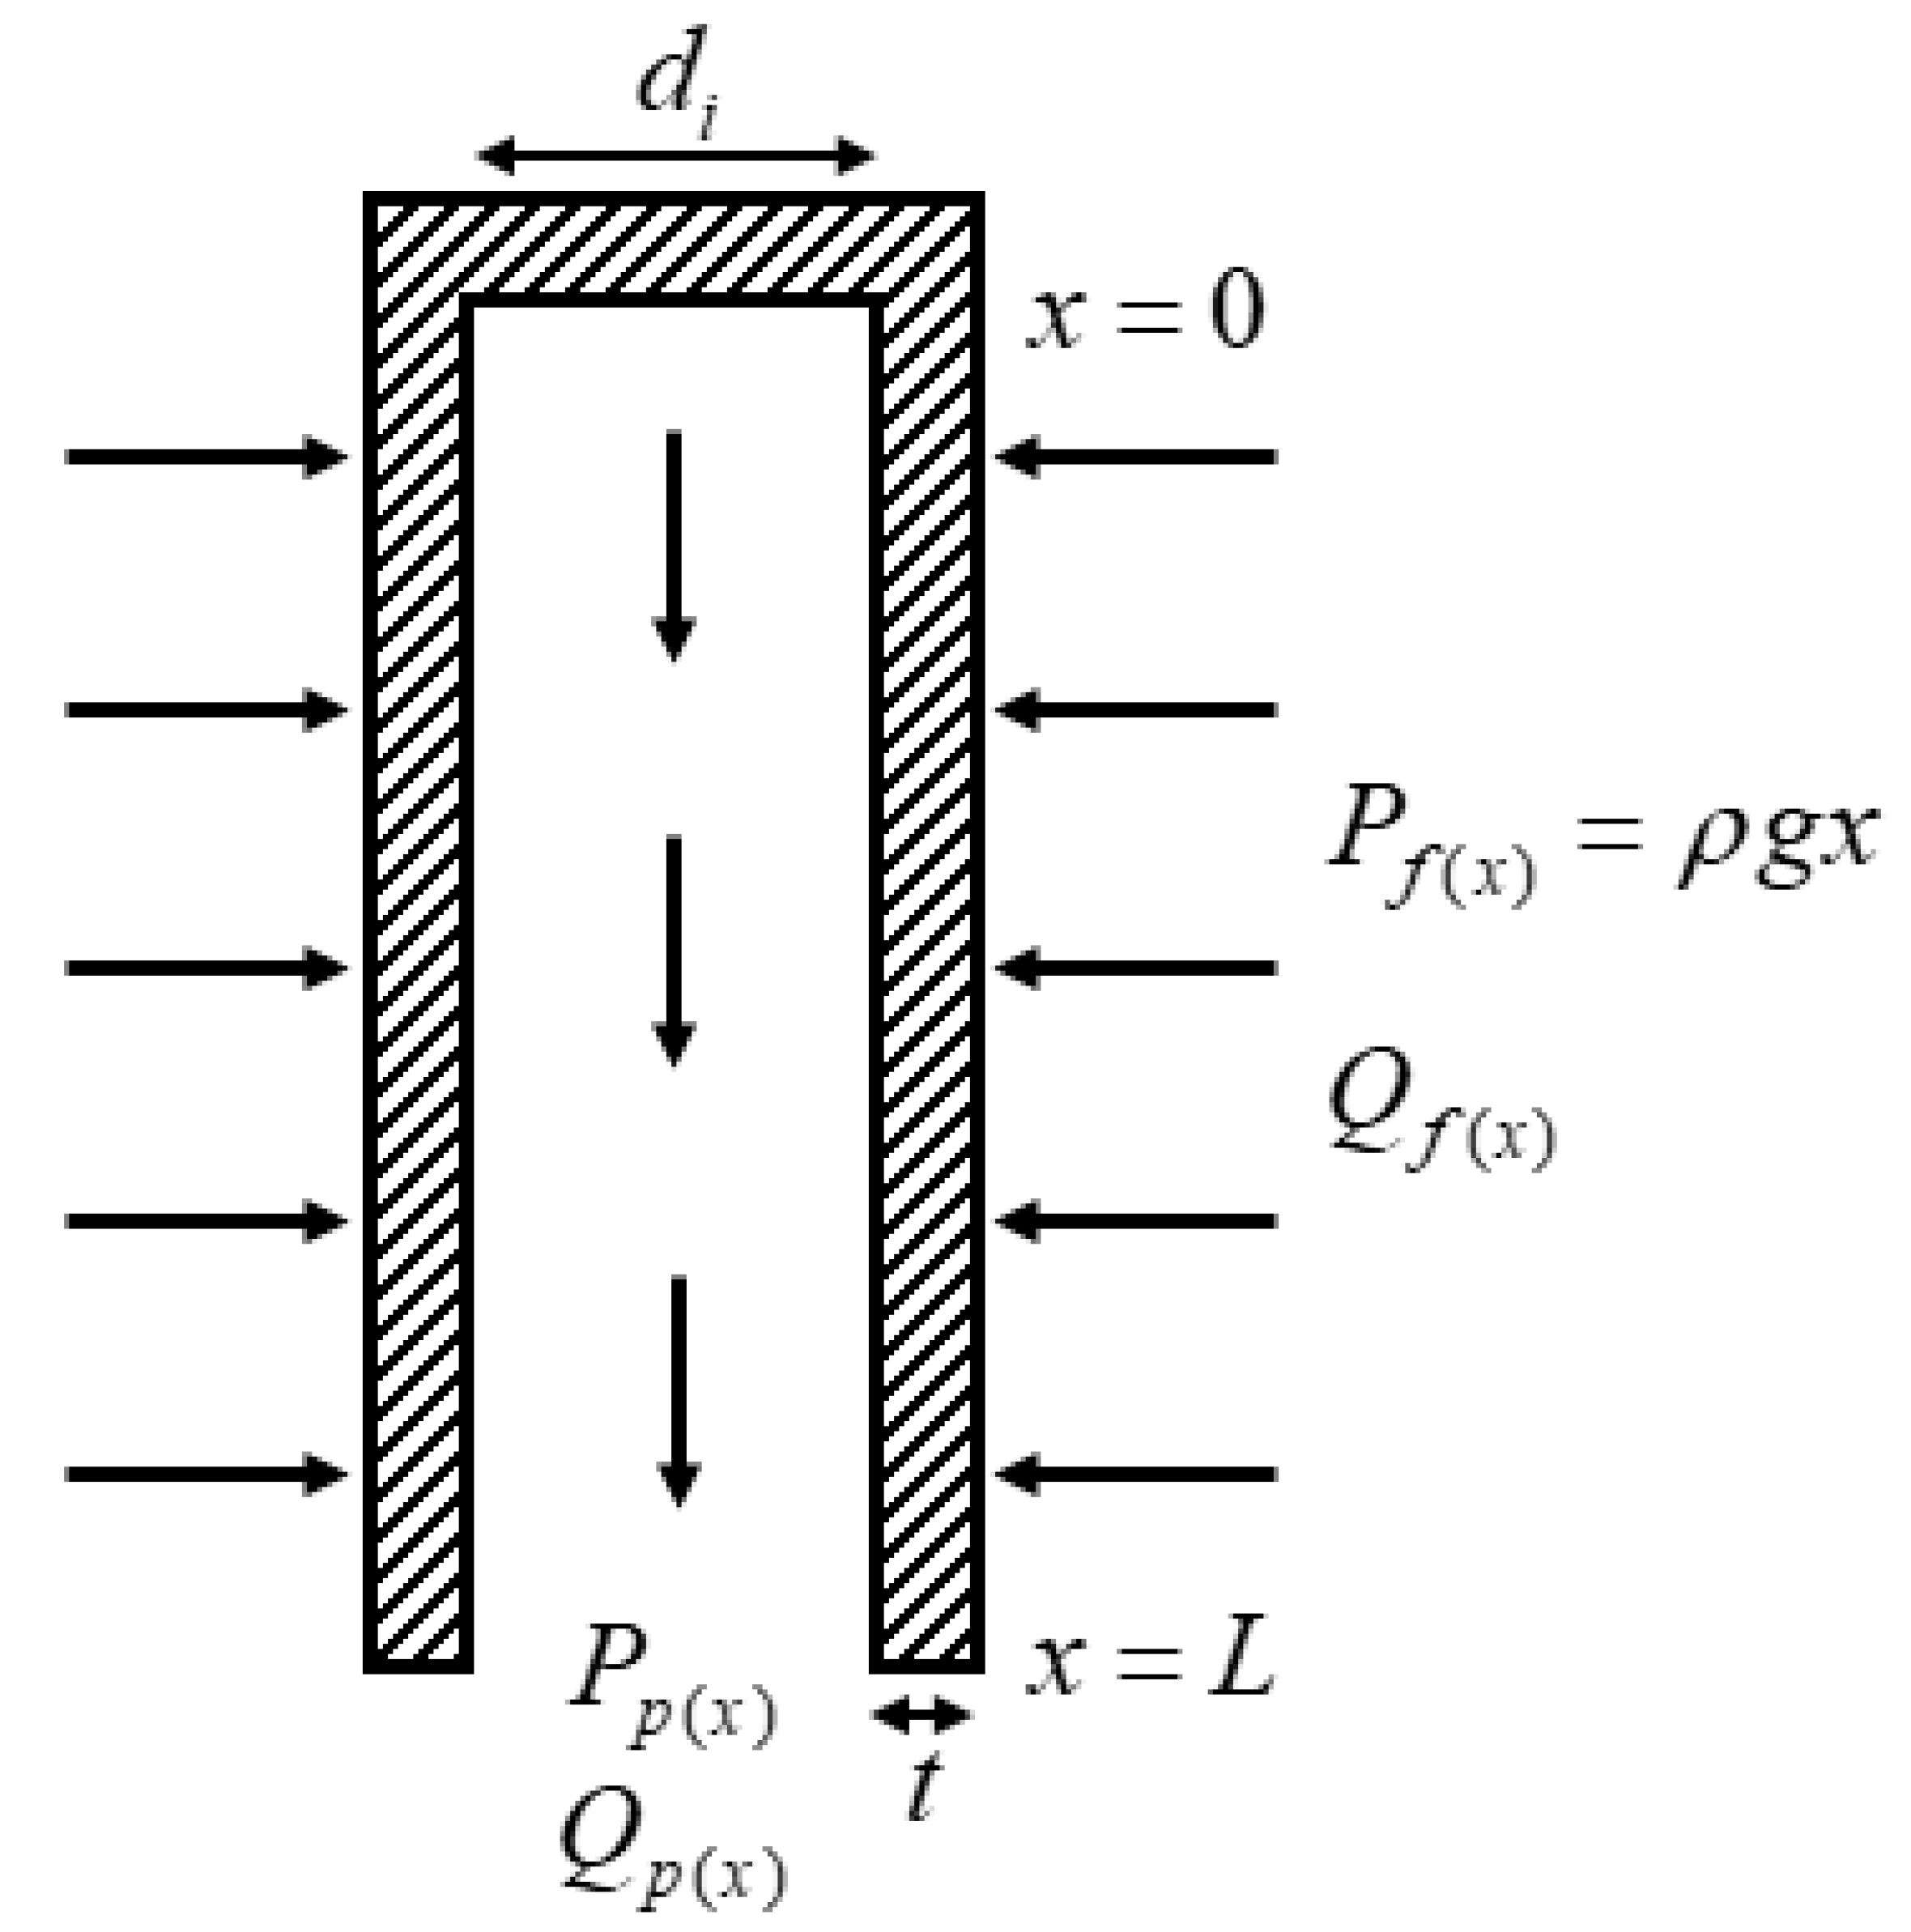
4.2.2. Permeate Output Flow Rate Calculation for Single-End Bottom Suction Configuration

The adopted derivation of permeate output flow rate from a single-end fibre is based on Chang et al.’s model of submerged dead-end hollow fibre during initial flux distribution [5]. The theoretical model is shown in Figure 10. The model considers the water depth in which the hypothetical module is immersed, as well as the proportional difference in fibre outer and inner diameter that stems from the cylindrical geometry and membrane thickness that has to be taken into account.
The pure water flux acting through the membrane wall can be described using Darcy’s equation:
d Q f ( x ) d x = k π d e [ P f ( x ) P p ( x ) ] μ t
where
  • Pf(x) denotes feed pressure at point x along the fibre length;
  • Pp(x) denotes permeate pressure at point x along the fibre length;
  • d Q f ( x ) d x   denotes membrane flux at point x along the fibre length;
  • k denotes membrane permeability in m2;
  • de denotes fibre external diameter in m;
  • µ denotes dynamic viscosity of water in Pa∙s; and
  • t denotes membrane thickness in m.
Since the fibres are submerged 2 m below water level, taking the density of water to be 1000 kg/m3 and gravity acceleration to be 10 m/s2, we have
P f ( x ) = ρ g ( 2 + x ) = 10 4 ( 2 + x ) .
Hence,
d Q f ( x ) d x = k π d e [ 10 4 ( 2 + x ) P p ( x ) ] μ t   .
The permeate flow profile can be approximated using the Hagen–Poisseuille equation for inclined pipe flow:
d P p ( x ) d x = 128 μ π d i 4 Q p ( x ) + 10 4
where di denotes fibre inner diameter in m.
Relating the membrane flux and permeate flow rate along fibre length with a mass balance gives
d Q p ( x ) d x = d Q f ( x ) d x = k π d e [ 10 4 ( 2 + x ) P p ( x ) ] μ t   .
Differentiating Equation (7) gives
d 2 Q p ( x ) d x 2 = 10 4 k π d e μ t k π d e μ t ( d P p ( x ) d x ) .
Substituting for dPp(x)/dx from Equation (6) into Equation (8) gives
d 2 Q p ( x ) d x 2 = 128 k d e t d i 4 ( Q p ( x ) ) .
Solving the second-order ordinary differential equation gives the master equation
Q p ( x ) = C 1 e x 128 k d e t d i 4 + C 2 e x 128 k d e t d i 4
where C1 and C2 can be found by applying the boundary conditions, Qp(0) = 0 and Pp(L) = Ps, where Ps is the suction pressure applied at the outlet.
Hence, the derived equation for determining the permeate output flow rate of a fibre in single-end bottom suction configuration is given as
Q p ( L ) = ( k π d e λ μ t ) { [ 10 4 ( 2 + L ) P s ] ( e λ L e λ L ) ( e λ L + e λ L ) } ,   where   λ = 128 k d e t d i 4   .

4.2.3. Permeate Output Flow Rate Calculation for Double-End Suction Configuration

The double-end suction configuration has the lumen channel opened at both ends and connected to suction pumps. This allows permeate to flow from both the top and bottom of the fibre. As the permeate flows in two opposite directions, it is certain that there is a point along the axial length where permeate flowrate Qp(x) = 0. The point where there is no permeate flowrate is shown in Figure 11 as the dashed line within the lumen. This is also the point where the permeate flow changes direction. Hence, to derive the permeate output flow rate, the double-end fibre can be considered as two regions of single-end fibres. The segment of fibre with upward permeate flow will have a fibre length of L1, while the other segment with downward permeate flow will have a fibre length of L2.
The above simplification of the double-end fibre model into two single-end fibre segments allows for the same master equation (Equation (10)) in Section 4.2.2 to be applied. For segment (A), the boundary conditions Qp(0) = 0 and Pp(L1) = Ps are applied. This results in the segment (A) general solution
Q p ( L 1 ) = k π d e [ 2 × 10 4 P s ] λ μ t ( e λ L 1 e λ L 1 ) ( e λ L 1 + e λ L 1 )   where   λ = 128 k d e t d i 4   .
For segment (B), the boundary conditions Qp(0) = 0 and Pp(L2) = Ps are applied. This gives the segment (B) general solution
Q p ( L 2 ) = k π d e [ 3 × 10 4 P s ] λ μ t ( e λ L 2 e λ L 2 ) ( e λ L 2 + e λ L 2 ) ,   where   λ = 128 k d e t d i 4   .
Hence, the total output flow rate Qp(total) is given as
Q p ( t o t a l ) = Q p ( L 1 ) + Q p ( L 2 ) = k π d e λ μ t { ( 2 × 10 4 P s ) ( e λ L 1 e λ L 1 e λ L 1 + e λ L 1 ) + ( 3 × 10 4 P s ) ( e λ L 2 e λ L 2 e λ L 2 + e λ L 2 ) } .

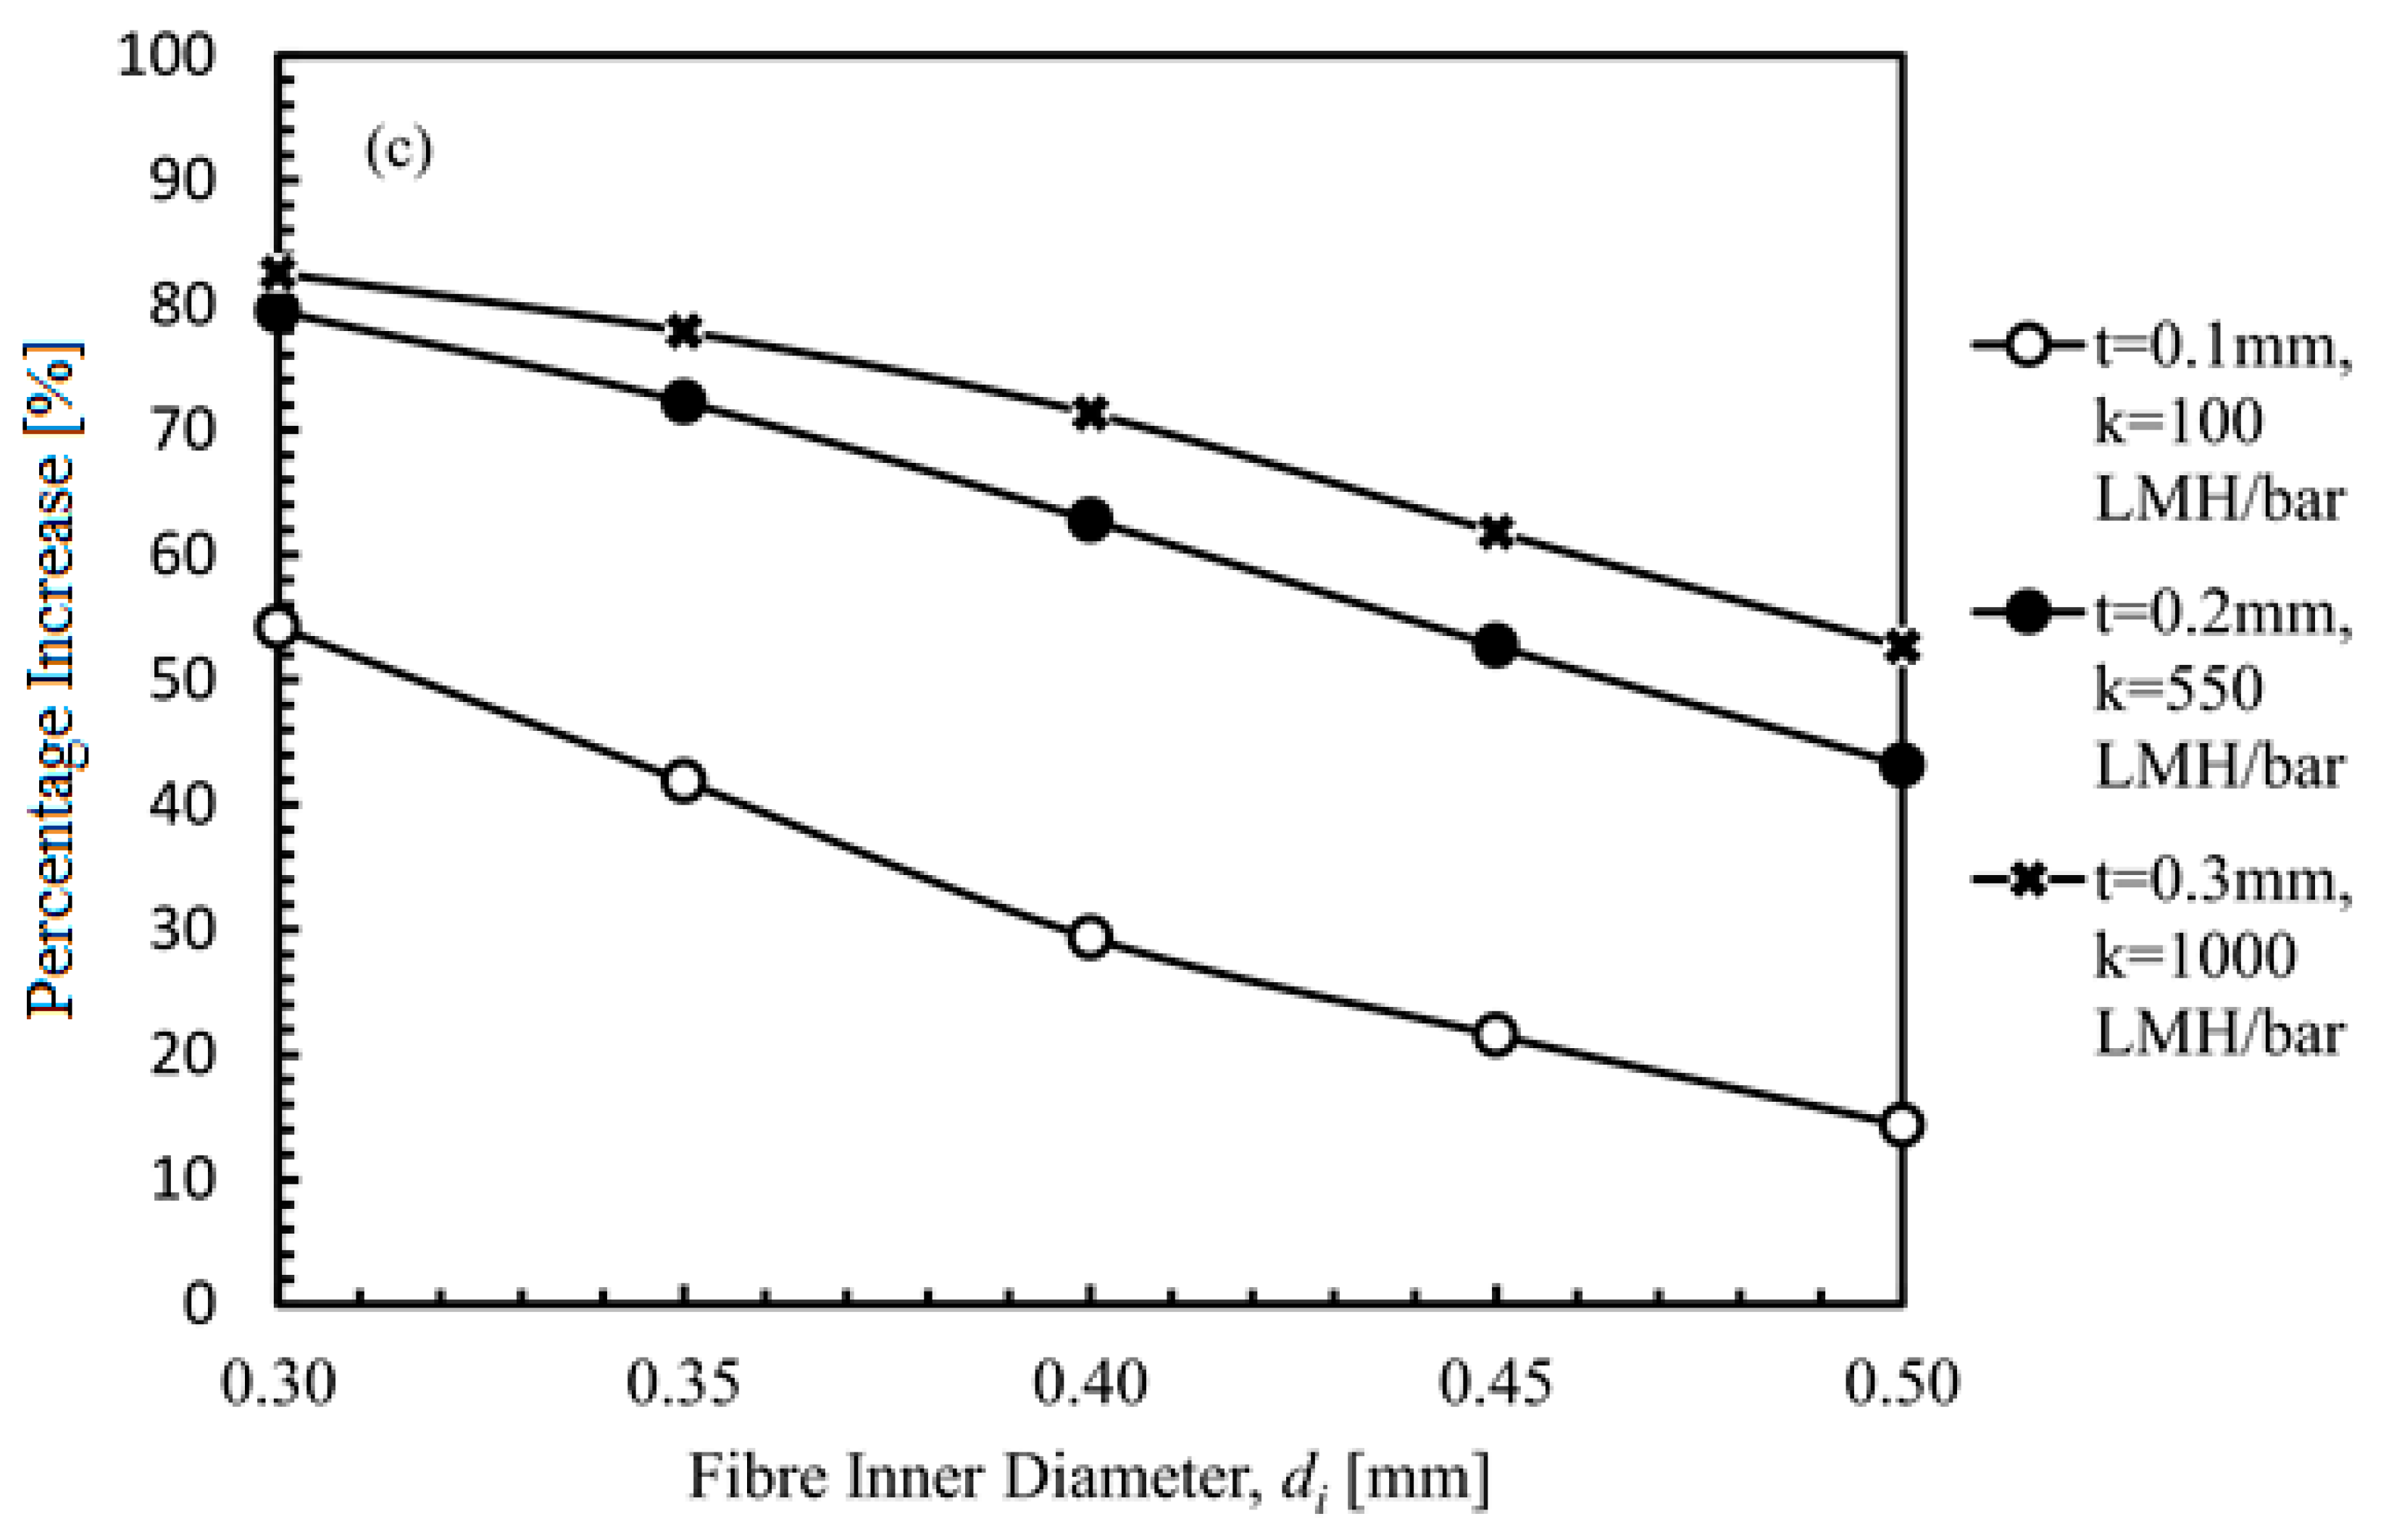
4.2.4. Increase in Permeate Flow Rate by Means of Configuration Change from Single-End to Double-End Suction.

Assuming that fibres of the same dimensions and boundary conditions are used in both cases outlined in Section 4.2.2 and Section 4.2.3, the relative increase in permeate flow rate due to change in configuration can be expressed as
( Q p ( L 1 ) + Q p ( L 2 ) Q p ( L ) 1 ) = k π d e λ μ t { ( 2 × 10 4 P s ) ( e λ L 1 e λ L 1 e λ L 1 + e λ L 1 ) + ( 3 × 10 4 P s ) ( e λ L 2 e λ L 2 e λ L 2 + e λ L 2 ) } k π d e λ μ t { ( 10 4 ( 2 + L ) P s ) ( e λ L e λ L e λ L + e λ L ) } 1 = ( 2 × 10 4 P s ) ( e λ L 1 e λ L 1 e λ L 1 + e λ L 1 ) + ( 3 × 10 4 P s ) ( e λ L 2 e λ L 2 e λ L 2 + e λ L 2 ) { ( 10 4 ( 2 + L ) P s ) ( e λ L e λ L e λ L + e λ L ) } 1
where λ = 128 k d e t d i 4 .
By comparing the relative increase in permeate output flow rate from single-end to double-end fibre, it is evident that this increase in flow rate is dependent on λ. The λ value, as outlined by Chang, is a value unique to the fibre’s geometry. As mentioned by Chang [10], it can be associated with the uniformity of the flux profile. The co-relation as established in Equation (15) may indicate that λ could be used to evaluate the effect of using double-end suction on the corresponding fibre.

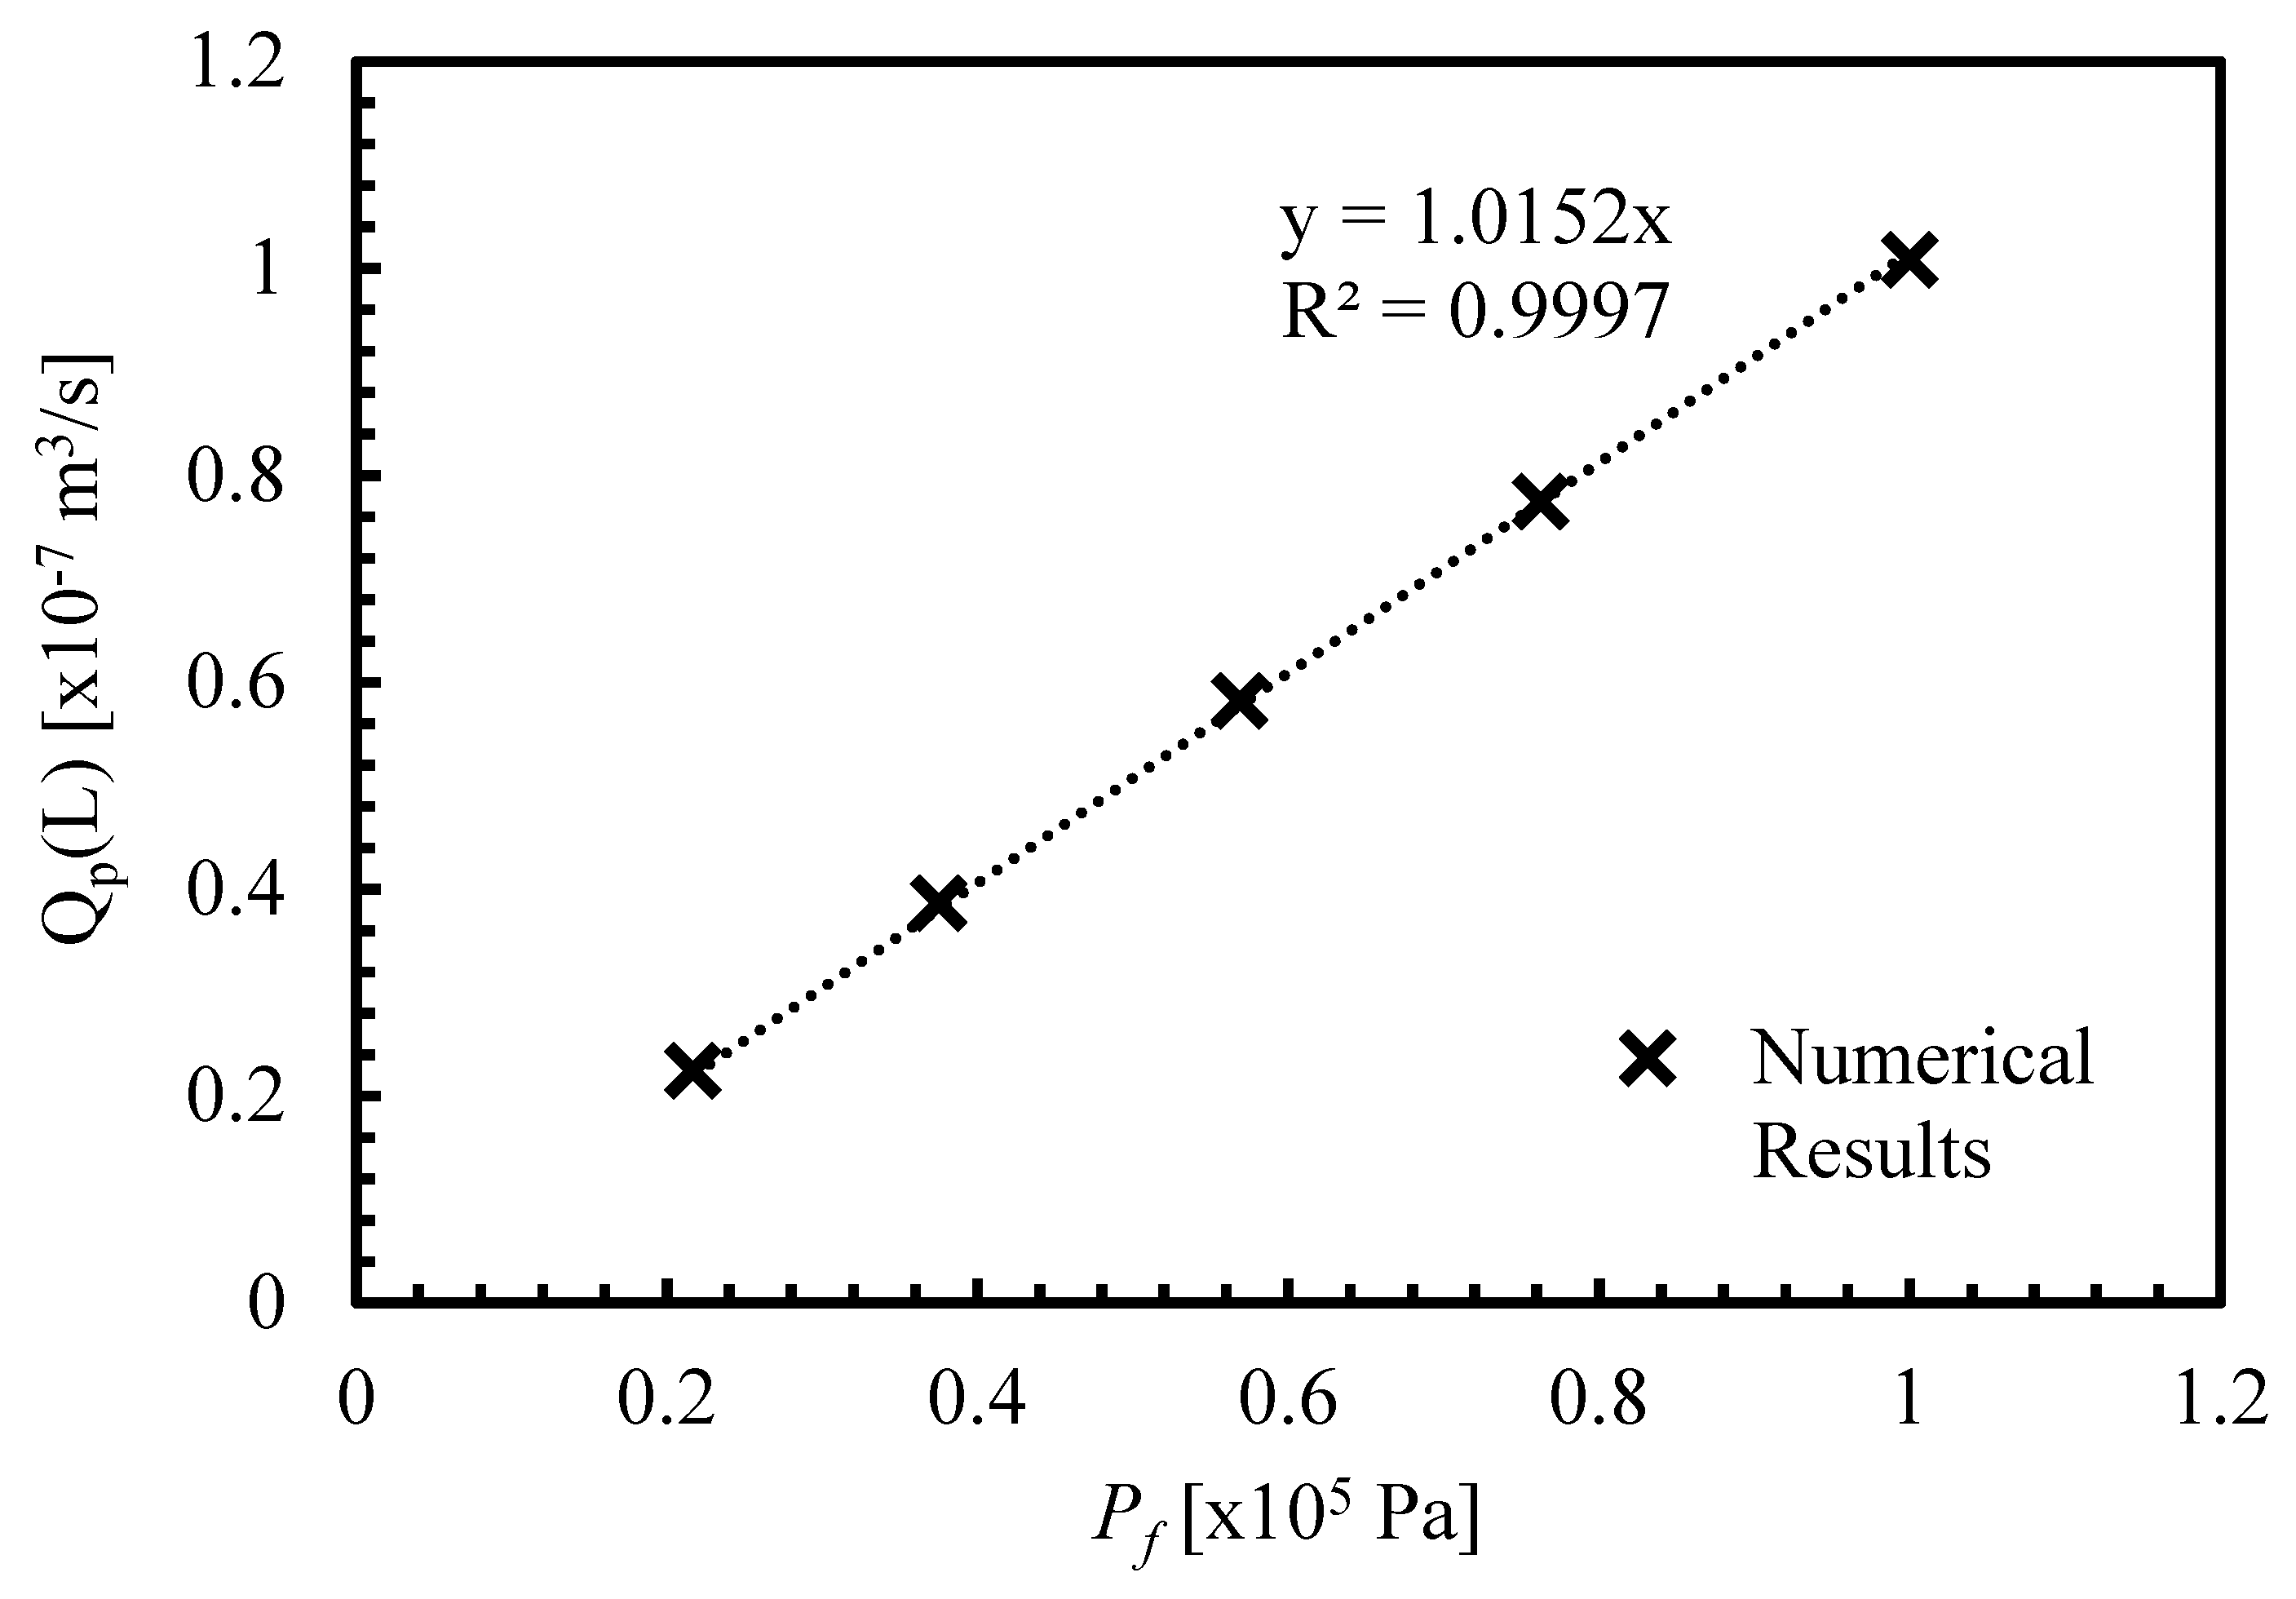
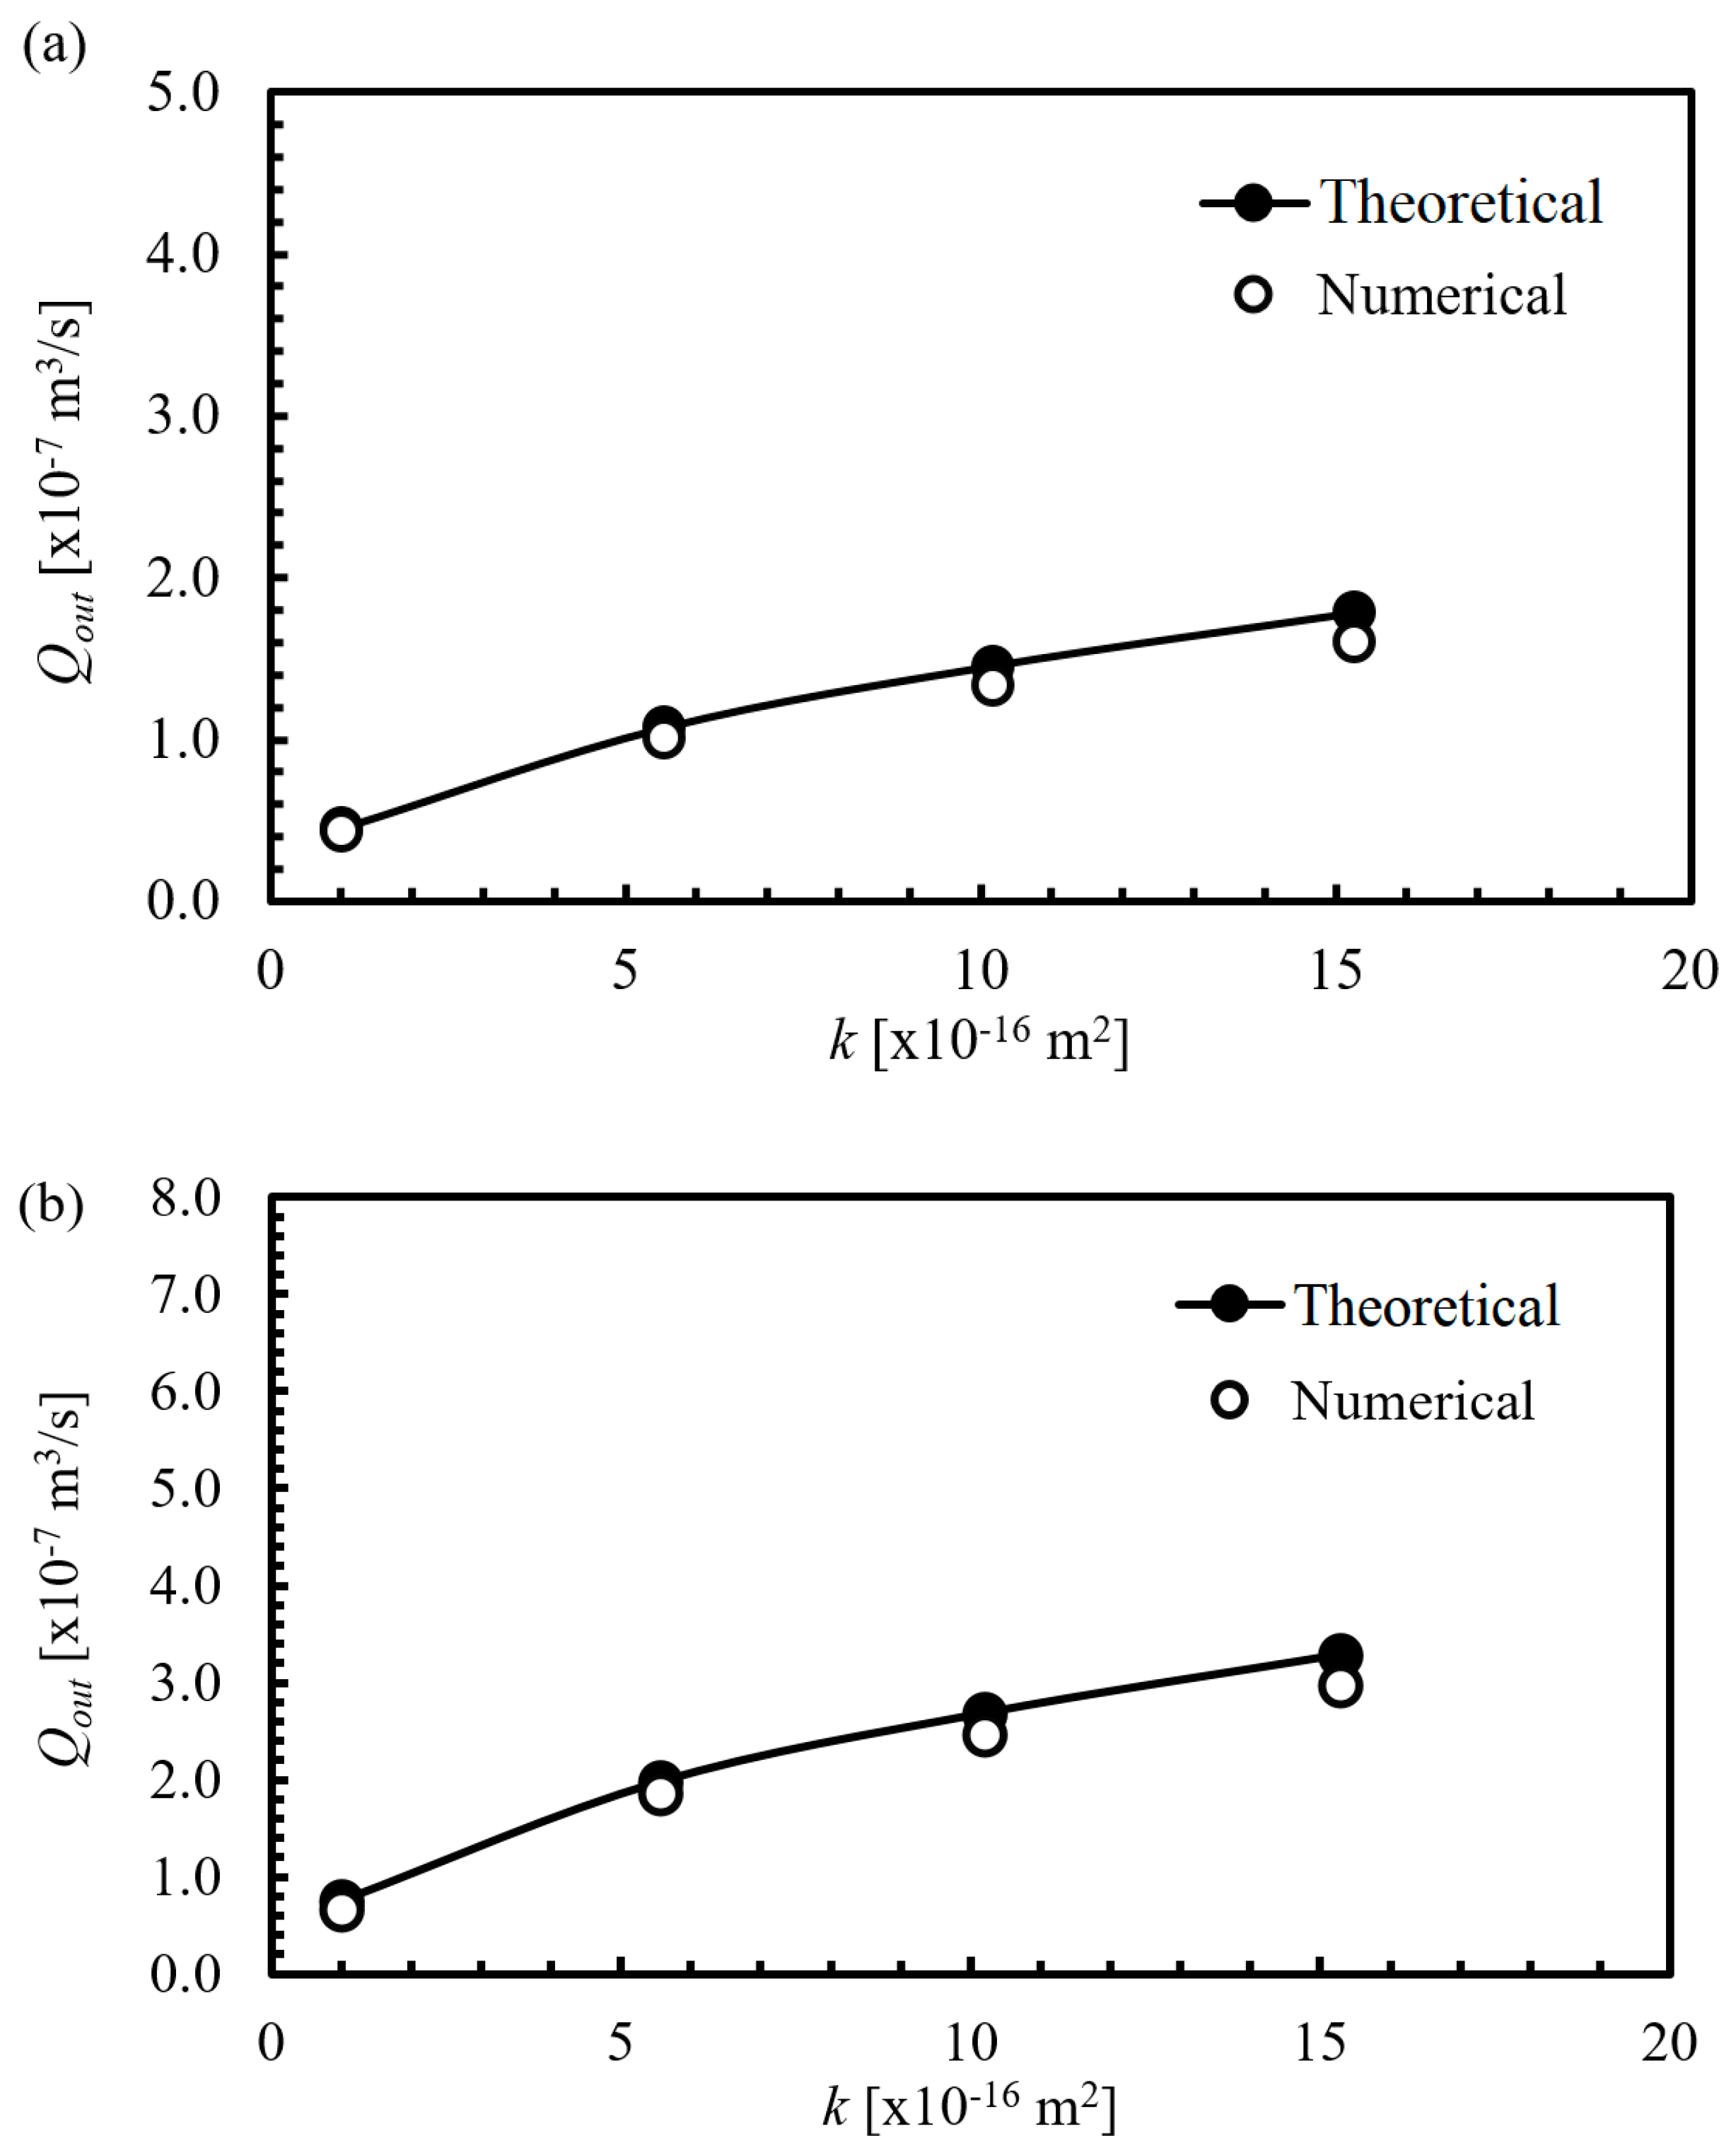
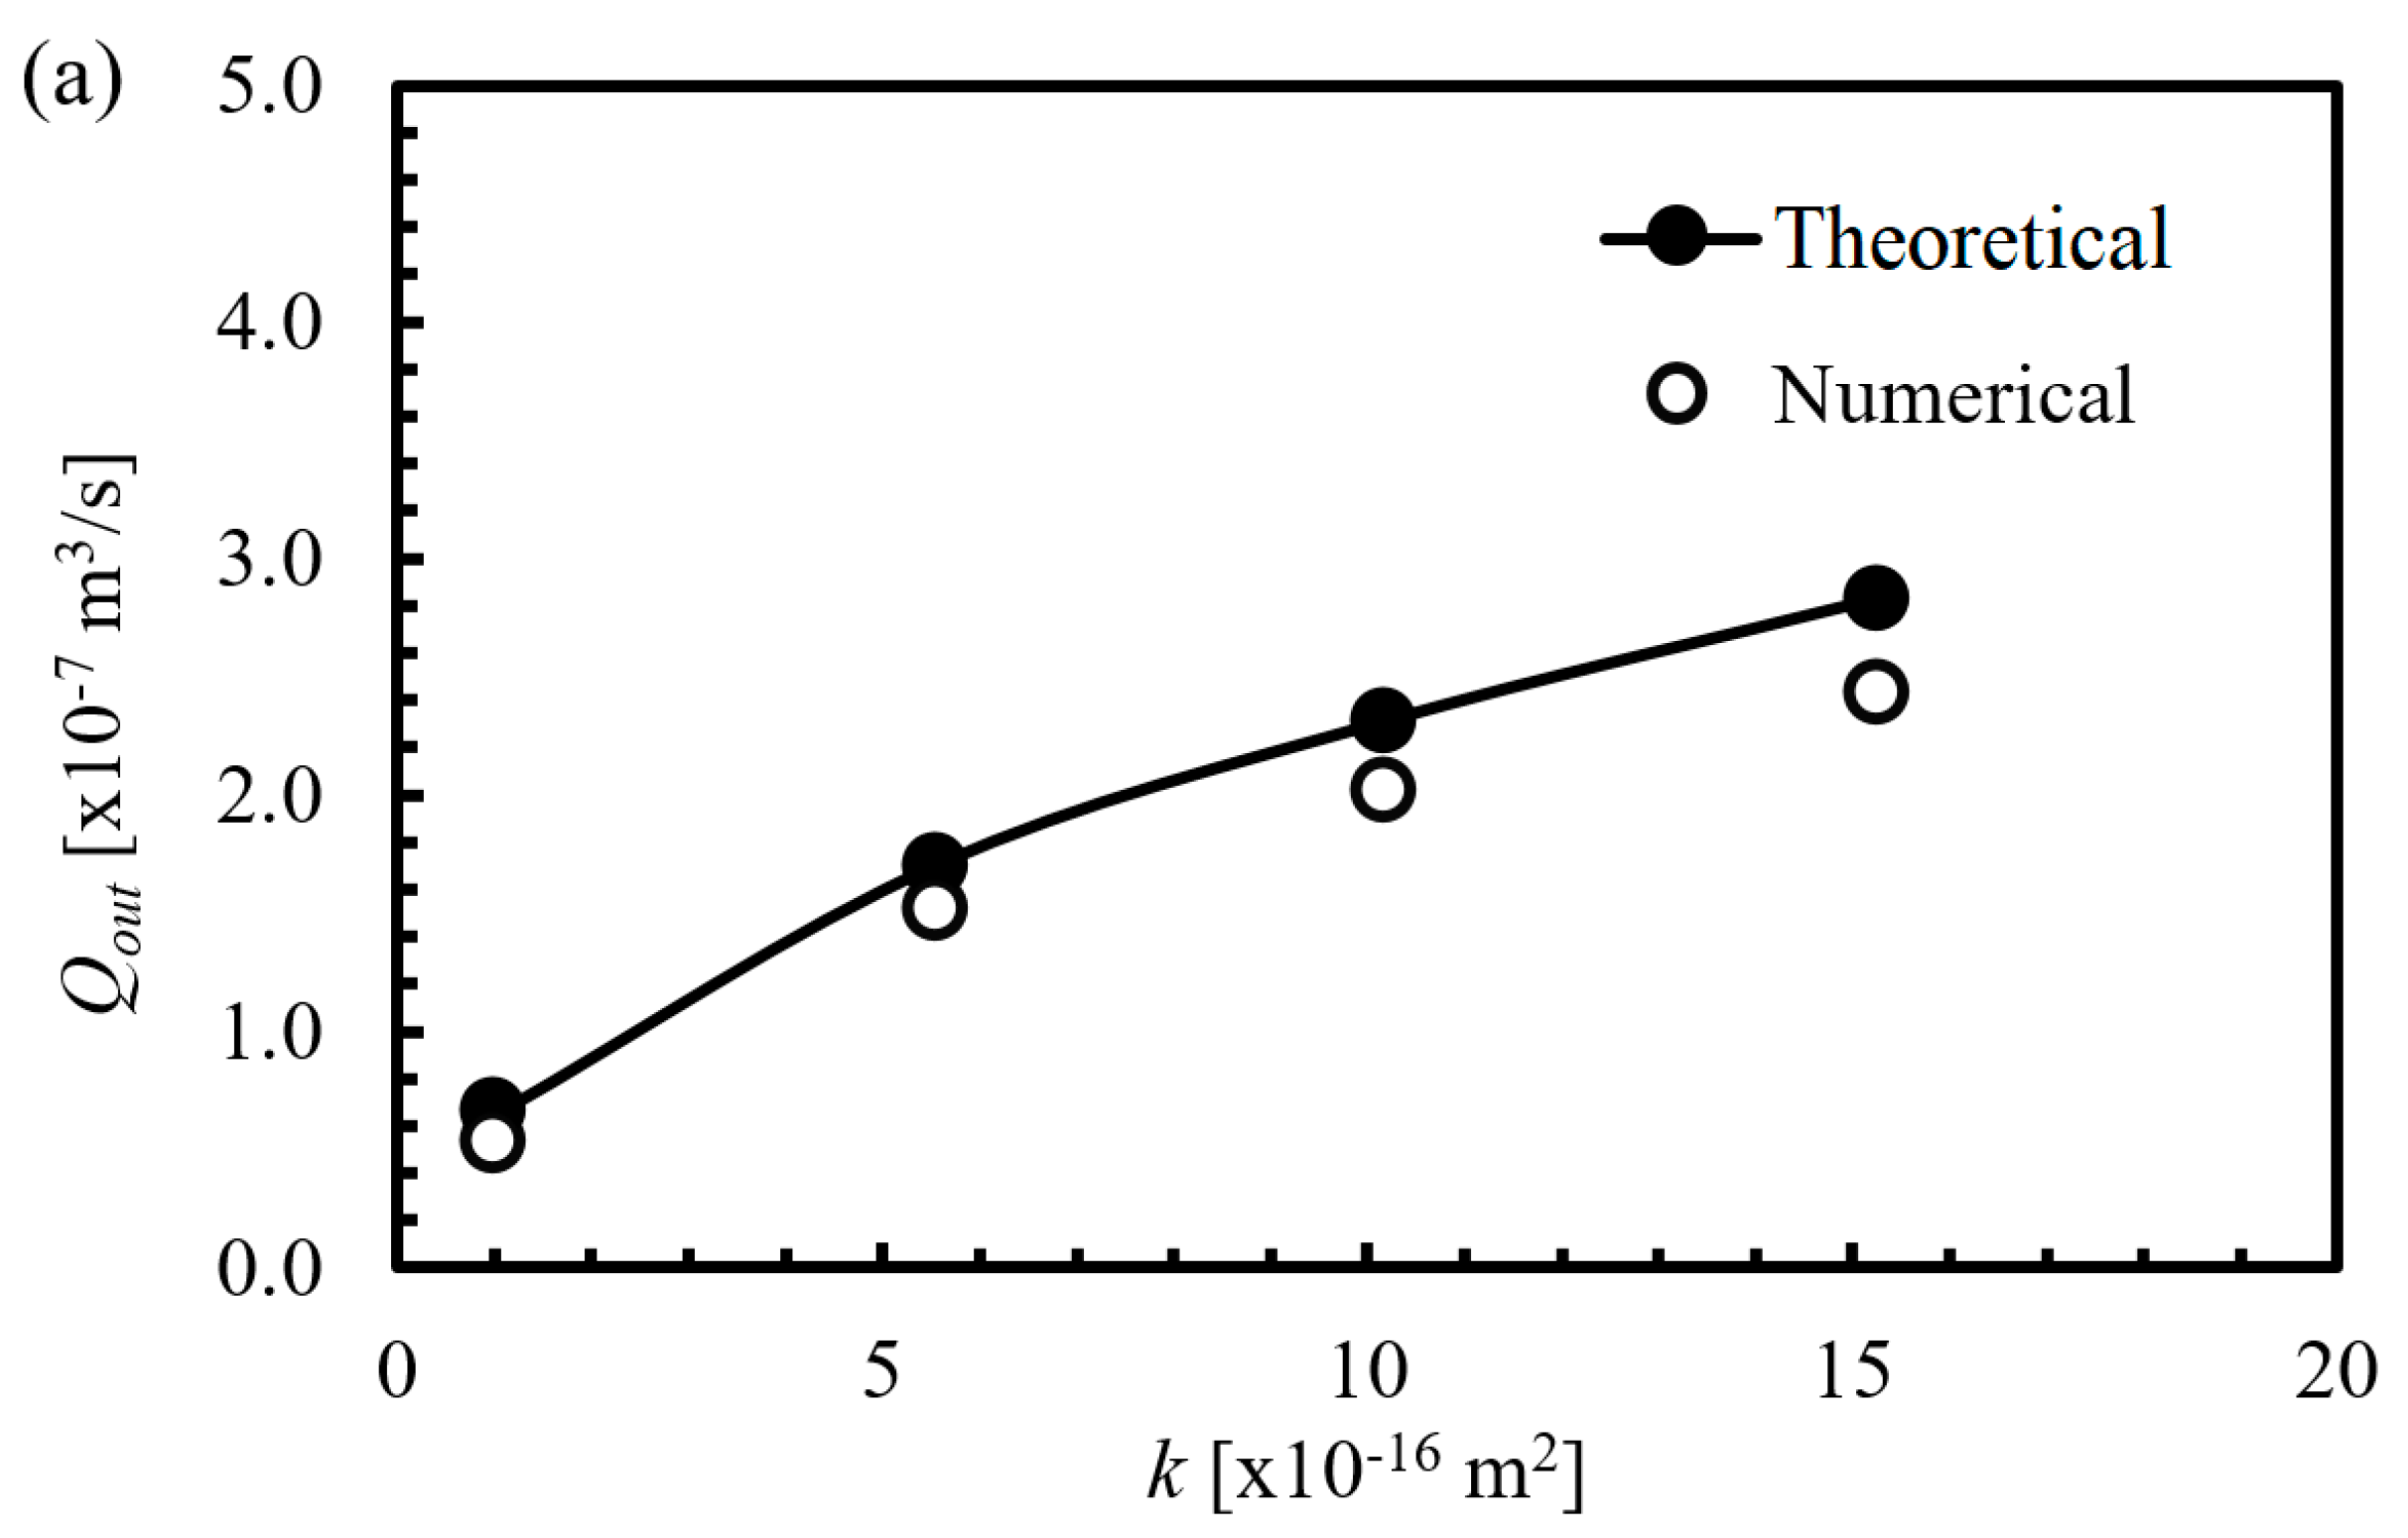
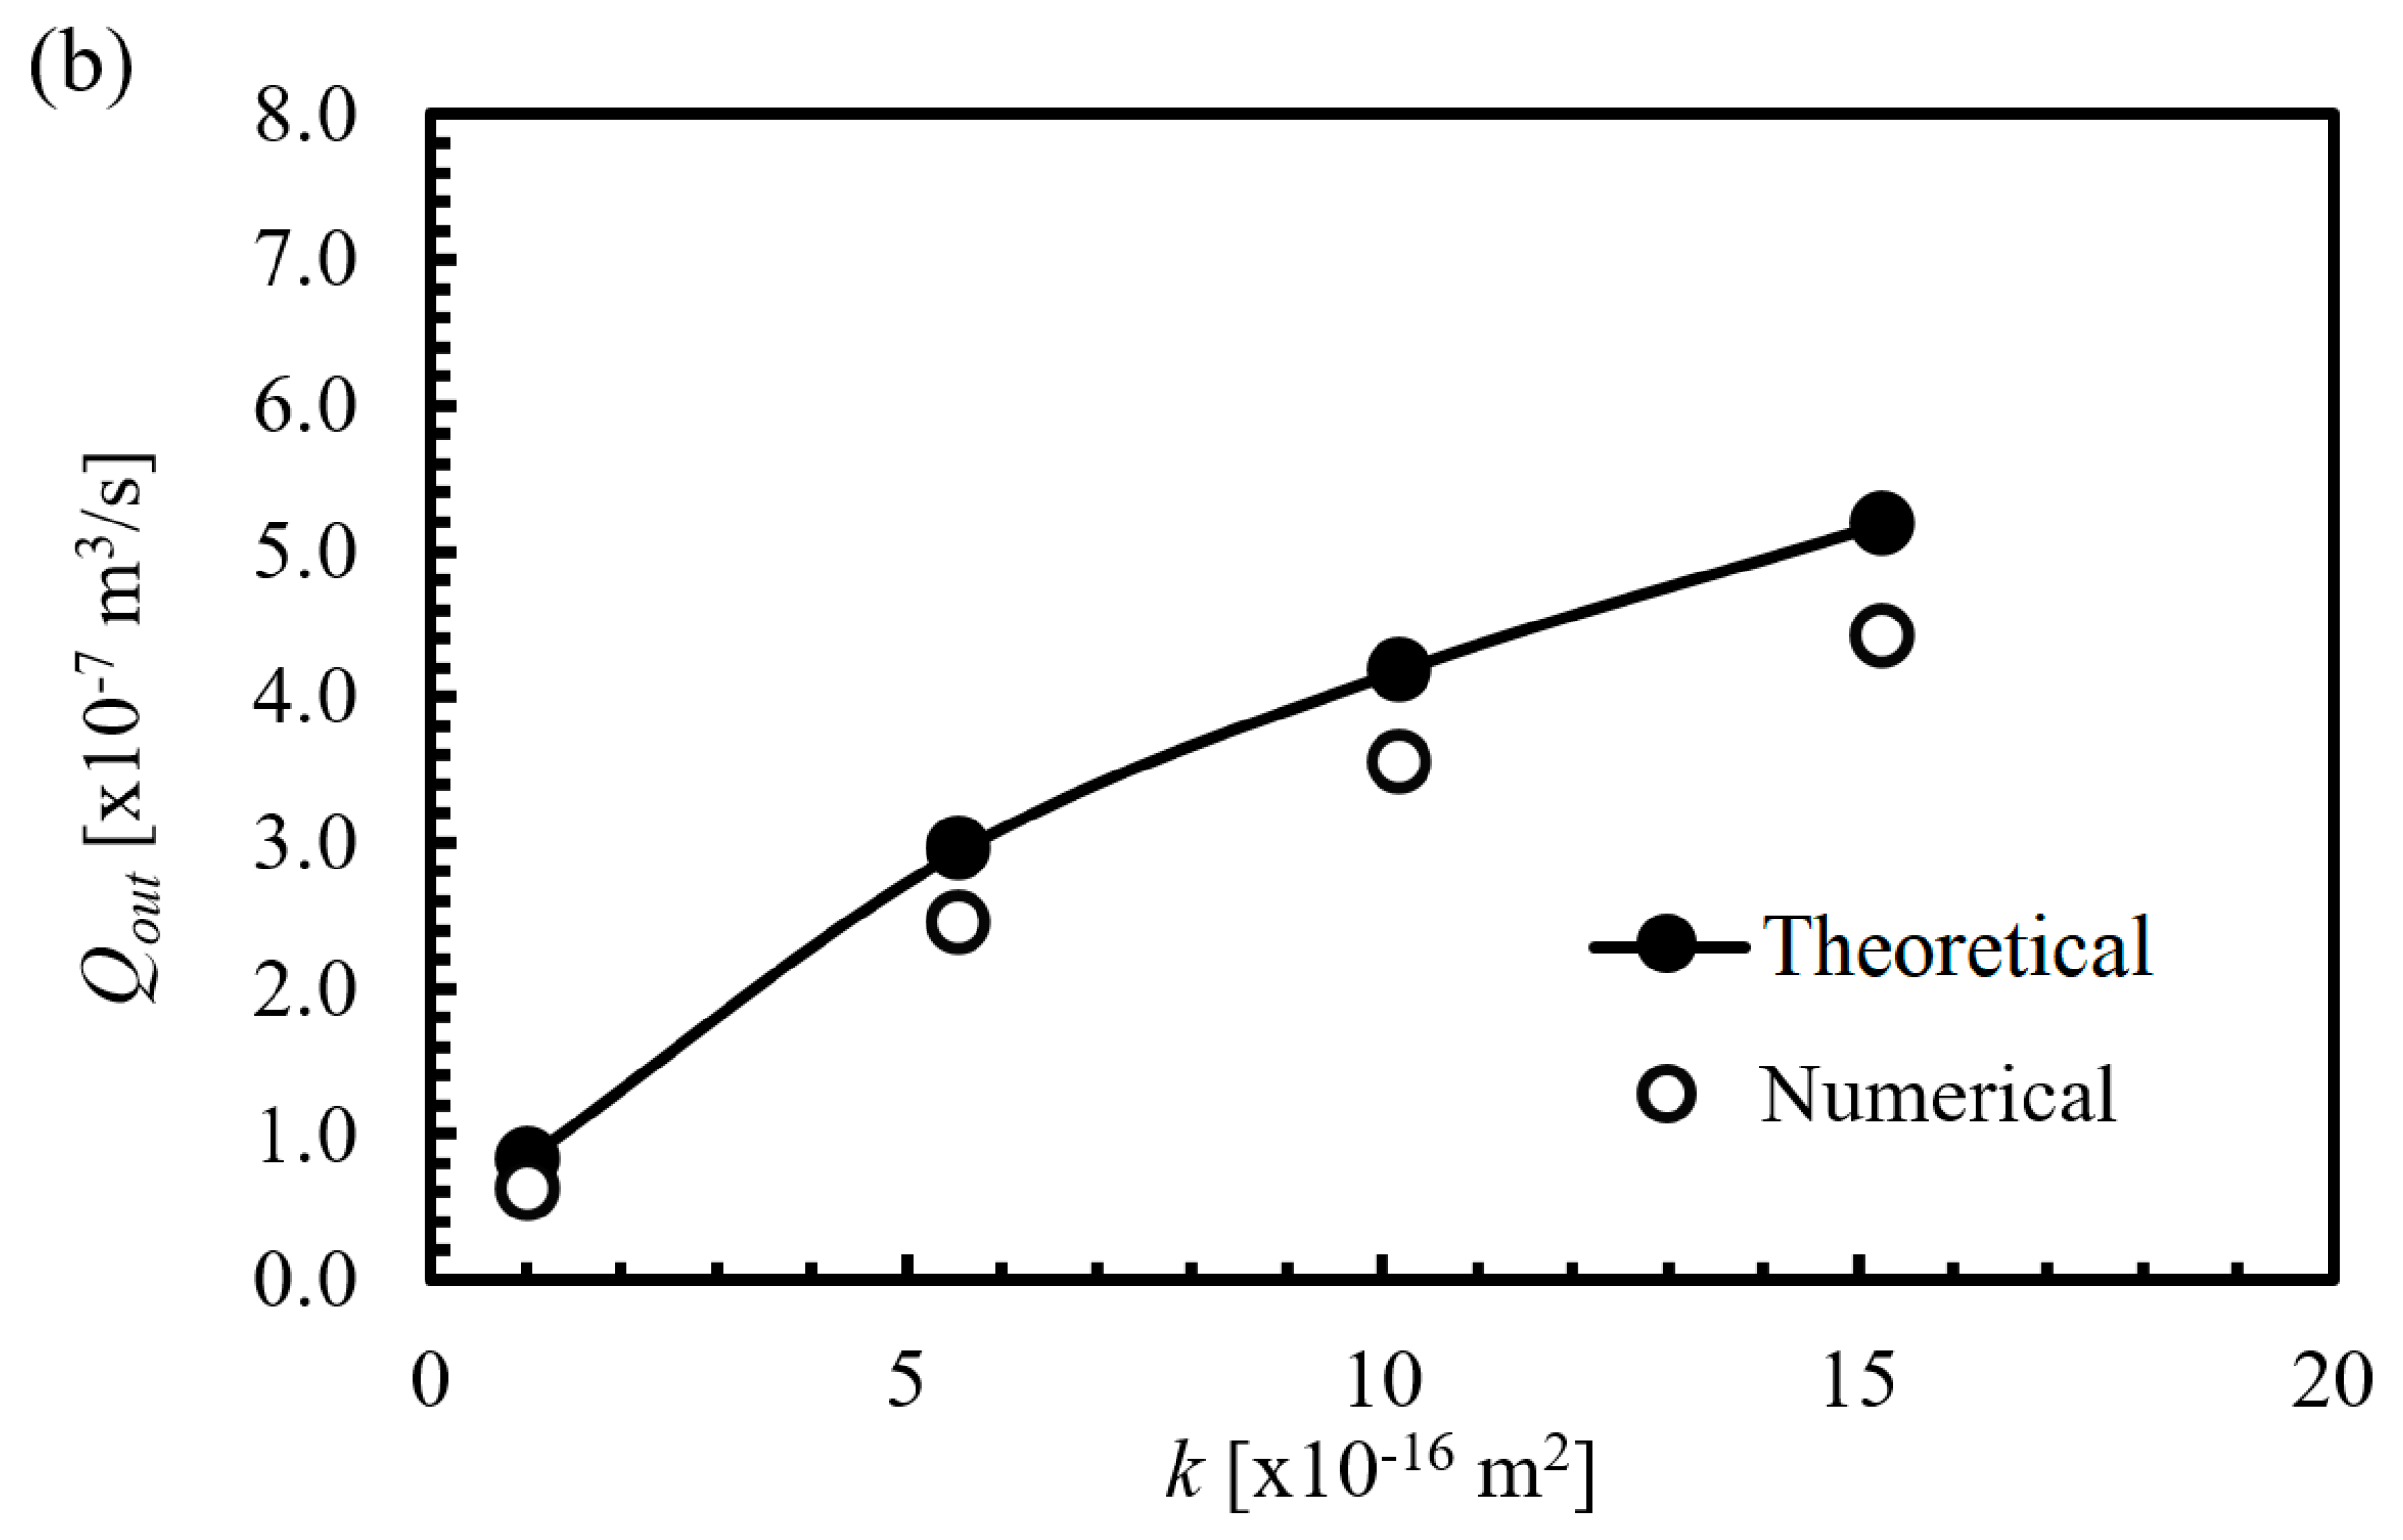
4.3. Comparison of Output Flowrate between Theoretical and Numerical Results

Numerical simulations were performed using the models and setup presented in Section 2.2. In order to evaluate the reliability of the numerical results obtained, the permeate output flow rate, Qout, obtained from simulation was compared against the flow rate calculated using equations presented in Section 4.2, as shown in Figure 12 and Figure 13. The comparisons were made based on fibre with 0.3 mm inner diameter and 0.1 mm membrane thickness, and fibre with 0.4 mm inner diameter and 0.2 mm membrane thickness for Figure 12 and Figure 13, respectively. Both figures show similar increasing trends in permeate output flow rate against membrane permeability between the numerical result and the theoretical calculations. However, the Qout value predicted numerically for each membrane permeability k used was about 15% lower than the value obtained through theoretical calculation. As the numerical model is able to account for the larger surface area on the fibre exterior, the CFD simulations accounted for higher flow into the membrane wall, resulting in higher output. Though numerical results were marginally higher, the numerical models are still useful in providing insight into the permeate pressure profile within the fibre lumen, which cannot be extracted through experimental means. Hence, the numerical results are still reliable for use in analysing the effects on permeate pressure.

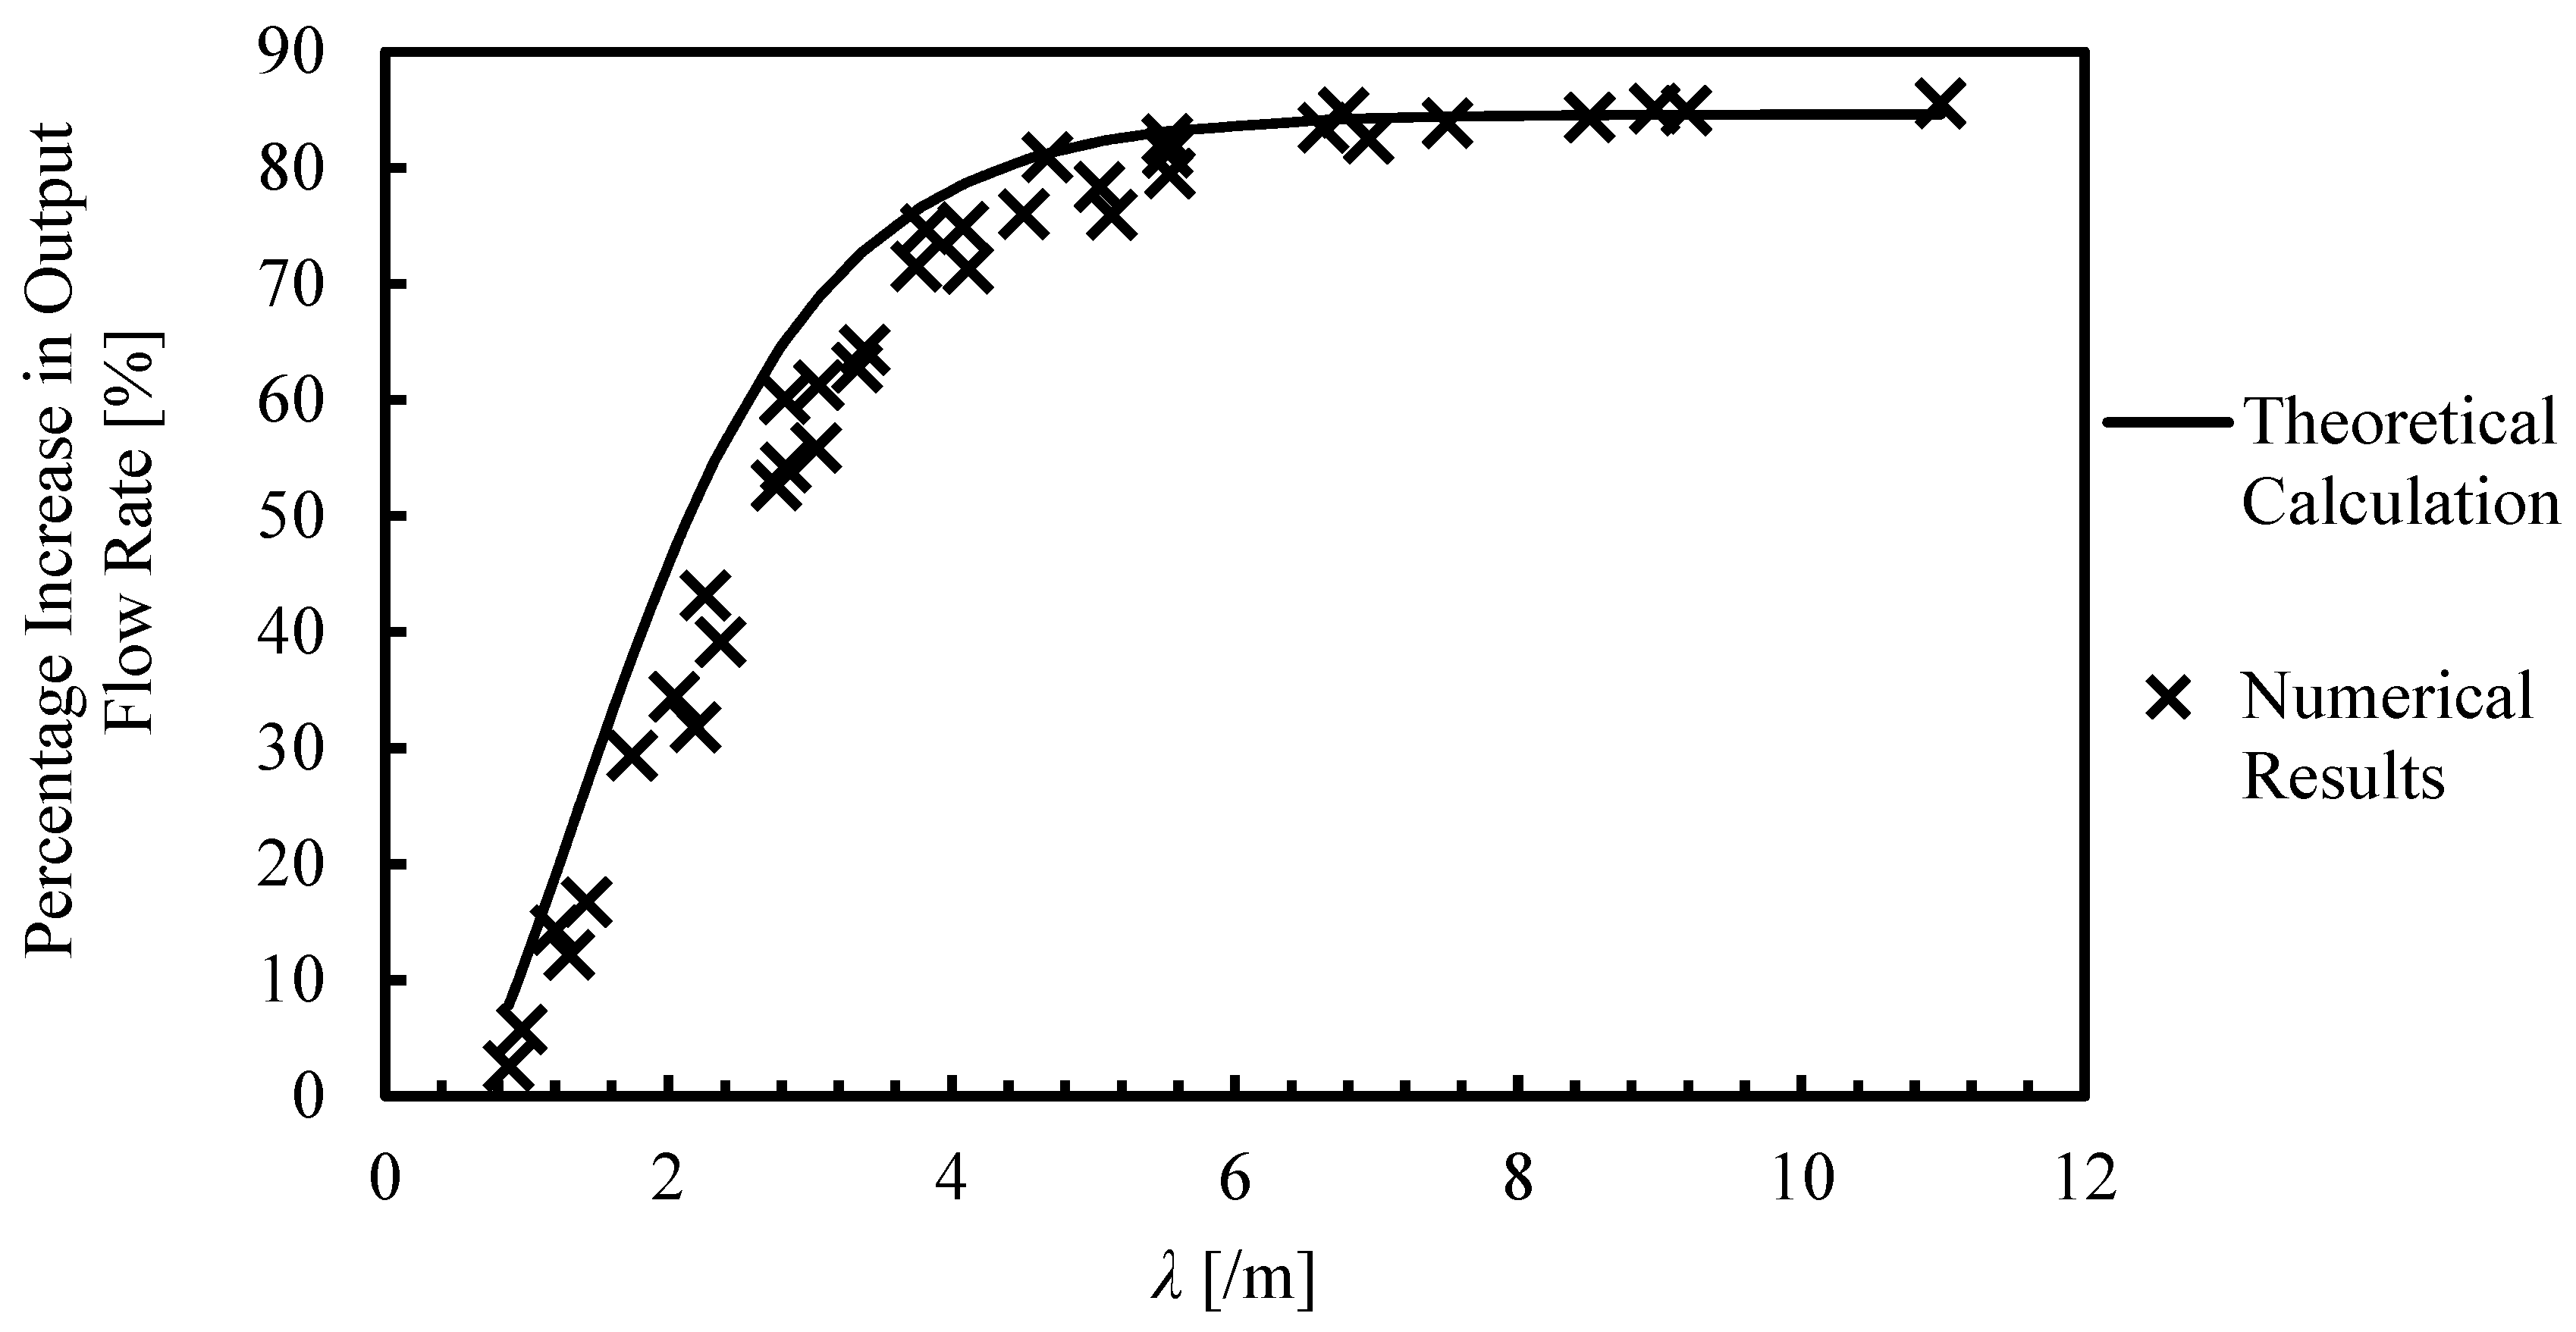
4.4. Correlation between λ and the Increase in Permeate Output Flow Rate Due to Change in Configurations

As established in Section 4.2, a possible correlation is found between λ, which is characteristic of a fibre’s geometry, and the increase in output flow rate by adopting double-end suction. The correlation let to the belief that λ could be useful in predicting the suitability of double-end suction.
From all 36 numerical cases, the output flow rates at the fibre exit were compared against their corresponding λ values. This resulted in a graph that aids in evaluating the effectiveness of double-end suction for the fibre design of choice. This is possible by predicting the percentage increase in output flow rate based on the calculated λ value. Results obtained show a general upwards trend in percentage increment of output flow rate as λ increases (Figure 14). A linear increment is observed at the beginning, for fibres with λ lower than 3 m−1. However, as λ increases beyond this value, the percentage increment starts to diminish, ultimately becoming constant at around 80% to 85%. A constant percentage increment of around 85% is observed in fibres with λ value higher than 6/m.
Figure 14 also compares the results obtained both from theoretical derivations presented in Section 4.2 and numerical simulation. As shown, both results have similar trends, and the percentage increment obtained from CFD closely follows the results obtained from theoretical calculations. The average error was found to be 5.1%, with maximum error found to be 10.9% in one of the cases.
The correlations made above can be useful in aiding the design process of a submerged hollow fibre membrane system. Based on choice of fibres, the suitability of using double-end suction in terms of tangible increase in output flow rate can be predicted. This can also prove useful in instances of retrofitting older submerged hollow fibre membrane system, as the option of double-end suction provides performance improvement without the need of additional space.

4.5. Correlation between λ and Permeate Pressure Profile

During filtration, driving forces within fibres are used in two main processes: (1) transportation of water through the membrane wall and (2) transportation of water within the lumen channel. The difference in fibre geometry impacts the proportion of TMP and permeate pressure acting on a fibre. Fibres which have larger inner diameter, thicker membrane, and lower membrane permeability are observed to have lower permeate pressure. Figure 15 shows the permeate pressure profile corresponding to a fibre of 0.5 mm inner diameter, 0.3 mm membrane thickness, and membrane permeability of 100 LMH/bar. Since this fibre has the largest inner diameter, thickest membrane, and lowest permeability of all cases studied, it has the lowest permeate pressure of all the fibres modelled. The corresponding λ value is 0.87 m−1, the lowest of all fibres modelled. A comparison of output flowrate increase from single-end to double-end suction showed minimal reduction in permeate pressure, and, subsequently, an increase in output flow rate of less than 3%.
By reducing inner diameter and membrane thickness, and increasing membrane permeability, a larger permeate pressure is required to transport water through the lumen, due to a narrower lumen channel and more water passing through the membrane. With inner diameter reduced to 0.4 mm and permeability increased to 550 LMH/bar, a higher permeate pressure profile can be observed in Figure 16. This combination of parameters translated to a λ value of 3.04 m−1. Comparing the same fibre in single-end and double-end suction, the reduction in permeate pressure is significantly higher, as shown in Figure 16. This led to an increase in output flow rate by 55.8%.
On the other side of the spectrum, Figure 17 shows the permeate pressure profile of a fibre with the lowest inner diameter (0.3 mm), lowest membrane thickness (0.1 mm), and highest membrane permeability (1500 LMH/bar), resulting in the highest λ value in this study of 10.98 m−1. As shown, a large segment of the fibre is observed to have very low TMP, since, in that segment, the permeate pressure profile touches the feed pressure profile. This indicated the need for permeate pressure reduction. By switching to double-end suction, the resultant increase in output flow rate was the highest, at about 85%. However, even with double-end suction, there is still a small segment of fibre with low TMP. This shows that the approach of double-end suction alone is not enough for fibres with such a high λ value.
Based on the above, it is evident that the λ value is indicative of the permeate pressure profile and output increase expected when adopting double-end suction. λ, which is characteristic of the fibre geometry, is found to have a positive correlation with permeate pressure. This is because membrane permeability and wall thickness directly impact the influx of water going through the membrane wall [18], since the pressure difference required is a direct function of the volumetric flow rate within the lumen. The same can be said concerning the membrane inner diameter, as a larger diameter will reduce the pressure difference required [18]. With higher permeate pressure, fibres with higher λ values experience a greater permeate pressure drop in double-end suction. This, in turn, leads to a higher output flow rate increase.

5. Conclusions

To determine how fibre geometry affects the effectiveness of using double-end suction instead of single-end suction, submerged hollow fibres with different combinations of membrane permeability, wall thickness, and inner diameter were numerically simulated in both single-end bottom suction and double-end suction configurations. The resultant permeate flow rates from both configurations were compared to find the potential increase due to the switch from single-end to double-end suction.
At the same time, analytical solutions to calculate the output flow rate from both the single-end bottom suction and double-end suction were derived based on a model presented by Chang et al. [6]. By comparing the equations describing output flow rate from both single-end and double-end fibres, λ, which was previously linked to uniformity of flux profile, was determined to be a crucial factor in determining the percentage increase in output flow rate. λ, which is unique to a fibre’s geometry, is dependent on membrane permeability, k; wall thickness, t; and inner diameter, di.
The numerical solution obtained closely followed what was obtained from theoretical calculations. Based on the results, we conclude that the increase in output flowrate resulting from using double-end suction is dependent on the permeate pressure profile, which is influenced by inner diameter, membrane thickness, and membrane permeability. Based on the theoretical model presented, λ can be used as a quantifiable indicator in evaluating a fibre’s suitability for adopting double-end suction based on the fibre’s design. A low λ value indicates a small portion of total pressure difference being used to drive water through the fibre lumen while a high λ value indicates that most of the pressure difference is used to drive water through the fibre lumen. As such, it is recommended that submerged fibres with high λ values be converted to the double-end suction configuration.

Acknowledgments

The authors acknowledge Technology, Innovation and Enterprise (T.I.E), Singapore Institute of Technology for their support and funding (Technology, Innovation and Enterprise Innovation Grant 2016) for this research project.

Author Contributions

Keng Boon Lim was mainly responsible for paper writing and data analyzing; Hui An and Peng Cheng Wang were mainly responsible for research direction, methodology and data analyzing; Guiqin Liu and Simon Ching Man Yu provided research ideas and modified the article.

Conflicts of Interest

The authors declare no conflict of interest.

Nomenclature

diInternal diameter of fibre (m)
deExternal diameter of fibre (m)
doOuter boundary diameter of fluid envelope (m)
xAxial position along membrane length (m)
LLength of fibre (m)
L1Length of top portion of double-end fibre in which water flows towards the top exit (m)
L2Length of bottom portion of double-end fibre in which water flows towards the bottom exit (m)
v Fluid velocity (m/s)
PPressure (Pa)
PsSuction pressure (Pa)
μDynamic viscosity of water (Pa∙s)
kMembrane permeability (m2)
tMembrane thickness (m)
λValue characterised by membrane geometry (/m) [6,9]
pf(x)Pressure at feed region (Pa)
pp(x)Pressure at permeate region (Pa)
Qf(x)Flowrate of feed through membrane wall at axial position x (m3/s)
Qp(x)Flowrate of permeate along inner channel at axial position x (m3/s)
QoutPermeate flowrate at outlet (m3/s)

References

  1. Fane, A.G.; Chang, S.; Chardon, E. Submerged Hollow Fibre Membrane Module—Design Options and Operational Considerations. Desalination 2002, 146, 231–236. [Google Scholar] [CrossRef]
  2. Doshi, M.R.; Gill, W.N.; Kabadi, V.N. Optimal Design of Hollow Fiber Modules. AlChE J. 1997, 23, 765–767. [Google Scholar] [CrossRef]
  3. Soltanieh, M.; Gill, W.N. A Note on the Effect of Fibre Length on the Productivity of Hollow Fibre Modules. Chem. Eng. Commun. 1983, 22, 109. [Google Scholar] [CrossRef]
  4. Li, X.; Li, J.; Wang, J.; Wang, H.; He, B.; Zhang, H.; Guo, W.; Ngo, H.H. Experimental Investigation of Local Flux Distribution and Fouling Behavior in Double-end and Dead-end Submerged Hollow Fiber Membrane Modules. J. Membr. Sci. 2014, 453, 18–26. [Google Scholar] [CrossRef]
  5. Carroll, T.; Booker, N.A. Axial Features in the Fouling of Hollow Fibre Membranes. J. Membr. Sci. 2000, 168, 203–212. [Google Scholar] [CrossRef]
  6. Chang, S.; Fane, A.G.; Waite, T.D. Analysis of Constant Permeate Flow Filtration Using Dead-end Hollow Fibre Membranes. J. Membr. Sci. 2006, 286, 132–141. [Google Scholar] [CrossRef]
  7. Carroll, T. The Effect of Cake and Fibre Properties on Flux Declines in Hollow-fibre Microfiltration Membranes. J. Membr. Sci. 2001, 189, 167–178. [Google Scholar] [CrossRef]
  8. Serra, C.; Clifton, M.J.; Moulin, P.; Rouch, J.-C.; Aptel, P. Dead-end Ultrafiltration in Hollow Fibre Modules: Module Design and Process Simulation. J. Membr. Sci. 1998, 145, 159–172. [Google Scholar] [CrossRef]
  9. Popovic´, S.; Dittrich, M.; Cakl, J. Modelling of Fouling of Outside-in Hollow-fiber Membranes by TiO2 Particles. Sep. Purif. Technol. 2015, 156, 28–35. [Google Scholar] [CrossRef]
  10. Chang, S. Application of Submerged Hollow Fibre Membrane in Membrane Bioreactors: Filtration Principles, Operation, and Membrane Fouling. Desalination 2011, 283, 31–39. [Google Scholar] [CrossRef]
  11. Chang, S.; Fane, A.G. The Effect of Fibre Diameter on Filtration and Flux Distribution—Relevance to Submerged Hollow Fibre Module. J. Membr. Sci. 2001, 184, 221–231. [Google Scholar] [CrossRef]
  12. Günther, J.; Schmitz, P.; Albasi, C.; Lafforgue, C. A Numerical Approach to Study the Impact of Packing Density on Fluid Flow Distribution in Hollow Fibre Module. J. Membr. Sci. 2010, 348, 277–286. [Google Scholar] [CrossRef] [Green Version]
  13. Zhuang, L.W.; Guo, H.F.; Wang, P.H.; Dai, G. Study on the Flux Distribution in a Dead-end Outside-in Hollow Fibre Membrane Module. J. Membr. Sci. 2015, 495, 372–383. [Google Scholar] [CrossRef]
  14. Wang, Y.; Brannock, M.; Cox, S.; Leslie, G. CFD Simulations of Membrane Filtration Zone in a Submerged Hollow Fibre Membrane Bioreactor Using a Porous Media Approach. J. Memb. Sci. 2010, 363, 57–66. [Google Scholar] [CrossRef]
  15. Vinther, F.; Pinelo, M.; Brøns, M.; Jonsson, G.; Meyer, A.S. Mathematical Modelling of Dextran Filtration through Hollow Fibre Membranes. Sep. Purif. Technol. 2014, 125, 21–36. [Google Scholar] [CrossRef]
  16. Happel, J. Viscous Flow Relative to Arrays of Cylinders. AlChE J. 1959, 5, 174–177. [Google Scholar] [CrossRef]
  17. Lim, K.B.; Wang, P.C.; An, H.; Yu, S.C.M. Computational Studies for the Design Parameters of Hollow Fibre Membrane Modules. J. Membr. Sci. 2017, 529, 263–273. [Google Scholar] [CrossRef]
  18. Filloux, E.; Teychene, B.; Tazi-Pain, A.; Croue, J.P. Ultrafiltration of Biologically Treated Domestic Wastewater: How Membrane Properties Influence Performance. Sep. Purif. Technol. 2014, 134, 178–186. [Google Scholar] [CrossRef]
Figure 1. Simplified illustration of fibre layout within housing (single-end configuration). Arrows indicate flow of water within system.
Energies 11 01042 g001
Figure 2. Simplified illustration of fibre layout within housing (double-end configuration). Arrows indicate flow of water within system.
Energies 11 01042 g002
Figure 3. Illustration of 3-dimensional hollow fibre model to be used in numerical domain.
Energies 11 01042 g003
Figure 4. Comparison of flow rate at permeate outlet, of all 5 test cases with different element counts used in GIT.
Energies 11 01042 g004
Figure 5. Numerical results presenting permeate flow rate at different feed pressures.
Energies 11 01042 g005
Figure 6. Comparison of numerical results against experimental data on permeate flow rate of fibres with different length.
Energies 11 01042 g006
Figure 7. Relationship between fibre inner diameter and output flow rate for different membrane thickness and permeability. (a) Single-end suction; (b) Double-end suction; (c) Percentage increase.
Energies 11 01042 g007aEnergies 11 01042 g007b
Figure 8. Relationship between membrane thickness and output flow rate for different fibre inner diameter and membrane permeability. (a) Single-end suction; (b) Double-end suction; (c) Percentage increase.
Energies 11 01042 g008aEnergies 11 01042 g008b
Figure 9. Relationship between membrane permeability and output flow rate for different fibre inner diameter and membrane thickness. (a) Single-end suction; (b) Double-end suction; (c) Percentage increase.
Energies 11 01042 g009aEnergies 11 01042 g009b
Figure 10. Theoretical model of hollow fibre within submerged membrane systems arranged in single-end bottom suction configuration.
Energies 11 01042 g010
Figure 11. Theoretical model of hollow fibre within submerged membrane systems arranged in double-end suction configuration.
Energies 11 01042 g011
Figure 12. Comparison between the theoretical and numerical output flow rates for fibres with 0.3 mm inner diameter, 0.1 mm membrane thickness. (a) Single-end suction; (b) Double-end suction.
Energies 11 01042 g012
Figure 13. Comparison between the theoretical and numerical output flow rates for fibres with 0.4 mm inner diameter, 0.2 mm membrane thickness. (a) Single-end suction; (b) Double-end suction.
Energies 11 01042 g013aEnergies 11 01042 g013b
Figure 14. Correlation between λ and the percentage increase in permeate output flow rate.
Energies 11 01042 g014
Figure 15. Feed and permeate pressure distribution of fibre with 0.5 mm inner diameter, 0.3 membrane thickness, and membrane permeability of 1.01 × 10⁻¹⁶ m2 (100 LMH/bar), in single-end and double-end suction. λ value of this fibre was calculated to be 0.87 m−1.
Energies 11 01042 g015
Figure 16. Feed and permeate pressure distribution of fibre with 0.4 mm inner diameter, 0.3 membrane thickness, and membrane permeability of 5.56 × 10⁻¹⁶ m2 (550 LMH/bar), in single-end and double-end suction. λ value of this fibre was calculated to be 3.04 m−1.
Energies 11 01042 g016
Figure 17. Feed and permeate pressure distribution of fibre with 0.3 mm inner diameter, 0.1 membrane thickness, and membrane permeability of 1.53 × 10⁻¹⁵ m2 (1500 LMH/bar), in single-end and double-end suction. λ value of this fibre was calculated to be 10.98 m−1.
Energies 11 01042 g017
Table 1. Node distribution of each Grid Independence Test (GIT) test case.
MeshNode DistributionMesh ResolutionElement Count
Axial Fibre LengthRadial PermeateRadial MembraneRadial Feed
125003342500 × 1025,000
250005585000 × 1890,000
375005587500 × 18135,000
410,00075810,000 × 20200,000
520,00014101620,000 × 40800,000

