1. Introduction
With the sustained growth of the global population and the continuous development of the world’s economy, energy shortages and environmental pollution have become two major problems to be solved [
1,
2]. Under this double pressure, the development and utilization of renewable clean energy has become a focus for various countries.
Among all kinds of renewable clean energy, wind energy and solar energy have developed rapidly, and power generation technology has also matured; however, owing to its being greatly influenced by meteorological and environmental factors, wind power and solar power cannot be accurately predicted, and mass storage and random scheduling cause wind power and photovoltaic power generation difficulties in maintaining stable output [
3]. It will bring great pressure on the safe and stable operation of the power system, and directly affect the power quality of the local power grid [
4]. To improve the quality of wind power and photovoltaic power generation, and to increase its power generation efficiency, it is necessary to seek a compensatory measure to adjust the connected power system, such as use of a combination with more dispatchable and flexible resources [
5,
6,
7].
Since at least 1981, research into complementarity between wind power and photovoltaic power generation has been conducted [
8]. More and more studies on renewable clean energy point out that the combination of wind energy and solar energy can improve the reliability and predictability of power production [
9,
10,
11,
12,
13,
14]. There are basically two types of such studies: non-grid-connected and grid-connected. The former studies tend to focus more on the minimization of system cost, while the latter tend to choose dimensionless parameters to avoid technical or economic choices [
15].
Existing studies [
10,
11,
12,
13,
14,
16,
17,
18,
19,
20,
21,
22,
23,
24] focus on the optimization of renewable energy hybrid systems. For a hybrid system based on renewable energy, studying the feasibility of its technology and economy must be within the potential areas of wind and solar energy resources [
21,
22]. Climate parameters such as solar radiation, wind speed, and temperature at the area of interest are important for efficient use of renewable energy sources [
23]. A techno-economic analysis [
11] based on 8-year-long measured hourly weather data for optimization purposes of autonomous small-scale photovoltaic-wind hybrid energy systems has been conducted. Eight years of meteorological data has been applied to a selected wind turbine and solar photovoltaic array and compared a grid-connected photovoltaic and wind hybrid at three locations [
12]. Others [
13,
14] analyzed the complementarities of solar and wind resources at different times and concluded that it is more effective to use a hybrid power generation system than a single photovoltaic power generation system or a wind power generation system. Sinha et al. analyzed solar and wind energy resources in their study area to determine the micro-wind photovoltaic hybrid system by various data including National Aeronautics and Space Administration (NASA) data, Artificial Neural Network (ANN) predictive data, Hamirpur measured data and estimated miscellaneous data of 11 locations in Himachal Pradesh [
24].
About 1.3 billion people around the world live in remote rural areas, and governments often fail to provide basic energy facilities to these sparsely populated areas [
25]; because of geographical conditions, pumped storage power plants can play a significant role in complementary hybrid systems [
26]. Researches have focused on energy systems in islands, mountains, and remote areas to seek energetic self-sufficient solutions [
27,
28,
29,
30,
31,
32]. For example, a wind-pumped storage complementary system meeting regional electricity demand was proposed based on the wind and hydrological characteristics across six regions in Turkey. The system simulation results show that the energy demand in the Marmara region can be enhanced through the wind-pumped storage complementary system effectively at reasonable energy cost [
29]. There is also a hybrid system with PV units, wind units, pumped storage systems, and diesel generators. The author developed a model to find the optimal daily operation schedule to minimize the use of diesel generators and reduce operating costs. Meanwhile pumped storage plants increase the amount of electricity generated by renewable energy sources and increase the participation of photovoltaic and wind energy systems in the electricity market [
31]. In another article by the author [
32], the author simulated by use of two different types of loads in rural South Africa to demonstrate that a pumped-storage hydroelectric system is a cost-effective, reliable, and environmentally friendly solution that can be used both remotely, and in isolated communities, to achieve 100% energy independence.
Another form of energy complementarity is the utilization of the water resource through a hydropower station. An index is presented to provide a new method with which to characterize the output fluctuations of a hydro-wind system [
33]. Ram Prabhakar and Ragavan discussed the power management strategies around battery-assisted wind-PV-hydro hybrid systems [
34]. A wind-photovoltaic-hydro hybrid system was proposed that provides uninterrupted electricity to a village in Ethiopia. HOMER (HOMER Energy, Boulder, CO, USA) was used to optimize six small hydro-schemes with wind and PV systems [
35].
All in all, from the current resource situation and technology development level, complementary power generation using the combination of water energy, wind energy and solar energy could be more efficient and environmentally safe. Almost all publications have different applications and focal points, but the common ground lies in their small-scale, off-grid or micro-grid operation, does not involve research into large-scale wind-photovoltaic-hydro complementary operation which is still a relatively new study area.
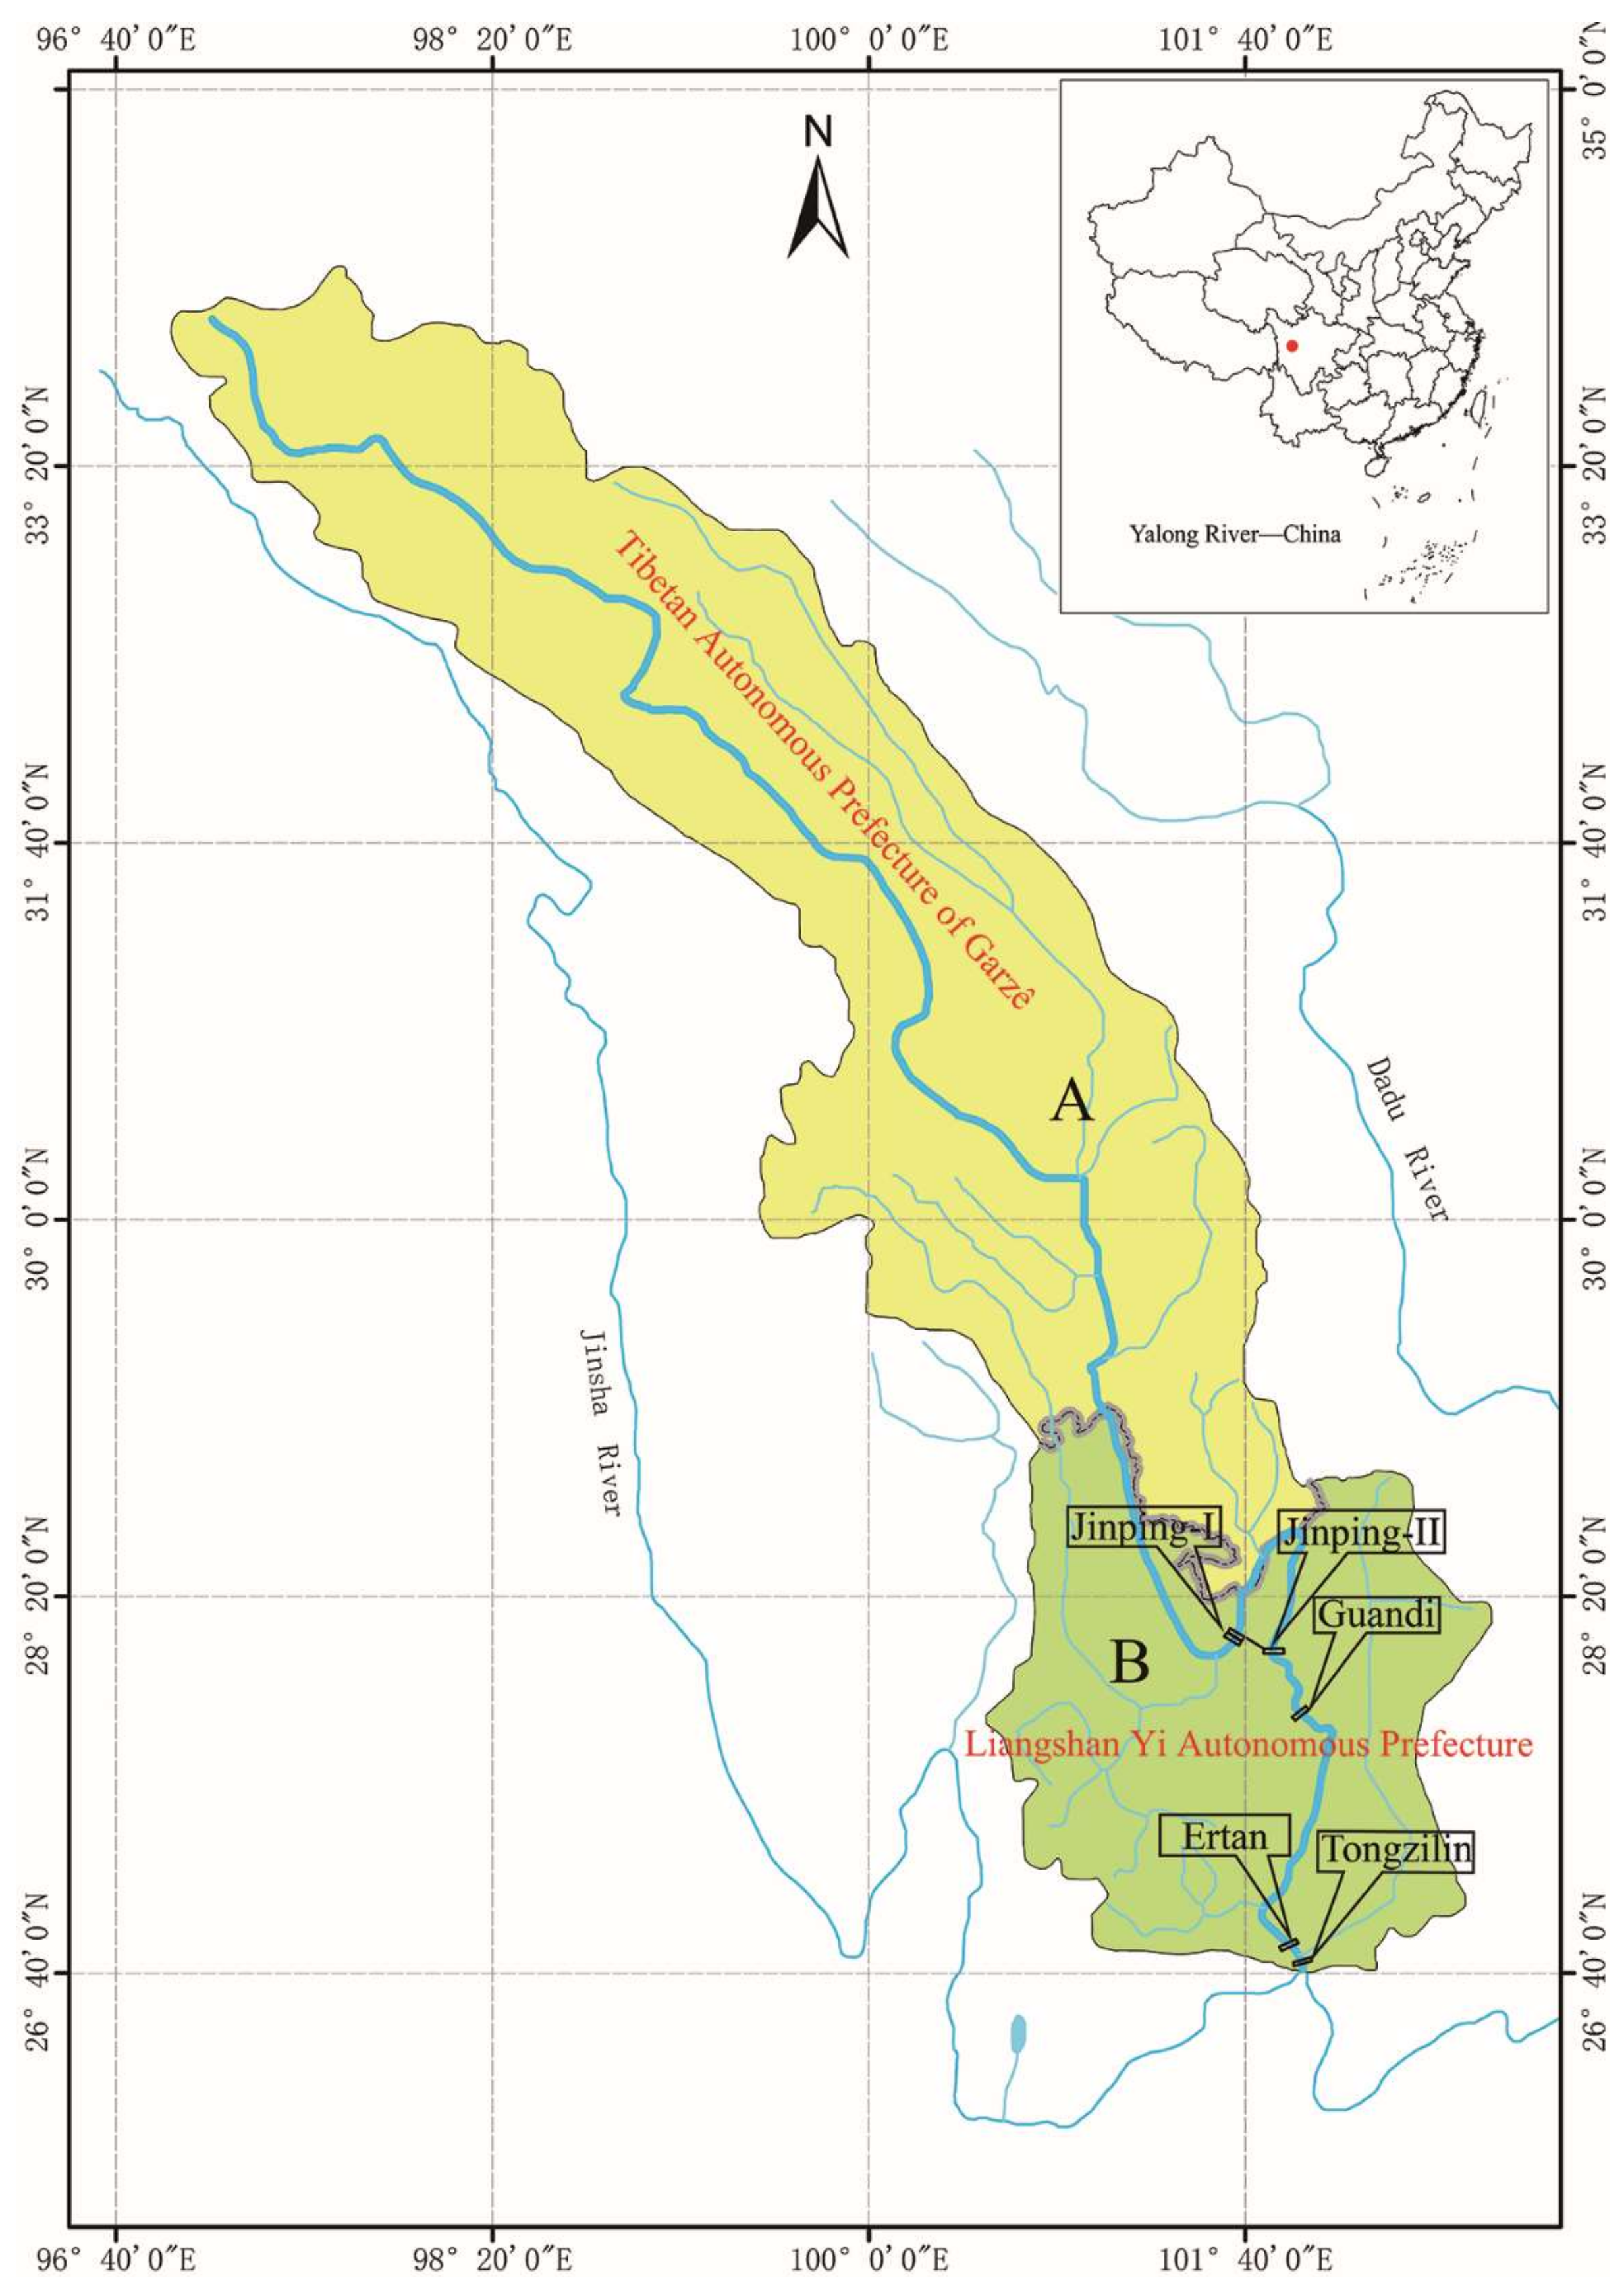
In China, the electric power industry is controlled by the state and energy is generally generated by large-scale power stations such as hydropower stations, thermal power stations, wind power stations, and photovoltaic power stations, and delivered to users through the State Grid Corporation of China. Therefore, off-grid small hybrid power systems are not applicable to China. It is necessary to expand the scale of research to adapt to China’s national conditions. Compared to small-scale hybrid power systems, large-scale wind-PV-hydro complementary systems incur greater challenges, especially cascade hydropower scheduling problems, which have not previously affected small-scale hybrid power systems but are very important at large-scale. In 2016, the Yalong River basin in the southwestern region of Sichuan Province in China was planned to be a clean energy demonstration base of wind-photovoltaic-hydro complementary power generation, which proposes new requirements for the operation and management of southwestern power grids. In view of this, the focus of this paper is to study the optimization of wind-PV-hydro generation scheduling in downstream areas of the Yalong River. Firstly, the complementary characteristics of wind power, photovoltaic power and hydropower in the basin are analyzed. Then an optimal scheduling model based on Progress Optimality Algorithm (POA) theory is proposed. The results show that the cascade hydropower in the downstream reach of the Yalong River has the capacity to accept, and compensate, large-scale wind power and photovoltaic power generation and provide a relatively continuous, stable power supply to the power grid.
Its originality is in its utilization of the regulation performance and storage capacity of cascade hydropower to compensate for the megawatt level wind output and photovoltaic output, and provide an economic, feasible cascade hydropower operation scheduling scheme. Before this, there has not been any such research on this large a scale of multi-energy complementary generation scheduling. This not only reduces the emissions of polluting gases and increases the proportion of non-fossil energy sources used in primary energy consumption, but also optimizes the power supply structure, efficiently uses the existing transmission channels, and provides safety and stability for the power grid.
3. Wind-PV-Hydro Complementary Principle and Characteristics
3.1. Wind-PV-Hydro Complementary Principle
The diverse regional characteristics of the area of interest mean that the construction of wind power stations must be in a wind resource-rich area and its period is short. The construction period of 10,000 kilowatts of wind farms generally requires only 6–12 months. In addition, the scale of wind power installed capacity is flexible and conveniently able to be increased or decreased at any time, but compared with thermal power and hydropower, its stand-alone capacity is much smaller. The most important point is that the output of wind power generation is unstable and affected by wind speed and wind direction, and there are often long periods when there is no wind.
Under the influence of solar radiation, the photovoltaic power generation system can only generate electricity during daytime hours. This intermittent power generation characteristic does not match human demand for electricity. Additionally, in a photovoltaic power generation system, the conversion efficiency between light energy and electrical energy is low (at only 13% to 17%) which greatly increases the cost of photovoltaic power generation.
After completion of the hydropower station, the operation cost is lower, only consuming water energy, and the water flow is at zero-cost and can be recycled repeatedly. The efficiency of advanced hydro-generator sets reaches 90%, which can adapt to the needs of power load changes by increasing or decreasing the load and changing the state from stationary to running in a few seconds.
According to the above characteristics of wind power, photovoltaic, and hydropower, the complementary characteristics of wind-PV-hydro can be summarized as being such that the hydropower compensates the wind power and photovoltaic by capacity, while the wind power and photovoltaic compensate the hydropower by electricity. The specific meaning of this may be presented as follows:
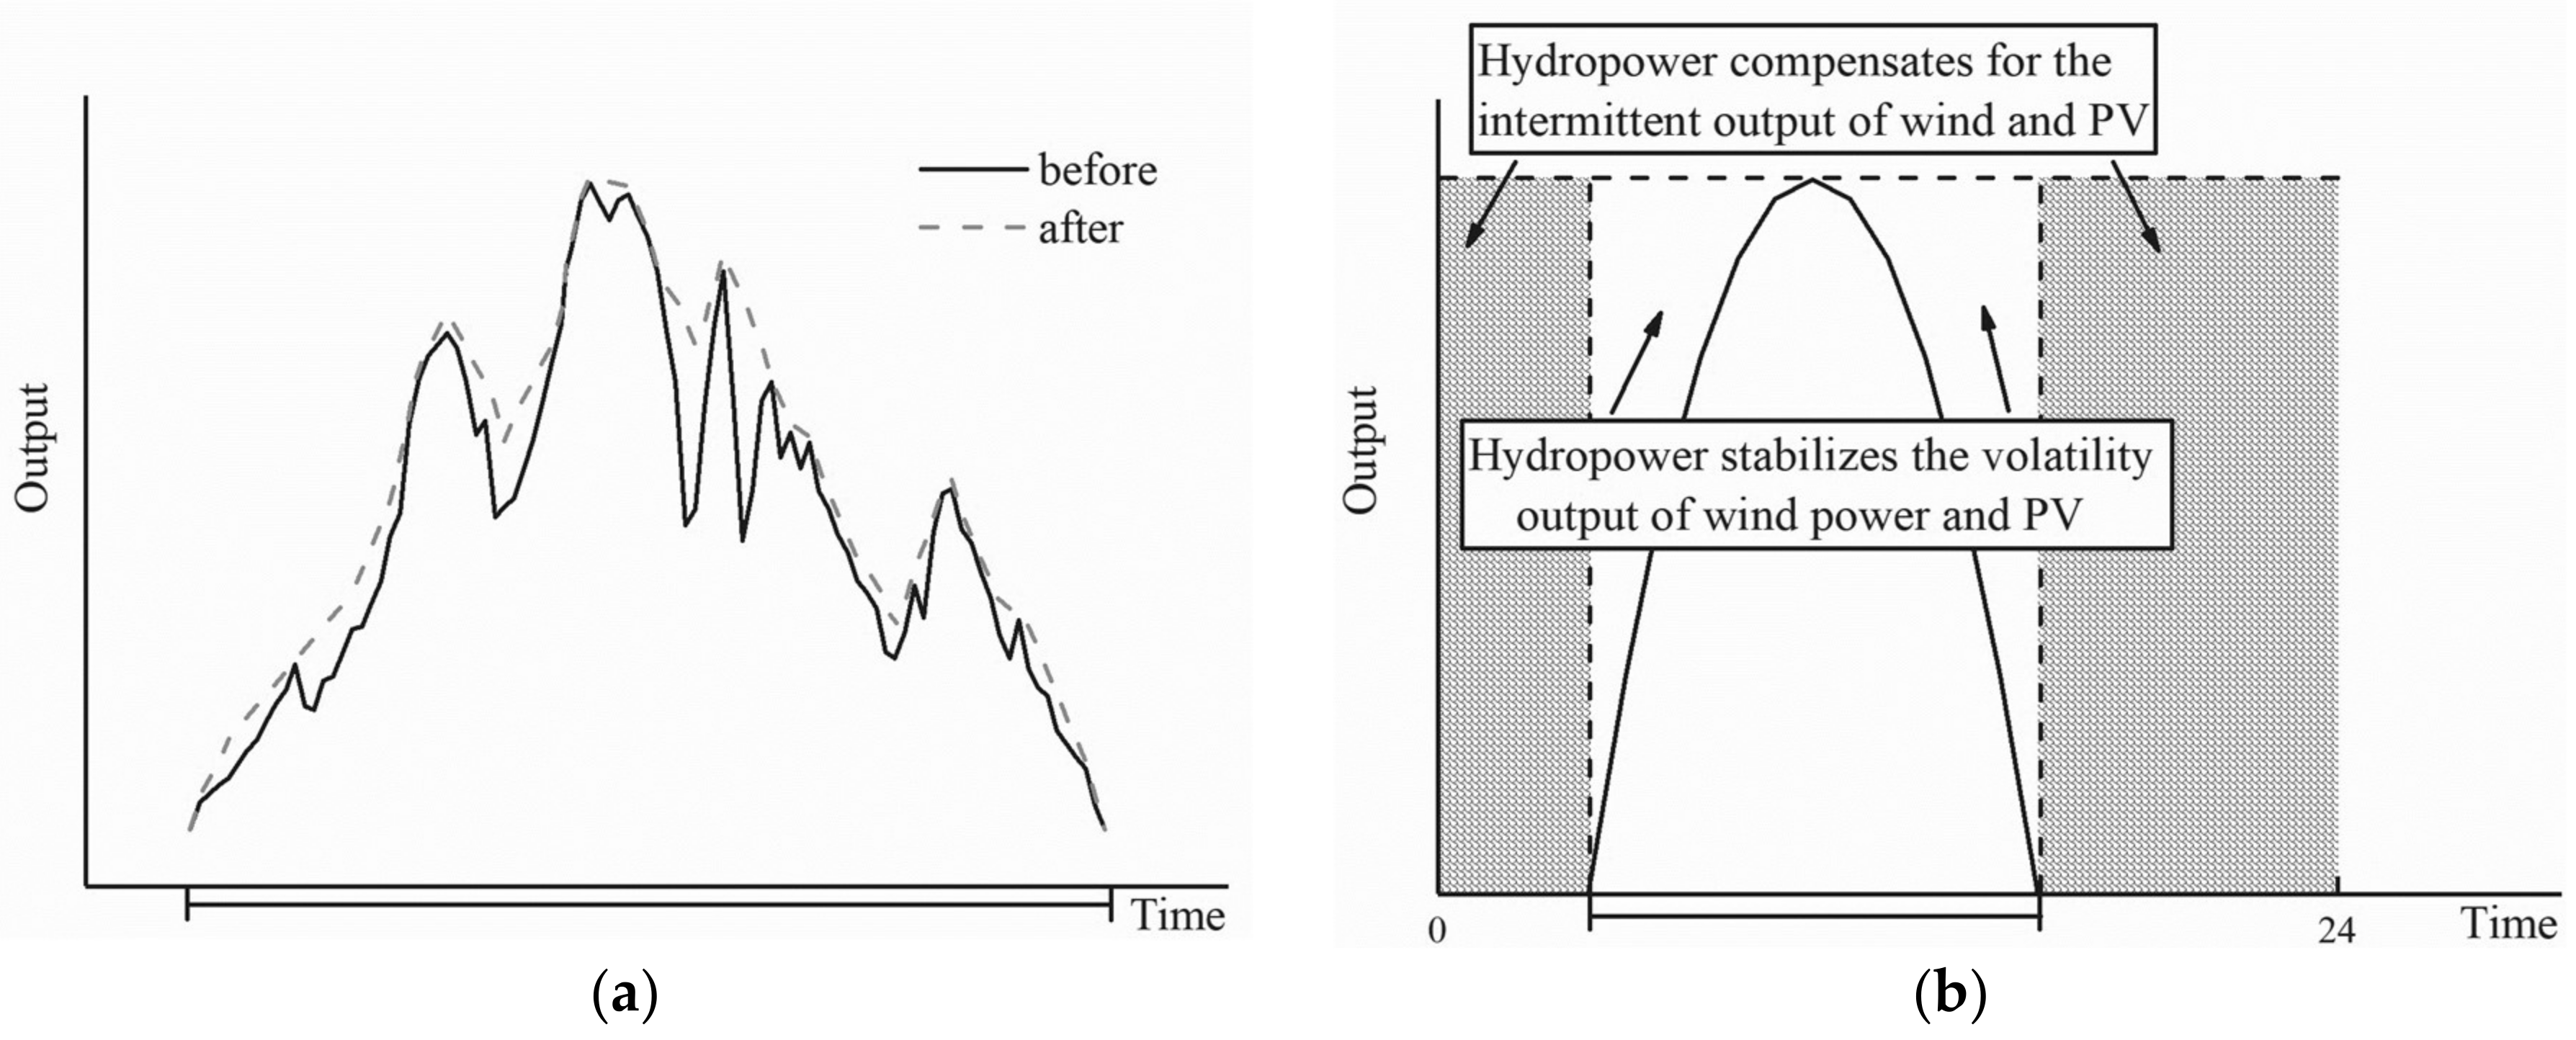
(1) Hydropower compensation for wind power and photovoltaic. It is mainly divided into volatility compensation and intermittent compensation. Volatility compensation utilizes the ability of quick adjustment of hydropower units to eliminate wind and photovoltaic sawtooth-shaped output and thus smooth the output curve (
Figure 2a). Intermittent compensation is based on volatility compensation, in other words, it is based on the smooth photovoltaic output curve. By utilizing the ability of reservoirs to store water and hydropower units to change output rapidly, wind power and PV output are maintained at a constant value required by the system to help to eliminate the intermittency and randomness of output (
Figure 2b). Therefore, by hydropower on wind power and photovoltaic compensation (twice) can eliminate the volatility, randomness, and intermittency of wind power and photovoltaic output, improve their power quality, and create benign conditions for the grid and its operation.
(2) Wind power and photovoltaic compensation for hydropower. Hydropower generation depends on the amount of runoff, which varies month-to-month and year-to-year. Regularly, there is more hydropower generation in high flow years, less power generation in low flow years, more power generation in summer and autumn, and less power generation in winter and spring. Therefore, wind power and photovoltaic can compensate for the shortage of hydropower generation during periods of low hydroelectric power generation. Furthermore, making full use of wind power and photovoltaic during the day, hydropower can reduce output so that reservoirs will reserve more water energy to generate at night, or during peak load, and to increase output to compensate wind power and photovoltaic. Akin to utilizing sources in a flexible fashion, the peak power of the three will be increased as well as the peak shaving ability and the peak benefit of wind-photovoltaic-hydro complementary operation.
To meet local grid load requirements, it is beneficial to bundle the three power sources and use the strong regulatory capacity of cascade hydropower stations to stabilize wind power and photovoltaic power output fluctuations. By using this method, the burden by the wind and photovoltaic power accessing the grid directly on the power system will be reduced to a certain extent, and the local power grid will gain relatively sustained and stable power supply. In addition, peak regulation capability will be enhanced and energy structure for the development of clean power will be optimized.
3.2. Wind-PV-Hydro Complementary Characteristics
After understanding the principle of wind-photovoltaic-hydro complementarity, the complementary features of the three on different timescales are analyzed, and the results will lay the foundation for the optimal operation of the entire system. There are 26 PV power plants and 74 wind farms planned on the wind-photovoltaic-hydro complementary clean energy base of the Yalong River basin. At present, four wind farms and two PV power plants have been built and put into operation. Among them, Baiwu PV power plant and Dechang wind farm have been selected for this research. The hydropower station was chosen as the last five cascade hydropower stations of the Yalong River’s downstream reach.
Dechang Wind Farm is in a plateau valley with extremely advantageous geographical conditions. The terrain is undulating, and topography is high in the north and low in the south. The altitude is between 1115 m to 4359 m. In winter and spring, the southerly wind prevails on the ground Dechang Wind Farm is the first and the largest wind farm in Sichuan Province.
Baiwu PV Power Station is the largest installed PV power plant in Sichuan Province located in a wide plain with generally flat terrain. The incident annual solar radiation is about 6213 MJ/m2. It can reach 653 MJ/m2 at peak in May and 404 MJ/m2 at its lowest in December, and thus belongs to the second category of solar energy resources in China.
Information about the selected power stations is summarized in
Table 2.
Baiwu and Dechang two power stations are in excellent conditions and can represent most quality wind and PV power stations in the Yalong River basin. The focus of this paper is on the feasibility of wind-PV-hydro complementary power generation, so their output is significant data that can be used as an upper bound. The upper bound output can be used to assess whether, or not, cascade hydropower stations can adjust the wind and PV power output to improve their utilization and help them onto the grid in a safe manner.
There are hourly output data of 2016 of each power station provided by each selected power station. As the installed capacities of the plants are different, direct analysis is not convenient. For simple normalization, the hourly output is converted to the unit installed capacity per hour, μ is set to be the ratio of output per hour to installed capacity. The analysis is mainly carried out on a yearly and daily basis.
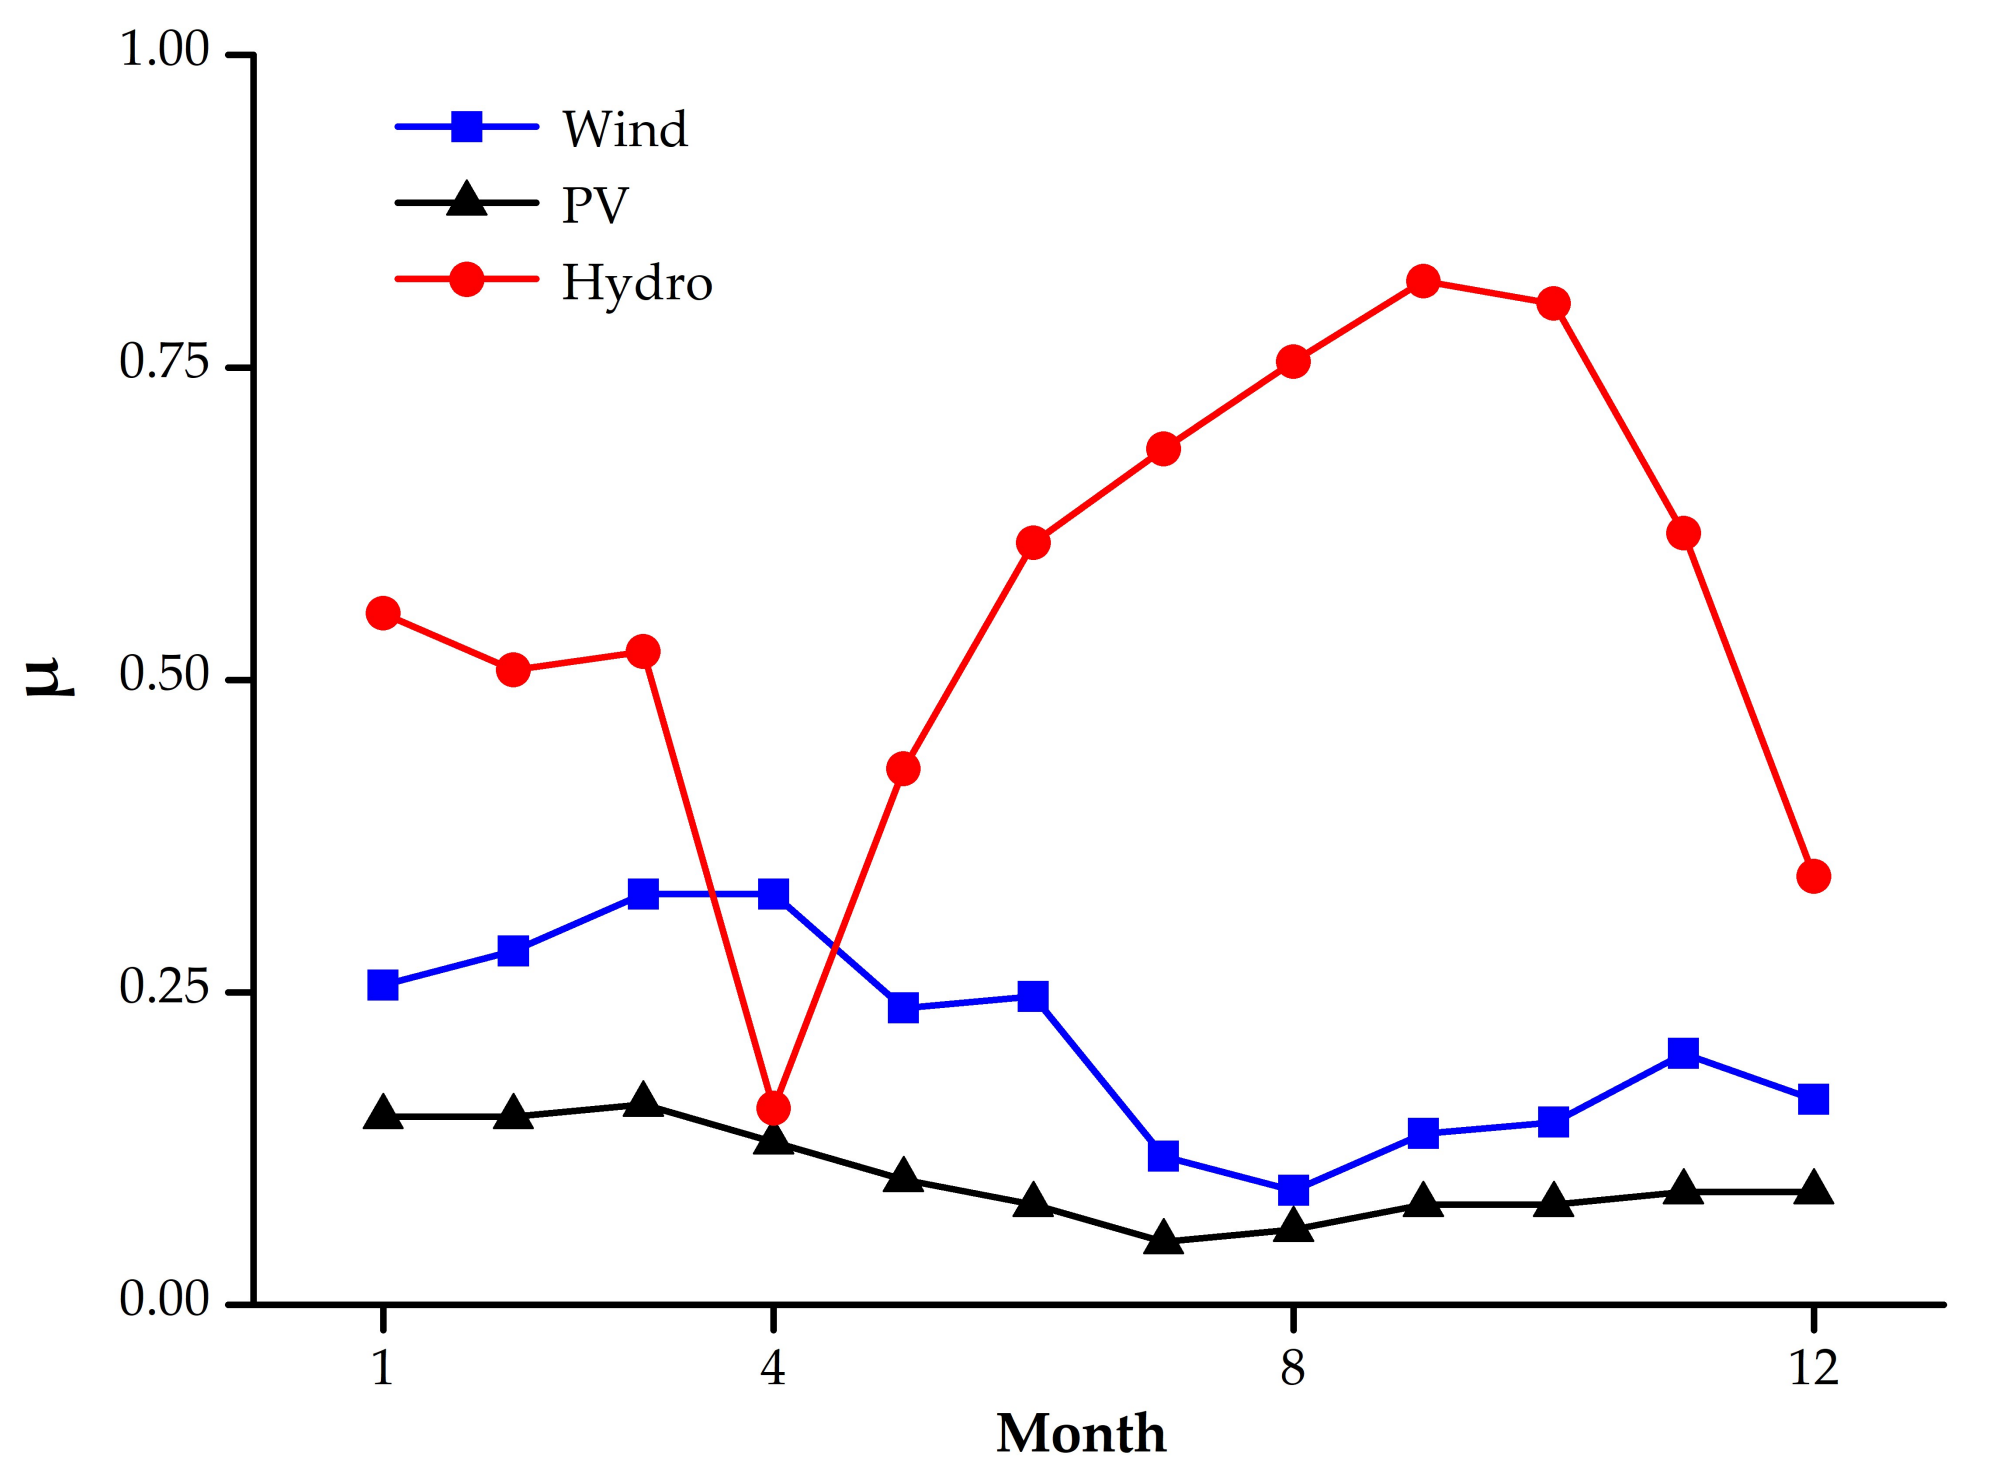
Within a year, the analysis of complementarity focuses on the characteristics of wind and photovoltaic output during the peak, and off-peak, periods of hydropower. By accumulating hourly output data from wind farms, photovoltaic stations, and five cascade hydropower stations in actual operation in 2016 and normalizing them, the sum of the monthly output dates are obtained. The Yalong River downstream wind power, photovoltaic power, and hydropower output process in one year is demonstrated in
Figure 3.
It is not difficult to find, from
Figure 3, that the output of wind power and photovoltaic power generation is greater in winter and spring than that in summer and autumn, while the hydropower output is the opposite. In April, wind power and photovoltaic outputs are larger, and hydropower output is smaller, but in August, hydropower output is larger while wind power and photovoltaic outputs are smaller, which proves that they have obvious complementarity.
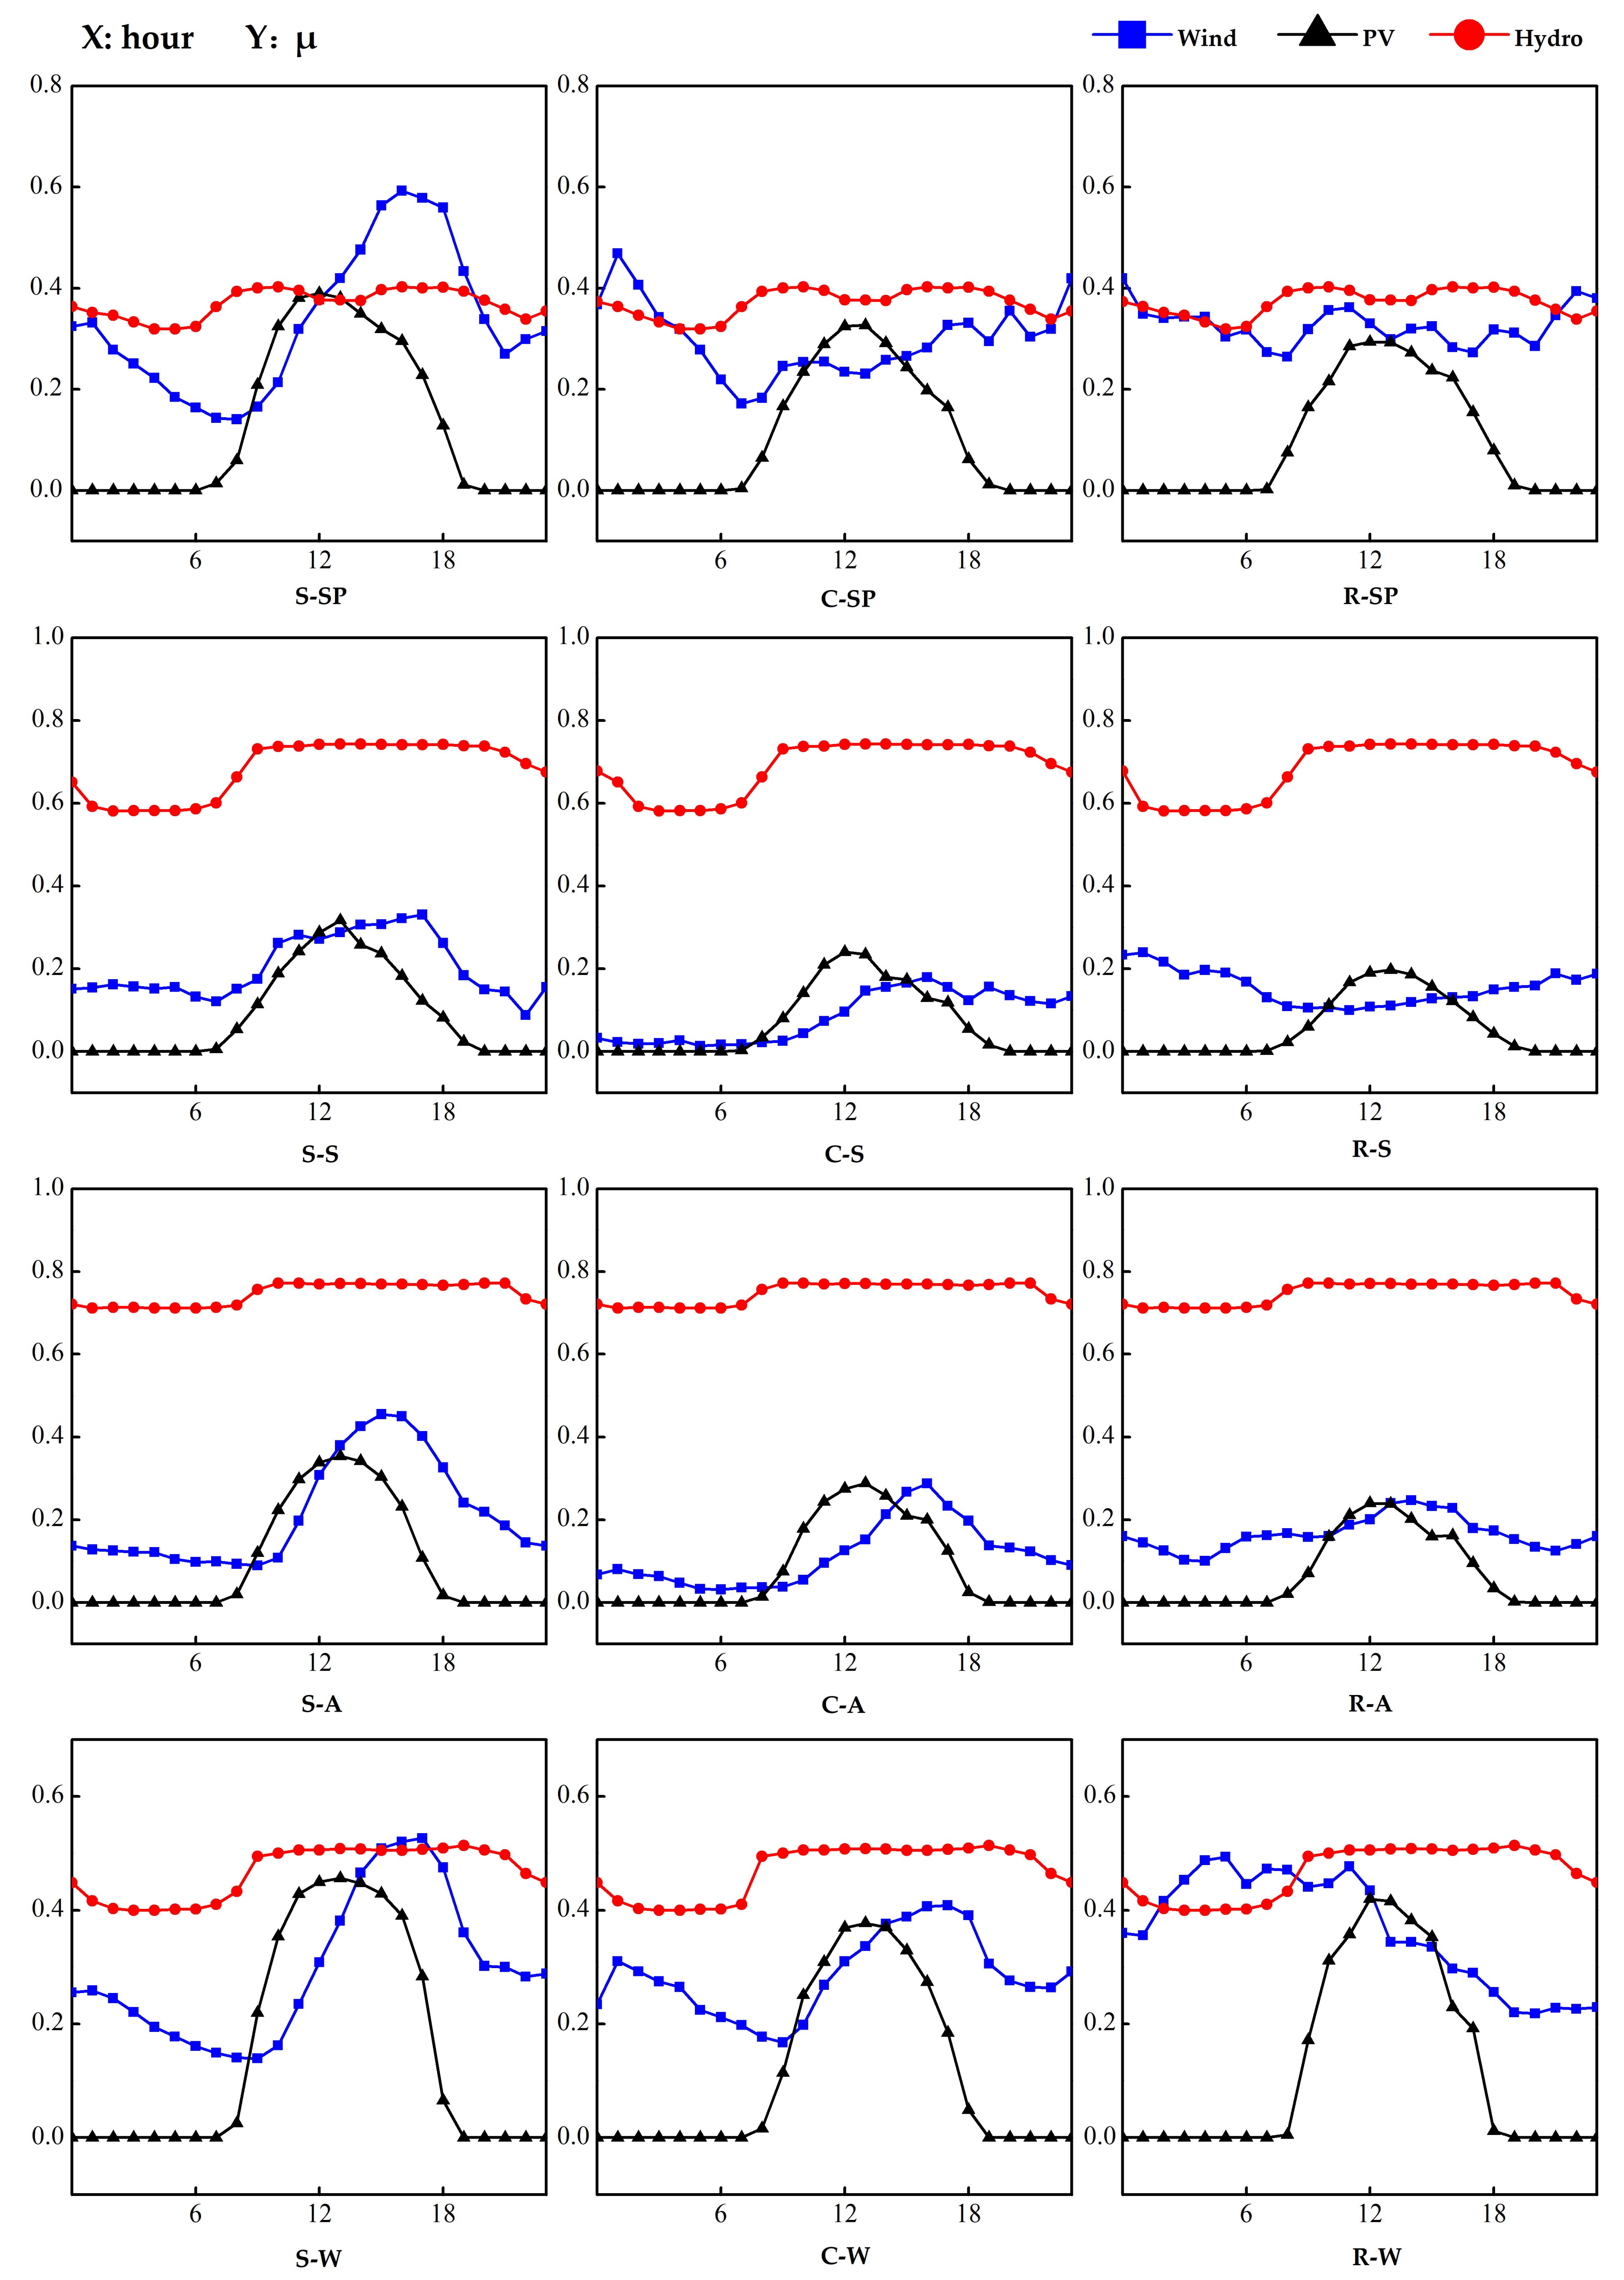
Within a day, due to the three power generation methods affected by different seasons and weather conditions that will cause certain differences in power output, there is a very good program able to help more fully understand the wind-photovoltaic-hydro complementary situation, which is to divide 365 days into 12 typical types in accordance with four seasons, spring, summer, autumn, and winter, and three weather types, cloudy, sunny, and rainy. The weather conditions come from the historical data of the China Meteorological Administration. The 12 typical types are displayed in
Table 3.
After completion of the classification of the weather conditions, for each case, the hourly output data are averaged and normalized, and then wind power, photovoltaic, hydropower output processes of the 12 typical types are shown in
Figure 4.
In the same season, under different weather conditions, the photovoltaic power output in a given 24 h is basically the same and takes on an arcuate form. The output of the peak on sunny days is greater than that on cloudy, and rainy, days: the peak time is the same. This is mainly affected by solar radiation. The greater the solar radiation, the greater the photovoltaic output. Wind power generation is affected by the weather. The output process, under the three kinds of weather, has different trends. The fluctuations are greatest on sunny days, with the peak output occurring at about 16:00 and the output is minimized by about 21:00. On cloudy, and rainy, days wind power output is greater in the mornings and evenings. Hydropower output does not change much during a given season.
In the same weather conditions, in different seasons, the PV output trend remains the same within a 24-h period and it is arcuate in form. The peak output is greater in winter than in spring, autumn, and summer, and the peak emergence time is different because the photovoltaic output is not only affected by solar radiation, but also affected by temperature. The higher the temperature, the smaller the PV output. Wind power contributes much more in winter and spring than in summer and autumn. Hydropower output is the opposite of wind power and PV power and is greater in summer and autumn than in spring and winter.
In general, the output of photovoltaic and wind power fluctuates greatly in any given day, and there is a certain degree of complementarity. The stable output of hydropower can leave a certain amount of storage capacity for adjustment purposes: the storage capacity of the reservoirs can be used to stabilize the fluctuations in wind power and photovoltaic output in the short-term, therefore, the three kinds of power sources also have good complementarity over a one-day period.
5. Methodology and Data
Compared with other optimization algorithms, the POA is chosen because of its advantages in the following aspects: reduction of the calculation of dimensions, faster convergence speed, less parameter adjustment, and excellent practicality [
37]. The POA proposed by Canadian scholars Howson and Sancho in 1975, has been improved several times and successfully applied to reservoir scheduling [
38].
5.1. Series Deformation of POA
The traditional POA algorithm decomposes a multi-stage problem into a two-stage problem. First, it fixes the variables of other stages and searches only the selected two-stage decision variables. After solving the problems in this stage, the optimized result is taken as the initial condition of the next optimization process and is thus used to fix the variables of this, and other, stages for continued optimization. The cycle continues until it converges.
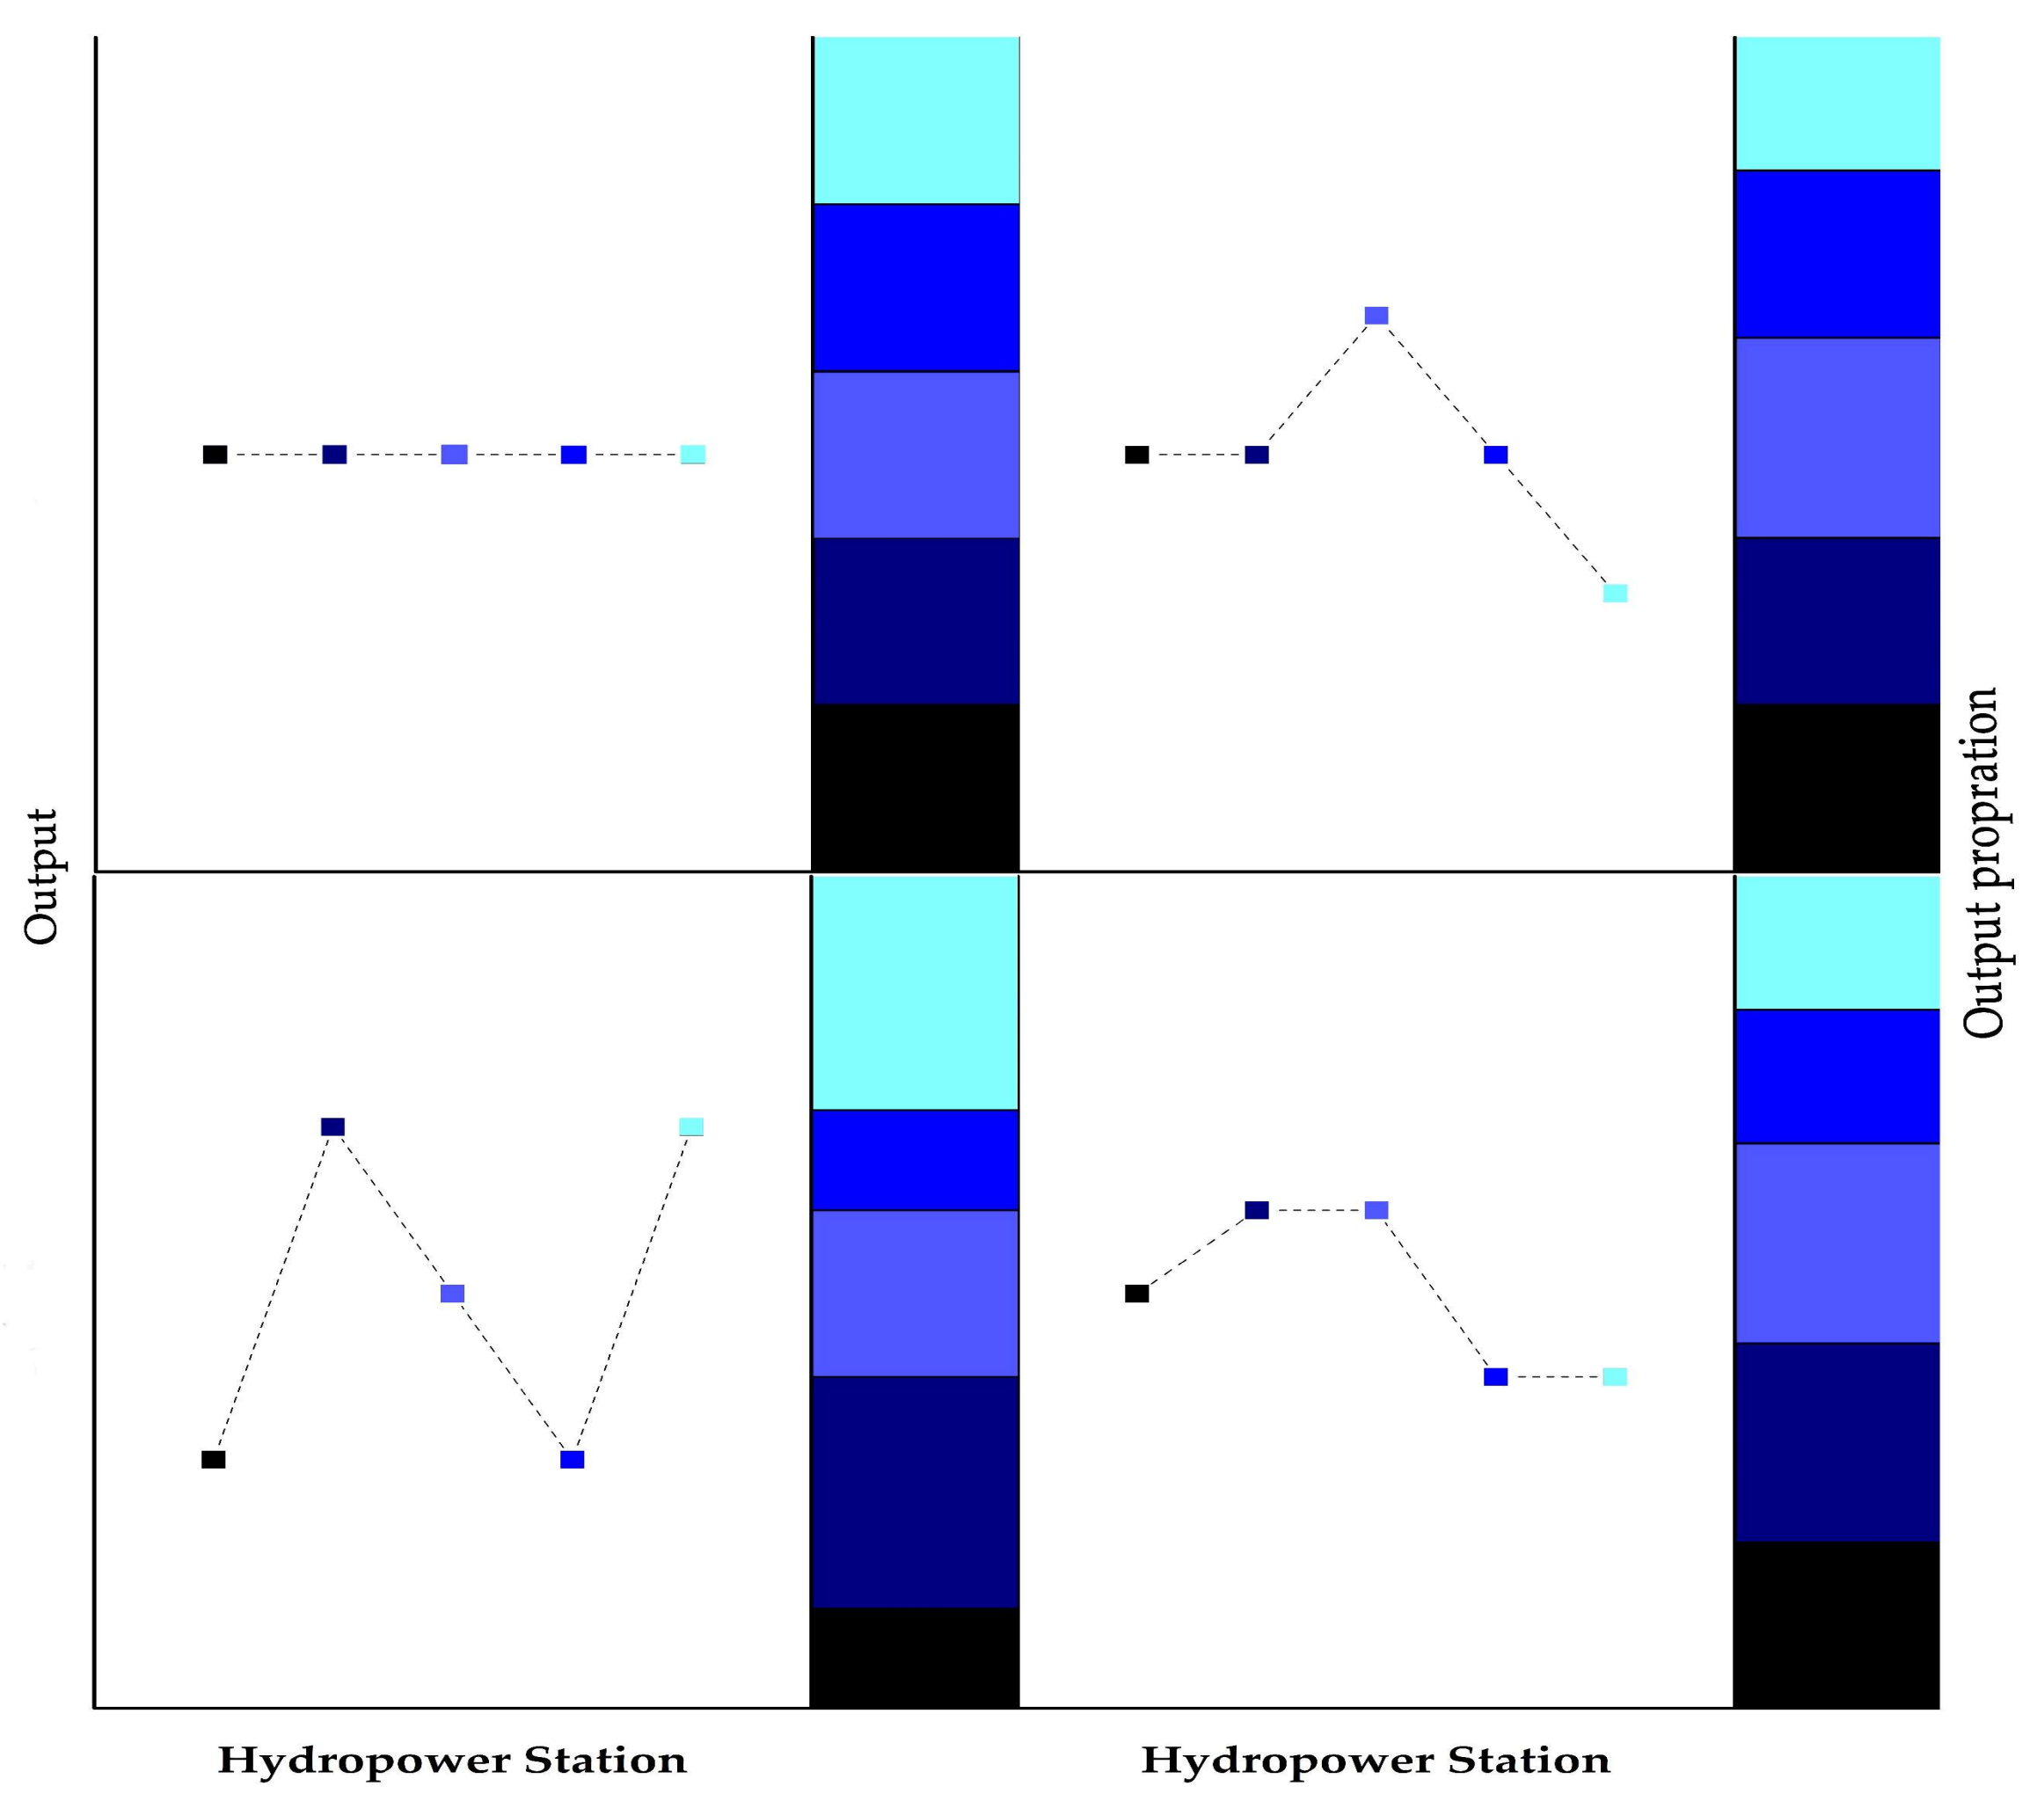
Based on the traditional POA algorithm, according to the characteristics of this work in which the sum of wind power output, photovoltaic power output, and hydropower output is certain and the priority is given to receive wind power and photovoltaic power, what is required is merely to choose an optimal way to distribute electricity through cascade hydropower dispatching. Therefore, it is feasible to connect the five hydropower stations in series. From all the solutions, the optimal trajectory satisfying the requirements should be selected according to the principle of “total output remains unchanged”, and then, the pilot calculation should be performed to find the global optimal solution from the selected optimization trajectory to reduce the computational burden. The schematic diagram of this “series deformation” concept is shown in
Figure 5.
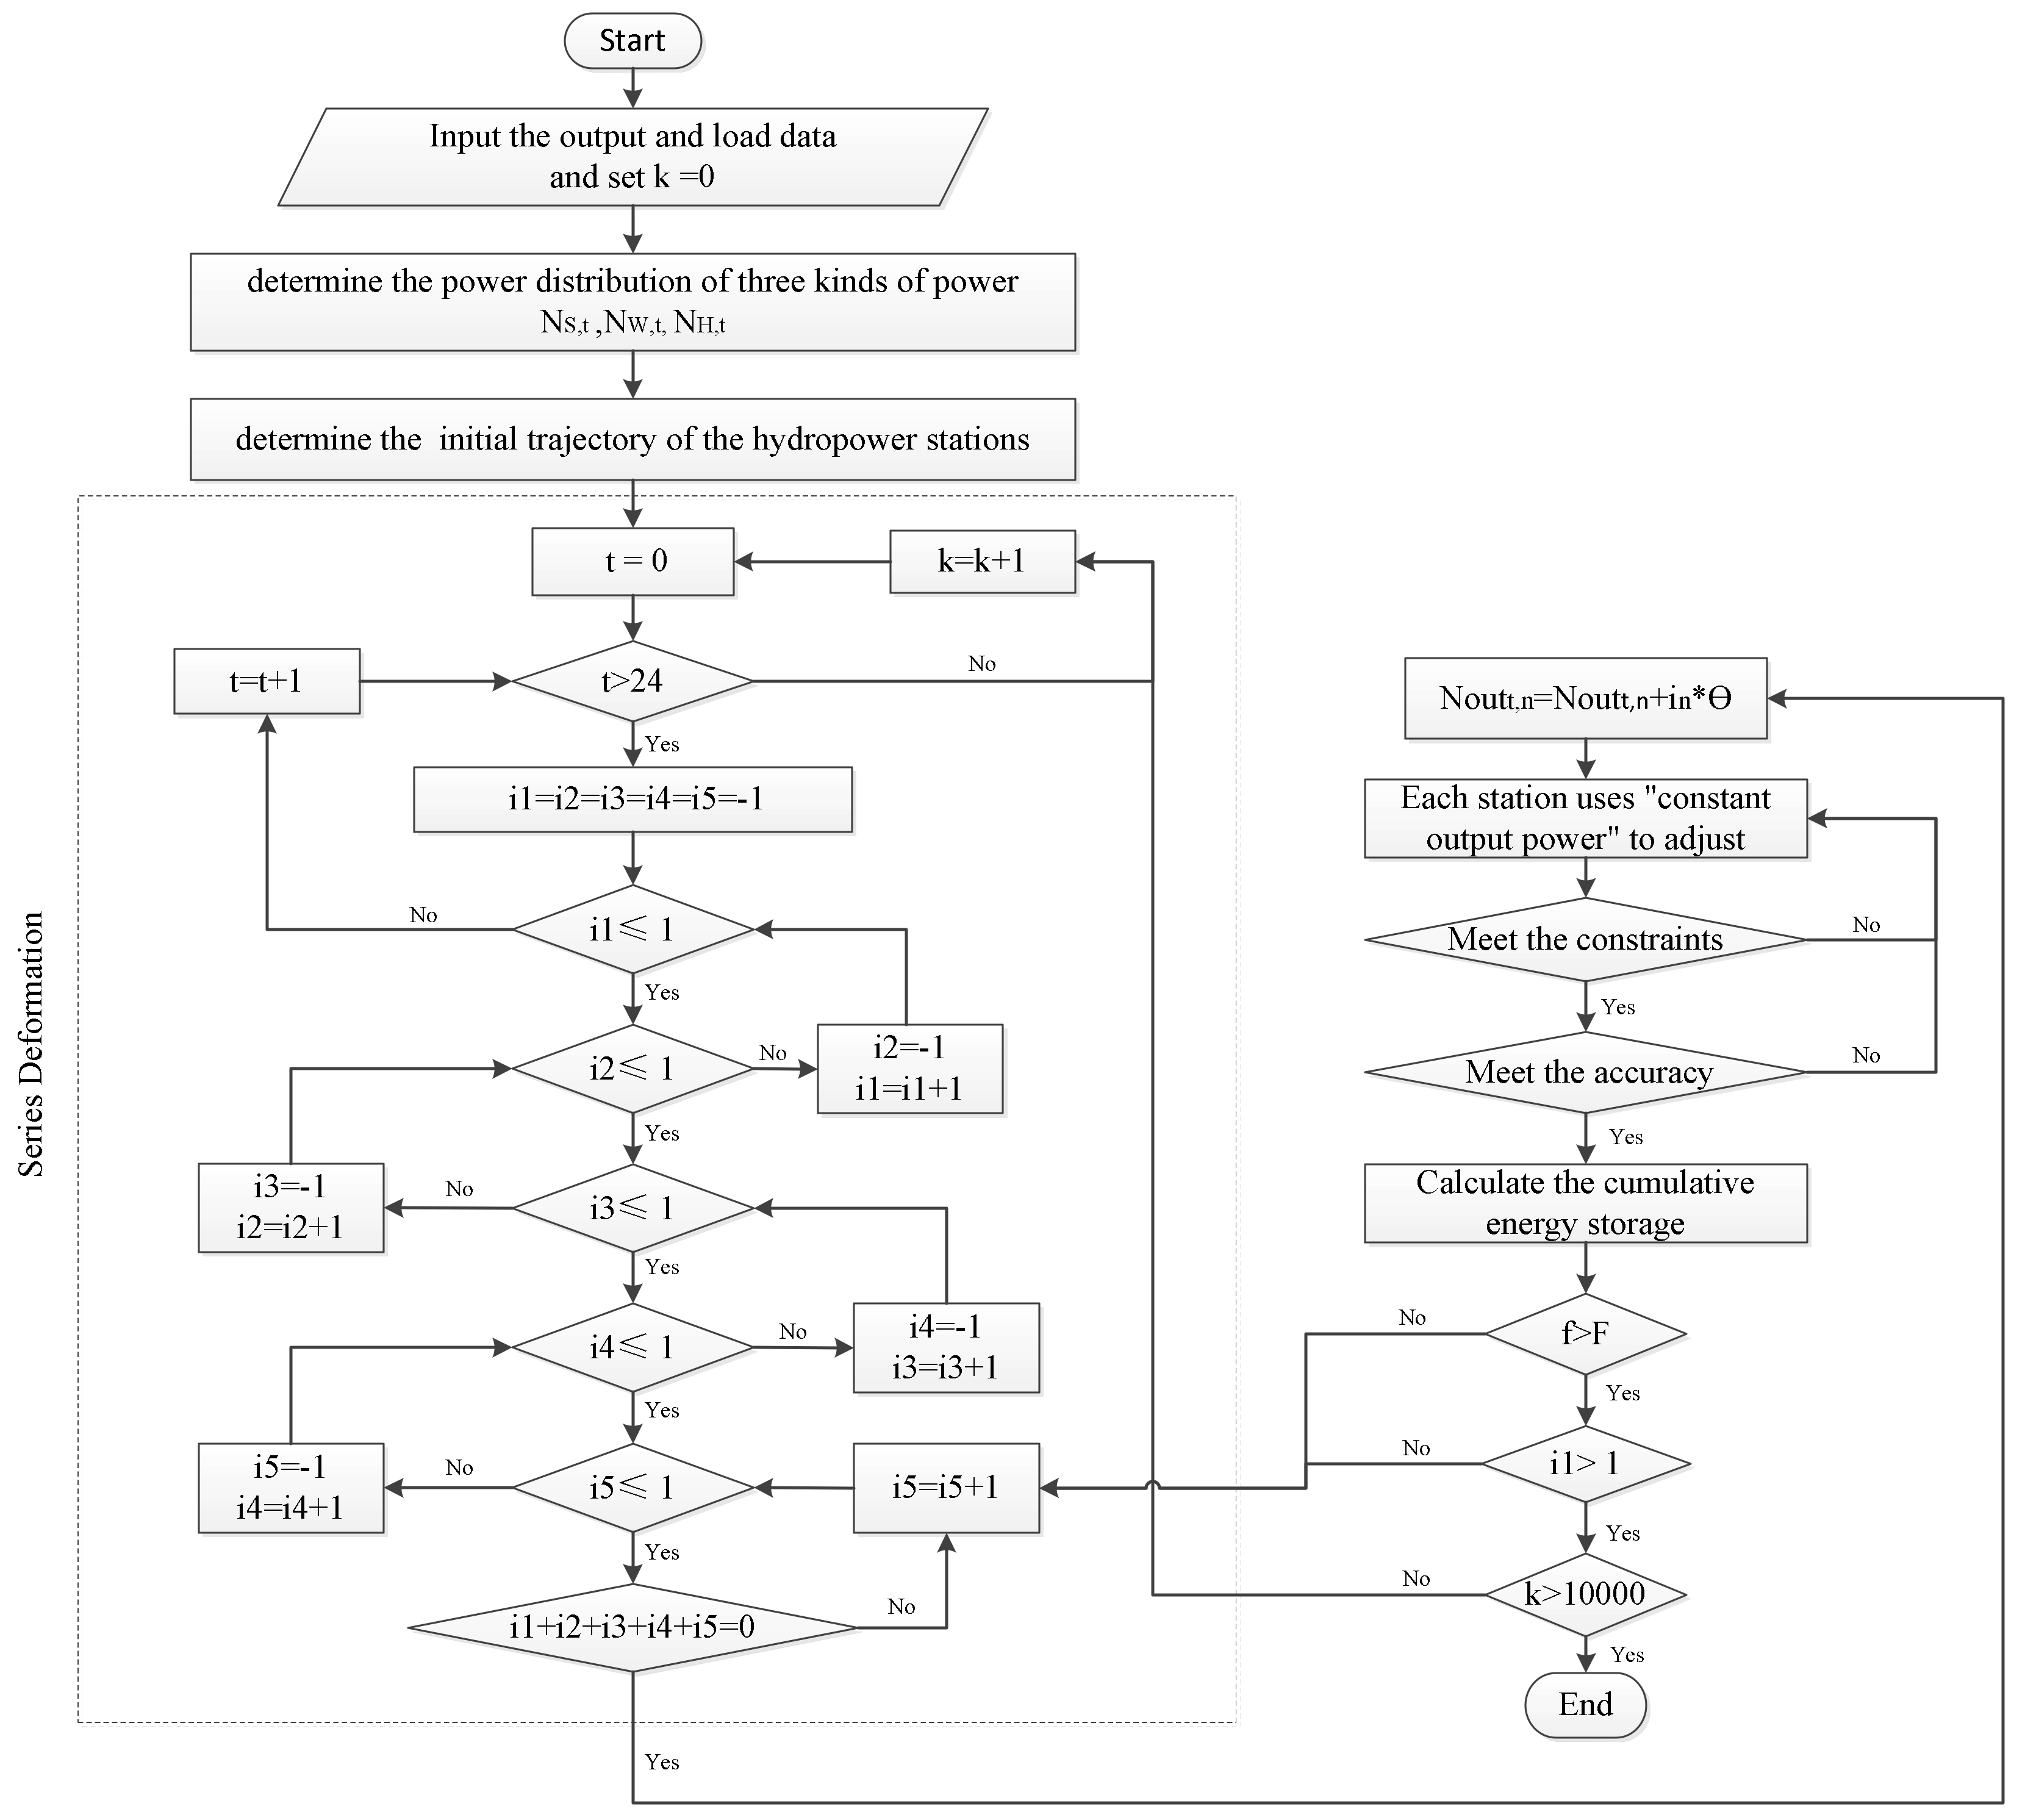
The complete optimal dispatching based on the proposed method is performed as described below and the flow chart through the overall solution procedure is shown in
Figure 6.
Step 1: input the data and the grid load requirements, and set the cycle index, and step value δ.
Step 2: determine the hourly load demand distribution of the three kinds of power supplies to meet the first goal of “Minimize the amount of abandoned wind power and photovoltaic power”.
Step 3: according to the proportion of the installed capacity of the five hydropower stations, determine the output process of each power plant in 24 h as the initial trajectory of the POA algorithm.
Step 4: through the “series deformation”, the trajectory that satisfies the requirement of “the power output of each station is changed, and the total power of the cascade does not change” is preferentially selected from all the solutions.
Step 5: optimize the scheduling by constant output regulation for each plant according to the trajectory selected in Step 4 and look for a solution that satisfies the second target, “Maximize the cumulative total energy storage of all cascade hydropower stations”.
Step 6: if the solution meets the constraints and precision requirements, proceed to the next time period calculation, otherwise return to Step 4 to continue to find the optimal solution.
Step 7: adjust step value δ and return to Step 4 to start a new round. When the period-by-period calculation is completed, and the specified cycle index is reached, export the final optimization schedule.
5.2. Data
At present, wind power and photovoltaic resources in the downstream reach of Yalong River have not yet been fully developed and are much smaller than the scale of cascaded hydropower that has been put into operation. For hydropower, it is easy to accept and regulate the current output of wind power and photovoltaic power. Therefore, more efforts should be made to investigate the wind-photovoltaic-hydro complement optimal dispatching method after developing wind power and photovoltaic power generation. The simulation data are as follows:
(1) Magnitude: according to the planning scale and theoretical exploitable capacity of the Yalong River Wind-PV-Hydro complementary clean energy base (
Table 1), the simulation data adopt a proportional amplification method. The real-time data of selected typical power plants are scaled up by 1:50 to simulate the situation after large-scale wind farms and photovoltaic power plants completed and grid-connected.
(2) Time: based on the results of the analysis of the characteristics of wind-photovoltaic-hydro complementary generation in
Section 3, S-SP and R-A are selected as the typical day for simulation. It is taken into account that the high-, and low-flow periods in the Yalong River Basin occupy August to October and March to May, respectively, in a given year, so the two extreme values of annual water flow occur in spring and autumn. Combining this with the characteristics of wind power and photovoltaic power generation, the amount of power generated is greatest during spring on sunny days and is lowest during autumn on rainy days. It can be considered that the complementarity in these two phases (S-SP and R-A) is obvious, representative, and worthy of research.
6. Results and Discussion
6.1. Simulation Results
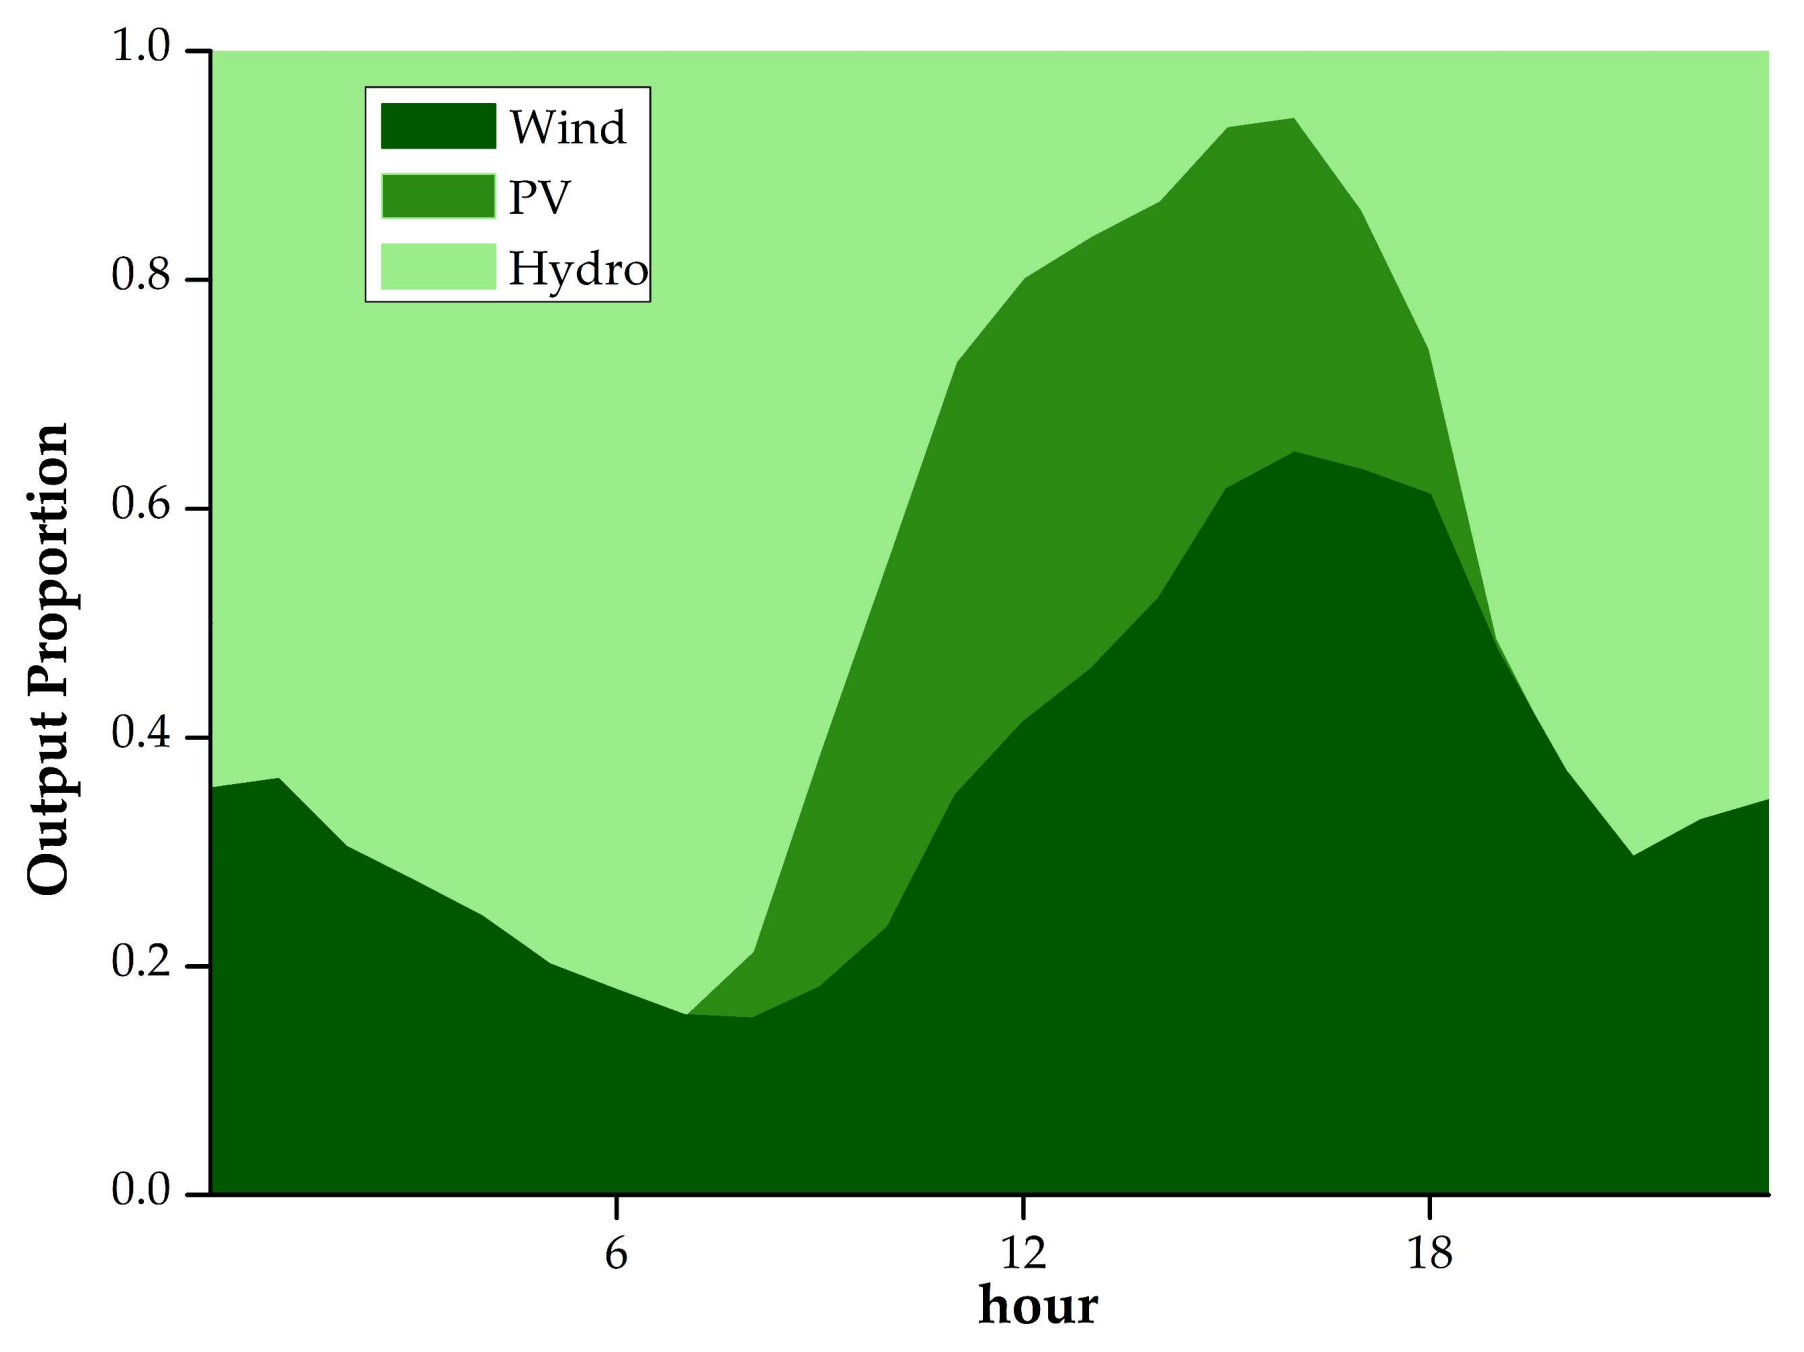
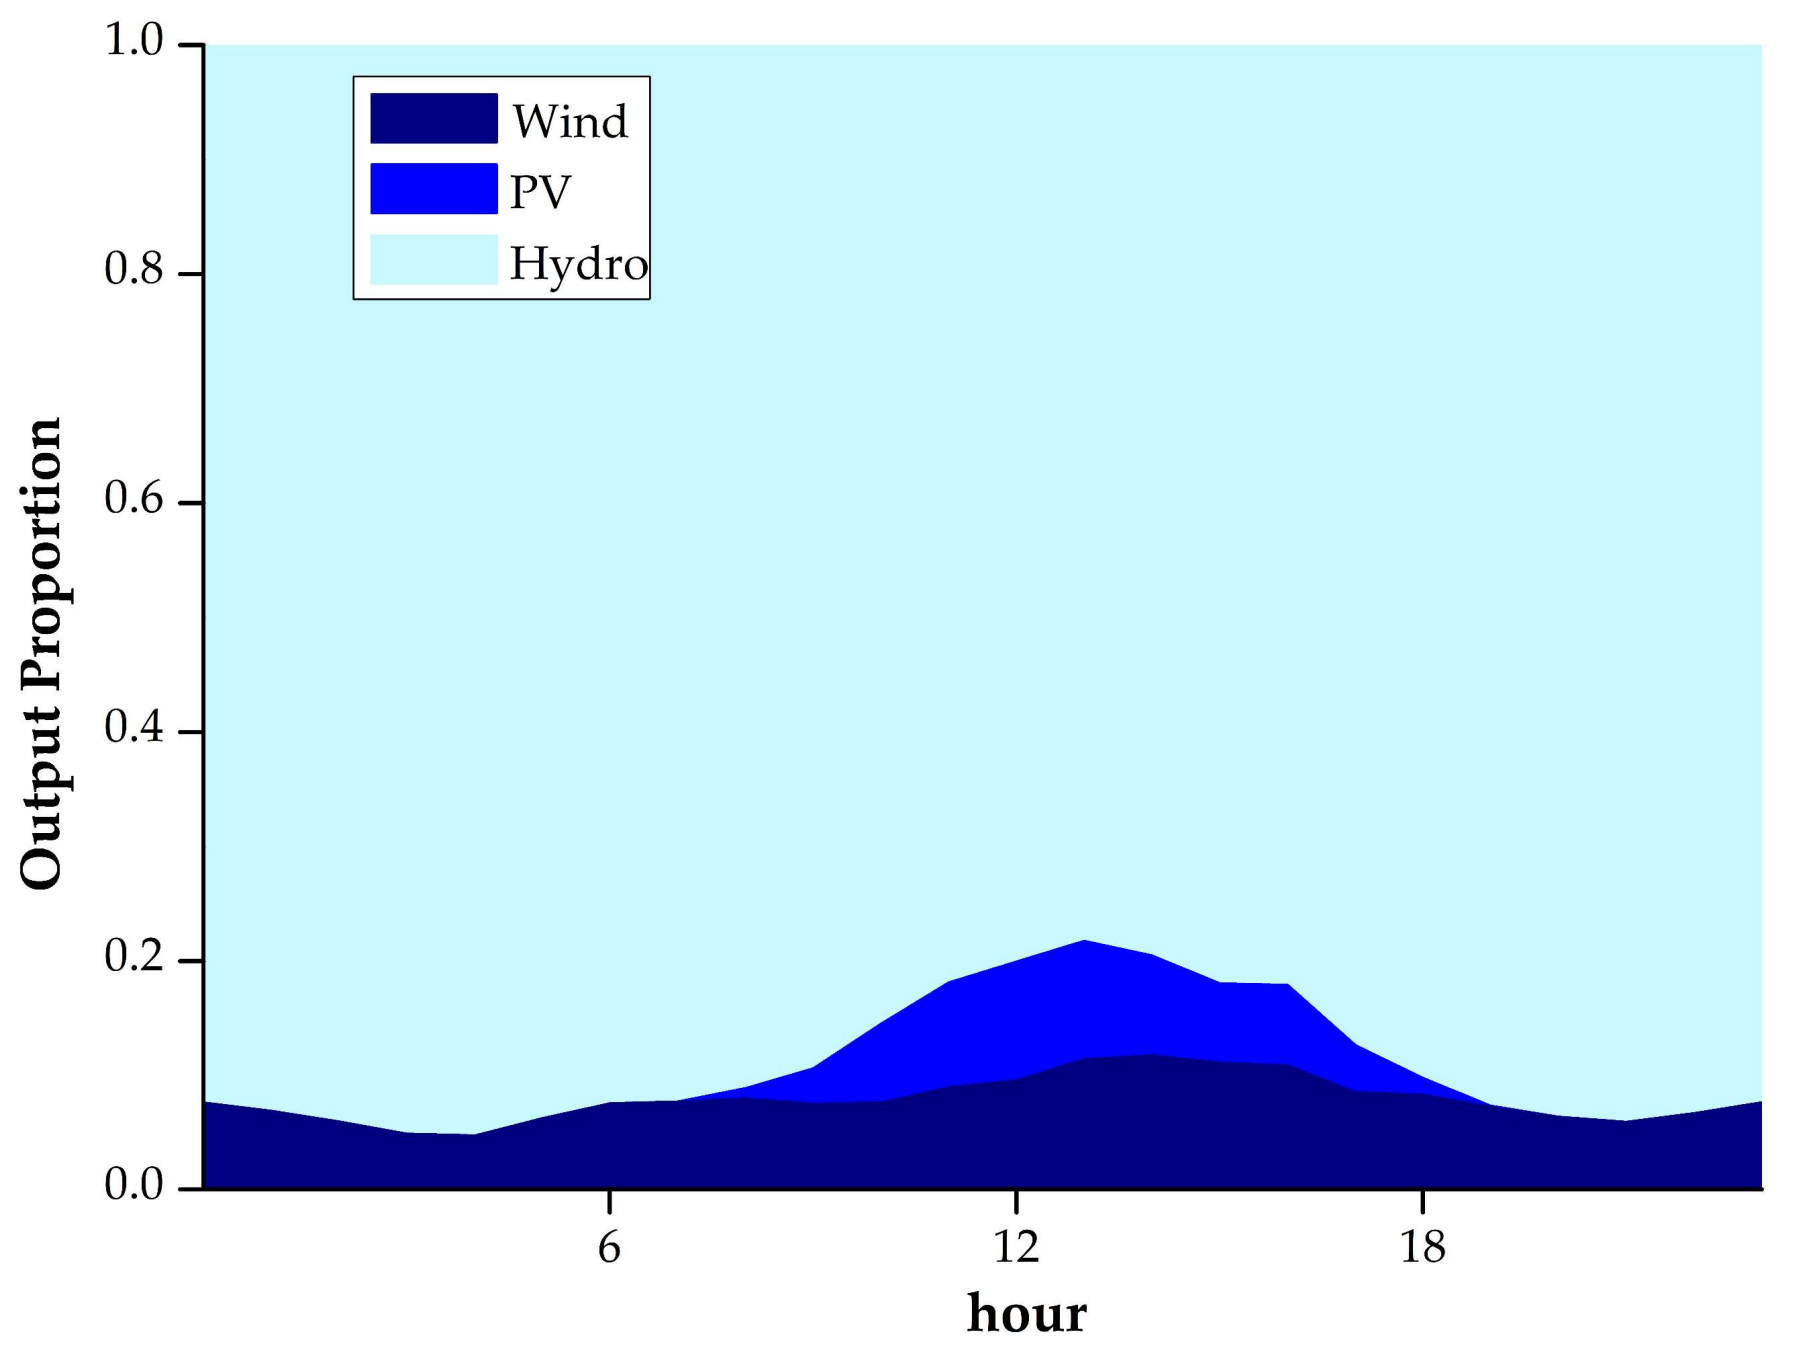
The final dispatch schemes in the two different typical days are respectively shown in
Figure 7 and
Figure 8.
In spring, hydropower is affected by drought: lower inflows and lower water levels, mean that power generation capacity decreases so that wind power and photovoltaic power make up the main energy structure of the grid by day. Wind power output shows a downward trend during 0:00 to 8:00, then gradually increases to a peak at 16:00 and then slowly decreases. Photovoltaic power generation is concentrated within the period from 7:00–18:00. The total output of wind and photovoltaics peaks at 16:00, accounts for 90% of the grid load. The hydropower output curve fluctuates and shows big peak-valley amplitude. In the evening, hydropower invokes the stored energy in reservoirs during the day to increase output to meet the demand for night-time electricity.
In autumn, hydropower benefits from the high-flow season. Water levels are close to full while regulation ability is weak. Wind power and photovoltaic outputs are greatly affected especially on rainy days. The energy structure of the grid is dominated by hydropower. Wind power output is more evenly distributed during each period but by no more than 10%. Photovoltaic power generation is concentrated between 10:00–18:00. The total output of wind and photovoltaics accounts for less than 20% of all grid load. Hydropower accounts for most of the tasks and has a fluctuating output curve because hydropower has been given priority to compensate for the random variations in wind and photovoltaic peak shaving and frequency modulation.
The results show that the five cascade hydropower stations in the downstream reach of Yalong River have performed well in compensating wind and photovoltaic fluctuations with strong regulatory capacity that can completely absorb nearby wind and solar resources and not produce excessive amounts of abandoned wind, and photovoltaic, power.
6.2. Impact on Hydropower
Although large-scale cascading acceptance of landscape power is conducive to the promotion of wind power and photovoltaic power consumption, it is bound to have an inevitable impact on the cascade hydropower stations. Wind-PV-Hydro complementary coordinated operations should also meet the principle of comprehensive utilization of water resources. Therefore, the following analysis will be undertaken from the perspective of changes in water level, discharge flow, and output.
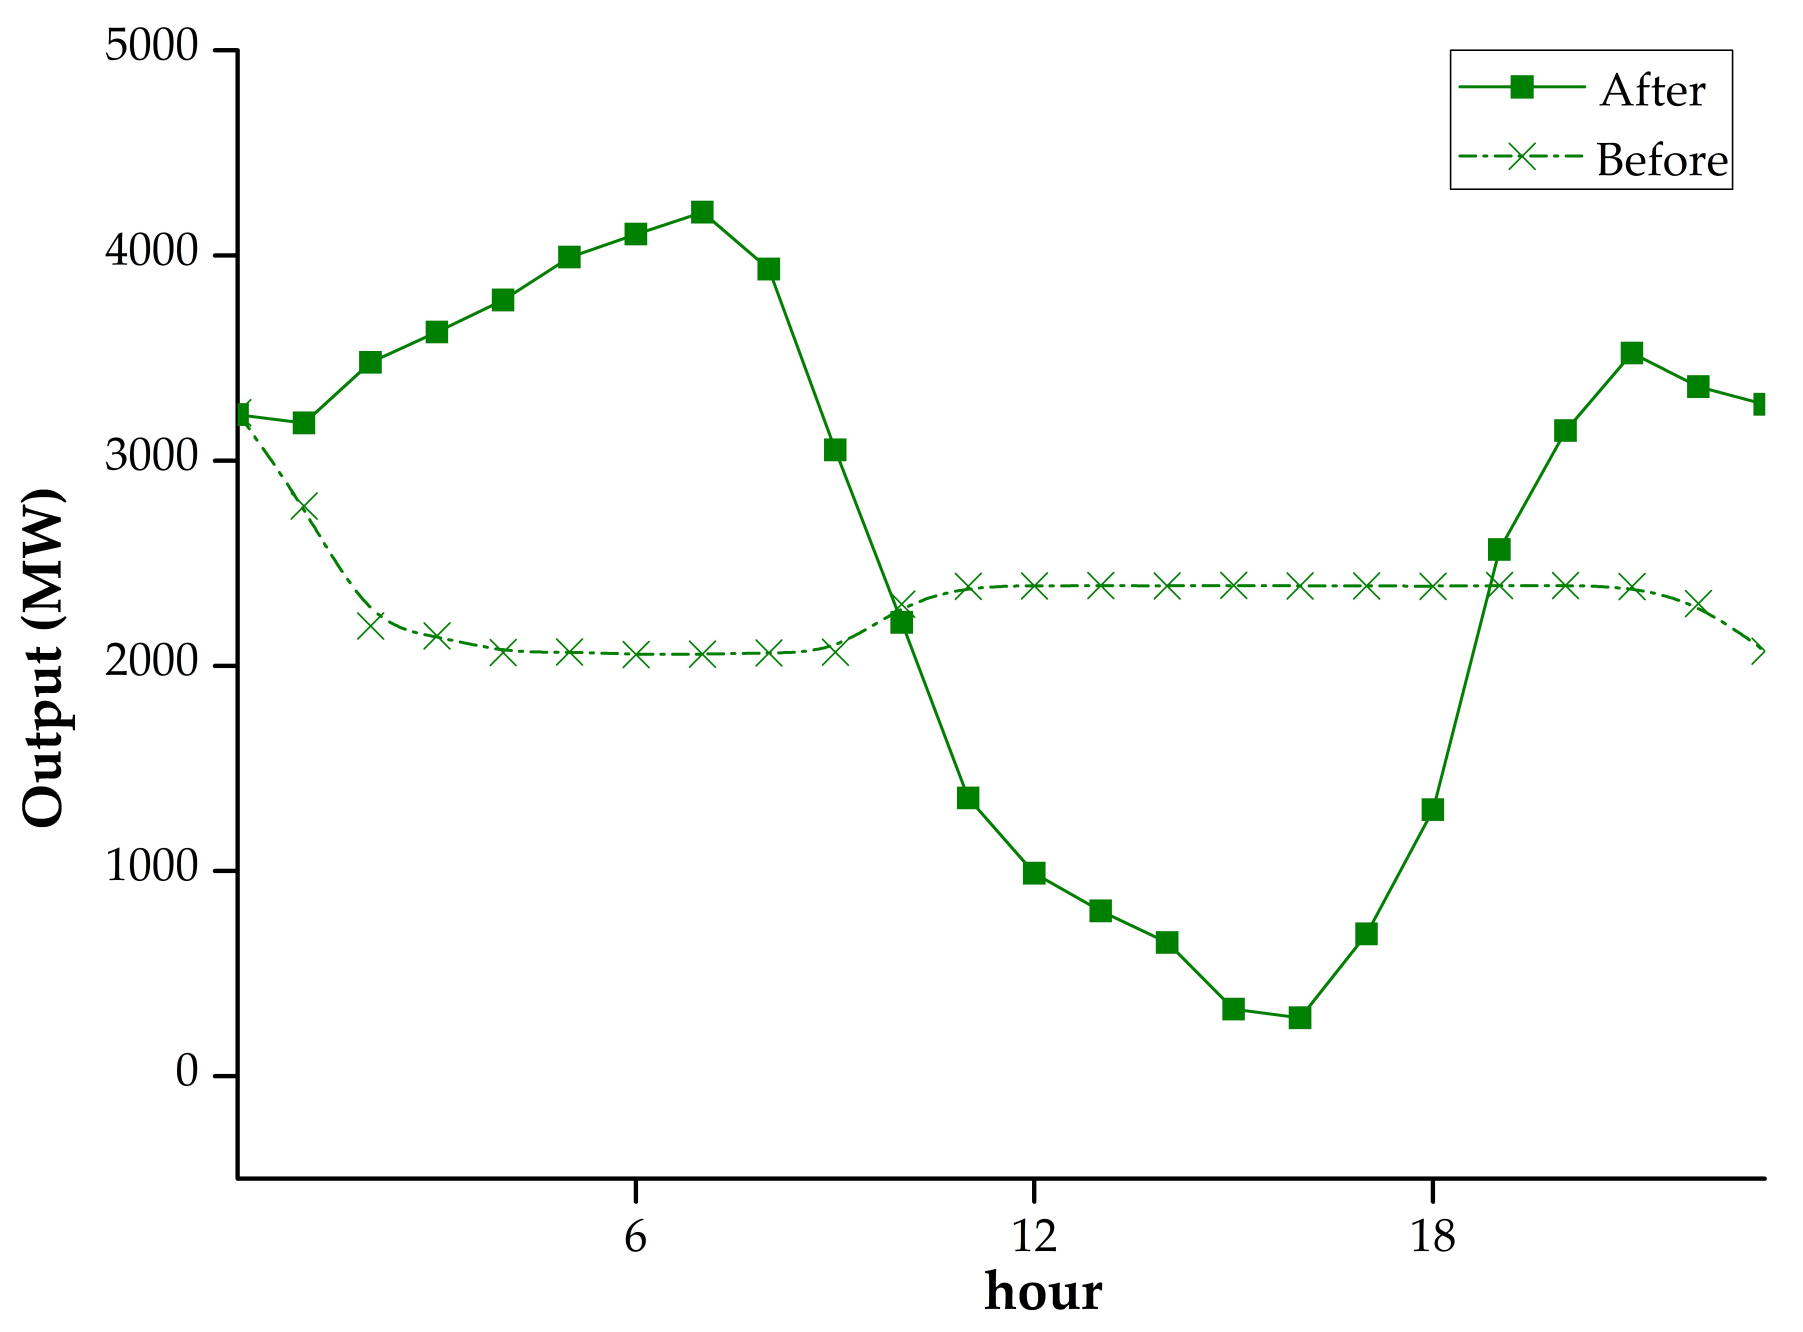
After complementary, the output process of the hydropower stations fluctuates obviously, leading to its discharge flow fluctuations. The cascade hydropower stations total output processes before, and after, complementary are shown in
Figure 9 and
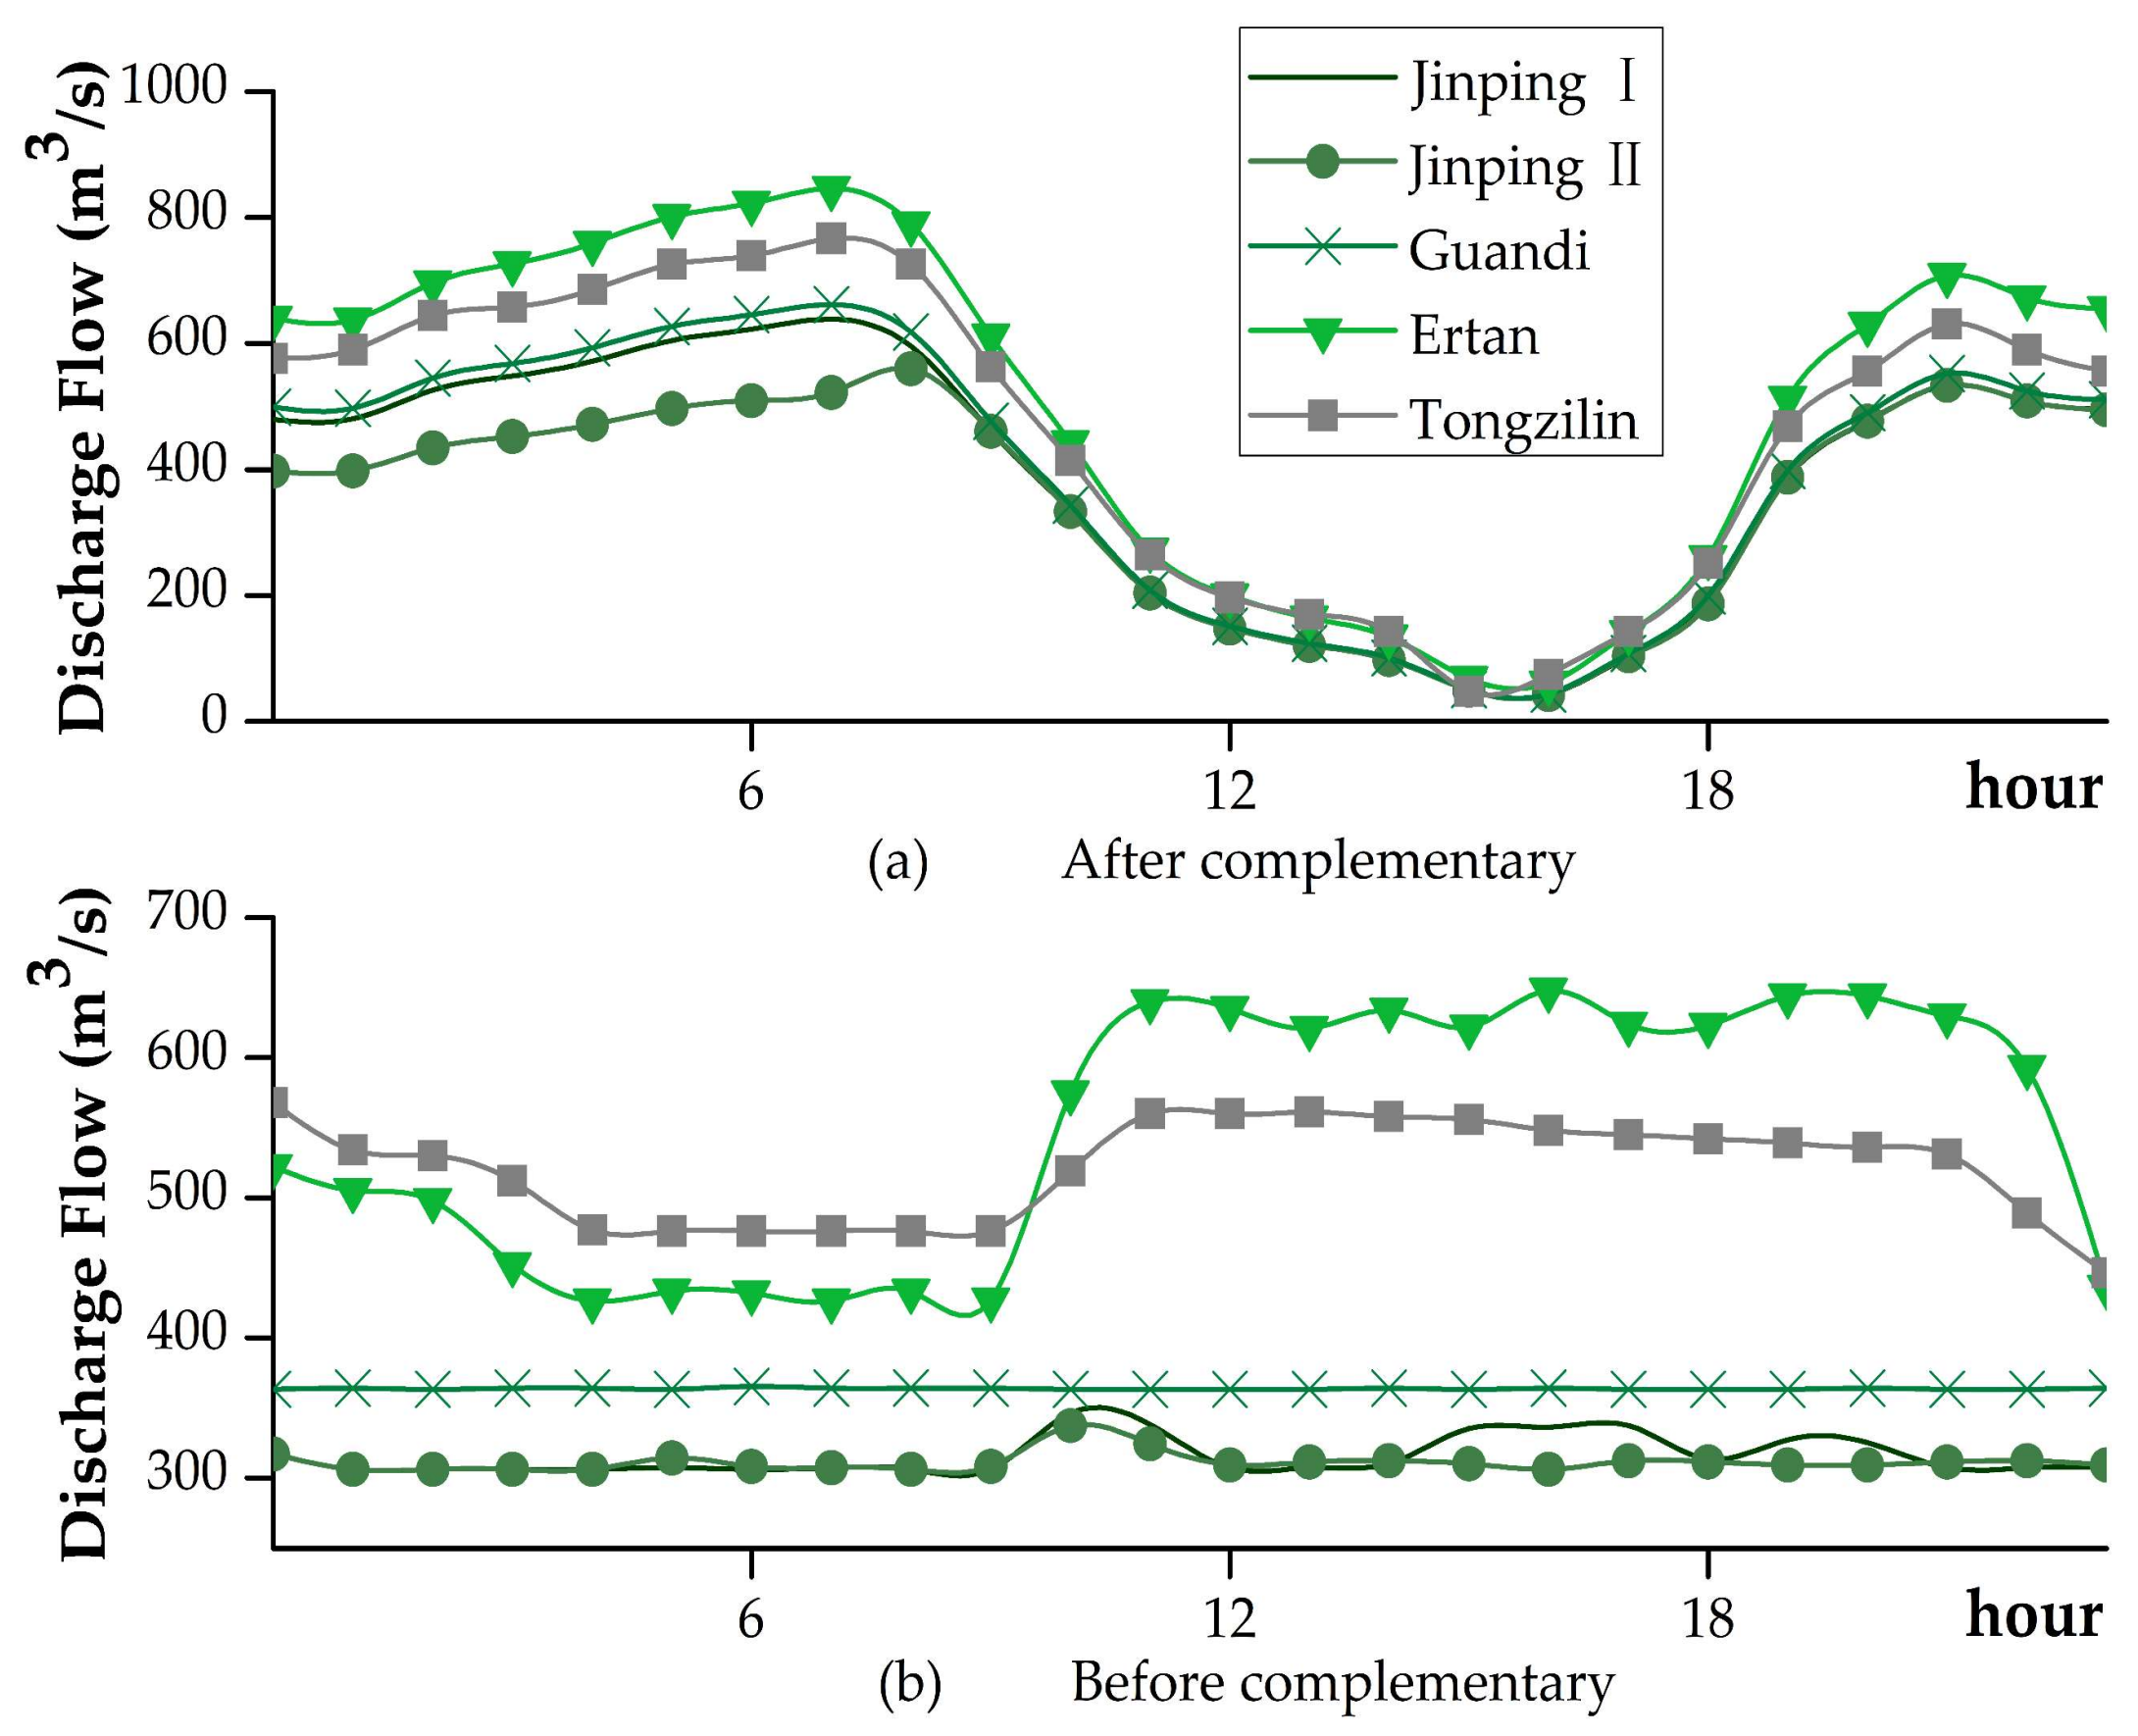
Figure 10, and the discharge flow processes before, and after, complementary optimization are illustrated in
Figure 11 and
Figure 12.
Comparing
Figure 9 and
Figure 11, the acceptance of wind power and photovoltaic power makes the original stable output process unstable and the variation of the five power stations discharge flow process almost the same. In the afternoon, the power plants mainly store water energy, and the discharge flow decreases to a minimum of 50 m
3/s; however, during morning peak and evening peak of electricity consumption the outflow increases significantly to supplement the lack of wind and photovoltaic power. The whole discharge flow reduces slightly after the complementary optimization.
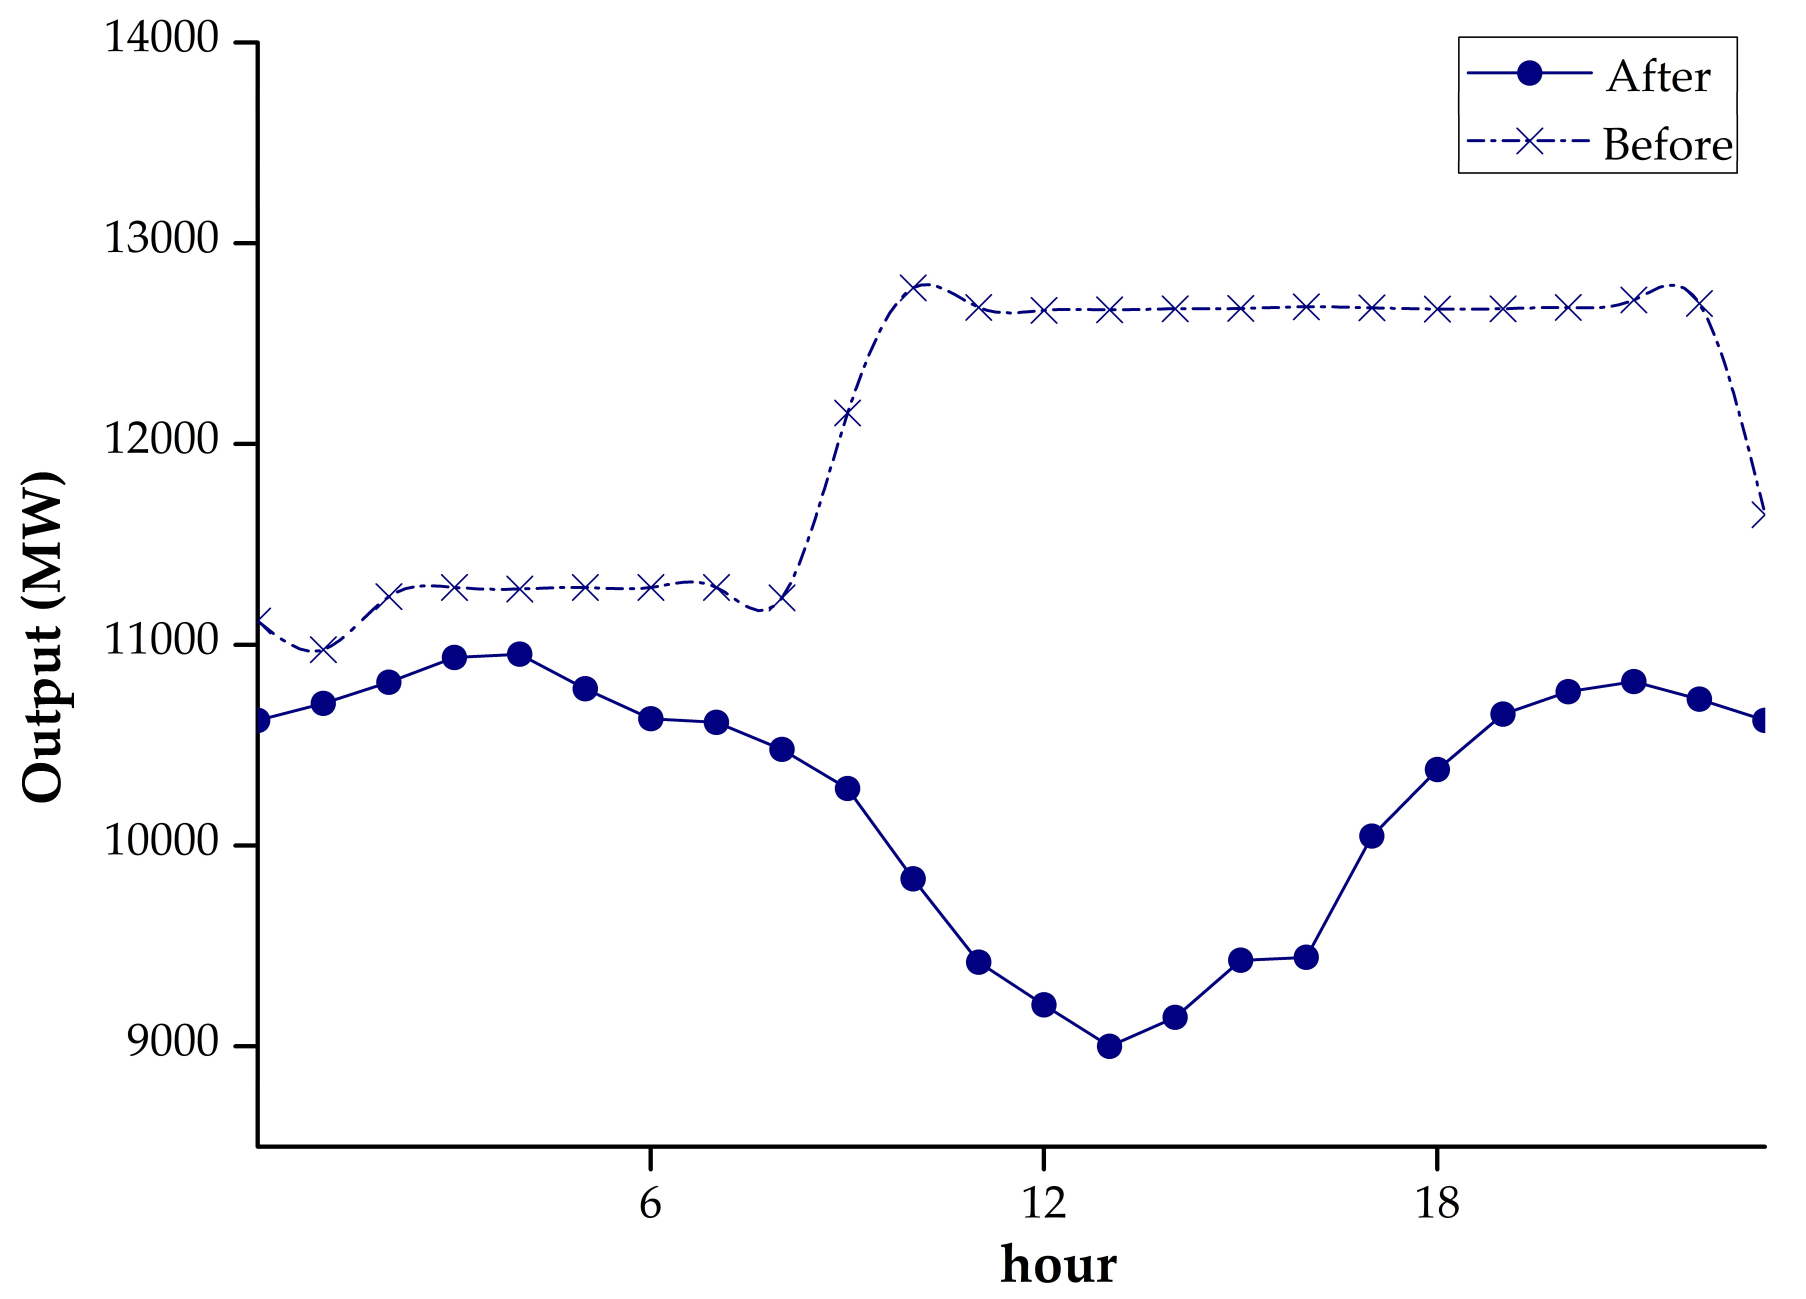
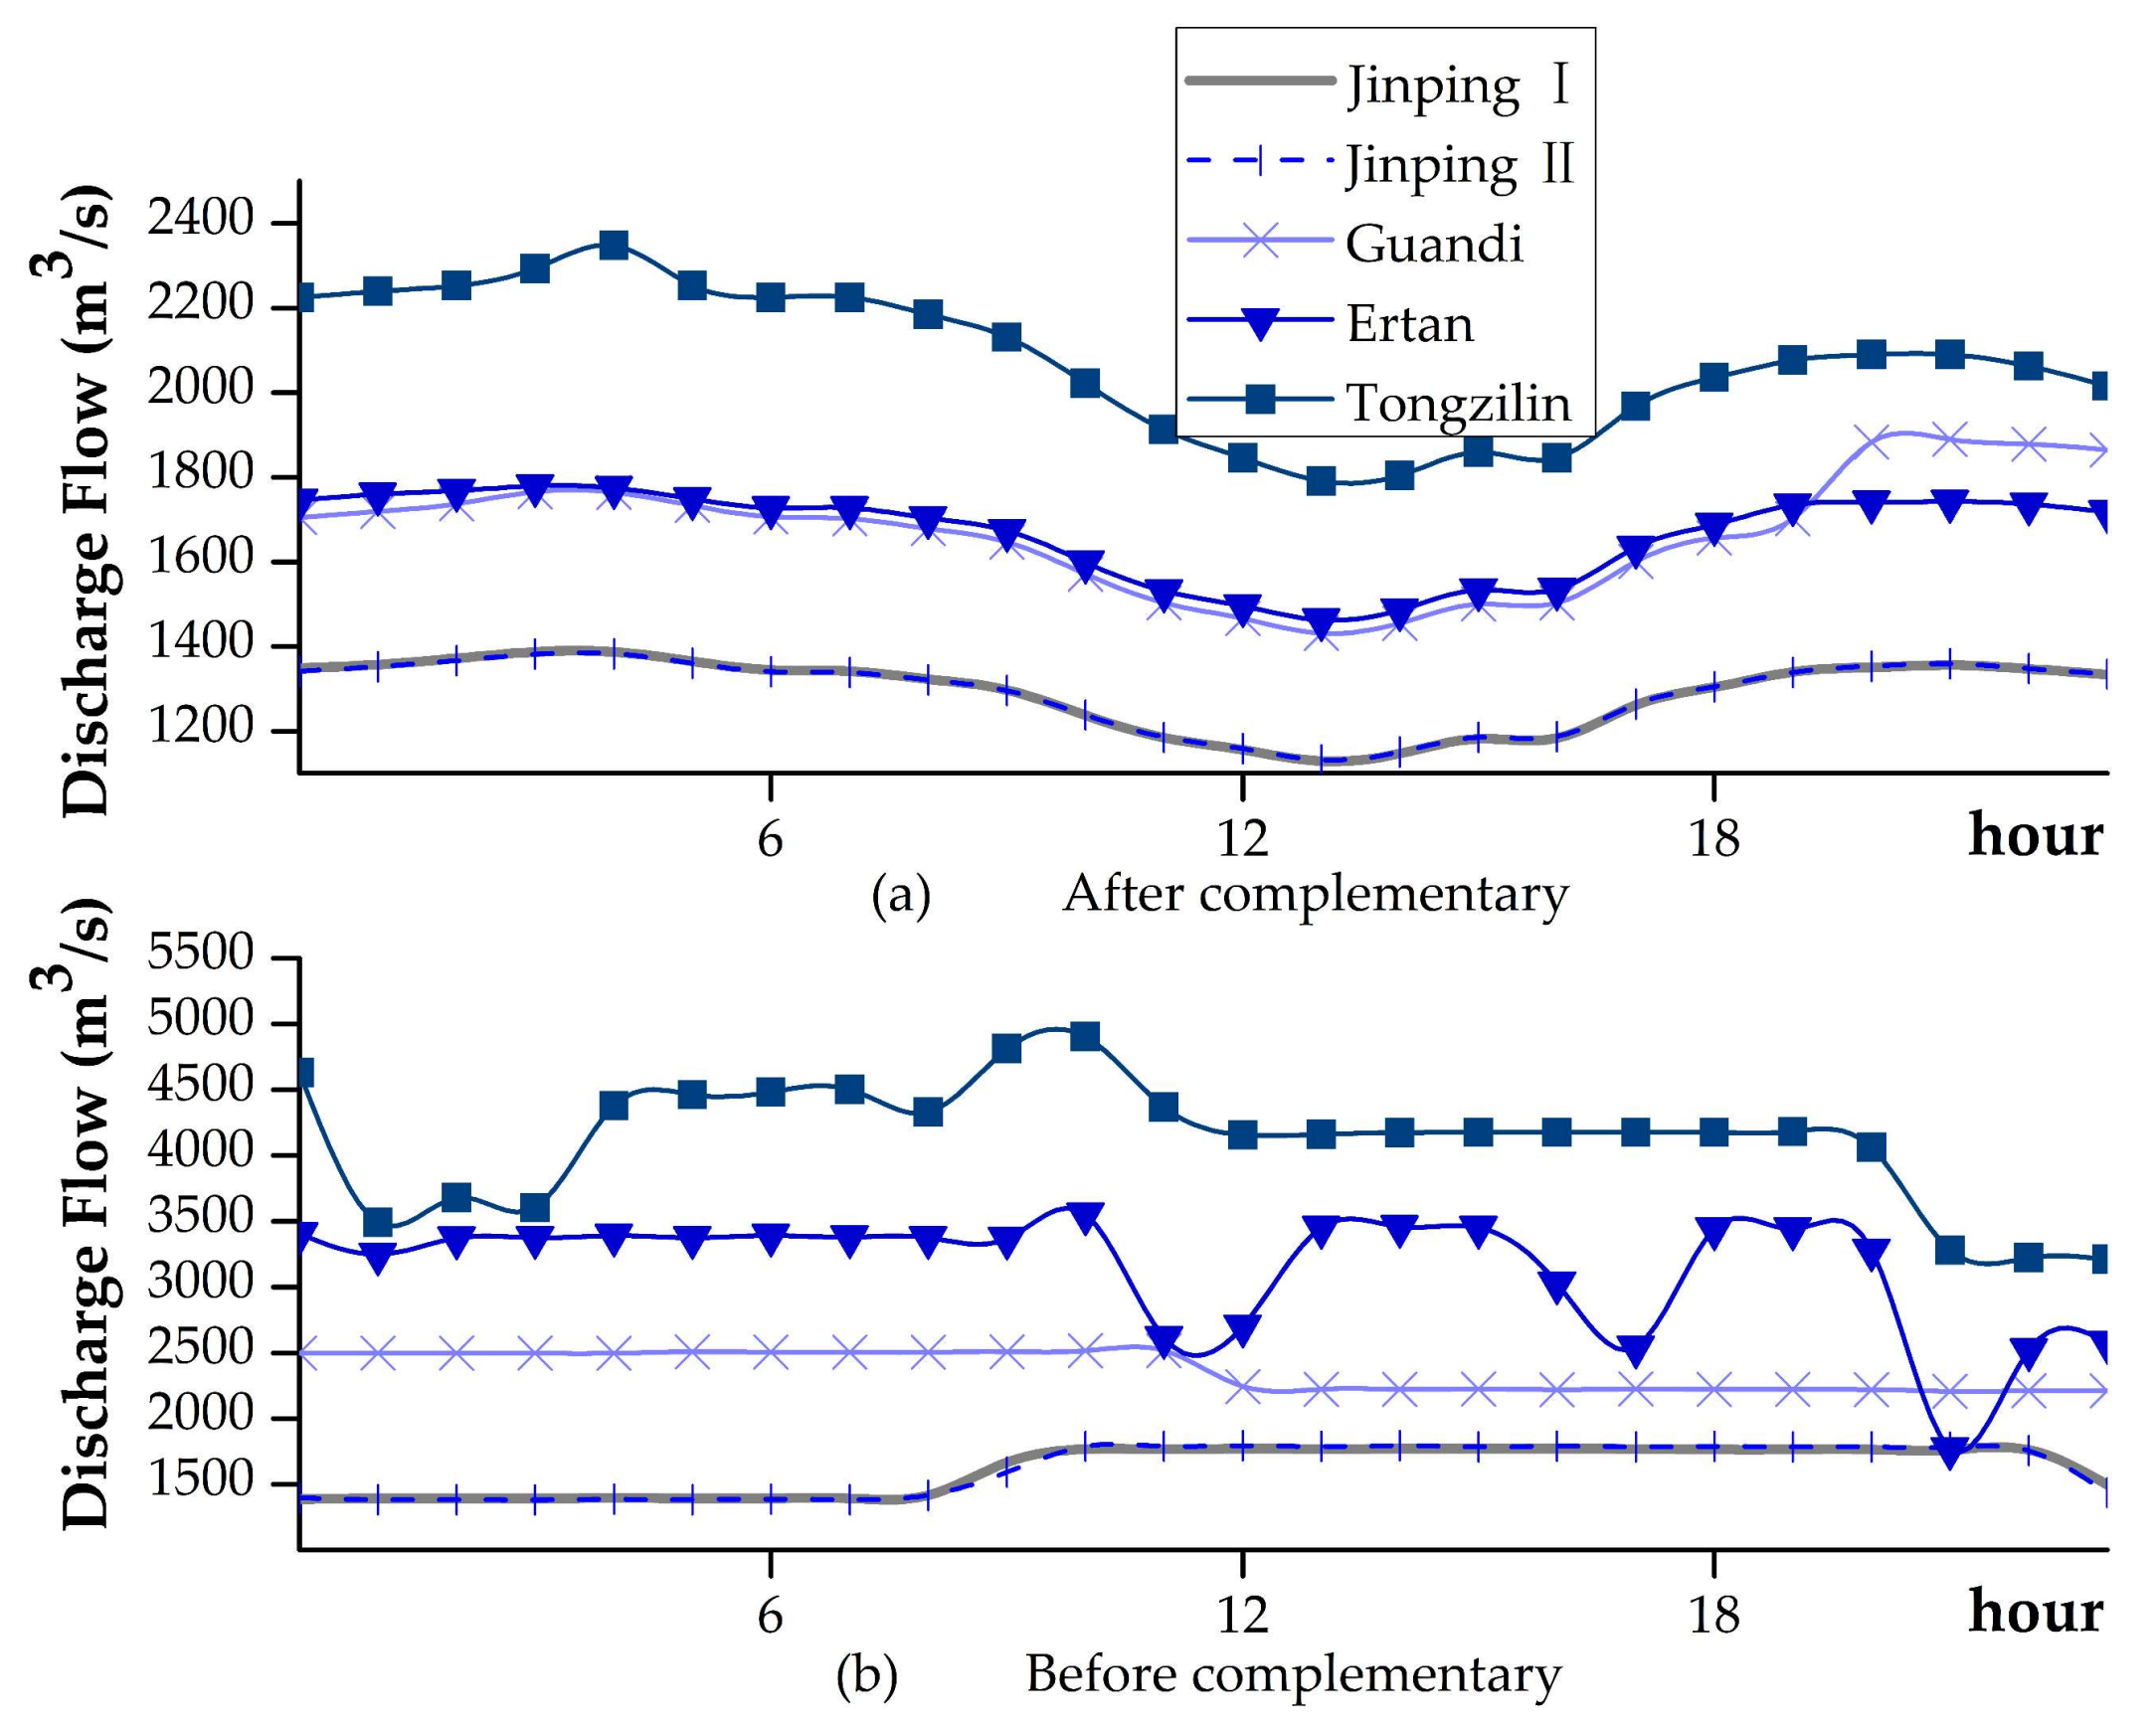
Differing from the dry season, there is more inflow and uncertainty during rainy Autumn days. In addition to daily power generation, hydropower stations also need to ensure flood control measures, so the discharge curve of the original discharge is relatively volatile. From
Figure 10 and
Figure 12, it may be seen that after the wind power and photovoltaic power are accepted, the discharge flow curves of the cascade hydropower stations become relatively flat, with a slight decrease in the depression trend only occurring at midday. For the order of magnitude, the total output after complementation is greatly reduced because part of the inflow is stored in reservoirs to increase cascade energy storage.
From
Figure 11 and
Figure 12, it is found that there are certain rules for the discharge flow changes in cascaded power stations. Before complementarity, the discharge flow from the five power stations fluctuates, but the trend becomes similar under complementarity conditions. This is because, when there is no complementarity, hydropower alone undertakes the task of power generation. The two power plants, with annual adjustments thereat, are mainly responsible for power regulation at peak- and low-power usage and their output processes fluctuate significantly. The output of the other three power plants, without regulation, will be relatively stable. Under conditions of complementarity, according to the constraints and the objective function used here, the sum of the output of the three power sources is a fixed value in each period, and as much wind, and photovoltaic, power as possible are required, therefore, in a day when wind power and photovoltaic power are abundant, hydropower is limited so that the output is reduced, but when wind power and photovoltaic power are reduced at night, hydropower output will increase. In addition, due to the addition of wind power and photovoltaic power, the amount of electricity generated by hydropower itself has decreased, which has led to a reduction in the power regulating burden imposed upon regulatory power plants. As a result, the output process difference between power plants with regulating performance and power plants without regulating performance has been decreased which is why, after complementarity, the dispatch profiles are nearly identical.
The same conclusion can be drawn from the changes in water level: from
Table 4, it can be seen that the water level at the end of each power station is slightly greater than that before complementary optimization. To absorb wind power and photovoltaic power, hydropower inhibits its own power generation to some extent, reducing the amount of power generation, but it does not pose a safety issue for its operation. The increase of water level remains reasonable and controllable, and the reduced discharge flow will not pose a threat to the basin environment.
6.3. Economic Aspects
Besides the problem of technology and resource utilization, it is also necessary to consider the economic interests of power generation enterprises. At present, as far as the power generation end is concerned, the prices of wind power and PV power are uniformly formulated by relevant departments in China, and they enjoy certain subsidies, and the prices are much higher than the price of hydropower. The full amount of electricity is guaranteed, and the grid receives all thereof. Hydropower price is more complicated to formulate, and is mainly divided into two types: “planned electricity” and “market electricity”. The planned electricity price is the same as the on-grid electricity price, and the other electricity generators participate in market competition. With different trading methods used to participate in the market, electricity prices will be different. For example, there are centralized bidding, listing transactions, contract transfer transactions, and retention of electricity conservation policies in place.
In Sichuan Province, the latest published on-grid price in 2018 is shown in
Table 5. The prices of wind power and photovoltaic power are much higher than that of hydropower. Although there are government subsidies and related supporting policies, it cannot change the fact that wind and photovoltaic prices are not competitive.
Realizing wind-photovoltaic-hydro complementarity operation in the downstream reach of Yalong River, little economic benefit can be foreseen. First, wind power and photovoltaic power generation are regarded as newly-added units of hydropower stations, which rely on existing transmission channels used by the hydropower stations to solve the grid-connection problem. This avoids the decentralized access of wind power and photovoltaic power plants, the different progress of single project delivery channels for construction and other defects with the result that, it saves transmission costs and accelerates the development of new energy resources. Especially in the dry season, hydropower output is small, but wind power and photovoltaic power access cascade hydropower station transmission channels, thereby improving the efficiency of the use of the delivery channel, which is undoubtedly a good thing for the overall income of power generation companies. In addition, wind-PV-hydro complementary operation improves the power quality of both wind, and photovoltaic, power. The smooth power output will improve its competitiveness and helps wind power and photovoltaics expand their market share; however, changes in market electricity prices after wind-PV-hydro complementary operation may become more complicated. In this regard, further research is warranted.

