1. Introduction
The search for development increasingly brings the current scenario closer to natural resources depletion for electric power generation. Energy plays an important role in the civilization evolution, but its consumption causes harmful effects on the planet, causing air pollution, carbon emissions, global warming and ecological damage [
1]. Therefore, there is a need to find sustainable solutions capable of dealing with the political, economic and environmental challenges involved in the electricity generation [
2]. In this context, global development strategies have been directed towards the renewable energy use, which in addition to reducing emissions gradually becomes economically viable [
3,
4].
The renewable energy promotion is one of the main energy policies of the European Union (EU) [
5]. In addition, intelligent network strategies target technologies, systems, and solutions to provide, host, and use up to 100% renewable energy sources [
6]. As a result, renewable energy is expected to grow at a rate of 2.8% per year, totaling approximately 30% of the world’s electricity generation by 2040 [
7]. Among the renewable energy options, Photovoltaic (PV) systems have come to lead public and industrial awareness in sustainable and renewable energy sources, which are alternatives to fossil fuels for electricity generation [
8,
9,
10,
11]. In 2016, 75 GW of solar photovoltaic capacity was installed worldwide, equivalent to the installation of more than 31,000 solar panels every hour, totaling 303 GW by the year’s end [
12]. In the Brazilian context, scenario of this research application, investments in modern renewable energies have been increasing quickly in recent years since hydroelectric energy is finding its saturation. One of the favorable reasons is that the Brazilian energy matrix is predominantly hydroelectric, which is very sensitive to droughts, reducing reservoir water storage levels; events occurred in 2001 and 2015 [
13,
14].
According to data from the Brazilian Atlas of Solar Energy [
3] the global solar irradiation values incident in the Brazilian territory (1500–2500 kWh/m²), whose highest irradiation of 6.5 kWh/m
2 is much higher than the values of most European Union countries. Brazil has a large proportion of sunny days, ideal radiation intensity and a large geographical area [
15]. Due to this, PV energy is bringing diversity to the Brazilian energy framework. In view of the investors’ potential attraction, the expansion of photovoltaic solar energy uses in industries, residences and the internal market development allow to glimpse an important role in the energy matrix for this technology type [
16].
Given this scenario, in order to obtain a competitive advantage and defend strategic positions in the market, it is necessary that managers in the energy sector know and understand the actors’ dynamics in the business and structural spheres permeated by indicators capable of measuring their specific reality [
17]. There are several measurable aspects related to the performance of solar generation [
18], among them, the competitiveness of the PV plant. In order to manage the competitiveness, we need Performance Measurement Systems, which consist of a set of metrics used to quantify the efficiency and effectiveness of an organization’s actions [
19,
20]. To measure performance, the concept of Key Performance Indicators (KPIs) can be used. KPIs are a set of measures focused on aspects of organizational performance that are most critical to the current and future success of the organization [
21,
22]. However, after defining the KPIs, it is necessary to model a measurement structure. This structure should consider the weight each KPI has on the target performance and the relationships between the KPIs. Then, the Performance Measurement System was built based on the hierarchical structure of Hierarchical Process Analysis (AHP) [
23]. The weighting of the KPIs was made based on the AHP criteria weighting method [
23,
24,
25].
Furthermore, the systemic monitoring of competitiveness becomes determinant for this market advancement. The competitive diagnosis is the identification of the performance of the PV plant in a cut of time, referring to strategic posture, corporate management, organization culture, marketing, finance, research and development, operations and logistics, human resources, systems information, opportunities and threats, evaluation and control [
26]. Thus, it can be seen that PV energy generation is embedded in a globally competitive environment, a characteristic that forces PV power plants to perform most processes relevant for its competitiveness with maximum efficiency. According to a research carried out in Cordoba, Spain [
27], improving the profitability of photovoltaic installations requires optimizing their production, thus reducing their costs and increasing plant lifespan. Moreover, it was not found in literature some computational tools of management scope that are able to assist in the identification, measurement, and analysis of these performance indicators. With this motivation and with the objective of complementing the study [
28] in the management sense, the construction of mathematical modeling sought to measure the organizational competitiveness of PV power plants in operation. Hence, the main contribution of this manuscript was the development of a computational tool (see
Supplementary Materials) to present graphically the level of competitiveness in PV power plants based on performance indicators, guaranteeing its easy applicability.
2. Material and Methods
For the proposed objective, the methodological procedure was conducted in five stages, according to
Figure 1.
First step intended finding theoretical basis for the construction of the research instrument and the development of the proposed computational tool. This stage was carried out by research on books, scientific articles, and technical notes regarding solar photovoltaic energy.
Second step contemplates the survey of the Key Performance Indicators (KPIs). It was carried out based on the theoretical reference and the readings referring to the scenario of the photovoltaic energy in Brazil and in the world. The relevant KPIs to the competitiveness of this sector were subdivided into two levels: Fundamental Viewpoints (FVs) and Critical Success Factors (CSFs). The indicators structuring was performed with the construction of the decision tree, where the FVs are part of the tree’s main structure and are deployed in the CSFs. However, competitiveness measurement and the construction of the decision tree were elaborated from a survey about indicators. In order to do this, two electronic forms were built on the Google Docs platform and applied to managers of companies with Solar PV Plants: (1) Form to collect data that fed the instrument and served to identify the level of competitiveness of each Solar PV Plants evaluated at that time; (2) form to collect the importance assigned to each indicator according respondent point-of-view. From the two forms the instrument suitable to apply elements of the Hierarchical Process Analysis (AHP) methodology, described in [
28] was structured, in the construction of the results.
The fourth step was the development of the research instrument in a computational tool, which was applied to four selected Photovoltaic Systems to verify its usability. The tool was applied in three different business models for photovoltaic power generation: Two Power Plants, Industry and the Research Center. The initial objective of the researchers was not the volume of application, but the verification of the flexibility of application of the indicators in different business models.
The final step of this research comprises analysis and discussion of the results. Here, it is verified if the obtained results satisfy the research problem defined in the introductory section. In addition, the limitations are analyzed and suggestions for future works are given.
3. Features Included in Computational Tool
3.1. Construction of Modeling for Competitiveness Measurement
From exploratory research on the current context of photovoltaic energy, in the national and international scenario, in addition to bibliographical and documentary research and readings of scientific articles, technical notes and academic works on solar energy, it was possible to identify elements capable of shaping competitiveness in the generation of photovoltaic energy.
Afterwards, the selection and grouping of the identified elements was done based on the synergy and relevance of each approach. Research has fundamentally highlighted some specific points for the development and consolidation of photovoltaic energy. It was observed that the elements identified in the reading of the materials were aligned around four Fundamental Viewpoints (FVs): (1) Strategic alliances: evaluate the level of interaction of the Solar Power Plants with the other stakeholders; (2) Management and Strategic Processes: measure the performance of plant’s internal operations; (3) Innovation in Photovoltaic Power Generation: Evaluate the performance of the plants as innovative organizations, mastering the technology used as well as prospecting for future scenarios; and (4) Monitoring of Photovoltaic Generation: Measure the state of conservation of installed system as well as monitoring economic and financial oscillations which are relevant to PV energy sector. The performance indicators used to quantify the technical monitoring points of Photovoltaic Generation were based on the software S·lar2 [
27].
The CSFs were identified based on these four FVs as well as in other information collected from the applied instrument. These CSFs and FVs were subdivided into the respective KPI, as shown in
Table 1.
With the objective of validating the indicators and increasing the reliability of the modeling, it was analyzed by a neutral evaluator who possesses systemic knowledge of the sector. In order to do it, Photovoltaic Solar Energy professors from the Group of Power Electronics and Control (GEPOC) of the Federal University of Santa Maria reviewed it. In this step, a material containing the details of the research and the proposal of indicators was sent for validation. From this validation, the construction of the evaluation instrument could be started.
As shown in
Table 1, each CSF has a grouping of KPI that has a measurement purpose. For the construction of the proposed instrument, 40 Performance Indicators were grouped into 26 Critical Success Factors (CSFs) and 4 Fundamental Viewpoints (FVs).
For the schematization of the information in
Table 1, the Decision Tree was constructed (
Figure 2), where the hierarchy and the interrelationships between the Fundamental Viewpoints can be visualized in a better way.
From the definition of the CSFs, which was done during the initial research section, it was performed the quantitative construction of the performance indicators and evaluation scales to measure them. The first step was to describe an evaluation concept for each CSF. This concept had the objective of accurately delimiting the scope of each CSF, thus reducing the likelihood of dubious interpretations that could be generated by the research respondents. Subsequently, each CSF was deployed in five possible response levels (N1, N2, N3, N4, and N5), making use of the five-point Likert scale concept, where in each case level “N1” corresponds to the situation considered as the most favorable for competitiveness, while the level “N5” corresponds to the worst possible situation. The midpoint “N3” refers to the overall average performance of the sector.
Additionally, the instrument asks respondents the importance they assign to each indicator. This information is used to calculate the substitution rates and distribution of weights for each FV, CSF, and Performance Indicator. This allows applying elements of the AHP method to create a ranking of importance among the indicators. From this analysis was constructed a scale of relevance for each indicator, where the respondents indicate an alternative from 1 to 9, where 1 corresponds to the alternative “No Importance”, 5 to “Medium Importance” and 9 to “Very High Importance”. Then, the proposed research instrument follows the structure of
Table 2.
The
Table 2 shows an example of the instrument structure for the indicator grouped in CSF 1.1, which belongs to Fundamental View 1: Strategic Alliances. Hence, all 40 KPIs represented in the decision tree follow the same structure as in
Table 2, totaling an instrument with 40 questions. It should be noted that all indicators are composed of the location number of their position in the Decision Tree, name of the indicator, evaluation levels, description of alternatives, and value of each level in percentage. Therefore, each question is composed of a double collection. The decision maker initially responds to the situation of his company and, later on, the level of importance it attributes to this CSF.
The return of the answered research instrument provides quantitative data for the proposed model to calculate the level of competitiveness of the Solar Photovoltaic Plant, besides allowing a diagnosis of the situation at the moment of data collection. The focus is to promote improvements of the indicators that present a greater relevance, in order to contribute more significantly to improve the global level of organizational competitiveness in the generation of photovoltaic energy. In addition to these results, it is intended with this proposed instrument to verify the relation of the competitive profile with the advances of the participation of photovoltaic energy in the energy matrix.
3.2. Computational Tool Development
Management practices developed through scientific research still face implementation difficulties in business environments. This fact, in part, is due to the need to provide more intuitive tools for this environment, through user-friendly interfaces. From this motivation, was built an electronic tool for assisting the practical application of proposed mathematical modeling. For that, a series of spreadsheets were elaborated, using Microsoft Excel
® software, named “
NIC—Generation of Photovoltaic Energy”. The initial screen of this tool, shown in
Figure 3, has four blocks: (1) Data Enter; (2) Results; (3) Attachments; and (4) Diagnosis of organizational competitiveness.
In the first tab of the graphical layout of the tool there are four buttons that give access to the forms built in the research instrument for data collection, being a screen for each FV. Thus, the user, by clicking on one of these buttons, is directed to another tab of the spreadsheet where the questions are, each one with the five levels of response distributed in alternatives, according to the research instrument.
Figure 4 shows the cutout of the screen to illustrate the flap of the FVs in the tool, which follows as an example the FV 1: Strategic Alliances.
Following the tool, the user should indicate a response for each question. The data processing is modeled in a tab of the worksheet called “
Interface”, in which are inserted all the mathematical and logical formulas necessary to quantify the replacement rates of each KPI. The second function table, called “
Results”, is designed to generate graphical reports of competitive performance in photovoltaic generation, using previously entered data, as well as replacement rates and the elaborated decision tree. The first report generated is a dashboard as shown in
Figure 5. This visualization allows a quick inspection of the competitive situation in the company’s photovoltaic energy generation, through speedometer graphics, in which the top presents the overall performance result and just below are shown the stratified competitiveness for each FV.
The presentation of results through the dashboard contributes to the visual management of the company’s Solar PV System, allowing managers to display it in murals or other channels of disclosure, facilitating the communication, dissemination, and evaluation of the indicators.
The construction of the mathematics of the dashboards was determined from the quantification of the indicators. Each of the performance indicators has a local replacement rate, equivalent to its importance, previously calculated from the completion of instruments by managers and validation by specialists in the area. With local replacement rates pre-established, one can then calculate the global rates, which represent the individual contribution of the Critical Success Factors and the Fundamental Viewpoints on the composition of the model as a whole. The representation of this modeling can be better understood by the example of
Table 3.
Above the level of the Fundamental Viewpoints is the global competitiveness result of photovoltaic energy generation, this result has a weight of 100% because it is the primary level of the decision tree, and its value is calculated through a function of additive aggregation of Foundational Viewpoints. Following the example given in
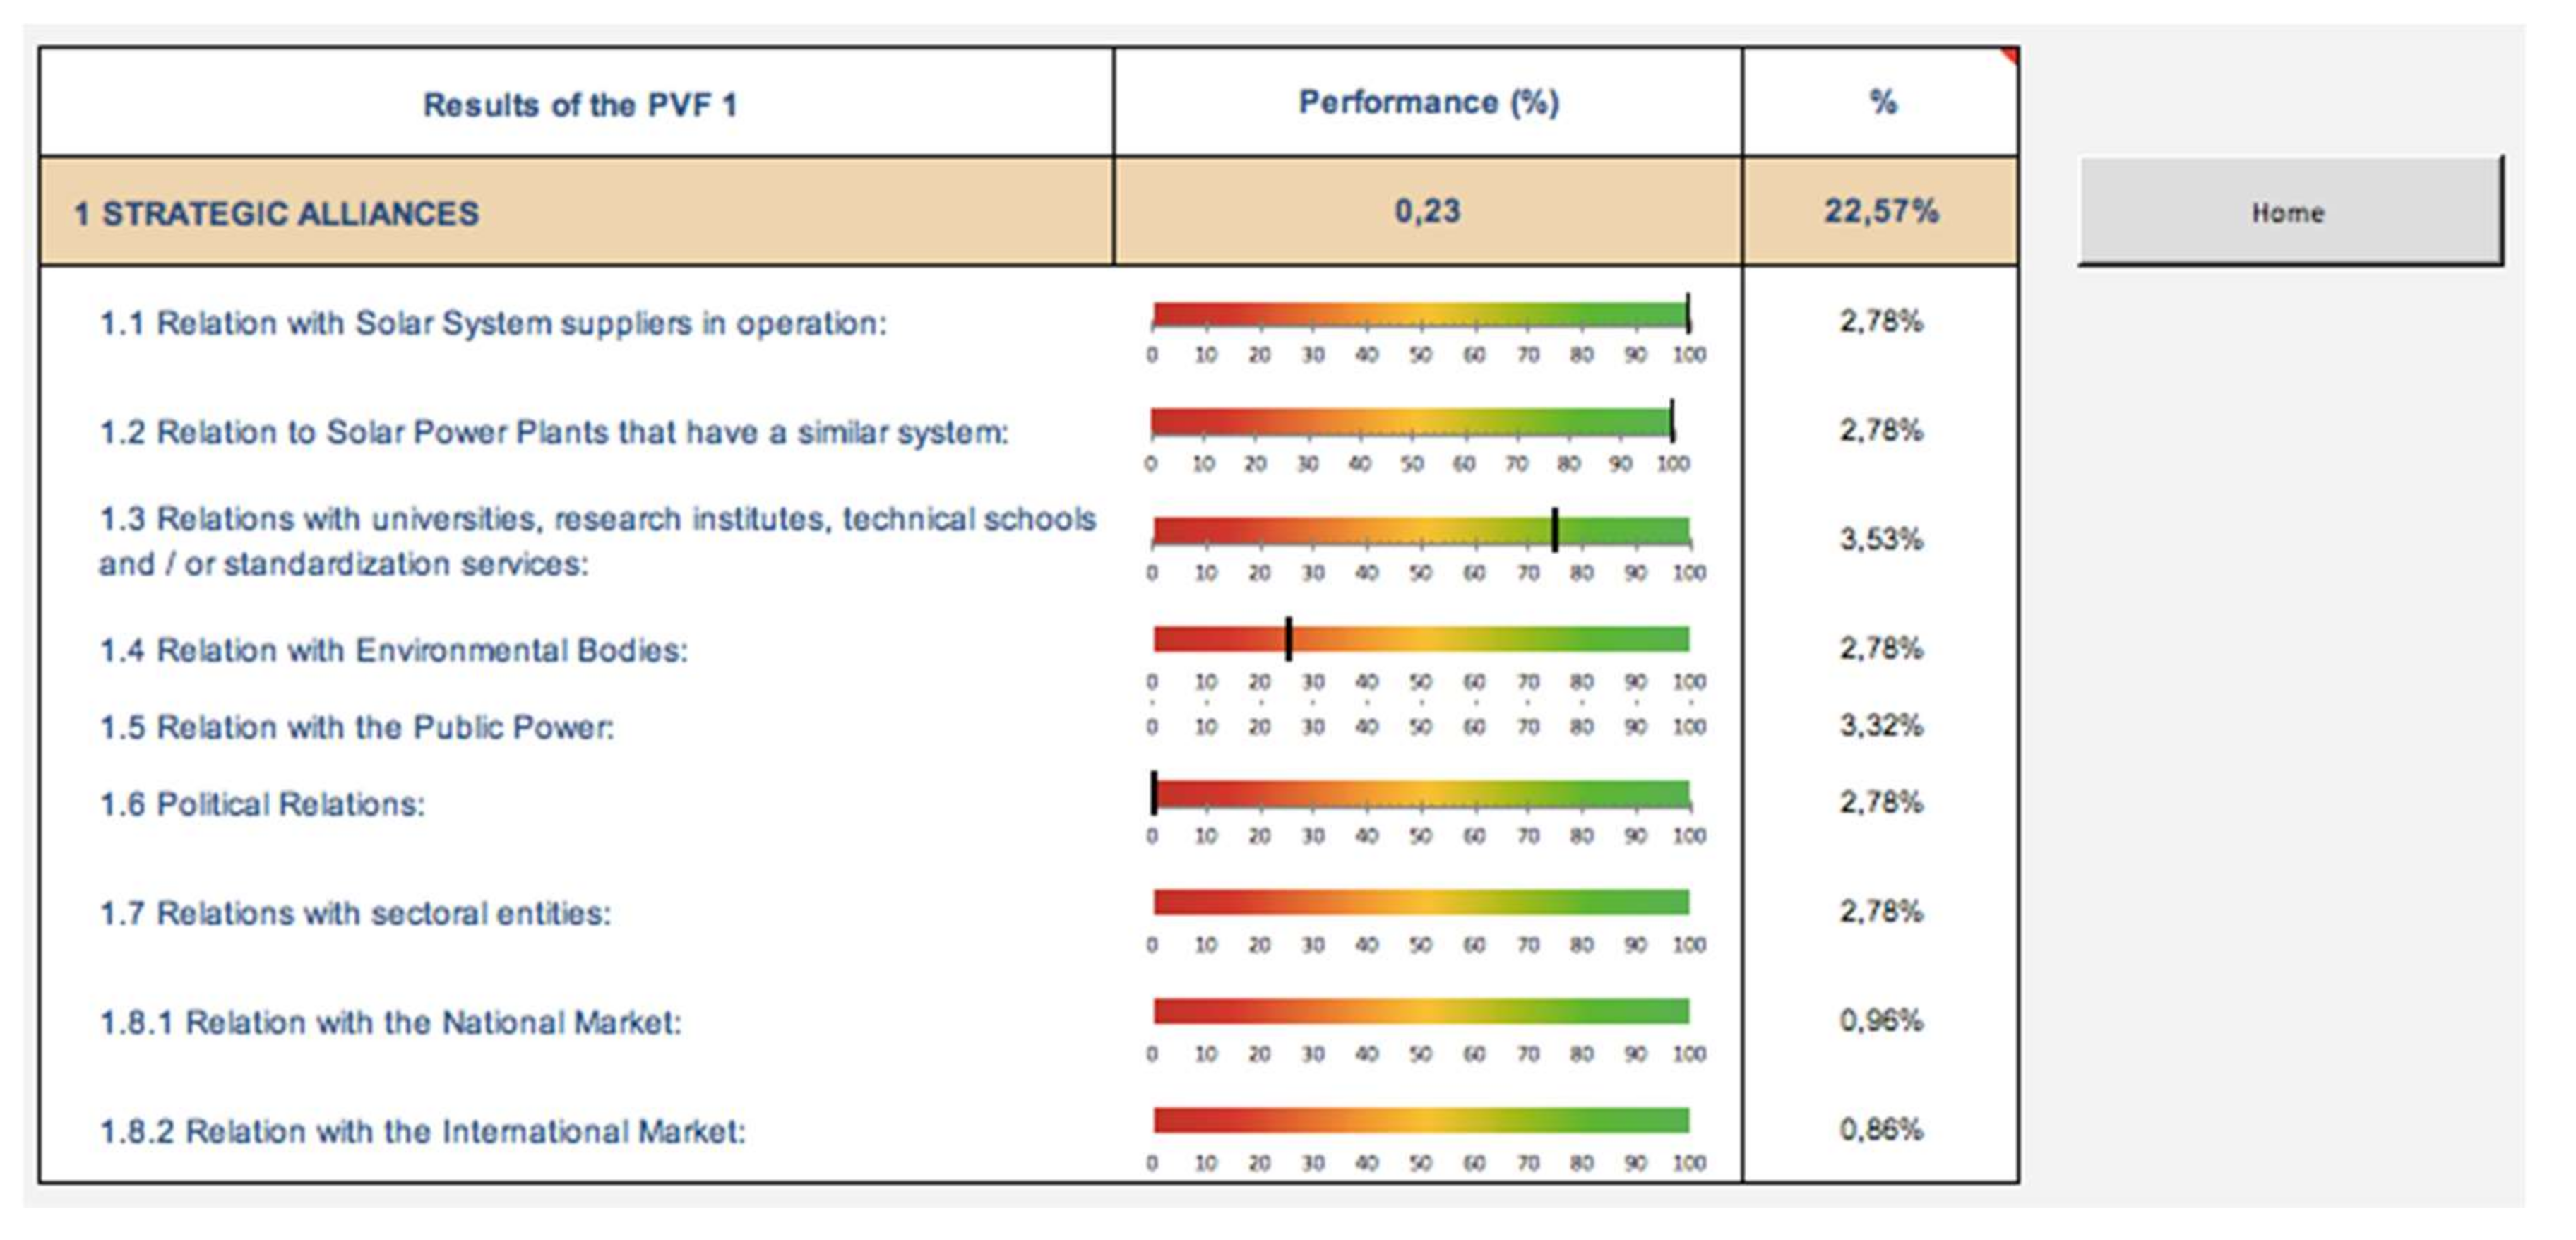
Table 3, the local rate calculation for each of the four Fundamental Viewpoints listed was: FV1 (22.57%), FV2 (25.58%), FV3 (25.97%), and FV4 (25.87%).
Other buttons related to block of results show the values obtained by the company in each of the FVs and in each indicator.
Figure 6 shows the results of the FV 1—Strategic Alliances.
The third block, called “Attachments”, presents information relevant to the modeling and tool construction. The “Hierarchical Structure” button consists of the decision tree, the “NIC-UFSM” button and the “Developers” button make up a brief description of the work done at the Núcleo de Inovação e Competitividade (NIC) of the Federal University of Santa Maria (UFSM) and the academic history of the authors of the research.
At the end of the computational tool presentation, the button labeled “Competitiveness Diagnostics” shows the overall performance of the organization under evaluation on the initial screen and also counts with an error alert in case any of the indicators have not been filled correctly, avoiding answers to be left blank and compromise the results final evaluation.
4. Application of the NIC-Generation Photovoltaic Power Tool in Photovoltaic Systems
The application phase of the tool was divided between the steps: (i) Data collection; (ii) Solar PV Plant diagnosis; (iii) Competitiveness evaluation, and (iv) Final report elaboration. The research instrument was submitted to: (1) Photovoltaic power plant located in the South of Brazil, with an installed capacity of 1 megawatt-peak (MWp), producing approximately 1.2 gigawatts-hour (GWh) of energy per year; (2) Solar Power Plant located in Northeast Brazil, which has 4680 photovoltaic panels to convert solar energy into electric, in an area of approximately 12 thousand square meters; (3) Industry, a manufacturer of electrical materials based in the South of Brazil, the company developed its own power generation project by photovoltaic system that showed efficiency of 80% in relation to the annual national average; and (4) Renewable Energy Research Center, located in Spain, which provides services and researches in six areas: wind, solar thermal, photovoltaic solar, biomass, energy in buildings and integration of renewable energies.
The directors of the companies that used the tool during the period of application did not suggest changes in the indicators and in the evaluation scales. Hence, there was no maintenance for correction in the modeling construction. During the diagnostic phase of competitiveness, a logic was presented for the formulation of adequacy actions in order to increase the performance of those companies that present the most unsatisfactory levels of competitiveness throughout the evaluation. In this way, it was possible to promote a conversation with the directors to carry out simulations visualizing the impact of the specific actions on the performance of the organization as a whole, contemplating the fulfillment of the tool to support decision making. Consequently, it is evident in this research the diversity of business segments of the companies in which the instruments for data collection were applied. The main objective of this tool was to measure the level of competitiveness of photovoltaic power generation in industries, solar power plants, and research centers, providing a range of information that includes the main indicators. In order to do so, the competitiveness evaluation involved obtaining quantitative results, acquired through the application of mathematical modeling, and its transcription for qualitative results, which represent a diagnosis of the company at the moment of data collection. The quantitative results were obtained by an additive aggregation function. It allows to calculate the global level of competitiveness of Photovoltaic Systems, considering the performance obtained in each indicator and its respective replacement rate. This function is demonstrated by Equation (1).
where
V(
β) is the global assessment of the competitiveness of the PV system,
V(
β)
{0 ... 100%} and
β {A, B, C ... Z},
Wi is the global replacement rate of CSF
i,
Wi {0 ... 100%} and
Vi (
β) refers to the performance of firm
β in CSF
i. In the same way as already presented in
Section 2,
i represents the index that indicates the position of the CSF in the hierarchical structure.
Table 4 shows four tracks were proposed to classify the level of global organizational competitiveness for the evaluation of the quantitative results and their consequent conversion into qualitative parameters.
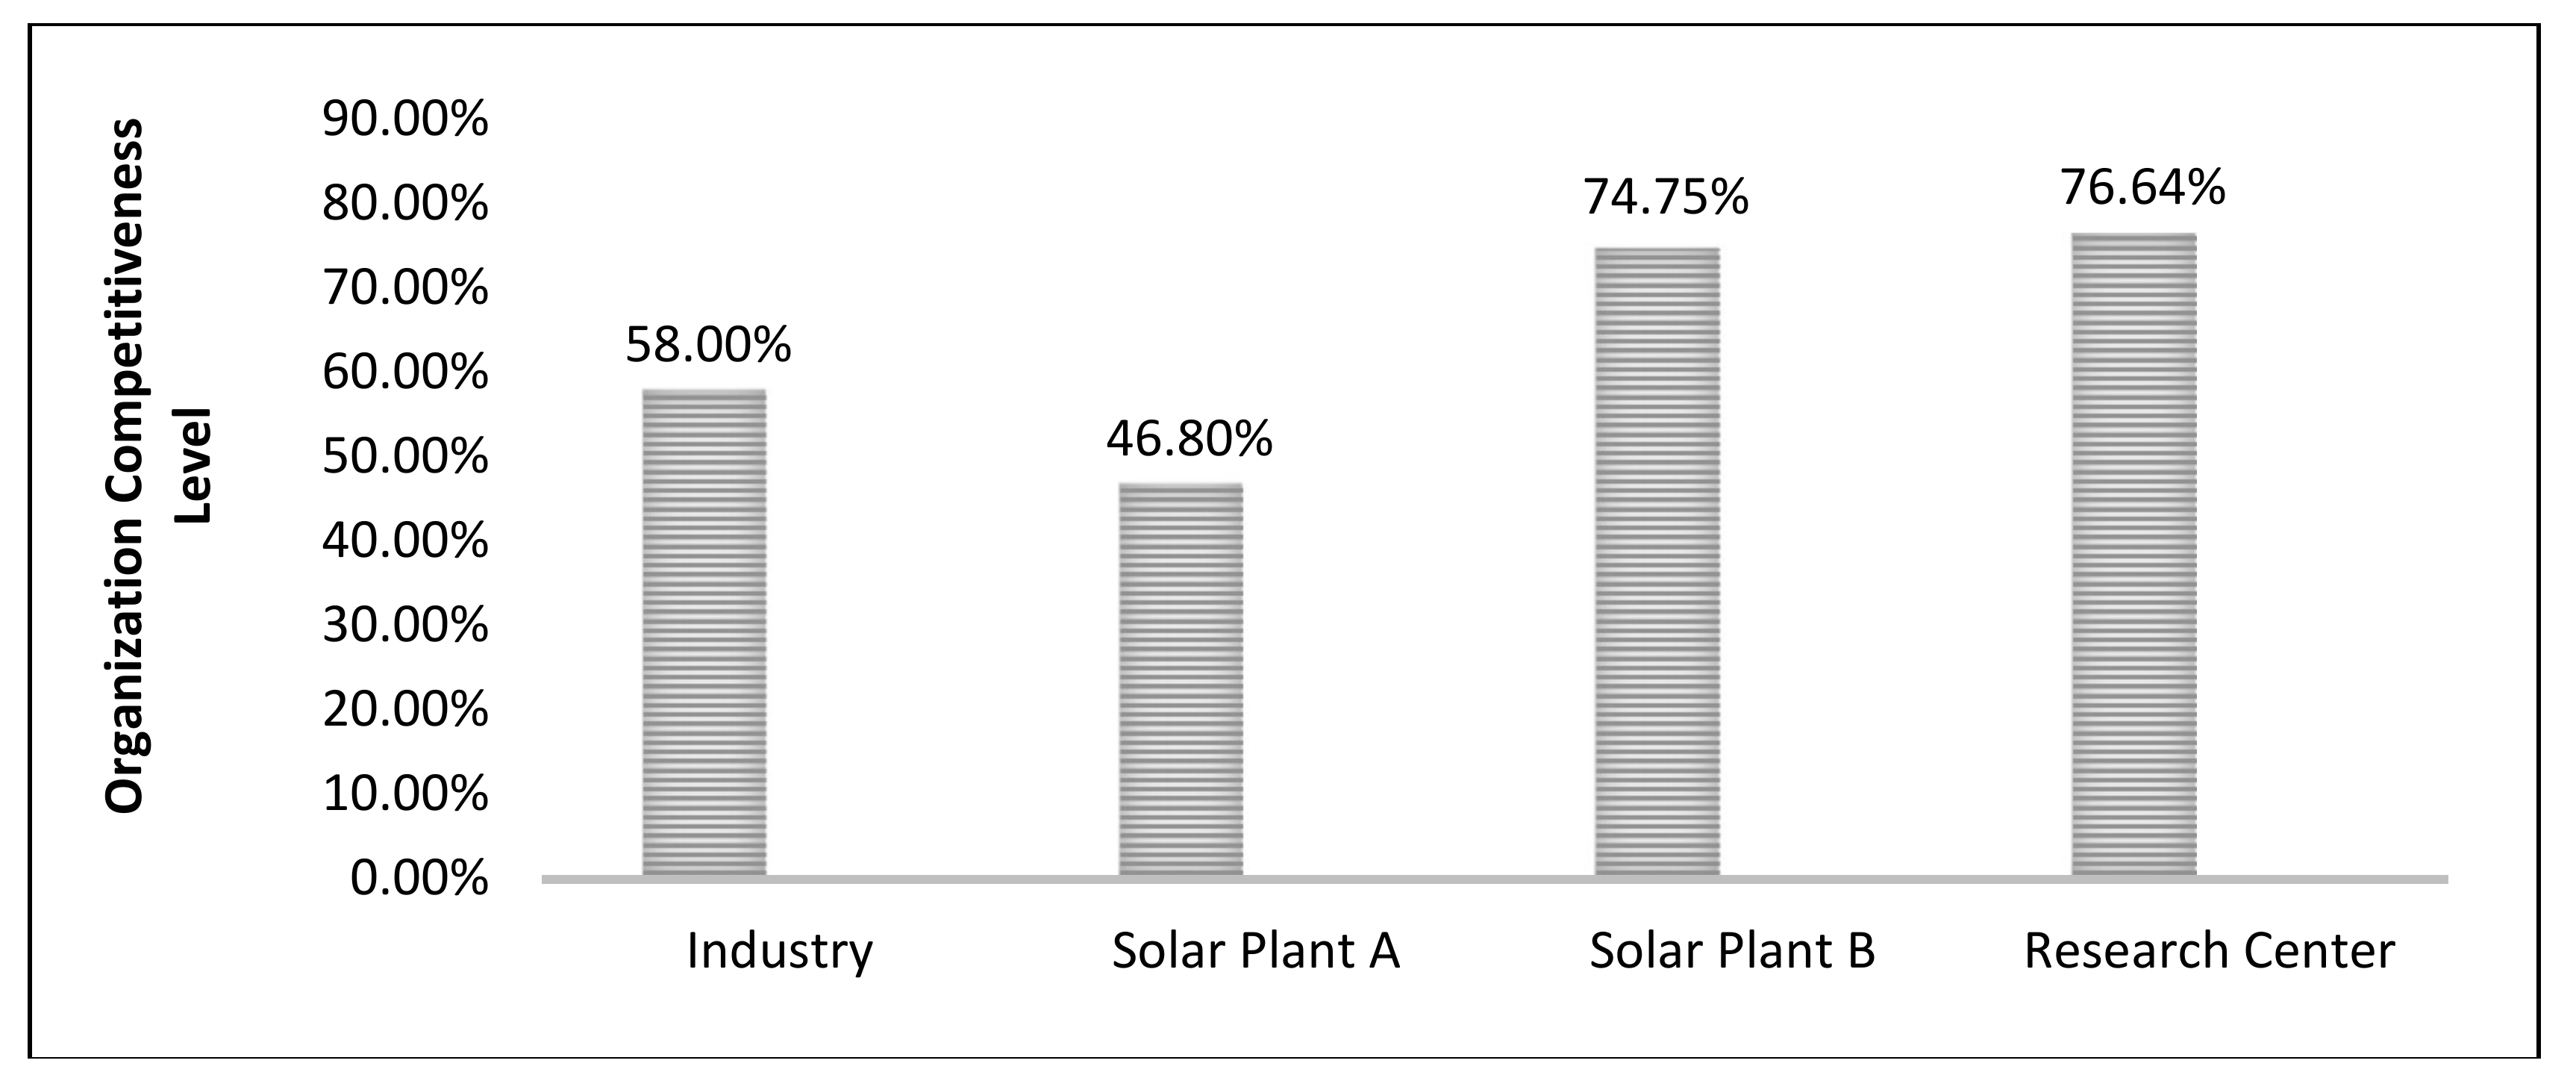
Results demonstrate that none of the evaluated companies was considered to be uncompetitive, as shown in
Figure 7: one is considered to be little competitive (46.80%), two potentially competitive (58.00% and 74.75%), and one fully competitive (76.64%).
The company considered to be “Full Competitiveness”, the Renewable Energy Research Center, located in Spain, has members with varying technical qualifications and its activities range from the study of photovoltaic cells to the completion of photovoltaic installations. In addition, the Research Center is also involved in international cooperation projects sponsored by the International Energy-Agency (IEA), which demands an organization’s management efficiency concern. The Solar Plant B presented a high level of competitiveness, being 0.25% below the percentage range considered “Full Competitiveness”. This high competitive degree is due to the fact that the solar system in operation is considered one of the first commercial scale photovoltaic plants in Brazil connected to the National Interconnected System. Similar situation was found in the Industrial PV System, which was within the range of potentially competitive companies, but presenting a percentage of 16.75% less than Plant B. It is noteworthy that the respondent industry has the smallest PV system in operation compared to the other companies participating of the survey. Nonetheless, the manager showed interest in the expansion of this system and presented high performance in indicators with high replacement rates.
With the proposed modeling, it can be seen that the results obtained do not allow a direct correlation between the size of the Solar System and the competitive performance of the evaluated organization. The lowest competitive level was accused by the Solar Plant A, falling within the range of a little competitive company, and it is considered one of the most representative Solar Power Plants in Brazil. This result confirms the importance of an efficient solar energy management based on KPIs.
Moreover, the computational tool to evaluate competitiveness in photovoltaic energy generation allows a current diagnosis of the situation of the companies participating in the research. Thus, creating subsidies for the elaboration of action plans focused on improvements that can leverage the current performance to higher levels of competition. Since the modeling considers that there are substitution rates among the indicators used, the elaboration of these plans should take into account the weight of each of the indicators, since they define a ranking of importance. The focus in this case should be to promote improvements first in the indicators that have the highest substitution rates, so that it is possible to contribute in a more significant way in increasing the global level of competitiveness in the generation of photovoltaic energy.
5. Conclusions
The mathematical modeling inserted in the tool allowed the managers to monitor the performance of the solar energy management and could raise competitiveness through the increase of indicators’ values, which helps in the prospection of future scenarios and decision-making. The instrument was constructed with the identification of four Fundamental Viewpoints, 26 Critical Success Factors and 40 Performance Indicators, presented in a multiple choice closed question format. The application of the tool in photovoltaic plants evidences the continuity and relevance of the research, in view of the main objective of developing solar energy management through indicators that generate a current diagnosis of organizational competitiveness in photovoltaic generation.
The tool was applied in two large solar plants located in Brazil, an electronics equipment industry that has a solar system in operation and a research center in renewable energy located in Europe and evaluated the organizational competitiveness of each one of them. Based on the feedback generated with the application of the instrument, the solar, industrial and research centers could promote improvements in indicators that have the highest importance rates in order to contribute significantly to leverage the global level of competitiveness. From the settings presented in the final considerations, it is considered that the modelling built satisfies the condition of being able to measure the level of competitiveness in the generation of photovoltaic energy.

 ,
, 


