Visual Investigation of the Occurrence Characteristics of Multi-Type Formation Water in a Fracture–Cavity Carbonate Gas Reservoir

Abstract
:1. Introduction
2. Materials and Methods
2.1. Similarity Principle
- (1)
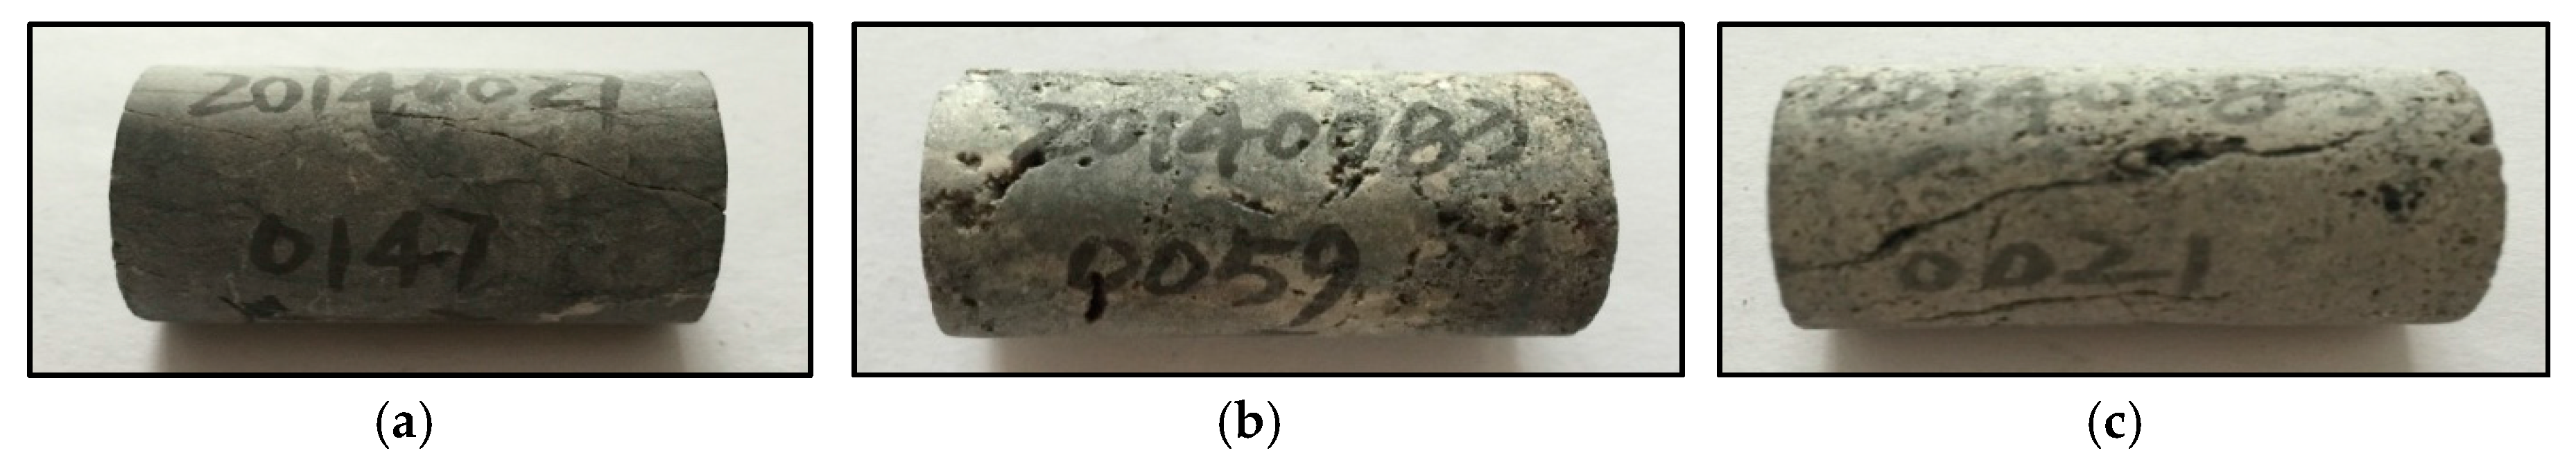
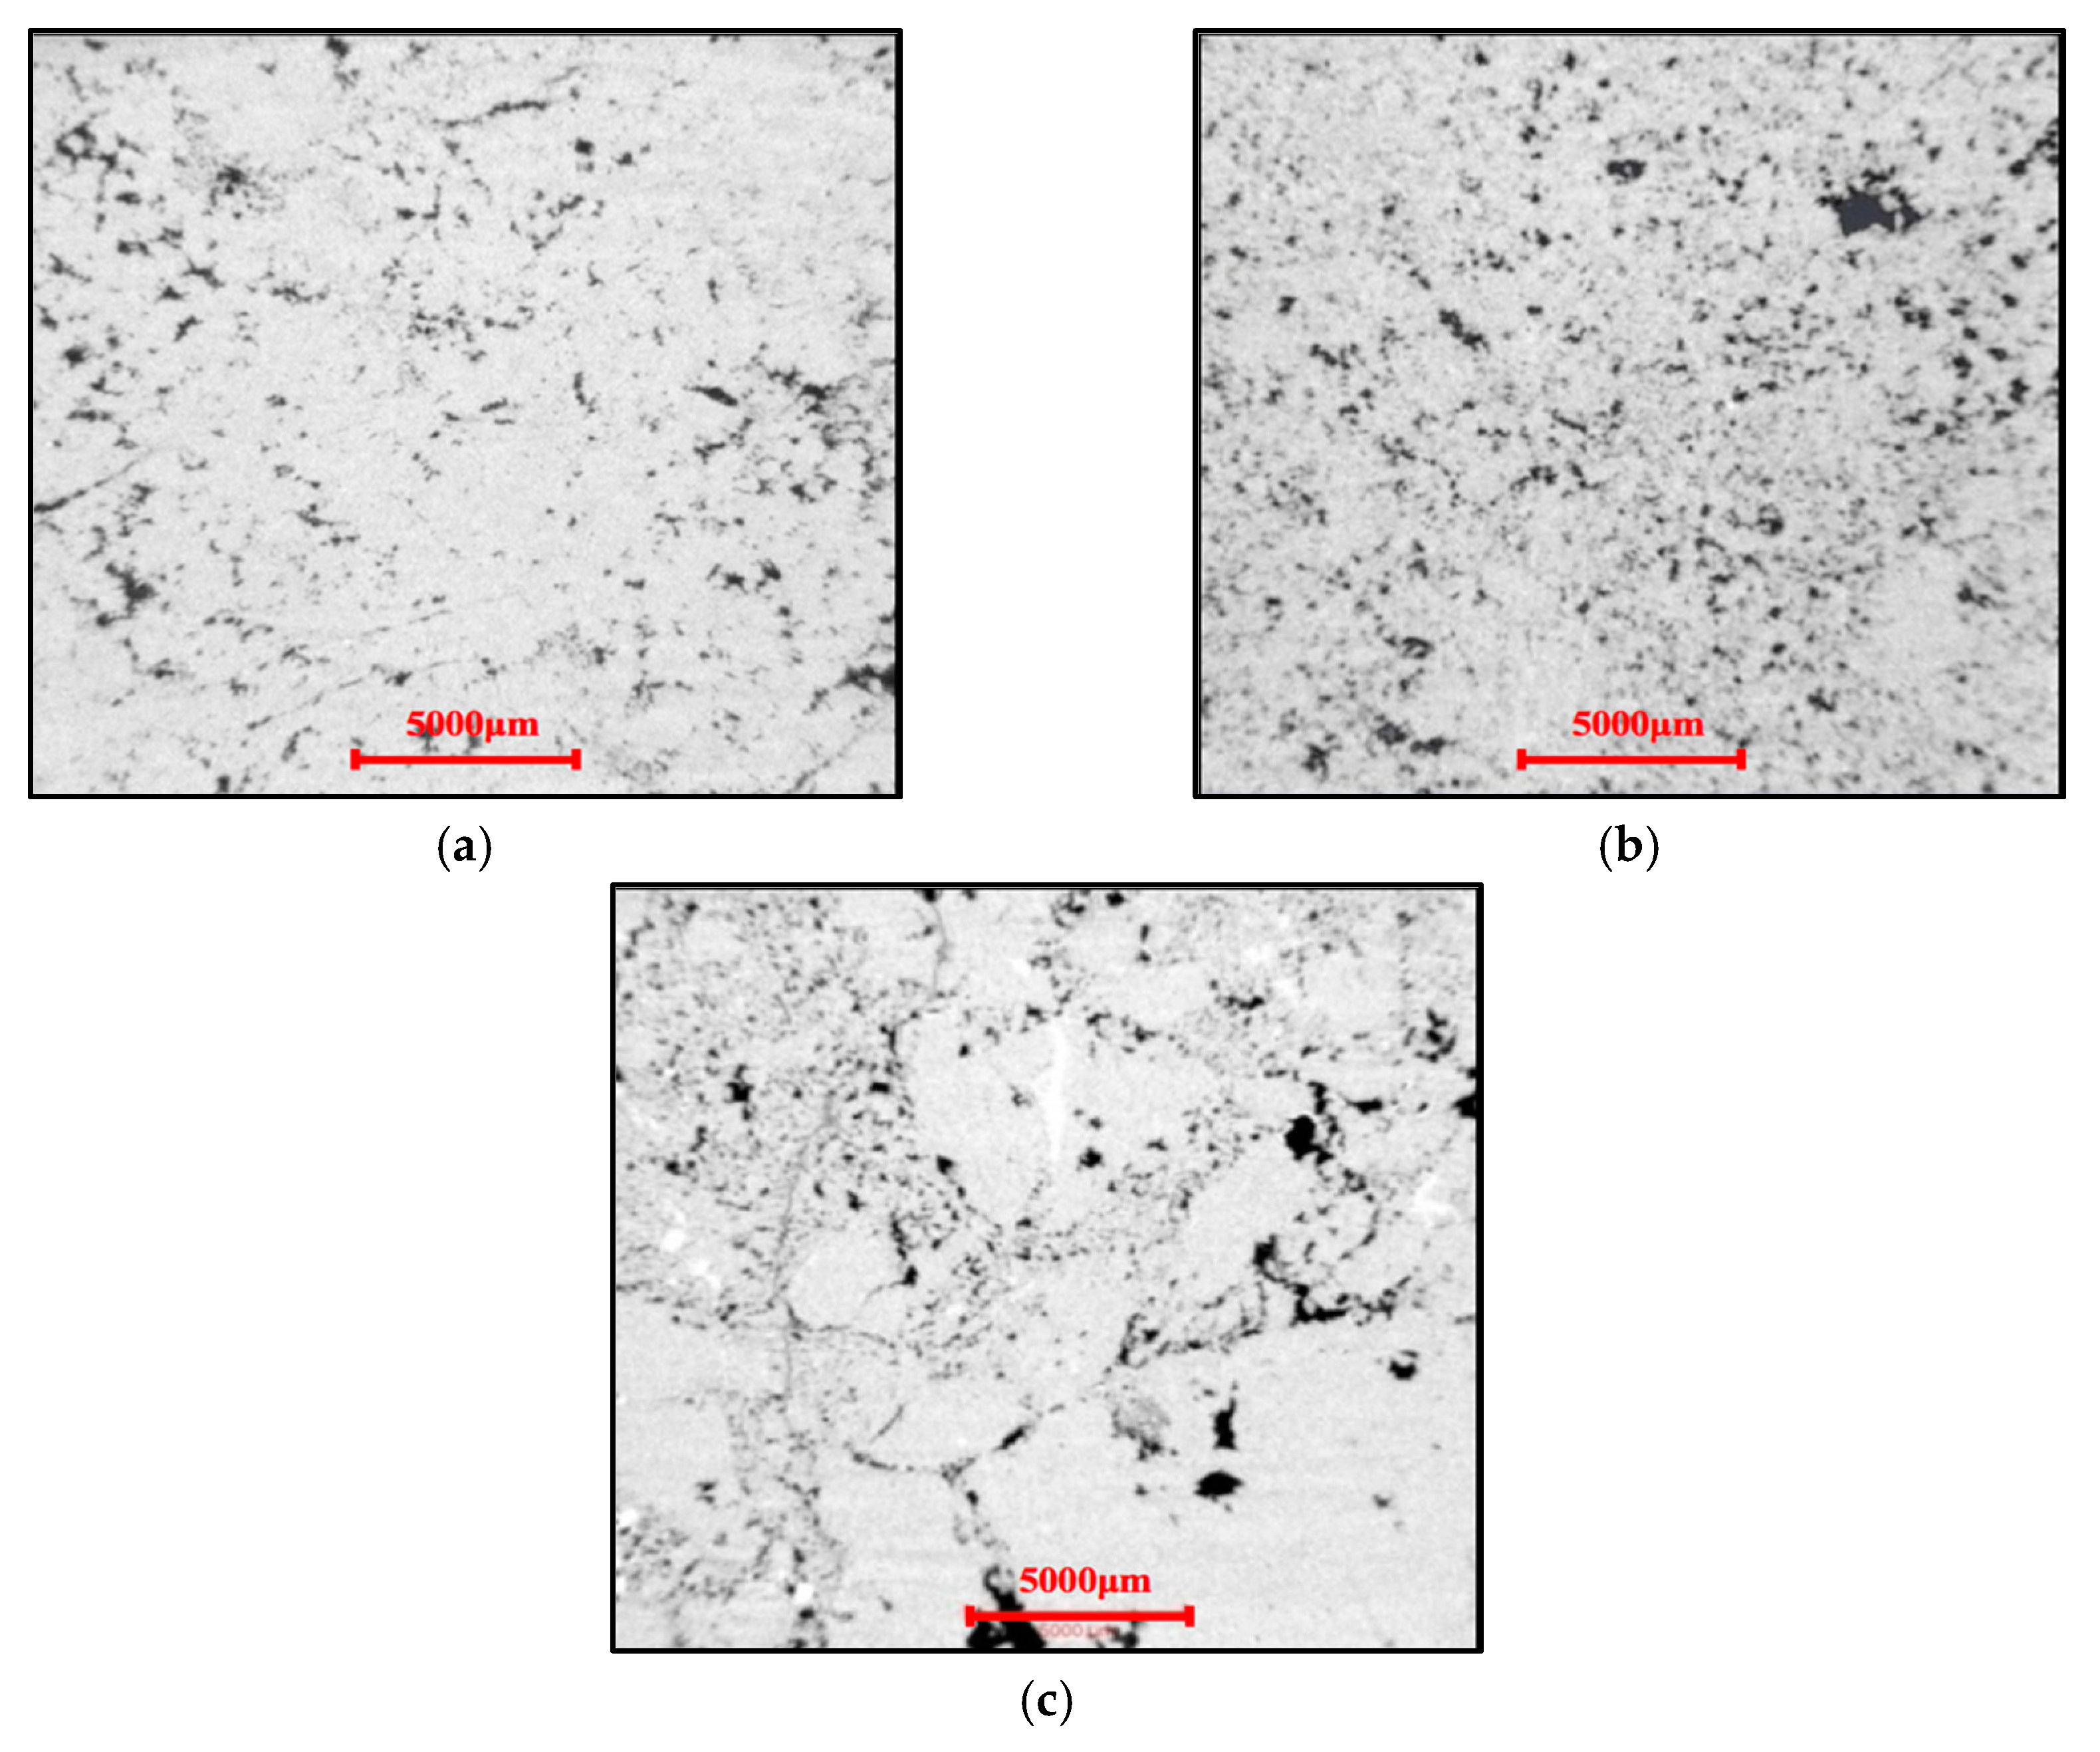
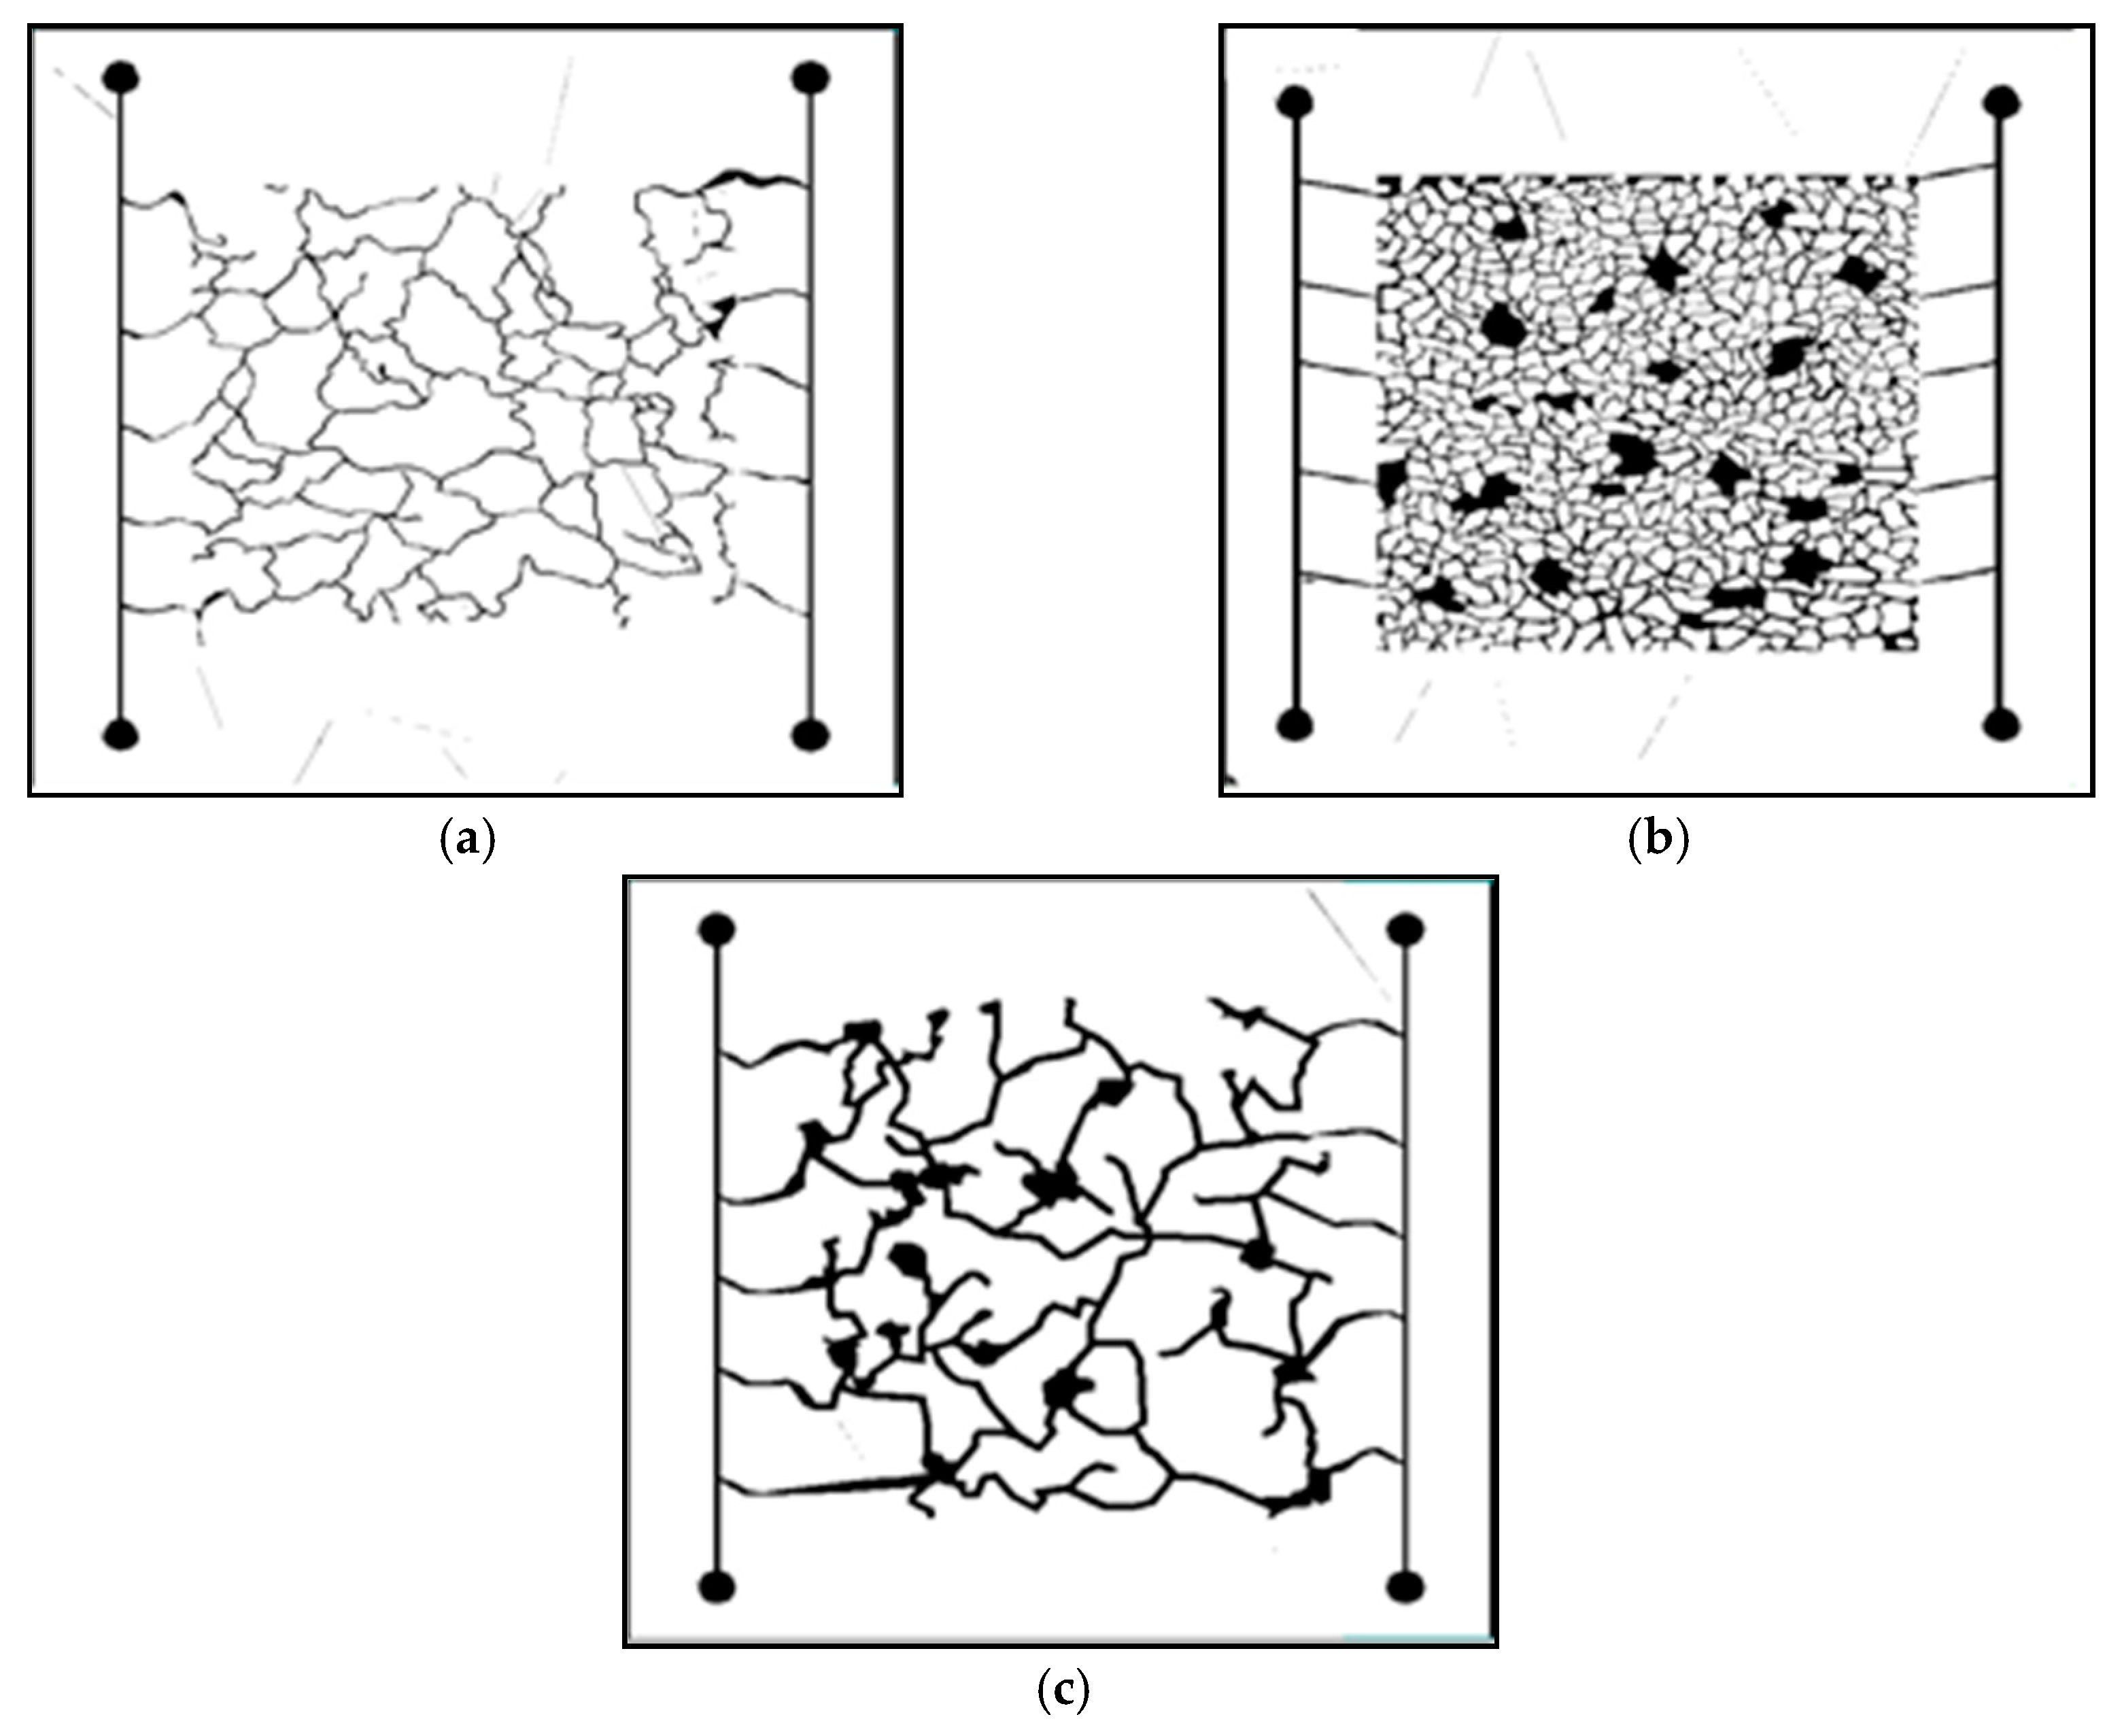
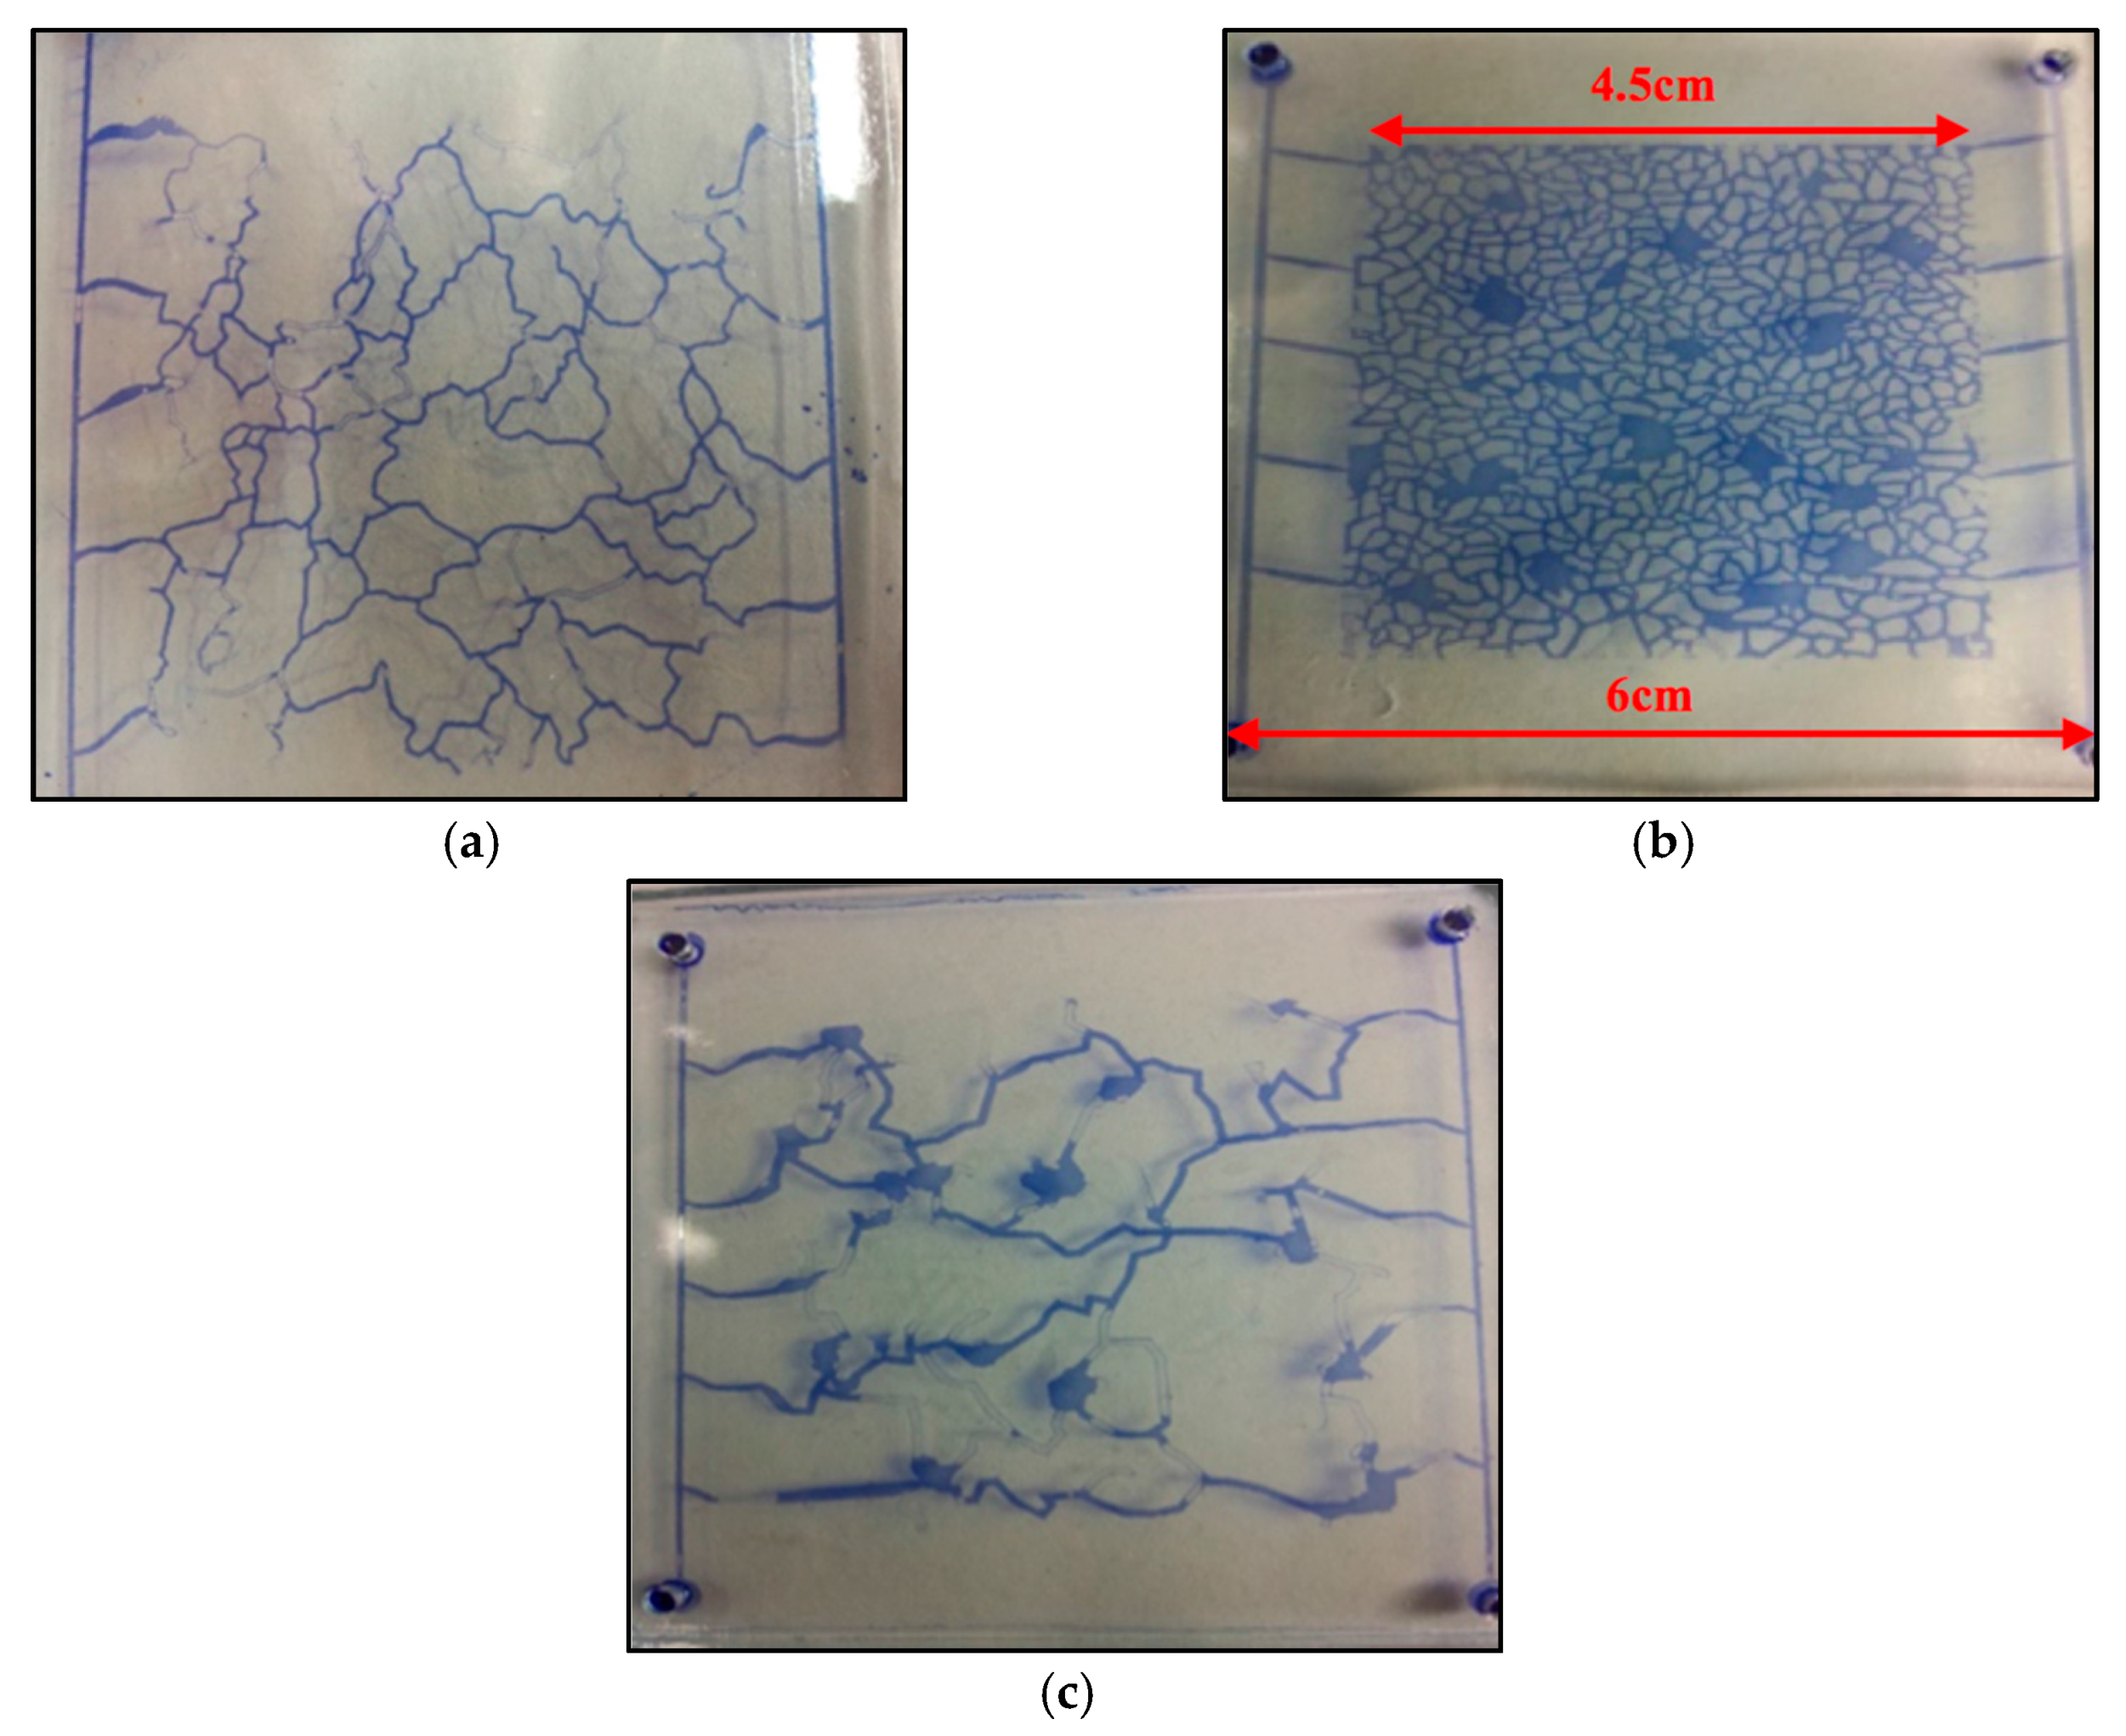
- Similarity in microstructures and heterogeneity: three types visual micromodels with representative microstructures were designed and fabricated based on the CT images of three typical cores in study area.
- (2)
- Similarity in wettability: float glass with similar wettability and wetting angles to the study area rocks was chosen to construct the visual micromodel.
- (3)
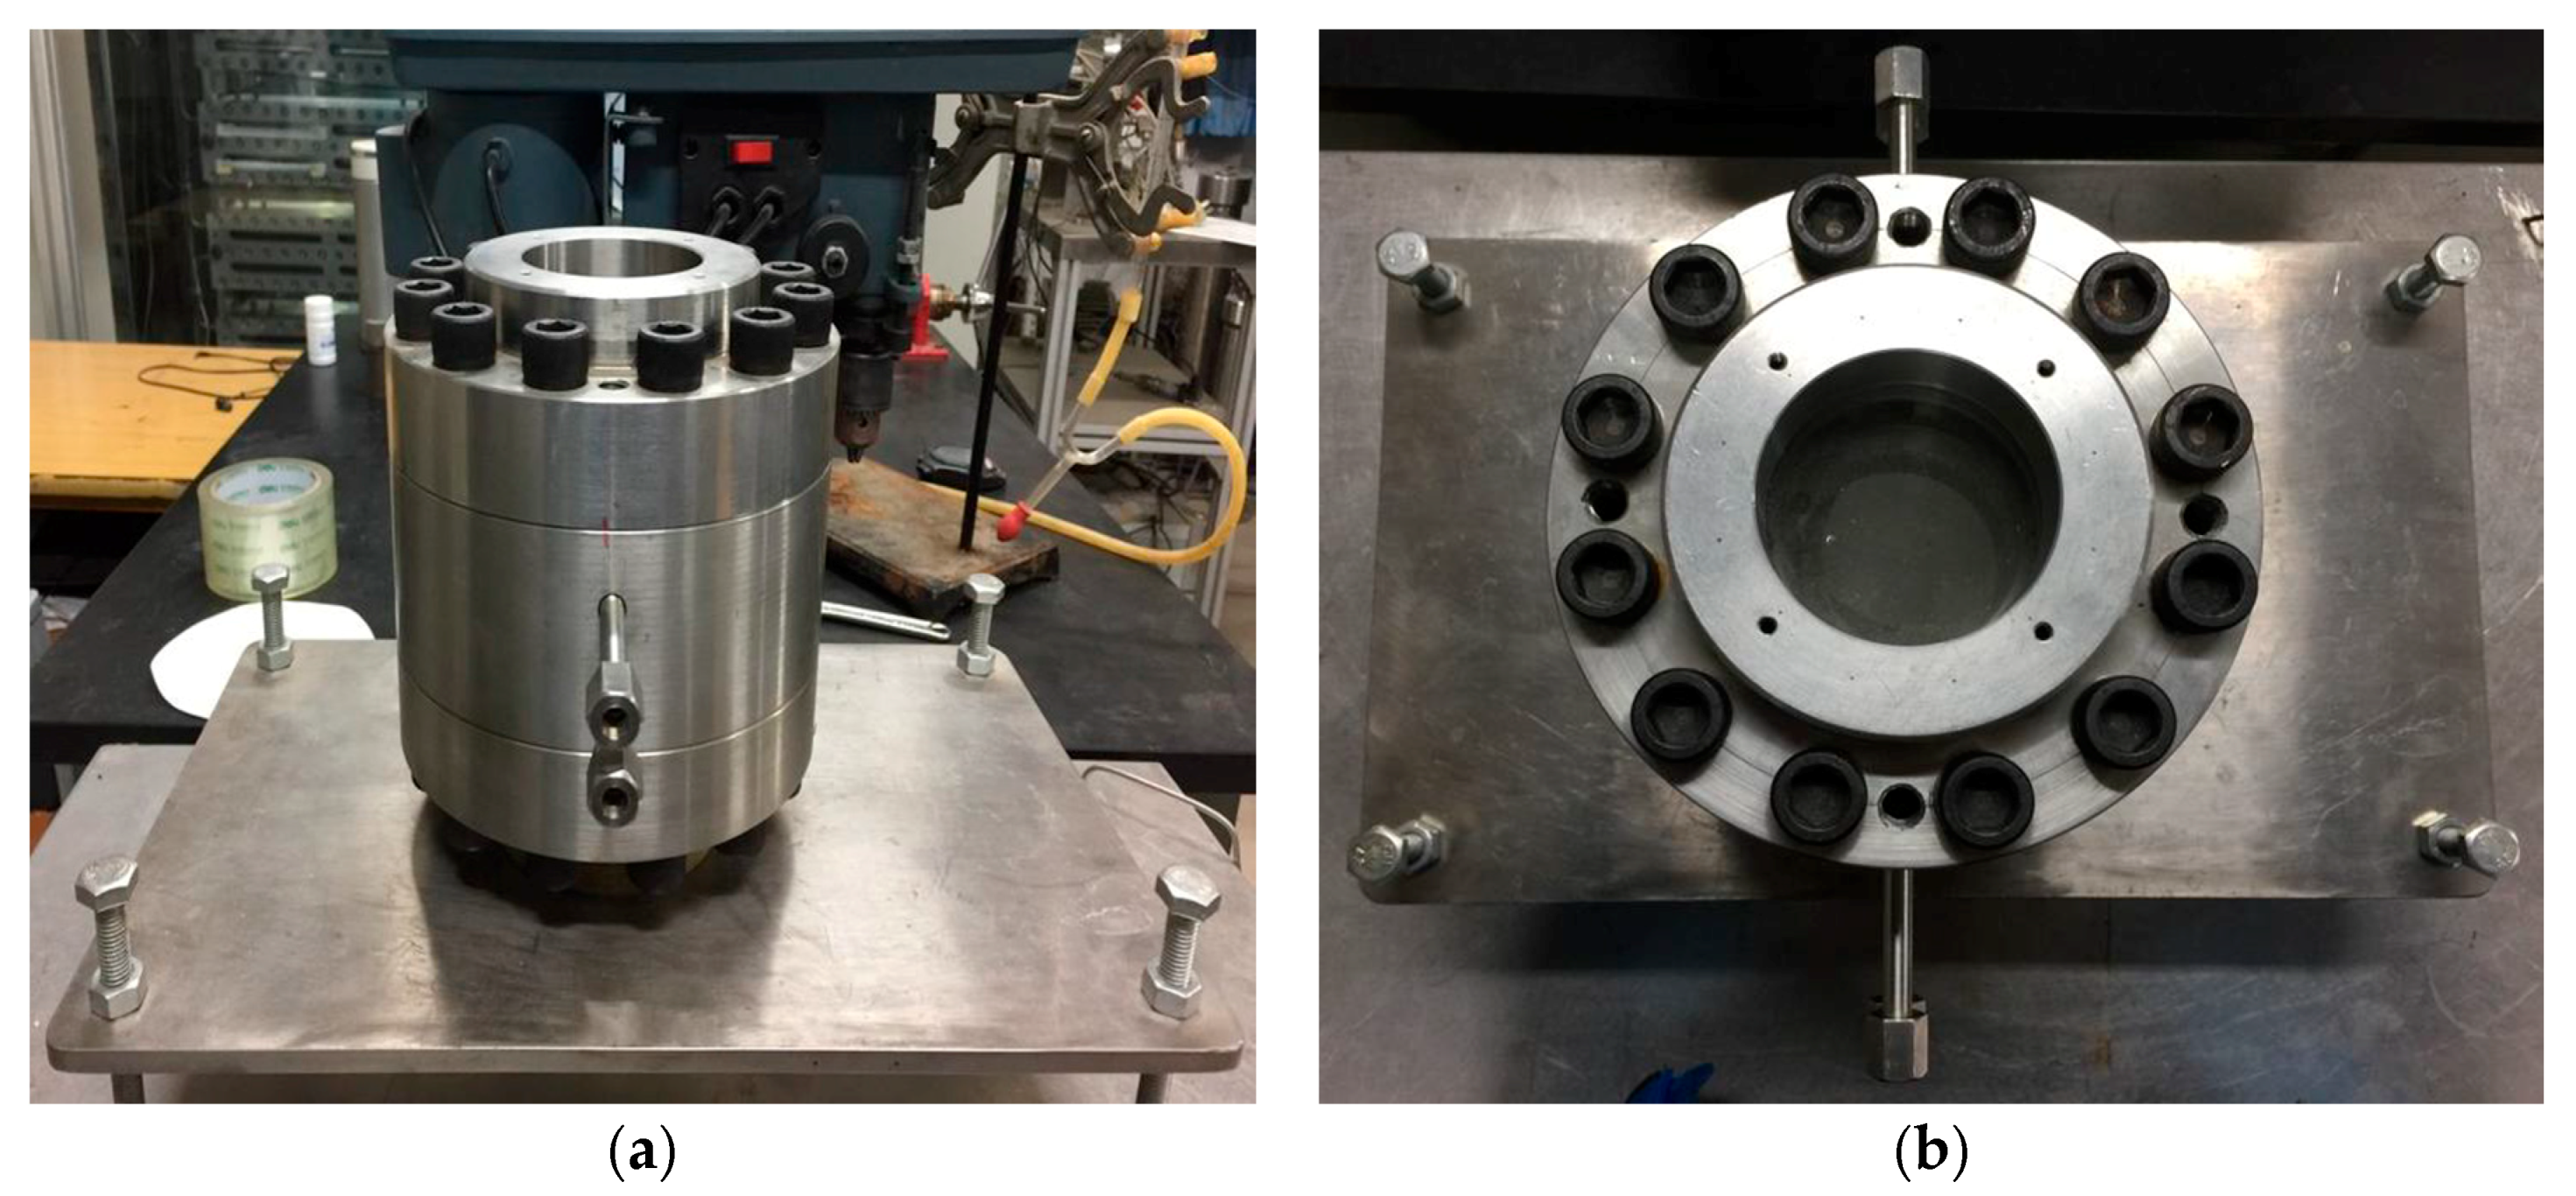
- Similarity in formation conditions: customized holder and constant temperature oven for the visual micromodels were used to simulate the formation conditions.
- (4)
- Similarity in flow mode: gas-drive-water physical simulation experiments were conducted to simulate the formation process of formation water in gas reservoir according to the theory of hydrocarbon migration and accumulation.
- (5)
- Similarity in fluid properties: water used in the visual experiment was prepared according to the chemical composition of formation water, and gas used in the visual experiment was produced by an actual gas well.
2.2. Visual Micromodels
2.2.1. Mask Creation Based on CT Scan Images
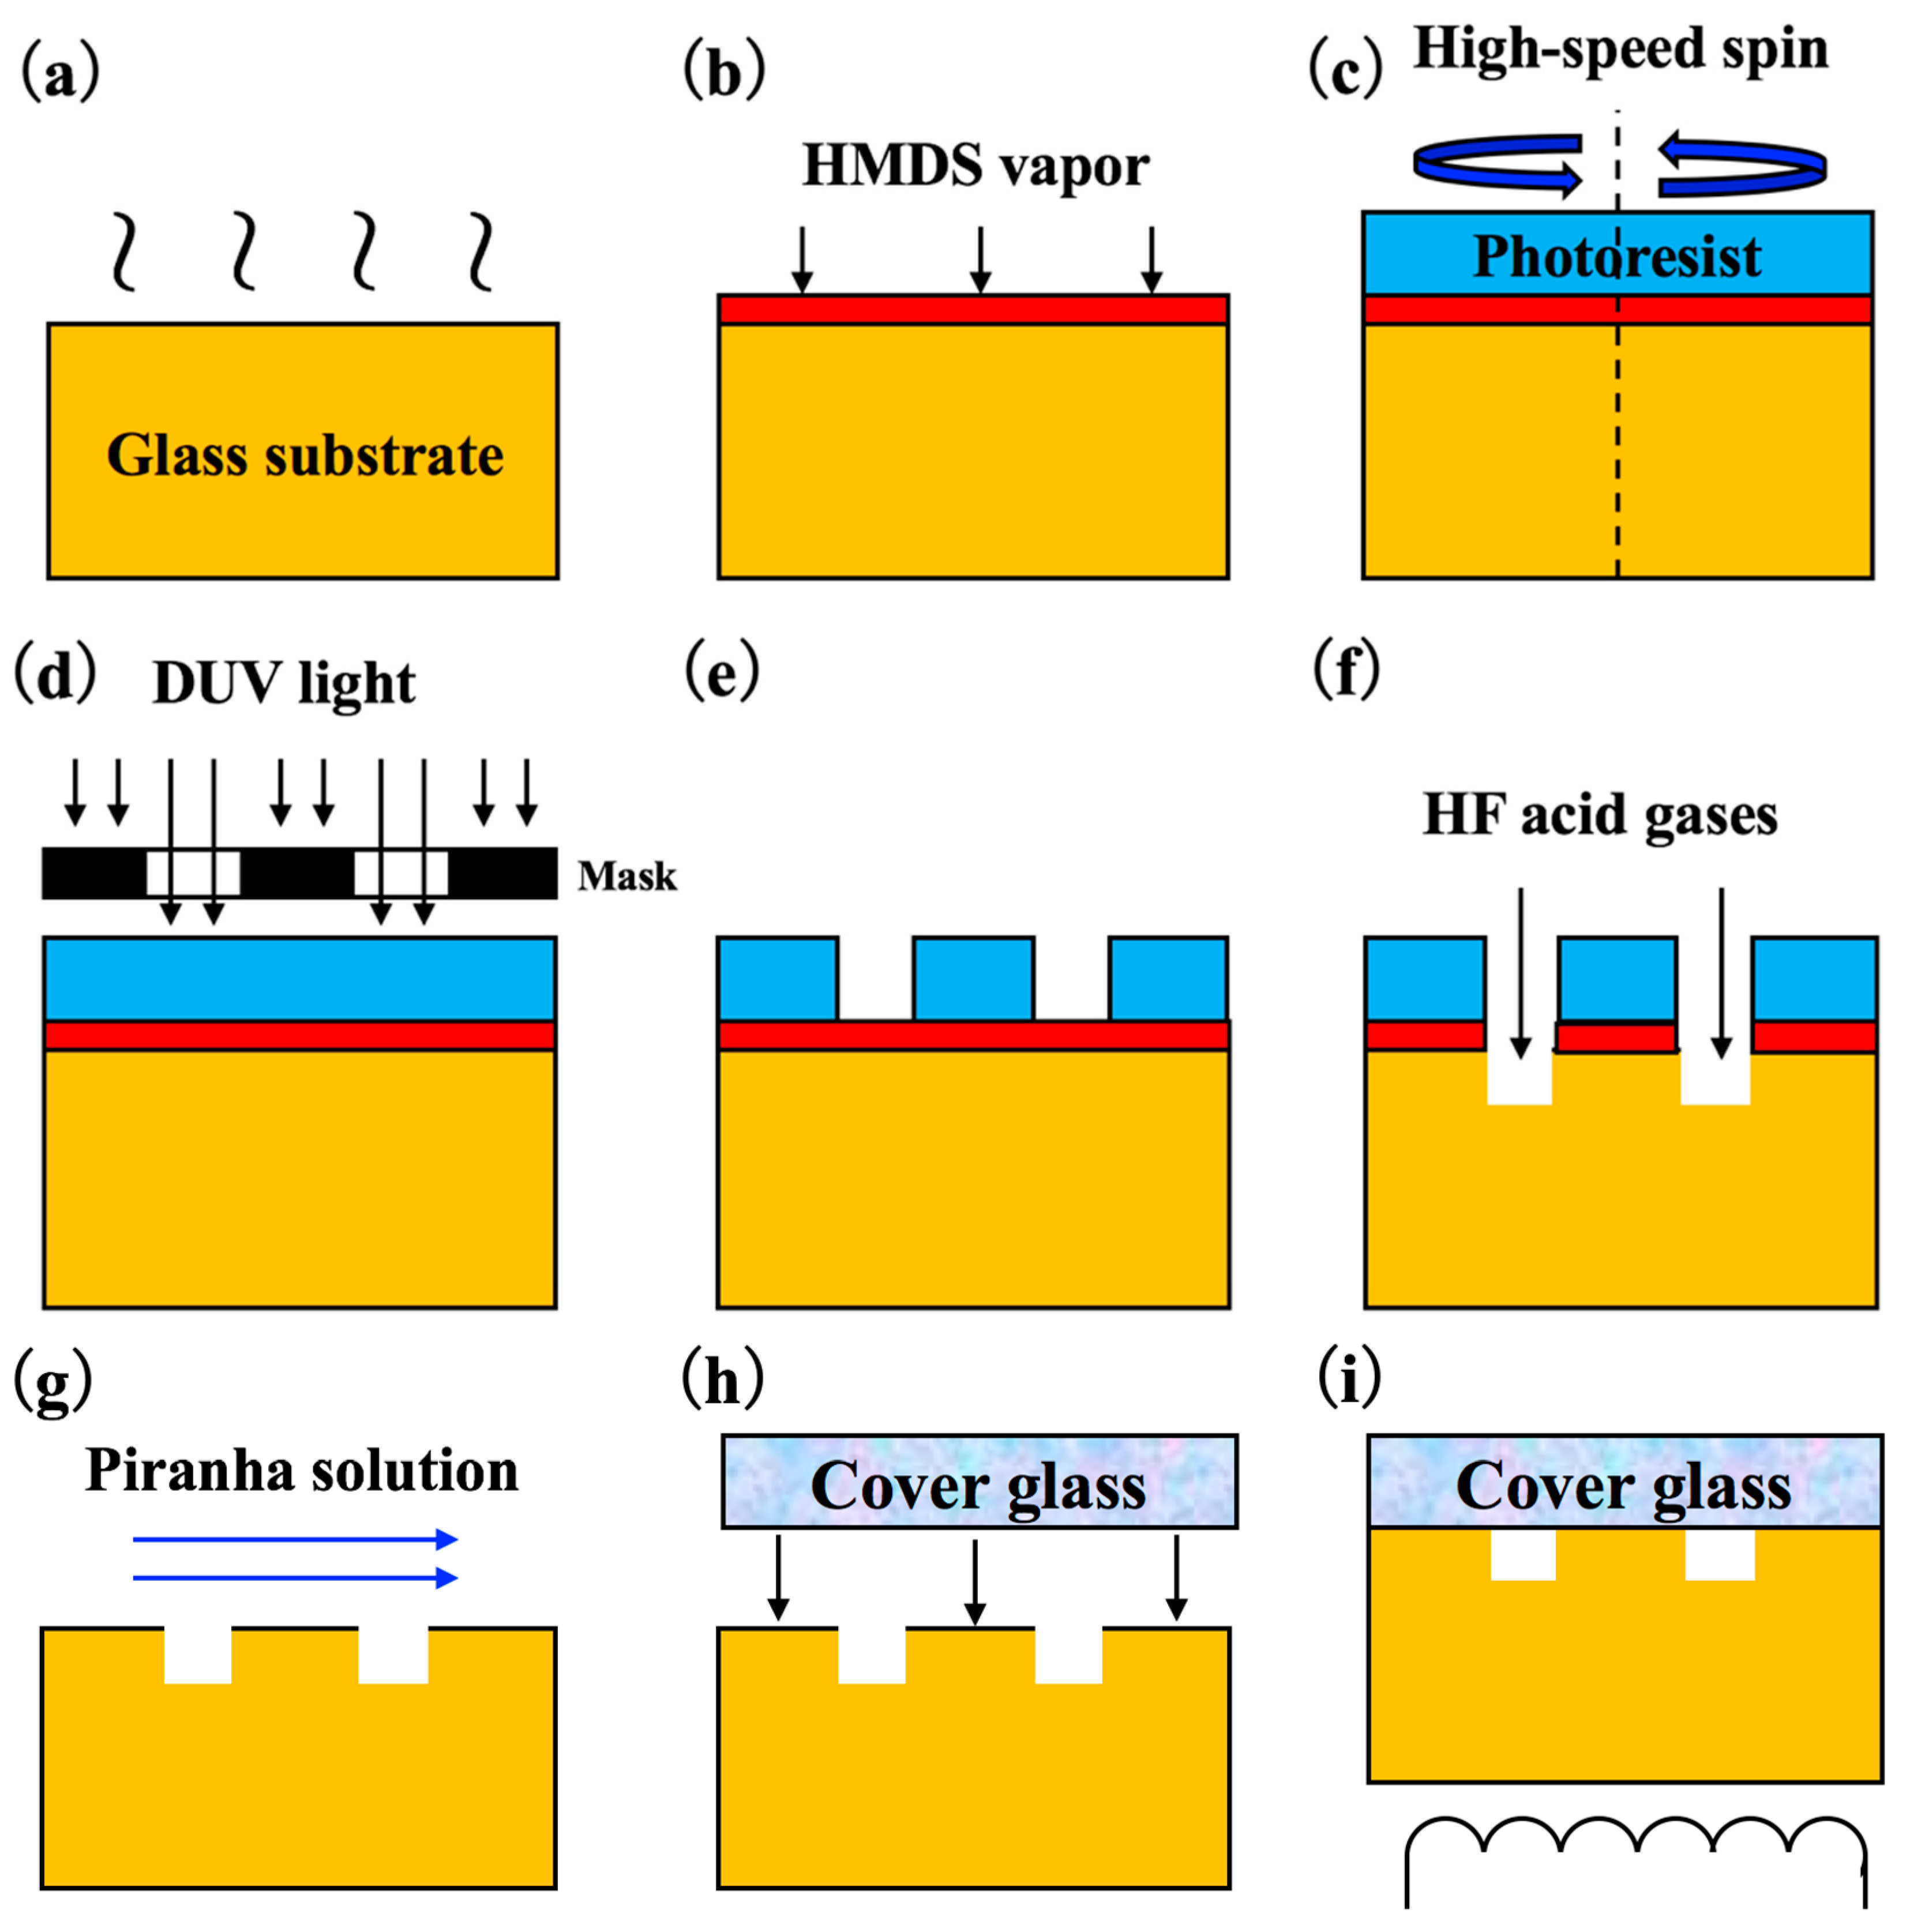
2.2.2. Micromodel Fabrication Based on Microelectronic Photolithography Techniques
2.2.3. Advantage of Microscopic Visual Models
- (1)
- Micromodel sealability is further enhanced by improving the bonding technique, guaranteeing the micromodel can be used for the simulation of gas–water flow under a certain stress.
- (2)
- Microstructure characteristics and multi-type media distribution are similar to those of actual reservoirs, which can be used for intuitively studying the occurrence states of formation water after gas-drive-water procedure.
- (3)
- Highest allowable stress of the micromodel is increased to 10 MPa, which is more close to the effective stress of actual reservoir.
- (4)
- Three types of micromodels are fabricated according to the different type reservoirs of fracture–cavity carbonate gas reservoir, which have never been created and introduced in previous studies.
2.3. Experimental Apparatus and Fluids
2.4. Experimental Procedure
- (1)
- Both the micromodel and holder were cleaned by deionized water and then dried in an oven.
- (2)
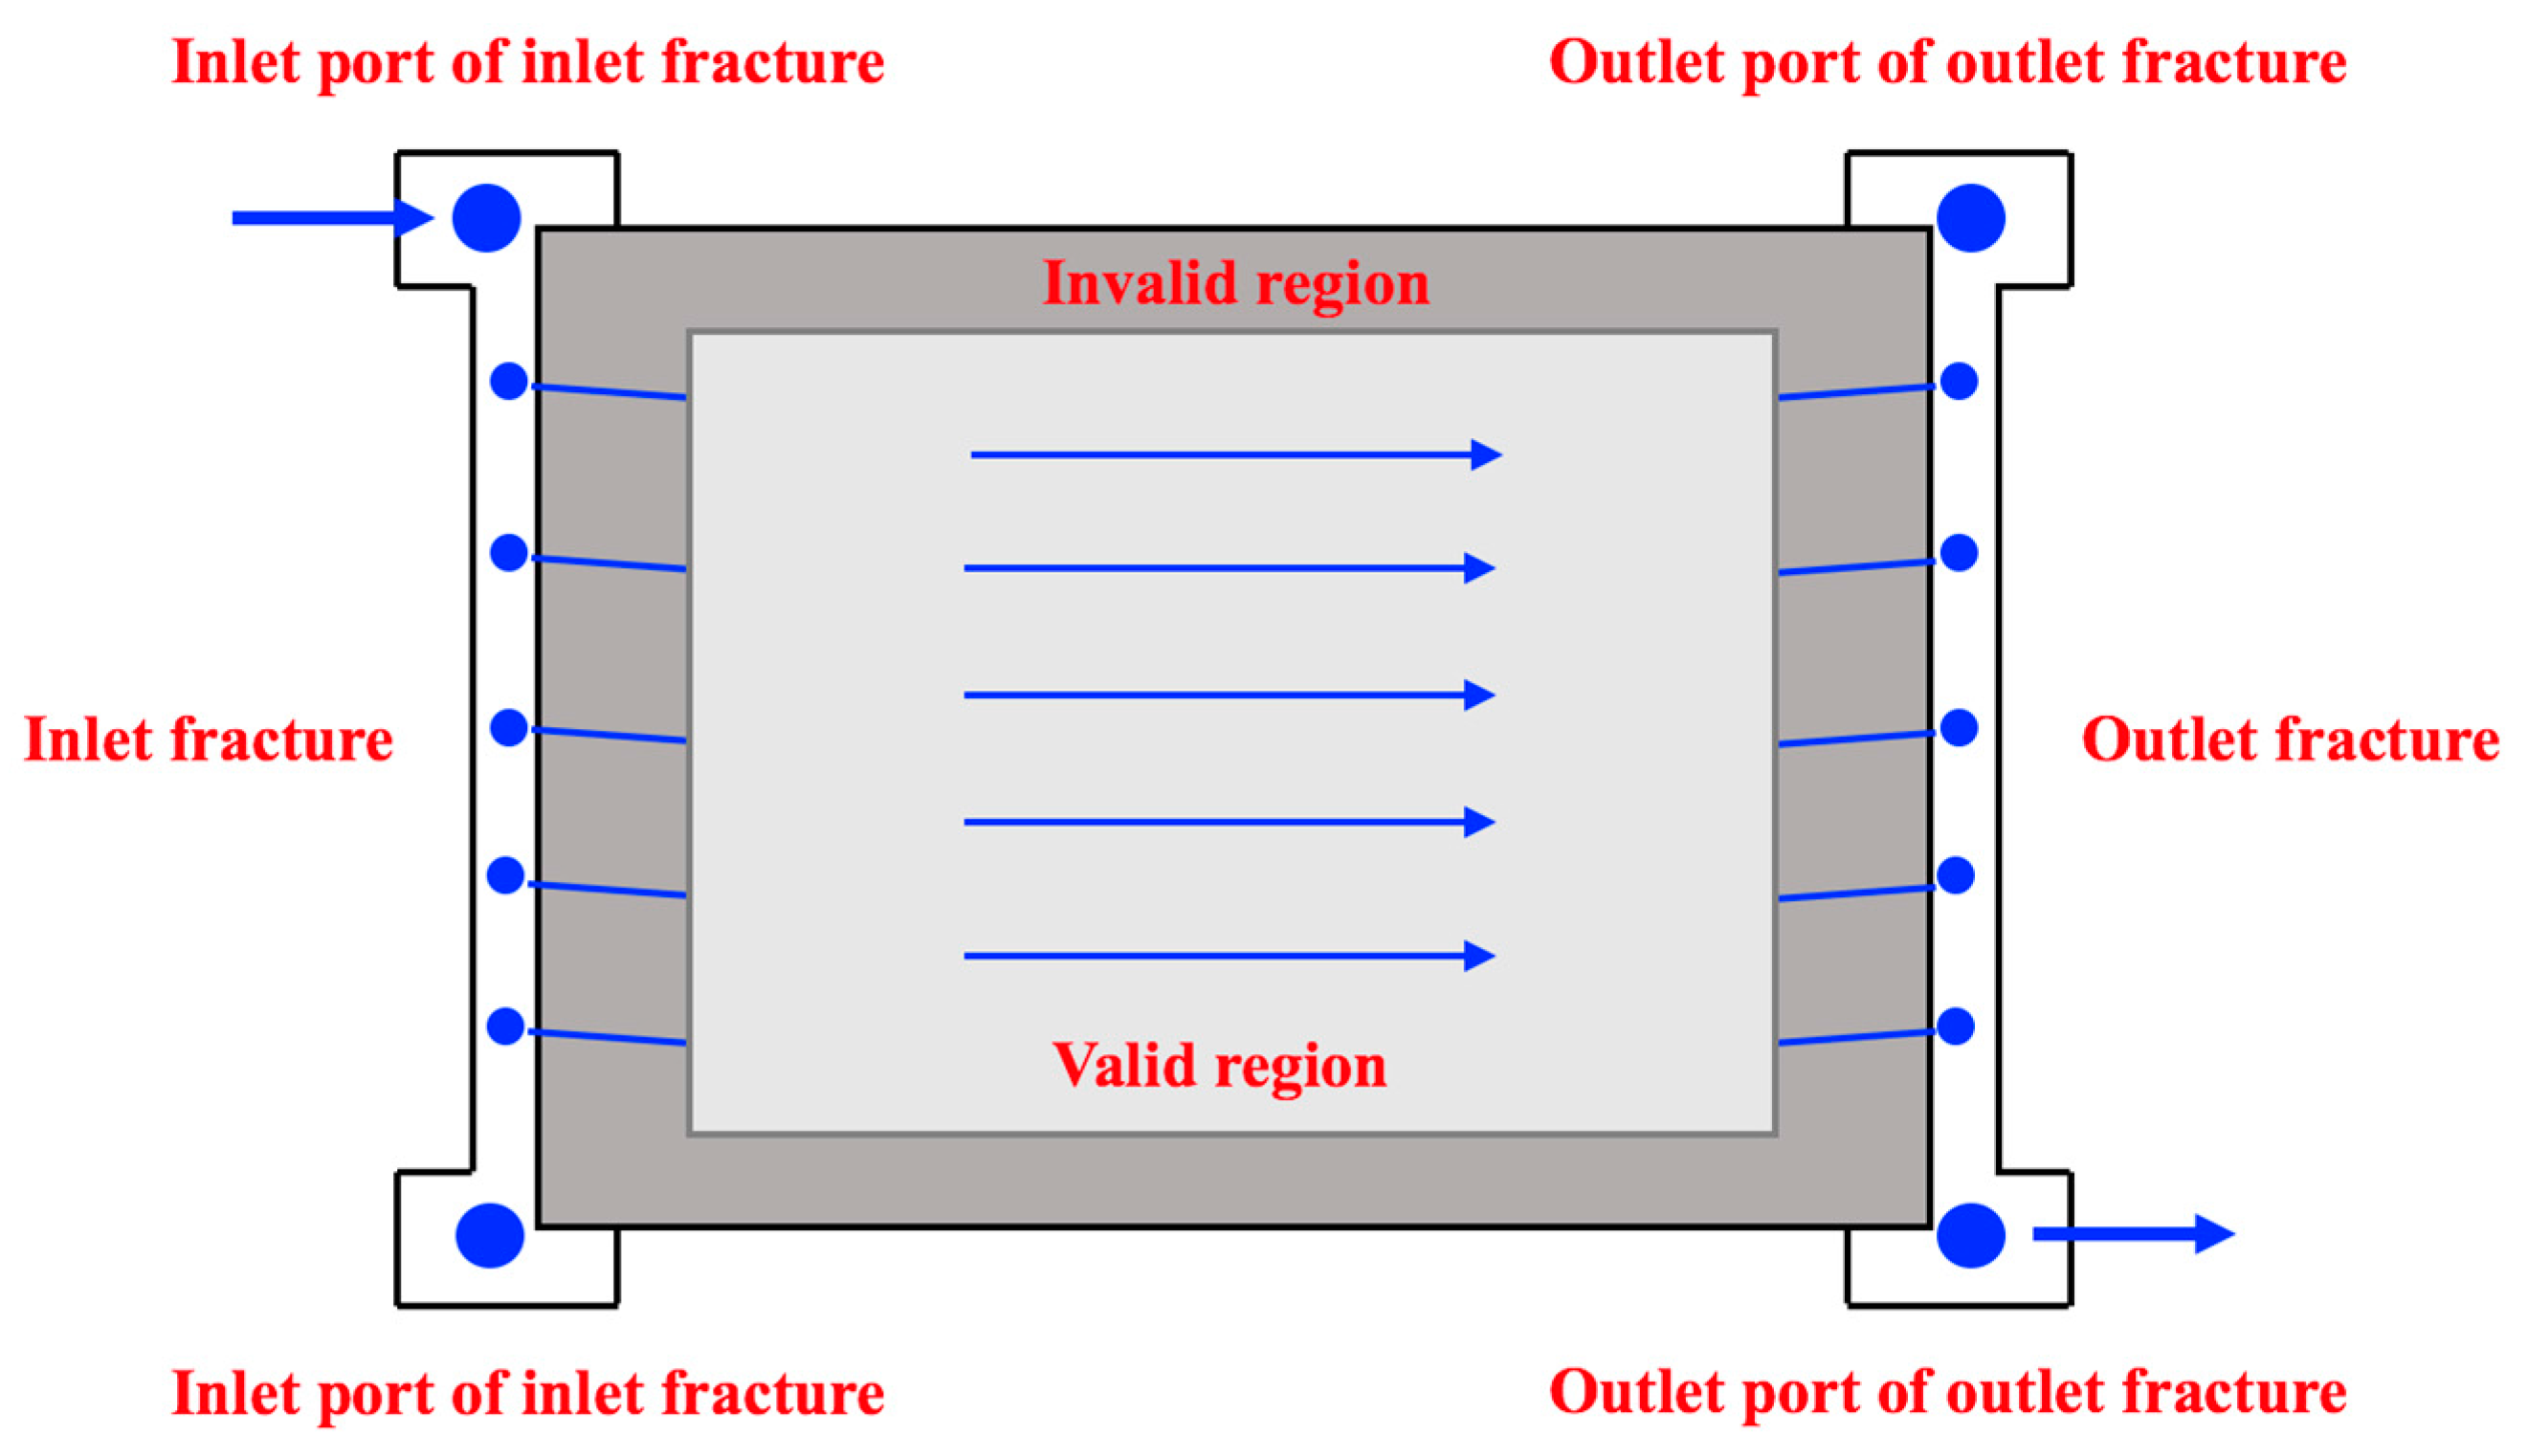
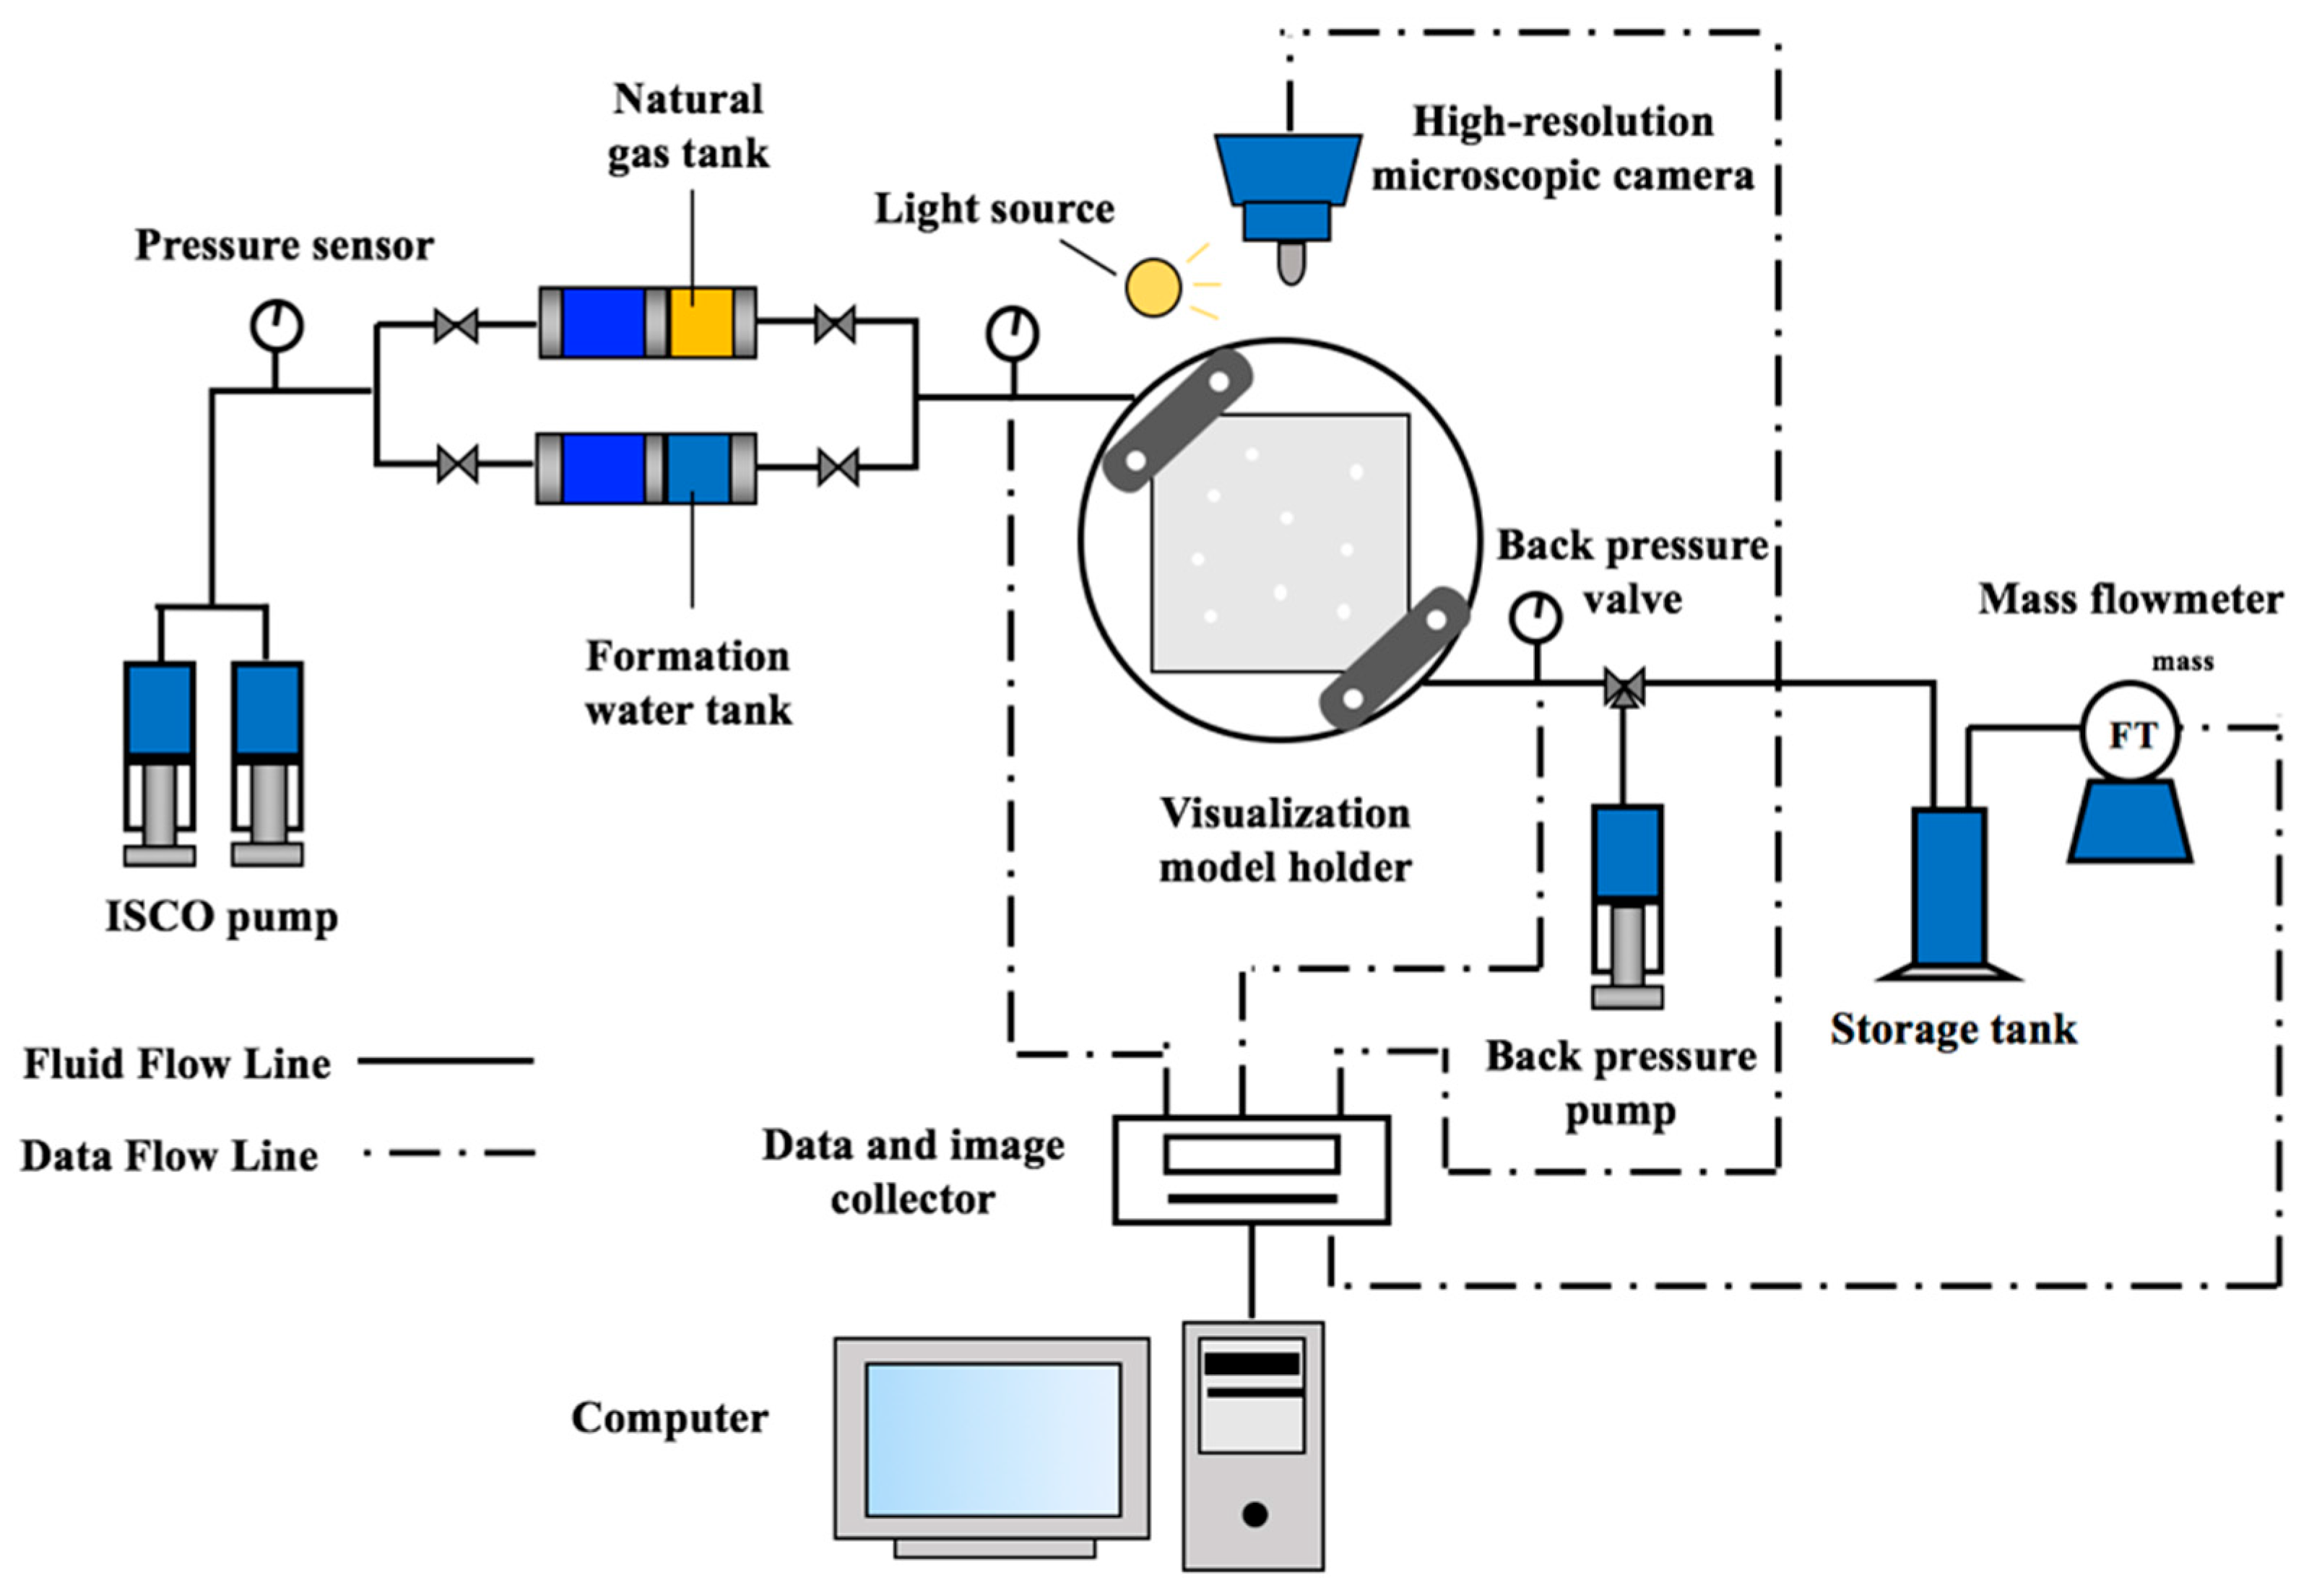
- The micromodel was placed on the holder, and then the experimental system was exactly equipped according to Figure 7.
- (3)
- The sealing of the experimental system was detected by injecting high-purity nitrogen gas into the system. Then, the micromodel was evacuated for 50 min.
- (4)
- Both the micromodel and experimental lines were heated and maintained at 80 °C, which is the original reservoir temperature.
- (5)
- The formation water was injected into the micromodel by using an ISCO pump at 0.02 mL/min until the saturation pressure of the micromodel reached 8 MPa.
- (6)
- Finally, the natural gas was injected into the micromodel at the displacement differential pressures of 0.05–1.00 MPa until no water produced in the outlet.
- (7)
- Steps 1–6 were repeated for the other two micromodels.
2.5. ImageJ Gray Analysis Method
- (1)
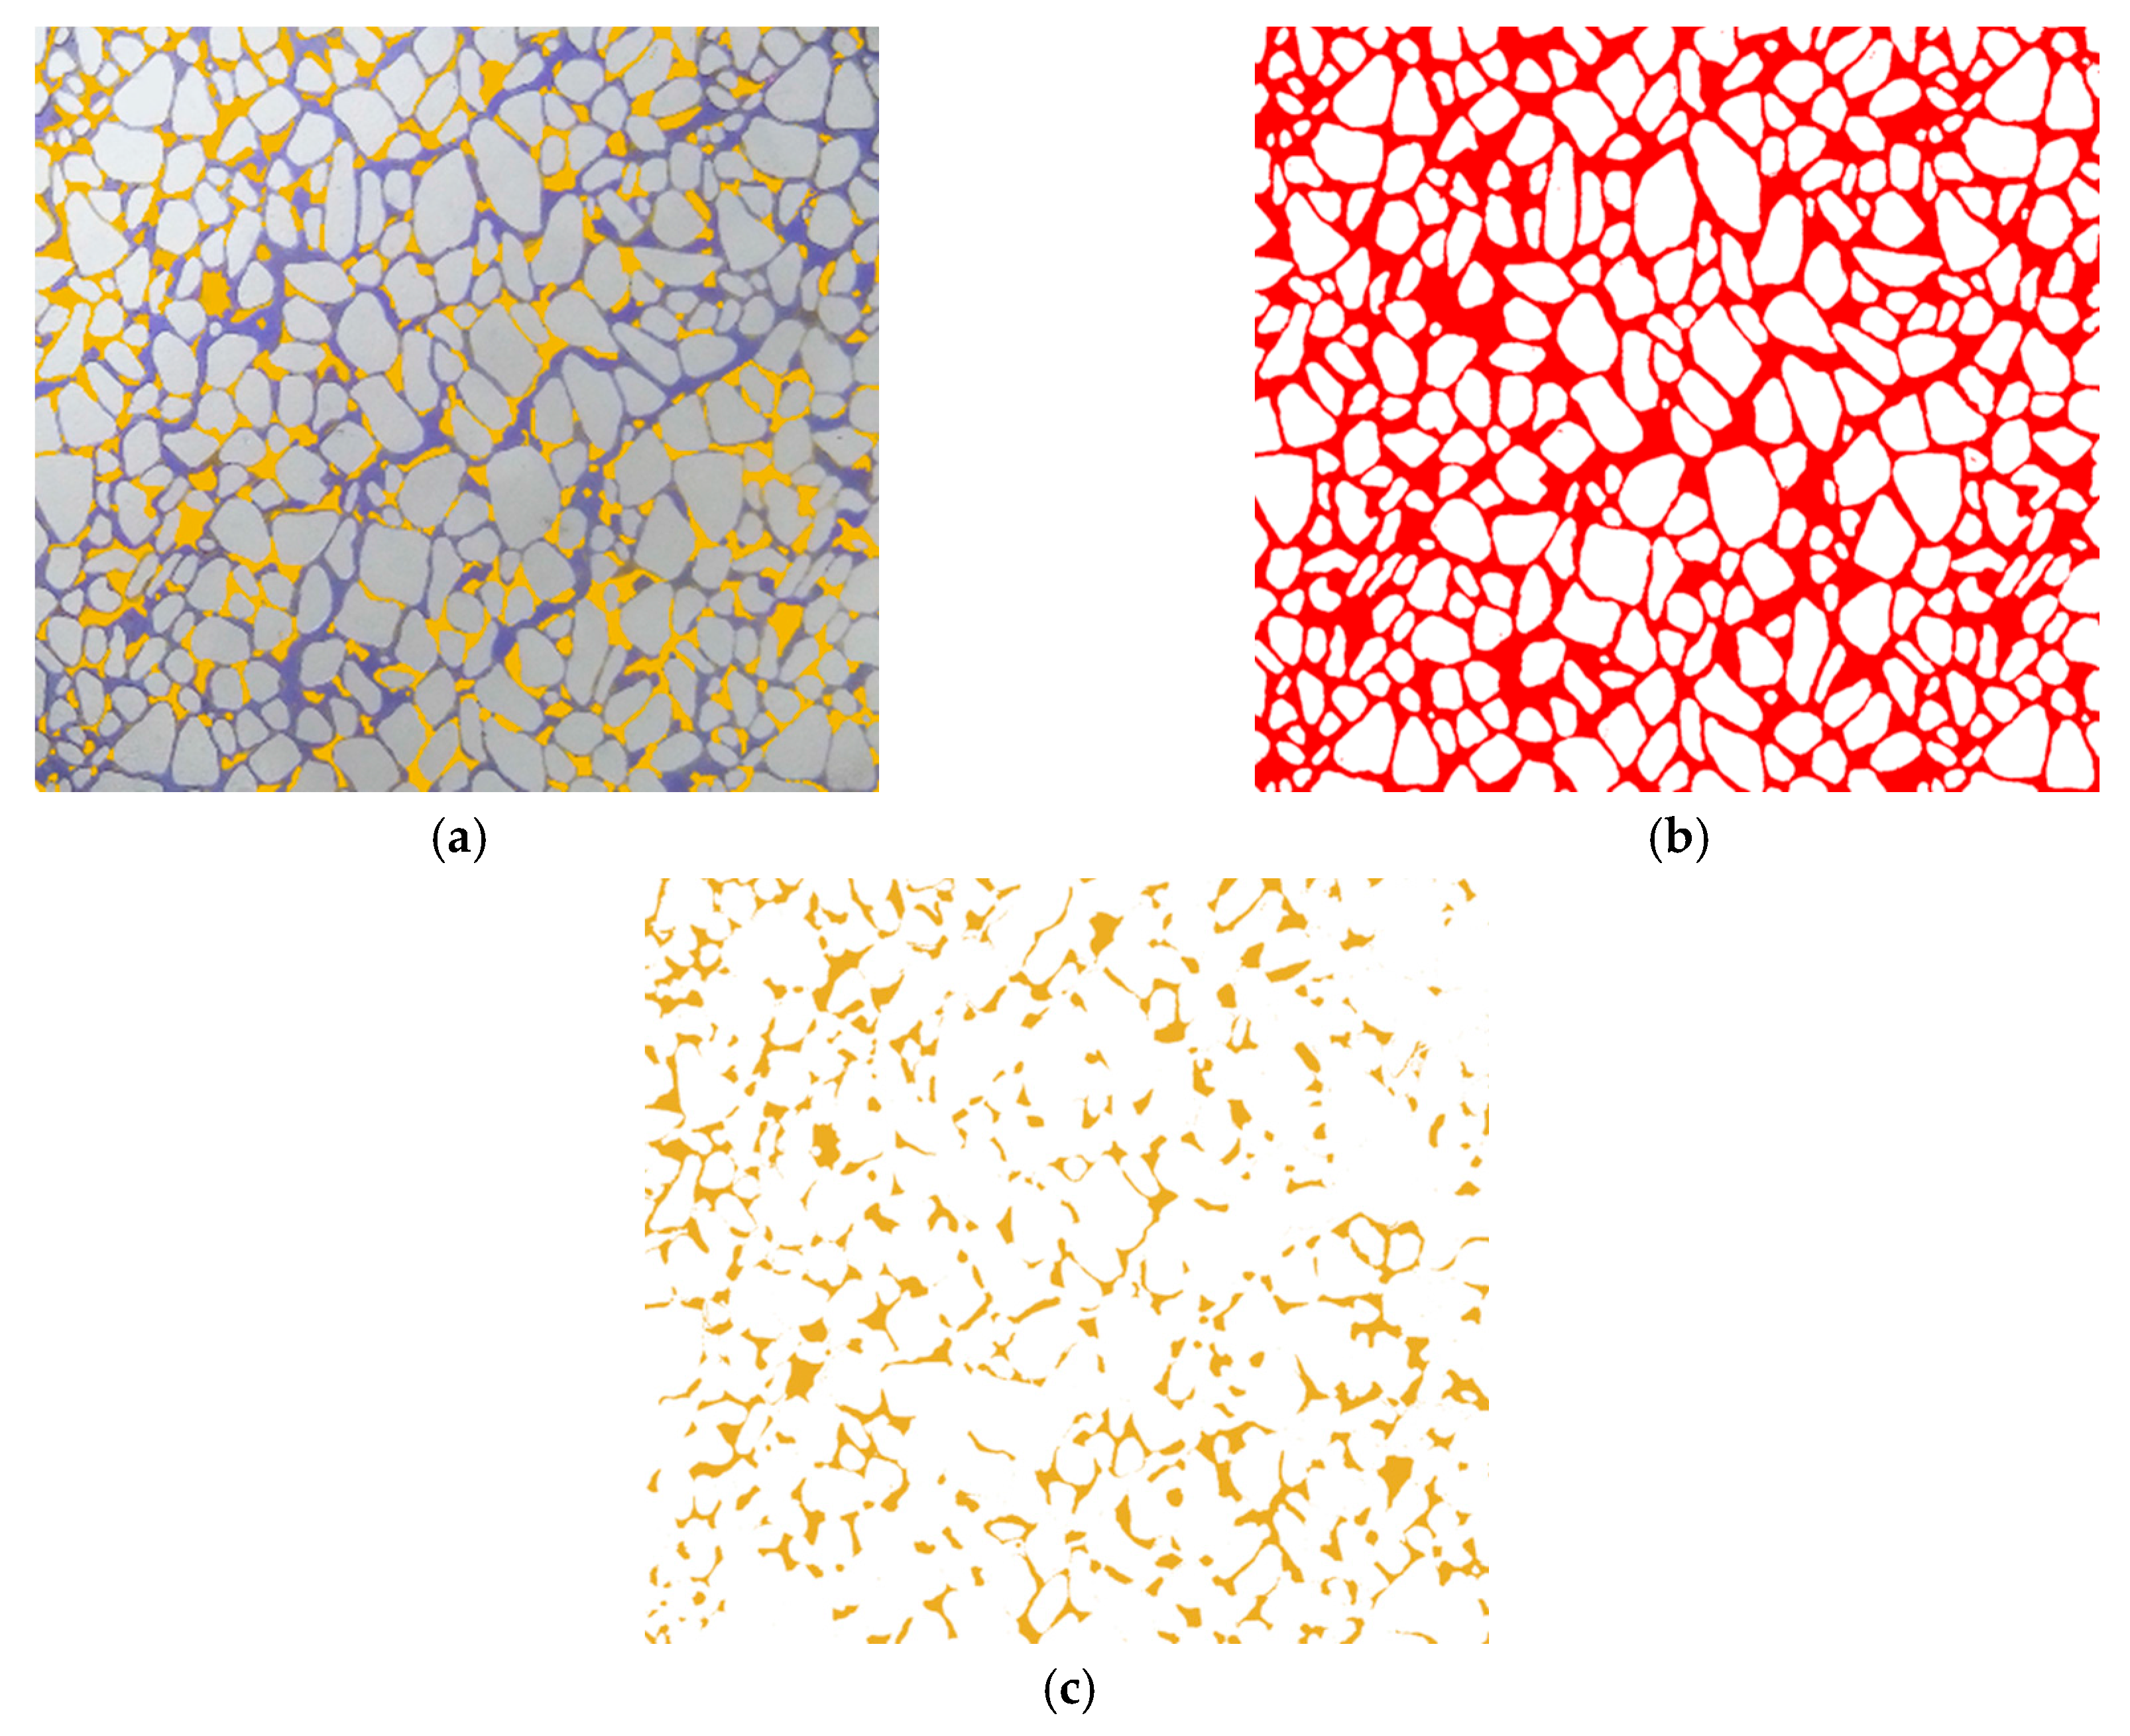
- The pretreatment of images was primarily conducted using the Photoshop software (Adobe Photoshop CS6, Adobe Systems Software Ireland Ltd, San Jose, CA, USA) to adjust the brightness and enhance the quality. Each image takes about 2 min for pretreatment.
- (2)
- The colorless gas was converted to yellow to facilitate the distinction between gas and glass particles, as presented in Figure 9a. Each image takes about 20 min for conversion.
- (3)
- The ImageJ software was used to distinguish the gray value of the image. After setting the threshold, the pixels of the glass particles were converted to white pixels, whereas the pixels of the voids were converted to red pixels, as depicted in Figure 9b. Each image takes about 15 min for conversion.
- (4)
- The area occupied by voids was calculated by counting the number of red pixels, and then the porosity of micromodel can be determined. Each image takes about 3 min for calculation.
- (5)
- Then, Photoshop and ImageJ software were used again to separate the gas from the fluid and convert the gas to yellow pixels, as shown in Figure 9c. Each image takes about 10 min for separation.
- (6)
- The area occupied by gas was calculated again by counting the number of yellow pixels, and then the gas saturation can also be obtained. Each image takes about 3 min for calculation.
3. Results and Discussion
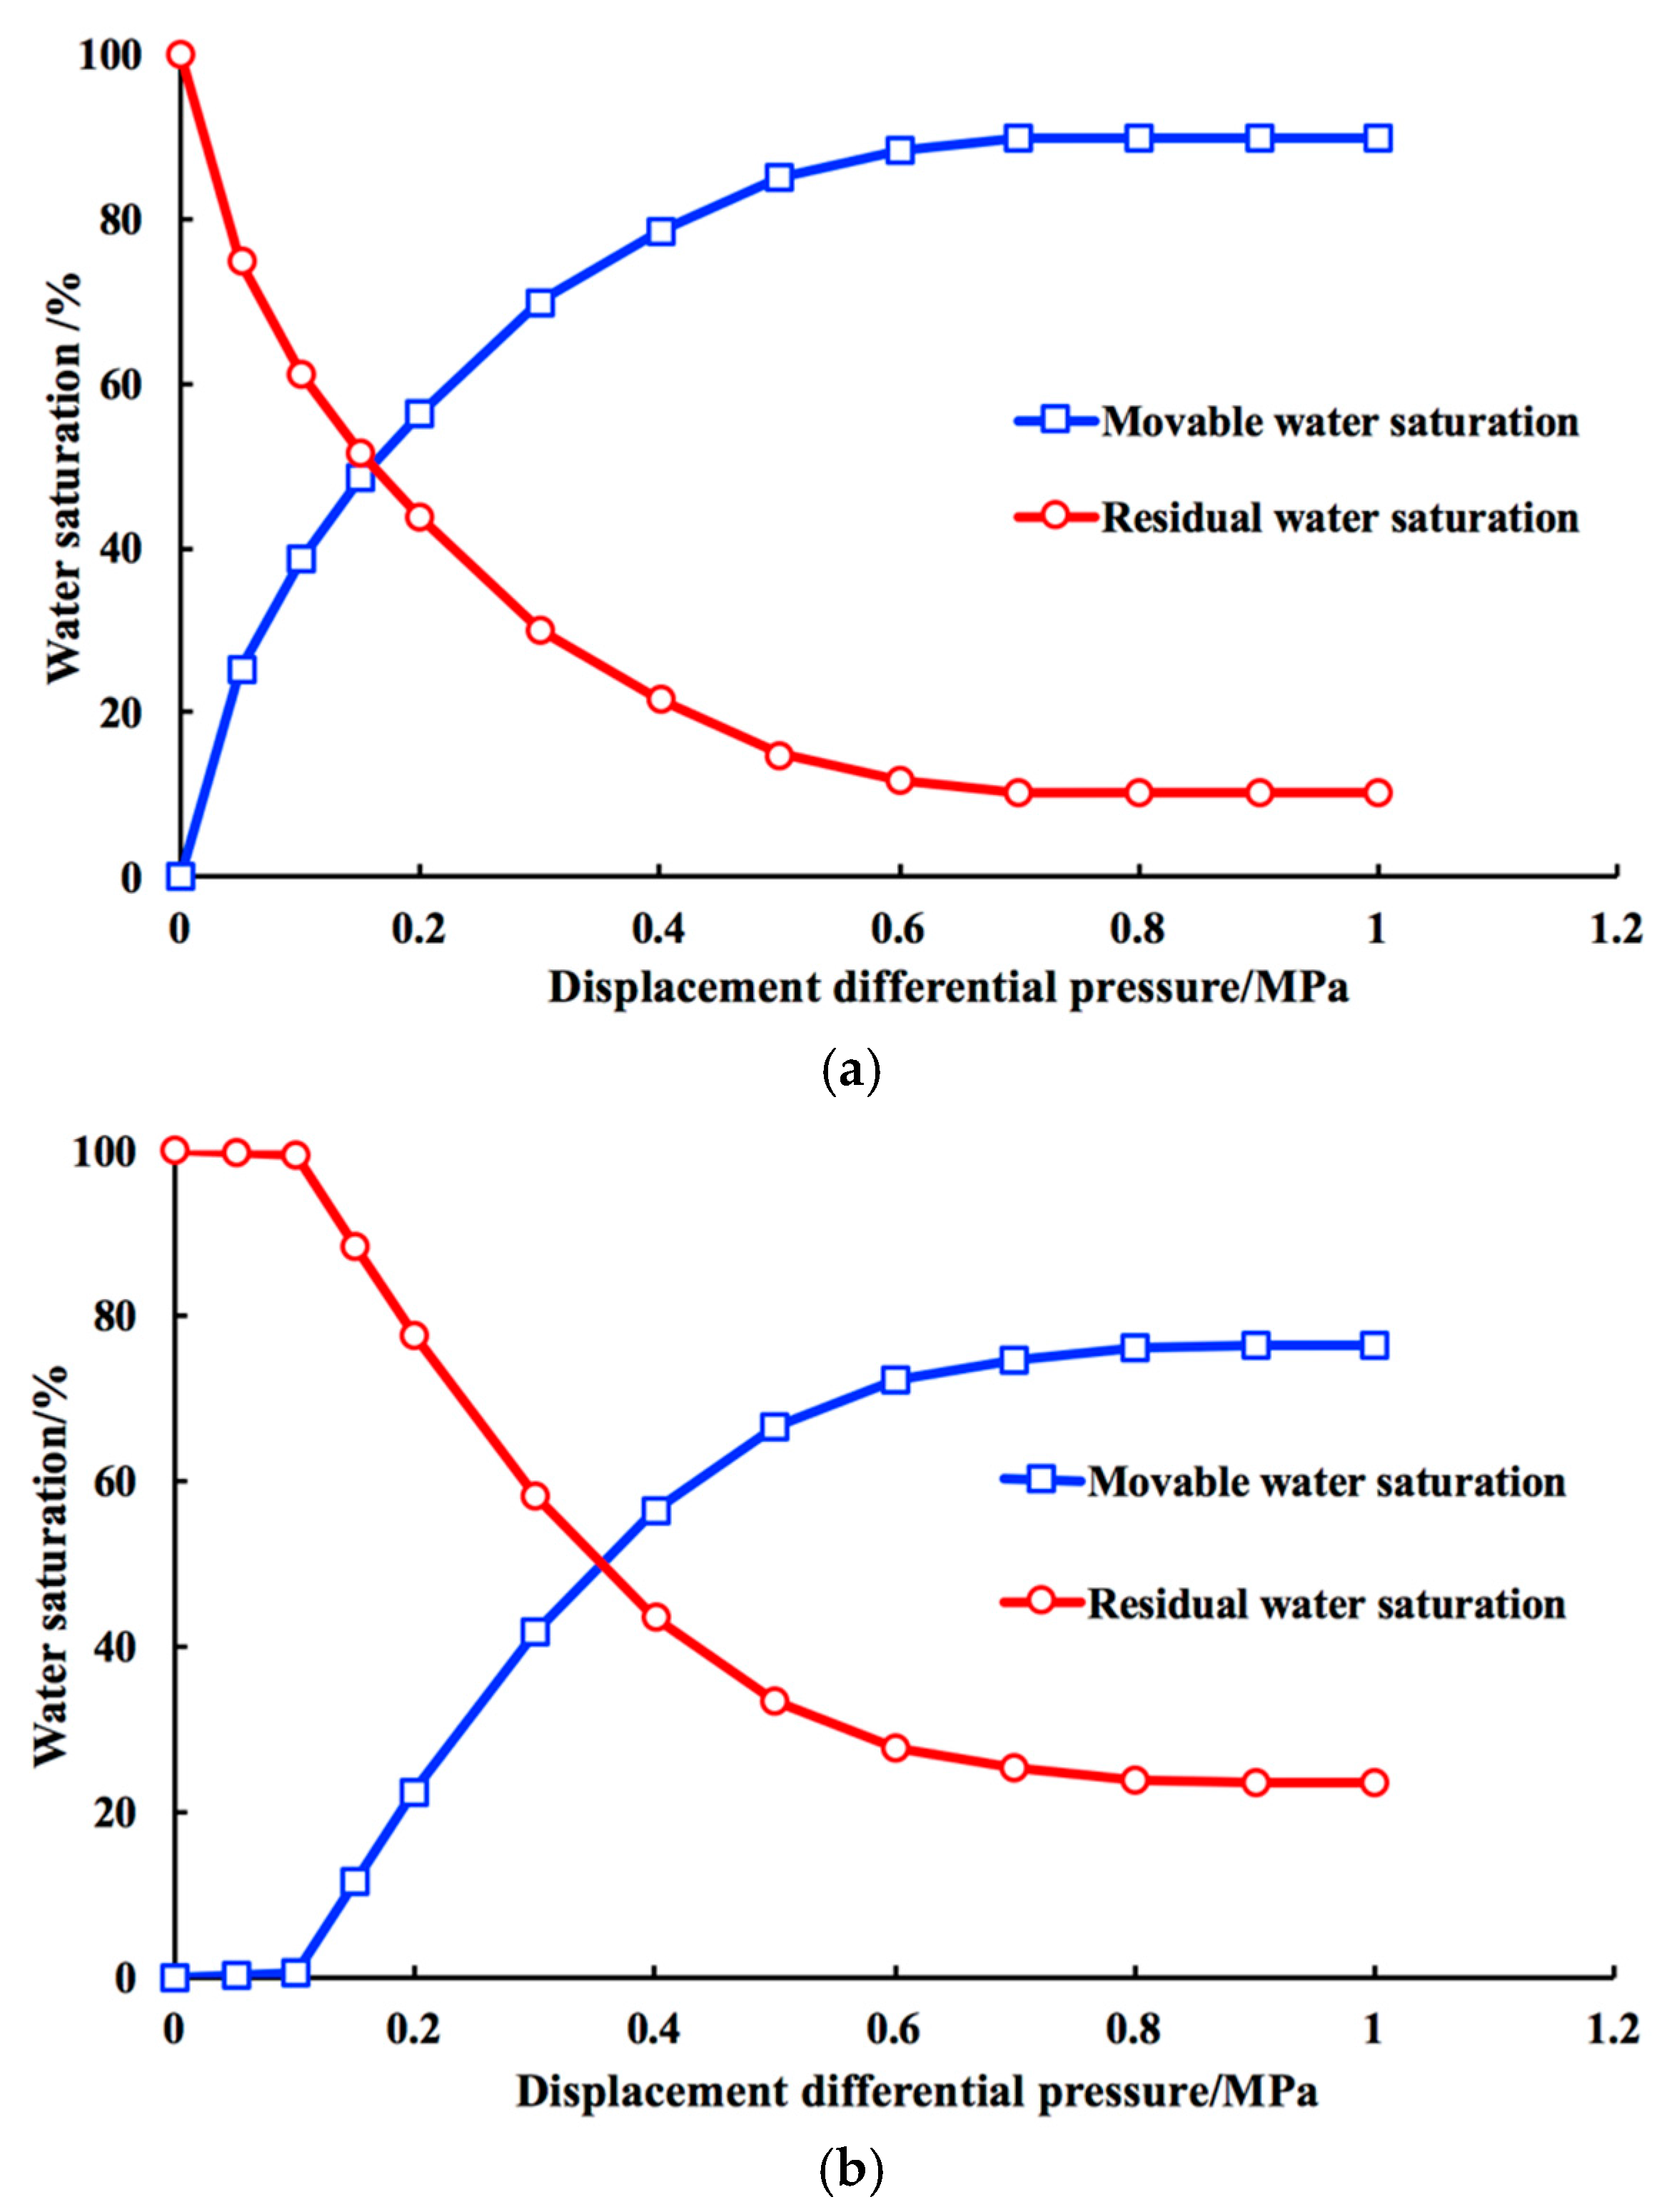
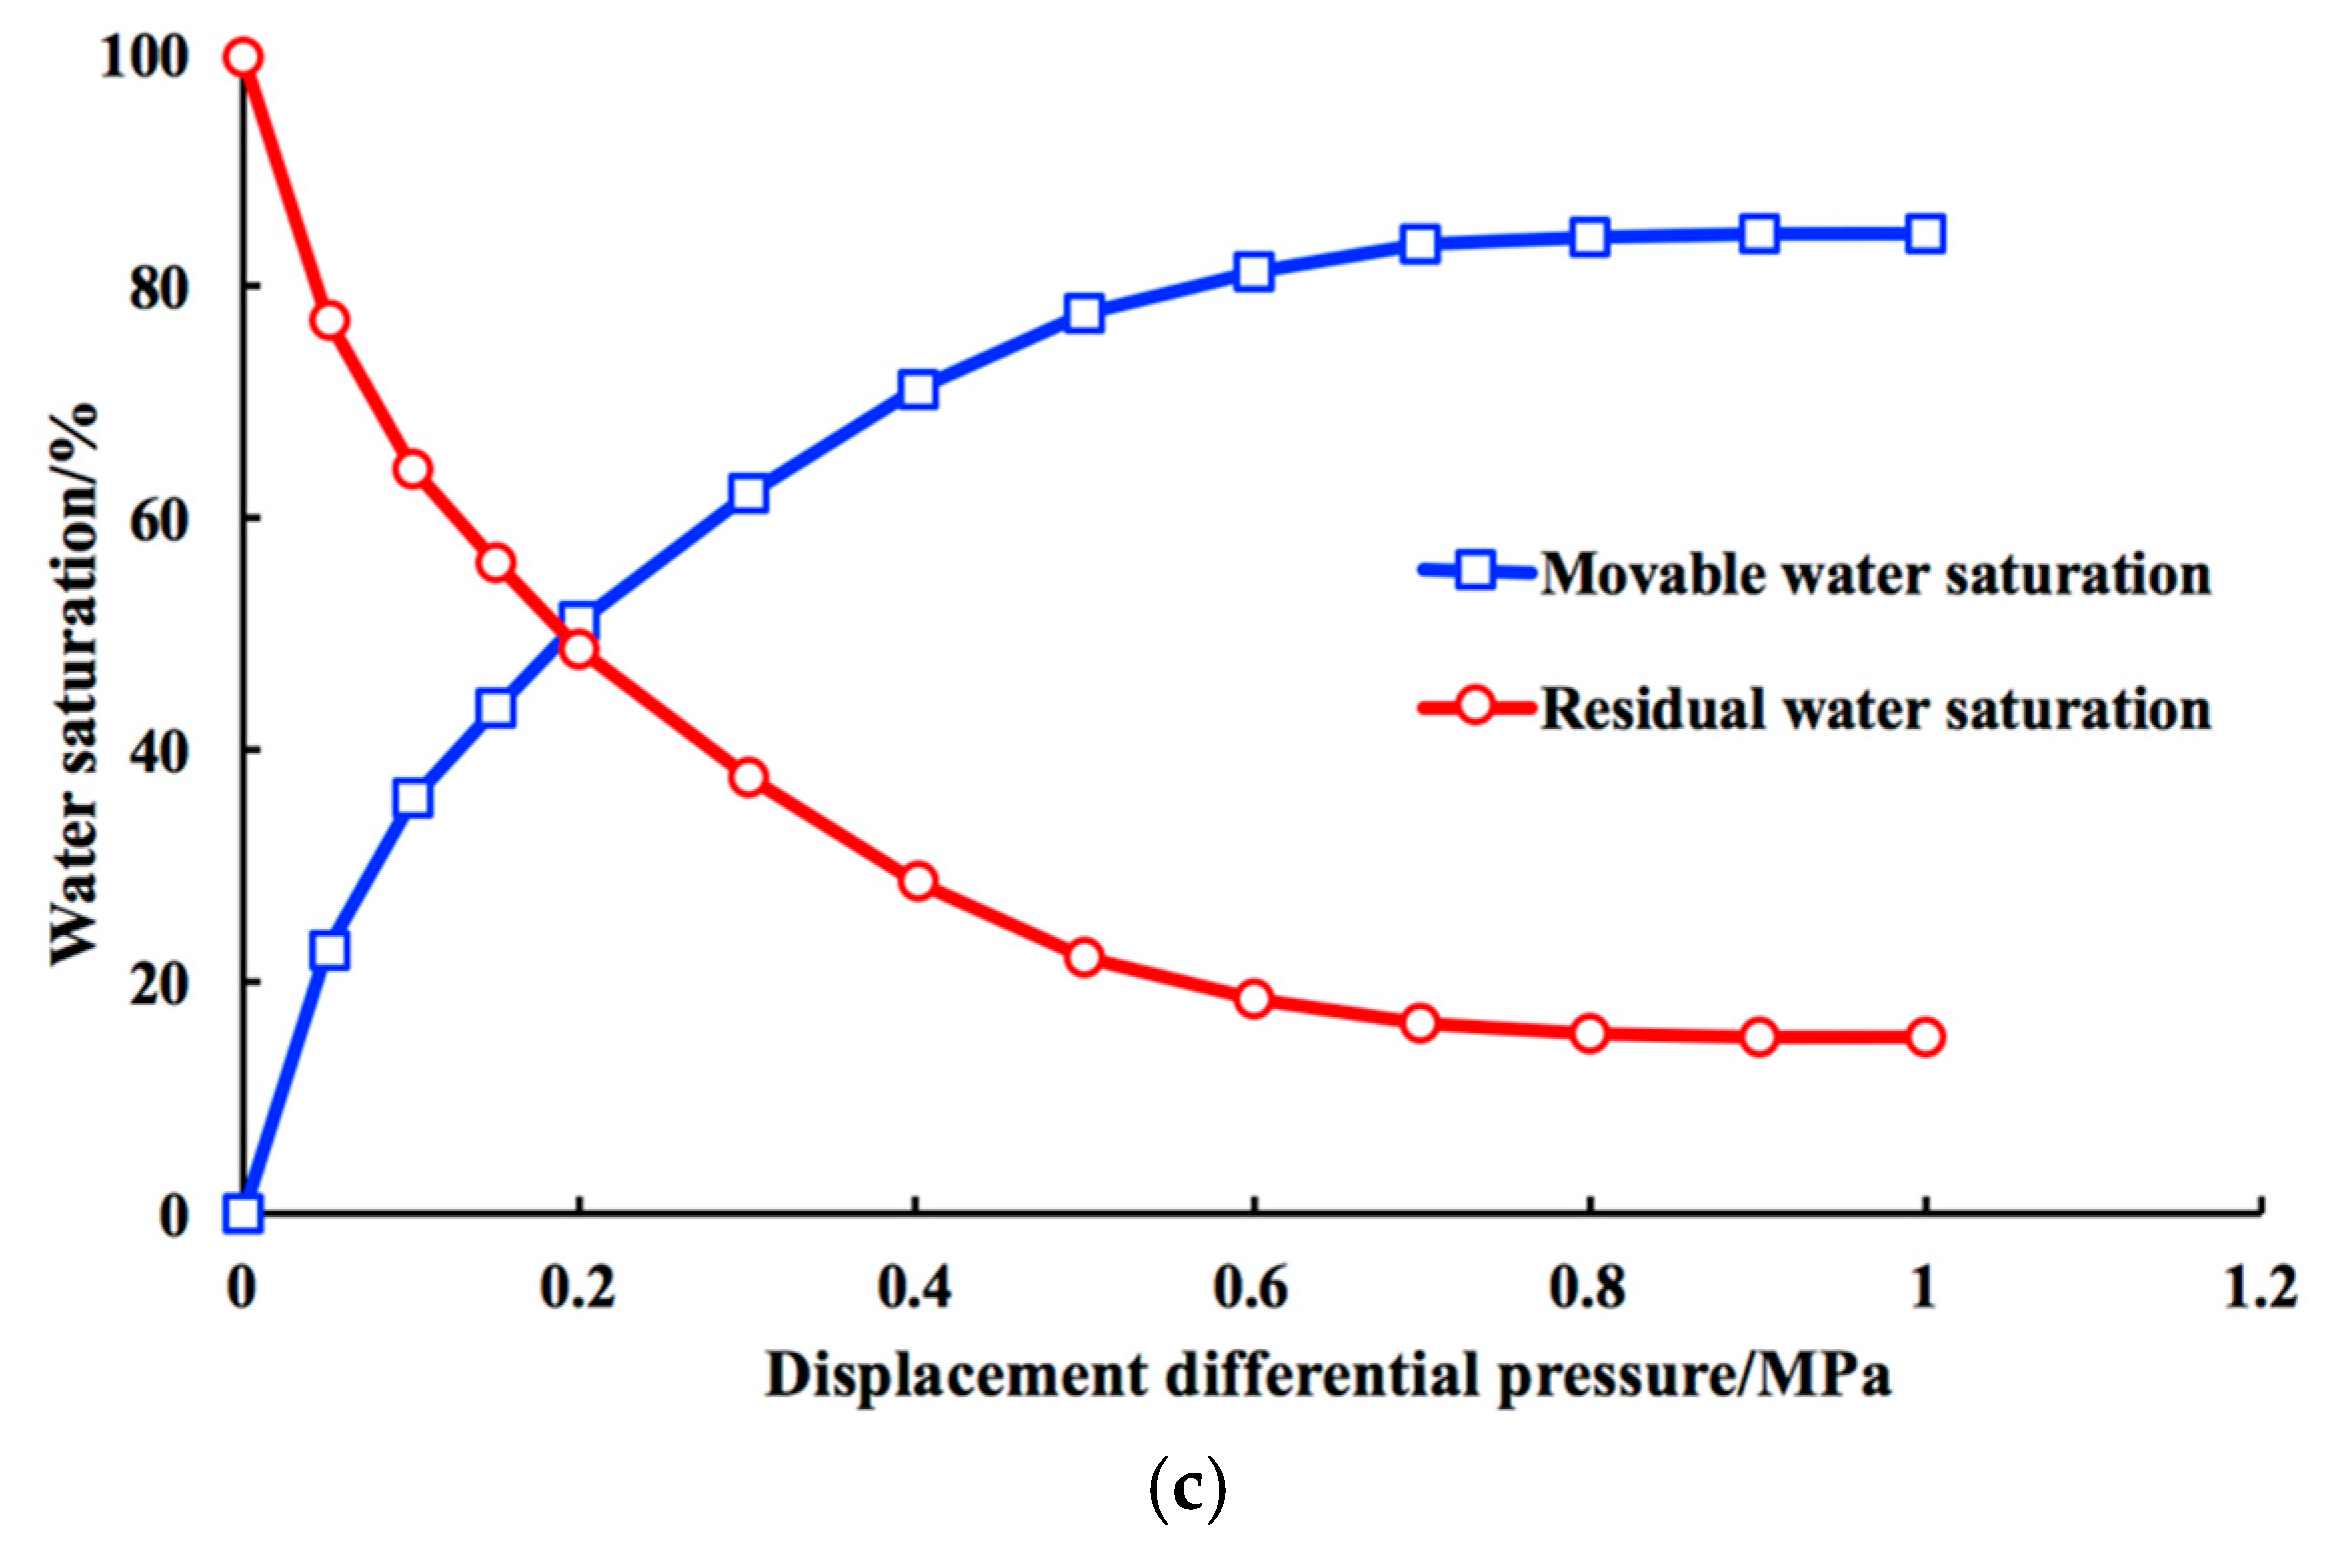
3.1. Formation Mechanism of Residual Water in Different Types of Reservoirs
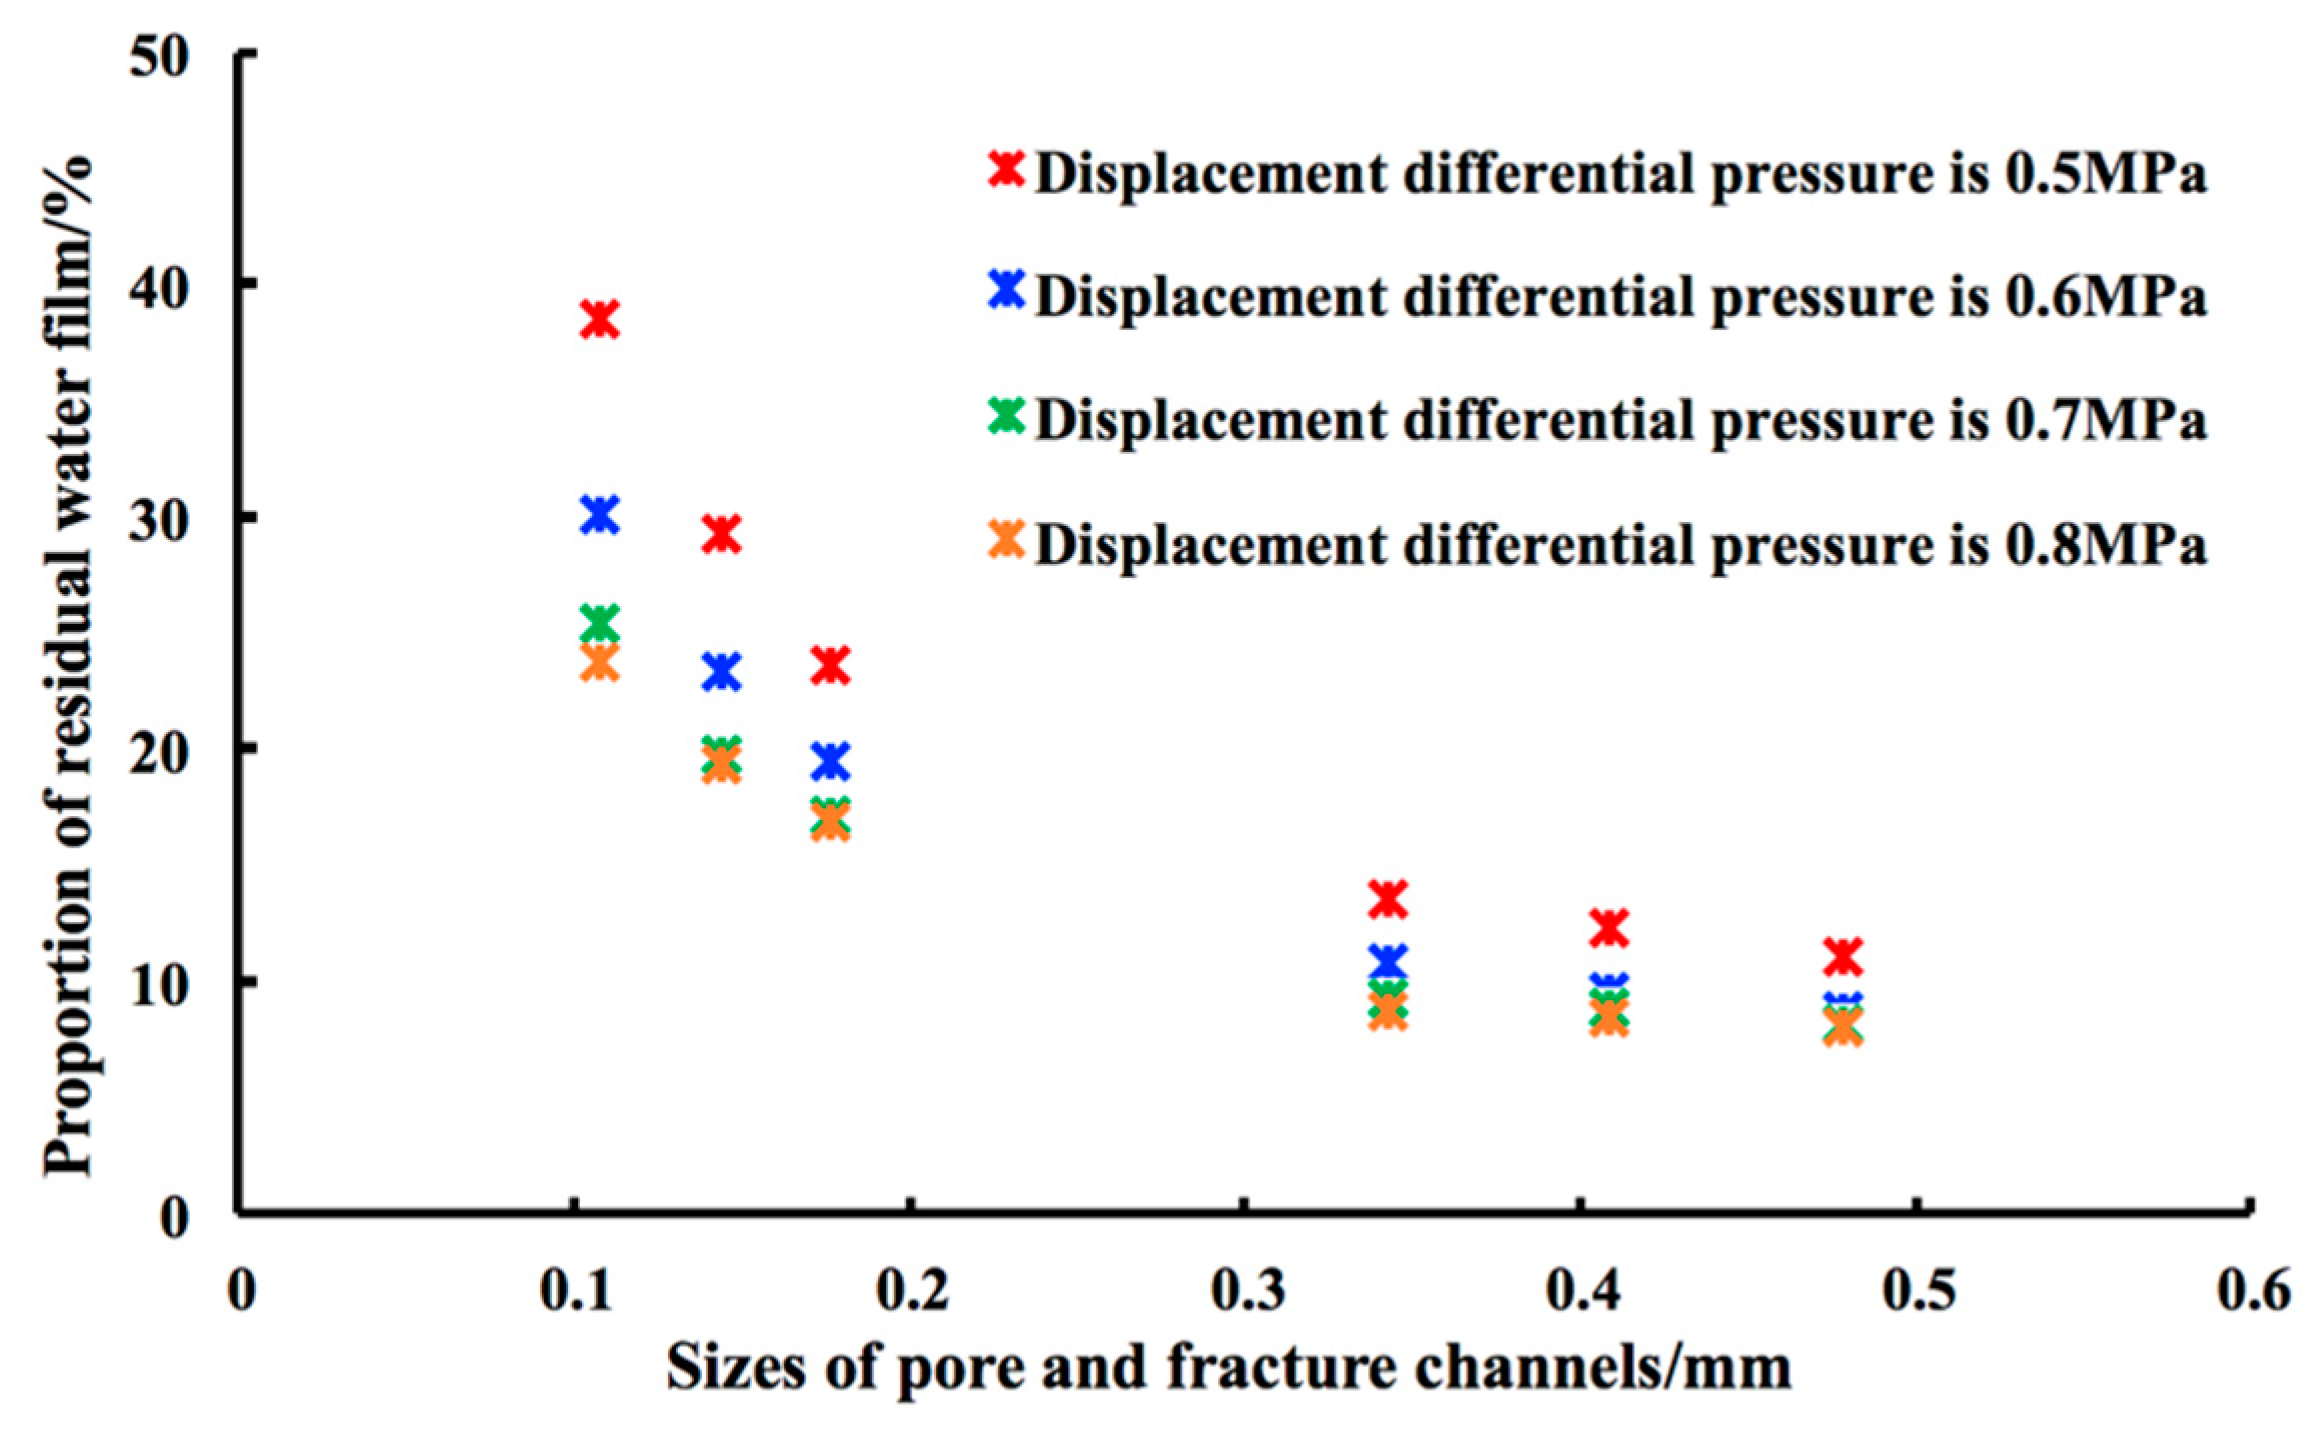
3.2. Occurrence States of Residual Water and Its Effect on Gas Seepage capability
3.3. Quantitative Results and Analysis of ImageJ
4. Conclusions
Acknowledgements
Author Contributions
Conflicts of interest
References
- Wu, Y.S.; Di, Y.; Kang, Z.J.; Fakcharoenphol, P. A multiple-continuum model for simulating single-phase and multiphase flow in naturally fractured vuggy reservoirs. J. Pet. Sci. Eng. 2011, 78, 13–22. [Google Scholar] [CrossRef]
- Wang, L.; Yang, S.L.; Liu, Y.C.; Xu, W.; Deng, H.; Meng, Z.; Han, W.; Qian, K. Experiments on gas supply capability of commingled production in a fracture–cavity carbonate gas reservoir. Pet. Explor. Dev. 2017, 44, 824–833. [Google Scholar] [CrossRef]
- Wang, L.; Yang, S.L.; Meng, Z.; Chen, Y.Z.; Qian, K.; Han, W.; Wang, D.F. Time-dependent shape factors for fractured reservoir simulation: Effect of stress sensitivity in matrix system. J. Pet. Sci. Eng. 2018, 163, 556–569. [Google Scholar] [CrossRef]
- Feng, Y.; Gray, K.E. Modeling lost circulation through drilling-induced fractures. SPE J. 2018, 23, 205–223. [Google Scholar] [CrossRef]
- Feng, Y.; Jones, J.F.; Gray, K.E. A review on fracture-initiation and -propagation pressures for lost circulation and wellbore strengthening. SPE Drill. Compl. 2016, 31, 134–144. [Google Scholar] [CrossRef]
- Feng, Y.; Gray, K.E. Review of fundamental studies on lost circulation and wellbore strengthening. J. Pet. Sci. Eng. 2017, 152, 511–522. [Google Scholar] [CrossRef]
- Hu, Y.; Shao, Y.; Lu, J.L.; Zhang, Y.F. Experimental study on occurrence models of water in pores and the influencing to the development of tight gas reservoir. Nat. Gas Geosci. 2011, 22, 176–181. [Google Scholar]
- Wang, X.M.; Zhao, J.Z.; Liu, X.S. Occurrence state and production mechanism of formation water in tight sandstone reservoirs of Sulige area, Ordos Basin. Pet. Geol. Exp. 2012, 34, 400–405. [Google Scholar]
- Zhu, H.Y.; Xu, X.; Gao, Y.; Hu, Y.; An, L.Z.; Guo, C.M. Occurrence characteristics of tight sandstone pore water and its influence on gas seepage: A case study from the Denglouku gas reservoir in the Changling Gas Field, Southern Songliao Basin. Nat. Gas Ind. 2014, 34, 54–58. [Google Scholar]
- Zhu, H.Y.; Xu, X.; An, L.Z.; Guo, C.M.; Xiao, J.R. An experimental on occurrence and mobility of pore water in tight gas reservoirs. Acta Petrol. Sin. 2016, 37, 230–236. [Google Scholar]
- Li, C.H.; Li, X.Z.; Gao, S.S.; Liu, H.X.; You, S.Q.; Fang, F.F.; Shen, W.J. Experiment on gas-water two-phase seepage and inflow performance curves of gas wells in carbonate reservoirs: A case study of Longwangmiao Formation and Dengying Formation in Gaoshiti-Moxi block, Sichuan Basin, SW China. Pet. Explor. Dev. 2017, 44, 930–938. [Google Scholar] [CrossRef]
- Xiao, B.Q.; Zhang, X.; Wang, W.; Long, G.B.; Chen, H.X. A fractal model for water flow through unsaturated porous rocks. Fractals 2018, 26, 1840015. [Google Scholar] [CrossRef]
- Xiao, B.Q.; Wang, W.; Fan, J.T.; Chen, H.X.; Hu, X.L.; Zhao, D.S.; Zhang, X.; Ren, W. Optimization of the fractal-like architecture of porous fibrous materials related to permeability, diffusivity and thermal conductivity. Fractals 2017, 25, 1750030. [Google Scholar] [CrossRef]
- Xiao, B.Q.; Chen, H.X.; Xiao, S.X.; Cai, J.C. Research on relative permeability of nanofibers with capillary pressure effect by means of fractal-monte carlo technique. J. Nanosci. Nanotechnol. 2017, 17, 6811–6817. [Google Scholar] [CrossRef]
- Chatenever, A.; Calhoun, J.C., Jr. Visual examinations of fluid behavior in porous media-Part I. J. Pet. Technol. 1952, 4, 149–156. [Google Scholar] [CrossRef]
- Wan, J.; Tokunaga, T.K.; Tsang, C.; Bodvarsson, G.S. Improved glass micromodel methods for studies of flow and transport in fractured porous media. Water Resour. Res. 1996, 32, 1955–1964. [Google Scholar] [CrossRef]
- Buchgraber, M.; Al-Dossary, M.; Ross, C.M.; Kovscek, A.R. Creation of a dual-porosity micromodel for pore-level visualization of multiphase flow. J. Pet. Sci. Eng. 2012, 86–87, 27–38. [Google Scholar] [CrossRef]
- Mohammadi, S.; Maghzi, A.; Ghazanfari, M.H.; Masihi, M.; Mohebbi, A.; Kharrat, R. On the control of glass micro-model characteristics developed by laser technology. Energy Sources Part A 2013, 35, 193–201. [Google Scholar] [CrossRef]
- Mattax, C.C.; Kyte, J.R. Ever see a waterflood? Oil Gas J. 1961, 59, 115–128. [Google Scholar]
- Mohammadi, S.; Ghazanfari, M.H.; Masihi, M. A pore-level screening study on miscible/immiscible displacements in heterogeneous models. J. Pet. Sci. Eng. 2013, 110, 40–54. [Google Scholar] [CrossRef]
- Sayegh, S.G.; Fisher, D.B. Enhanced oil recovery by CO2 flooding in homogeneous and heterogeneous 2D micromodels. J. Can. Pet. Technol. 2009, 48, 30–36. [Google Scholar] [CrossRef]
- Wang, J.; Dong, M.; Asghari, K. Effect of oil viscosity on heavy oil-water relative permeability curves. In Proceedings of the 15th SPE-DOE Improved Oil Recovery Symposium, Tulsa, OK, USA, 22–26 April 2006. [Google Scholar]
- Bai, B.; Missouri-Rolla, U.O.; Liu, Y.; Coste, J.P.; and Li, L. Preformed particle gel for conformance control: Transport mechanism through porous media. SPE Reserv. Eval. Eng. 2007, 10, 176–184. [Google Scholar] [CrossRef]
- Wang, Y.Z.; Liu, H.Q.; Pang, Z.X.; Gao, M. Visualization study on plugging characteristics of temperature-resistant gel during steam flooding. Energy Fuels 2016, 30, 6968–6976. [Google Scholar] [CrossRef]
- Wu, Z.B.; Liu, H.Q.; Pang, Z.X.; Wu, Y.L.; Wang, X.; Liu, D.; Gao, M. A visual investigation of enhanced heavy oil recovery by foam flooding after hot water injection. J. Pet. Sci. Eng. 2016, 147, 361–370. [Google Scholar] [CrossRef]
- Soudmand-Asli, A.; Ayatollahi, S.S.; Mohabatkar, H.; Zareie, M.; Shariatpanahi, S.F. The in situ, microbial enhanced oil recovery in fractured porous media. J. Pet. Sci. Eng. 2007, 58, 161–172. [Google Scholar] [CrossRef]
- Mosavat, N.; Torabi, F. Micro-optical analysis of carbonated water injection in irregular and heterogeneous pore geometry. Fuel 2016, 175, 191–201. [Google Scholar] [CrossRef]
- George, D.S.; Hayat, O.; Kovscek, A.R. A microvisual study of solution-gas-drive mechanism in viscous oils. J. Pet. Sci. Eng. 2005, 46, 101–119. [Google Scholar] [CrossRef]
- Chen, H.; Yang, S.L.; Ren, S.S.; Yu, D.H.; Li, F.F.; Lu, H.; Zhang, X. Crude Oil Displacement Efficiency of Produced Gas Re-injection. Int. J. Green Energy 2013, 10, 566–573. [Google Scholar] [CrossRef]
- Hatiboglu, C.U.; Babadagli, T. Experimental and visual analysis of co- and counter-current spontaneous imbibition for different viscosity ratios, interfacial tensions, and wettabilities. J. Pet. Sci. Eng. 2010, 70, 214–228. [Google Scholar] [CrossRef]
- Doryani, H.; Malayeri, M.R.; Riazi, M. Visualization of asphaltene precipitation and deposition in a uniformly patterned glass micromodel. Fuel 2016, 182, 613–622. [Google Scholar] [CrossRef]
- Smith, J.D.; Chatzis, I.; Ioannidis, M.A. A new technique to measure the breakthrough capillary pressure. J. Can. Pet. Technol. 2005, 44, 25–31. [Google Scholar] [CrossRef]
- Yun, W.; Kovscek, A.R. Microvisual investigation of polymer retention on the homogeneous pore network of a micromodel. J. Pet. Sci. Eng. 2015, 128, 115–127. [Google Scholar] [CrossRef]
- Romero-Zeron, L.B.; Kantzas, A. The effect of wettability and pore geometry on foamed-gel-blockage performance. SPE Reserv. Eval. Eng. 2007, 10, 150–163. [Google Scholar] [CrossRef]
- Mackay, E.J.; Henderson, G.D.; Tehrani, D.H.; Danesh, A.; Herlot-Watt, U. The importance of interfacial tension on fluid distribution during depressurization. SPE Reserv. Eval. Eng. 1997, 1, 408–415. [Google Scholar] [CrossRef]
- Bahralolom, I.M.; Orr, F.M. Solubility and extraction in multiple-vontact miscible displacements: Comparison of N2 and CO2 flow visual experiments. SPE Reserv. Eng. 1988, 3, 213–219. [Google Scholar] [CrossRef]
- Schneider, M.; Osselin, F.; Andrews, B.; Rezgui, F.; Tabeling, P. Wettability determination of core samples through visual rock and fluid imaging during fluid injection. J. Pet. Sci. Eng. 2011, 78, 476–485. [Google Scholar] [CrossRef]
- Lei, H.; Yang, S.L.; Zu, L.H.; Wang, Z.L.; Li, Y. Oil Recovery performance and CO2 storage potential of CO2 water-alternating-gas injection after continuous CO2 injection in a multilayer formation. Energy Fuels 2016, 30, 8922–8931. [Google Scholar] [CrossRef]
- Lei, H.; Yang, S.L.; Qian, K.; Chen, Y.; Li, Y.; Ma, Q.Z. Experimental investigation and application of the asphaltene precipitation envelope. Energy Fuels 2015, 29, 6920–6927. [Google Scholar] [CrossRef]
- Chen, H.; Zhang, X.S.; Chen, Y.; Tang, H.; Mei, Y.; Li, B.W.; Shen, X. Study on pressure interval of near-miscible flooding by production gas Re-injection in QHD offshore oilfield. J. Pet. Sci. Eng. 2017, 157, 340–348. [Google Scholar] [CrossRef]
- Chen, H.; Yang, S.L.; Zhang, X.S.; Ren, S.S.; Dong, K.; Li, Y.; Meng, Z.; Wang, L.; Lei, H.; Ma, Q.Z. Study of phase behavior and physical properties of a natural gas reservoir with high carbon dioxide content. Greenh. Gases-Sci. Technol. 2016, 6, 428–442. [Google Scholar] [CrossRef]
- Wang, L.; Yang, S.L.; Peng, X.; Deng, H.; Meng, Z.; Qian, K.; Wang, Z.L.; Lei, H. An improved visual investigation on gas–water flow characteristics and trapped gas formation mechanism of fracture–cavity carbonate gas reservoir. J. Nat. Gas Sci. Eng. 2018, 49, 213–236. [Google Scholar] [CrossRef]
- Li, M.C.; Li, J. “Dynamic trap”: A main action of hydrocarbon charging to form accumulations in low permeability-tight reservoir. Acta Pet. Sin. 2011, 31, 718–722. [Google Scholar]
- Dai, J.Y.; Li, J.T.; Wang, B.G.; Pan, R. Distribution regularity and formation mechanism of gas and water in the western area of Sulige gas field, NW China. Pet. Explor. Dev. 2012, 39, 560–566. [Google Scholar] [CrossRef]


| Core Number | Length (cm) | Diameter (cm) | Porosity (%) | Permeability (mD) | Core Type |
|---|---|---|---|---|---|
| 201400270147 | 4.384 | 2.518 | 2.75 | 2.658 | Fracture-type |
| 201400830059 | 4.900 | 2.518 | 6.48 | 0.734 | Cavity-type |
| 201400830021 | 4.560 | 2.510 | 8.31 | 3.928 | Fracture–cavity |
| Percentage of Natural Gas Components (%) | Relative Density | Pseudo-Critical Pressure (MPa) | Pseudo-Critical Temperature (K) | ||||||
|---|---|---|---|---|---|---|---|---|---|
| CH4 | C2H6 | C3H8 | N2 | CO2 | He | H2S | |||
| 93.13 | 0.07 | 0.01 | 0.73 | 5.01 | 0.03 | 1.02 | 0.6265 | 4.82 | 199.55 |
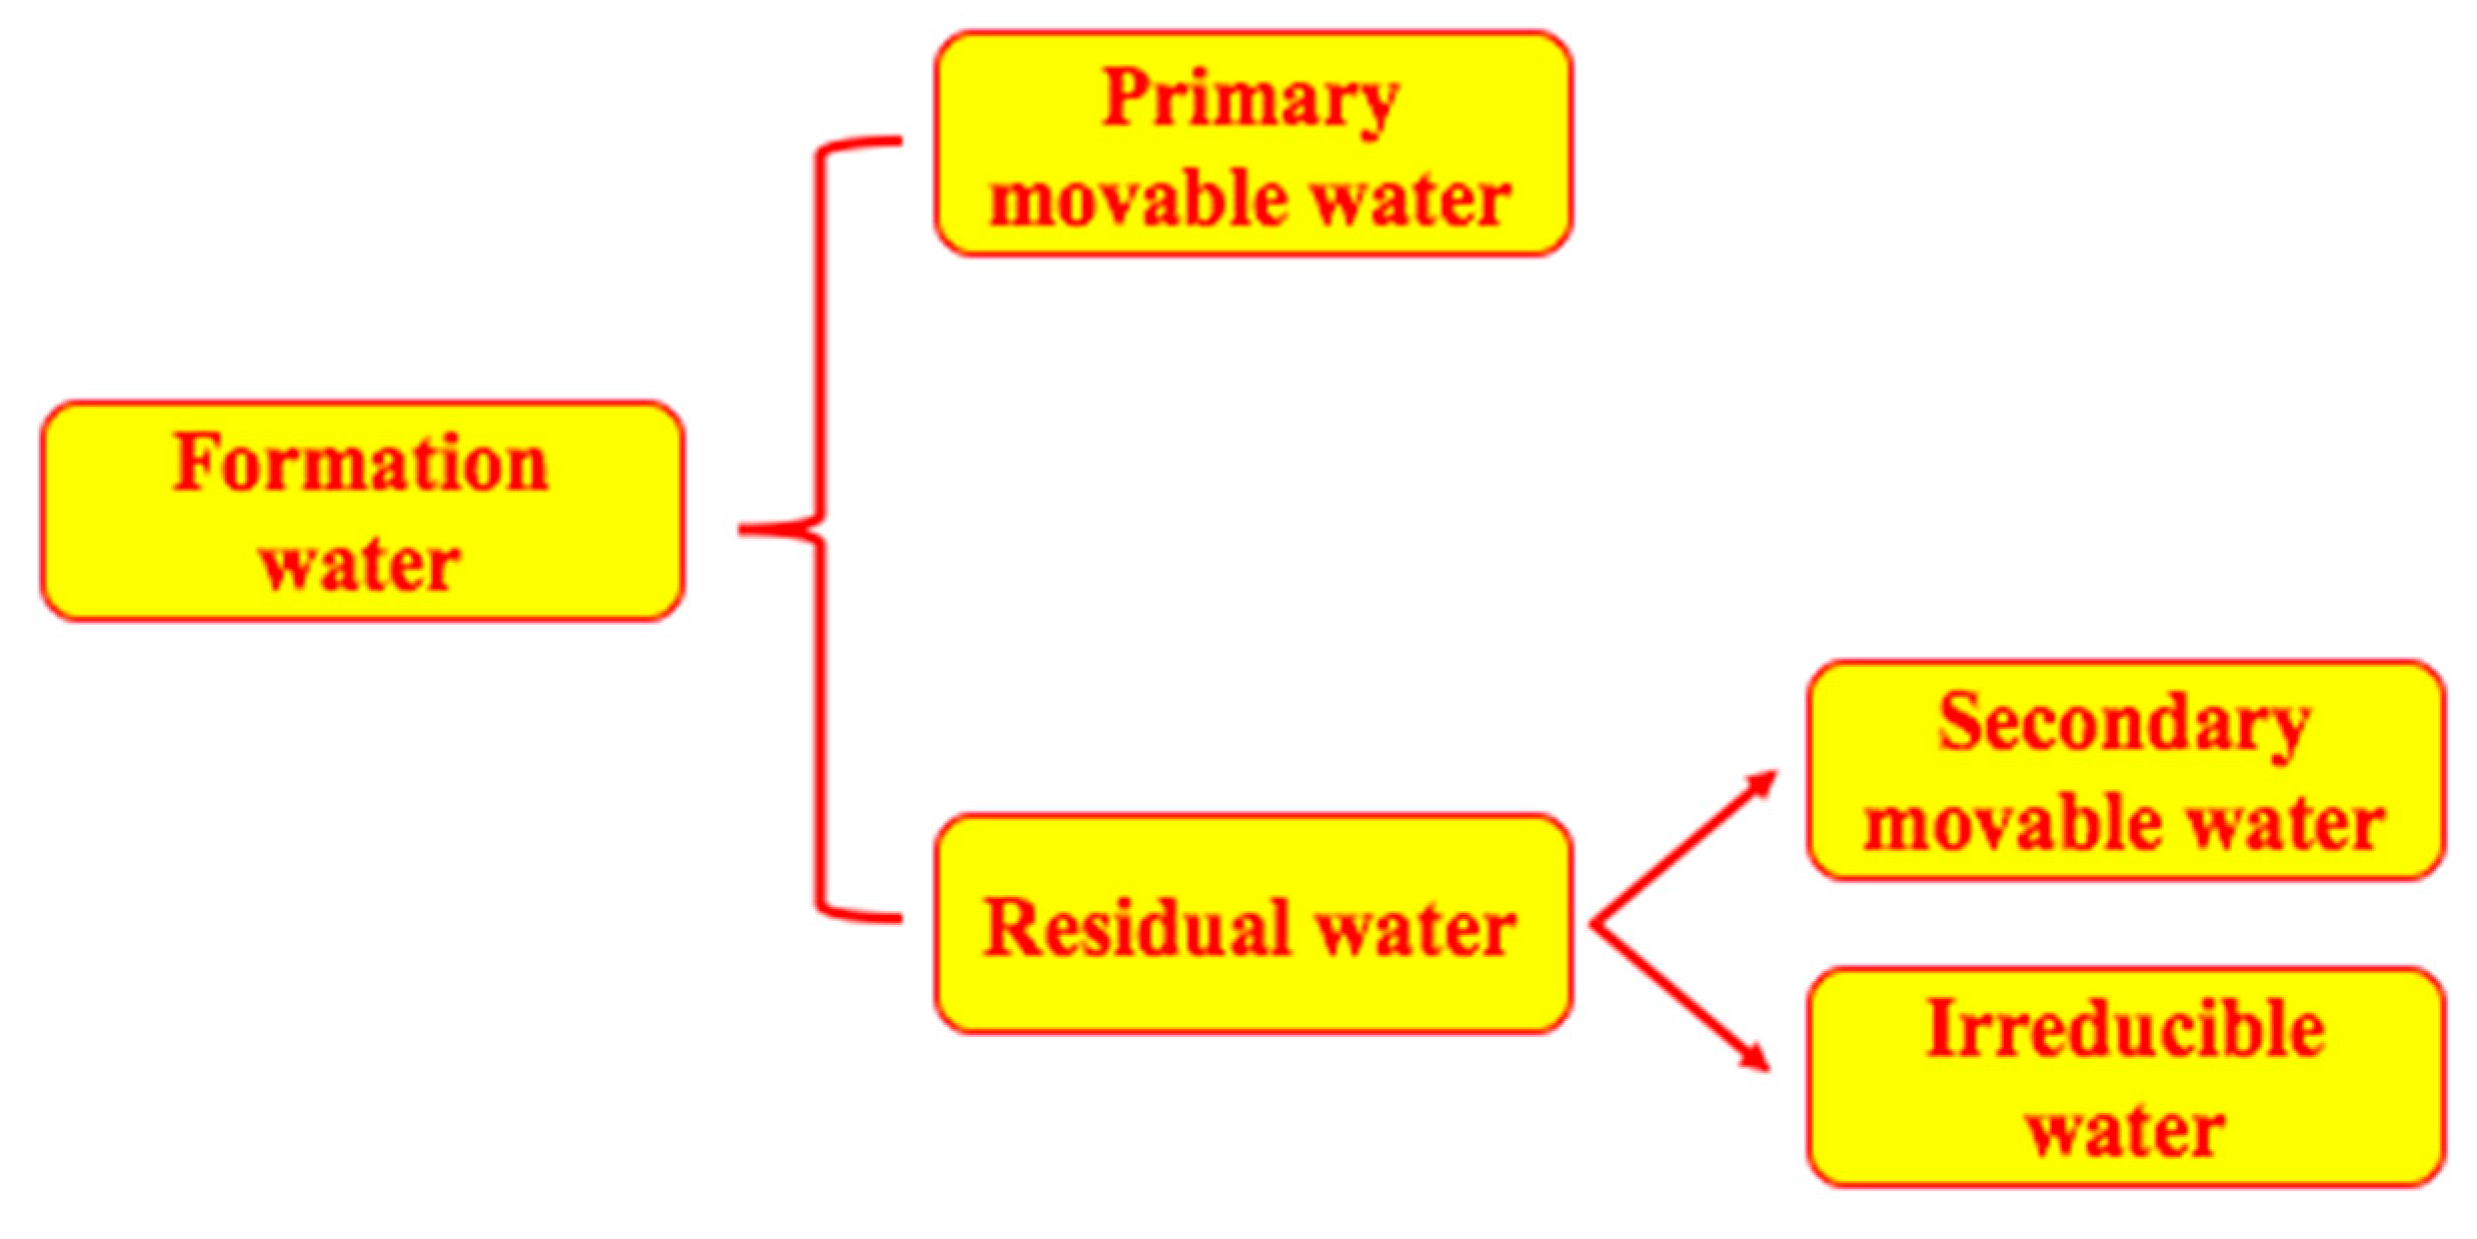
| Occurrence States | Influencing Factor | Forming Mechanism | Water Type |
|---|---|---|---|
| Residual thin water film on the fracture walls | Surface tension | Residual thin water film forms in the wide channels because of the low capillary resistance | Secondary movable water |
| Residual thick water film on the fracture walls | Capillary force | Residual thick water film forms in the narrow channel because of the high capillary resistance | Secondary movable water |
| Residual water mass at the bottom of cavity | Displacement pressure | The cavity is large and the capillary force can be neglected; the greater the displacement pressure, the smaller the residual water mass | Secondary movable water |
| Residual water column at the narrow throat channel | Jamin effect | The Jamin effect is serious in the narrow throat channel because of the high capillary resistance, leading the water column forms by cutoff phenomenon | Irreducible water |
| Residual water column at the long and narrow pore channel | Capillary force | When displacement pressure is low, the water column forms in the long-narrow pore channel because of the high capillary resistance | Secondary movable water |
| Residual water droplet at the dead end and blind corner | Channel connectivity | The water can be trapped by gas pressure when the channel connectivity is poor | Irreducible water |
© 2018 by the authors. Licensee MDPI, Basel, Switzerland. This article is an open access article distributed under the terms and conditions of the Creative Commons Attribution (CC BY) license (http://creativecommons.org/licenses/by/4.0/).
Share and Cite
Wang, L.; Yang, S.; Peng, X.; Deng, H.; Liao, Y.; Liu, Y.; Xu, W.; Yan, Y. Visual Investigation of the Occurrence Characteristics of Multi-Type Formation Water in a Fracture–Cavity Carbonate Gas Reservoir. Energies 2018, 11, 661. https://doi.org/10.3390/en11030661
Wang L, Yang S, Peng X, Deng H, Liao Y, Liu Y, Xu W, Yan Y. Visual Investigation of the Occurrence Characteristics of Multi-Type Formation Water in a Fracture–Cavity Carbonate Gas Reservoir. Energies. 2018; 11(3):661. https://doi.org/10.3390/en11030661
Chicago/Turabian StyleWang, Lu, Shenglai Yang, Xian Peng, Hui Deng, Yi Liao, Yicheng Liu, Wei Xu, and Youjun Yan. 2018. "Visual Investigation of the Occurrence Characteristics of Multi-Type Formation Water in a Fracture–Cavity Carbonate Gas Reservoir" Energies 11, no. 3: 661. https://doi.org/10.3390/en11030661