Risk-Based Two-Stage Stochastic Optimization Problem of Micro-Grid Operation with Renewables and Incentive-Based Demand Response Programs


Abstract
:1. Introduction
1.1. Motivation and Aim
1.2. Literature Review and Contributions
- Modeling the operation problem of an MG considering the non-linear economic models of the incentive-based DRPs and uncertainties of RERs as a risk-based two-stage optimization problem.
- Control the effects of RERs uncertainties on the optimal decisions of the MGO using the CVaR index.
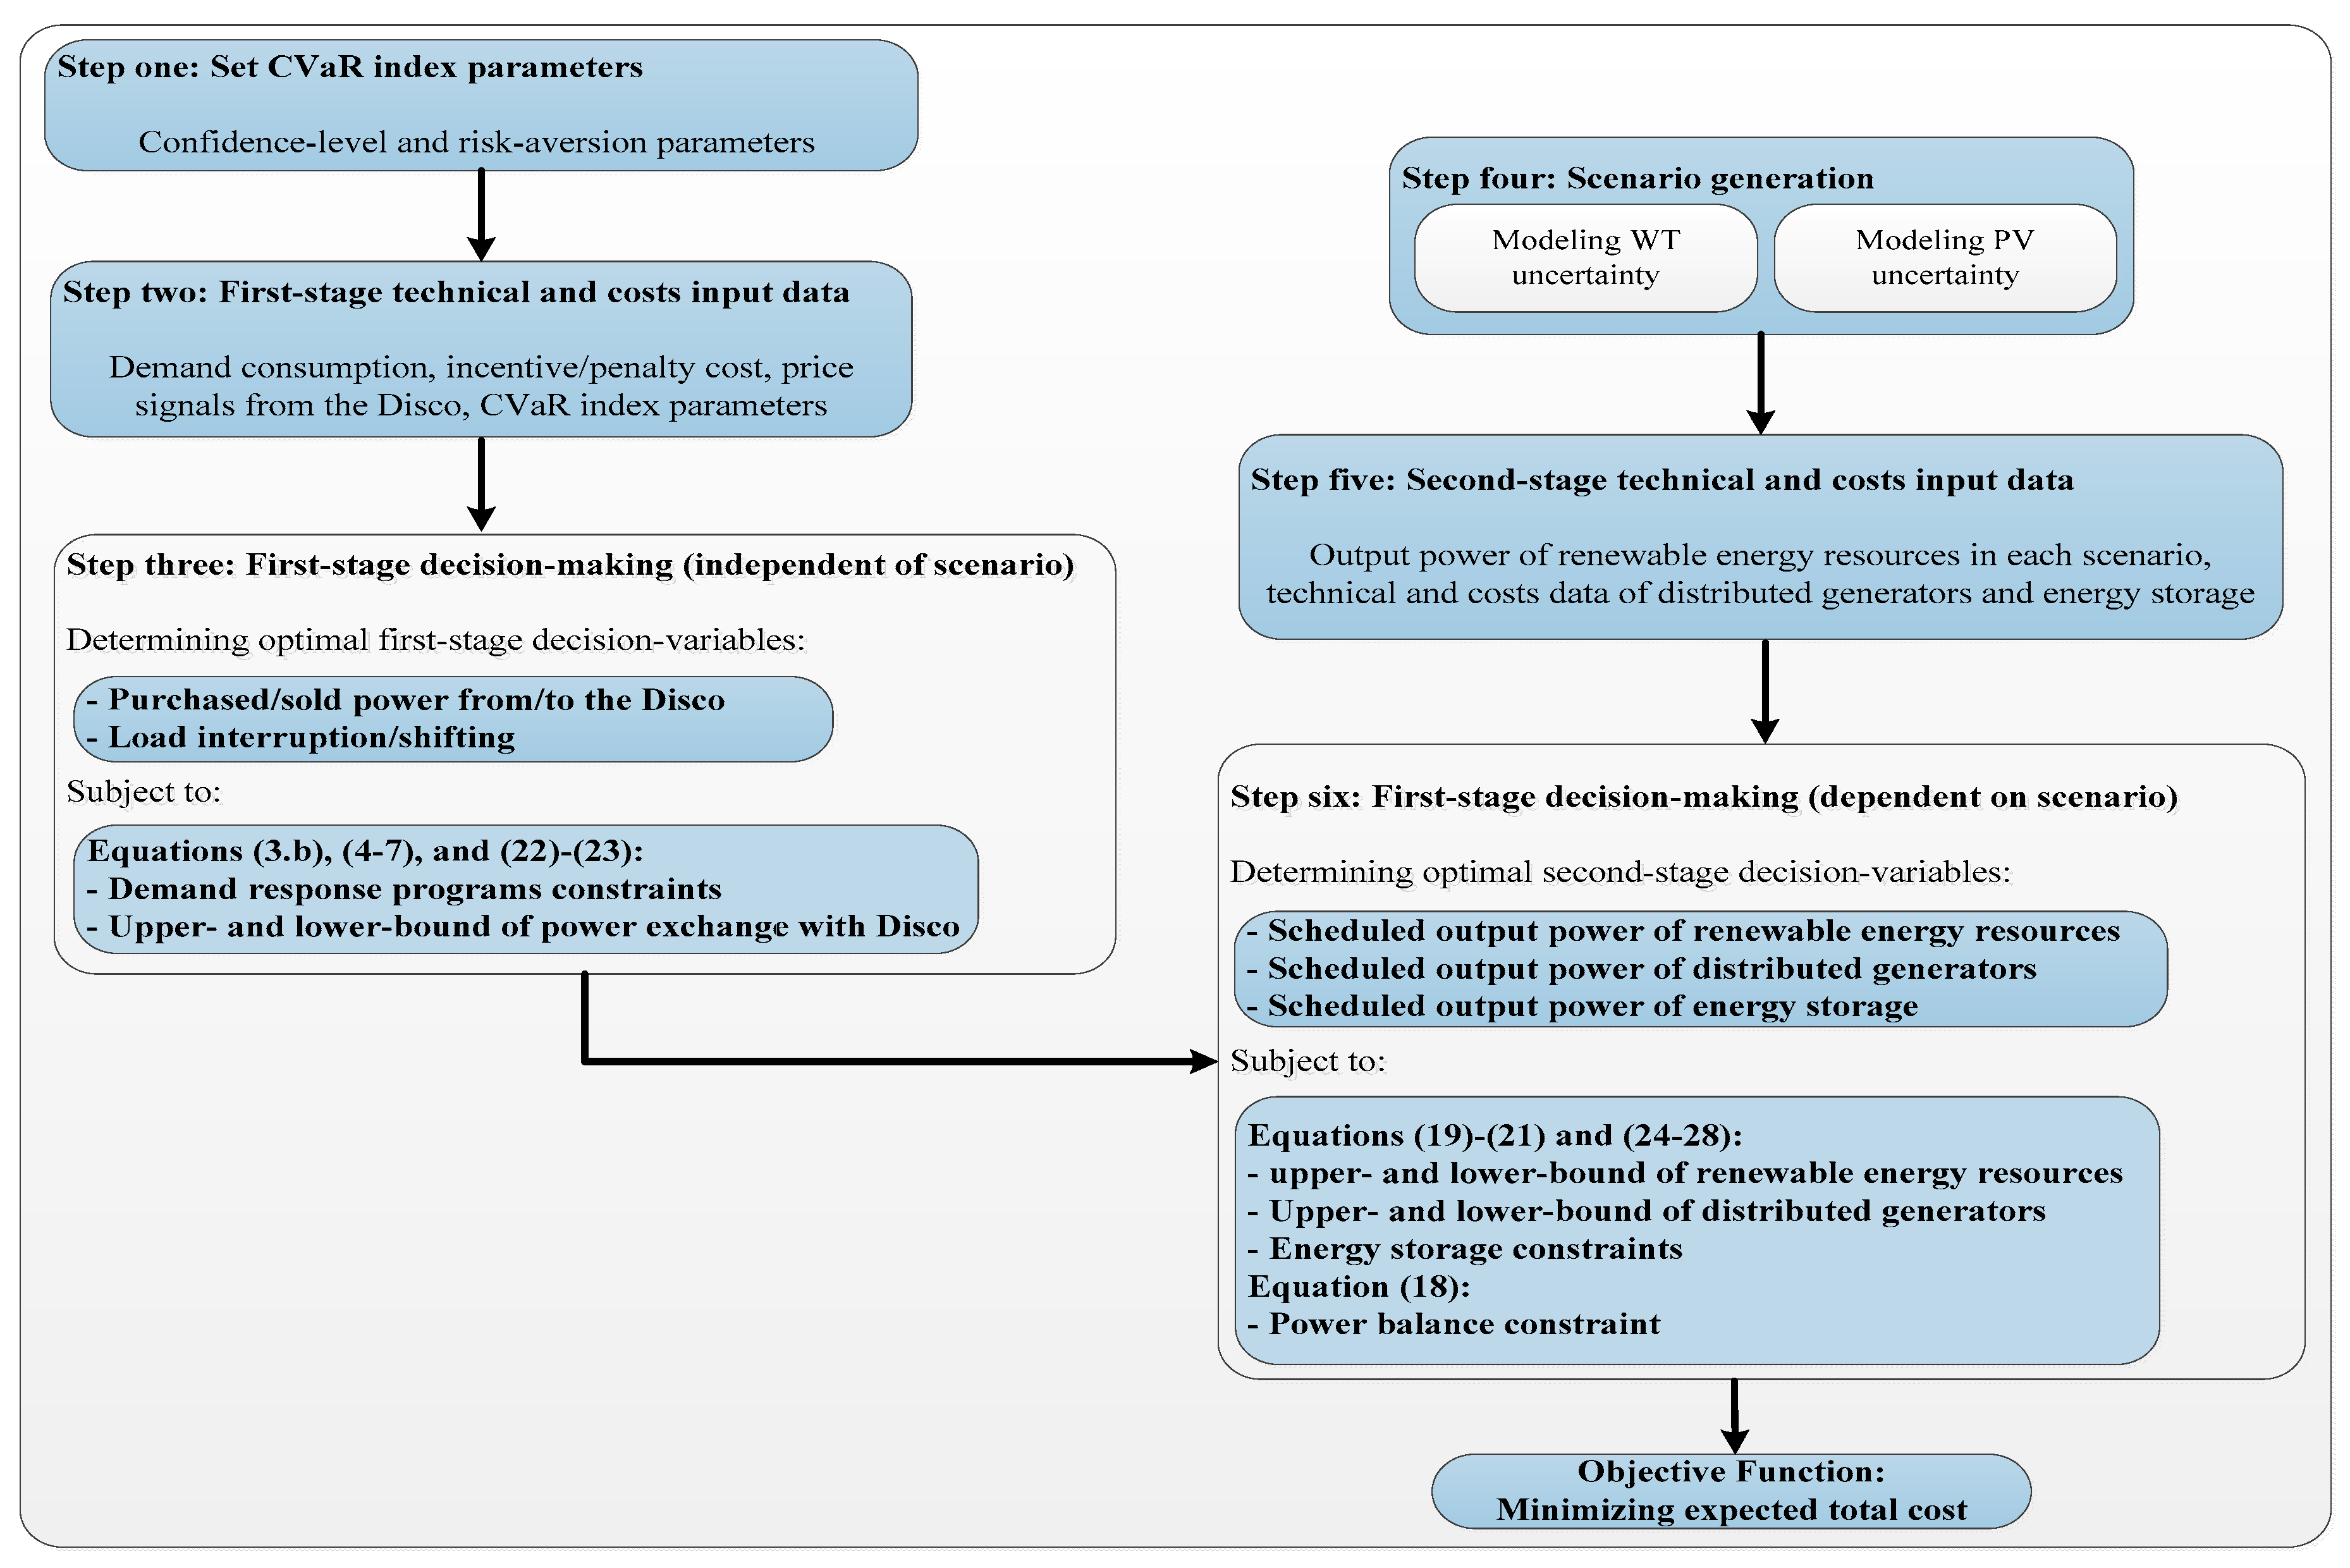
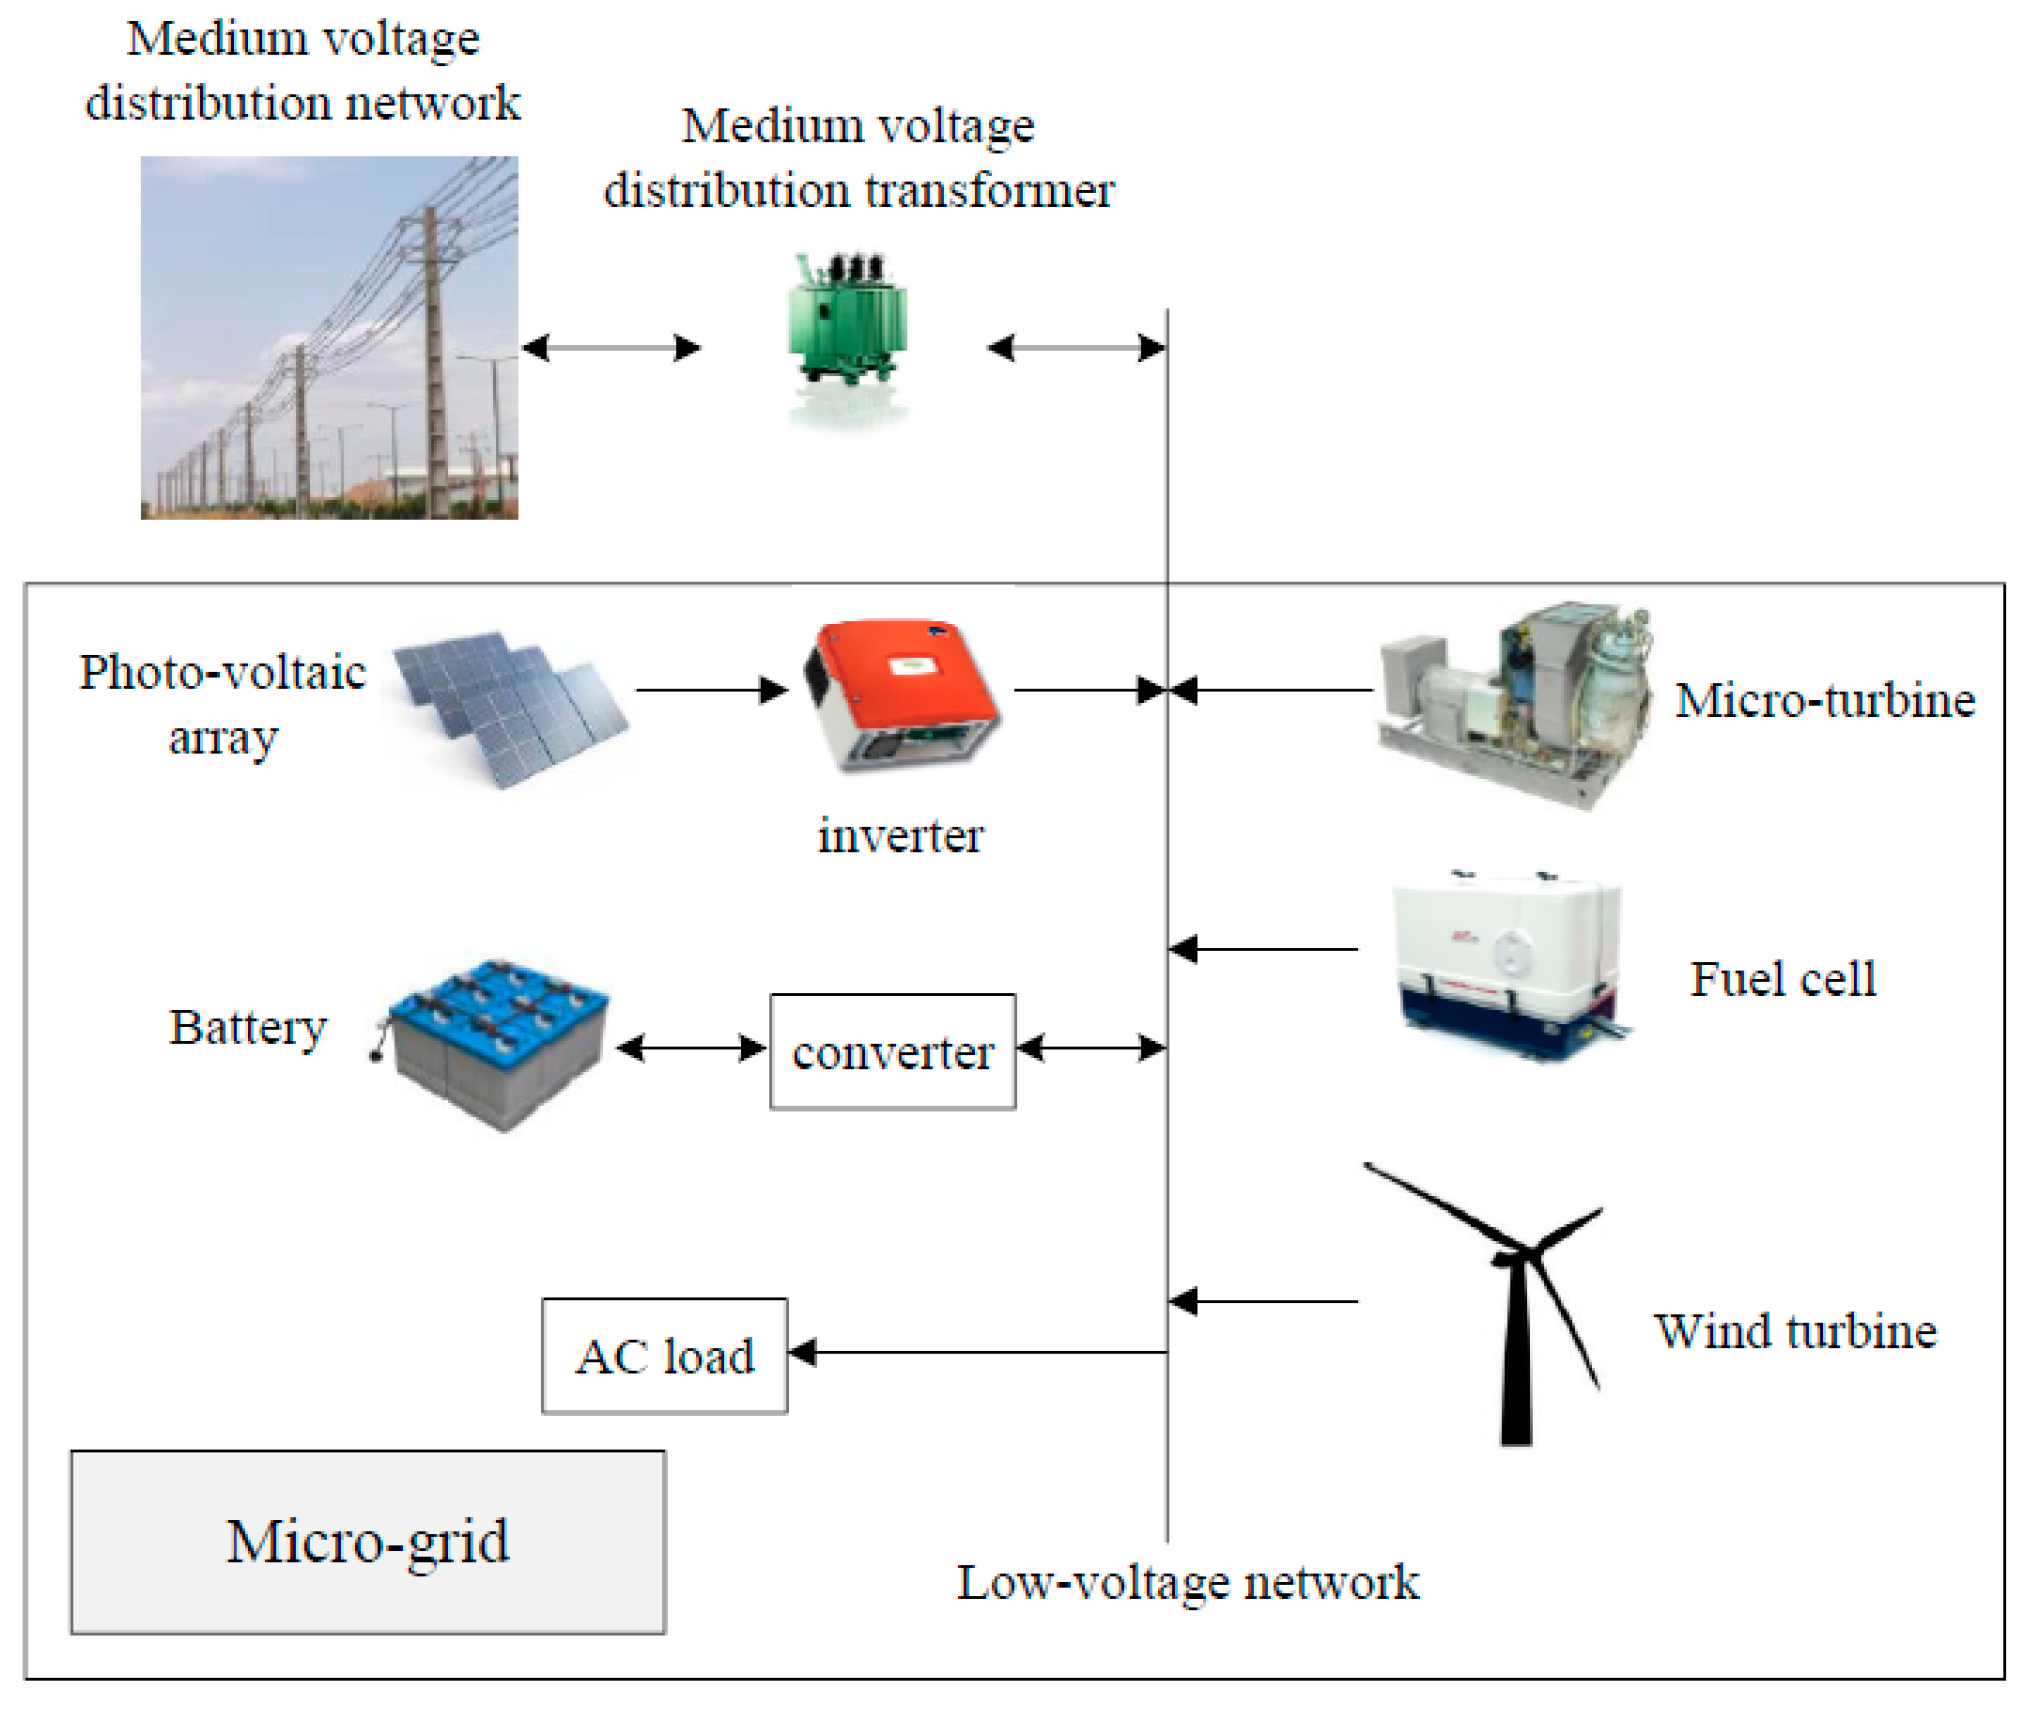
2. Problem Description
3. Mathematical Modeling
3.1. Assumptions
- The RERs’ uncertainties are only modeled in the MG operation problem and modeling the equipment failures; the factors that make interrupt the MG connection to the distribution network are beyond the scope of this paper.
- It is assumed that the end users are equipped with smart meters and the appropriate communication infrastructure is designed between the MGO and end-users to implement the DRPs.
3.2. Demand Response Models (DRMs)
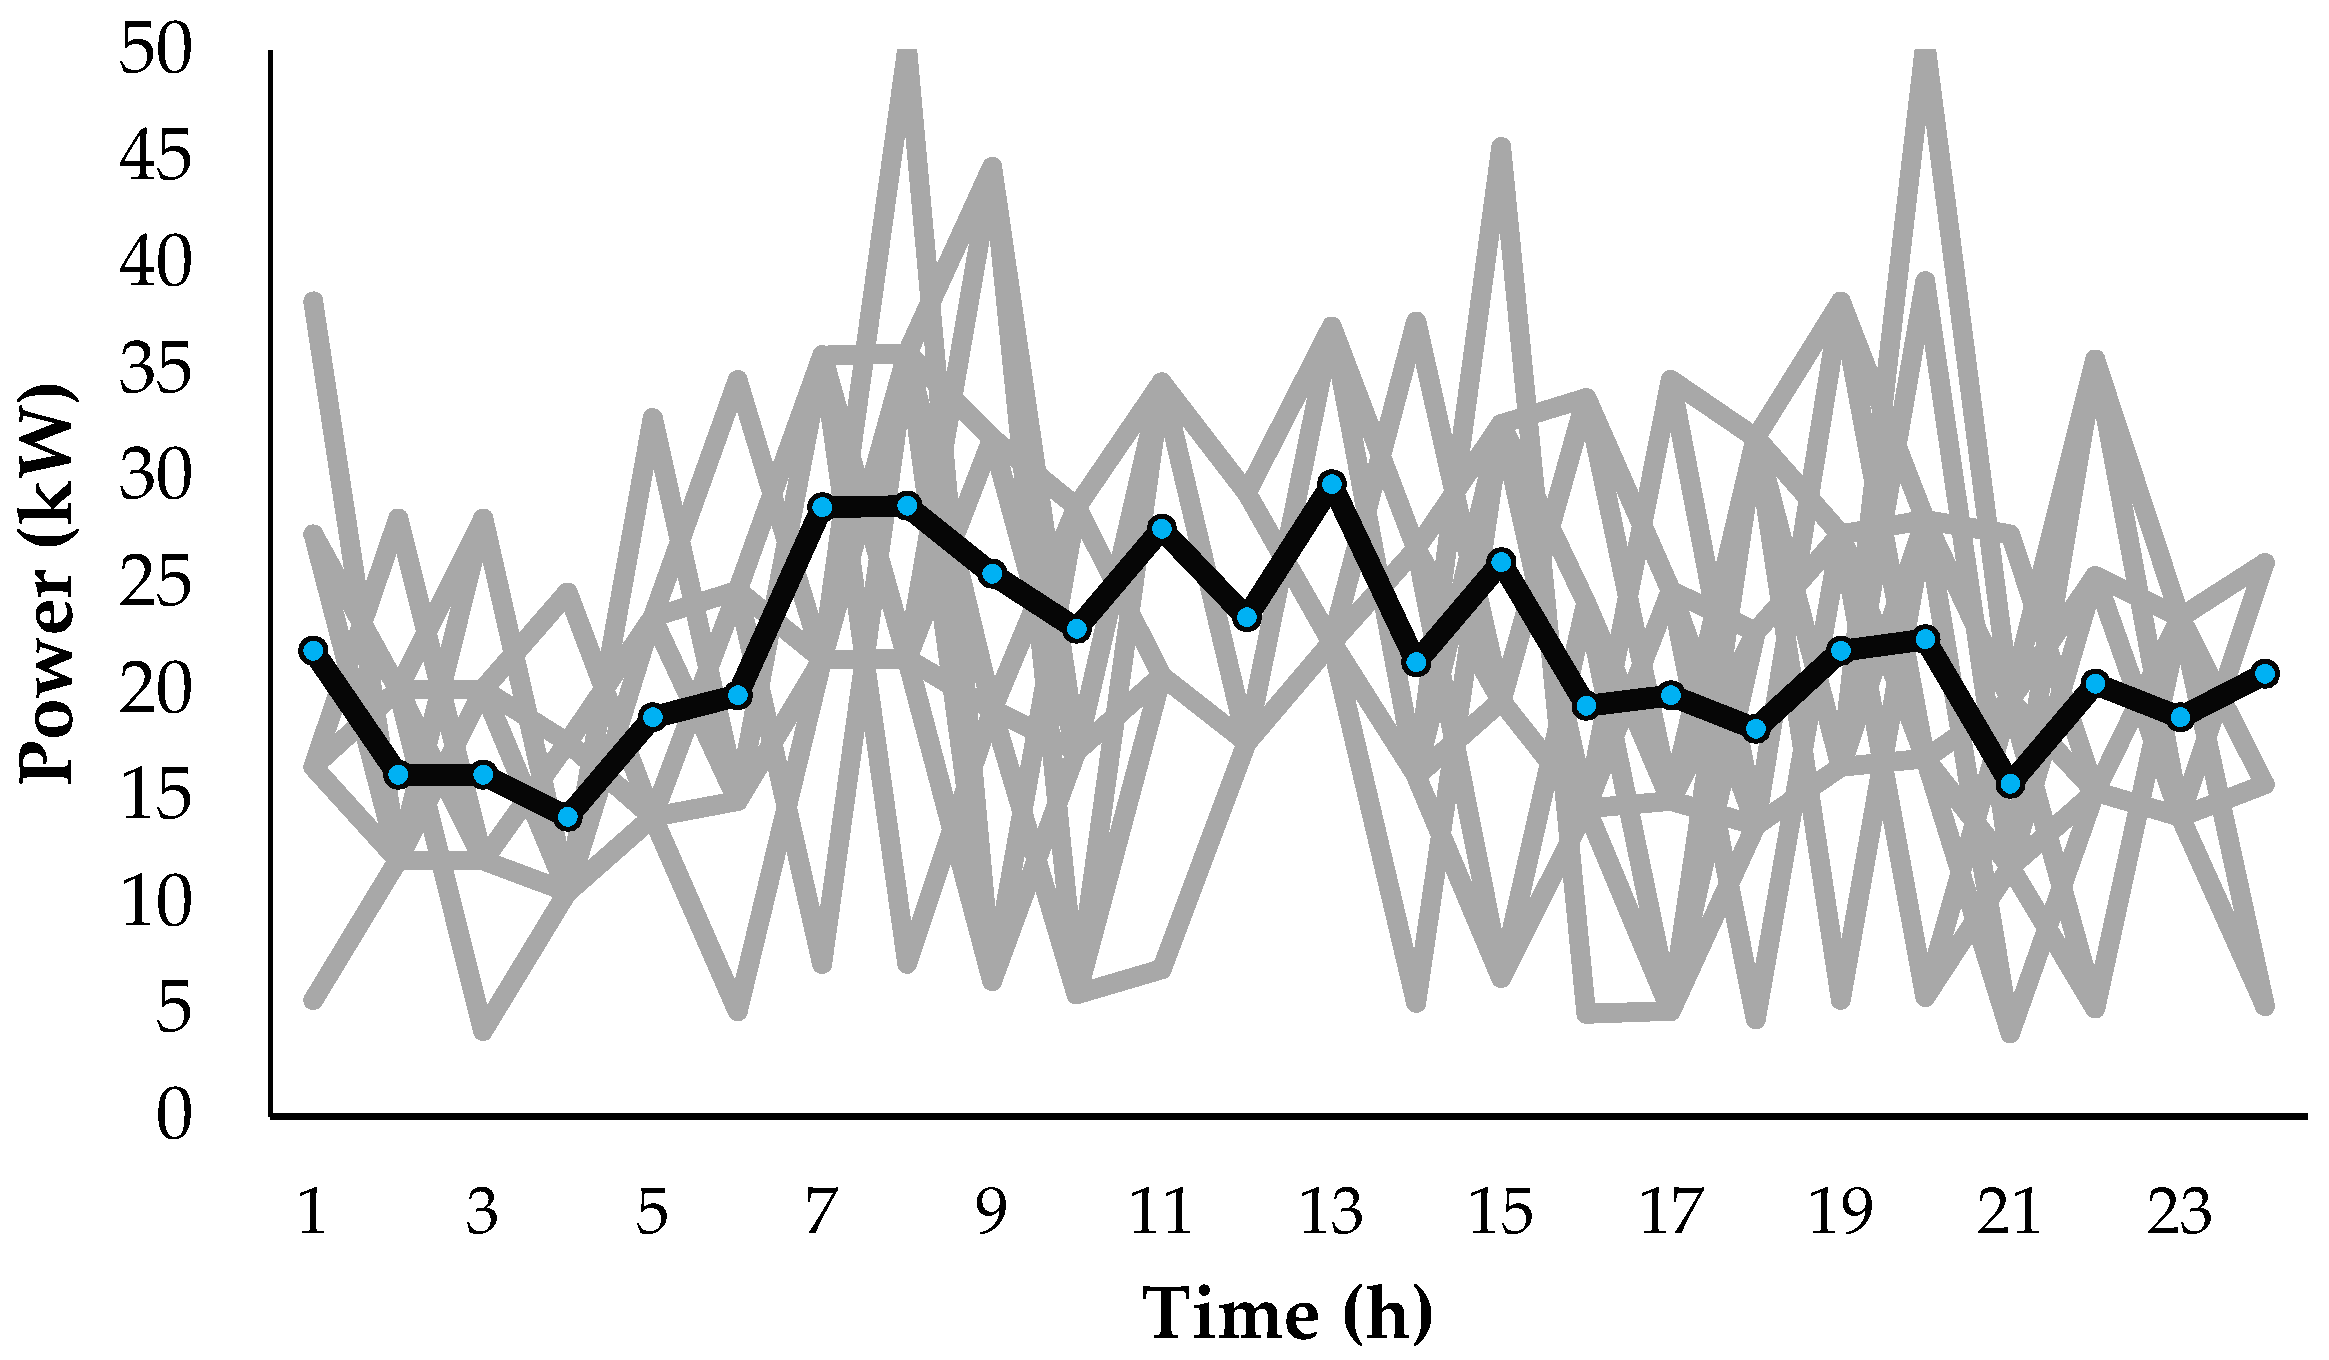
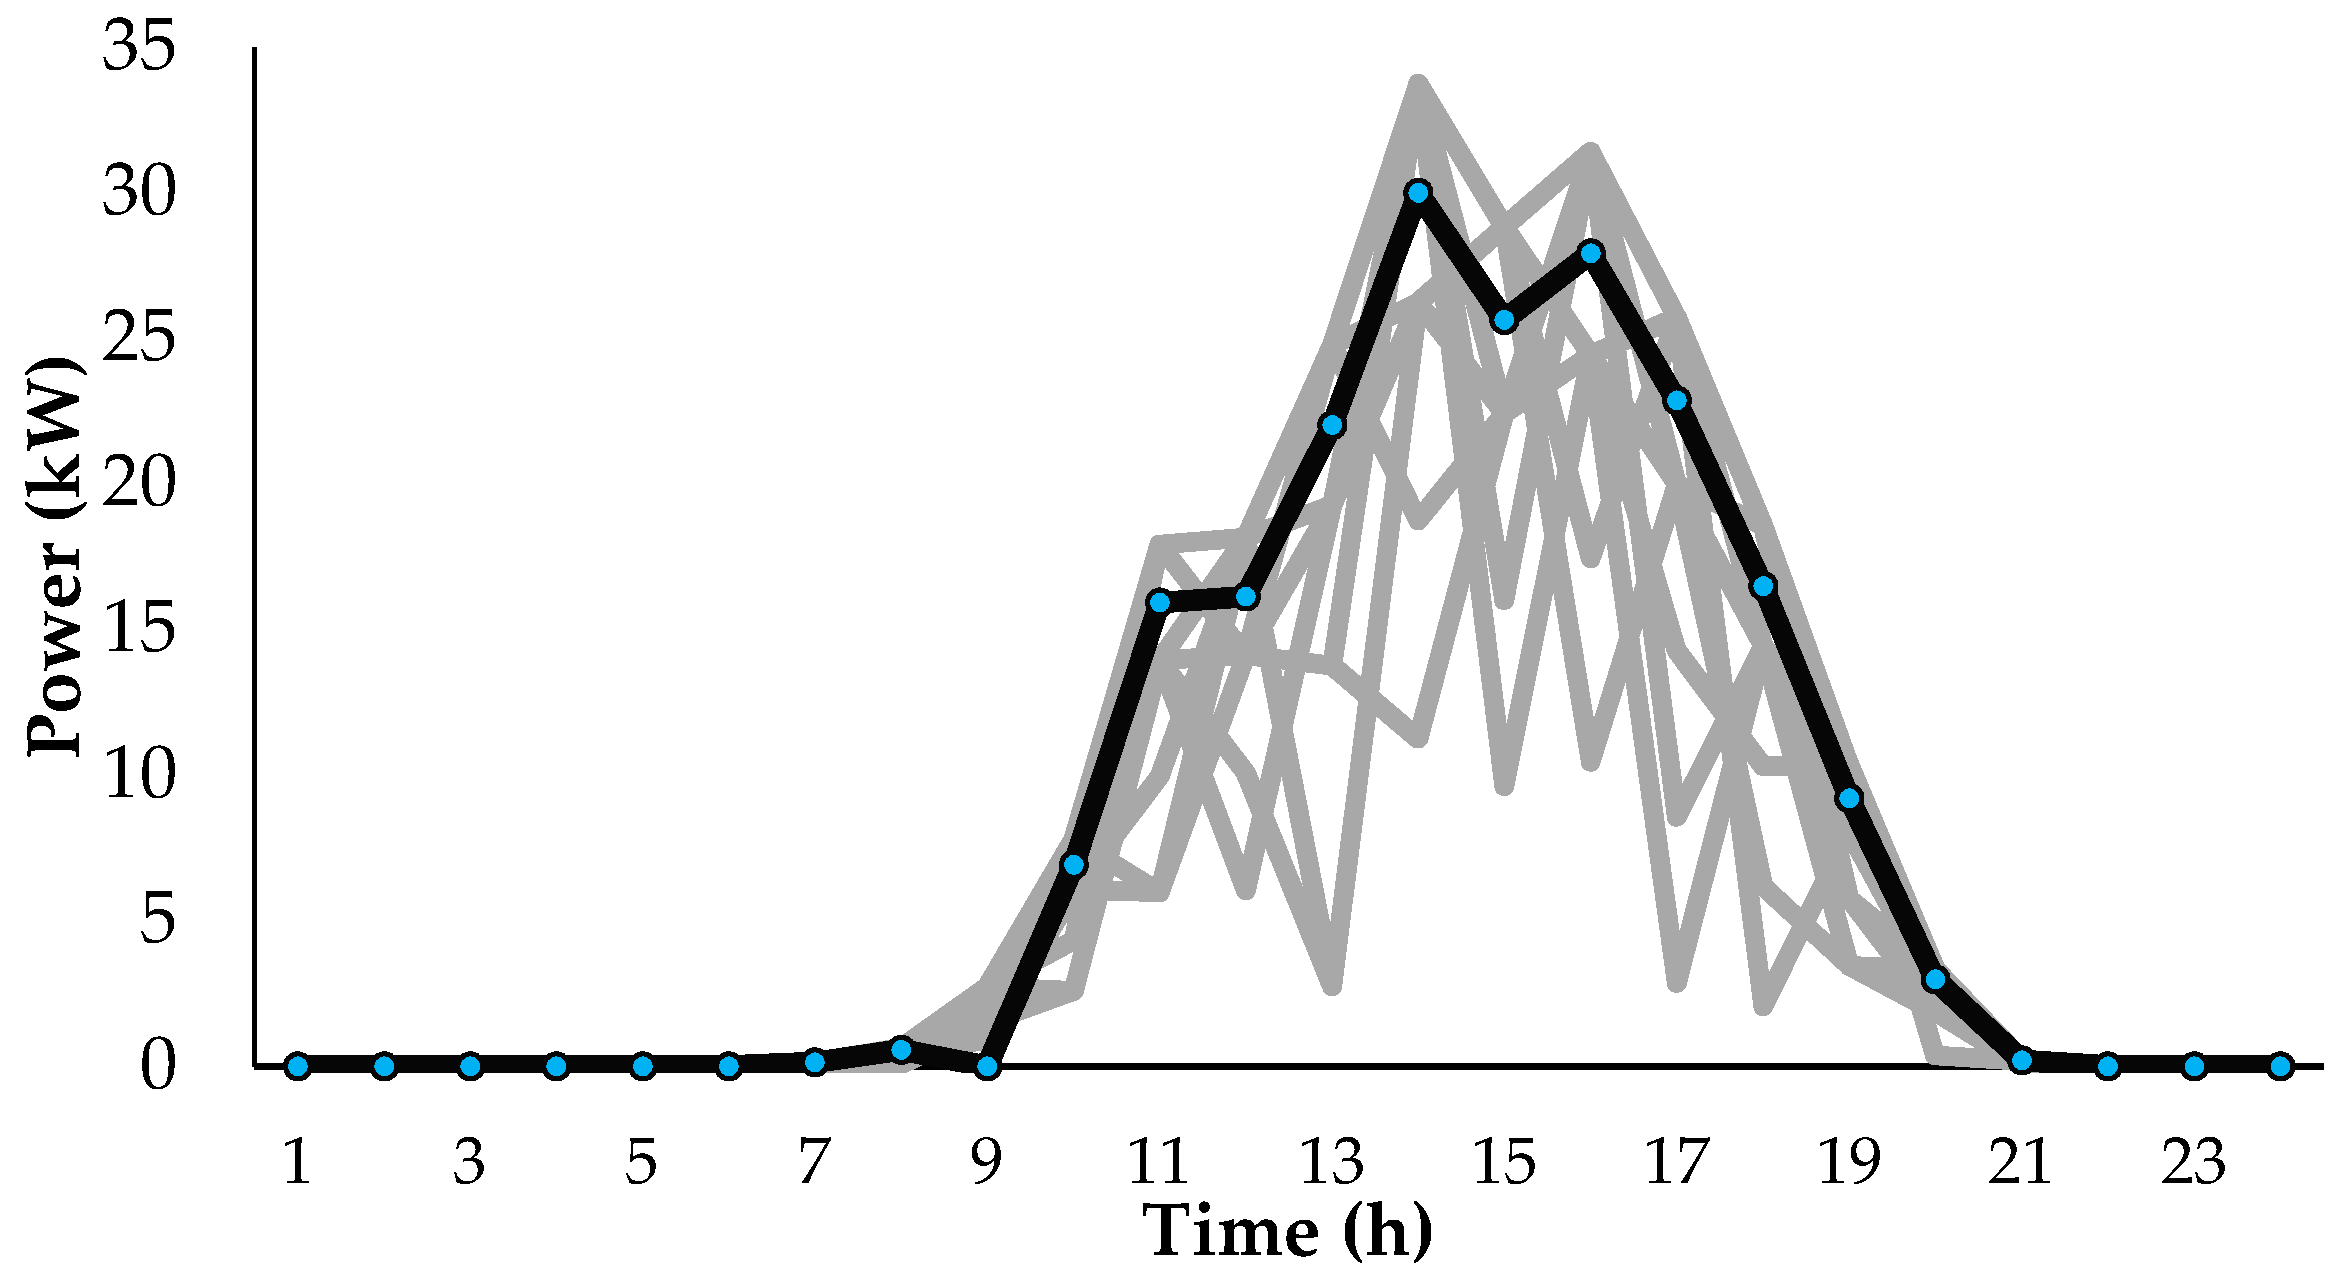
3.3. Modeling Uncertainties
3.4. RERs Model
3.5. Operation Cost
3.6. Risk Management
3.7. Objective Function
3.8. Equality and Inequality Constraints
Power Balance Constraint
3.9. The Limitation of the Adopted Model
- The MG equipment failure rate and its uncertainties are not considered.
- The proposed scenario generation approach only used to model the uncertainties of RERs and cannot model the uncertainties of parameters with unknown PDF.
4. Numerical Results
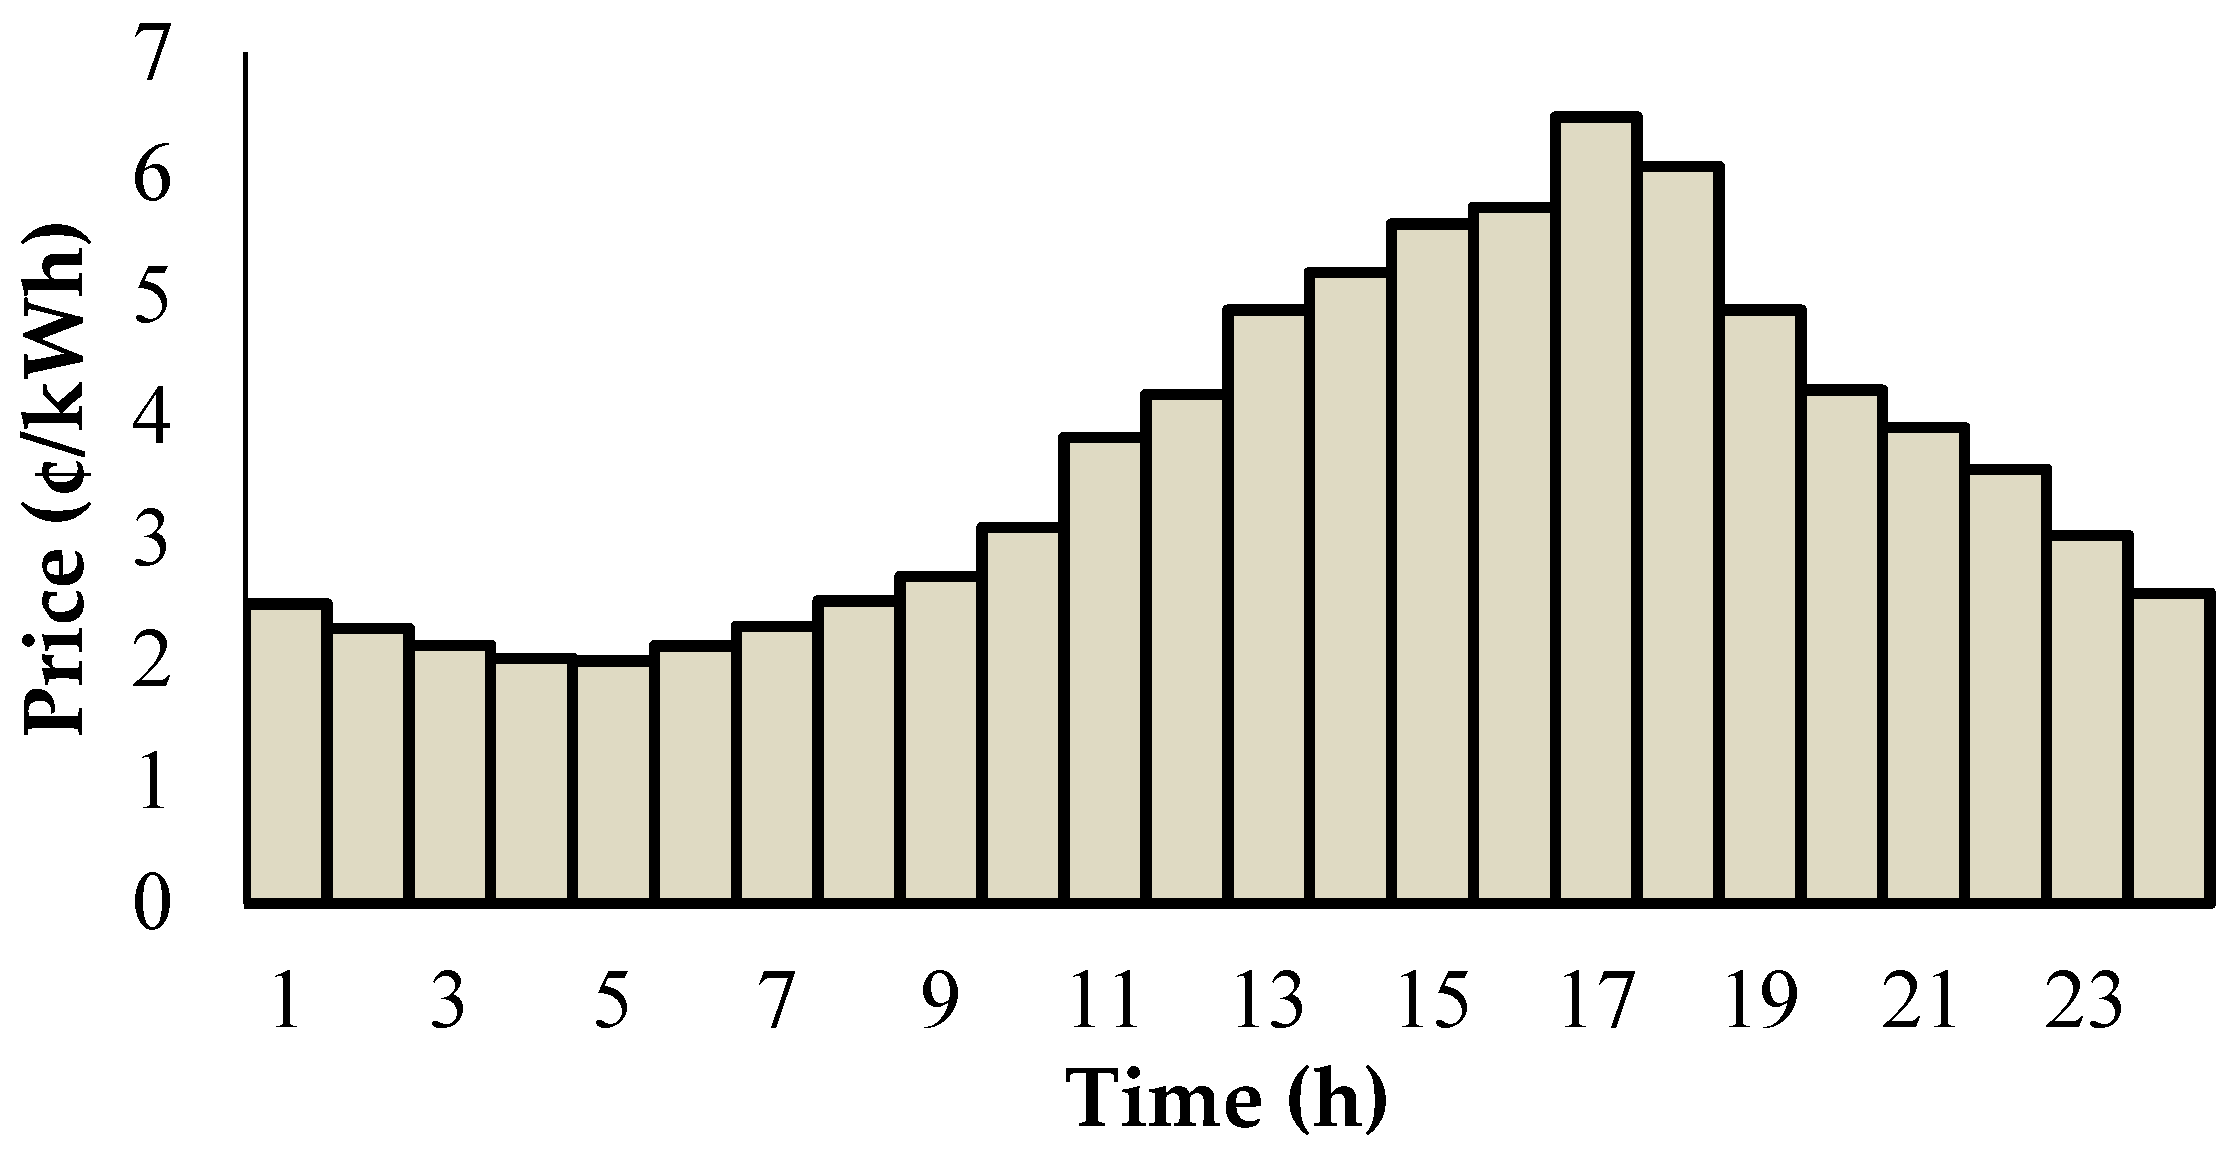
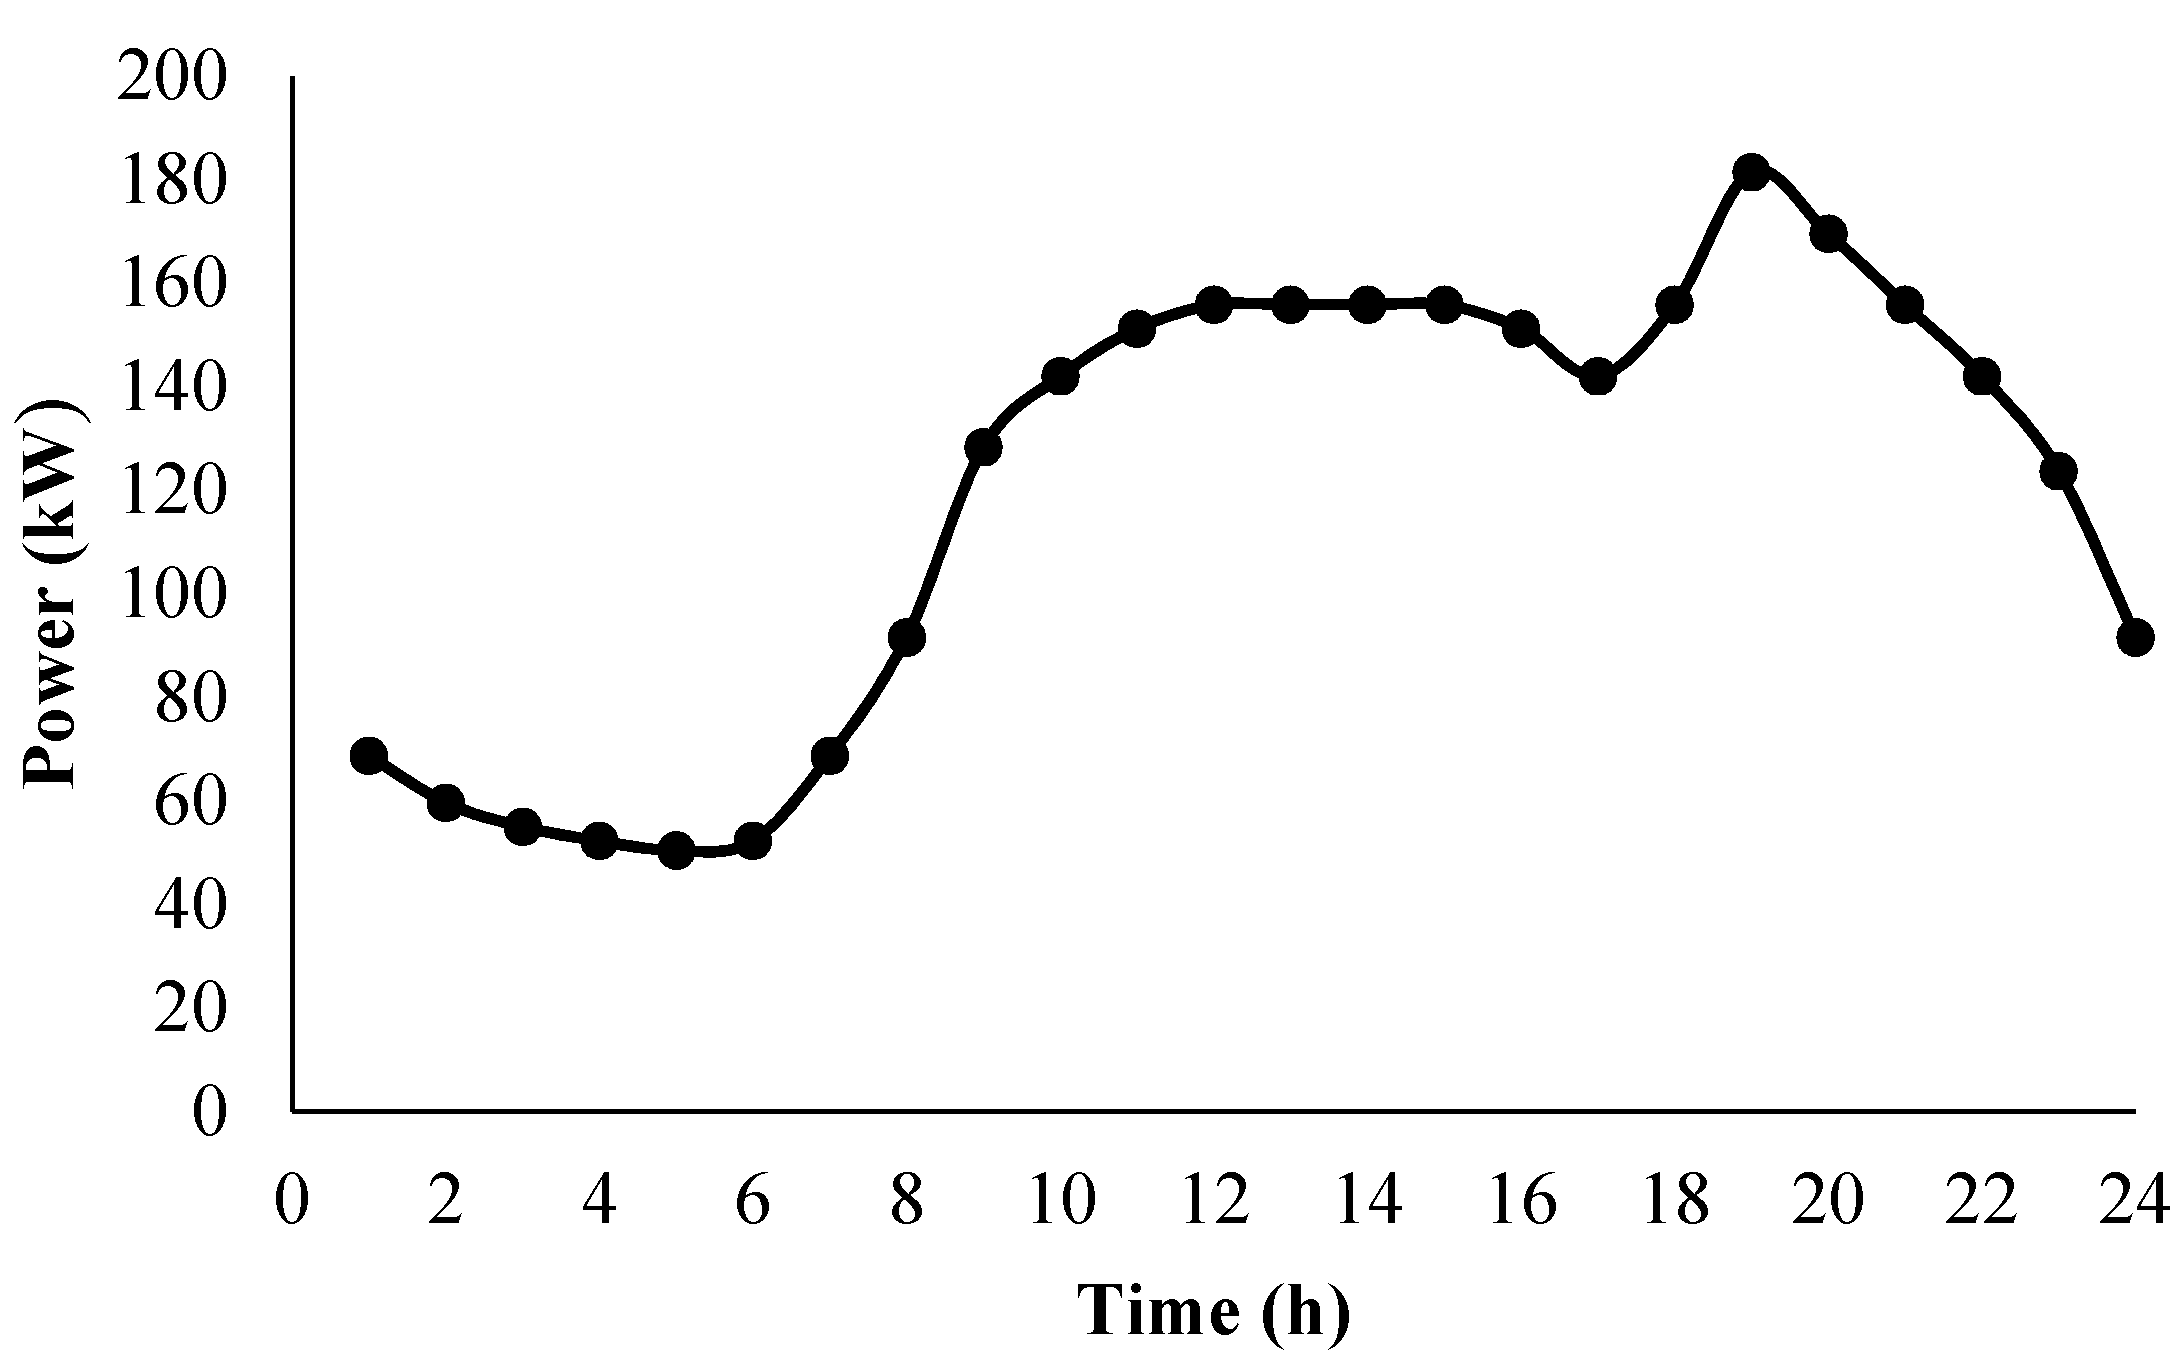
4.1. Input Data
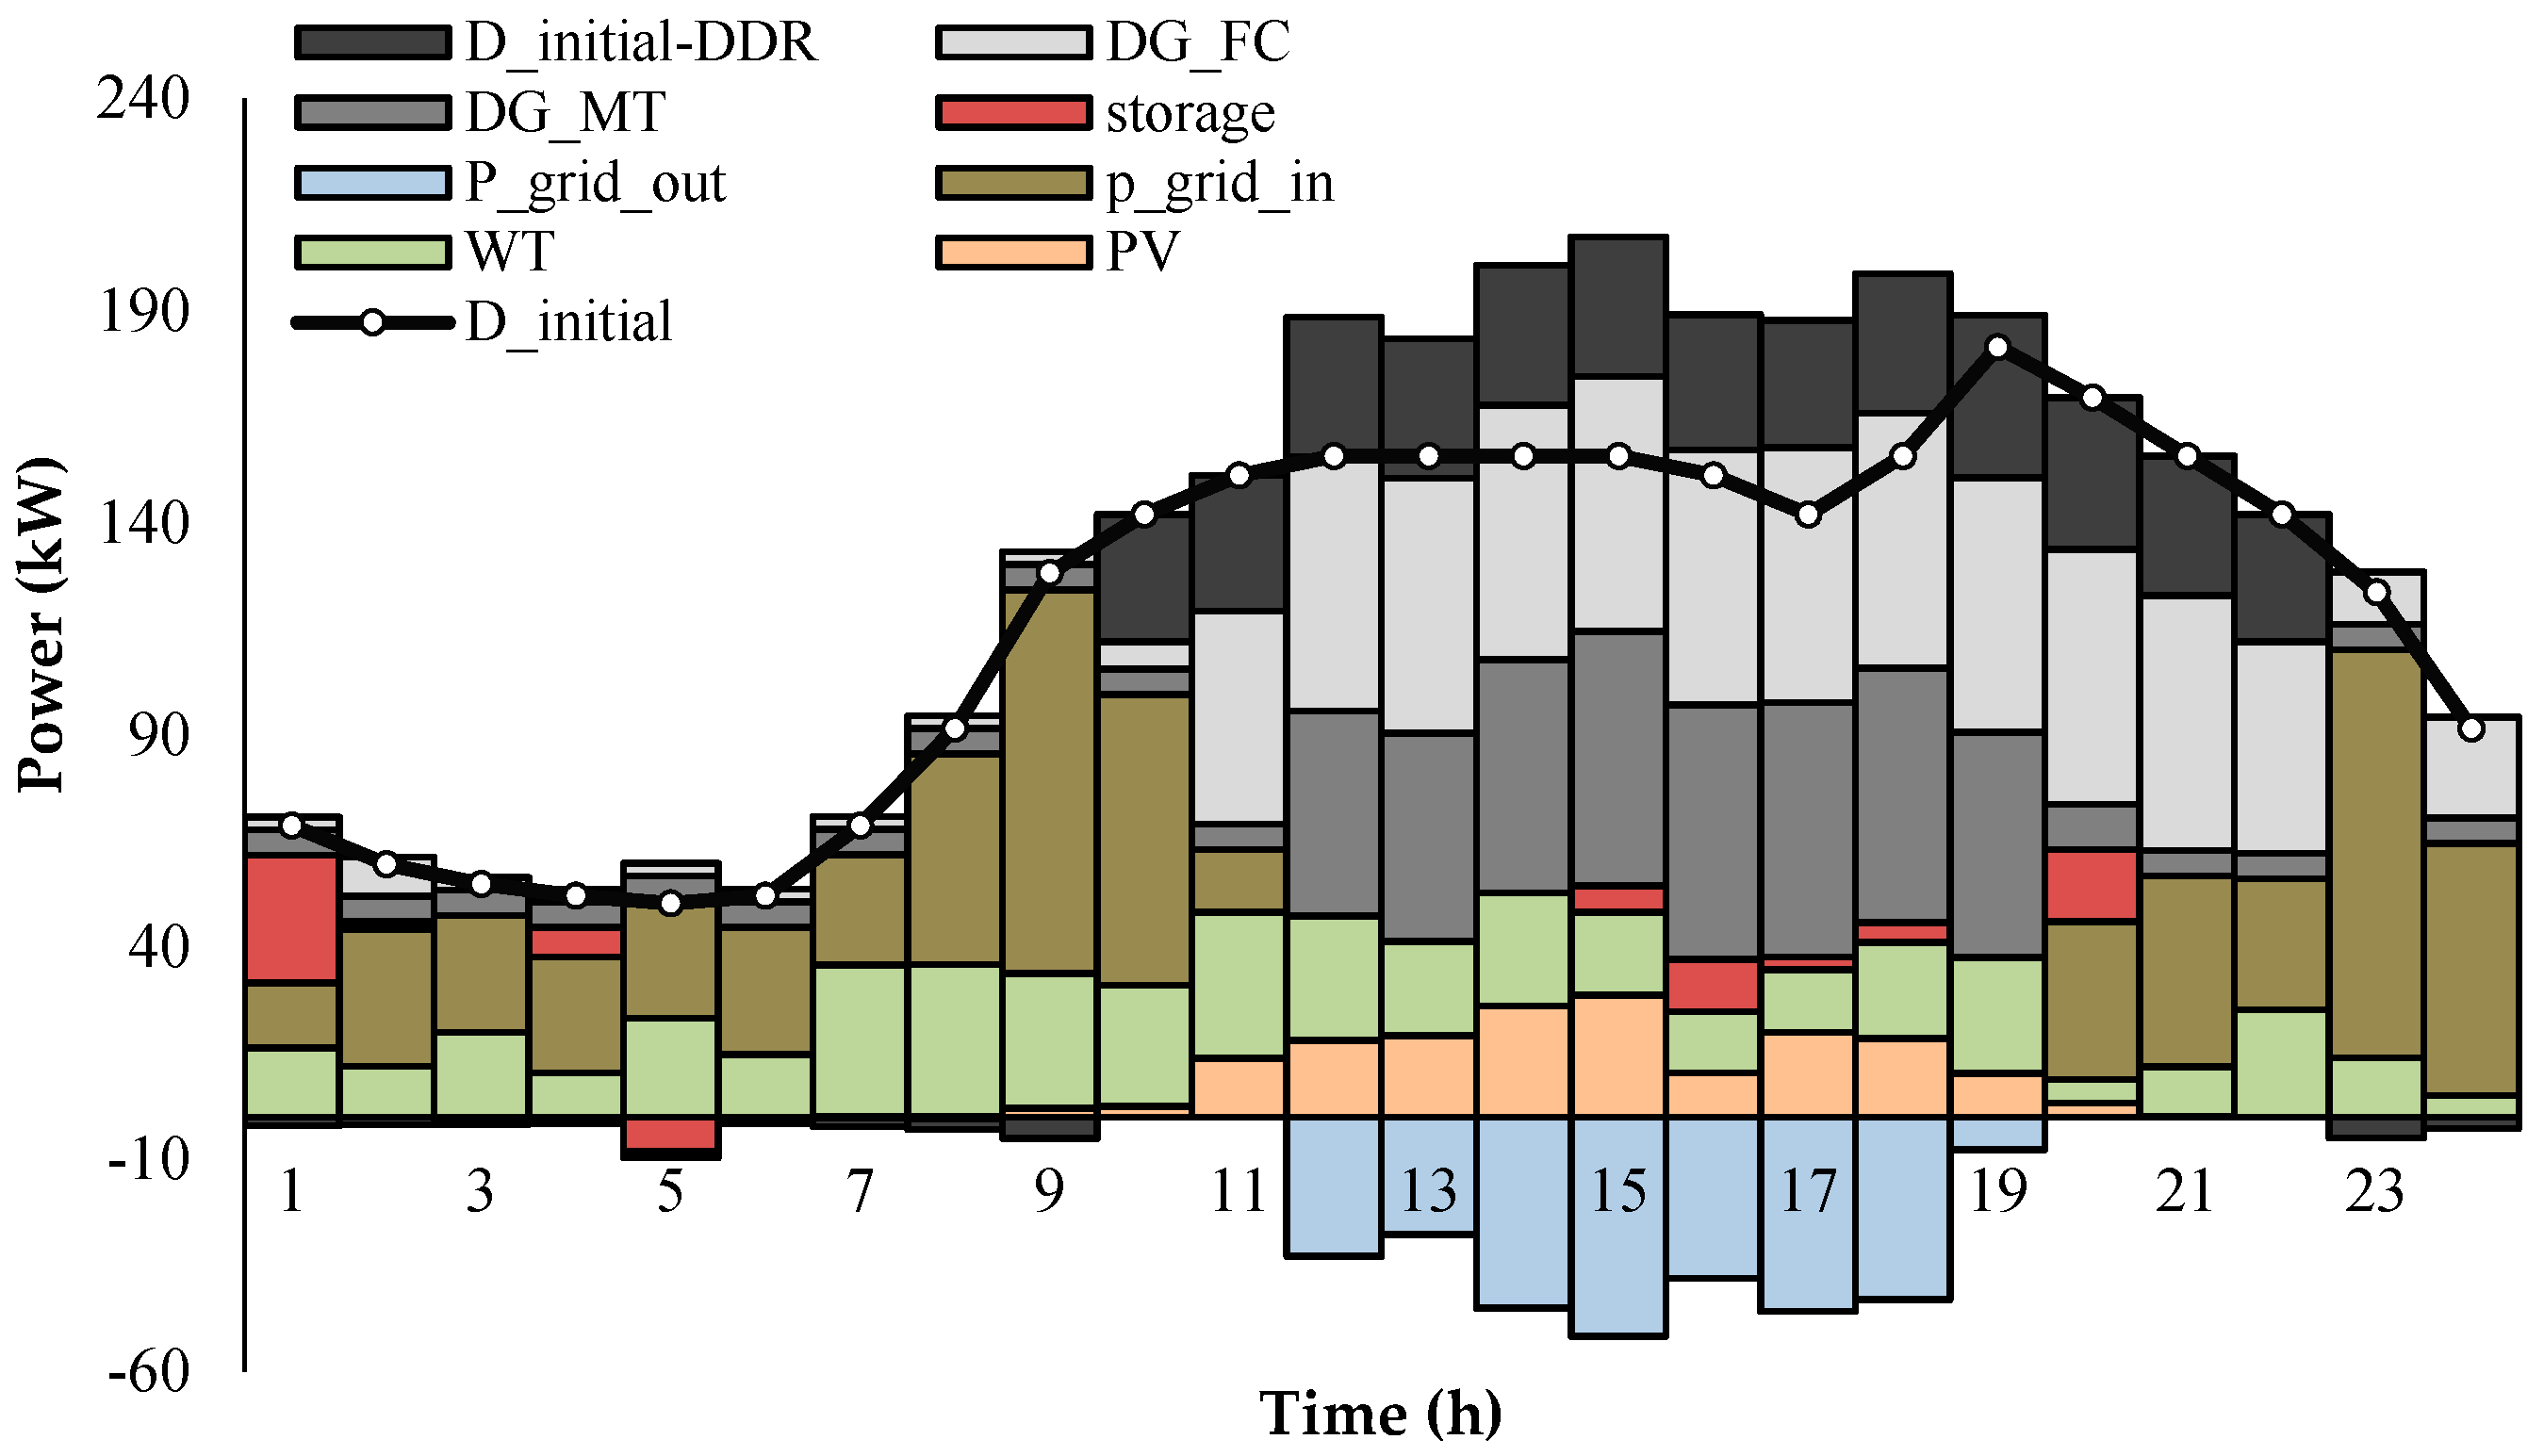
4.2. Case Studies
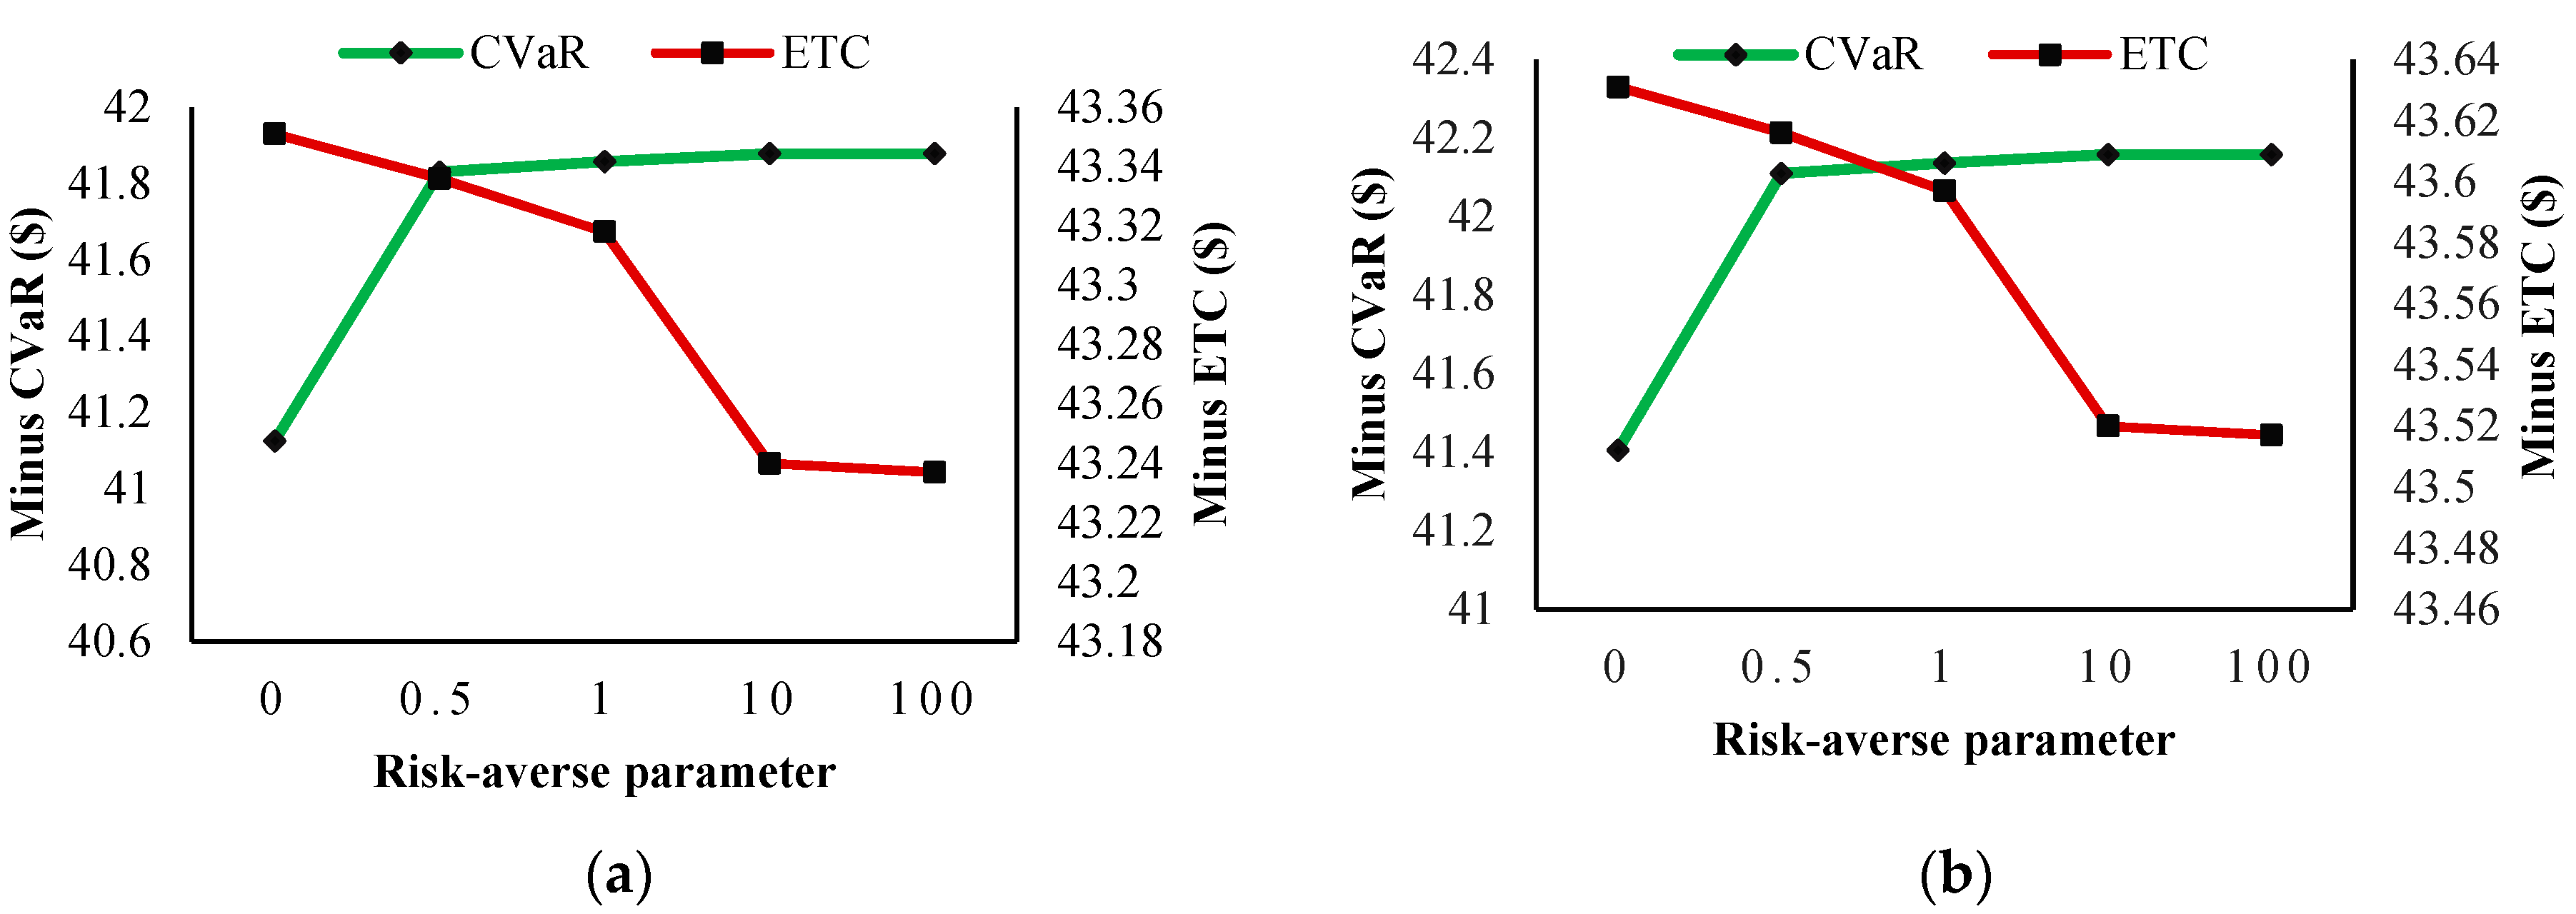
4.3. Sensitivity Analysis
5. Conclusions and Future Works
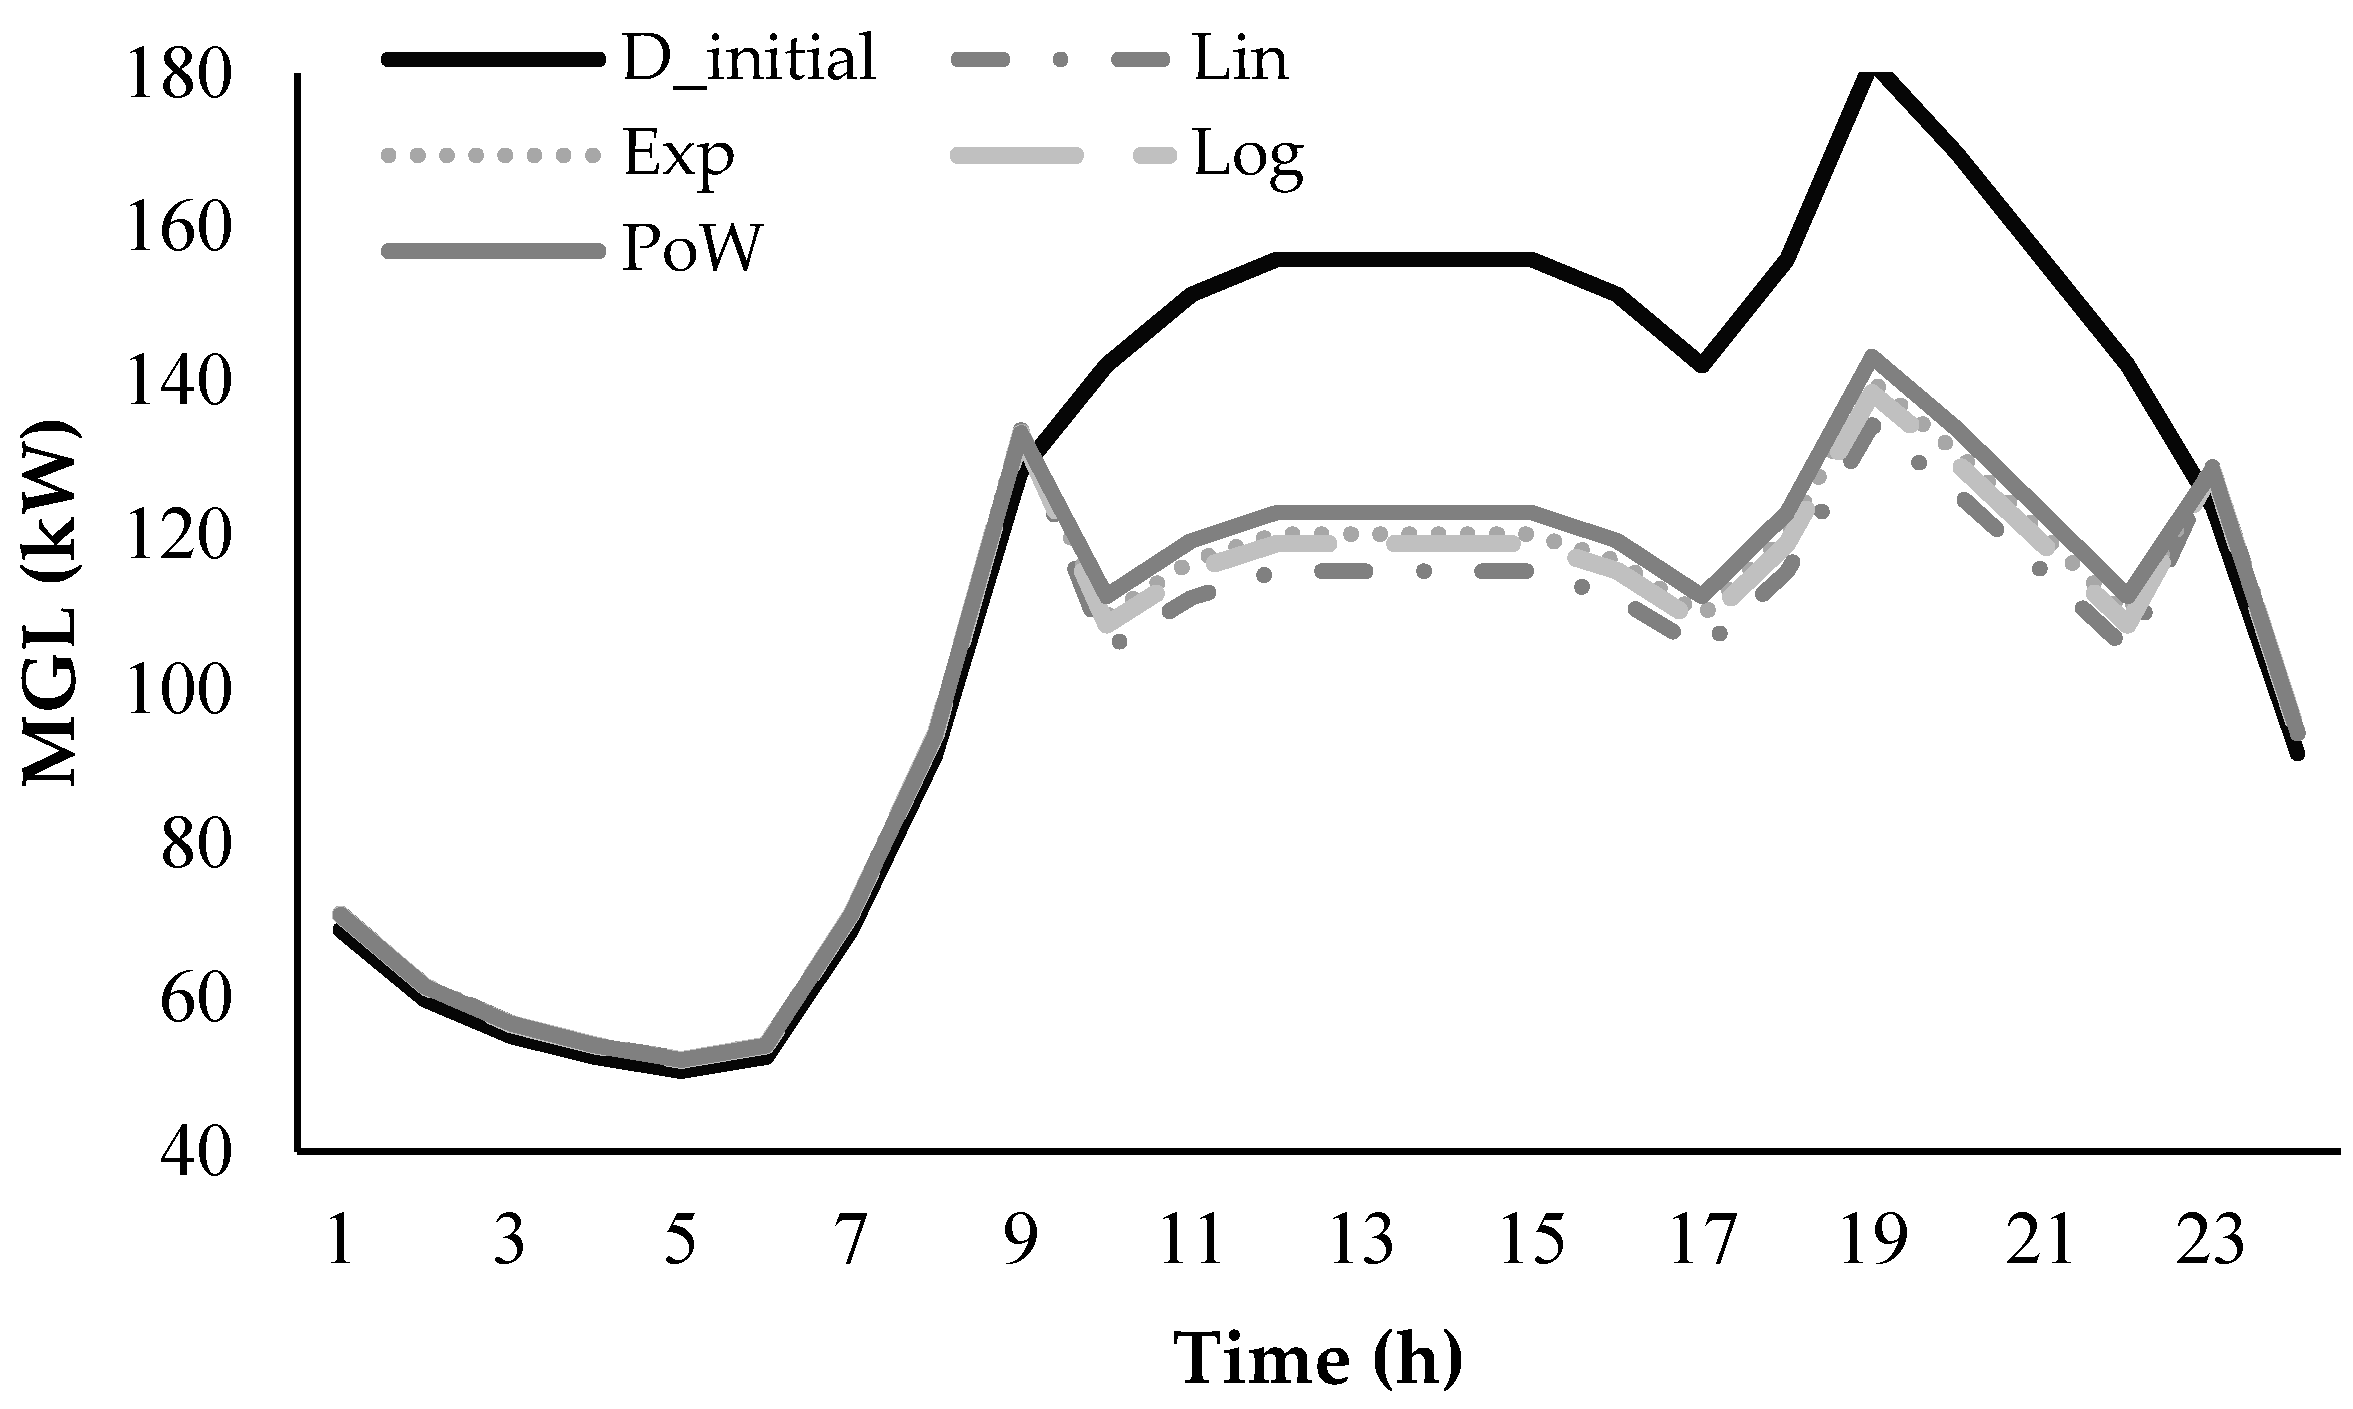
- The DRMs have various impacts on the MGL profile and the first-stage decisions of the MGO wherein the power model has the highest profitable model for the MGO.
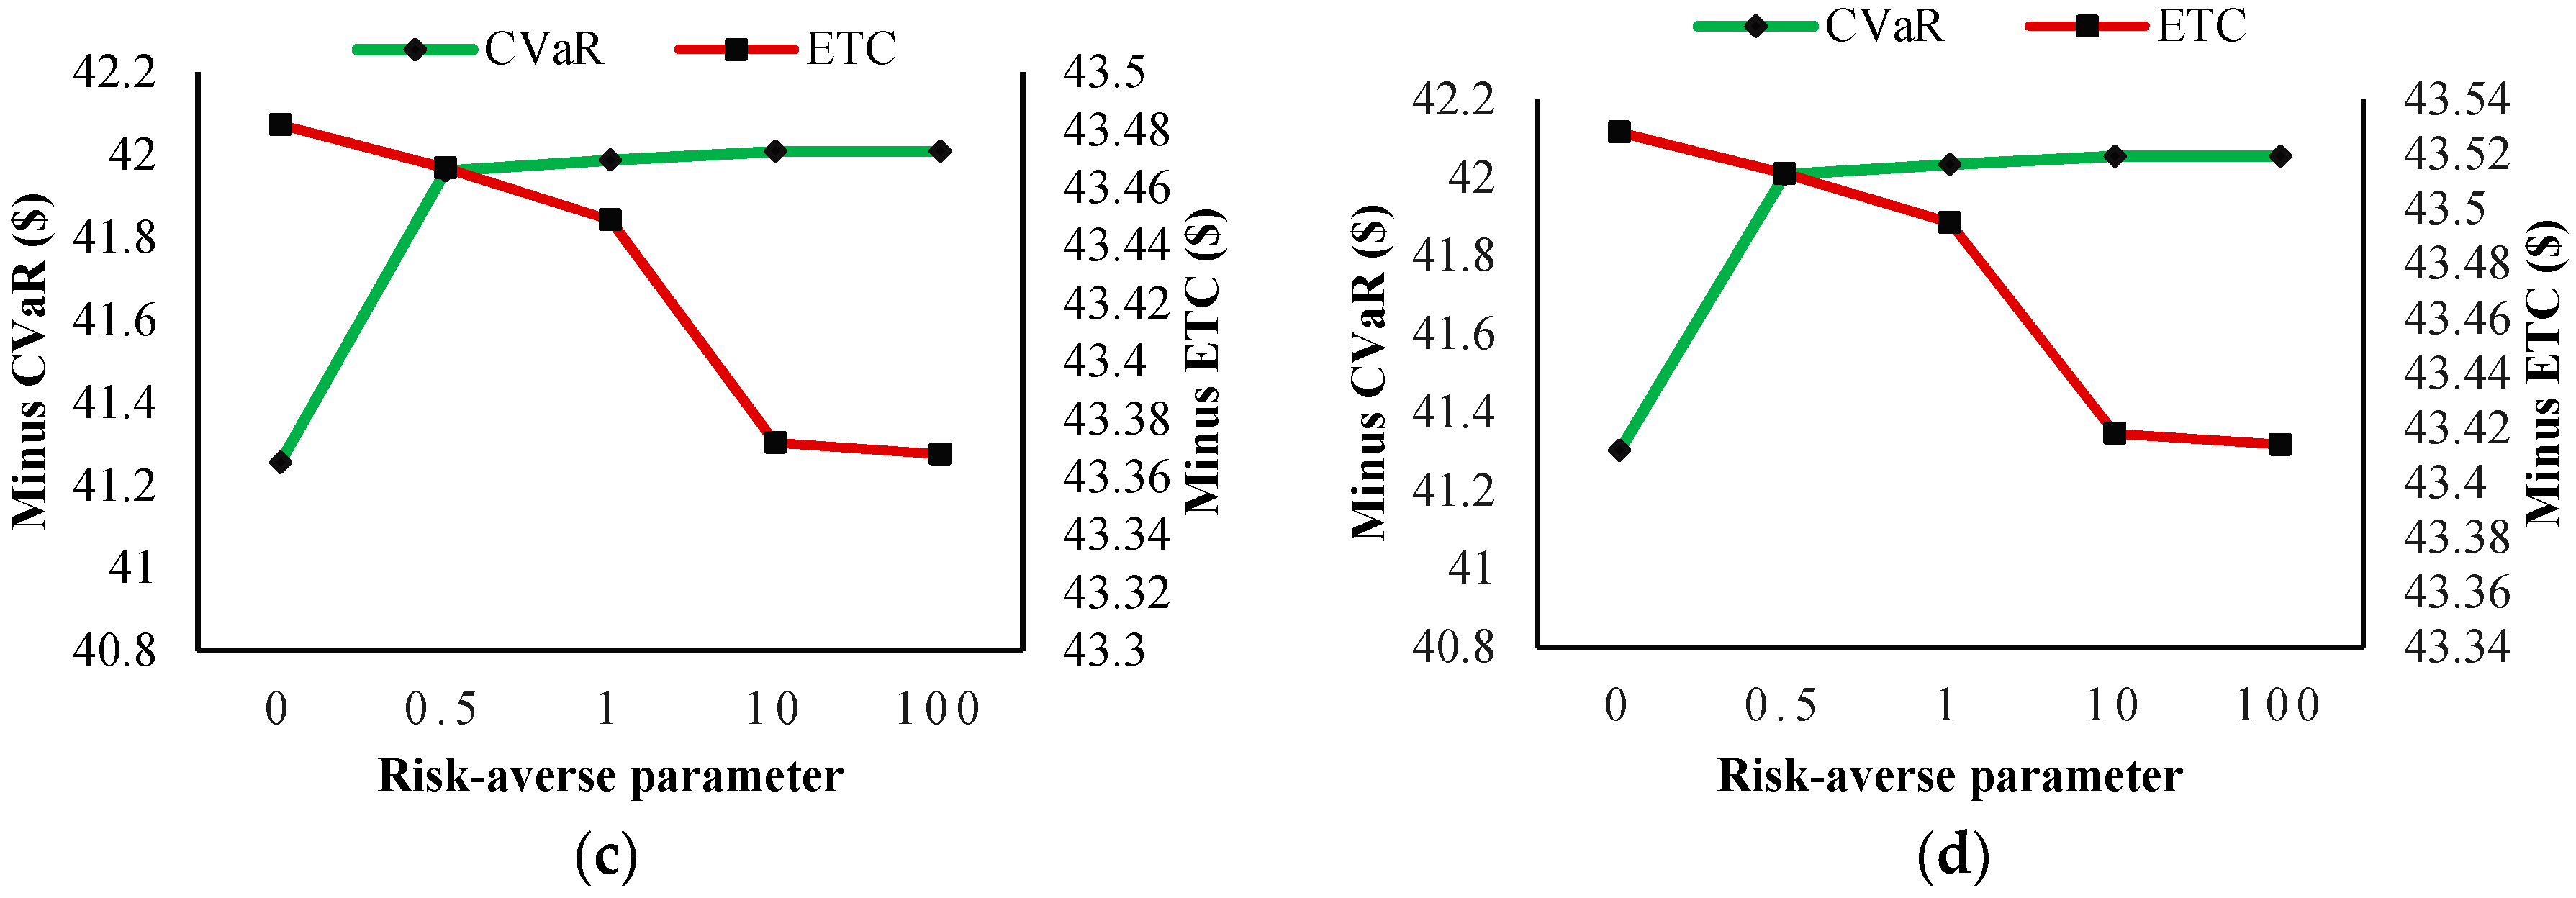
- The risk-averse MGO and the risky MGO prefer the first-stage and the second-stage decisions in the proposed two-stage problem, respectively.
- The risky MGO (risk neutral MGO) uses the whole capacity of RERs to meet its demand due to their low operation costs. On the other hand, the risk-averse MGO uses the lower output power of the RERs to control their uncertainties.
- In the presence of the MG, the energy mixes of an urban city ae changed so that Disco as the body responsible for supplying the energy consumption of the urban city can meet its required energy from the MG besides purchasing energy from the main grid.
- Modeling the MG operation problem in cooperation with Disco considering the objective functions of both decision makers, i.e., Disco and the MG.
- Modeling the interaction between the MG with other decision makers in distribution networks including other MGs, retailers, various types of aggregators, and virtual power plants.
- Modeling several MGs in the form of an MG aggregator and its participation in the wholesale energy markets.
- The proposed model in this paper can be converted to a real-time application in which the operation problem of the MG can be modeled in the day-ahead and the real-time operation simultaneously. In this model, the stochastic optimization problem is changed so that the first-stage decision variables of the MGO, which are determined in the previous day of the operation, are purchased power from Disco and load interruption/shifting. The second-stage decision variables are determined considering the occurrence of the scenarios in real time, consisting of purchased power from Disco in real time, the power generation of DGs, and power charging/discharging of the battery.
Acknowledgments
Author Contributions
Conflicts of Interest
Nomenclature
| Acronyms | |
| CVaR | Conditional value at risk |
| DER | Distributed energy resources |
| DG | Distributed Generator |
| DR | Demand response |
| DRM | Demand response model |
| DRP | Demand response program |
| ES | Energy storage |
| MG | Micro-grid |
| MGL | Micro-grid load |
| PBDR | Price-based demand response |
| PSO | Particle Swarm Optimization |
| PV | Photovoltaic System |
| RER | Renewable energy resources |
| WT | Wind turbine |
| Indices and sets | |
| Index and set of DG | |
| Index and set of scenario | |
| Index and set of time period | |
| Variables | |
| The amount of MGL considering each type of DRM (kW) | |
| Energy storage of ES (kWh) | |
| Power charging/discharging of ES (kW) | |
| Power charging of ES (kW) | |
| The amount of power purchased from main grid (kW) | |
| The amount of selling power to main grid (kW) | |
| The output power of WTs (kW) | |
| The output power of PVs (kW) | |
| The output power of DG (kW) | |
| Power discharging of ES (kW) | |
| Revenue from using DRPs (¢) | |
| Revenue from selling power to MGL after (and before) considering DRPs (¢) | |
| Total incentive payment (¢) | |
| Total penalty payment (¢) | |
| Binary variable (if equal to 1; MG purchases power from main grid and if equal 0, MG sells power to it) | |
| Binary variable (if equal to 1, ES is charging and equal 0 for otherwise) | |
| Parameters | |
| Incentive cost of DRPs (¢) | |
| Cost of power purchased from main grid (¢/kW) | |
| Revenue from selling power to main grid (¢/kW) | |
| Operation cost of ES and DGs (¢/kW) | |
| Value of demand assigned in the contract to be curtailed in DRPs (kW) | |
| Initial demand level (kW) | |
| Elasticity | Price elasticity of responsive load ($) |
| () | Minimum (maximum) capacity of ES (kWh) |
| Maximum power charging of ES (kW) | |
| Maximum power discharging of ES (kW) | |
| Maximum selling power to main grid (kW) | |
| Maximum purchased power from main grid (kW) | |
| maximum WT output power (kW) | |
| maximum PV output power (kW) | |
| maximum DG output power (kW) | |
| minimum DG output power (kW) | |
| Penalty cost of DRPs in period t (¢) | |
| Efficiency of the ES | |
| Initial price of electricity (¢/kWh) | |
| Electricity price in the price-based DRPs (¢/kWh) | |
References
- Palma-Behnke, R.; Benavides, C.; Lanas, F.; Severino, B.; Reyes, L.; Llanos, J.; Sáez, D. A Microgrid Energy Management System Based on the Rolling Horizon Strategy. IEEE Trans. Smart Grid 2013, 4, 996–1006. [Google Scholar] [CrossRef]
- Baboli, P.T.; Shahparasti, M.; Moghaddam, M.P.; Haghifam, M.R.; Mohamadian, M. Energy management and operation modelling of hybrid AC–DC microgrid. IET Gener. Transm. Distrib. 2014, 8, 1700–1711. [Google Scholar] [CrossRef]
- Shen, J.; Jiang, C.; Liu, Y.; Wang, X. A Microgrid Energy Management System and Risk Management Under an Electricity Market Environment. IEEE Access 2016, 4, 2349–2356. [Google Scholar] [CrossRef]
- Ou, T.-C.; Hong, C.-M. Dynamic operation and control of microgrid hybrid power systems. Energy 2014, 66, 314–323. [Google Scholar] [CrossRef]
- Ou, T.-C.; Lu, K.-H.; Huang, C.-J. Improvement of transient stability in a hybrid power multi-system using a designed NIDC (Novel Intelligent Damping Controller). Energies 2017, 10, 488. [Google Scholar] [CrossRef]
- Justo, J.J.; Mwasilu, F.; Lee, J.; Jung, J.-W. AC-microgrids versus DC-microgrids with distributed energy resources: A review. Renew. Sustain. Energy Rev. 2013, 24, 387–405. [Google Scholar] [CrossRef]
- Ou, T.-C. A novel unsymmetrical faults analysis for microgrid distribution systems. Int. J. Electr. Power Energy Syst. 2012, 43, 1017–1024. [Google Scholar] [CrossRef]
- Ou, T.-C. Ground fault current analysis with a direct building algorithm for microgrid distribution. Int. J. Electr. Power Energy Syst. 2013, 53, 867–875. [Google Scholar] [CrossRef]
- Zhang, Y.; Gatsis, N.; Giannakis, G.B. Robust energy management for microgrids with high-penetration renewables. IEEE Trans. Sustain. Energy 2013, 4, 944–953. [Google Scholar] [CrossRef]
- Li, Z.; Zang, C.; Zeng, P.; Yu, H. Combined two-stage stochastic programming and receding horizon control strategy for microgrid energy management considering uncertainty. Energies 2016, 9, 499. [Google Scholar] [CrossRef]
- Ou, T.-C.; Su, W.-F.; Liu, X.-Z.; Huang, S.-J.; Tai, T.-Y. A modified bird-mating optimization with hill-climbing for connection decisions of transformers. Energies 2016, 9, 671. [Google Scholar] [CrossRef]
- Aalami, H.A.; Moghaddam, M.P.; Yousefi, G.R. Demand response modeling considering Interruptible/Curtailable loads and capacity market programs. Appl. Energy 2010, 87, 243–250. [Google Scholar] [CrossRef]
- Wu, K.; Zhou, H. A multi-agent-based energy-coordination control system for grid-connected large-scale wind–photovoltaic energy storage power-generation units. Sol. Energy 2014, 107, 245–259. [Google Scholar] [CrossRef]
- Tazvinga, H.; Xia, X.; Zhang, J. Minimum cost solution of photovoltaic–diesel–battery hybrid power systems for remote consumers. Sol. Energy 2013, 96, 292–299. [Google Scholar] [CrossRef]
- Nwulu, N.I.; Xia, X. Optimal dispatch for a microgrid incorporating renewables and demand response. Renew. Energy 2017, 101, 16–28. [Google Scholar] [CrossRef]
- Han, Y.; Chen, W.; Li, Q. Energy Management Strategy Based on Multiple Operating States for a Photovoltaic/Fuel Cell/Energy Storage DC Microgrid. Energies 2017, 10, 136. [Google Scholar] [CrossRef]
- Guo, L.; Liu, W.; Jiao, B.; Hong, B.; Wang, C. Multi-objective stochastic optimal planning method for stand-alone microgrid system. IET Gener. Transm. Distrib. 2014, 8, 1263–1273. [Google Scholar] [CrossRef]
- Lee, S.; Jin, Y.; Jang, G.; Yoon, Y. Optimal bidding of a microgrid based on probabilistic analysis of island operation. Energies 2016, 9, 814. [Google Scholar] [CrossRef]
- Gast, N.; Tomozei, D.-C.; Le Boudec, J.-Y. Optimal generation and storage scheduling in the presence of renewable forecast uncertainties. IEEE Trans. Smart Grid 2014, 5, 1328–1339. [Google Scholar] [CrossRef]
- Talari, S.; Yazdaninejad, M.; Haghifam, M.R. Stochastic-based scheduling of the microgrid operation including wind turbines, photovoltaic cells, energy storages and responsive loads. IET Gener. Transm. Distrib. 2015, 9, 1498–1509. [Google Scholar] [CrossRef]
- Aghajani, G.R.; Shayanfar, H.A.; Shayeghi, H. Demand side management in a smart micro-grid in the presence of renewable generation and demand response. Energy 2017, 126, 622–637. [Google Scholar] [CrossRef]
- Huang, C.; Yue, D.; Deng, S.; Xie, J. Optimal Scheduling of Microgrid with Multiple Distributed Resources Using Interval Optimization. Energies 2017, 10, 339. [Google Scholar] [CrossRef]
- Aalami, H.A.; Parsa Moghaddam, M.; Yousefi, G.R. Evaluation of nonlinear models for time-based rates demand response programs. Int. J. Electr. Power Energy Syst. 2015, 65, 282–290. [Google Scholar] [CrossRef]
- Abdi, H.; Dehnavi, E.; Mohammadi, F. Dynamic economic dispatch problem integrated with demand response (DEDDR) considering non-linear responsive load models. IEEE Trans. Smart Grid 2016, 7, 2586–2595. [Google Scholar] [CrossRef]
- Bahramara, S.; Parsa Moghaddam, M.; Haghifam, M.R. Modelling hierarchical decision making framework for operation of active distribution grids. IET Gener. Transm. Distrib. 2015, 9, 2555–2564. [Google Scholar] [CrossRef]
- Zakariazadeh, A.; Jadid, S.; Siano, P. Stochastic multi-objective operational planning of smart distribution systems considering demand response programs. Electr. Power Syst. Res. 2014, 111, 156–168. [Google Scholar] [CrossRef]
- Uryasev, R.T.R.A.S. Optimization of conditional value-at-risk. J. Risk 2000, 2, 21–41. [Google Scholar]
- Hatziargyriou, N.; Anastasiadis, A.G.; Vasiljevska, J.; Tsikalakis, A. Quantification of Economic, Environmental and Operational Benefits of Microgrids. In Proceedings of the PowerTech, 2009 IEEE Bucharest, Bucharest, Romania, 28 June–2 July 2009; pp. 1–8. [Google Scholar] [CrossRef]


| Ref. | MG‘s Resources | The Type of Model | Demand Response Model | Risk Management | Approach |
|---|---|---|---|---|---|
| [1] | PV, WT, DG, ES, DR | Probabilistic | Load shifting (linear) | No | Mixed Integer Linear Programming (MILP) |
| [2] | PV, WT, DG, ES | Probabilistic | - | No | MILP |
| [3] | PV, WT, DG, ES, DR | One-stage stochastic | Interruptible load (linear) | Yes | MILP |
| [14] | PV, DG, ES | Deterministic | - | No | Non-Linear Programming (NLP) |
| [15] | PV, WT, DG, DR | Deterministic | Incentive-based (linear) | No | NLP |
| [16] | PV, DG, ES | Deterministic | - | No | MILP |
| [17] | PV, WT, DG ES (stand alone MG) | Probabilistic | - | No | NLP |
| [18] | Load shedding | One-stage stochastic | - | Yes | MILP |
| [20] | PV, WT, DG, ES, DR | Probabilistic | Price-based (linear) | No | MIP |
| [21] | PV, WT, DG, ES, DR | Probabilistic | Incentive-based payments as price offer packages (linear) | No | NLP |
| This paper | PV, WT, DG, ES, DR | Two-stage stochastic | Incentive-based (linear and non-linear) | Yes | MILP/MINLP |
| Type of DG | Marginal Cost (¢/kWh) | ||||||
| MT | 4.67 | 6.00 | 60.0 | ||||
| FC | 3.40 | 3.00 | 60.0 | ||||
| Number of ES | Operation cost (¢/kWh) | (kWh) | (kWh) | (kW) | |||
| 1 | 2 | 9 | 50 | 30 | 0.95 | ||
| (kW) | Capacity of the MG responsive loads | (¢/kWh) | The incentive/penalty payment/cost | ||||
| 300 | 30% MG load (MGL) | 1.2 of the forecasted electricity market prices by Disco | 30% () | ||||
| Peak | Off-Peak | Low Load | |
|---|---|---|---|
| Peak | −0.100 | 0.016 | 0.012 |
| Off-peak | 0.016 | −0.100 | 0.010 |
| Low load | 0.012 | 0.010 | −0.100 |
| Linear Model | Power Model | Exponential Model | Logarithmic Model | |
|---|---|---|---|---|
| (kW) | 642.650 | 677.780 | 666.785 | 657.579 |
| (kW) | 352.385 | 290.973 | 313.450 | 323.568 |
| (kW) | 502.170 | 502.170 | 502.170 | 502.170 |
| (kW) | 174.372 | 174.372 | 174.372 | 174.372 |
| (kW) | 1322.038 | 1322.038 | 1322.038 | 1322.038 |
| (kW) | 81.916 | 81.916 | 81.916 | 81.916 |
| (kW) | 8.474 | 8.474 | 8.474 | 8.474 |
| Total load reduction (kW) | 494.913 | 398.37 | 431.842 | 451.167 |
| Expected total cost (ETC) (¢) | −43.351 | −43.631 | −43.528 | −43.482 |
| (¢) | −90.157 | −95.724 | −93.733 | −92.730 |
| DRMs | Linear Model | Power Model | Exponential Model | Logarithmic Model | |
|---|---|---|---|---|---|
| ETC (¢) | Without DR | −42.618 | −42.618 | −42.618 | −42.618 |
| With DR | −43.351 | −43.631 | −43.528 | −43.482 | |
| # Scenario | 1 | 2 | 3 | 4 | 5 |
|---|---|---|---|---|---|
| Total cost (¢) | −43.054 | −41.405 | −42.057 | −43.666 | −43.222 |
| # Scenario | 6 | 7 | 8 | 9 | 10 |
| Total cost (¢) | −44.741 | −46.351 | −41.814 | −42.663 | −43.642 |
| # Scenario | 11 | 12 | 13 | 14 | 15 |
| Total cost (¢) | −43.019 | −44.558 | −45.897 | −42.907 | −43.087 |
| Linear Model | Power Model | Exponential Model | Logarithmic Model | |||||||||
|---|---|---|---|---|---|---|---|---|---|---|---|---|
| (kW) | 642.650 | 654.603 | 655.569 | 677.780 | 689.734 | 690.700 | 666.785 | 678.739 | 679.705 | 657.579 | 669.533 | 670.499 |
| (kW) | 352.385 | 352.385 | 350.823 | 290.973 | 290.973 | 289.410 | 313.450 | 313.450 | 311.887 | 323.568 | 323.568 | 322.005 |
| (kW) | 502.170 | 502.170 | 497.857 | 502.170 | 502.170 | 497.857 | 502.170 | 502.170 | 497.857 | 502.170 | 502.170 | 497.857 |
| (kW) | 174.372 | 174.372 | 174.372 | 174.372 | 174.372 | 174.372 | 174.372 | 174.372 | 174.372 | 174.372 | 174.372 | 174.372 |
| (kW) | 1322.038 | 1309.97 | 1311.20 | 1322.038 | 1309.97 | 1311.20 | 1322.038 | 1309.97 | 1311.20 | 1322.038 | 1306.97 | 1311.20 |
| (kW) | 81.916 | 83.051 | 88.740 | 81.916 | 83.051 | 88.740 | 81.916 | 83.051 | 88.740 | 81.916 | 83.051 | 88.740 |
| (kW) | 8.474 | 9.498 | 14.633 | 8.474 | 9.498 | 14.633 | 8.474 | 9.498 | 14.633 | 8.474 | 9.498 | 14.633 |
| ETC (¢) | 494.913 | −43.318 | −43.237 | 398.37 | −43.597 | −43.517 | 431.842 | −43.495 | −43.414 | 451.167 | −43.449 | −43.368 |
| (¢) | −43.351 | −90.157 | −90.157 | −43.631 | −95.724 | −95.724 | −43.528 | −93.733 | −93.733 | −43.482 | −92.730 | −92.730 |
© 2018 by the authors. Licensee MDPI, Basel, Switzerland. This article is an open access article distributed under the terms and conditions of the Creative Commons Attribution (CC BY) license (http://creativecommons.org/licenses/by/4.0/).
Share and Cite
Sheikhahmadi, P.; Mafakheri, R.; Bahramara, S.; Damavandi, M.Y.; Catalão, J.P.S. Risk-Based Two-Stage Stochastic Optimization Problem of Micro-Grid Operation with Renewables and Incentive-Based Demand Response Programs. Energies 2018, 11, 610. https://doi.org/10.3390/en11030610
Sheikhahmadi P, Mafakheri R, Bahramara S, Damavandi MY, Catalão JPS. Risk-Based Two-Stage Stochastic Optimization Problem of Micro-Grid Operation with Renewables and Incentive-Based Demand Response Programs. Energies. 2018; 11(3):610. https://doi.org/10.3390/en11030610
Chicago/Turabian StyleSheikhahmadi, Pouria, Ramyar Mafakheri, Salah Bahramara, Maziar Yazdani Damavandi, and João P. S. Catalão. 2018. "Risk-Based Two-Stage Stochastic Optimization Problem of Micro-Grid Operation with Renewables and Incentive-Based Demand Response Programs" Energies 11, no. 3: 610. https://doi.org/10.3390/en11030610
APA StyleSheikhahmadi, P., Mafakheri, R., Bahramara, S., Damavandi, M. Y., & Catalão, J. P. S. (2018). Risk-Based Two-Stage Stochastic Optimization Problem of Micro-Grid Operation with Renewables and Incentive-Based Demand Response Programs. Energies, 11(3), 610. https://doi.org/10.3390/en11030610