The Effect of Climate Conditions on the Relation between Energy Efficiency and Urban Form


Faculty of Civil Engineering, Aristotle University of Thessaloniki, 54124 Thessaloniki, Greece
*
Author to whom correspondence should be addressed.
Energies 2018, 11(3), 582; https://doi.org/10.3390/en11030582
Submission received: 16 December 2017
/
Revised: 12 February 2018
/
Accepted: 1 March 2018
/
Published: 7 March 2018
(This article belongs to the Special Issue Energy Efficient and Smart Cities)
Abstract
:Urban sustainability has been connected to form and compactness of the urban tissue. At the same time the relationship between urban form and energy efficiency is strongly affected by climate. This paper investigates the effect of climate conditions on the relation between urban morphology and energy efficiency of urban blocks, focusing on the Greek city context. A set of building block typologies is analyzed with regard to their form factors such as S/V ratio, coverage ratio and building ratio for the climatic conditions of two cities, each one belonging to a different climatic zone. Heating and cooling loads are calculated at an urban block scale for the climate of the city of Thessaloniki (zone C) and of the city of Heraklion (zone A) in order to draw conclusions about the relation between geometry factors and energy efficiency. The results of the research indicate that there is a strong relationship between urban morphology factors and energy efficiency and that the total load demand of urban blocks can be described as a function of form parameters. Results of the research, concerning the energy demand calculation, are valuable since they indicate the energy profile of each typology according to climate and can be used for defining different urban strategies towards sustainability in a context-based climate dependent analysis.
1. Introduction
The study of the environmental quality of the urban space is connected to the built environment as a key factor for achieving sustainability. It is a fact that the amount of building’s operational energy consumed for heating and cooling contributes to the bad air quality in contemporary cities and to the increased greenhouse gas (GHG) emissions affecting the global climate change.
The aim of this paper is to define patterns of sustainability in the existing urban tissue of the Greek city. The assessment of existing urban configurations can on the one hand contribute to a great extent on the identification of the factors that create more or less energy efficient urban areas and on the other hand on the definition of the way these factors affect the overall energy performance of buildings.
1.1. State of the Art
Theory examining the sustainability of urban areas is largely targeted towards compactness. However, compact cities have been considered as the main reason for the low quality of life οwed at the resulting increased density of urban areas [1,2,3,4,5]. It is a fact that energy efficiency at the urban scale is not always easy to be predicted as factors defining the energy demand are often contradictory. A compact urban form does not provide a de facto better energy performance of the urban tissue than a less compact one.
Owens [6] pointed out that it should be taken into account that there is a certain point beyond which the benefits of compactness resulting from minimizing heat loss and transportation needs are counterbalanced by the deficits arising from congestion. Other theories have also questioned compactness suggesting that there are no ideal typologies as “the challenge for urban policy is to develop the most appropriate urban form for a particular local context” [7]. “Urban sustainability is a place dependent notion” and generalized strategies should be avoided [8]. In the same direction, Ratti et al. [9] and Papa et al. [10] recognized two conflicting exigencies for energy efficiency, minimizing the exposed building envelope, which would reduce heat losses, and maximizing it, which would favor daylight and natural ventilation availability.
Among general typology studies and case study approaches there is a great distance on the level of interpretation of the results. A large amount of research examines typologies according to their energy performance in order to define the most energy efficient urban form [11,12]. Martin and March [13] have been the pioneers of such approaches as they tried to minimize complexity of the urban scale by introducing archetypical forms in order to examine energy efficiency of the urban tissue. Their research concluded that the more sustainable urban form is that of a cube, but this is a very general conclusion which despite the fact that it can give some general direction towards sustainable urban forms, cannot of course be applied in a real city situation. Since then a lot of research has been carried out on similar issues trying to define urban patterns of sustainability.
Steadman and Brown [14] used two main parameters of building geometry (plan depth and mean room size) in order to classify the urban environment according to its energy performance. Their approach mainly focused on the assessment of the exposed surface of the building stock of Great Britain without however referring to the energy consumption of buildings.
Steadman et al. [15] have examined geometry parameters in order to define correlations to energy use. Their research pointed out the statistical correlation of four geometry parameters of the non-domestic building stock (volume, plan depth, exposed surface area and height) of London. They concluded that all examined parameters have a significant correlation with the volume parameter being the most highly correlated. A statistical approach for examining correlation of form parameters to energy demand can be found at [16,17].
Typology approaches, by Randall [18] and Preisig et al. [19] have as well connected the surface of the exposed shell to energy consumption as an expression of the S/V (Surface to Volume) ratio by examining abstract building typologies combined in different ways. The results of these researches stay on an abstract geometry basis and do not take into account different climatic conditions.
On the contrary, Niemasz et al. [20] studied the notion of the solar shell in nine U.S. cities and pointed out that the increase of solar radiation does not always imply the expected reduction in energy consumption, as energy savings during the heating period are counterbalanced by larger energy consumption during the cooling period. Other researchers [21,22,23] analyzed the energy efficiency of urban forms and pointed out the contribution of urban morphology on the sustainable development of the built environment.
Moreover, other studies examine urban form on a range of different methodologies, in order to define either the energy loads and CO2 emissions [24], or regional suitability for reducing CO2 depending on the type and on residential density [25] or aiming to assess scenarios for increasing renewable energy potential in neighborhoods [26,27]. Quantitative approaches focus on calculating end use energy consumption [28] and on simulating consumption behaviors of residents in order to predict future energy consumption at the urban scale [29].
All the above mentioned research shows that there is a variety of different approaches when it comes to energy efficiency at the urban scale. On the one hand, typology approaches can result in more general conclusions and give a wider perspective on issues concerning sustainability in contemporary cities, while on the other hand, case sensitive assessment methodologies can provide more accurate results for specific climatic conditions and specific urban areas. The tools for calculating the energy efficiency in both approaches have been found to vary as well. From simulation approaches to spatial or statistical estimation of energy demand, all methods have a common target; to find ways to define the more efficient way to foster energy efficiency measures.
At the meantime, currently cities are leading the way to a carbon-neutral economy. Some have passed or committed to aggressive greenhouse gas (GHG) emissions reduction targets and climate action plans; many have adopted building benchmarking policies. But the definition of policies and action plans should be based on extensive research in order to define the most efficient ways to upgrade the built environment. In this context this research aims to define patterns of sustainability that could promote specific urban policies according to climate and urban form.
The majority of central areas of contemporary cities have been built during the past decades without taking into account any energy conscious design parameters. The study of these areas and the definition of the degree of energy efficiency can not only contribute to the definition of appropriate energy upgrading measures and priority action plans but they can also teach us on how to build our cities in the future.
Urban morphology has been defined as the study of the urban form [30], of the agents and processes of their transformation [31] and of climate [32]. It has been suggested that urban morphology is a key to assess urban sustainability. Besides, as Oliveira points out [31]: “the understanding of physical complexities of various scales, from individual buildings, plots, street-blocks, and the street patterns that make up the structure of towns helps us to understand the ways in which towns have grown and developed”. In this context this paper examines the effect of climate conditions on the relationship between urban form and energy efficiency.
1.2. Scope of the Research
Following the fact that the building stock of the Greek city suffers from degradation, low quality of construction and an inefficient energy performance, with more than 25% of the building stock ranking in the lowest energy efficiency category according to the Greek regulation for the Energy Efficiency of Buildings (KENAK), a climate sensitive study of the energy efficiency of the built environment can be valuable. Measures of upgrade could be guided by the results of this study to those areas which present the worse energy performance profile. Moreover results could also help recognize to which extent compactness is related to energy efficiency.
This study supports that a modeling framework of urban form parameters is needed combining on a single function of form parameters, the energy demand in the Greek city context. This paper presents an innovative approach for achieving this purpose, as despite the fact that it is based on a typology basis, it also includes detailed geometry and form information of the urban blocks examined. This can make conclusions adaptable to the real city scenario instead of using abstract urban forms which would lead on abstract results as well.
For the scope of the research 28 typical urban blocks of different form and geometry are analysed for the climate of two cities (Thessaloniki and Heraklion) each one belonging to a different climatic zone of Greece. According to the Greek energy performance regulation, Greece is divided into four climatic zones (A, B, C and D; A is the warmest and D is the coldest). The city of Thessaloniki belongs to zone C and the city of Heraklion belongs to zone A (Figure 1). The typologies selected to be examined are representative of the continuous urban tissue of the Greek city centers, where the upgrade of the energy performance is imperative not only in economic terms but also in terms of improvement of the quality of life. The study examines their energy performance concerning heating and cooling, pointing out not only correlations of geometry parameters to the energy demand, but also differences and similarities in the contribution of geometry and form to space load demand in different climatic conditions.
Besides, well-known factors of urban form the research examines the form of the inner court of urban blocks in order to relate it to energy efficiency. Inner court geometry is a factor which is very important to take it into account in the specific urban context as it is not defined by a random development but it is in a great extend the result of building regulations and plot sizes dominant in the Greek urban tissues.
In addition this paper aims not only to define the main parameters that affect energy demand at the urban block scale but also to quantify this relation on a single equation which will be able to assess the total load demand in all densely built urban blocks of the two cities, which are mainly representative of the central area of each city.
2. Methodology
The methodological basis of the research, as described in the next paragraphs, follows a typology approach by examining the prevailing urban block types in the central areas of the Greek city in order to define their energy performance. This means that the urban blocks examined are representative types, including all form and geometry factors that are associated to building’s energy efficiency. This approach has two main objectives.
The first is to avoid complexity existing in all real urban tissues of old European cities in order to manage in an efficient and feasible way the large amount of different urban block forms that can be distinguished. The second is to create a set of comparable cases in order to be able to draw not only case sensitive but also more general conclusions on the effect of the urban form on the energy efficiency in different climates. This is why the typologies that are examined might not necessarily have the same degree of representativeness for the two cities. Others might be more suitable for representing the urban tissue of Thessaloniki and others more suitable for expressing the typical urban tissue of the city of Heraklion. However, they have all been examined for both climates in order to be able to draw conclusions on a comparative basis.
The presented study of the urban form refers mainly to the physical form of the city including buildings, streets and urban blocks. Besides, according to Levy [34] the urban form and its study depend always “on the starting point of view, on a view of the form, on a prior definition that delimits the contour and the approach, to be verified on the ground”. In this context the current research focuses on the built form, the open space created by streets and free spaces and it takes into account urban block patterns of the Greek urban tissue. Human factor is taken into account in terms of indoor conditions that should be fulfilled in order to provide a comfort indoor environment, in terms of building uses and the corresponding operational schedules.
Urban form is examined in its present condition, aiming to assess its energy performance and to propose measures to improve it in the future. As the majority of buildings in the central areas of the Greek cities have been built between 1960 and 1980 [35] when the thermal insulation regulation had not been applied yet, the research suggests that the mass retrofitting of the Greek city is a challenge that should be faced in the near future. Urban morphology studies relating the energy performance to form parameters could be a leading point for setting priorities and targeting measures in an efficient way. In addition, it is useful to identify the parameters of form and geometry that could improve energy efficiency in order to take them into account in future building regulations’ recasts and in the expansion of urban plans.
A simulation approach is followed for the calculation of heating and cooling loads and statistical analysis is also performed in order to correlate form and geometry parameters to the calculated energy demand.
A linear regression model is developed for each one of the two climates, in order to define energy demand through the parameters which mainly affect energy performance. The regression model aims to predict the energy profile, of any urban block under the boundaries set in the current research and to quantify the contribution of all significant form parameters on the energy demand for each climatic zone examined.
2.1. Study Area and Climate
As already mentioned, the analysis of the energy efficiency of urban blocks is performed for the climate of two cities (Figure 1) corresponding to climatic zone A (Heraklion) and C (Thessaloniki).
The city of Thessaloniki is situated in the northern of mainland Greece in the region of Central Macedonia (latitude 40.50° N, longitude 23.00° E). The form of the city is organized around a narrow central area, which is surrounded by two large sectors in the west and east (Figure 2a). The geomorphology of the area consists of highland in the north, Thermaikos bay in the south and abundant agricultural land in the east and west. The city’s center urban plan is characterized mainly by an orthogonal grid with several urban block sizes forming different layout plans. Building heights differ significantly ranging from 10 m to 26 m. The urban tissue of the old town in the north of the city is characterized by a more organic layout, with smaller buildings having one or two floors, retaining however a dense and compact urban form in terms of land coverage.
The city of Heraklion is situated in the southern of Greece in the north of the island of Grete (latitude 35.30° N, longitude 25.20° E). The city faces the Aegean Sea towards the north (Figure 2b). Heraklion is significantly smaller than the city of Thessaloniki; however, it is the largest city of the island of Crete, the capital of the region and the fourth largest city in Greece after Athens, Thessaloniki and Patras [35]. The urban tissue is characterized by a central core surrounded by the Venetian fortification walls, forming a core city which has expanded outside the walls towards the south in a homocentric urban plan. The majority of building heights range between 10 m and 16 m, but there are also buildings with a 19 m height and older buildings with one or two floors.
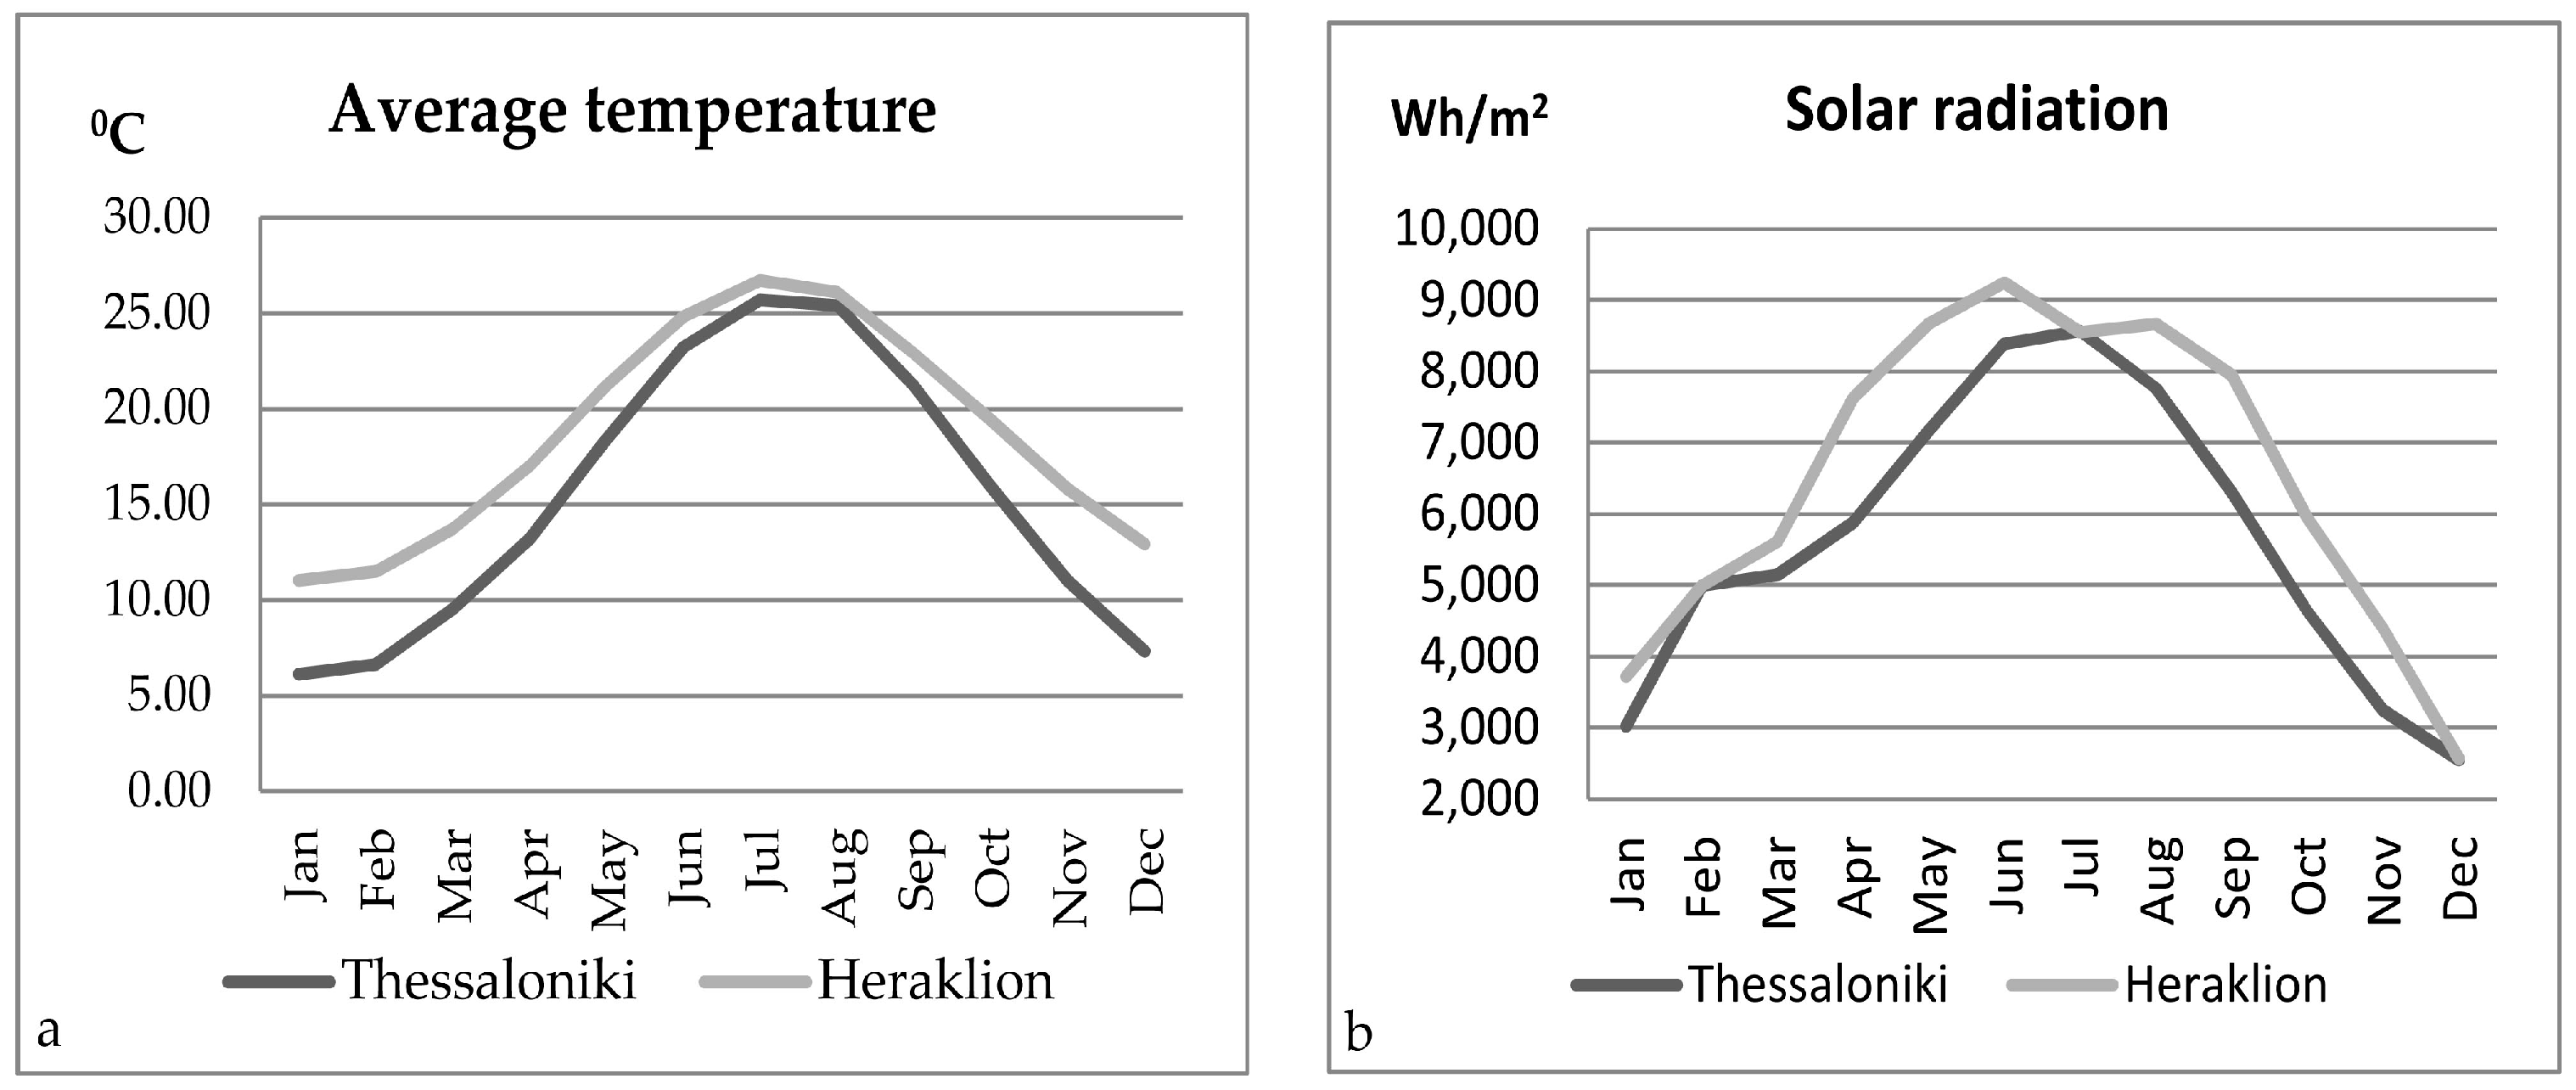
Despite the fact that they both are seaside cities, climate conditions differ significantly during the year as they are situated in different latitudes. Figure 3a presents the average temperature, for each month of the year, for the two cities, and Figure 3b the solar radiation per month for each city. Thessaloniki, not only presents lower temperatures during the whole year, but it also has less solar radiation especially during spring and autumn.
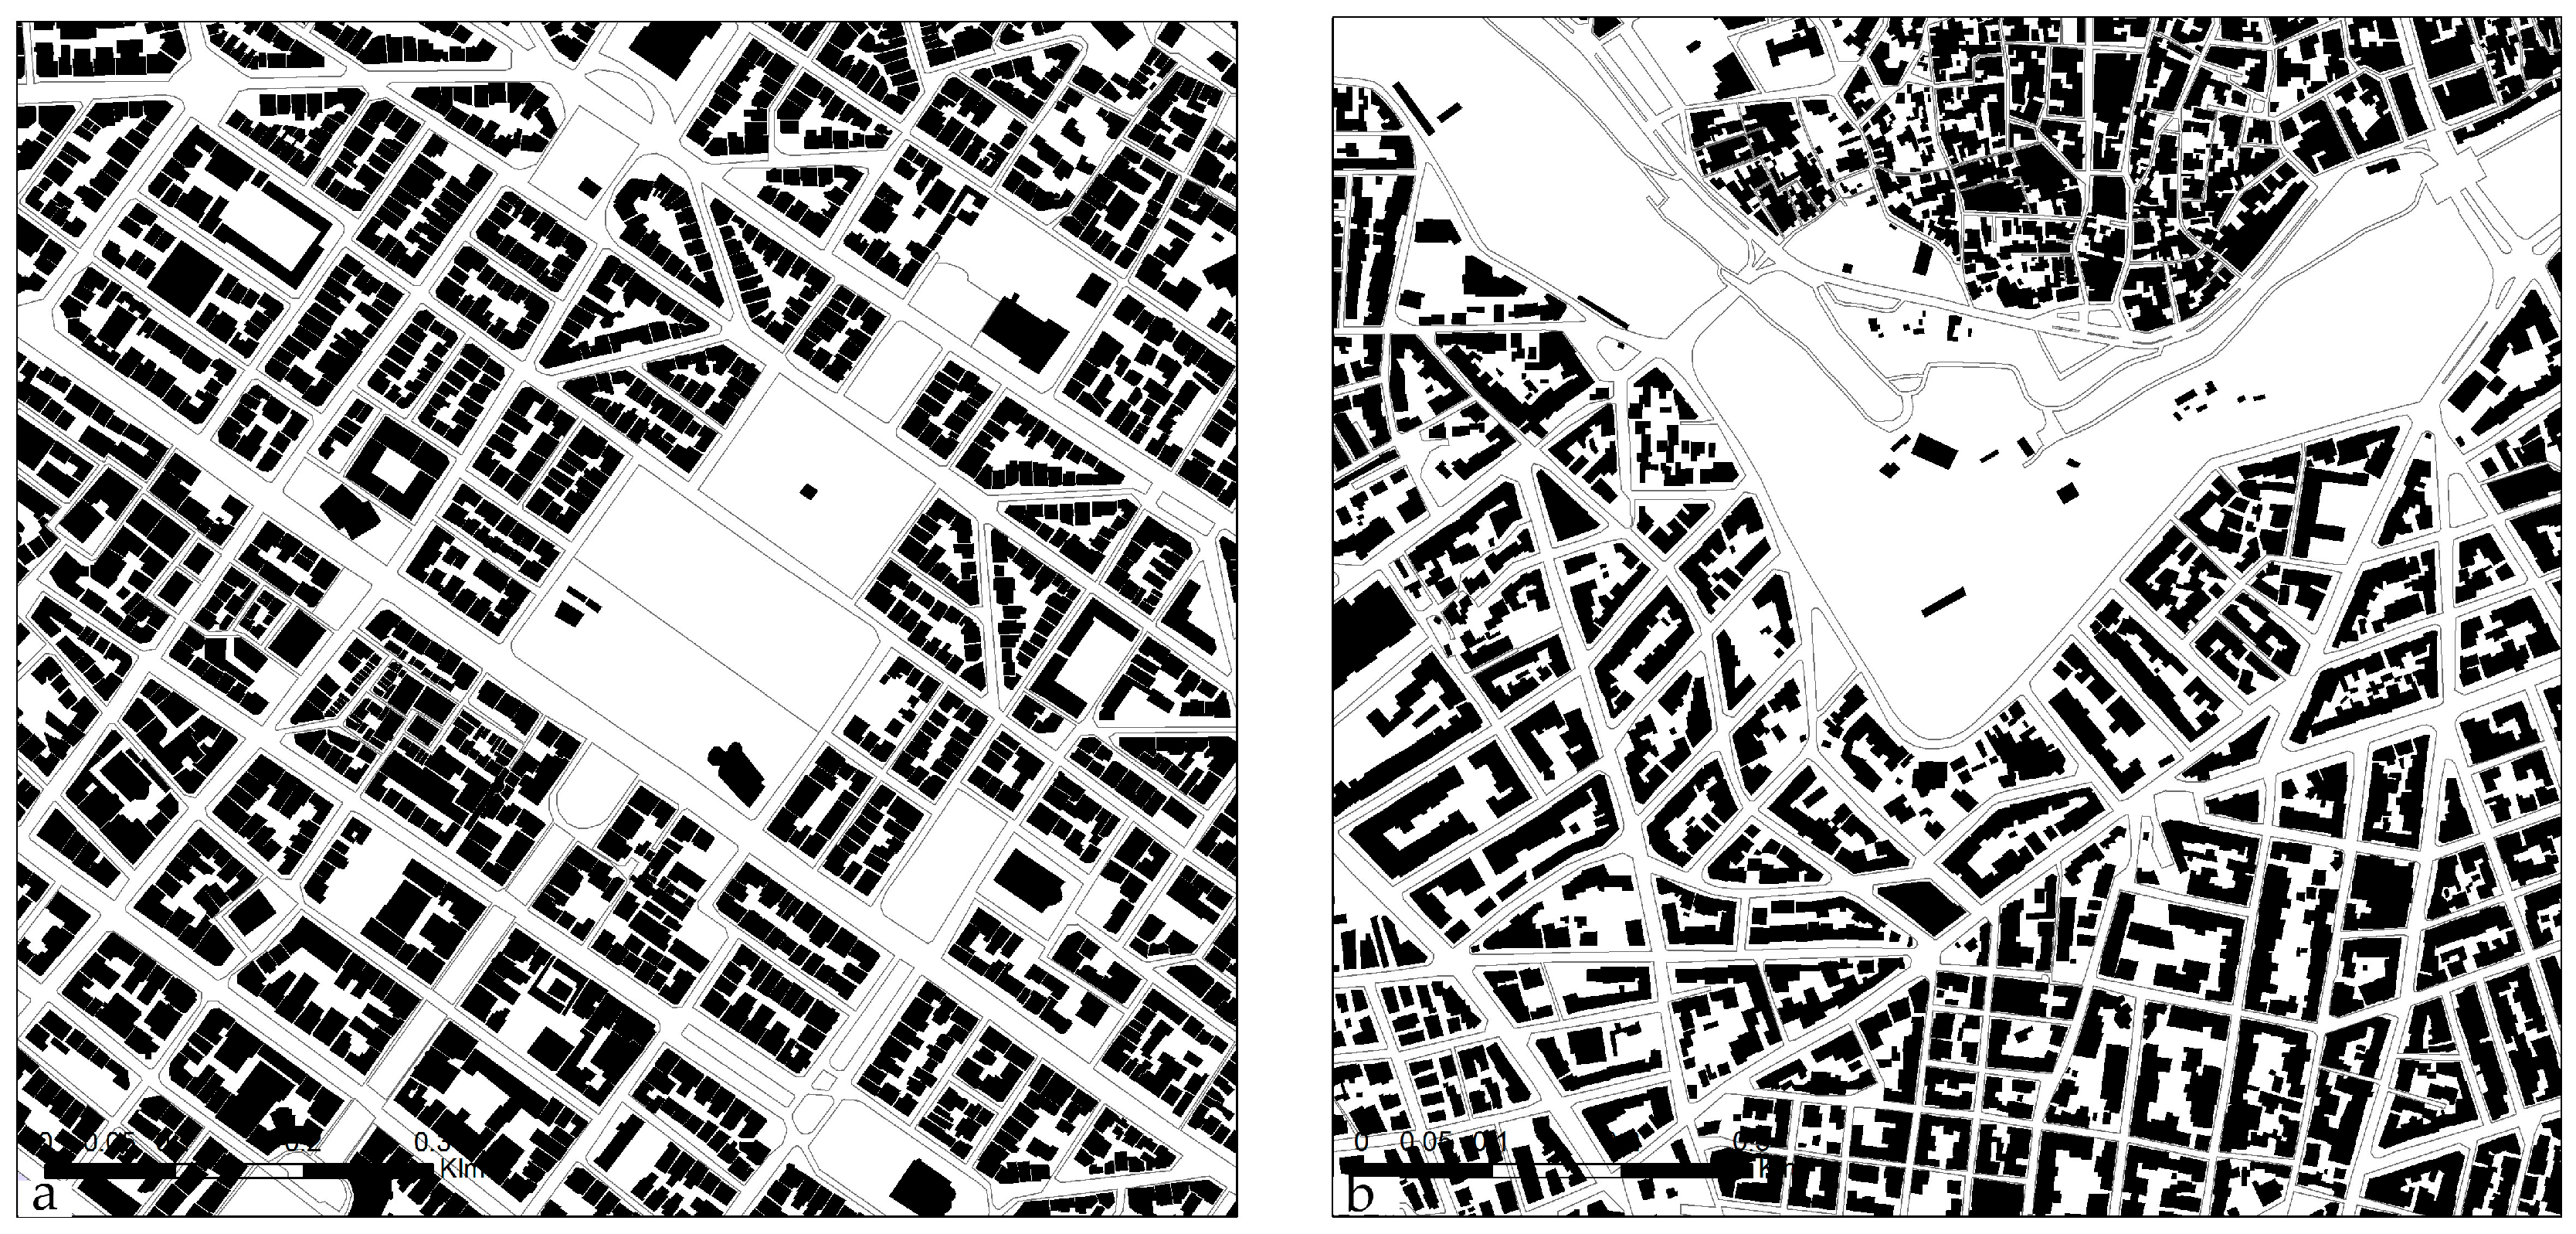
The urban fabric of the city center of both cities presents a high degree of coverage of the built space and is densely built (Figure 4). In more distant areas the cities have also discontinuous urban tissues with a variety of urban block typologies, but the analysis of discontinuous form exceeds the scope of this paper.
2.2. Urban Block Typologies Description and Analysis
The typical urban blocks analysed in this study have different layout plans, form and geometry parameters and are characterized by a relatively high coverage ratio. They are organised in three different groups according to the building height. Each urban block examined is a representative typology of the urban tissue of the Greek city [37]. Urban block typologies are formed by combining a number of typical buildings, which represent the most common building types. A database of typical building typologies from [37] was used for this purpose.
The analysis focuses on urban blocks having a continuous form meaning that buildings are attached to each other forming a compact volume. Besides, this is also imposed by the high values of coverage ratio of the examined cases.
According to the fact that urban blocks are characterized by a small range of coverage ratio, the degree of compactness is mainly defined by the corresponding building ratio, which is apparently related to the building height and by the resulting surface to volume ratio, which expresses the ratio of exposed surface to the urban block’s volume. Building ratio is calculated by dividing the total built surface in all floors by the plot surface. It should be also mentioned that all parameters expressing geometry or compactness refer the urban block scale and not to the building scale. This means that coverage ratio, building ratio, or S/V ratio values presented in this paper do not apply to the individual buildings, nor are they an aggregated index of individual buildings corresponding values, but they have been calculated for the total urban block volume independently of the number buildings included in the block.
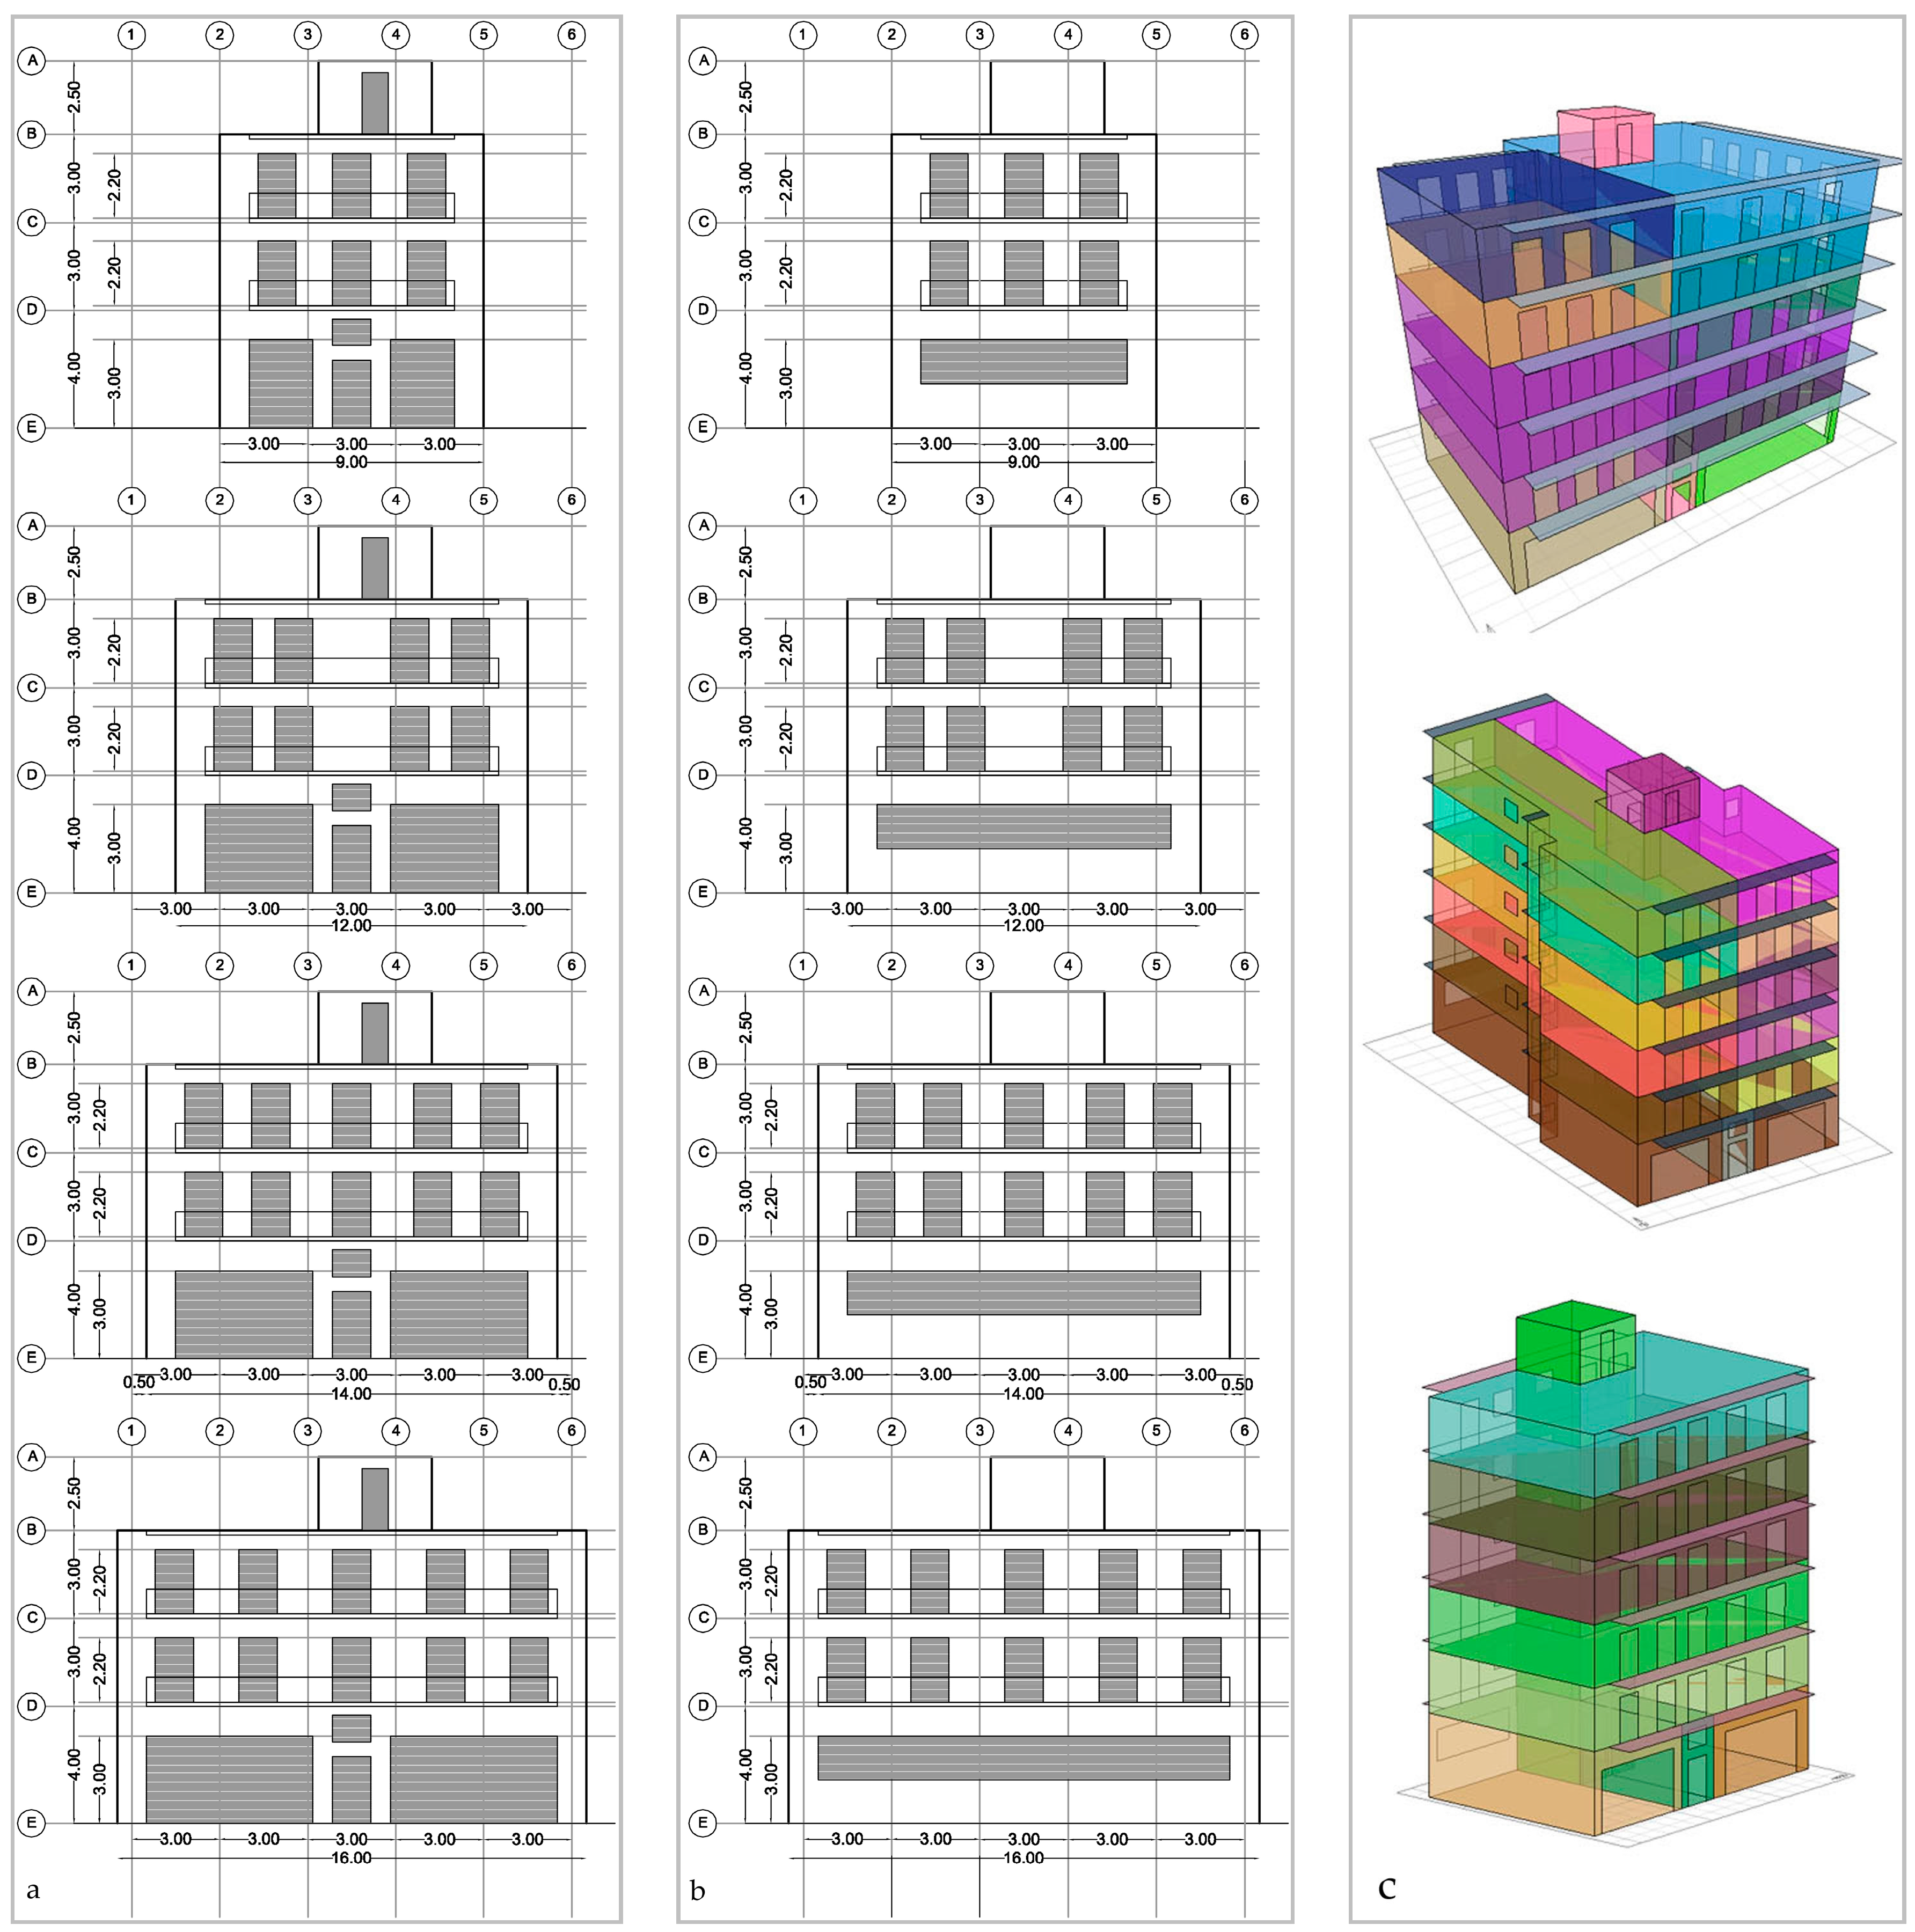
Elements of the façade such as openings and balconies have common typical dimensions of the majority of Greek buildings, which were imposed during the past decades by the building regulations. The basic window size (width × height) dimensions taken into account are 1.30 m × 2.20 m respectively. The rule for positioning the windows in the façade follows a basic 3.00 m grid, which follows common practice for the division of plans of the Greek buildings, as in the majority of cases the basic room dimension is defined by a minimum 3.00 m width. The above mentioned rule for positioning windows on the typical building façade, results in a range of 24–32% of transparent to non-transparent vertical building surfaces. Balconies have all been designed in a common dimension for the front and the rear façade of the buildings accounting for 1.10 m and 0.90 m respectively.
The typical façade configuration for the front and the rear view of the buildings and 3D models of 3 typical building blocks are presented in Figure 5. Buildings are divided in different thermal zones for each floor and they all have a central volume for the staircase and entrance with common plan dimensions which has been considered as a non-conditioned zone. This zone exceeds the height of the building in each case by 2.10 m, as is usually the case in Greek buildings in order to provide access on the flat roof.
Road width is considered to be 15.00 m for all building blocks examined, and the surrounding buildings have common form and geometry to each examined case. Of course in the Greek urban tissue there is a great range of street widths, including widths smaller than 15.00 m, but in this case urban block form is altered by the mandatory recession of the last floors. A consideration of larger road width could also provide important conclusions on the effect of this parameter on the energy efficiency of the urban tissue but in a general consideration the better solar access would have a favorable effect on energy performance during the heating period for the Greek climatic conditions.
The form and geometry parameters of the 28 examined urban blocks are presented in three tables (Table 1, Table 2 and Table 3), describing the overall profile of each case. The typical urban blocks are grouped according to their geometry factors into three different groups of typical urban blocks as described below:
- Group 1, includes buildings with 7 floors corresponding to a 22 m height, a coverage ratio ranging from 0.61 to 0.74 and a building ratio ranging from 4.24 to 5.61 (Table 1). The surface to volume ratio (S/V) ranges from 0.296 to 0.378. All buildings have 6 typical floors with a 3.00 m height and a ground floor with a 4.00 m height representing a non-residential use. Section geometry towards the street is described by a height to width (H/W) ratio of 1.47.
- Group 2 includes urban blocks with 5 floors and a corresponding height of 16 m. Coverage ratio ranges from 0.69 to 0.85 and building ratio from 3.14 to 4.24 (Table 2). All buildings have 4 typical floors with a 3.00 m height and a ground floor with a 4.00 m height with a non-residential use. Section geometry towards the street is described by a height to width (H/W) ratio of 1.07.
- Group 3 includes buildings with a height of 10 m corresponding to 3 floors that consist of two typical floors having a three meter height and a ground floor with a 4.00 m height with a non-residential use. Coverage ratio ranges from 0.67 to 0.80 and building ratio from 2.00 to 2.41(Table 3). Section geometry towards the street is described by a height to width (H/W) ratio of 0.67.
Several plot sizes of urban blocks are included in the analysis in order to draw conclusions on a range of typologies representing the majority of urban blocks of the densely built tissue of the Greek city. Urban block plot size ranges from 1155 to 6864 m2 for group 1, from 1155 to 5400 m2 for group 2 and from 1188 to 6185 m2 for group 3.
Urban blocks are organized in each table according to their size and plan proportions. For groups 1 and 2 three size categories are distinguished (the larger presented first on the table and the smaller last), while group 3 has 2 size categories. The size categories are separated by a thicker line on the table. For each size category (large, medium and small sized urban blocks), the square layout plans are presented first on the table, followed by the rectangular plans. For group 1 three urban blocks are included in the first category (large: 1.1–1.3) and four in the other two categories (medium: 1.4–1.7 and small: 1.8–1.11). For group 2 three urban blocks are included in the first category (large: 2.1–2.3), four in the second (medium: 2.4–2.7 and three in the third (small: 2.8–2.10). Group 3 includes three urban blocks in the first category (3.1–3.3) and four in the second (3.4–3.7).
2.3. Energy Demand Calculation
For the calculation of heating and cooling load demand, a 3D computer model has been created in Ecotect Analysis 2011 for each one of the typologies. In order to be able to compare the results of the simulation several assumptions were taken into account during the construction of the simulation model.
First, all urban blocks are oriented in a similar way, having their larger axis parallel to the east—west direction, in order to be able to compare the cases. Of course, orientation is an important parameter, which should be taken into account in the examination of urban tissues and especially when it comes to energy efficiency. However, this study is limited in a common orientation, which has been chosen after an orientation parametric analysis, carried out for the urban blocks of the city of Thessaloniki. The orientation chosen to be employed in this paper is neither the best (optimum) nor the worst. This choice was considered in order to compare a mean case scenario. Results of simulations on 8 different orientation angles have pointed out that the difference on total load demand ranges between 0.4% and 2.5%. This means that despite the fact that energy performance of urban blocks is influenced by different orientation, it is a less important parameter than other form factors when it comes to energy performance.
Second, as the vast majority of buildings in the Greek city centers have been constructed before 1980 and they are characterized by the lack of insulation of the building shell, all constructional elements (walls, roofs, load bearing elements etc.) are considered to be non-insulated and windows are single glazed with an aluminum frame. All buildings are considered to have similar construction (representing common practice in Greece) consisting of concrete load bearing elements and brick masonry walls. The U-values of all construction elements are presented in Table 4.
The heating and cooling loads are calculated through simulation performed for a whole year period and in a month’s interval for indoor temperature conservation between 20 °C and 26 °C respectively according to the national energy performance regulation. Concerning operation hours, all urban blocks are considered to be residential with a non-residential use on the ground floor level. This is why different operation hours were taken into account for the ground floor spaces and the spaces of the rest of the floors. It should be noted that all space load demand values presented hereinafter refer to an annual basis.
3. Analysis and Results
3.1. Definitions of the Parameters of the Analysis
The analysis focuses on defining the relation between the urban form parameters and the energy performance in two different climatic zones of Greece. This is why results of energy performance calculations are examined not only for each city but also on a comparative basis, trying to figure out similarities and differences among the three groups of urban blocks; in order to quantify the effect of different climatic conditions during the heating and cooling period as well.
First, the calculated space loads are presented and conclusions are drawn on the difference resulting on the load demand for the climate of each city. The results are compared for the heating and cooling loads separately in order to define the effect of urban form during the heating and the cooling period. In addition the total load demand is examined in order to draw conclusions on the energy profile of each urban block and the effect of geometry on the overall energy demand.
Second, the correlation of space loads to form parameters is examined. The Pearson correlation coefficient is used for the heating and cooling loads and for the overall load demand as well. Except from the coverage ratio, the building ratio and the S/V ratio, two additional parameters are examined:
- The inner court perimeter
- The urban block plot overall surface
The first intends to correlate the geometry of the uncovered space to energy performance, as it expresses the exposed shell towards the inner court of the urban block. Inner court perimeter can be a decisive factor if correlated to energy efficiency as in a great number of urban blocks the uncovered spaces have been designed with minimum dimensions in order to cover regulation requirements. This affects in many cases the quality of life, as inner court geometry in most cases results in reduced daylight availability and bad air quality. In addition, narrow uncovered spaces in the core of urban blocks with relatively high buildings result in reduced solar access while, the extended perimeter results often in extensive heat loss through the building shell, especially in the case of inadequate insulation.
The second parameter is examined in order to define the effect of the urban block size factor on the energy performance. As already mentioned, block size can vary significantly in the Greek urban areas, as it is defined by the road network density and geometry. A variety of urban block sizes has been examined, ranging from 1155 m2 to 6864 m2. Besides, Bourdic et al. [38] propose three formulas for examining building compactness:
- Traditional compactness (S/V)
- Size factor (V1/3) and
- Form factor (S/V2/3)
Suggesting that size at the urban scale can affect significantly the assessment of energy efficiency they propose the use of S/V2/3 ratio instead of traditional compactness in order to remove the size impact. In the current research, however, traditional S/V ratio is examined, as size is a factor that defines the existing urban tissue and the results intend to correlate its relation to the energy performance.
After the examination of correlation of the two above mentioned parameters a new parameter is proposed combining them into a single index called the Inner Court index. This index is defined as the ratio of the inner court perimeter CP to the overall urban block plot size PS. The definition of the Inner Court index intends to create a clear expression of the contribution of the inner court geometry with regard to block size on the energy demand as it is proved by the findings of this study it has a significant contribution on the definition of the energy profile of the urban block for both climates.
3.2. Space Load Demand Results
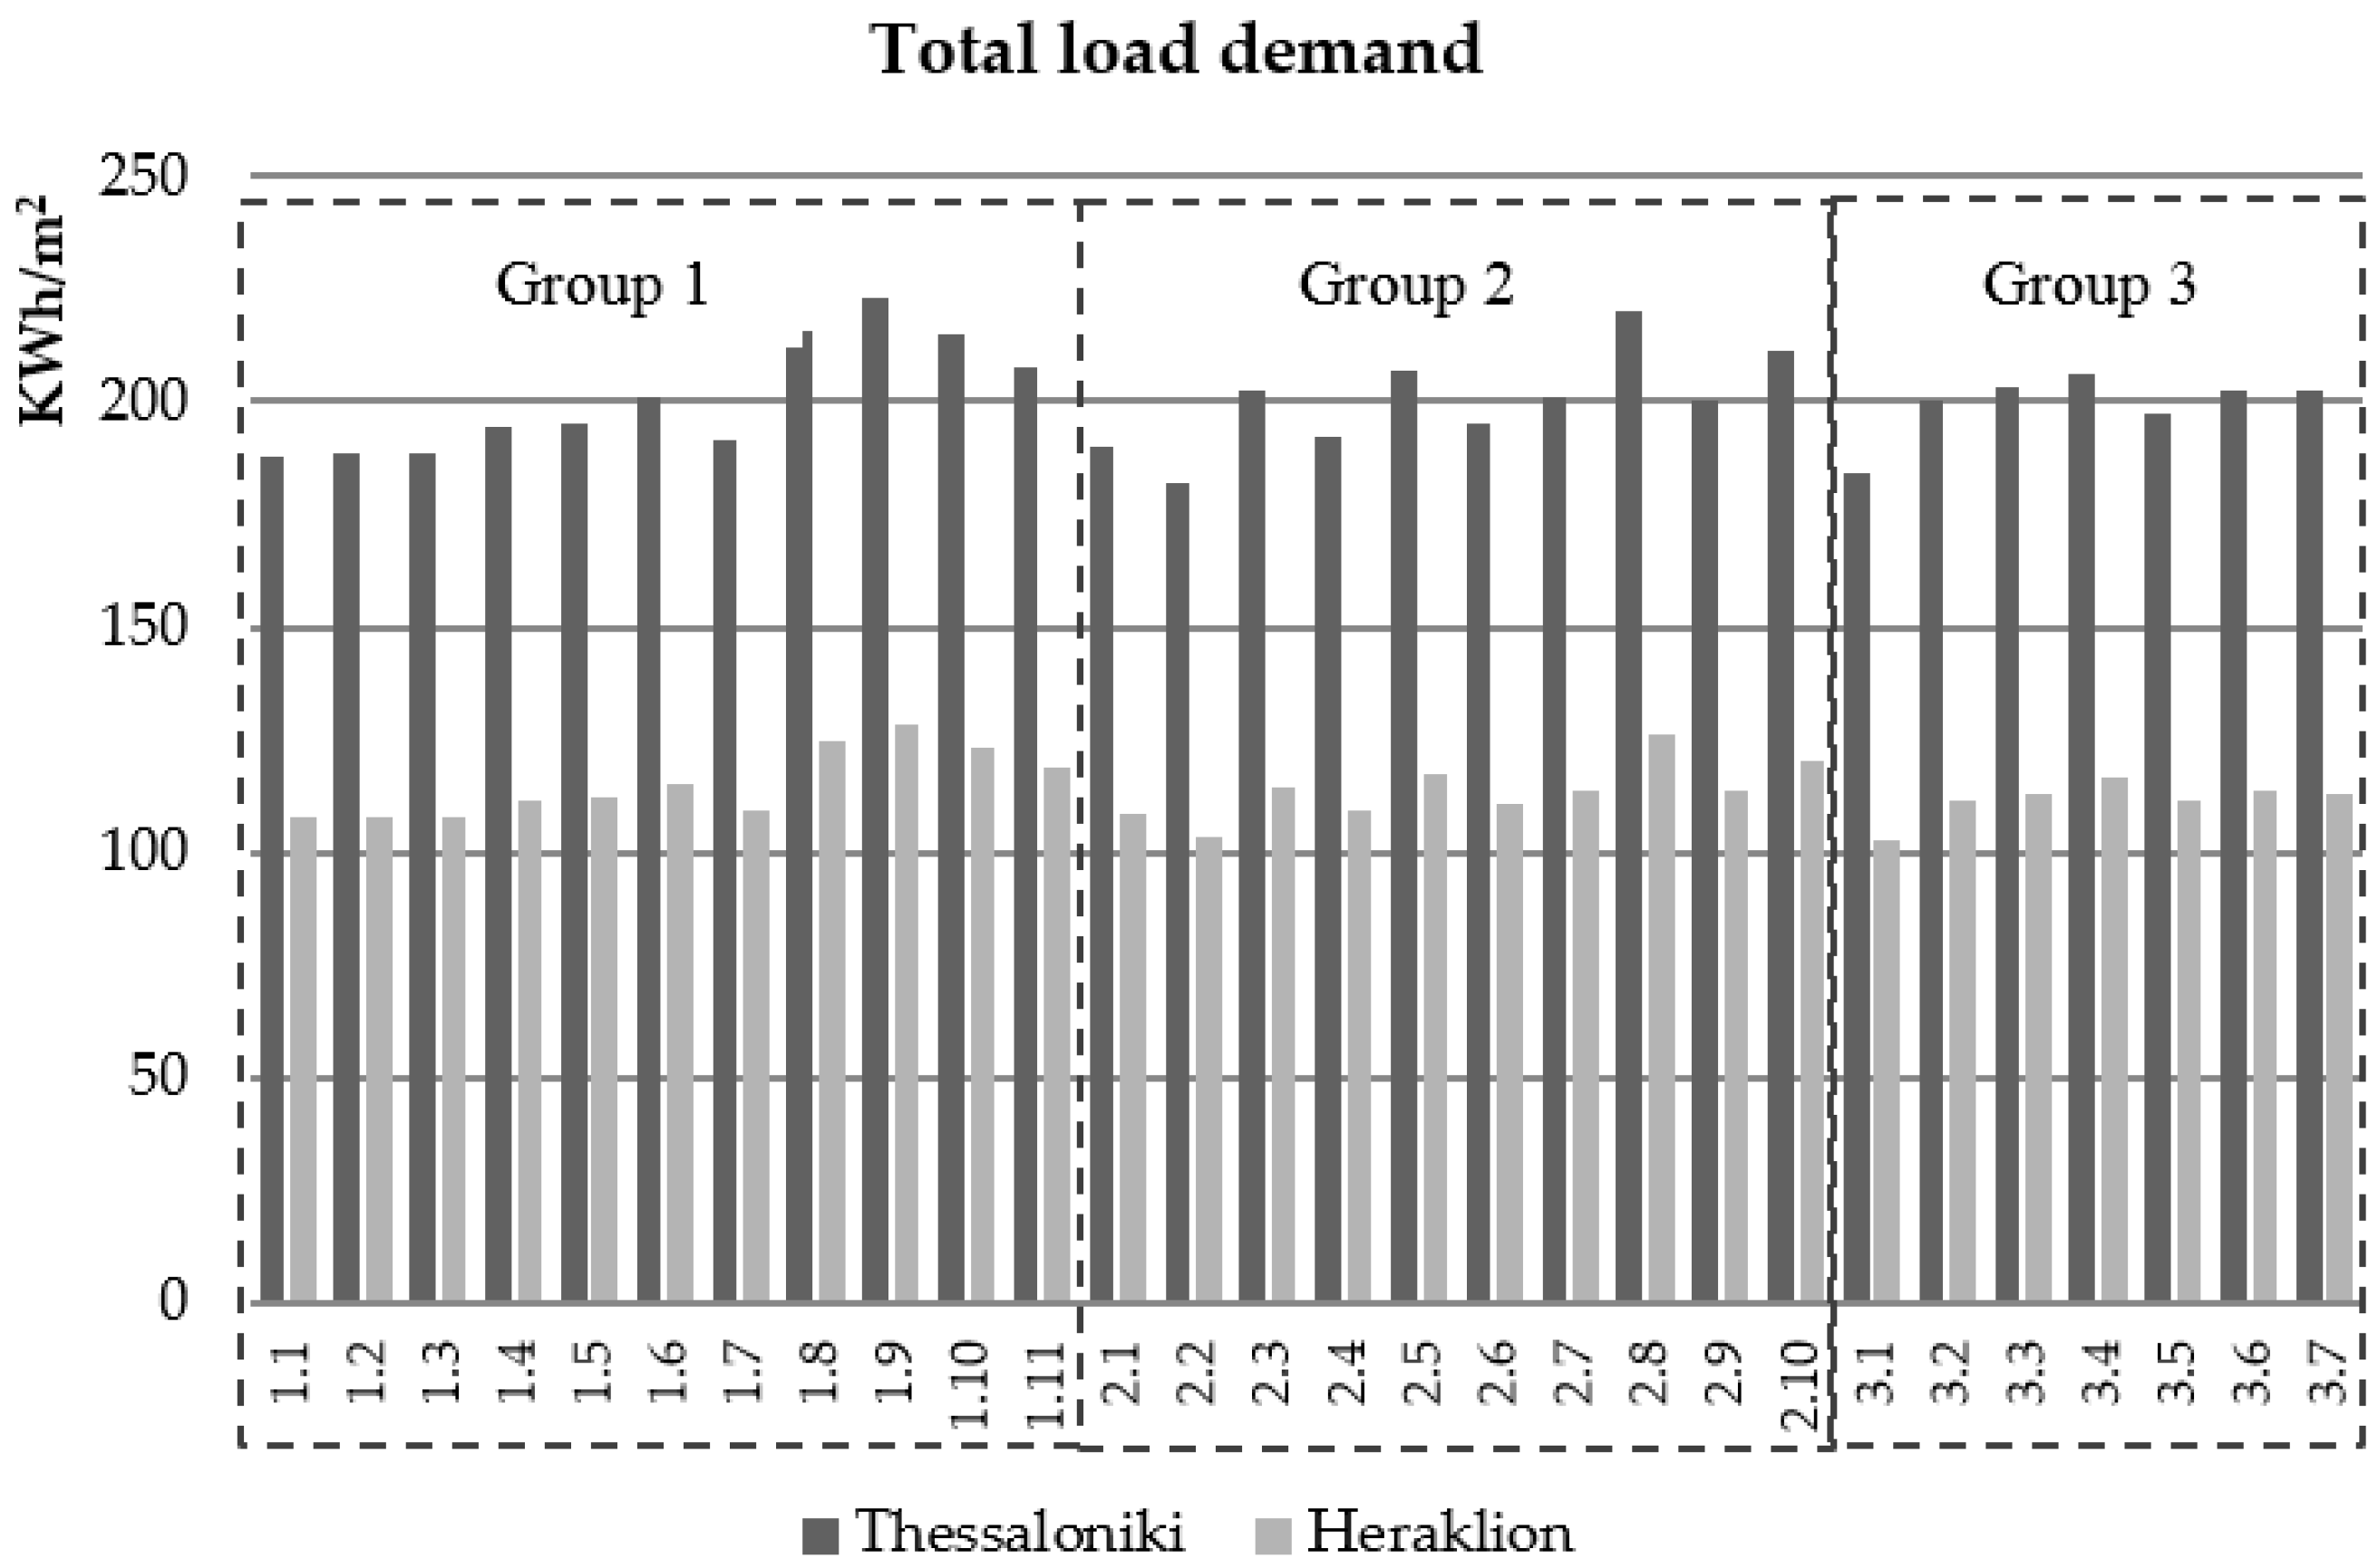
The calculated heating, cooling and total load demand for the 28 typologies of urban blocks for the climatic conditions of the city of Thessaloniki and of the city of Heraklion are presented in the histograms of Figure 6, Figure 7 and Figure 8 respectively.
For the climate of Thessaloniki heating load ranges from 167.82 KWh/m2 to 205.94 KWh/m2, and cooling load ranges from 13.42 KWh/m2 to 17.86 KWh/m2, resulting in a total load demand range of 41.60 KWh/m2. For the city of Heraklion heating load ranges from 83.82 KWh/m2 to 104.45 KWh/m2 and cooling load form 18.77 KWh/m2 to 24.85 KWh/m2 resulting in a total load demand range of 25.19 KWh/m2. The range in both cases confirms the fact that urban form and geometry defines the energy performance of the Greek city in a great extent. Moreover, despite the fact that this is an urban block approach similar results on energy demand calculations are driven by building research for Greek climatic conditions validating, to a certain degree, the results of the research. Dascalaki et al. [39,40] calculated the thermal load demand for several building typologies and concluded that for climatic zone A (Heraklion) load demand for non-insulated apartment buildings ranges from 55.10 KWh/m2 to 98.30 KWh/m2 while, for climatic zone C (Thessaloniki) values range between 161.80 KWh/m2 and 174.40 KWh. Despite the fact that it is not easy to compare results of these studies to the results of the current research as the first ones are examining building typologies and not urban blocks it is pointed out that in a raw comparison the results of the research are in line with similar studies.
For each examined urban block, a remarkable decrease in heating loads and an increase in cooling loads is indicated for the climate of Heraklion. Obviously the total energy demand is remarkably smaller for the city of Heraklion as in an average basis the total load demand for Heraklion is 43% smaller than the demand for the city of Thessaloniki. Besides, this is expected, as Heraklion is situated in southern latitude than Thessaloniki and thus it has a warmer climate.
In addition it is pointed out that the difference in the contribution of heating and cooling load in the overall energy demand is remarkable, as for the climate of Thessaloniki average heating loads account for the 92% of the total load demand and cooling loads only for the 8%, while for the climate of Heraklion average heating loads contribute by 81% on the total demand, while cooling loads by 19%. Despite the fact that heating loads are dominating in the total energy demand for both climatic zones, the significant increase in cooling demand calculated for the urban blocks in the case of Heraklion proves the degree at which energy demand can be affected by cooling demand. On the other hand it is also remarked that in some cases the contribution of cooling load can reach up to 21%, while for the city of Thessaloniki it does not exceed 8.5% in any case.
Table 5 presents mean values (for the 28 urban blocks) for heating, cooling and total loads for the climate of Heraklion and for the climate of Thessaloniki, in order to compare energy demand according to climate. The mean value of heating loads for all examined urban blocks for the city of Thessaloniki is 184.97 KWh/m2 for a whole heating period while for the city of Heraklion it accounts for 92.67 KWh/m2 that is 92.30 KWh/m2 less. As regards cooling loads in the case of Heraklion the demand is only 5.84 Kwh/m2 larger in comparison to cooling load demand for Thessaloniki. However, in a percentage based comparison the heating load mean value of Heraklion is smaller by 49.90%, when compared to Thessaloniki’s mean value, while cooling demand is 38.18% larger.
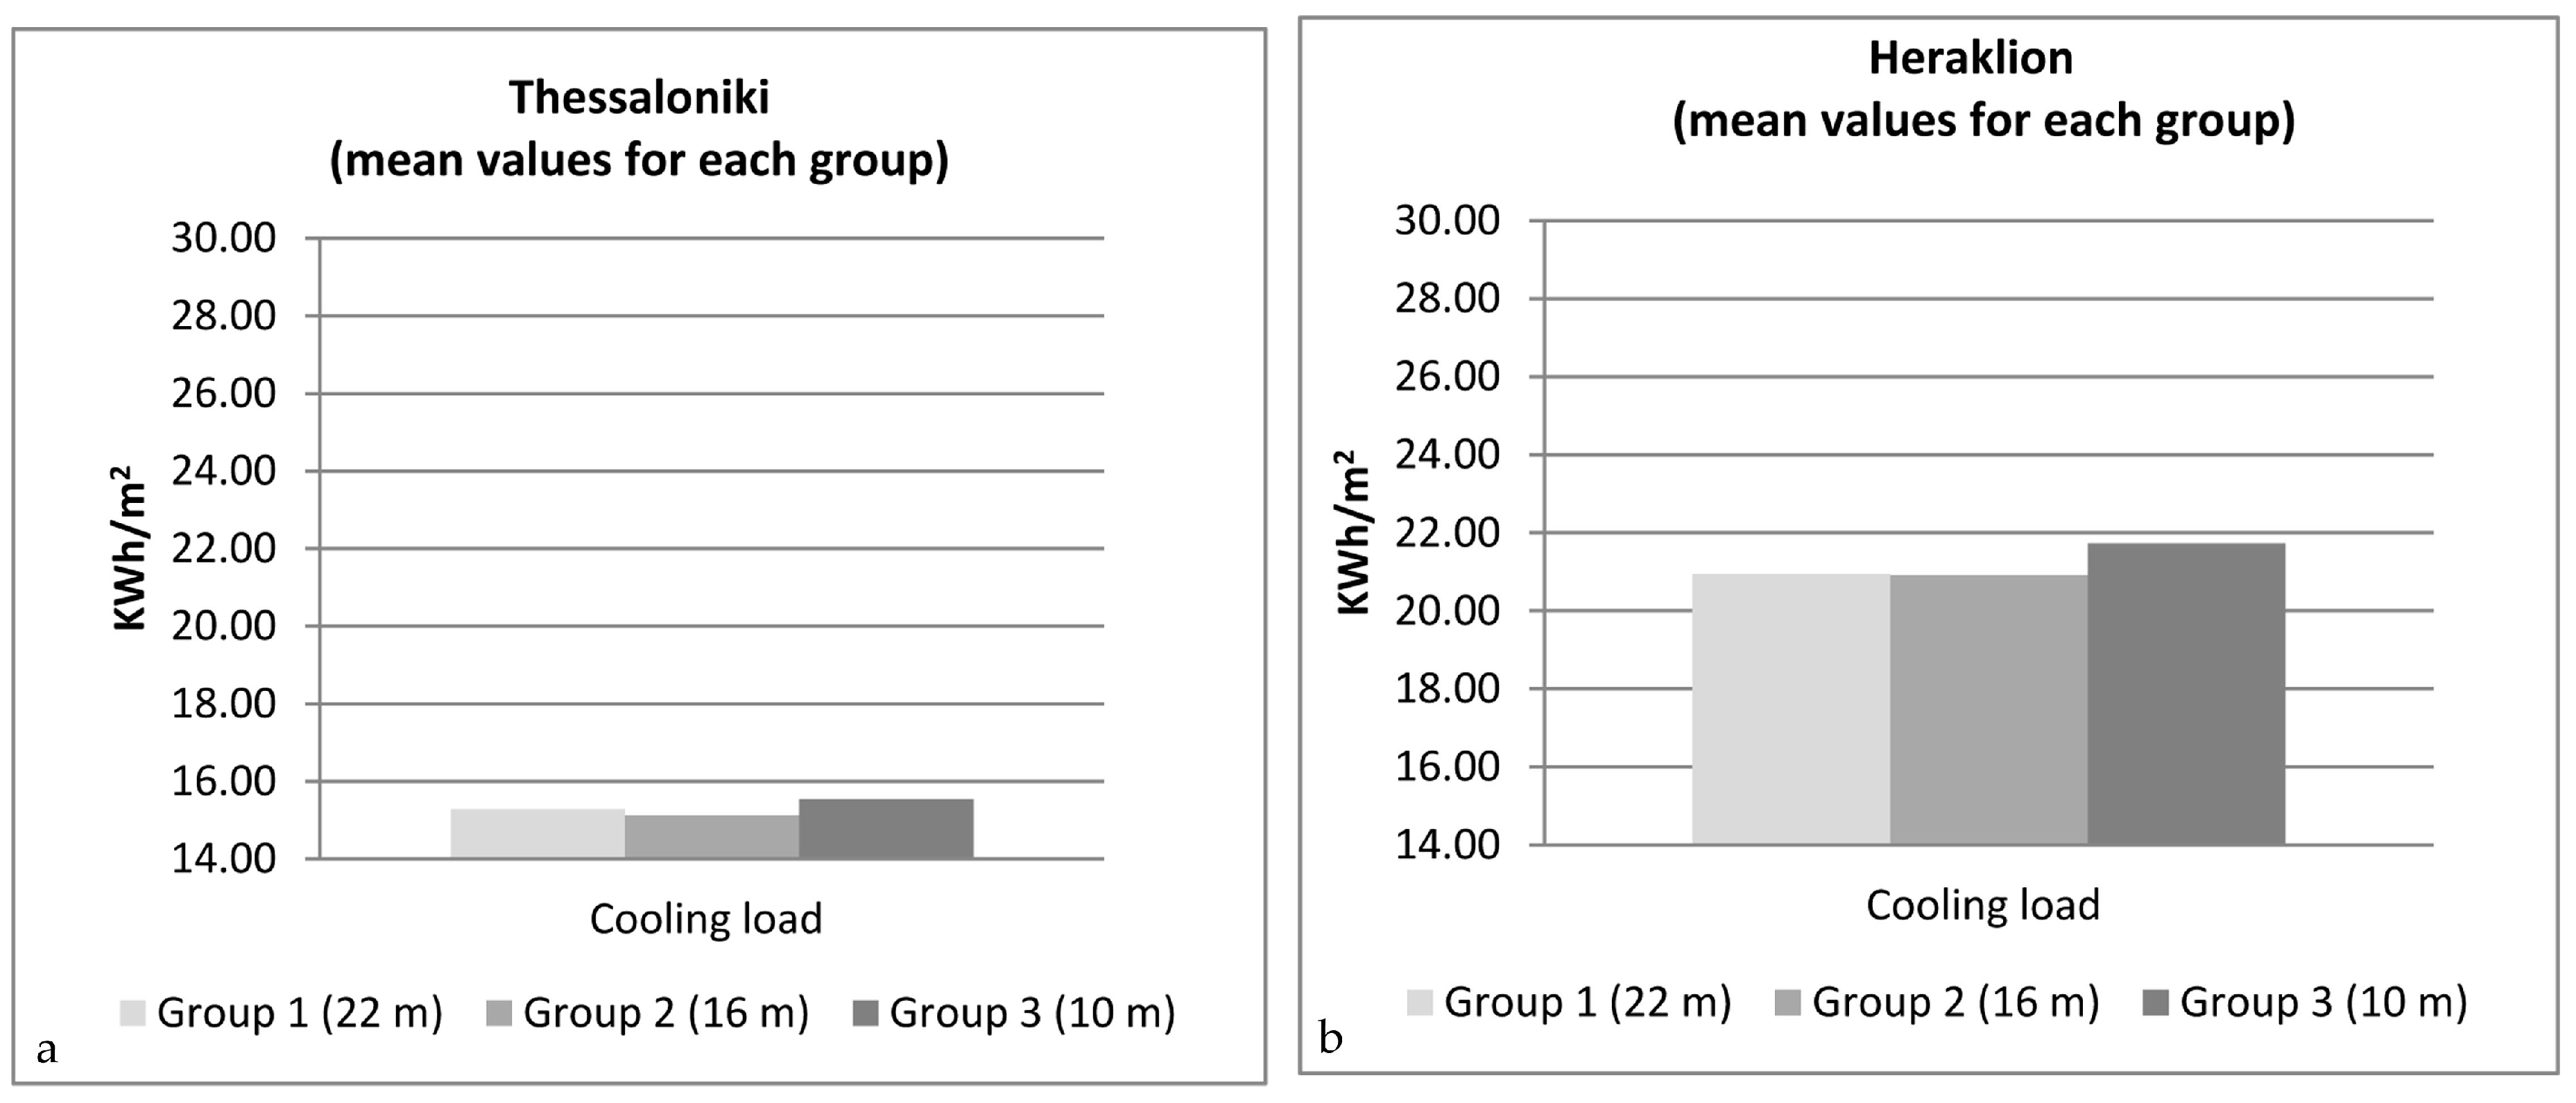
Conclusions on the effect of compactness can also be derived by the comparative examination of the mean values of heating, cooling and total load demand for each one of the three groups of urban blocks for Thessaloniki (Figure 9a, Figure 10a and Figure 11a) and Heraklion (Figure 9b, Figure 10b and Figure 11b) respectively.
In the case of Thessaloniki, group 3 presents improved total energy performance compared to groups 1 and 2, according to the derived mean values. However, if heating and cooling periods are examined separately, then for the heating period group 3 has still the best energy profile, while for the cooling period it is group 2, which presents less energy demand. Similar conclusions are drawn also for the city of Heraklion. This means that in a mean value comparison for both cities energy efficiency is favored by the small height urban block forms (10 m), while only for the cooling period medium height blocks (16 m) favor energy efficiency. It should be noted that this is a conclusion that regards densely built urban forms as the ones examined.
In addition, it is also pointed out that according to the above mentioned conclusions, if values are ranked separately for each urban block, then for both cities not all urban blocks of group 3 necessarily rank better in terms in of energy efficiency than urban blocks of group 1 and 2. This means that there are other geometry parameters which affect energy efficiency at an urban block scale besides urban block height. For example it is obvious that in group 1 there is a tendency for all urban blocks with a large plot surface to perform better than the majority of urban blocks of group 2 and 3. This means that the combination of large height to large plot surface can result in more energy efficient urban forms.
However, values of load demand for group 2 present the larger range between values, indicating that urban blocks of this group can either present energy efficiency or have a totally unfavorable energy profile depending on their form. Therefore, for the assessment of energy efficiency at the urban block scale; all geometry parameters should be taken into account in order to draw reliable conclusions.
The mean difference in load demand among groups is more intense for the majority of cases of urban blocks belonging in group 3 (group 1 and 2 present a mean difference of 86 KWh/m2 while group 3 a mean difference of 90 KWh/m2), meaning that smaller height urban blocks (e.g., group 3) appear to have a slightly larger decrease of energy demand for the city of Heraklion. This proves that urban form has a more intense effect (though slightly) when defining the energy profile of urban blocks in southern climates.
The urban blocks which are organized in the three groups examined differ not only in the layout plan configuration, but mainly in the mean building height. It is therefore pointed out that the height parameter affects the impact of climate on building energy performance and that urban morphology in densely built urban areas is related to energy demand in a great extent. Both heating and cooling loads have a larger difference in case of smaller height. Group 3, having the smaller height (10 m), presents the larger difference of load demand, while group 1, having the larger height (22 m), presents the smallest one.
Furthermore the examination of the range of energy demand values for each group shows that for groups 1 and 2 urban form can affect energy demand in both climatic zones by a factor of 1.2 while for group 3 by a factor of 1.1. This is a rather insignificant difference, but considering that typologies included in all three groups have a limited range in several form parameters (coverage ratio, plot surface, continuous form) it could be considered that in a broader examination of typologies a larger difference would result.
Moreover, it can be highlighted that the majority of urban blocks in which maximum values are observed for the three groups, have rectangular square plan proportions. An exception appears for the city of Heraklion as regards the maximum heating load, which appears to be for block 3.3. However, the rectangular square typology (block 3.4) in this case has also a very close value of heating load demand (91.90 KWh/m2) to the value of block 3.3 (92.18 KWh/m2).
For the minimum values it can be remarked that for both cities the same urban blocks present the minimum values for heating and cooling demand. It is also observed that plan proportions of the urban blocks vary for each group and they also differ for the heating and for the cooling period. In addition, for group 1 the total load demand for the two cities appears in a different typology, but this is rather an issue of balance between heating and cooling period.
Table 6 and Table 7 present the plan configuration of the urban blocks that have the maximum and minimum values in each group for heating, cooling and total loads for the city of Thessaloniki and for the city of Heraklion as well. It is obvious by the comparison of the two tables that maximum values appear in small sized urban blocks, while minimum values in large urban blocks. Therefore, larger configurations present improved energy efficiency when compared to larger ones.
Moreover, it can be highlighted that the majority of urban blocks in which maximum values are observed for the three groups, have square plan proportions. An exception appears for the city of Heraklion as regards the maximum heating load, which appears to be for block 3.3. However, the square typology (block 3.4) in this case has also a very close value of heating load demand (91.90 KWh/m2) to the value of block 3.3 (92.18 KWh/m2).
For the minimum values it can be remarked that for both cities the same urban blocks present the minimum values for heating and cooling demand. It is also observed that plan proportions of the urban blocks vary for each group and they also differ for the heating and for the cooling period. In addition, for group 1 the total load demand for the two cities appears in a different typology, but this is rather an issue of balance between heating and cooling period.
3.3. Correlation of Form Parameters to Space Load Demand
In order to examine the relation of energy performance to geometry parameters for the different climatic conditions, the Pearson correlation coefficient was used for all three groups. Results are presented for each group (Table 8, Table 9, Table 10, Table 11, Table 12 and Table 13) for the two cities. It is indicated that S/V ratios of all urban blocks for all groups are significantly correlated to heating and cooling loads calculated for both the city of Thessaloniki and the city of Heraklion. Obviously the correlation is positive, showing that the larger the exposed surface of an urban block for a certain volume is, the larger the energy demand derives. This indicates that heat losses from the building shell define the energy efficiency of urban blocks for both climatic zones. This means that the expected reduction of solar gains which is expected in high density urban blocks as a result of high S/V values is not.
It can also be remarked that for group 1 and for both examined climatic zones, cooling loads have a stronger correlation to S/V ratio than heating loads. For both cities Pearson correlation coefficient has similar values. Moreover, for heating loads, the correlation coefficient is larger for the city of Thessaloniki, indicating a trend for a stronger correlation of heating loads to the S/V ratio compared to the case of Heraklion.
For group 1 correlation is significant for all examined parameters (Table 8). Concerning coverage ratio it can be remarked that it has a significant negative correlation to load demand which means that larger coverage ratios favor energy efficiency. The same is for the building ratio and inner court perimeter; again the correlation is negative, meaning that the large values of these two parameters favor also energy efficiency as load demand is reduced.
Inner court perimeter is a factor which is rarely taken into account [41,42] in urban block’s energy efficiency assessment and it is has not a linear relation to the S/V ratio as it depends on more complex parameters influencing the urban form (regulation restrictions, daylighting issues, natural ventilation needs, plot geometry, building height etc.). Conclusions on inner court perimeter support that the correlation of inner court perimeter to energy demand is inverse of the correlation of S/V to the energy demand, as the first factor has a positive correlation coefficient while the second a negative one. This means that while a small S/V value favors energy efficiency a small inner court perimeter value is unfavorable.
Concerning urban block size it is also pointed out that there is a negative correlation for the climate of Thessaloniki, which means that large urban blocks are expected to have a favorable energy performance. However, for the city of Heraklion block size has a positive correlation to the total load demand. This means that larger urban blocks are expected to have unfavorable energy performance. However, the correlation of urban block size has opposite effect during the cooling and the heating period; for the heating period correlation is negative, while for the cooling period it has a positive value, as is also for the total demand.
Examining Pearson correlation coefficients for groups 2, (Table 10, Table 11, Table 12 and Table 13) it can be remarked that in these groups, coverage ratio and building ratio have no significant correlation neither to heating nor to cooling loads. Similarly, inner court perimeter presents no significant correlation, except from cooling loads of group 2 for Thessaloniki and to cooling loads of group 3 both for Thessaloniki and Heraklion. Finally, urban block size has a negative correlation to the total load demand for both cities.
3.4. Regression Models for the Two Climates
In this paper, special interest is given to the correlation study, which intends to highlight the most dominant parameters determining total energy demand in urban blocks.
The examination of the correlation between the load demand and the geometry parameters proved that the energy demand depends on all the examined parameters. It is thus important to identify the mathematical model which can describe the relation of the energy demand to the geometry parameters of the urban blocks.
A multiple linear regression model for each one of the two cities has been developed to assess the energy performance of the urban block according to the climatic conditions. The dependent variable is the Total Load demand (TL) and the independent variables are the Surface to Volume ratio (S/V), the Building ratio (BR), the urban block Height and the Inner Court Index (CP/PS).
Separate regressions were performed for the two different cities. For the statistical analysis IBM SPSS 24 platform was used. Each model could predict the total load demand of any urban block of continuous form according to the values of the independent variables. The values of the urban blocks’ geometry parameters should of course be in the same range as the parameters of the analyzed urban blocks.
First the normality of the distribution of the dependent variable is examined for both models. The test of normality (one sample Kolmogorov-Smirnov) for the total load demand for the climate of Thessaloniki (Total Load Th) and the total load demand for the climate of Heraklion (Total Load H) is presented in Table 14. The null hypothesis is retained in both cases proving that the normal distribution is confirmed.
The linear regression model for Thessaloniki is described in Table 15 and for Heraklion in Table 16. Sig. values are smaller than 0.05 for both models, confirming the significance of the corresponding regression coefficients. A 95% confidence interval was considered.
The coefficient of determination R2 is equal to 0.765 for the regression model of total load demand for the city of Thessaloniki and 0.799 for the regression model of Heraklion which means that 76.50% of the variations in annual load demand for heating and cooling can be explained by differences in the four parameters describing urban block form for the model of Thessaloniki and 79.90% of the variations in annual load demand for heating and cooling can be explained by differences in four urban block form parameters for the model of Heraklion. Model summary parameters for the two cities are presented in Table 17 and Table 18. According to the analysis the regression equation for Thessaloniki (Equation (1)) and for Herkalion (Equation (2)) are presented as follows:
where:
TLTh = 129.799 − 138.212 × CP/PS − 0.003 × PS + 1.911 × H + 160.838 × S/V
ΤLΗ = 70.111 − 86.178 × CP/PS − 0.002 × PS + 1.323 × Η + 93.173 × S/V
- TLTh is the total load demand value for the city of Thessaloniki,
- TLH is the total load demand value for the city of Heraklion,
- CP/PS is the Inner Court index,
- PS is the urban block plot surface,
- H is the urban blocks’ building height and,
- S/V is the surface to volume ratio.
The analysis shows that both regression models satisfy all the assumptions of correlation including, independence, linearity and homoscedasticity. Multicollinearity can be detected using variance inflation factor (VIF) and Tolerance factor (T). As a general rule which indicates that no collinearity issues exist, values for VIF and T should be: 1 < VIF < 10 and T > 0.1. The results presented in Table 19 indicate that the multicollinearity is not a problem in the developed regression model as for all independent variables both factors are within the above mentioned limits.
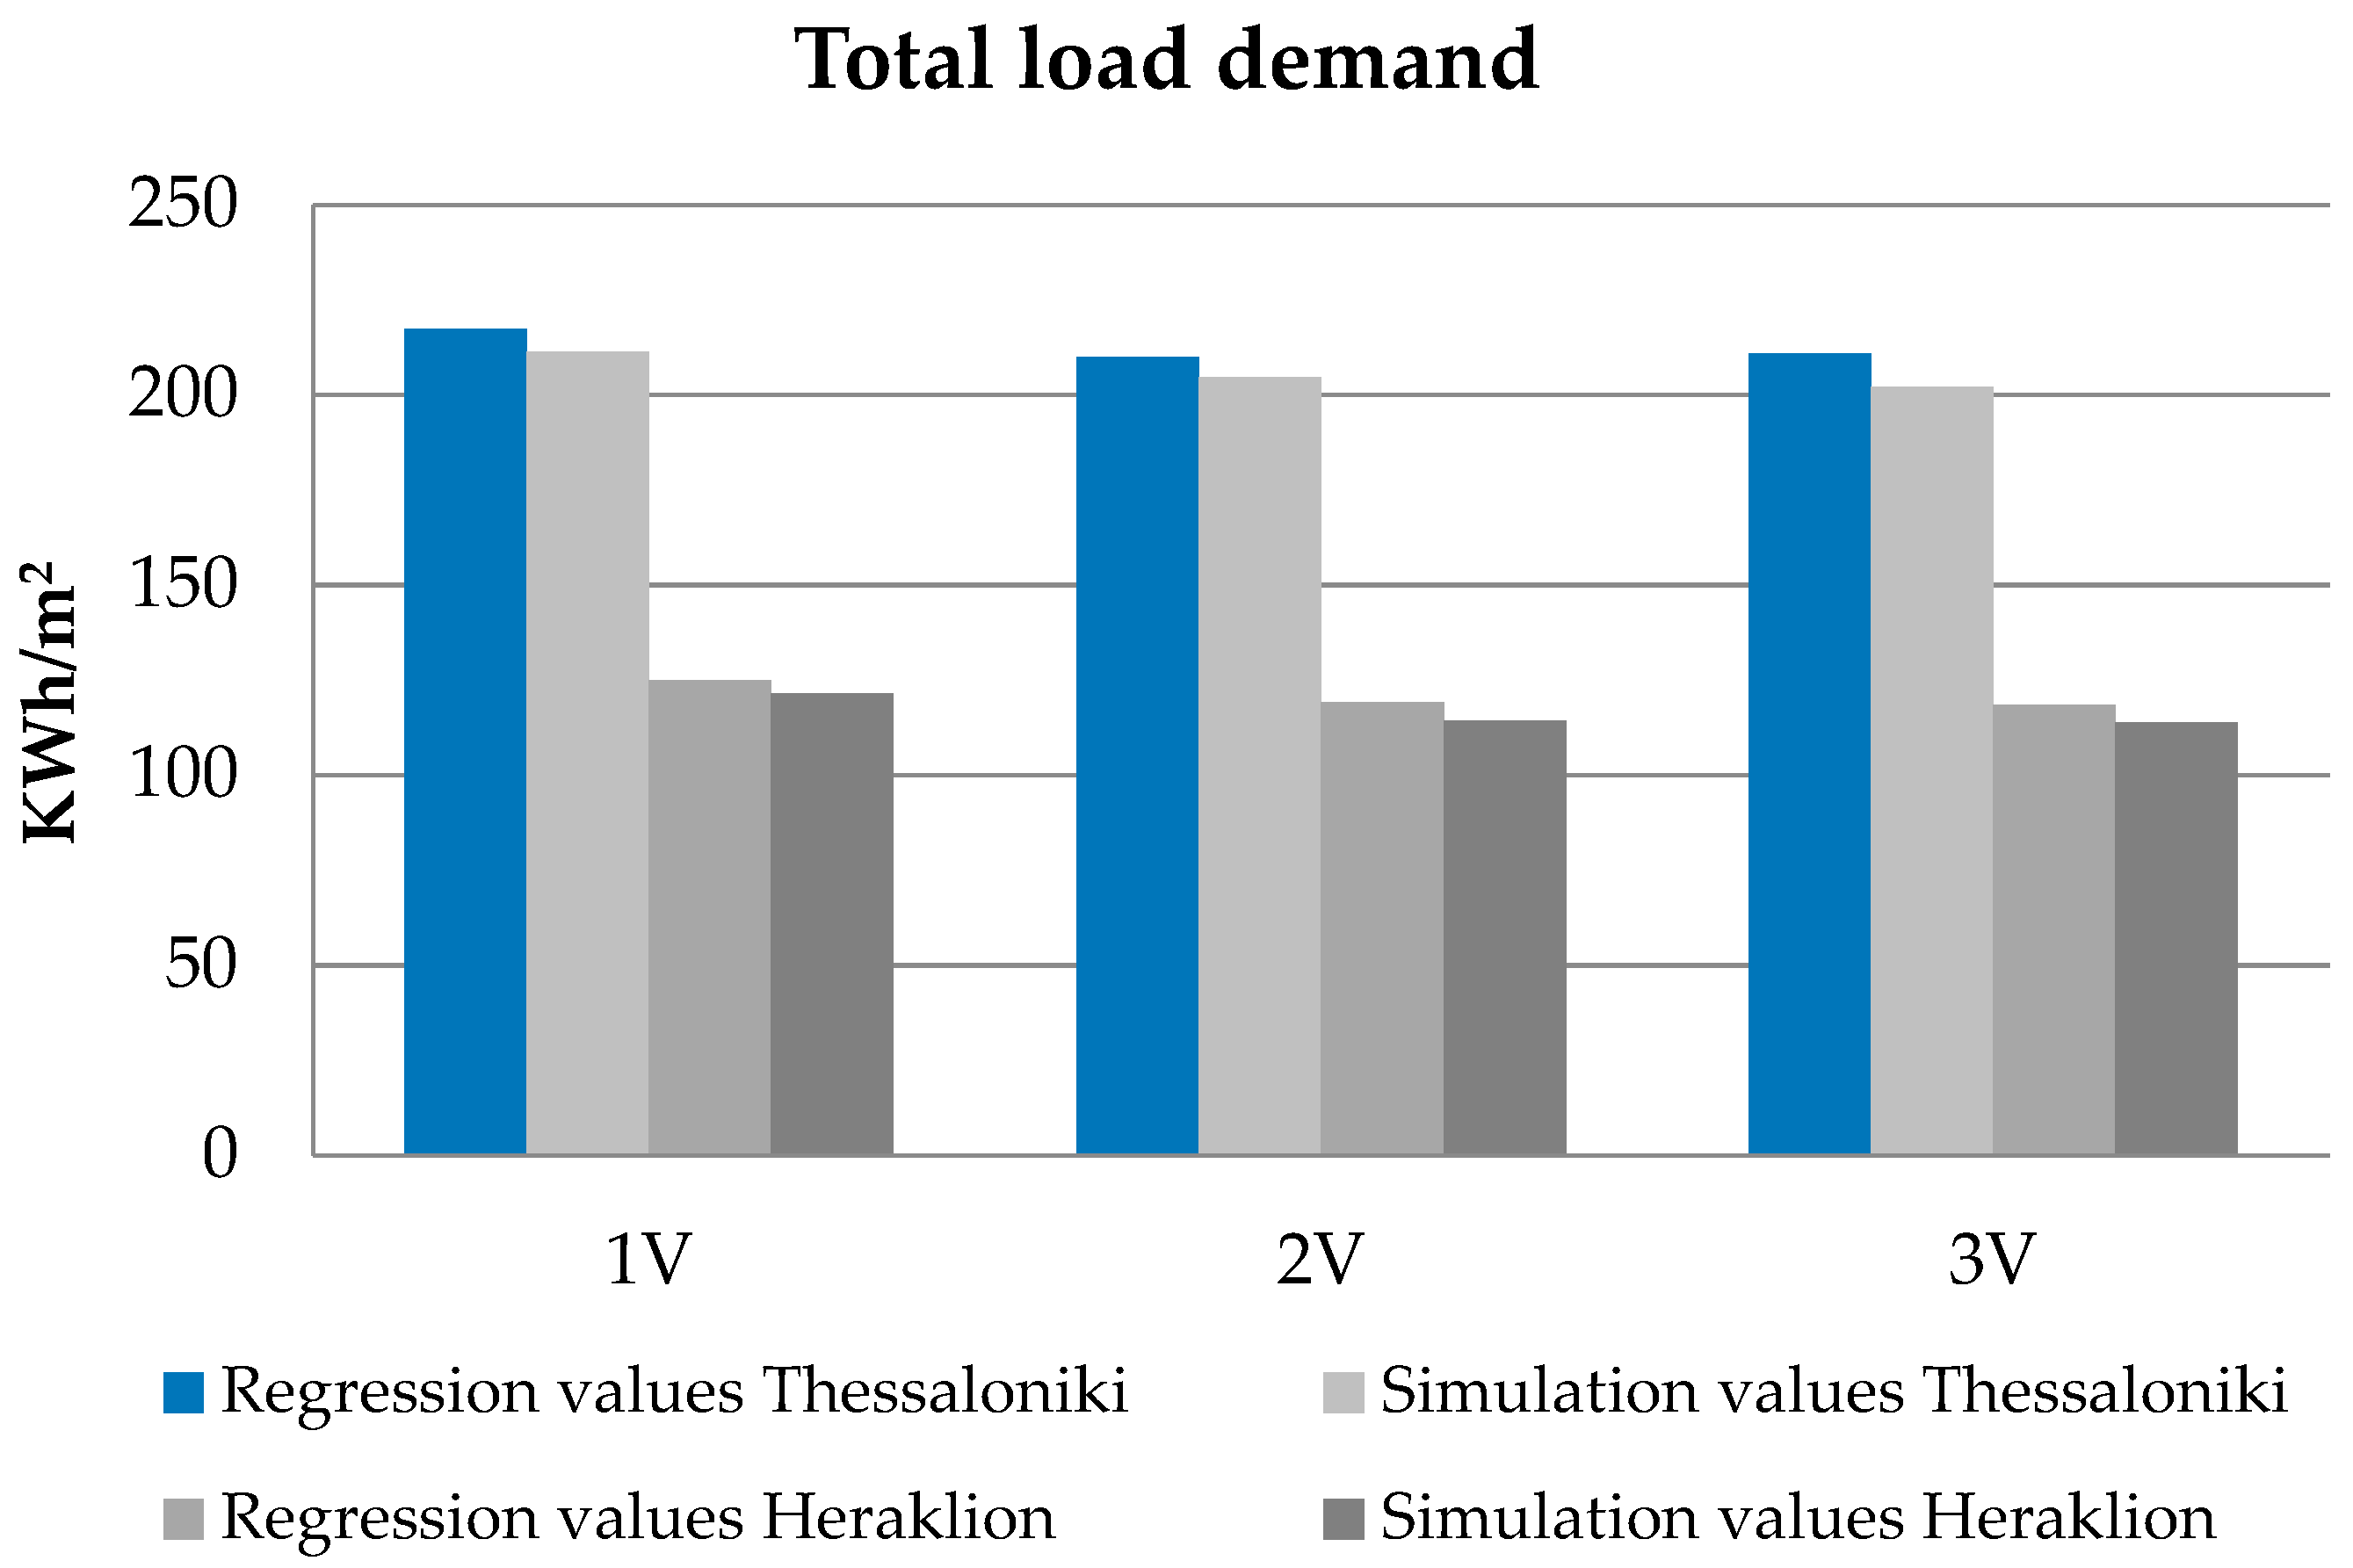
3.5. Regression Model’s Validation
For the validation of both regression models three urban blocks (one for each group) were simulated for both climates and the results of the simulations were compared to the ones predicted by the two functions. The form and geometry parameters of the three urban block typologies used to validate the regression models are presented in Table 20.
The results of the comparison show that for all groups both models can provide reliable results on the prediction of total energy demand (Figure 14). More specifically both regression model present a tendency to underestimate the total energy demand of all three urban blocks but the variation of calculated values to simulated values is very small (less than 4.5%) in all cases which means that the prediction of load demand can be considered reliable.
4. Discussion
It is well known that the sustainable development of a city is mainly a matter of strategies targeted in all three pillars of sustainability, including economy, society and environment. As a large amount of energy in contemporary cities is consumed for the heating and cooling of buildings, the improvement of energy efficiency at a city scale could obviously improve not only the environmental quality of the urban areas, but also contribute on the economic growth and promote a better quality of living for the society. However, individual efforts can only partially improve the quality of life of the inhabitants and do not reserve a sustainable future for the cities. This is why the research proposes that the energy performance of the urban tissue should be examined at an urban block scale rather than at a building scale and that the overall geometry of the urban block should be taken into account when it comes to energy efficiency issues.
Moreover, following the fact that the urban tissue of the Greek city suffers from degradation, low construction quality of buildings and lack of energy conscious design this paper proved that it is possible to define strategies for improving energy efficiency at an urban block scale through the consideration of urban form parameters. The results of the research pointed out the parameters of geometry that mostly affect energy efficiency for each one of the two climates examined. In addition the extent to which climatic conditions differentiate the share of heating and cooling loads on the total energy demand of the urban blocks is defined, pointing out that the balance of heating and cooling differs significantly according to climate.
More specifically, the comparison of load demand for the climate conditions of the two cities showed that despite the fact that cooling loads have an increased effect on the total energy demand for the climate of Heraklion; it is still heating demand that defines the energy profile of the urban blocks. In addition it has been pointed out that urban blocks with smaller heights seem to be more energy efficient for both climates, on a mean value comparison basis. However, it has been proved as well, that height cannot define the energy profile of urban blocks without taking into account other parameters of geometry as well. The combination of large height and large urban block plot surface can result in even more energy efficient urban forms. This is a useful finding for targeting upgrading strategies and setting priorities to the energy upgrade of similar urban forms for the city of Thessaloniki and for the city of Heraklion. As it is not feasible to upgrade simultaneously the total building stock of a city, it is very important to define in which areas a regeneration of the building stock could provide the maximum profit in terms of energy efficiency.
Urban form has been proved to affect energy demand by a factor of 1.2, which is smaller to the factor of 2 proposed by Ratti [10], but it can still be considered an important effect keeping in mind that the typologies examined have a limited range of values of urban form parameters as they are high density compact blocks. It is expected that an examination of discontinuous forms with lower densities could increase this effect.
In addition, the examination of correlations showed that for urban blocks having a continuous form and large building heights, all geometry parameters examined contribute to the definition of their energy performance, as they all have a significant correlation with the energy demand for both climates. However, for smaller building heights the most correlated parameter seems to be the S/V ratio, meaning that the exposed surface in these cases plays an important role on the definition of the heating and cooling loads. Besides the S/V ratio is a parameter that has been correlated to energy demand by other researchers as well [17] and it has also been proved by Martins et al. [19] to have a significant effect in illuminance and irradiation levels of the buildings’ facades. In this research however its effect on the energy demand is quantified and proved to have the largest coefficient in both regression models. The findings of the research proved also that the effect of the S/V parameter on the total energy demand is larger by a factor of 1.7 for climatic zone C than for climatic zone A. It is almost the same for the Inner court index on an absolute value basis where CP/PS has a larger effect on the total energy demand for climatic zone C by a factor of 1.6.
It has also been proved that the inner court geometry affects the energy performance of the urban blocks with large building heights in a negative way, as it defines the exposed shell of the urban block towards the inner uncovered space. This means that larger perimeters of the inner court favor energy efficiency and could be promoted in a building regulation recast basis. Building line boundaries in terms of set-backs (which are defined in the Greek building regulation only for the plots’ side that faces the street) could also be set for the rear side of the plot, in an appropriate way in order to promote the larger possible perimeter of the buildings.
Moreover, as already mentioned the plot size of the urban block seems to be a decisive parameter for its energy profile, as it can significantly correlate to space load demand, especially in cases of medium or large building height urban blocks. Urban design or strategies for the urban regeneration or expansion plans should therefore promote larger urban block configurations.
Under this conclusion a new index is introduced (called the Inner Court Index) combining the above mentioned parameters. This index can be used to describe the relation of inner court geometry and block size with the energy demand.
Finally, two linear regression models have been developed for the two climates analysed, proving that the total load demand of each climate can be predicted by four main form parameters. Plot Surface, Height, S/V ratio and CP/PS ratio.
The validation of the regression models through the simulation of three different typologies representing all three groups showed that the models can produce reliable results on the prediction of energy demand of the urban blocks. This means that the assessment of the majority of urban blocks of the Greek cities with similar climate can be estimated through four simple form and geometry factors and useful results can be drawn at the city level.
This research examined densely built urban blocks with a continuous urban form, in order to define the effect of climate on the relation between urban form and energy performance. The research suggests that in any case the sustainable development at the city scale should take into account local context parameters (not only climate but also regulation limitations and guidelines for urban planning and building design, user’s habits and even market constraints and in general all parameters which contribute at the formation of the built environment). The quantification of the effect of urban form factors on the total load energy demand of detailed (context based) building typologies can provide both specific conclusions on the energy profile of urban blocks according to climate and generalized results as well in the city scale. The findings of the research can be applied also not only on the two cities examined but also an all urban areas of Greece belonging in climatic zones A and C. This means that this paper provides a method to assess the energy performance of densely built urban blocks in several urban tissues of Greece.
Further research should take into account results for climatic zones B and D in order to be able to assess the energy performance of urban blocks in all Greek cities. Moreover less dense urban blocks, and discontinuous forms, should also be examined, where both heating losses and solar gains are expected to be increased, in order to develop models that will be able to assess energy performance for the majority of urban typologies characterizing the Greek city. Finally, scenarios of upgrading should also be examined in order to define the role of urban morphology on energy efficiency when it comes to insulated shells.
5. Conclusions
The results of the study in the Greek city context, indicated that the energy profile of all building block typologies examined is related to their form and geometry parameters. The two basic form parameters that express the degree of the exposed shell in general (S/V) and the degree of the exposed shell towards the inner court (CP/PS) of the urban block have been proved to affect the energy demand in an opposite way. The S/V ratio has a negative effect while the Inner Court Index has a positive effect on the total energy demand for both climates. However these two factors have been defined as the most important ones for the examination of the overall energy demand in Greek climatic conditions.
Climate can change significantly the balance of heating and cooling demand of urban blocks despite the fact that it does not alter significantly the effect of urban form on energy performance. However, the results of the research showed that the urban block form is a significant factor for the definition of energy efficiency at a city scale. It can also be concluded that geometry factors are significantly correlated to the energy demand during the heating and the cooling period. This is why the energy performance assessment of urban forms should take into account all correlated parameters.
Finally it is suggested that strategies for improving the energy efficiency (urban regeneration plans, expansion plans etc.) of cities, and future building regulations should promote new tools, which will take into account the (positive or negative) effect of all geometry parameters proven to significantly affect the energy demand for heating and cooling.
Acknowledgments
The current research and publication is funded by the IKY Fellowships of Excellence for Postgraduate Studies in Greece-Siemens Program. The authors would also like to thank Dimitrios Bikas for supervising the urban block typology definition in which the current research was based.
Author Contributions
Dimitra Tsirigoti conceived, designed and simulated the urban block typologies, analysed the data and wrote the paper; Katerina Tsikaloudaki supervised the research and contributed in writing the paper.
Conflicts of Interest
The authors declare no conflict of interest.
References
- Jenks, M.; Burton, E.; Williams, K. (Eds.) The Compact City: A Sustainable Urban Form? Oxford Brookes University: Oxford, UK, 1996. [Google Scholar]
- Johns, F. Sustainable urbanity in a powerful but fragile landscape. In Future Forms and Design for Sustainable Cities; Jenks, M., Dempsey, N., Eds.; Architectural Press: New York, NY, USA, 2005; pp. 245–262. [Google Scholar]
- Bierens de Haan, C. Entre écovillages et projets d’architectes, les écoquartiers. Urbanisme 2006, 348, 41–44. [Google Scholar]
- Hildebrand, F. Designing the City, towards a More Sustainable Urban Form; E & FN Spon: New York, NY, USA, 1999. [Google Scholar]
- Miller, D.; De Roo, G. Integrating City Planning and Environmental Improvement: Practical Strategies for Sustainable Urban Development; Ashgate Publishing Ltd.: Farnham, UK, 1999. [Google Scholar]
- Owens, S. Energy, Planning and Urban Form; Peon: London, UK, 1986. [Google Scholar]
- Guy, S.; Marvin, S. Models and pathways: The diversity of sustainable urban futures. In Achieving Sustainable Urban Form; Jenks, M., Williams, K., Burton, E., Eds.; Routledge: London, UK, 2001; pp. 9–18. [Google Scholar]
- Hassan, A.M.; Lee, H. The paradox of the sustainable city: Definitions and examples. Environ. Dev. Sustain. 2015, 17, 1267–1285. [Google Scholar] [CrossRef]
- Ratti, C.; Baker, N.; Steemers, K. Energy consumption and urban texture. Energy Build. 2005, 37, 762–776. [Google Scholar] [CrossRef]
- Papa, R.; Gargiulo, C.; Zucaro, F. Urban systems and energy consumptions: A critical approach. TeMA J. Land Use Mobil. Environ. 2014, 783–792. [Google Scholar] [CrossRef]
- Adolphe, L. A simplified model of urban morphology: Application to an analysis of environmental performance of cities. Environ. Plan. B Plan. Des. 2001, 28, 183–200. [Google Scholar] [CrossRef]
- Ratti, C.; Robinson, D.; Baker, N.; Steemers, K. LT urban: The energy modelling of urban form. In Architecture, City, Environment: Proceedings of PLEA 2000; Steemers, K., Yannas, S., Eds.; James and James (Science Publishers) Ltd.: London, UK, 2000; pp. 660–665. [Google Scholar]
- Martin, L.; March, L. Urban Space and Structures; Cambridge University Press: Cambridge, UK, 1972. [Google Scholar]
- Steadman, P.; Brown, F. Estimating the exposed surface area of the domestic stock. In Energy and Urban Built Form; Hawkes, D., Owners, J., Rickaby, P., Steadman, P., Eds.; Butterworth-Heinemann: Cambridge, UK, 1987; pp. 113–131. [Google Scholar]
- Steadman, P.H.; Hamilton, I.; Evans, S. Energy and urban built form: An empirical and statistical approach. Build. Res. Inf. 2014, 42, 17–31. [Google Scholar] [CrossRef]
- Rode, P.H.; Keim, C.H.; Robazza, G.; Viejo, P.; Schofield, J. Cities and energy: Urban morphology and residential heat-energy demand. Environ. Plan. B Plan. Des. 2014, 41, 138–162. [Google Scholar] [CrossRef] [Green Version]
- Martins, T.A.L.; Adolphe, L.; Bastos, L.E.G. From solar constraints to urban design opportunities: Optimization of built form typologies in a Brazilian tropical city. Energy Build. 2014, 76, 43–56. [Google Scholar] [CrossRef]
- Randall, T.H. (Ed.) Sustainable Urban Design: An Environmental Approach; Spon Press: London, UK, 2005. [Google Scholar]
- Gauzin-Muller, D. L’Architecture écologique, 29 Exemples Européens; Le Moniteur: Paris, France, 2001. [Google Scholar]
- Niemasz, J.; Sargent, J.; Reinhart, C.F. Solar zoning and energy in detached dwellings. Environ. Plan. B Plan. Des. 2013, 40, 801–813. [Google Scholar] [CrossRef]
- Steemers, K. Environmental issues of building design. In Environmental Design of Urban Buildings; Santamouris, M., Ed.; Earthscan: London, UK, 2006; pp. 46–60. [Google Scholar]
- Carmona, M.; Tiedell, S.; Heath, T.; Oc, T. Public Places, Urban Spaces: The Dimensions of Urban Design; Elsevier: Amsterdam, The Netherlands, 2010. [Google Scholar]
- Baker, N.; Steemers, K. Energy and Environment in Architecture: A Technical Design Guide; Taylor & Francis: Abingdon, UK, 2005. [Google Scholar]
- Salat, S. Energy Loads, CO2 emissions, and building stocks: Morphologies, typologies energy systems and behaviour. Build. Res. Inf. 2009, 37, 598–609. [Google Scholar] [CrossRef]
- Hargreaves, A.; Cheng, V.; Deshmukh, S.; Leach, M.; Steemers, K. Forecasting how residential urban form affects the regional carbon savings and costs of retrofitting and decentralized energy supply. Appl. Energy 2017, 186, 549–561. [Google Scholar] [CrossRef]
- Compagnon, R. PRECis: Assessing the Potential for Renewable Energy in Cities, Solar and Daylight Availability in Urban Areas. 2000. Available online: http://raphael.compagno.home.hefr.ch/ref/PRECIS_EIF_FINAL.pdf (accessed on 16 December 2017).
- Sarralde, J.J.; Quinn, D.J.; Wiesmann, D.; Steemers, K. Solar energy and urban morphology: Scenarios for increasing the renewable energy potential of neighbourhoods in London. Renew. Energy 2015, 73, 10–17. [Google Scholar] [CrossRef]
- Yamaguchi, Y.; Shimoda, Y.; Mizuno, M. Proposal of a modeling approach considering urban form for evaluation of city level energy management. Energy Build. 2007, 39, 580–592. [Google Scholar] [CrossRef]
- Yin, Y.; Mizokami, S.H.; Aikawa, K. Compact development and energy consumption: Scenario analysis of urban structures based on behavior simulation. Appl. Energy 2015, 159, 449–457. [Google Scholar] [CrossRef]
- Larkham, P. Understanding urban form? Urban Des. 2005, 93, 22–24. [Google Scholar]
- Oliveira, V. Urban Morphology: An Introduction to the Study of the Physical Form of Cities; Springer: Cham, Switzerland, 2016; pp. 7–30. [Google Scholar]
- Salat, S. Energy and bioclimatic efficiency of urban morphologies: A comparative analysis of Asian and European cities. In Proceedings of the Conference on Sustainable Building South East Asia, Kuala Lumpur, Malaysia, 5–7 November 2007. [Google Scholar]
- TOTEE 20701-3/2010. Climate Data of Greek Regions; Ministry of Environment, Energy and Climate Change, Special Secretariat for the Environment and Energy Inspection, Special Service of Energy Inspectors, Technical Chamber of Greece: Athens, Greece, 2010. [Google Scholar]
- Lévy, A. Formes urbaines et significations: Revisiter la morphologie urbaine. Espaces et Sociétés 2005, 25–48. [Google Scholar] [CrossRef]
- Hellenic Statistical Authority (ELSTAT). Census. 2011. Available online: http://www.statistics.gr/ (accessed on 16 December 2017).
- U.S. Deparment of Energy Website: Energy Plus Energy Simulation Software. Available online: http://apps1.eere.energy.gov/buildings/energyplus/cfm/weather_data3.cfm/region=6_europe_wmo_region_6/country=GRC/cname=Greece (accessed on 30 June 2017).
- Tsirigoti, D. A Study of the Impact of Urban Morphology on the Energy Performance of the Building Shell through the Assessment of Geometry Parameters of the Urban Block. Ph.D. Thesis, Aristotle University of Thessaloniki, Thessaloniki, Greek, 2016. [Google Scholar]
- Bourdic, L.; Salat, S.; Nowacki, C. Assessing cities: A new system of cross-scale spatial indicators. Build. Res. Inf. 2012, 40, 592–605. [Google Scholar] [CrossRef]
- Dascalaki, E.G.; Droutsa, K.G.; Balaras, C.A.; Kontoyiannidis, S. Greek Residential Buildings Typology. Energy Saving Potential (In Greek). EPISCOPE and TABULA Project. 2016. Available online: http://episcope.eu/building-typology/country/gr/ (accessed on 16 December 2017).
- Dascalaki, E.G.; Droutsa, K.G.; Balaras, C.A.; Kontoyiannidis, S. Typology Approach for Building Stock Energy Assessment. 2012. Available online: http://episcope.eu (accessed on 16 December 2017).
- Yaşa, E.; Ok, V. Evaluation of the effects of courtyard building shapes on solar heat gains and energy efficiency according to different climatic regions. Energy Build. 2014, 73, 192–199. [Google Scholar] [CrossRef]
- Manioğlu, G.; Koçlar Oral, G. Effect of Courtyard Shape Factor on Heating and Cooling Energy Loads in Hot-dry Climatic Zone. Energy Procedia 2015, 78, 2100–2105. [Google Scholar] [CrossRef]
Figure 1.
The four climatic zones of Greece as defined by the national energy performance regulation and the two examined cities (Thessaloniki and Heraklion) position in the map. Source: [33], edited by the authors.
Figure 1.
The four climatic zones of Greece as defined by the national energy performance regulation and the two examined cities (Thessaloniki and Heraklion) position in the map. Source: [33], edited by the authors.
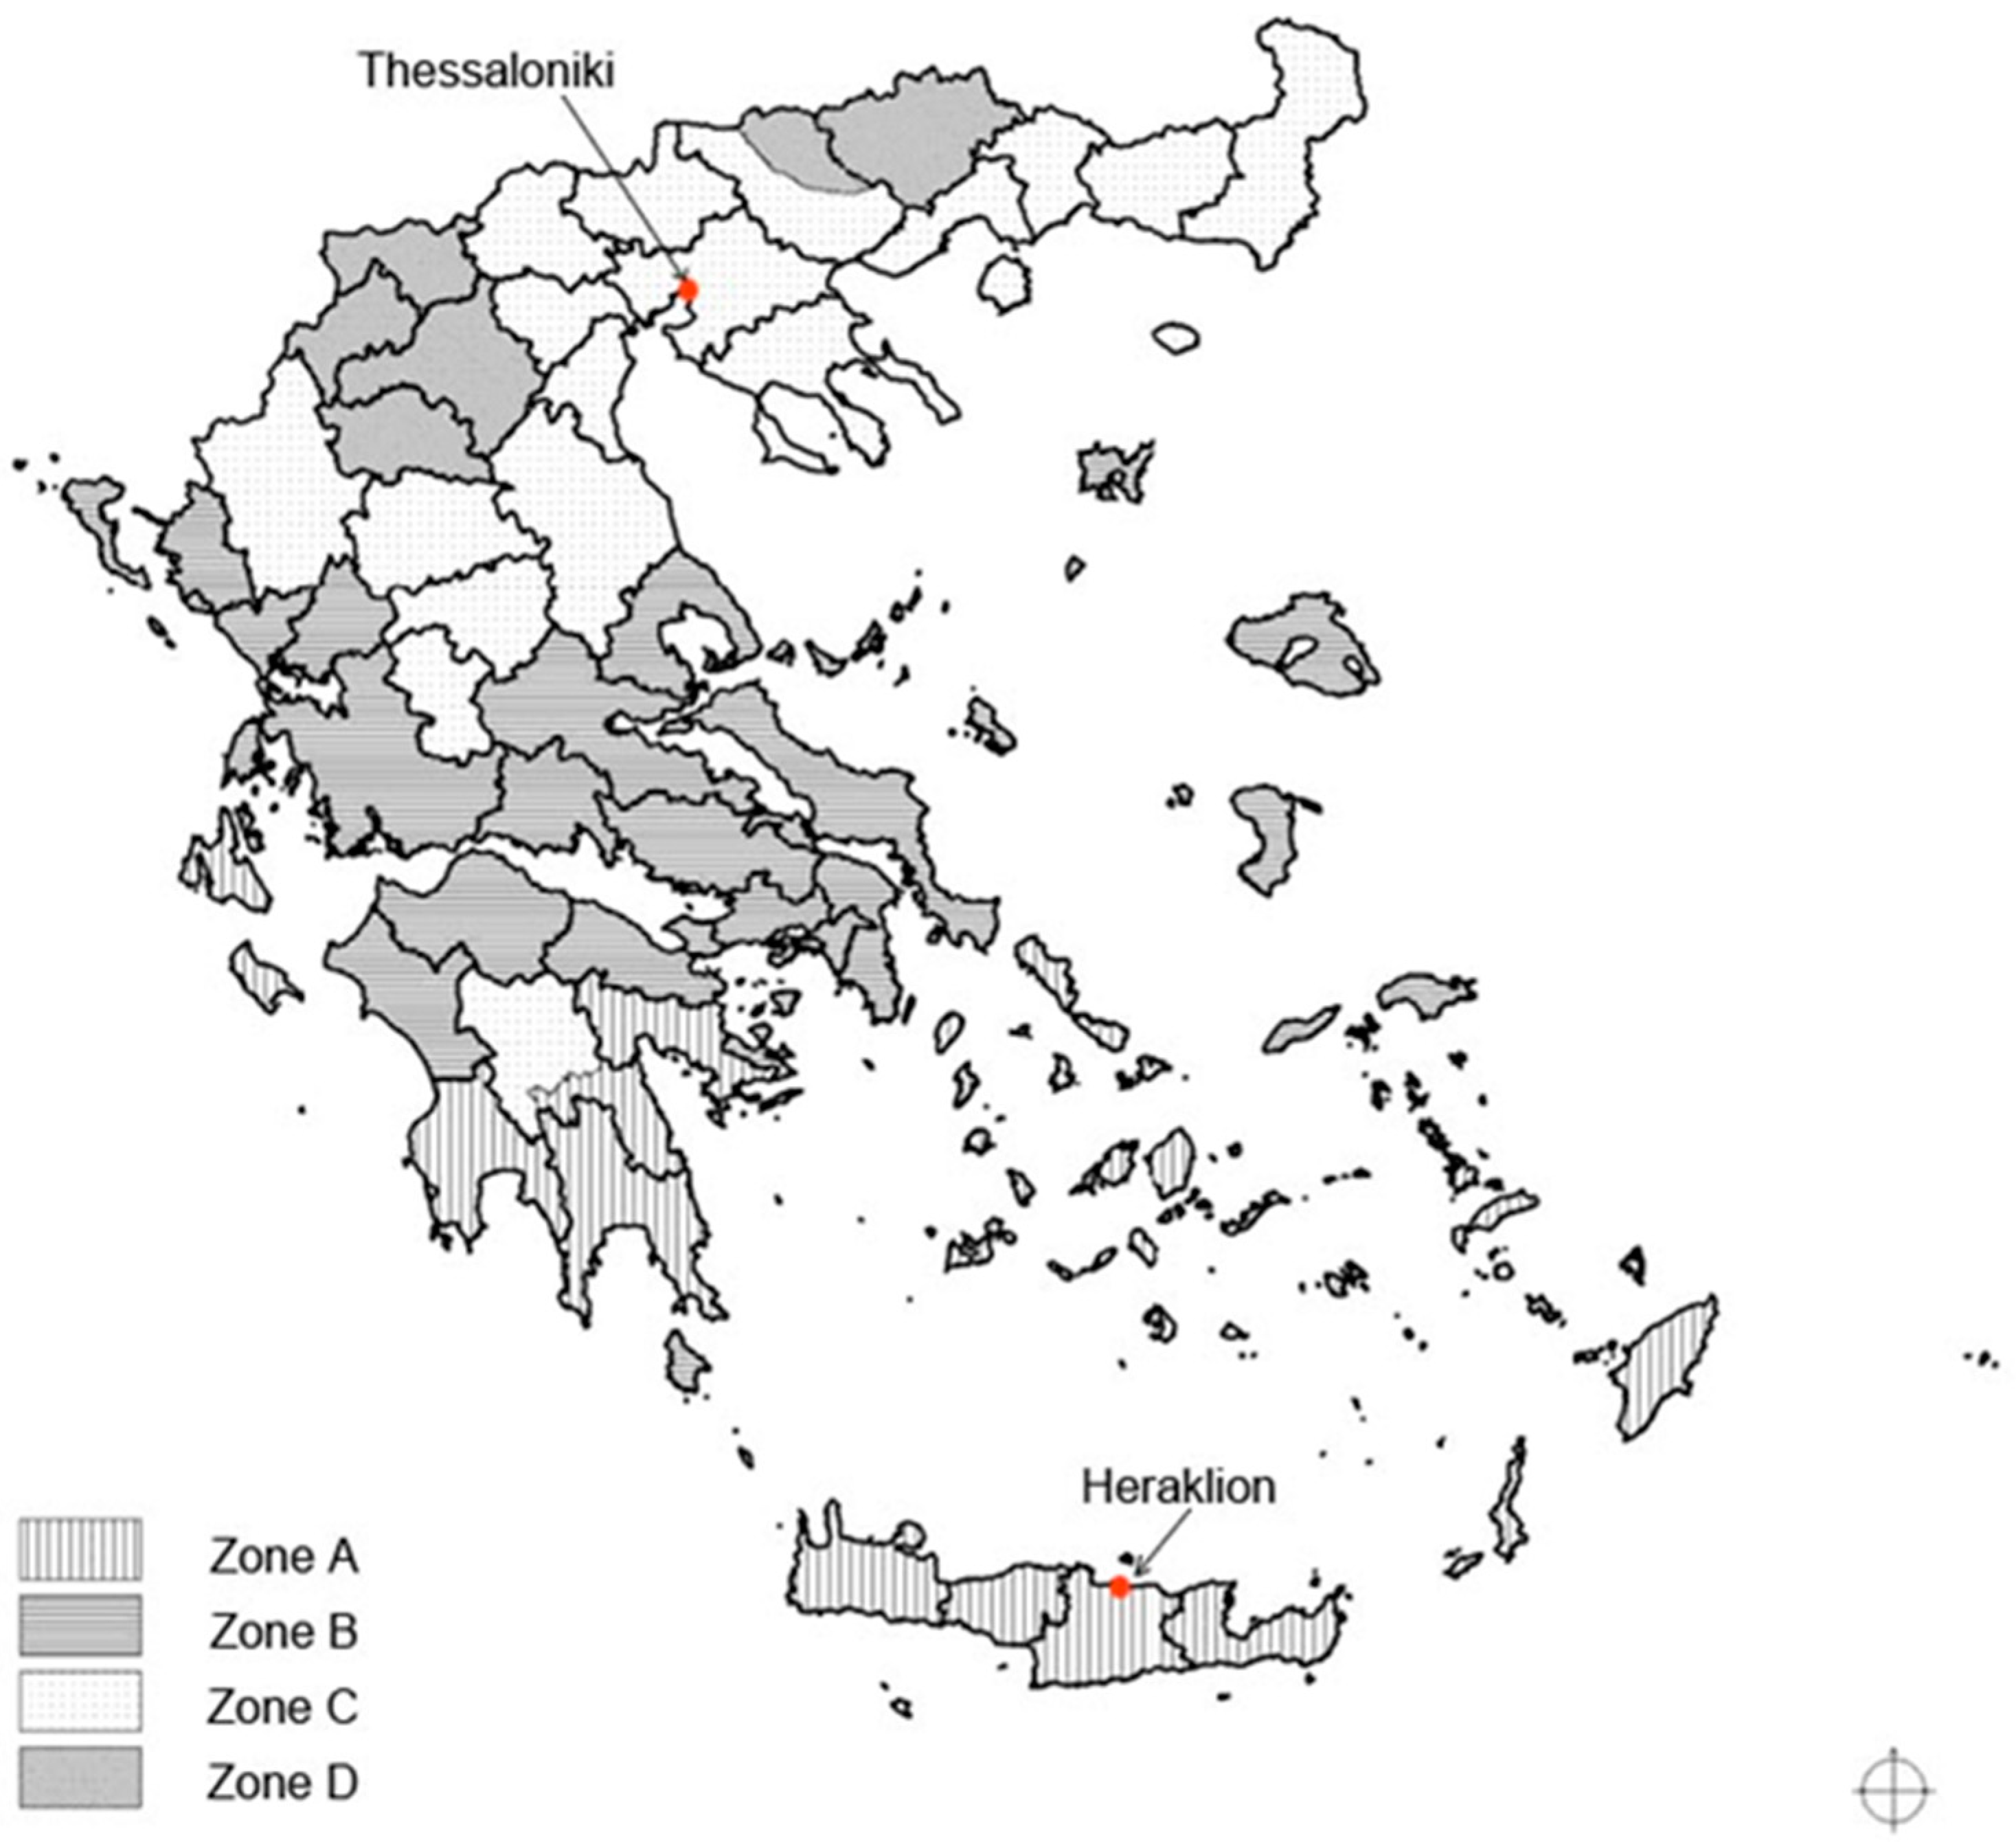
Figure 2.
Maps of the two cities examined. (a) Thessaloniki built up area; (b) Heraklion built up area [35].
Figure 2.
Maps of the two cities examined. (a) Thessaloniki built up area; (b) Heraklion built up area [35].
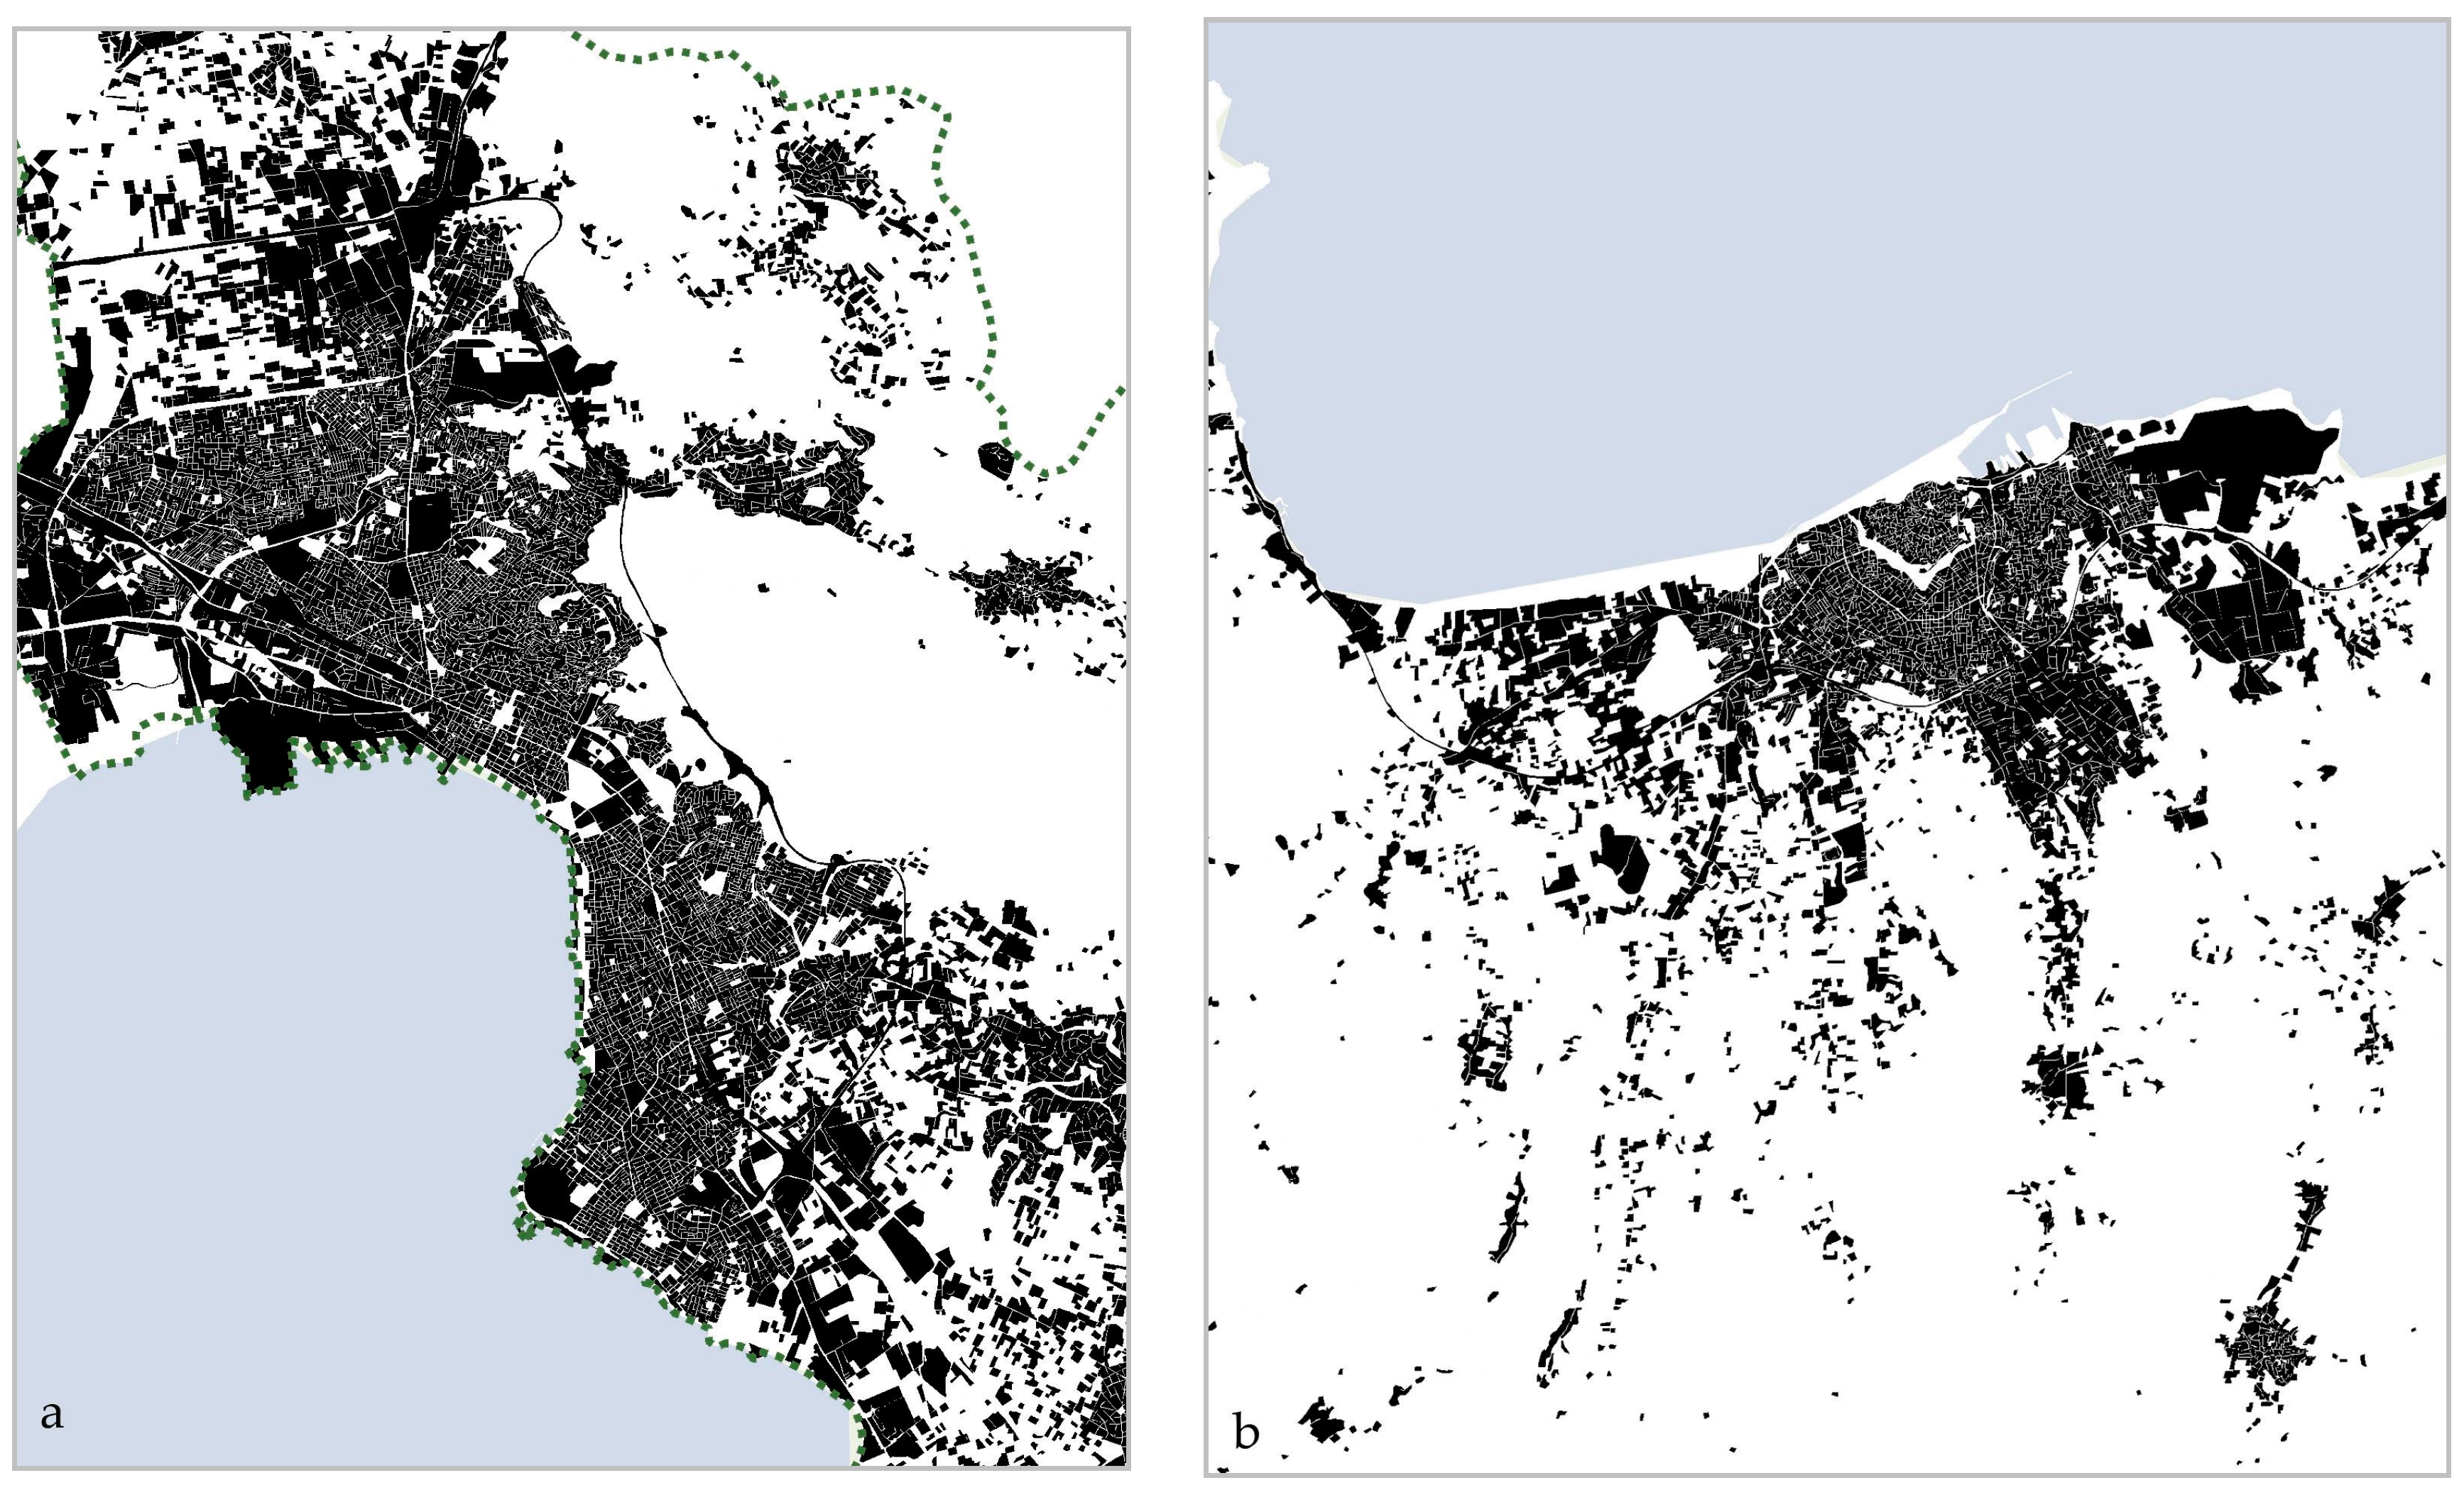
Figure 3.
Climate data for the two cities. (a) Monthly average temperature of the two cities in °C; (b) Monthly distribution of solar radiation in Wh/m2. Data source: [36].
Figure 3.
Climate data for the two cities. (a) Monthly average temperature of the two cities in °C; (b) Monthly distribution of solar radiation in Wh/m2. Data source: [36].

Figure 4.
The urban tissue of the two cities. (a) Urban blocks layout configuration for the city of Thessaloniki; (b) Urban blocks layout configuration for the city of Heraklion [35].
Figure 4.
The urban tissue of the two cities. (a) Urban blocks layout configuration for the city of Thessaloniki; (b) Urban blocks layout configuration for the city of Heraklion [35].

Figure 5.
(a) Typical configuration of buildings front (street) façade; (b) Typical configuration of buildings rear façade; (c) 3D model of three typical building blocks used for design of urban blocks [37].
Figure 5.
(a) Typical configuration of buildings front (street) façade; (b) Typical configuration of buildings rear façade; (c) 3D model of three typical building blocks used for design of urban blocks [37].

Figure 6.
Heating load demand for all examined typical urban blocks for the city of Thessaloniki and for the city of Heraklion.
Figure 6.
Heating load demand for all examined typical urban blocks for the city of Thessaloniki and for the city of Heraklion.
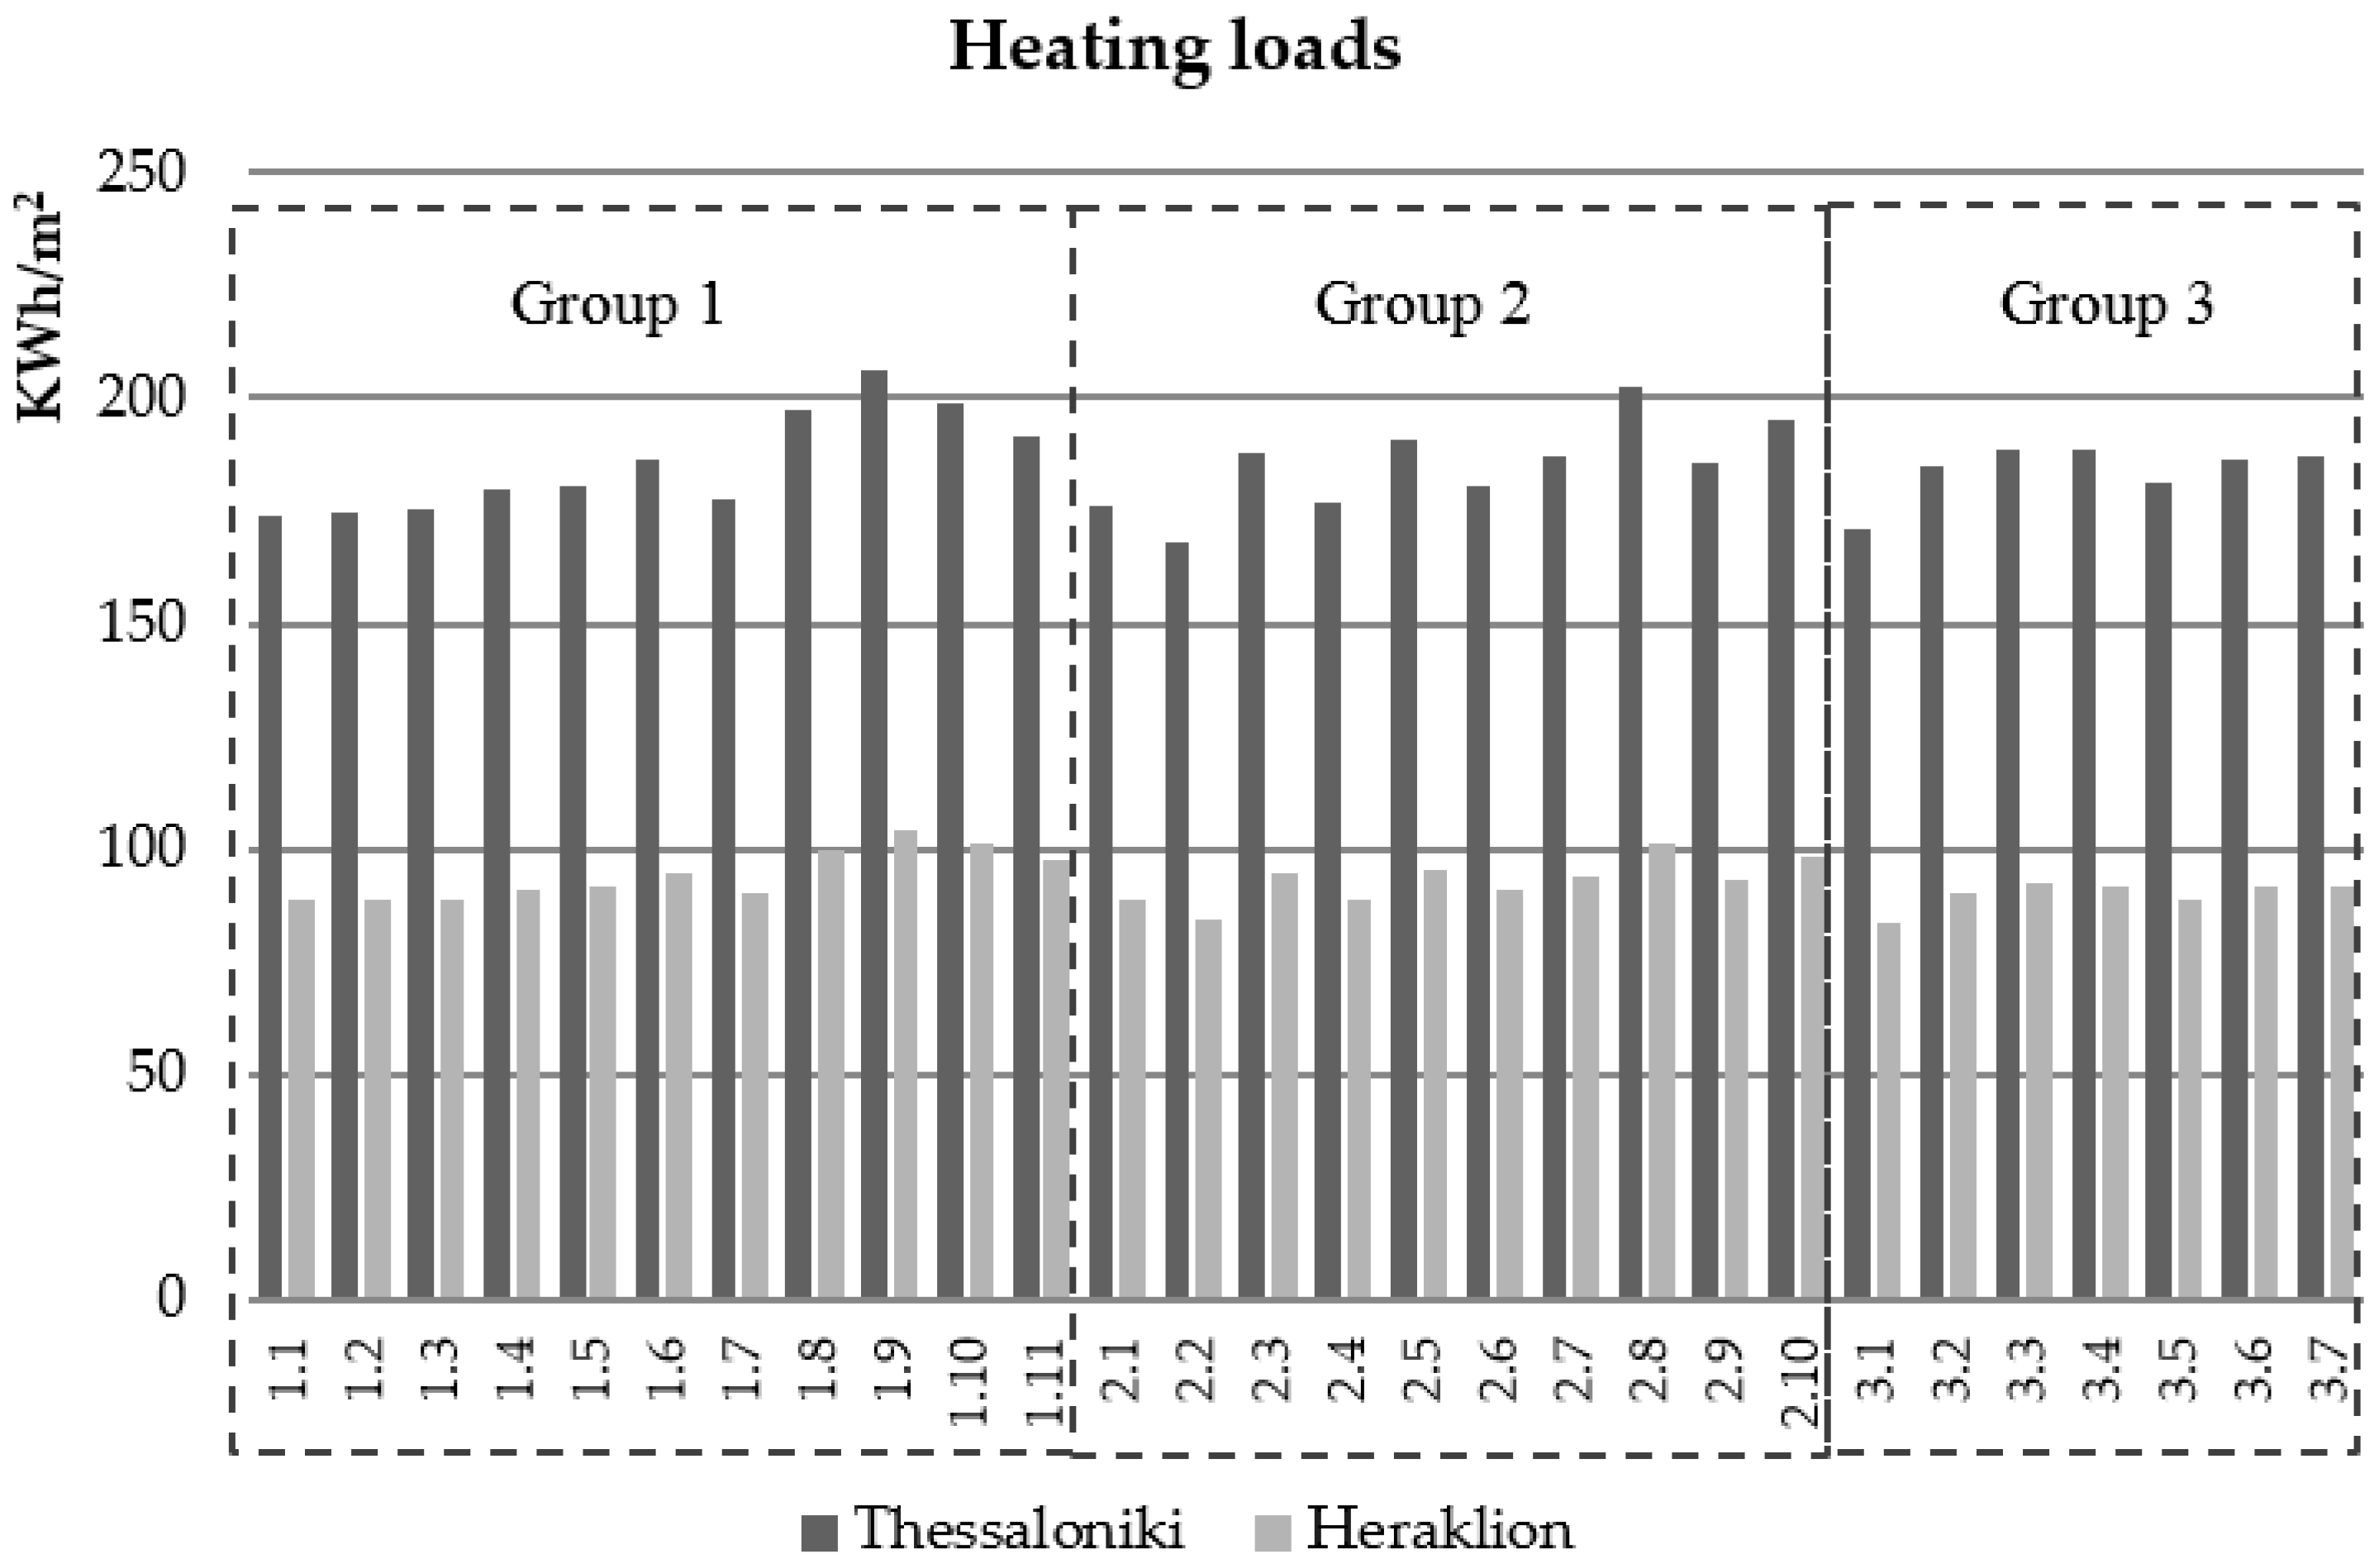
Figure 7.
Cooling load demand for all examined typical urban blocks for the city of Thessaloniki and for the city of Heraklion.
Figure 7.
Cooling load demand for all examined typical urban blocks for the city of Thessaloniki and for the city of Heraklion.
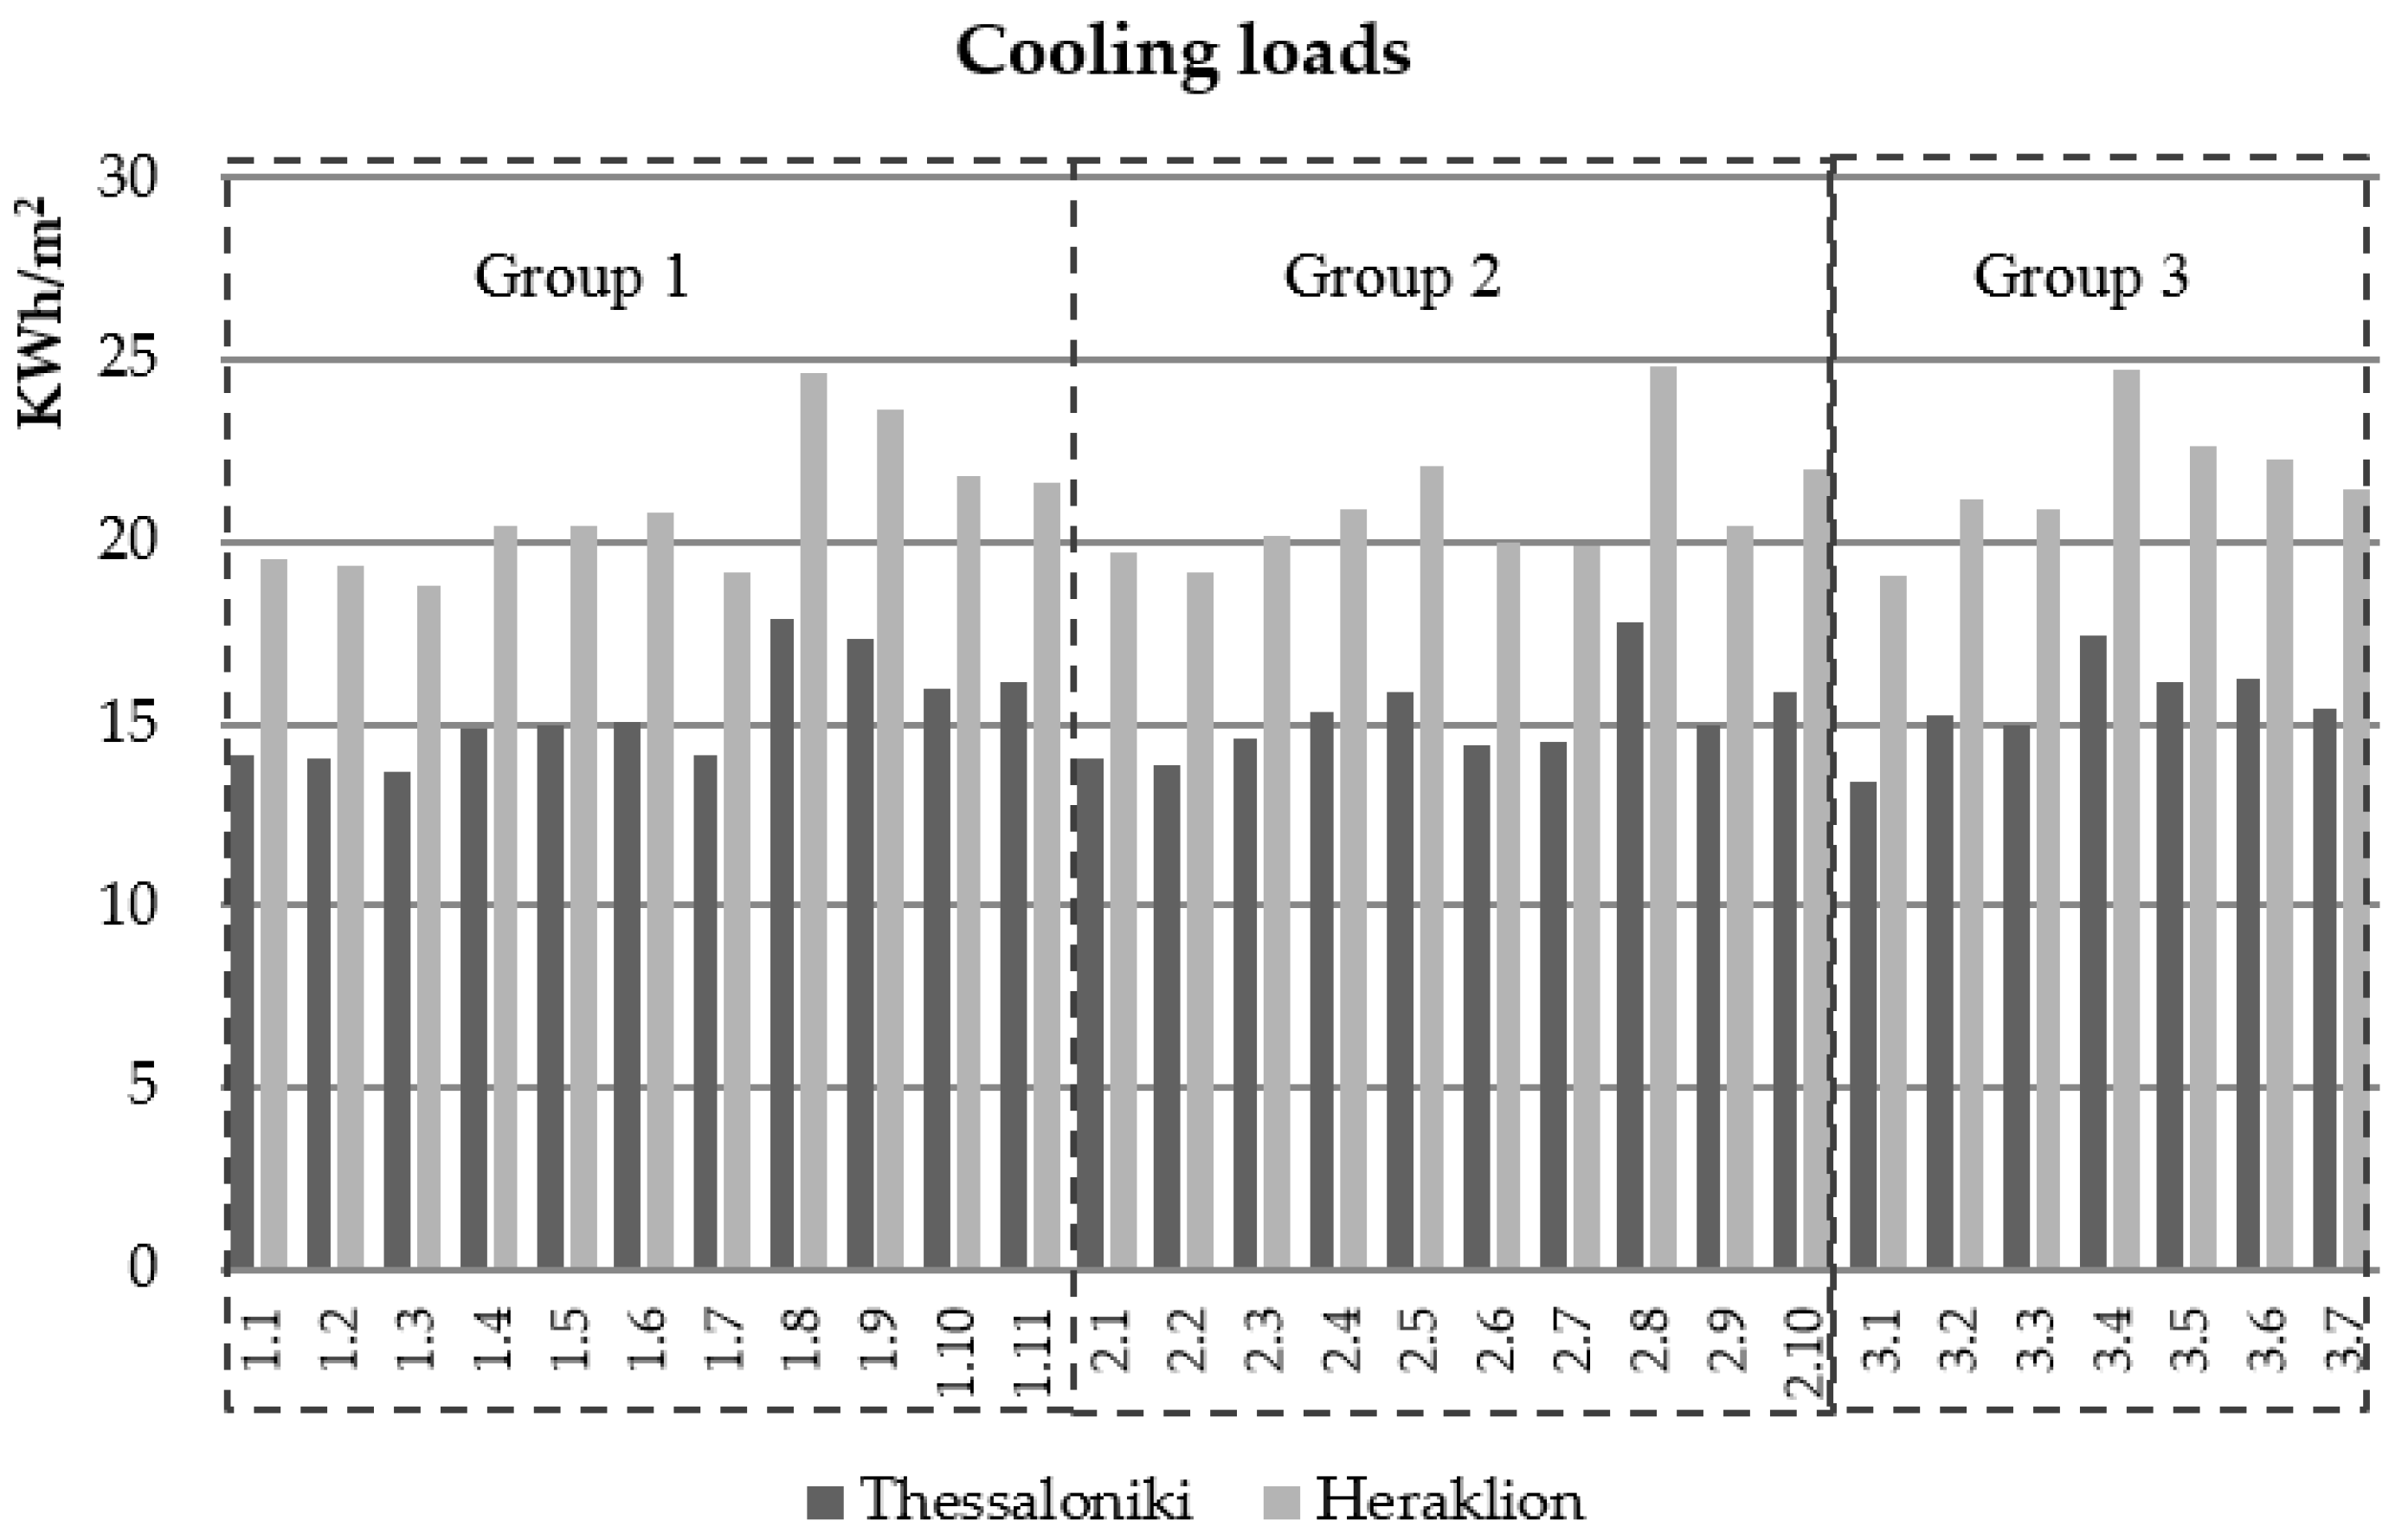
Figure 8.
Total load demand for all examined typical urban blocks for the city of Thessaloniki and for the city of Heraklion.
Figure 8.
Total load demand for all examined typical urban blocks for the city of Thessaloniki and for the city of Heraklion.

Figure 9.
Histogram presenting mean values for the heating loads calculated for each group of urban blocks for the climatic conditions of (a) Thessaloniki and (b) Heraklion.
Figure 9.
Histogram presenting mean values for the heating loads calculated for each group of urban blocks for the climatic conditions of (a) Thessaloniki and (b) Heraklion.
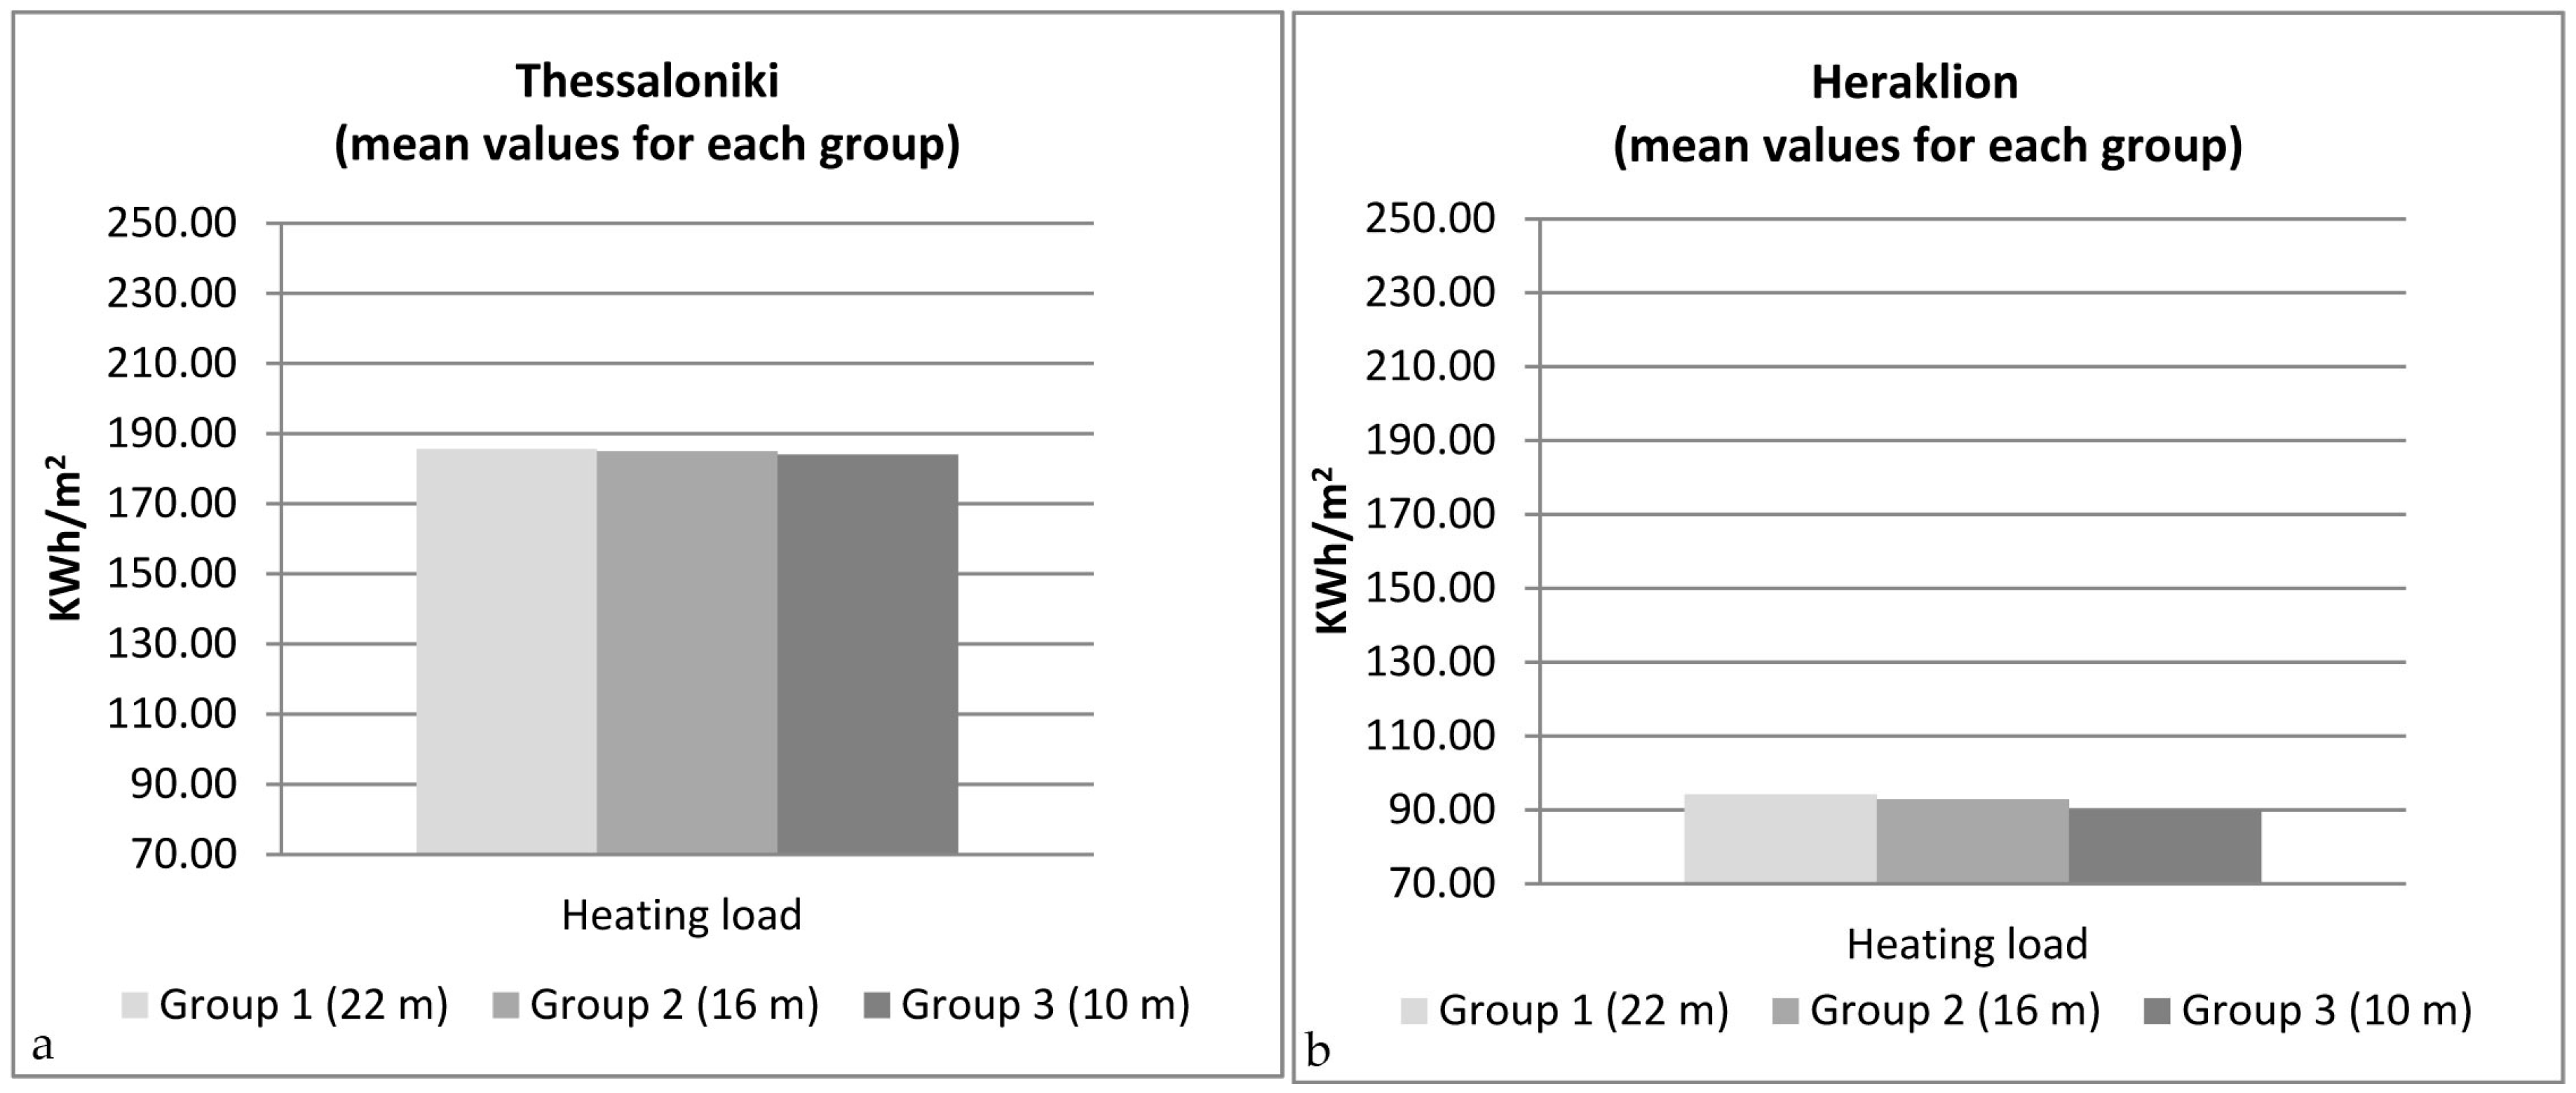
Figure 10.
Histogram presenting mean values for the cooling loads calculated for each group of urban blocks for the climatic conditions of (a) Thessaloniki and (b) Heraklion.
Figure 10.
Histogram presenting mean values for the cooling loads calculated for each group of urban blocks for the climatic conditions of (a) Thessaloniki and (b) Heraklion.

Figure 11.
Histogram presenting mean values for the total loads calculated for each group of urban blocks for the climatic conditions of (a) Thessaloniki and (b) Heraklion.
Figure 11.
Histogram presenting mean values for the total loads calculated for each group of urban blocks for the climatic conditions of (a) Thessaloniki and (b) Heraklion.
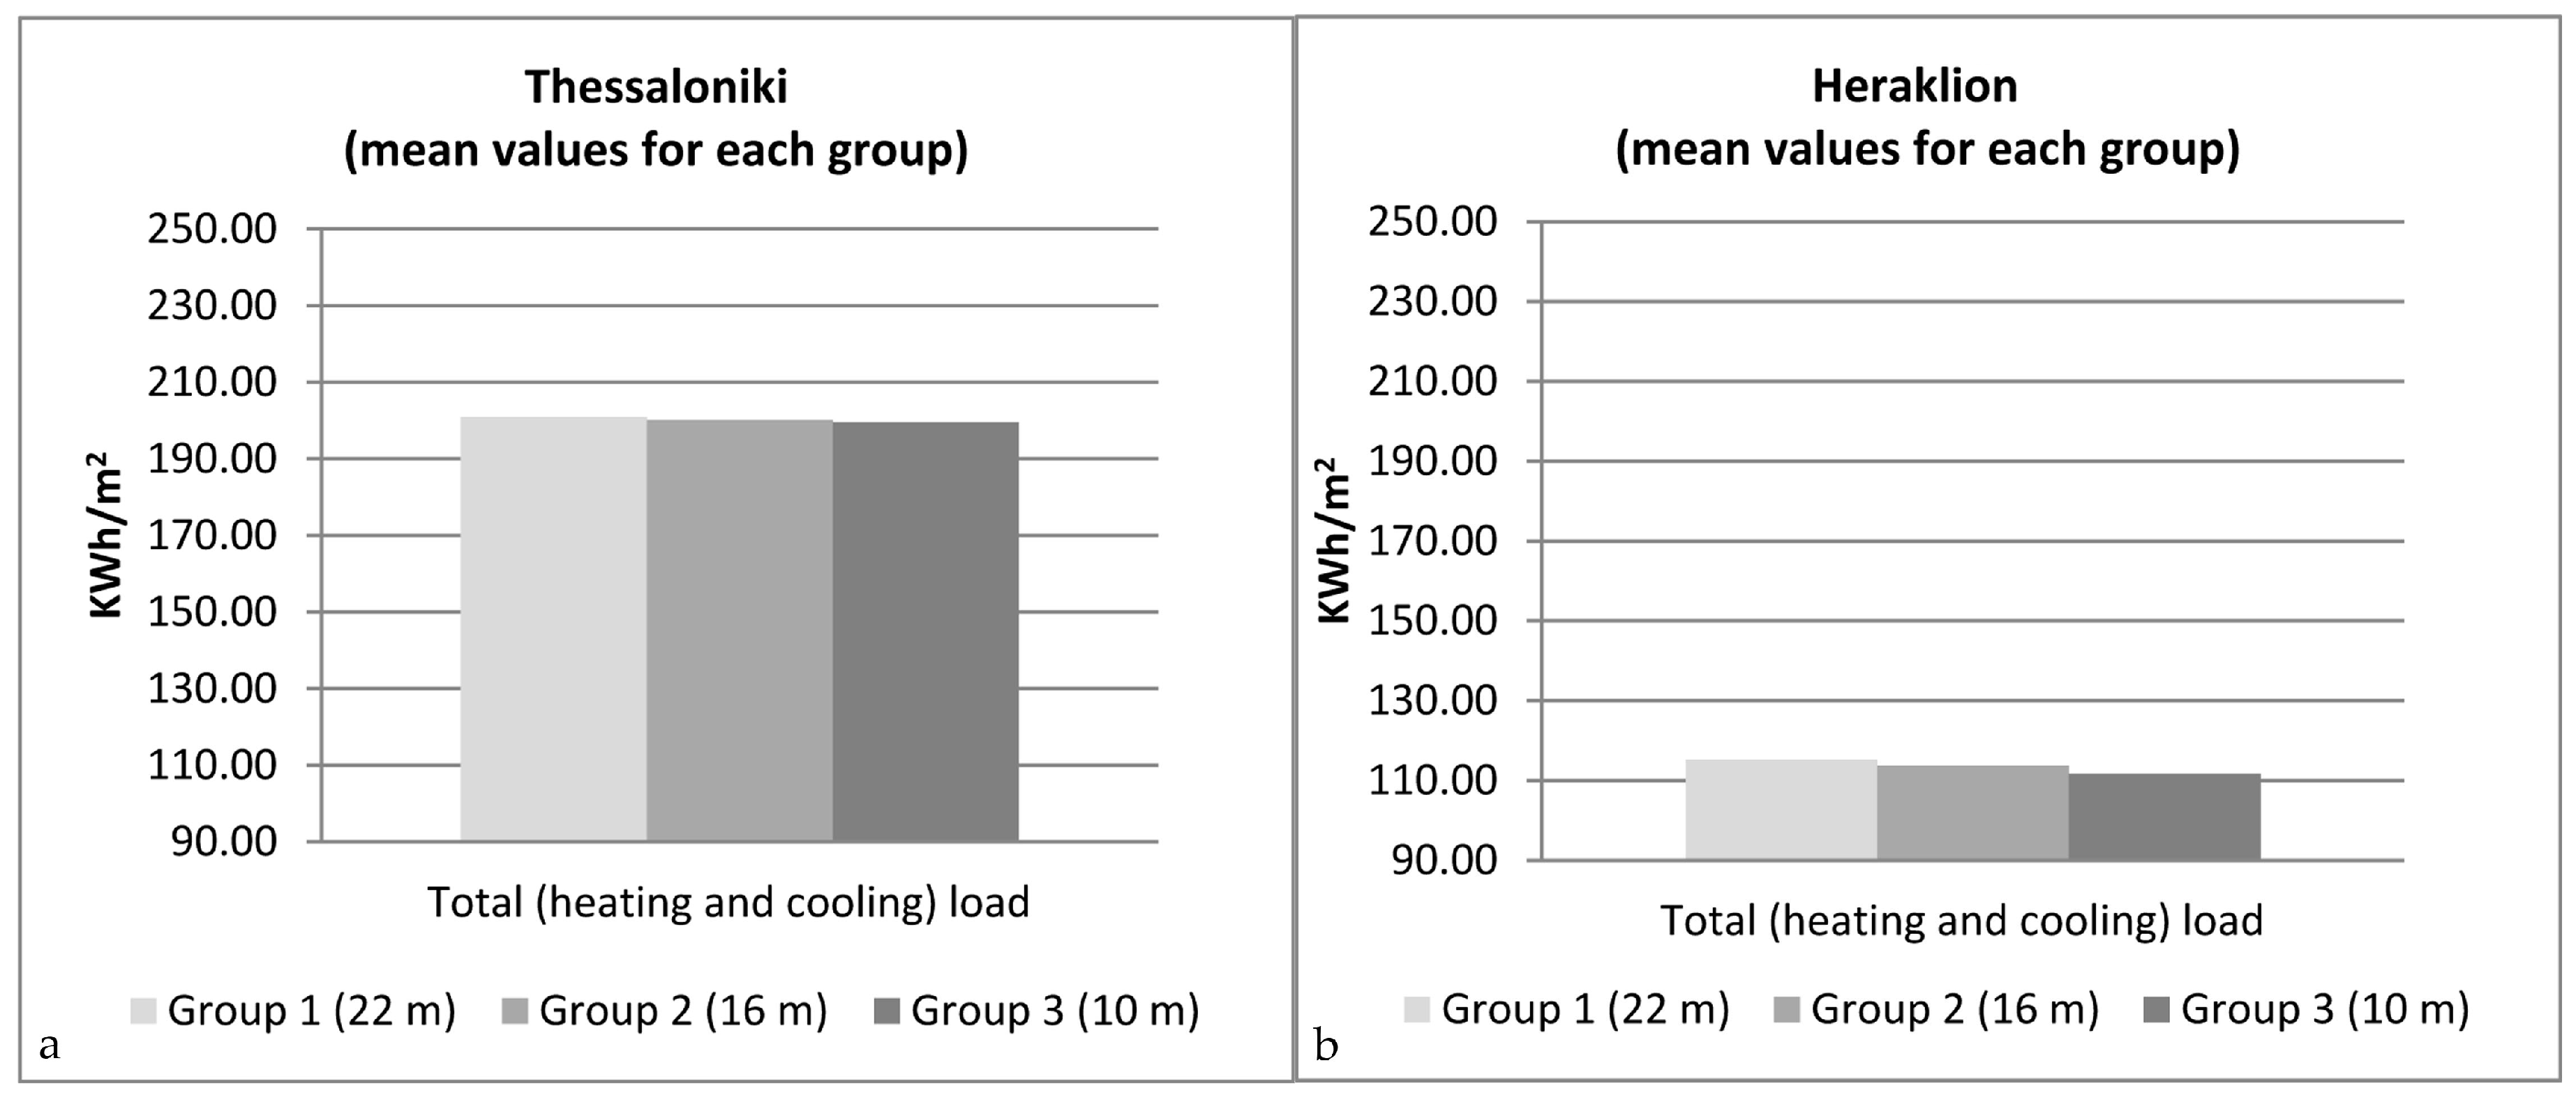
Figure 12.
Statistical tests for Thessaloniki’s regression model.
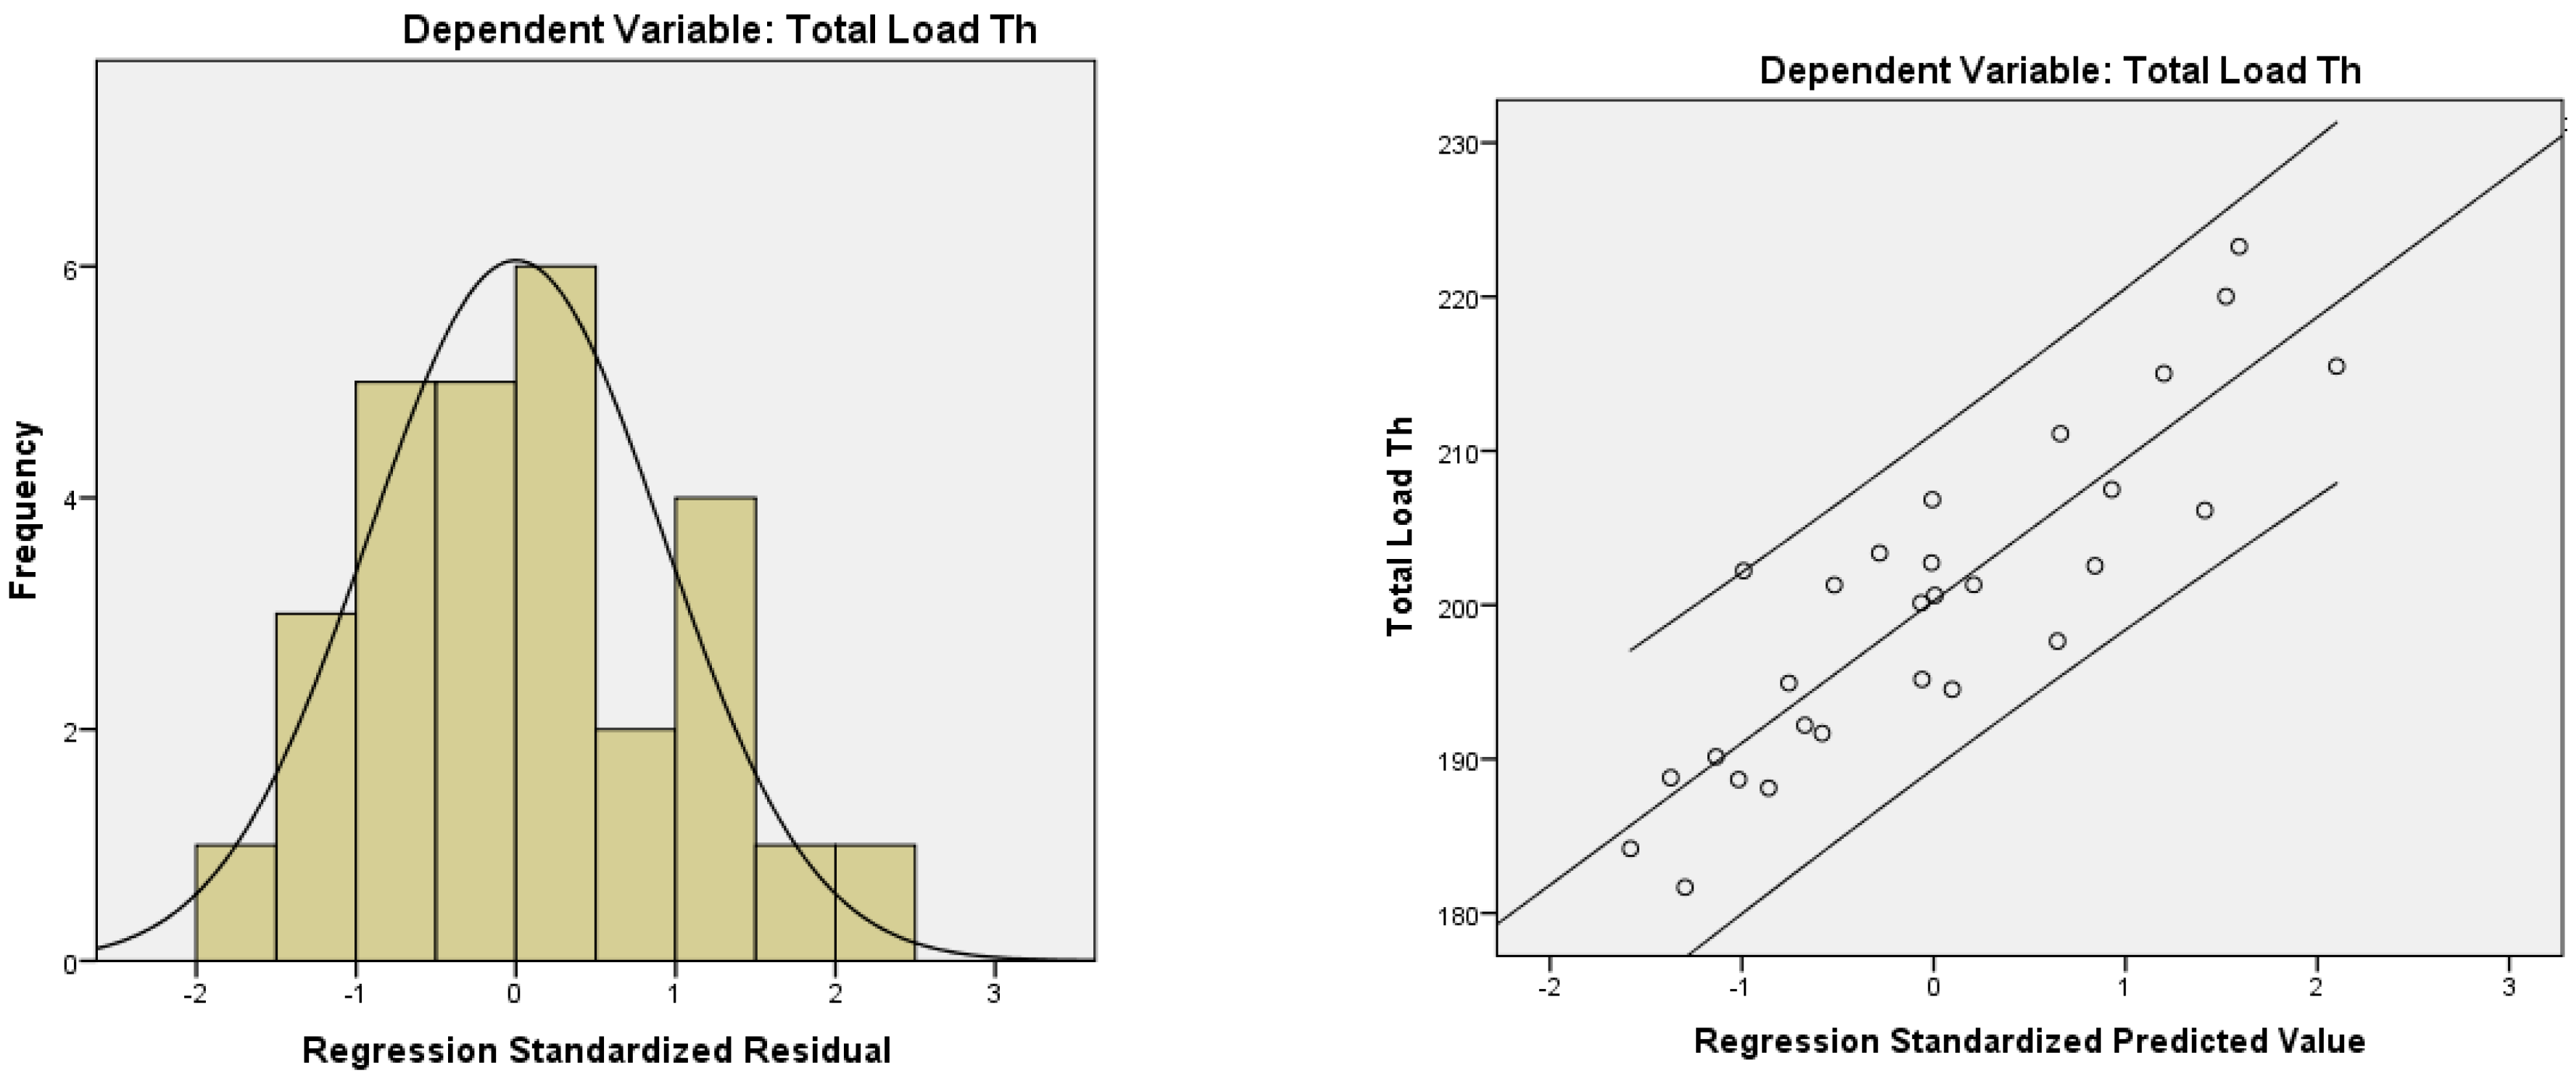
Figure 13.
Statistical tests for Heraklion’s regression model.
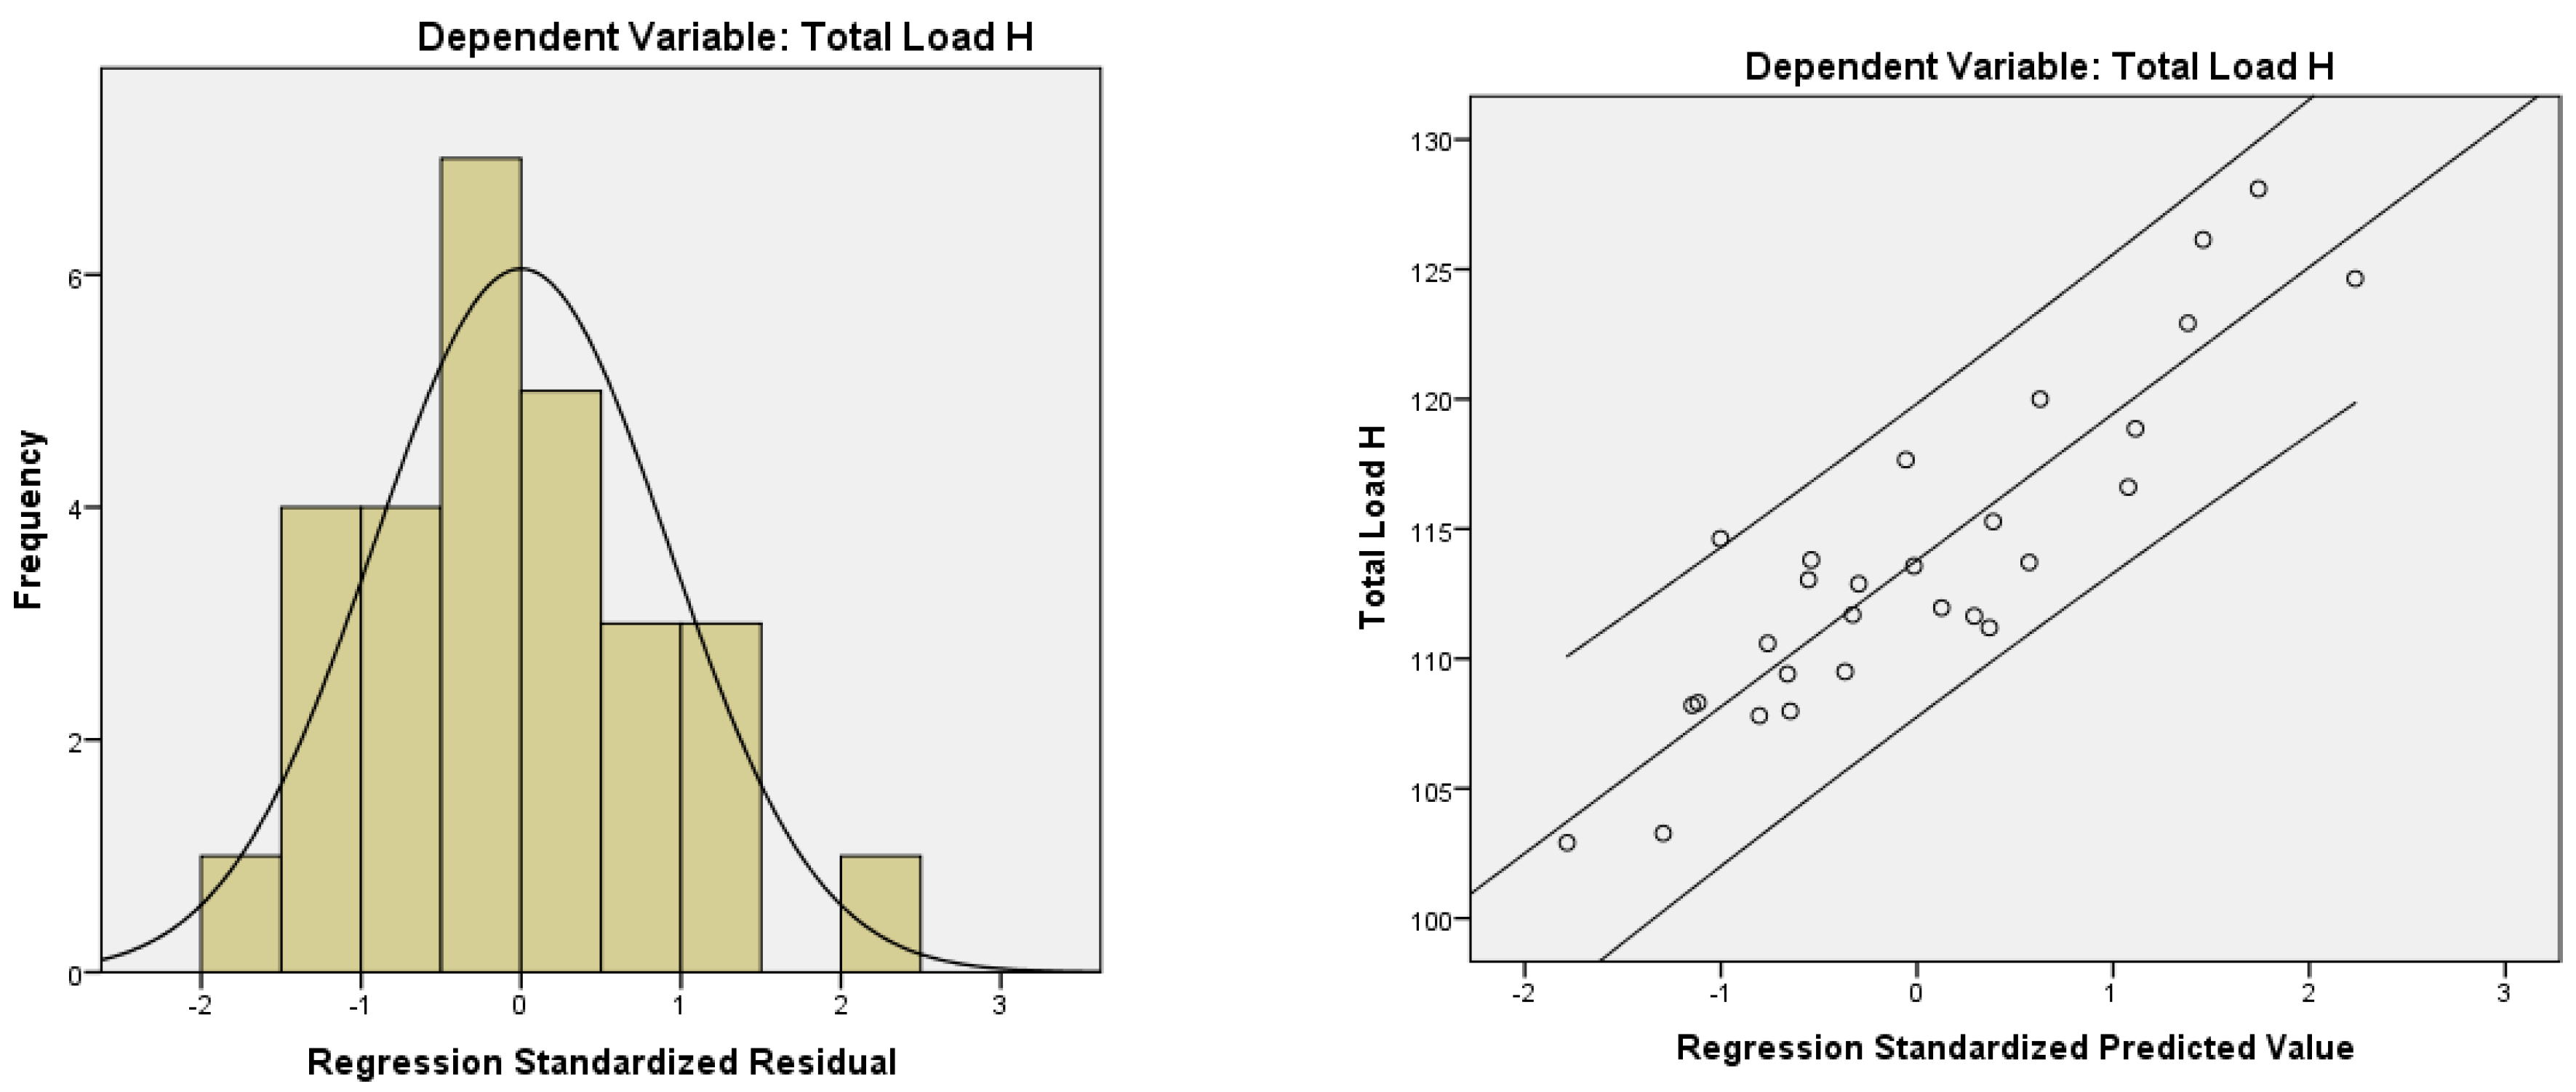
Figure 14.
Regression model’s validation results for both climates.


Table 1.
Form and geometry parameters of typical urban blocks included in group 1.
| Urban Block | Urban Block Surface (m2) | Plan | 3D Model | Inner Court Perimeter (m) | Height (m) | Coverage Ratio | Building Ratio | S/V | Section Geometry H/W |
|---|---|---|---|---|---|---|---|---|---|
| 1.1 | 5016 |  |  | 544 | 22.00 | 0.74 | 5.21 | 0.32 |  1.47 |
| 1.2 | 6864 |  |  | 742 | 22.00 | 0.69 | 4.83 | 0.32 |  1.47 |
| 1.3 | 5610 |  |  | 625 | 22.00 | 0.75 | 5.23 | 0.32 |  1.47 |
| 1.4 | 3120 |  |  | 297 | 22.00 | 0.74 | 5.16 | 0.32 |  1.47 |
| 1.5 | 3380 |  |  | 369 | 22.00 | 0.76 | 5.32 | 0.33 |  1.47 |
| 1.6 | 2880 |  |  | 305 | 22.00 | 0.77 | 5.39 | 0.34 |  1.47 |
| 1.7 | 3800 |  |  | 326 | 22.00 | 0.80 | 5.61 | 0.30 |  1.47 |
| 1.8 | 1155 |  |  | 79 | 22.00 | 0.63 | 4.40 | 0.38 |  1.47 |
| 1.9 | 1914 |  |  | 141 | 22.00 | 0.61 | 4.24 | 0.37 |  1.47 |
| 1.10 | 1716 |  |  | 111 | 22.00 | 0.67 | 4.72 | 0.33 |  1.47 |
| 1.11 | 2418 |  |  | 165 | 22.00 | 0.68 | 4.76 | 0.34 |  1.47 |
Table 2.
Form and geometry parameters of typical urban blocks included in group 2.
| Urban Block | Urban Block Surface (m2) | Plan | 3D Model | Inner Court Perimeter (m) | Height (m) | Coverage RATIO | Building Ratio | S/V | Section Geometry H/W |
|---|---|---|---|---|---|---|---|---|---|
| 2.1 | 4224 |  |  | 417 | 16.00 | 0.74 | 3.70 | 0.35 |  1.07 |
| 2.2 | 5400 |  |  | 600 | 16.00 | 0.69 | 3.46 | 0.37 |  1.07 |
| 2.3 | 4762 | 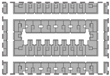 |  | 539 | 16.00 | 0.72 | 3.58 | 0.38 |  1.07 |
| 2.4 | 3300 |  |  | 296 | 16.00 | 0.69 | 3.43 | 0.35 |  1.07 |
| 2.5 | 3003 |  |  | 345 | 16.00 | 0.71 | 3.53 | 0.40 |  1.07 |
| 2.6 | 3382 | 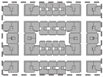 |  | 371 | 16.00 | 0.78 | 3.90 | 0.36 |  1.07 |
| 2.7 | 3451 | 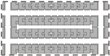 | 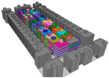 | 383 | 16.00 | 0.82 | 4.11 | 0.38 |  1.07 |
| 2.8 | 1155 |  |  | 80 | 16.00 | 0.63 | 3.14 | 0.42 |  1.07 |
| 2.9 | 1666 |  |  | 168 | 16.00 | 0.83 | 4.17 | 0.37 |  1.07 |
| 2.10 | 1364 |  | 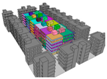 | 111 | 16.00 | 0.85 | 4.24 | 0.38 |  1.07 |
Table 3.
Form and geometry parameters of typical urban blocks included in group 3.
| Urban Block | Urban Block Surface (m2) | Plan | 3D Model | Inner Court Perimeter (m) | Height (m) | Coverage Ratio | Building Ratio | S/V | Section Geometry H/W |
|---|---|---|---|---|---|---|---|---|---|
| 3.1 | 6185 | 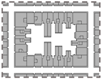 |  | 593 | 10.00 | 0.67 | 2.01 | 0.43 |  0.67 |
| 3.2 | 3708 |  |  | 359 | 10.00 | 0.70 | 2.10 | 0.47 |  0.67 |
| 3.3 | 4250 |  |  | 471 | 10.00 | 0.80 | 2.41 | 0.48 |  0.67 |
| 3.4 | 1188 |  |  | 134 | 10.00 | 0.78 | 2.35 | 0.52 |  0.67 |
| 3.5 | 1904 |  |  | 171 | 10.00 | 0.72 | 2.17 | 0.47 |  0.67 |
| 3.6 | 2184 |  |  | 154 | 10.00 | 0.67 | 2.00 | 0.47 |  0.67 |
| 3.7 | 2925 |  |  | 358 | 10.00 | 0.79 | 2.36 | 0.48 |  0.67 |
Table 4.
Thermal transmittance values calculated for all construction elements of the typical buildings forming the examined urban blocks.
Table 4.
Thermal transmittance values calculated for all construction elements of the typical buildings forming the examined urban blocks.
| Construction Element | U-Value (W/m2 K) |
|---|---|
| Brick walls | 1.72 |
| Concrete walls | 3.25 |
| Roof horizontal slab | 2.11 |
| Ground floor concrete slab | 2.65 |
| Windows | 5.81 |
Table 5.
Mean values for heating, cooling and total load demand, their absolute value of difference and the absolute percentage of difference for Thessaloniki and Heraklion climatic conditions.
Table 5.
Mean values for heating, cooling and total load demand, their absolute value of difference and the absolute percentage of difference for Thessaloniki and Heraklion climatic conditions.
| Mean Values | |||
|---|---|---|---|
| Heating Load | Cooling Load | Total Load | |
| Thessaloniki (KWh/m2) | 184.97 | 15.29 | 200.26 |
| Heraklion (KWh/m2) | 92.67 | 21.13 | 113.80 |
| Absolute difference (KWh/m2) | 92.30 | 5.84 | 86.46 |
| Percentage of change (%) | −49.90 | 38.18 | −43.18 |
Table 6.
Urban blocks presenting the maximum values for heating cooling and total load demand in each group for the two examined cities.
Table 6.
Urban blocks presenting the maximum values for heating cooling and total load demand in each group for the two examined cities.
| Max | Thessaloniki | Heraklion | |||||
|---|---|---|---|---|---|---|---|
| Heating Loads | Cooling Loads | Total Loads | Heating Loads | Cooling Loads | Total Loads | ||
| Group 1 | plan & block n° |  1.9 |  1.8 |  1.9 |  1.9 |  1.8 |  1.9 |
| size (m2) | 1914 | 1155 | 1914 | 1914 | 1155 | 1914 | |
| Group 2 | plan & block n° |  2.8 |  2.8 |  2.8 |  2.8 |  2.8 |  2.8 |
| size (m2) | 1155 | 1155 | 1155 | 1155 | 1155 | 1155 | |
| Group 3 | plan & block n° |  3.4 |  3.4 |  3.4 |  3.3 |  3.4 |  3.4 |
| size (m2) | 1188 | 1188 | 1188 | 4250 | 1188 | 1188 | |
Table 7.
Urban blocks presenting the minimum values for heating cooling and total load demand in each group for the two examined cities.
Table 7.
Urban blocks presenting the minimum values for heating cooling and total load demand in each group for the two examined cities.
| Max | Thessaloniki | Heraklion | |||||
|---|---|---|---|---|---|---|---|
| Heating Loads | Cooling Loads | Total Loads | Heating Loads | Cooling Loads | Total Loads | ||
| Group 1 | plan & block n° |  1.1 |  1.3 |  1.1 |  1.1 |  1.3 |  1.3 |
| size (m2) | 5016 | 5610 | 5016 | 5016 | 5610 | 5610 | |
| Group 2 | plan & block n° |  2.2 |  2.2 |  2.2 |  2.2 |  2.2 |  2.2 |
| size (m2) | 5400 | 5400 | 5400 | 5400 | 5400 | 5400 | |
| Group 3 | plan & block n° |  3.1 |  3.1 |  3.1 |  3.1 |  3.1 |  3.1 |
| size (m2) | 6185 | 6185 | 6185 | 6185 | 6185 | 6185 | |
Table 8.
Correlation of the form parameters to the load demand of the urban blocks of group 1 for the climate of Thessaloniki.
Table 8.
Correlation of the form parameters to the load demand of the urban blocks of group 1 for the climate of Thessaloniki.
| Thessaloniki Group 1 | ||||||
|---|---|---|---|---|---|---|
| Coverage Ratio | Building Ratio | S/V | Inner Court Perimeter | Block Surface | ||
| Heating loads | Pearson Correlation | −0.790 ** | −0.789 ** | 0.799 ** | −0.845 ** | −0.803 ** |
| Sig. (2-tailed) | 0.004 | 0.004 | 0.003 | 0.001 | 0.003 | |
| Cooling loads | Pearson Correlation | −0.809 ** | −0.811 ** | 0.900 ** | −0.844 ** | −0.810 ** |
| Sig. (2-tailed) | 0.003 | 0.002 | 0.000 | 0.001 | 0.002 | |
| Total loads | Pearson Correlation | −0.799 ** | −0.798 ** | 0.816 ** | −0.851 ** | −0.810 ** |
| Sig. (2-tailed) | 0.003 | 0.003 | 0.002 | 0.001 | 0.002 | |
** Correlation is significant at the 0.01 level (2-tailed).
Table 9.
Correlation of the form parameters to the load demand of the urban blocks of group 1 for the climate of Heraklion.
Table 9.
Correlation of the form parameters to the load demand of the urban blocks of group 1 for the climate of Heraklion.
| Heraklion Group 1 | ||||||
|---|---|---|---|---|---|---|
| Coverage Ratio | Building Ratio | S/V | Inner Court Perimeter | Block Surface | ||
| Heating loads | Pearson Correlation | −0.789 ** | −0.787 ** | 0.788 ** | −0.843 ** | −0.812 ** |
| Sig. (2-tailed) | 0.004 | 0.004 | 0.004 | 0.001 | 0.002 | |
| Cooling loads | Pearson Correlation | −0.813 ** | −0.815 ** | 0.928 ** | −0.813 ** | 0.994 ** |
| Sig. (2-tailed) | 0.002 | 0.002 | 0.000 | 0.002 | 0.000 | |
| Total loads | Pearson Correlation | −0.810 ** | −0.810 ** | 0.839 ** | −0.852 ** | 0.943 ** |
| Sig. (2-tailed) | 0.003 | 0.003 | 0.001 | 0.001 | 0.000 | |
** Correlation is significant at the 0.01 level (2-tailed).
Table 10.
Correlation of form parameters to load demand of the urban blocks of group 2 for the climate of Thessaloniki.
Table 10.
Correlation of form parameters to load demand of the urban blocks of group 2 for the climate of Thessaloniki.
| Thessaloniki Group 2 | ||||||
|---|---|---|---|---|---|---|
| Coverage Ratio | Building Ratio | S/V | Inner Court Perimeter | Block Surface | ||
| Heating loads | Pearson Correlation | 0.029 | 0.028 | 0.762 * | −0.587 | −0.775 ** |
| Sig. (2-tailed) | 0.936 | 0.940 | 0.010 | 0.075 | 0.008 | |
| Cooling loads | Pearson Correlation | −0.361 | −0.362 | 0.678 * | −0.752 * | −0.781 ** |
| Sig. (2-tailed) | 0.306 | 0.304 | 0.031 | 0.012 | 0.008 | |
| Total loads | Pearson Correlation | −0.011 | −0.013 | 0.766 ** | −0.614 | −0.788 ** |
| Sig. (2-tailed) | 0.975 | 0.972 | 0.010 | 0.059 | 0.007 | |
** Correlation is significant at the 0.01 level (2-tailed). * Correlation is significant at the 0.05 level (2-tailed).
Table 11.
Correlation of form parameters to load demand of the urban blocks of group 2 for the climate of Heraklion.
Table 11.
Correlation of form parameters to load demand of the urban blocks of group 2 for the climate of Heraklion.
| Heraklion Group 2 | ||||||
|---|---|---|---|---|---|---|
| Coverage Ratio | Building Ratio | S/V | Inner Court Perimeter | Block Surface | ||
| Heating loads | Pearson Correlation | 0.049 | 0.048 | 0.754 * | −0.571 | −0.765 ** |
| Sig. (2-tailed) | 0.893 | 0.896 | 0.012 | 0.085 | 0.010 | |
| Cooling loads | Pearson Correlation | −0.401 | −0.402 | 0.714 * | −0.696 | −0.746 * |
| Sig. (2-tailed) | 0.251 | 0.249 | 0.020 | 0.025 | 0.013 | |
| Total loads | Pearson Correlation | −0.065 | −0.066 | 0.771 ** | −0.625 | −0.788 ** |
| Sig. (2-tailed) | 0.859 | 0.856 | 0.009 | 0.054 | 0.007 | |
** Correlation is significant at the 0.01 level (2-tailed). * Correlation is significant at the 0.05 level (2-tailed).
Table 12.
Correlation of form parameters to load demand of the urban blocks of group 3 for the climate of Thessaloniki.
Table 12.
Correlation of form parameters to load demand of the urban blocks of group 3 for the climate of Thessaloniki.
| Thessaloniki Group 3 | ||||||
|---|---|---|---|---|---|---|
| Coverage Ratio | Building Ratio | S/V | Inner Court Perimeter | Block Surface | ||
| Heating loads | Pearson Correlation | 0.649 | 0.638 | 0.855 * | −0.366 | −0.688 |
| Sig. (2-tailed) | 0.115 | 0.123 | 0.014 | 0.420 | 0.088 | |
| Cooling loads | Pearson Correlation | 0.335 | 0.339 | 0.851 * | −0.813 * | −0.976 ** |
| Sig. (2-tailed) | 0.462 | 0.456 | 0.015 | 0.026 | 0.000 | |
| Total loads | Pearson Correlation | 0.622 | 0.613 | 0.889 ** | −0.457 | −0.764 * |
| Sig. (2-tailed) | 0.136 | 0.144 | 0.007 | 0.303 | 0.045 | |
** Correlation is significant at the 0.01 level (2-tailed). * Correlation is significant at the 0.05 level (2-tailed).
Table 13.
Correlation of form parameters to load demand of the urban blocks of group 3 for the climate of Heraklion.
Table 13.
Correlation of form parameters to load demand of the urban blocks of group 3 for the climate of Heraklion.
| Heraklion Group 3 | ||||||
|---|---|---|---|---|---|---|
| Coverage Ratio | Building Ratio | S/V | Inner Court Perimeter | Block Surface | ||
| Heating loads | Pearson Correlation | 0.616 | 0.603 | 0.819 * | −0.351 | −0.656 |
| Sig. (2-tailed) | 0.141 | 0.152 | 0.024 | 0.441 | 0.109 | |
| Cooling loads | Pearson Correlation | 0.343 | 0.352 | 0.852 * | −0.809 * | −0.949 ** |
| Sig. (2-tailed) | 0.451 | 0.439 | 0.015 | 0.027 | 0.001 | |
| Total loads | Pearson Correlation | 0.569 | 0.564 | 0.918 ** | −0.574 | −0.844 * |
| Sig. (2-tailed) | 0.182 | 0.187 | 0.004 | 0.178 | 0.017 | |
** Correlation is significant at the 0.01 level (2-tailed). * Correlation is significant at the 0.05 level (2-tailed).
Table 14.
Tests of normality for the dependent variables: (a) Total Load for Thessaloniki (Total Load Th) and (b) Total Load for Heraklion (total Load H).
Table 14.
Tests of normality for the dependent variables: (a) Total Load for Thessaloniki (Total Load Th) and (b) Total Load for Heraklion (total Load H).
| (a) Thessaloniki | |||
| Test of Normality | |||
| Kolmogorov-Smirnov a | |||
| Statistic | df | Sig. | |
| Total Load Th | 0.099 | 28 | 0.200 * |
| (b) Heraklion | |||
| Test of Normality | |||
| Kolmogorov-Smirnov a | |||
| Statistic | df | Sig. | |
| Total Load H | 0.143 | 28 | 0.152 |
* This is a lower bound of the true significance. a Lilliefors Significance Correction.
Table 15.
Coefficients of regression model for Thessaloniki urban block load demand.
| Coefficients a | ||||||||
|---|---|---|---|---|---|---|---|---|
| Model | Unstandardized Coefficients | Standardized Coefficients | t | Sig. | 95.0% Confidence Interval for B | |||
| B | Std. Error | Beta | Lower Bound | Upper Bound | ||||
| 1 | (Constant) | 129.799 | 29.365 | 4.420 | 0.000 | 69.054 | 190.544 | |
| CP/PS | −138.212 | 73.952 | −0.229 | −1.869 | 0.074 | −291.194 | 14.770 | |
| PS | −0.003 | 0.001 | −0.462 | −3.472 | 0.002 | −0.005 | −0.001 | |
| Height | 1.911 | 0.577 | 0.874 | 3.314 | 0.003 | 0.718 | 3.104 | |
| S/V | 160.838 | 46.940 | 0.927 | 3.426 | 0.002 | 63.735 | 257.941 | |
a Dependent Variable: Total load Th.
Table 16.
Coefficients of regression model for Heraklion urban block load demand.
| Coefficients a | ||||||||
|---|---|---|---|---|---|---|---|---|
| Model | Unstandardized Coefficients | Standardized Coefficients | t | Sig. | 95.0% Confidence Interval for B | |||
| B | Std. Error | Beta | Lower Bound | Upper Bound | ||||
| 2 | (Constant) | 70.111 | 16.278 | 4.307 | 0.000 | 36.437 | 103.786 | |
| CP/PS | −86.178 | 40.996 | −0.238 | −2.102 | 0.047 | −170.984 | −1.372 | |
| PS | −0.002 | 0.000 | −0.460 | −3.740 | 0.001 | −0.003 | −0.001 | |
| Height | 1.323 | 0.320 | 1.010 | 4.139 | 0.000 | 0.662 | 1.984 | |
| S/V | 93.173 | 26.022 | 0.896 | 3.581 | 0.002 | 39.343 | 147.002 | |
a Dependent Variable: Total load H.
Table 17.
Model Summary for Thessaloniki b.
| Model | R | R2 | Adjusted R2 | Std. Error of the Estimate | Change Statistics | Durbin-Watson | ||||
|---|---|---|---|---|---|---|---|---|---|---|
| R2 Change | F Change | df1 | df2 | Sig. F Change | ||||||
| 1 | 0.875 a | 0.765 | 0.724 | 5.533 | 0.765 | 18.721 | 4 | 23 | 0.000 | 1.841 |
a Predictors: (Constant), S/V, CP/PS, Plot Surface, Height; b Dependent Variable: Total Load Th.
Table 18.
Model Summary for Heraklion b.
| Model | R | R2 | Adjusted R2 | Std. Error of the Estimate | Change Statistics | Durbin-Watson | ||||
|---|---|---|---|---|---|---|---|---|---|---|
| R2 Change | F Change | df1 | df2 | Sig. F Change | ||||||
| 2 | 0.894 a | 0.799 | 0.764 | 3.067 | 0.799 | 22.867 | 4 | 23 | 0.000 | 1.774 |
a Predictors: (Constant), Height, Plot Surface, CP/PS, S/V; b Dependent Variable: Total Load H.
Table 19.
Collinearity statistics for the four independent variables included in both regression models.
Table 19.
Collinearity statistics for the four independent variables included in both regression models.
| Collinearity Statistics | ||
|---|---|---|
| Tolerance | VIF | |
| CP/PS | 0.679 | 1.473 |
| PS | 0.578 | 1.731 |
| S/V | 0.147 | 6.813 |
| H | 0.139 | 7.171 |
Table 20.
Form and geometry parameters of typical urban blocks used for the validation of the regression models.
Table 20.
Form and geometry parameters of typical urban blocks used for the validation of the regression models.
| Urban Block | Urban Block Surface (m2) | Plan | 3D Model | Inner Court Perimeter (m) | Height (m) | Coverage Ratio | Building Ratio | S/V | Section Geometry H/W |
|---|---|---|---|---|---|---|---|---|---|
| 1V | 2550 |  |  | 310 | 22.00 | 0.58 | 4.09 | 0.39 |  1.47 |
| 2V | 2850 |  |  | 370 | 16.00 | 0.67 | 3.35 | 0.42 |  1.07 |
| 3V | 2625 |  |  | 320 | 10.00 | 0.66 | 1.98 | 0.49 |  0.67 |
© 2018 by the authors. Licensee MDPI, Basel, Switzerland. This article is an open access article distributed under the terms and conditions of the Creative Commons Attribution (CC BY) license (http://creativecommons.org/licenses/by/4.0/).
Share and Cite
MDPI and ACS Style
Tsirigoti, D.; Tsikaloudaki, K. The Effect of Climate Conditions on the Relation between Energy Efficiency and Urban Form. Energies 2018, 11, 582. https://doi.org/10.3390/en11030582
AMA Style
Tsirigoti D, Tsikaloudaki K. The Effect of Climate Conditions on the Relation between Energy Efficiency and Urban Form. Energies. 2018; 11(3):582. https://doi.org/10.3390/en11030582
Chicago/Turabian StyleTsirigoti, Dimitra, and Katerina Tsikaloudaki. 2018. "The Effect of Climate Conditions on the Relation between Energy Efficiency and Urban Form" Energies 11, no. 3: 582. https://doi.org/10.3390/en11030582
Note that from the first issue of 2016, this journal uses article numbers instead of page numbers. See further details here.