Article

Renewable Energy in Urban Areas: Worldwide Research Trends

1
Departamento de Física Aplicada, Universidad de Córdoba, CEIA3, Campus de Rabanales, 14071 Córdoba, Spain
2
Faculty of Engineering, Campus Coatzacoalcos, University of Veracruz, 96535 Coatzacoalcos, Veracruz, Mexico
*
Author to whom correspondence should be addressed.
Energies 2018, 11(3), 577; https://doi.org/10.3390/en11030577
Submission received: 13 January 2018 / Revised: 23 February 2018 / Accepted: 5 March 2018 / Published: 7 March 2018
(This article belongs to the Special Issue Urban Generation of Renewable Energy and Energy Saving in Cities)

Abstract

:
This study aims to highlight the contribution made by different international institutions in the field of urban generation of renewable energy, as a key element to achieve sustainability. This has been possible through the use of the Scopus Elsevier database, and the application of bibliometric techniques through which the articles content published from 1977 to 2017 has been analysed. The results shown by Scopus (e.g., journal articles and conferences proceedings) have been taken into account for further analysis by using the following search pattern (TITLE-ABS-KEY ({Renewable energy} AND ({urban} OR ({cit*})). In order to carry out this study, key features of the publications have been taken into consideration, such as type of document, language, thematic area, type of publication, and keywords. As far as keywords are concerned, renewable energy, sustainability, sustainable development, urban areas, city, and energy efficiency, have been the most frequently used. The results found have been broken down both geographically and by institution, showing that China, the United States, the United Kingdom, Italy, Germany and India are the main research countries and Chinese Academy of Sciences, Ministry of Education China and Tsinghua University the major contributing institutes. With regard to the categories, Energy, Environmental Sciences, and Engineering are positioned as the most active categories. The scientific community agrees that the study of the renewable energy generation in cities is of vital importance to achieve more sustainable cities, and for the welfare of a growing urban population. Moreover, this is in line with the energy policies adopted by most of developed countries in order to mitigate climate change effects.

Graphical Abstract

1. Introduction

Energy production and consumption have considerations that affect both sustainability and economy [1]. Indeed, not only the depletion of fossil resources and generated greenhouse gasses emissions, as a consequence of a coal and oil based model, or the occupation of natural spaces for renewable models of centralized production should be taken into account, but also the increasing cost of energy [2,3]. In the economic activity, this cost has an impact on the income statement, which may involve a variable amount in relation to the total costs of the activity, usually ranging from 5 to 40% of the costs necessary to produce or provide the services [4].
On the whole, energy efficiency is defined as the relationship between the production of goods or services and the energy expenditure required [5]. Thus, through energy efficiency, the reduction in energy consumption is sought by maintaining the same uses of energy that is, without reducing the level of production or decreasing the level of comfort, ensuring supply, promoting sustainability and protecting the environment. This reduction involves the different sources of energy used, such as oil, coal, natural gas, etc. [6,7,8].
The group of fossil fuels (coal, oil and natural gas) used worldwide as a source of energy represents a very high percentage of the primary energy used. This is leading to its depletion and resulting in the increase of prices [9].
Because of the above, it can be said that the current energy system presents serious problems that are summarized in the depletion of fossil fuel reserves, negative consequences for the environment (climate change, greenhouse effect, acid rain, deforestation, etc.) and instability of the geopolitical system caused mainly by inequality in the distribution of energy consumption and reserves [10,11,12].
The alternative to these problems raised by the current global energy system should be the progressive implementation of measures that promote sustainable development [13,14,15]. In the current economic model, three production sectors are of great importance for saving energy and reducing pollution and, therefore, for sustainable development: construction by improving building techniques [16]; the energy producing sector with cogeneration systems [17,18,19], hybrid systems (wind-diesel) and alternative sources [20,21]; and the transport sector using unleaded gasoline, biofuels, catalytic filters and mixed and electric vehicles [22,23,24].
On the other hand, renewable energies cover only 15% of the world’s energy sources, and fossil fuels will continue to satisfy a large part of the world’s energy demand for the foreseeable future [25]. The energy sector is responsible for two thirds of global CO2 emissions and one of the main drivers of climate change. Therefore, to limit this increase in emissions, strategic plans have been put in place such as the Strategic Framework for 2030 of the European Union, or the Clean Energy Plan of the United States in which countries involved are committed to reducing CO2 emissions by 32% by 2030 [26,27].
There are twice as many inhabitants in the world compared to the year 1960, and the population is expected to continue growing to reach 9000 million by 2050 [28]. According to predictive models, developing countries will experience 99% of this population growth, with a 50% population increase in urban areas. In accordance with the information given by the United Nations in relation to the environment program, in Latin America, which has a high degree of urbanization, 78% of its inhabitants resided in urban areas in 2007, and it is expected that this percentage will increase to 89% by 2050 [29]. In less urbanized countries such as Asia and Africa, with 40% of the population living in cities, a high rate of increase in the urban population is also expected, reaching 62% by 2050. According to the United Nations forecasts, in 2050, the number of people who will live in cities will amount to 6000 million [30]. However, the increase in urbanization also means new opportunities for policy makers in developing countries to promote better urban conditions in terms of stricter efficiency standards in buildings, as well as to boost sustainable mobility in order to achieve a sustainable urban development [31].
Although fossil fuels continue to be the main source of energy in cities, the use of sustainable energy as a policy solution to mitigate the serious pollution issues, is becoming more and more essential [3]. Upcoming technologies such as the use of cogeneration systems and biomass district heating in cities are characterized by energy savings and high energy efficiency. Research and development of renewable energy models in urban areas are becoming an imperative to achieve a sustainable energy system. Many cities have already expressed their commitment towards a 100% renewable model. It is expected that by the year 2025, cities such as Copenhagen and Munich will obtain 100% of their electricity from renewable sources, thus becoming neutral carbon cities [32].
With regard to the main sources of renewable energy that are currently used in cities, biomass, solar and wind energy are the main technologies, which remain under-researched [33]. Municipal Solid Waste (MSW) generated in urban areas is generally carried to dumps and buried, without making a sustainable use of it. Once decomposed by anaerobic digestion, they end up generating a methane-rich biogas that reaches the atmosphere and becomes carbon dioxide, one of the main drivers of global warming. This generated biogas can be used for thermal and electrical energy generation, avoiding in this form the negative consequences of its release into the atmosphere. The use of biomass (wastewater, agricultural and livestock waste, urban or industrial residues, remains of trees or crops, ...), for the generation of useful energy-electricity or heat-, is a source of energy production with a large potential, which contributes on the one hand to a more sustainable waste management, and on the other hand, to reduce the energy dependence on fossil fuels [34].
Moreover, solar energy applied in urban environments is an effective and environmentally friendly technology, since panels and photovoltaic (PV) equipment, as well as thermal solar collectors, can be placed on the roofs of buildings, where they function efficiently, without hindering normal activity and with low maintenance [35]. It is estimated that the global capacity for concentrating solar energy production will reach 147 GW in 2020, 337 GW in 2030 and 1089 GW in 2050 [36].
Another growing research trend is related to small-scale wind energy generation. The installation of wind turbines in cities is a simple and eco-friendly technology; since a mini wind generator has a low maintenance cost, is very reliable and has a minimum environmental impact. It also works with low intensity winds, does not need the creation of new electrical infrastructures and has a high efficiency index, since it avoids the losses that occur in the transport and distribution electricity grids [37]. A Chinese home, for example, would currently need a 1 kW turbine to generate all the energy needed for a year; a European house would not need more than 4 kW, and an American home would need roughly a 10 kW wind turbine to cover an average consumption of 11,500 kWh of annual electricity [38].
Nowadays, the use of green energy in urban areas represents a field of great interest to the scientific community. The large-scale urban generation of renewable energy is postulated as a solution for the development of sustainable energy, both, to meet the growing demand for energy in cities and, to reduce greenhouse gasses emissions [39]. Research is needed to achieve more efficient, profitable and sustainable renewable sources. Then, the knowledge about the distribution of the worldwide scientific scene with regard to the urban generation and use of renewable energy in cities is of utmost interest [40].
Because there are two widely used databases, Web of Science (WoS) and Scopus, the problem related to the statistical data provided from different sources arises, as regards their comparability and stability. The overlay among these databases and the effect due to the use of data coming from different sources for specific research fields in bibliometric indicators, have been studied. To solve this problem, and taking into account some studies involving citations, it has been limited the citation period from 1977 onwards, since Scopus citations are comparable to Web of Science citations in this period (the citation coverage from Scopus); it has been proved that each database covers approximately 90% of the references identified by the other [41]. Nevertheless, if the scope of WoS and Scopus journals is taken as an indicator, a comparative study shows that Scopus has a greater coverage of active academic journals (20,346 journals) compared to WoS (13,605 journals) [42], being the correspondences between the data obtained with both databases in relation to the quantity of documents and citations by country and range extremely high (R2 ≈ 0.99) [43]. The advantages of Scopus database are highlighted in diverse papers and, consequently, is frequently employed for many bibliometric analyses [44,45].
The ultimate purpose of this study is to establish the current situation as well as the research trends in the field of renewable energy in urban areas over the 1977–2017 period, in order to help the scientific world to have a greater understanding about the present and future situation, providing useful information to foresee future tendencies that might occur in research lines.

2. Materials and Methods

Bibliometrics is the branch of bibliology that studies the scientific production contained in various types of documents through statistical methods. Bibliometrics is considered one of the key research tools widely extended to all scientific fields, being frequently used in the evaluation of the results of peer-reviewed research.
On the other hand, the Scopus database, which has a catalog of more than 20,000 publications coming from more than five thousand international publishers, has been chosen in this study, owing to the fact the scientific community agrees on its great usefulness as the largest source of data and citations on the referenced literature.
Through the use of this database, a thorough search of the subfields of the title, abstract, and authkey involving the topics of renewable energy and city has been accomplished. The search was limited between the years 1977 and 2017. The success of this methodology has also been proved by other studies [46,47,48,49].
The following search pattern has been used, in order to avoid distorting the results: (TITLE-ABS-KEY ({Renewable energy} AND ({urban} OR ({cit*})).
Several indices, as well as the statistical indicators in lot of interest areas can be established by combining the field results with the information collected. The publications found concerning renewable energy and urban areas or cities over the time frame from 1977 to 2017 were assessed based on different criteria such as kind of publication, language, scientific product features, distribution of publications by country and institution, categories of distribution topics, analysis of citations as well as the frequency of the key word appearance. For the analysis of citations, the influence of the h-index has been taken on board. This index, which was suggested in 2005 by Hirsch, is extensively used to evaluate the impact of an individual researcher. It is considered the most reliable way to measure the work scientific quality, evaluating the regularity of production and predicting the future result, since it takes into consideration both productivity and impact. The h-index of a researcher is equivalent to the number of articles of that researcher whose number of citations is equal or greater than the number of articles published. That is, if the index h is 20, that means that the author has 20 articles with 20 or more citations each. Therefore, it can be concluded that the higher the h-index, the better the academic scientific quality of the researcher.

3. Results and Discussion

3.1. Type of Publications and Languages of Publications

Considering several fields and types of documents, the search has shown a total of 46,172 documents. A further analysis of the different types of publications reveals that the great part of the research works are articles (30,764; 67%) and conference papers (8074; 17%). By contrast, there are a remarkably lower number of reviews (3933; 9%), being devoted the lowest percentage to book chapters and books. Figure 1 shows a chart representation of the distribution according to the type of document during the period 1977–2017.
Due to the fact that the majority of the analysed publications are articles published in international journals, a great percentage (96.50%) of the works have been published in English, with a minute percentage (2.61%) being written in Chinese, German or Spanish language. Figure 2 depicts the percentage of publications according to the language used in the document.

3.2. Characteristics of scientific output

Figure 3a represents the evolution trend in the publications amount over the last four decades. As can be seen, scientific production in this area was scarce until the beginning of the 2000s, when it began to increase almost exponentially, going from barely 250 annual publications, to exceed 9000 in 2017. This important rise was motivated by a greater understanding of the environmental issue at the dawn of the 21st century, in which different governments and institutions established energy policies with the objective of encouraging renewable energies and energy efficiency, as a measure to mitigate the effects of climate change. In Figure 3b, a logarithmic scale is used to represent the data, thus giving a clear view of the growth rate.

3.3. Publication Distribution by Regions and Institutions

Figure 4 shows a representative map of the publications distribution according to the country of origin. The quantity of publications is represented by colors ranging from turquoise that indicates the greatest number of publications, to gray that indicates the non-existence of publications. As can be observed, China is the top country in number of publications, followed by the United States and the United Kingdom. It also highlights the scientific production of other countries such as Italy, Germany, or India. These data lead us to the conclusion of the importance of urban generation of renewable energy in developed countries as a key element to achieve sustainable development. Governments all over the world, especially in industrialized countries, develop increasingly stringent energy policies, having as main objective reducing greenhouse gas emissions to mitigate climate change effects.
In the case of China, in view of its overwhelming pollution issues and the possibility that their coastal cities being devastated by the rising sea level, Beijing was forced to launch a campaign in search of green solutions. The program “Made in China 2025”, a central axis of the internal industrial policy of Beijing, foresees a considerable investment in research and development of clean energies, in order to meet climates aims. State banks invest tens of billion dollars each year in technologies such as solar and wind energies, as well as strategies for energy conservation such as high-speed rail and underground transport lines. China already enjoys a dominant position in many low carbon emission energy technologies. It produces two thirds of the solar panels and almost half of the wind turbines in the world. It has also rapidly expanded its fleet of nuclear reactors and is the undisputed world leader in hydropower energy [50].
One of the studied emerging technologies consists of the installation of floating photovoltaic solar panels. In a lake originated after the collapse of abandoned coal mines, China has built the largest worldwide floating solar project, capable of supplying light and air conditioning to a nearby city almost completely. The government plans to extend this project to ten more cities, which together could produce the same amount of energy as a normal-sized commercial nuclear reactor. This project is a sample of the contribution of China to the urban generation of renewable energy, as a key element to achieve its climate goals.
In addition to the reduction of air pollution in cities, energy security is another of the main drivers of renewable energy in urban areas. For example in the United States energy security is considered part of a national security issue, which plays a key role in ensuring the security of its own military operations. Energy security is also widely considered in terms of increasing the resilience of the electrical system.
Also from an economic point of view, the implementation of renewables will generate value and employment at the local level. The renewable energy sector offers an alternative to increase wages, improve the trade balance, contribute to industrial and local development, and generate jobs. Analyses made show that countries with stable regulatory frameworks in renewable energies are the ones that benefit the most from the value generated by this sector at the local level.
Figure 5 represents the total scientific production for the top 50 contributing countries. As can be seen, China and the United States are the countries with greater annual scientific contribution, more than 800 per year from 2014, followed by the United Kingdom with roughly 400 annual editions, and Italy close to 300 publications each year from 2014. As previously stated, all countries experienced an exponential increase in scientific publications amount over the first decade of the 21st century. Figure 6 depicts the evolving trend of the main five countries over the last 17 years.
The 10 institutions with the highest scientific output are sorted in Table 1. In the first place is The Chinese Academy of Sciences, secondly the Ministry of Education of China, and thirdly the Tsinghua University. These institutions belong to China, the top productive country in this field, as has already been specified above. If publications are analysed according to their key words, it is observed that the term “Energy utilization” leads the research, occupying the first place in four of the top 10 institutions. If this analysis takes into account the three main keywords, it is observed that “Energy efficiency” appears in five of these institutions, followed by “Energy utilization” and “Sustainable development” in four of the 10 main institutions. Figure 7 represents the research activity of the five main institutions in the last decade, in addition to the share of publications in this field on overall.
Figure 8 depicts the collaborative network existing among countries that share the same co-author in the publications. The map was achieved using the VOSviewer software v.1.6.6., which generates a CSV file obtained through the SCOPUS database, with the key aspects of our search. It can be seen a remarkable scientific link in this field between China and the United States, likewise between the United States and Canada or between China and Australia. Traditionally the industrialized countries and those that speak the same language tend to have a greater exchange of information and works. However, due to the English language proficiency in the scientific field, there are already great interconnections with non-English speaking countries. It should also be noted that unlike other fields of research, renewable energy in urban areas is a subject where most countries maintain relationships with each other.

3.4. Distribution of Output in Subject Categories and Journals

The Scopus database generated the time evolution of the distribution of publications on renewable energy in urban areas, by subject area [51]. Figure 9 depicts the findings of the search classified by topic. The highest percentage corresponds to the subject of Energy (37.4%), followed by Environmental Science (34.7%) and Engineering (31.1%). The “Other” area includes the unspecified subject areas. Table 2 lists the number of publications by subject area.
Table 3 shows the top twelve journals that have published most of the works in this field. The data has been presented based on the h-index, since it is the criterion most frequently used to catalog a publication. First of all is the journal “Bioresource Technology” with a 216 h-index, followed by “Renewable and Sustainable Energy Reviews” with a 176 h-index and thirdly “Energy Policy” with a 146 h-index.
To go beyond the analytical results representation, it is necessary to combine several techniques along with the use of new applications that provide a different approach in the presentation of the found results. With a view to evaluate the appearance of international Scopus newsletter in the investigation field that occupies us, besides the editorial production of the different countries and regions, it is necessary to consider the overlap existing between the main journals of the Energy, Environmental Science, and Engineering sectors.
Figure 10 shows this overlap, through a map which is generated by taking into account the citations, co-citations and the bibliographic linkage of the approximately 30,000 publications (journals and congress proceedings) found in Scopus, which are used to generate a relational array that serves as the basis for the output presentation. In this chart the bibliometric indicators, as well as the shape of the clusters in which they are arranged, according to the utilization given by the authors, can be observed. The overlap mapping methodology is applied to situate subasemblies of publications within the general context of publications. The different clusters generated by the algorithm are represented in different colors. At the top of the map, a green cluster dedicated mainly to Environmental Sciences is represented. On the right-hand side it is observed two small clusters, one yellow dedicated to Biology and Ecology, and another reddish brown that deals with Hydrological Processess. These two groups blend with two bigger clusters, one purple dedicated to the Technology of Materials and Water Research, and elongated bright blue one dedicated to Electronics, Automatics, and Signal, Sound and Video Processing. On the left-hand side there is a small orange cluster dedicated to Neuroscience and Physiology and just below a pinkish group that deals with mutation research, biotechnology and bio-medical materials. It can easily observed that most of the journals stay on the right side of the map, coinciding with the areas of Environmental Science, Engineering, Computer Science and Energy.

3.5. Analysis of Authors and Keywords

With regard to the most noteworthy authors in the field of renewable energy in urban areas, Figure 11 and Table 4 show the quantity of publications of the top five authors of this subject in the last decade. At a glance, it can be seen that Ren leads the classification with 95 publications since 2007. This researcher has a 55 h-index, with greatest part of his works being released by the Harbin Institute of Technology. He is followed by Huangof the University of Regina, with a total of 76 publications and a h-index of 50. Next are Sovacool, Zuo, and Chen with 64, 62 and 61 publications, respectively, in the 2007–2017 period. It is outstanding the growing trend of publications in recent years on urban generation of renewable energy. A proof of this is that the publications number during the last three years, accounted for more than 40 percent over the total publications in the last decade. It should be highlighted the year 2015 with a total of 60 publications among the five main authors.
Figure 12 shows the relationship between different co-authors and the main authors of publications on the subject. It can be observed a strong attachment among Asian authors, presumably due to both, the idiom and the proximity of their institutes.
On the other hand, the analysis of the keywords used in the quest is of vital importance to define the areas and themes that have been considered in the study. Based on the last 40 years, 173,925 items have been found. Thus, the key word “Energy Efficiency” appeared in 4069 items (2.34%), followed by “Sustainable Development” with 3998 appearances (2.30%) and in third place “Energy Utilization” with 3447 occurrences and a percentage of 1.98% over the total. Table 5 lists the 40 most significant keywords in the last four decades.
The keyword analysis in scientific publications in the fields of science and engineering is highly recommended for the follow-through and search of research trends. However, to obtain the data that have been presented, it has been previously necessary to apply a search filter to the data supplied by Scopus. At this point, it should be pointed out the existence of different versions for the same keyword, depending on the writing made by each author. For instance, “Renewable energy”, may be written as “Green energy”, “Sustainable energy” or “Renewable power” thereby giving rise different expressions for the same concept. Indeed, in Table 5, the first and third positions are occupied by the concepts of “Energy efficiency” and “Energy utilization”, which although they may share some aspects, their meaning is completely different. Finally, Figure 13 represents a cloud of words which, at a glance, provides a clear overview of the most representative keywords.
Figure 14 represents a map with the most frequents words that our searching brought to light. They are split according to their field, shown by a color. It can be seen that, the bigger the circle, the more frequent is the used term. In the case study, “Energy efficiency”, “Sustainable development”, “Energy utilization”, “Carbon dioxide”, and “Renewable energy resources” are the most common words. Moreover, the lines that connect the different circles reveal the linkage between the keywords by means of papers and other publications.
The graph in Figure 15 shows the tendency of use of these five technical terms in the publications of the last decade. As we can see, the take-off in the use of these terms took place at the end of 2005, probably due to the entry into force of the Kyoto protocol, and this rising tendency continues nowadays, where these topics seem to be of overwhelming interest to the international scientific society.
As can be noticed, there is a clear inclination towards the use of the term energy efficiency, whose synergy with renewable energies is considered a key dynamic duo to achieve sustainable development. The relation between energy efficiency and energy utilization must be highlighted. In fact, energy efficiency is the set of actions that reduce energy consumption to produce the same. Therefore, it is an inverse relationship between production and consumption, in such a way that energy efficiency (EE) improves either if production is maintained with less energy utilization, or the production increases with the same energy utilization. That is, EE = Production/Energy utilization.

4. Discussion and Conclusions

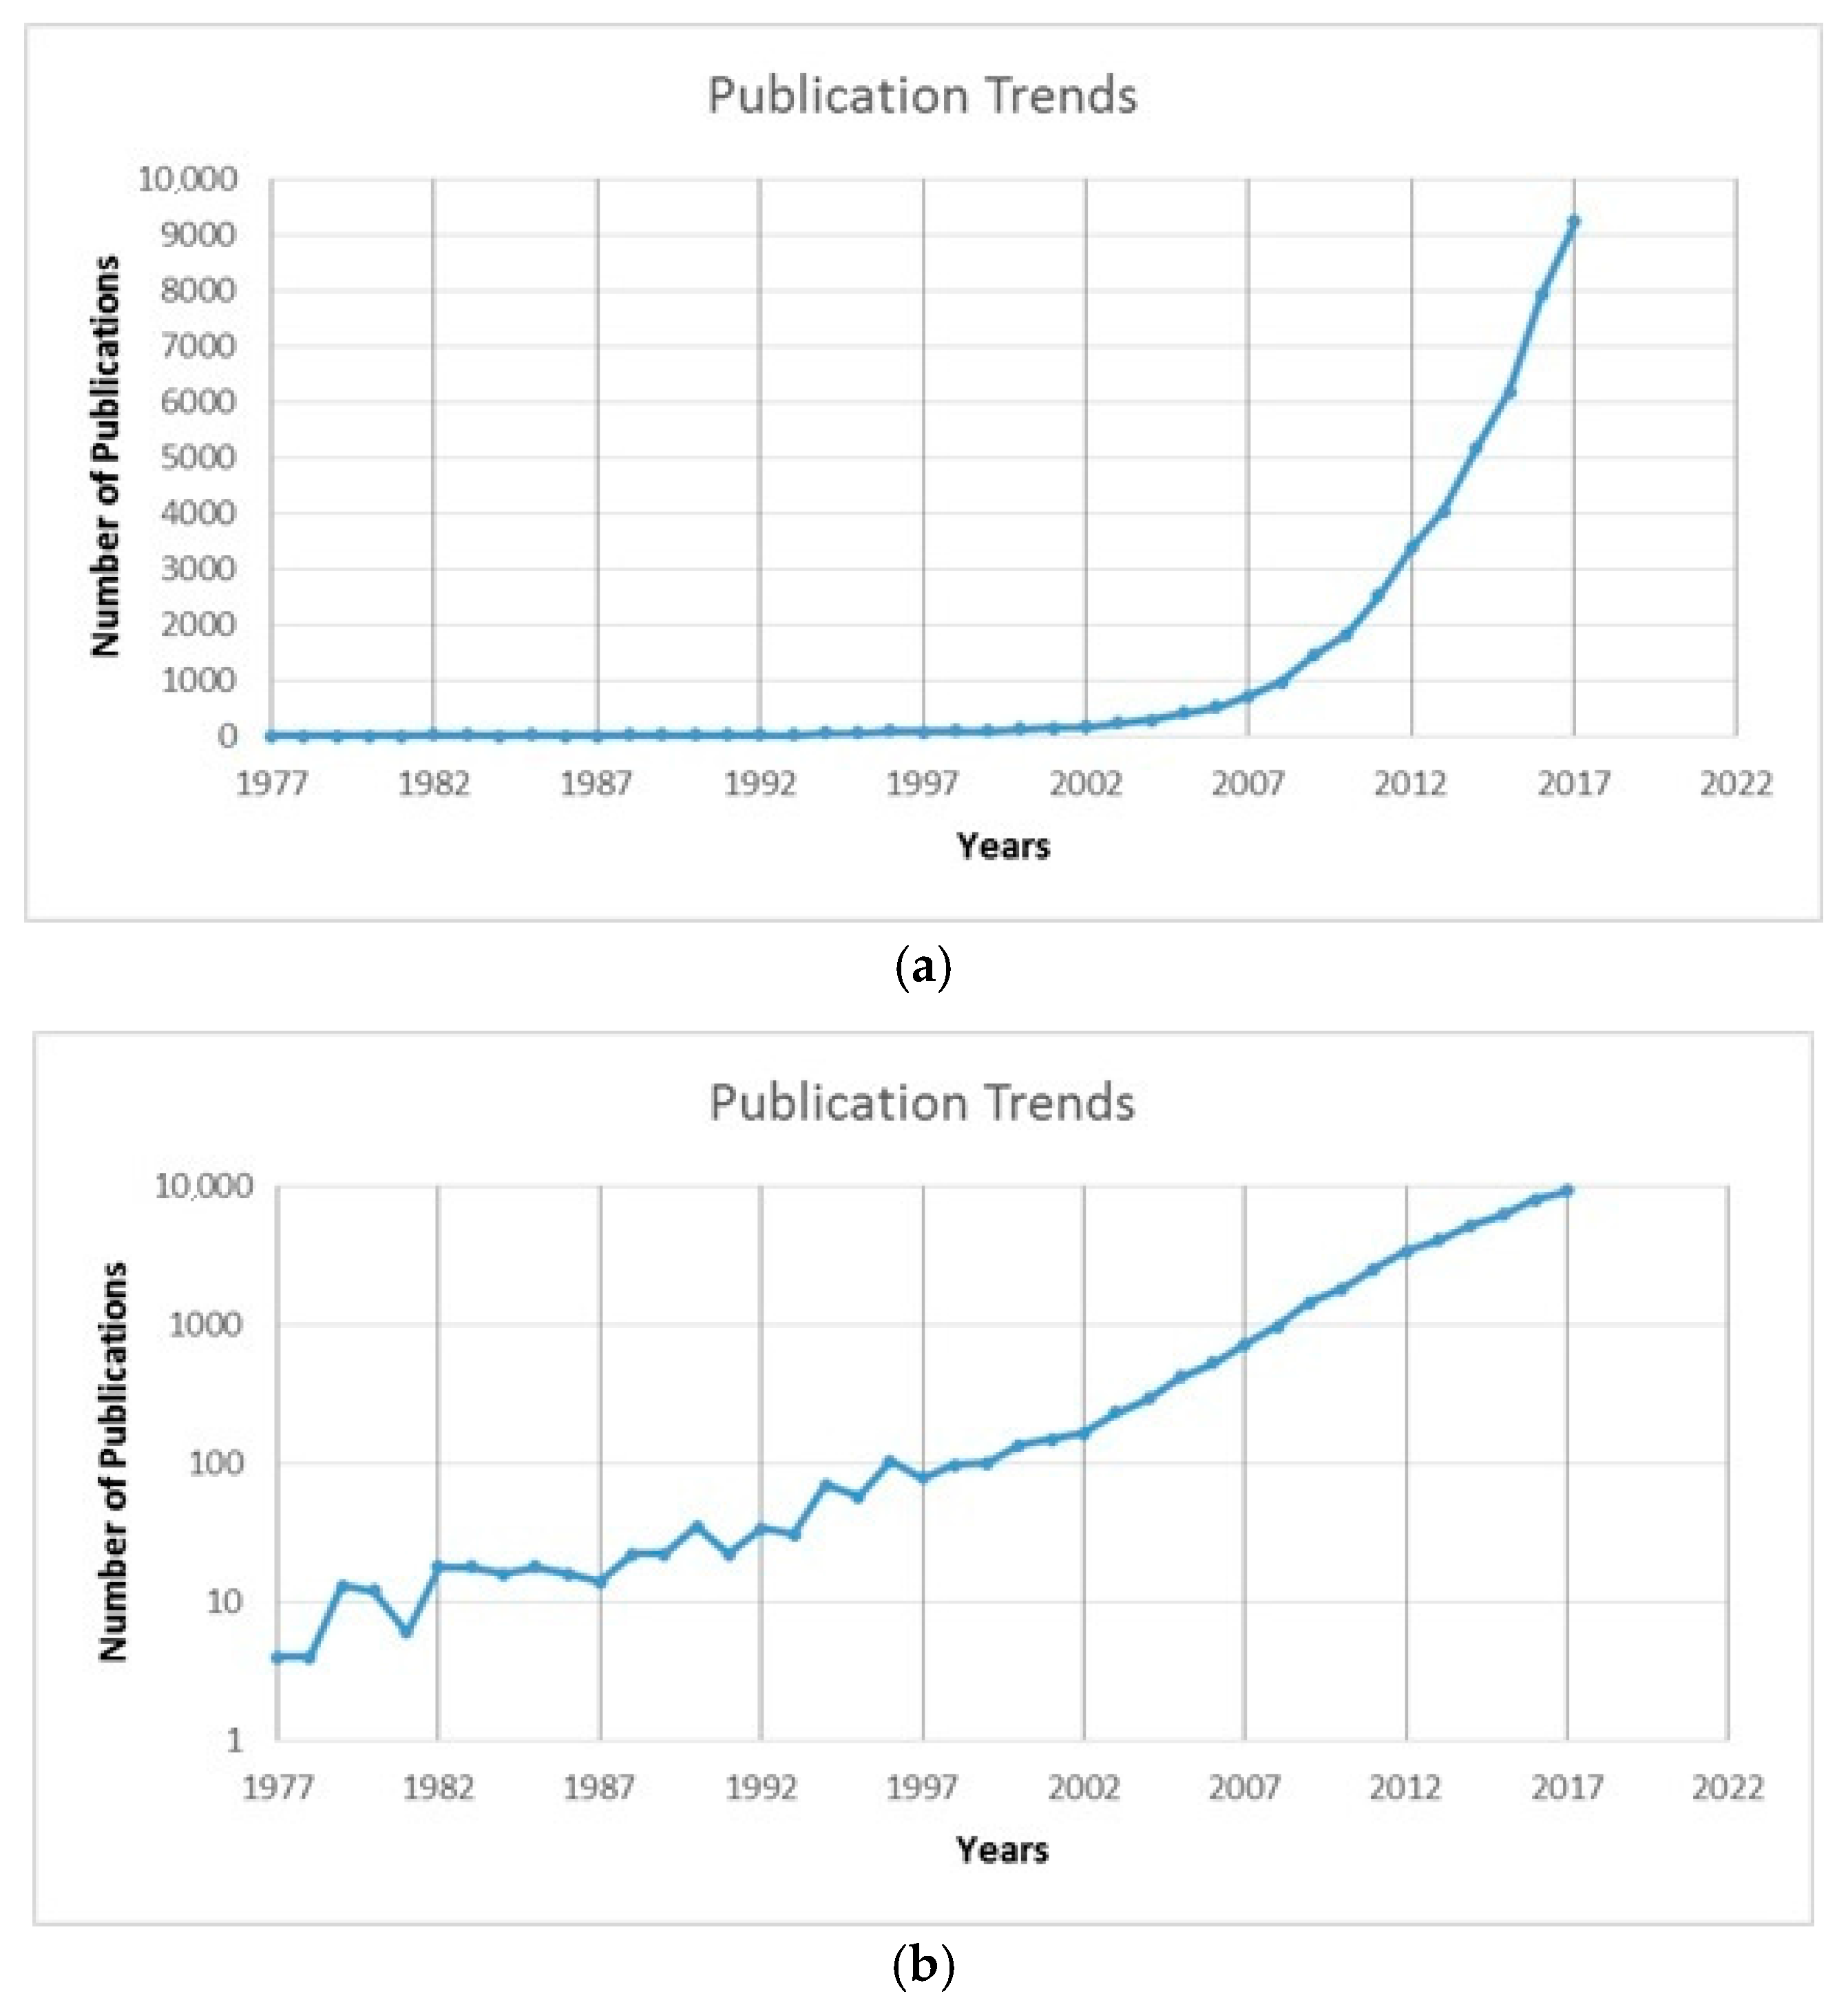
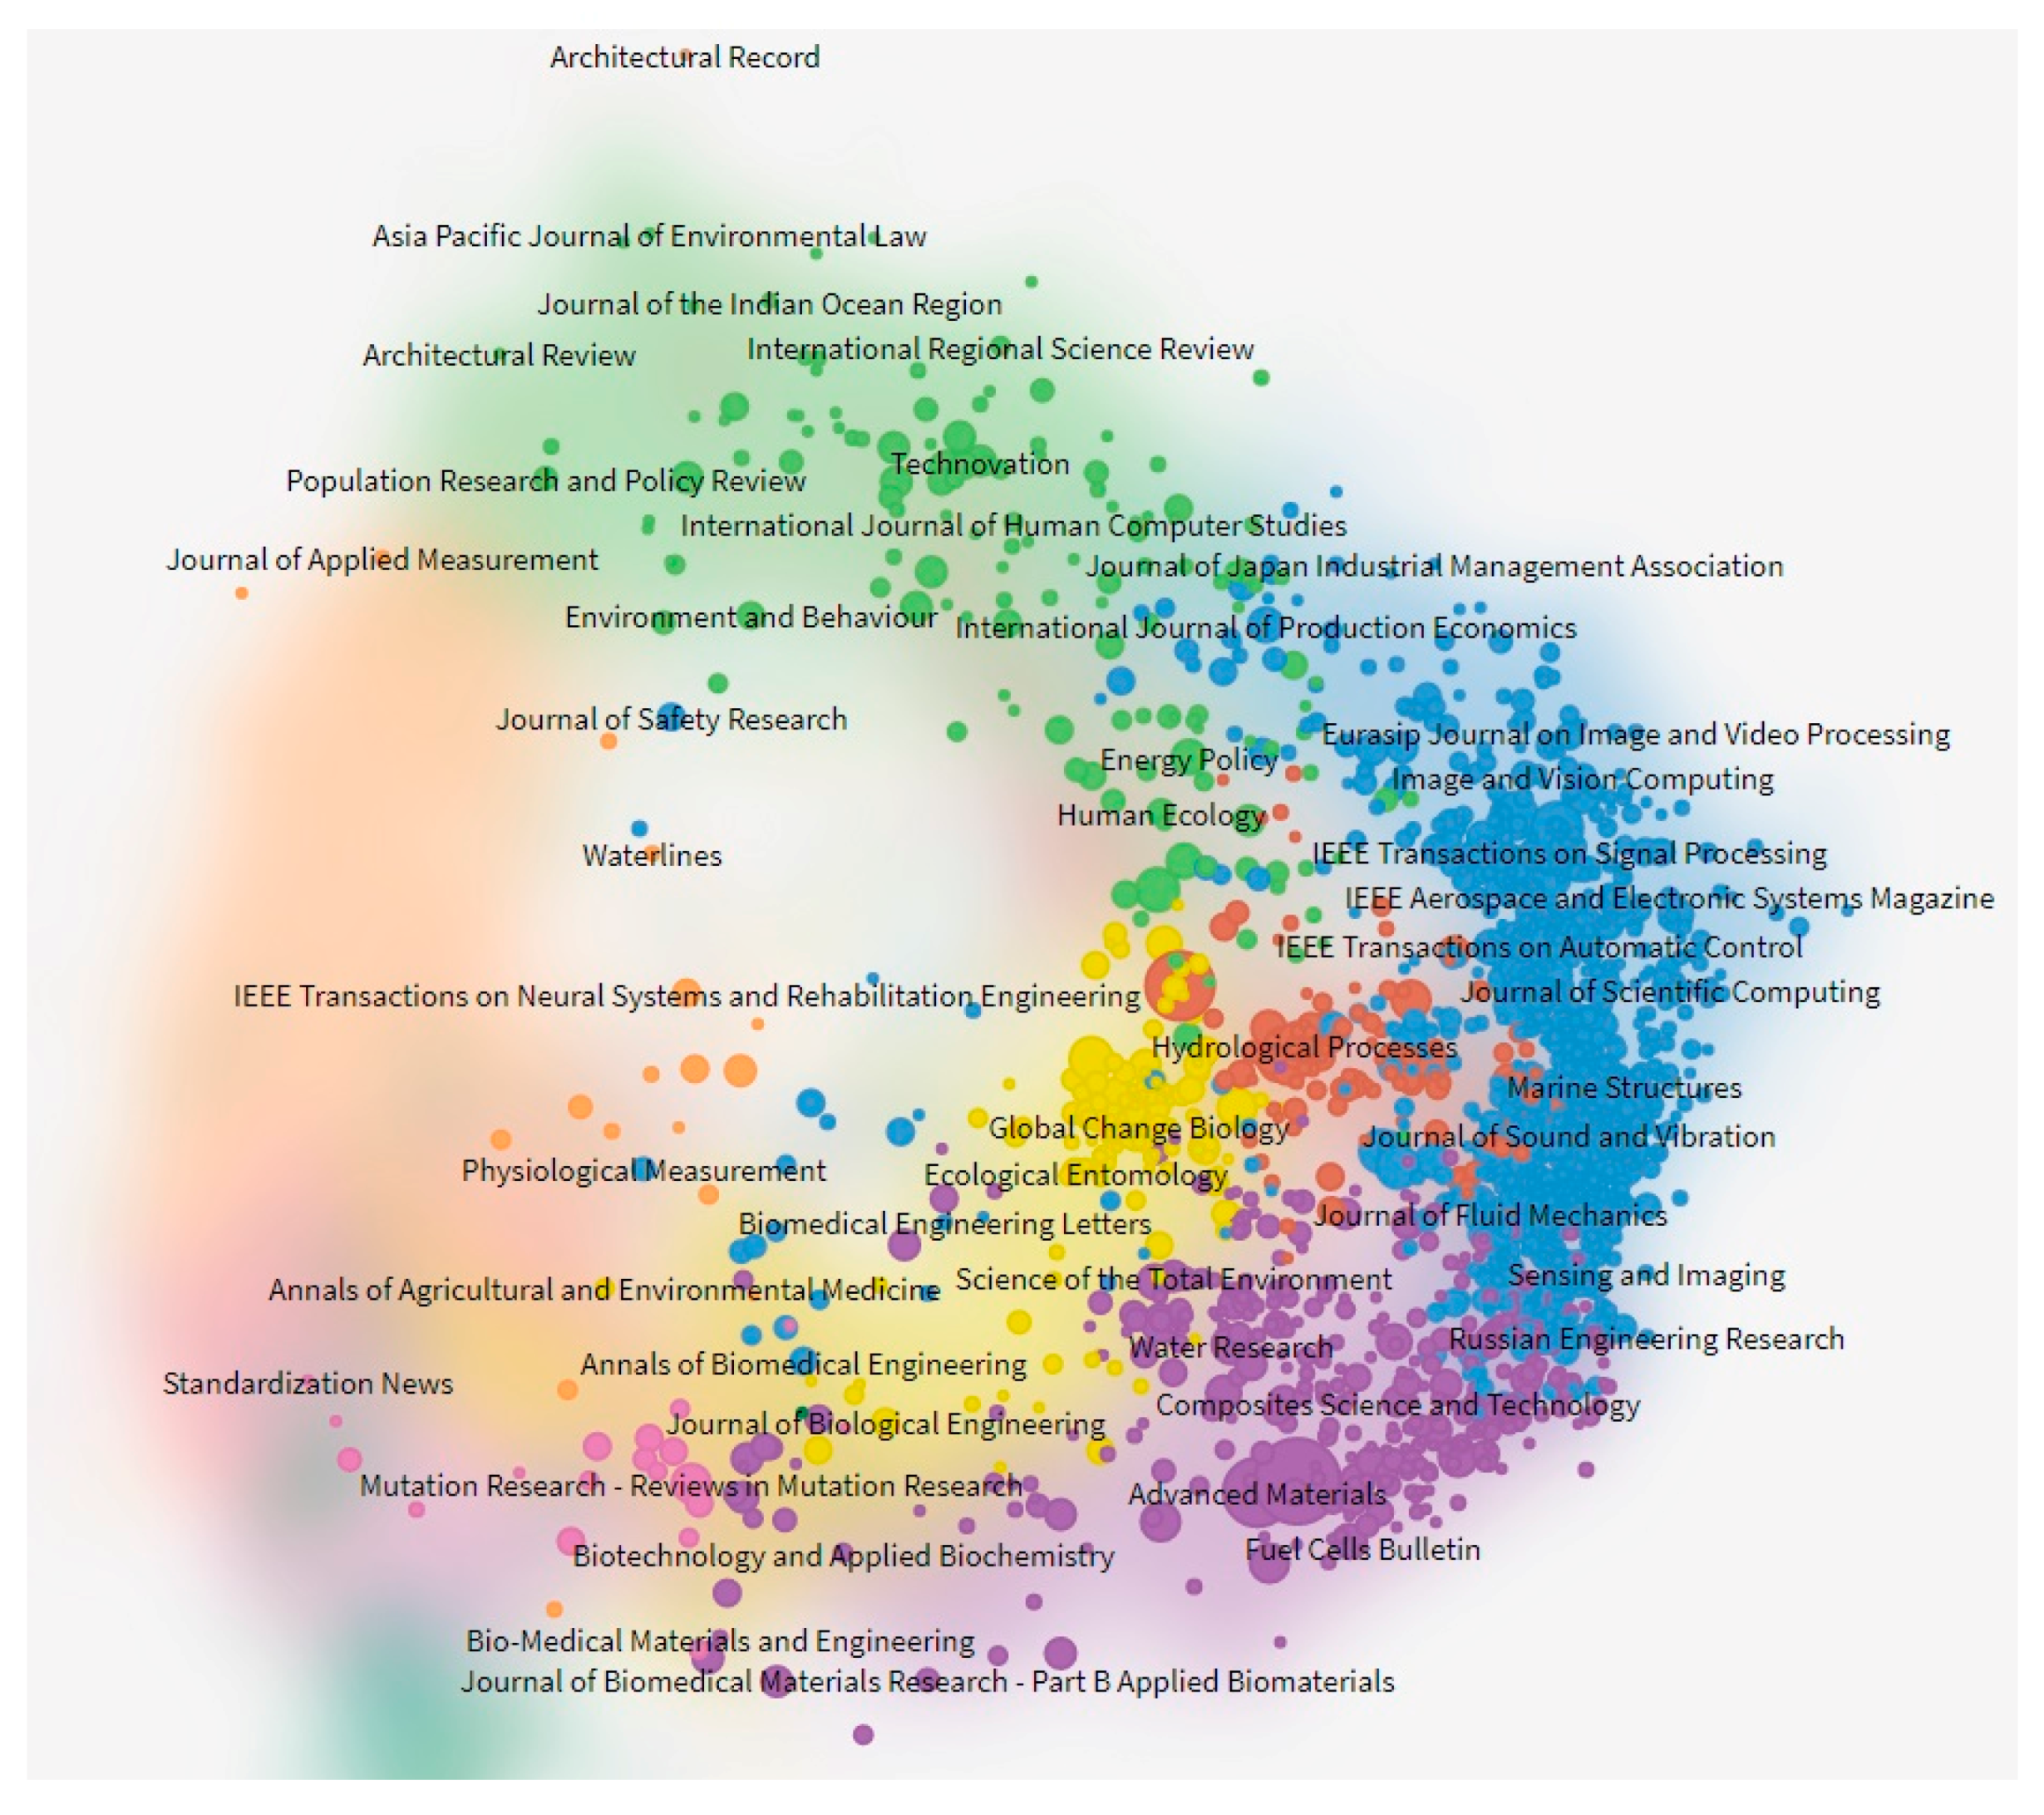
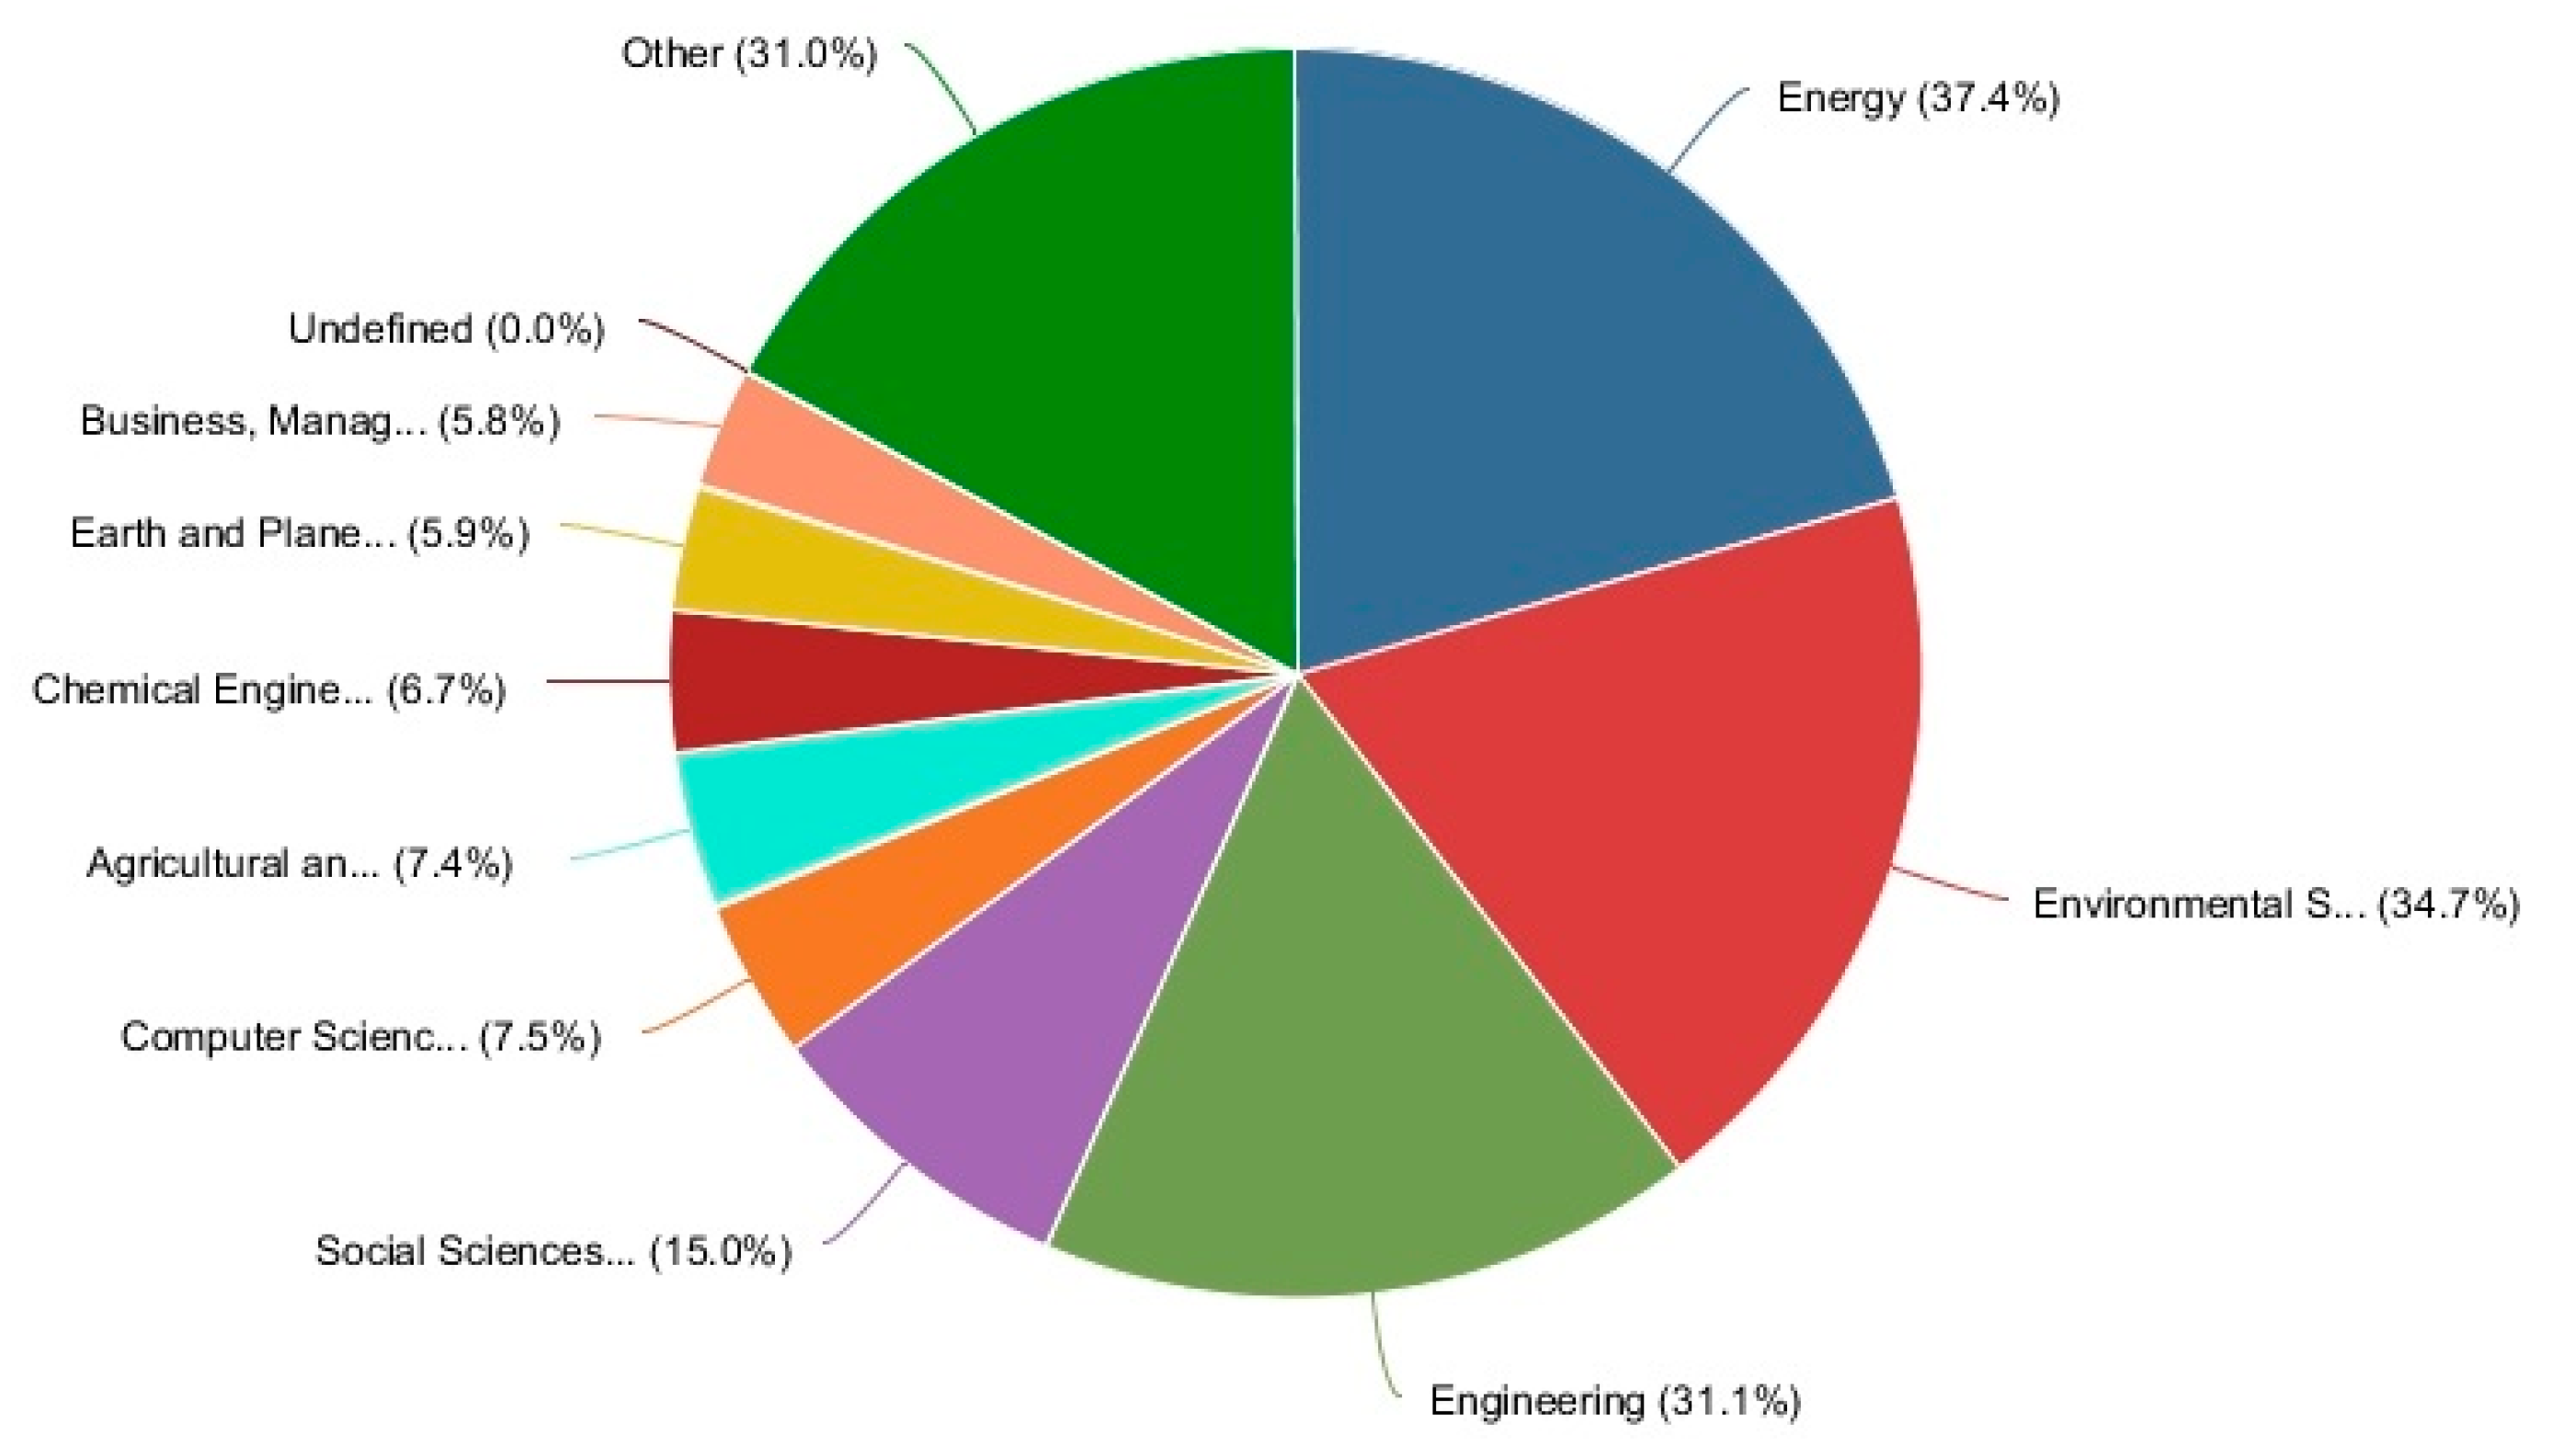
A broad scope of data concerning to the international input to the scientific knowledge of urban generation of renewable energy during the period 1977–2017 has been traced. The data found in more than ten categories have been collected, yielding a total of 46,172 publications. The categories Energy, Environmental Sciences and Engineering stand out, which experienced an exponential growth.
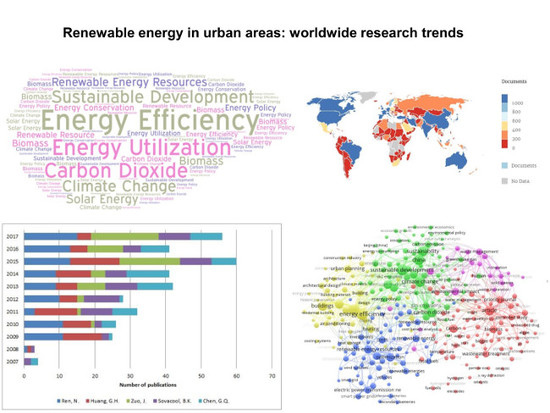
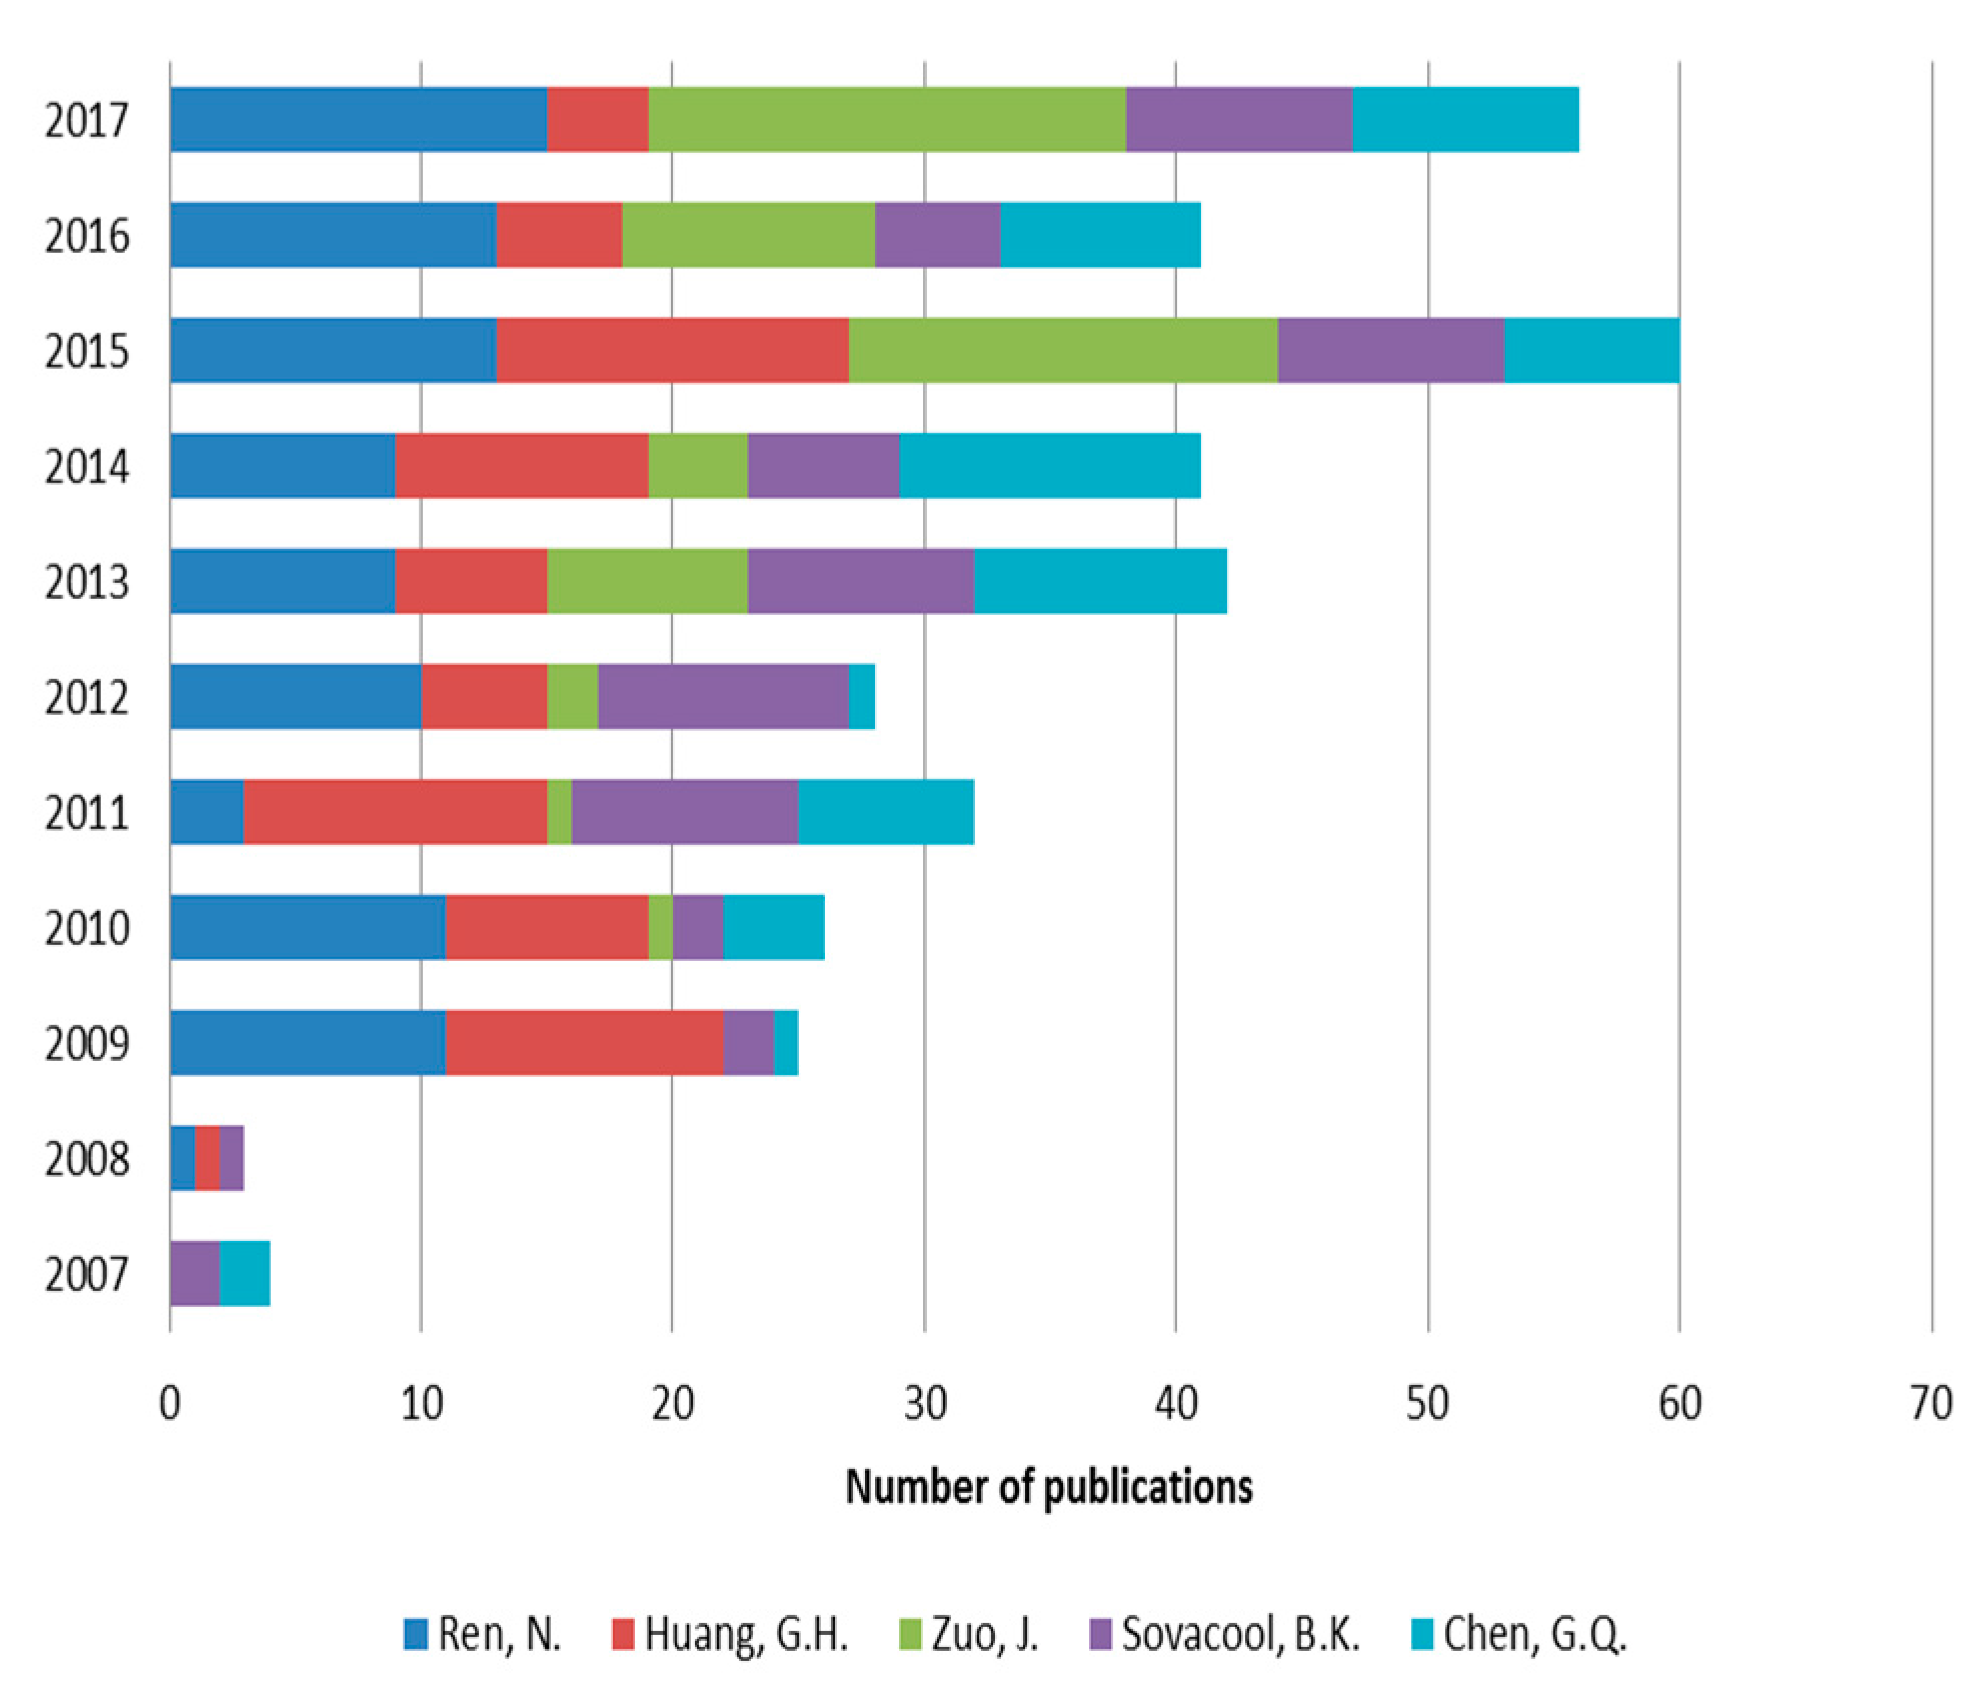
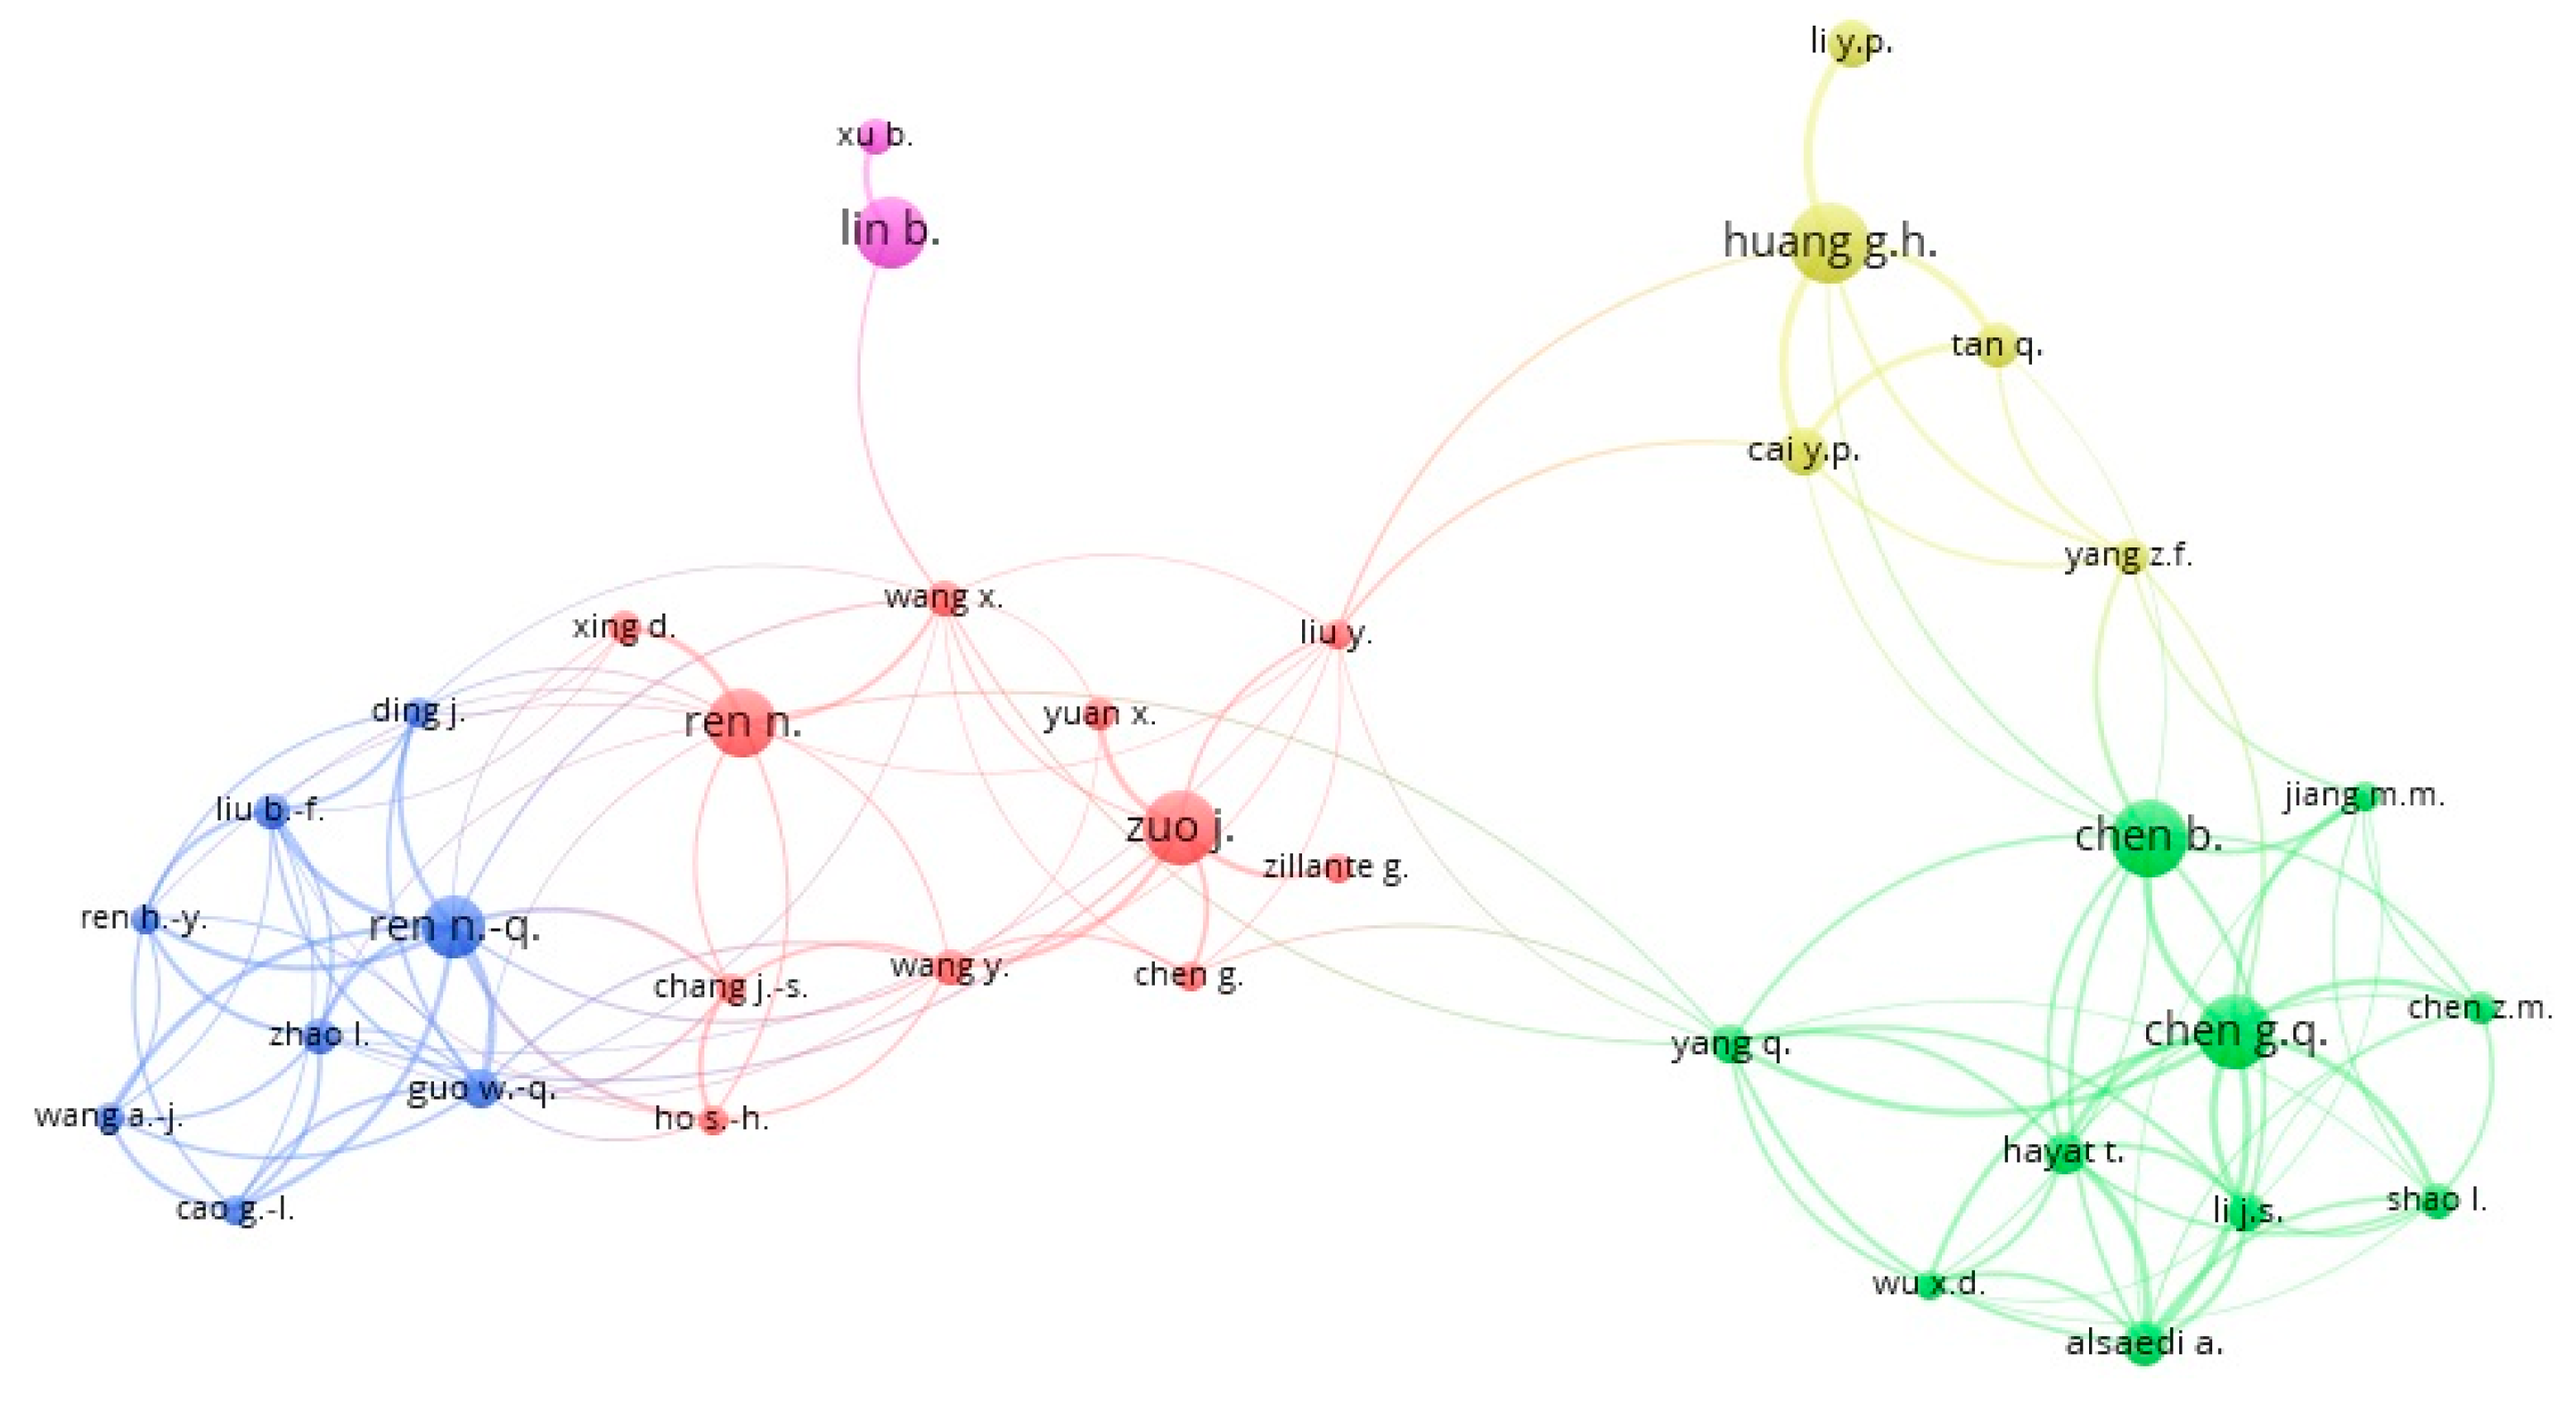
It is pinpointed 2017 as the richest year in scientific production with 9242 publications in all, being the magazine Journal of Cleaner Production the one that accumulated the largest number of publications on the matter. As far as the authors are concerned, Ren, Huang, Zuo, Sovacool, and Chen concentrate the greatest part of the works in the analysed period.
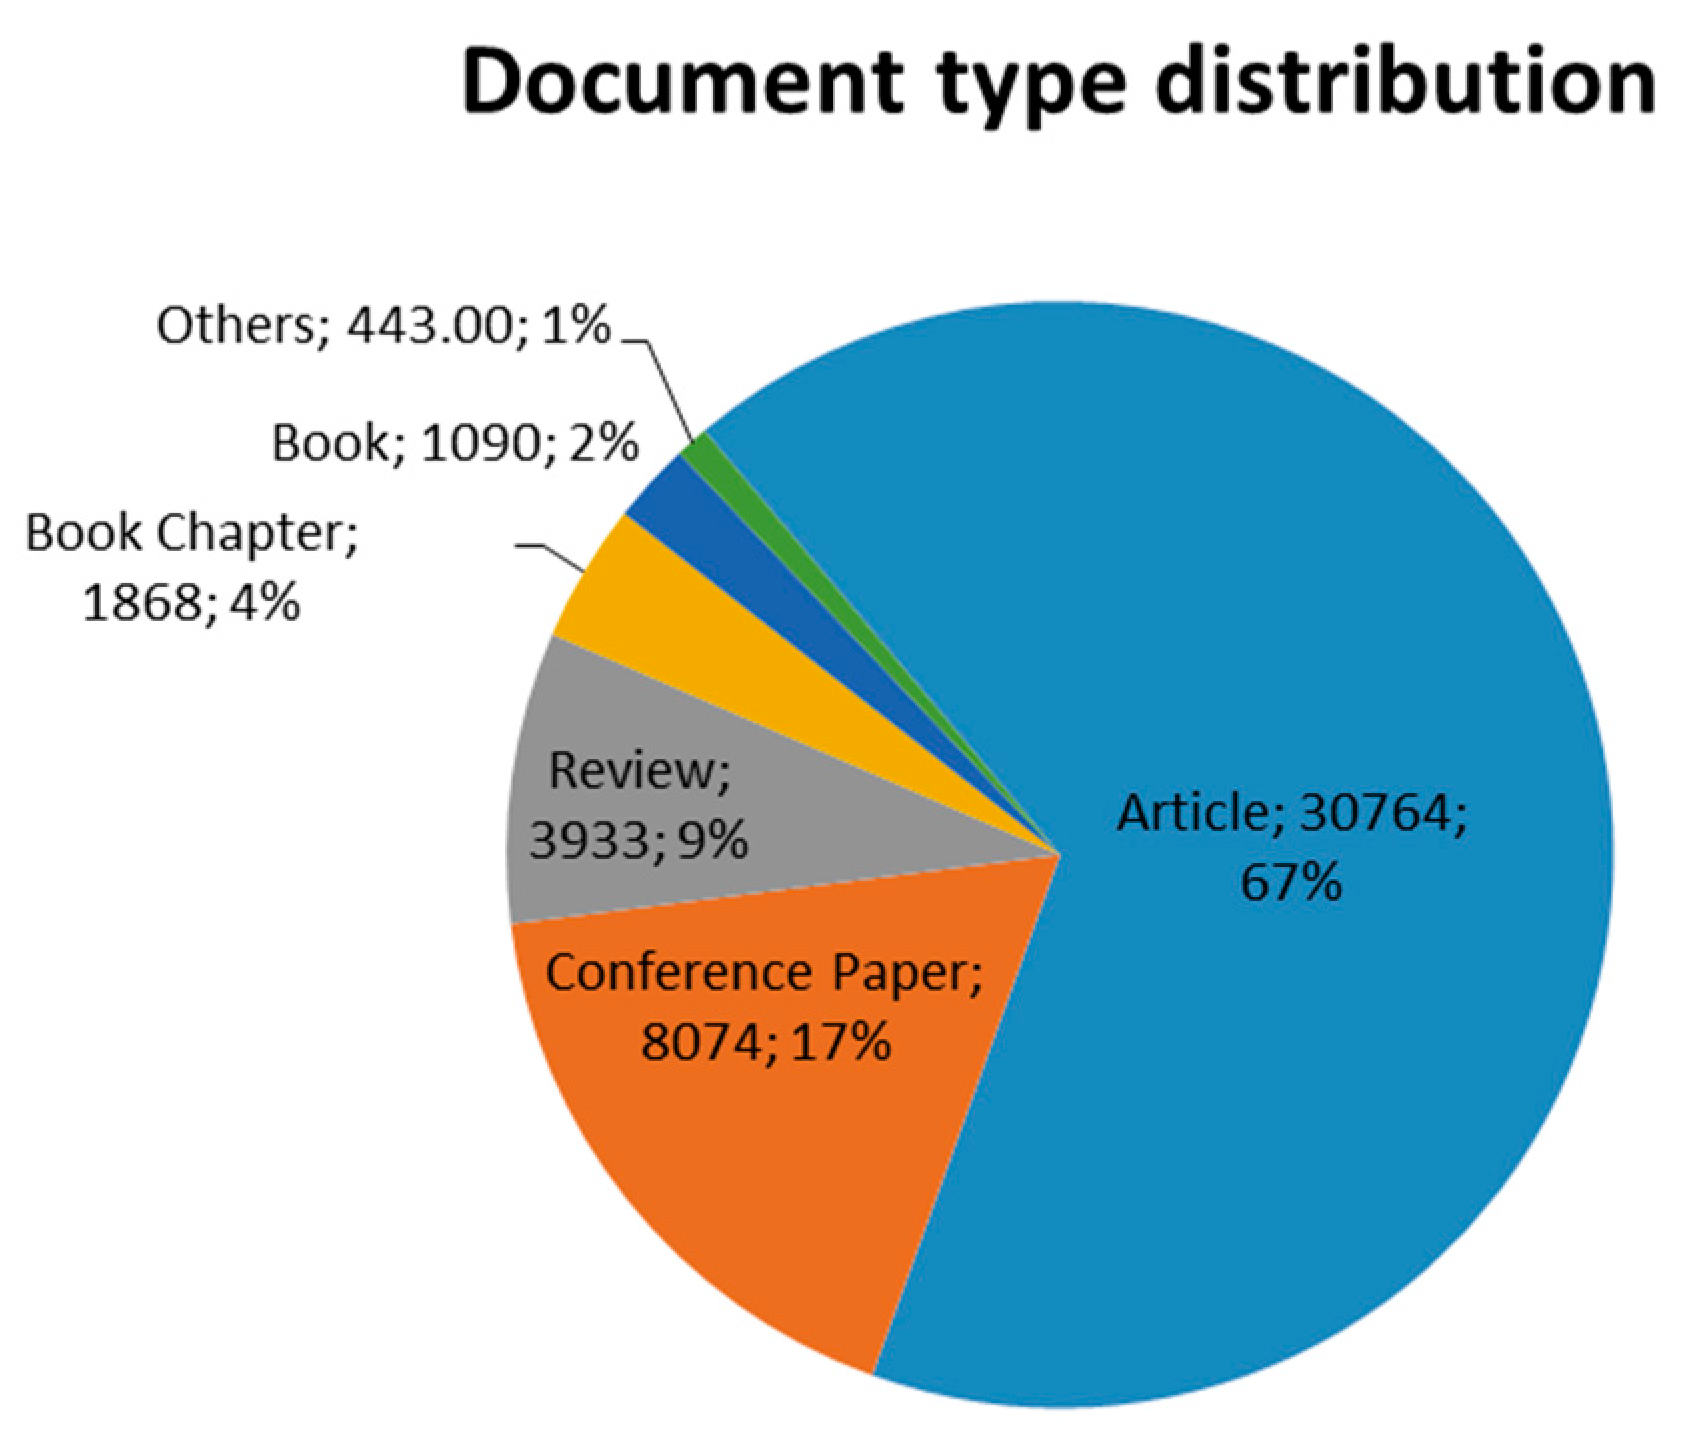
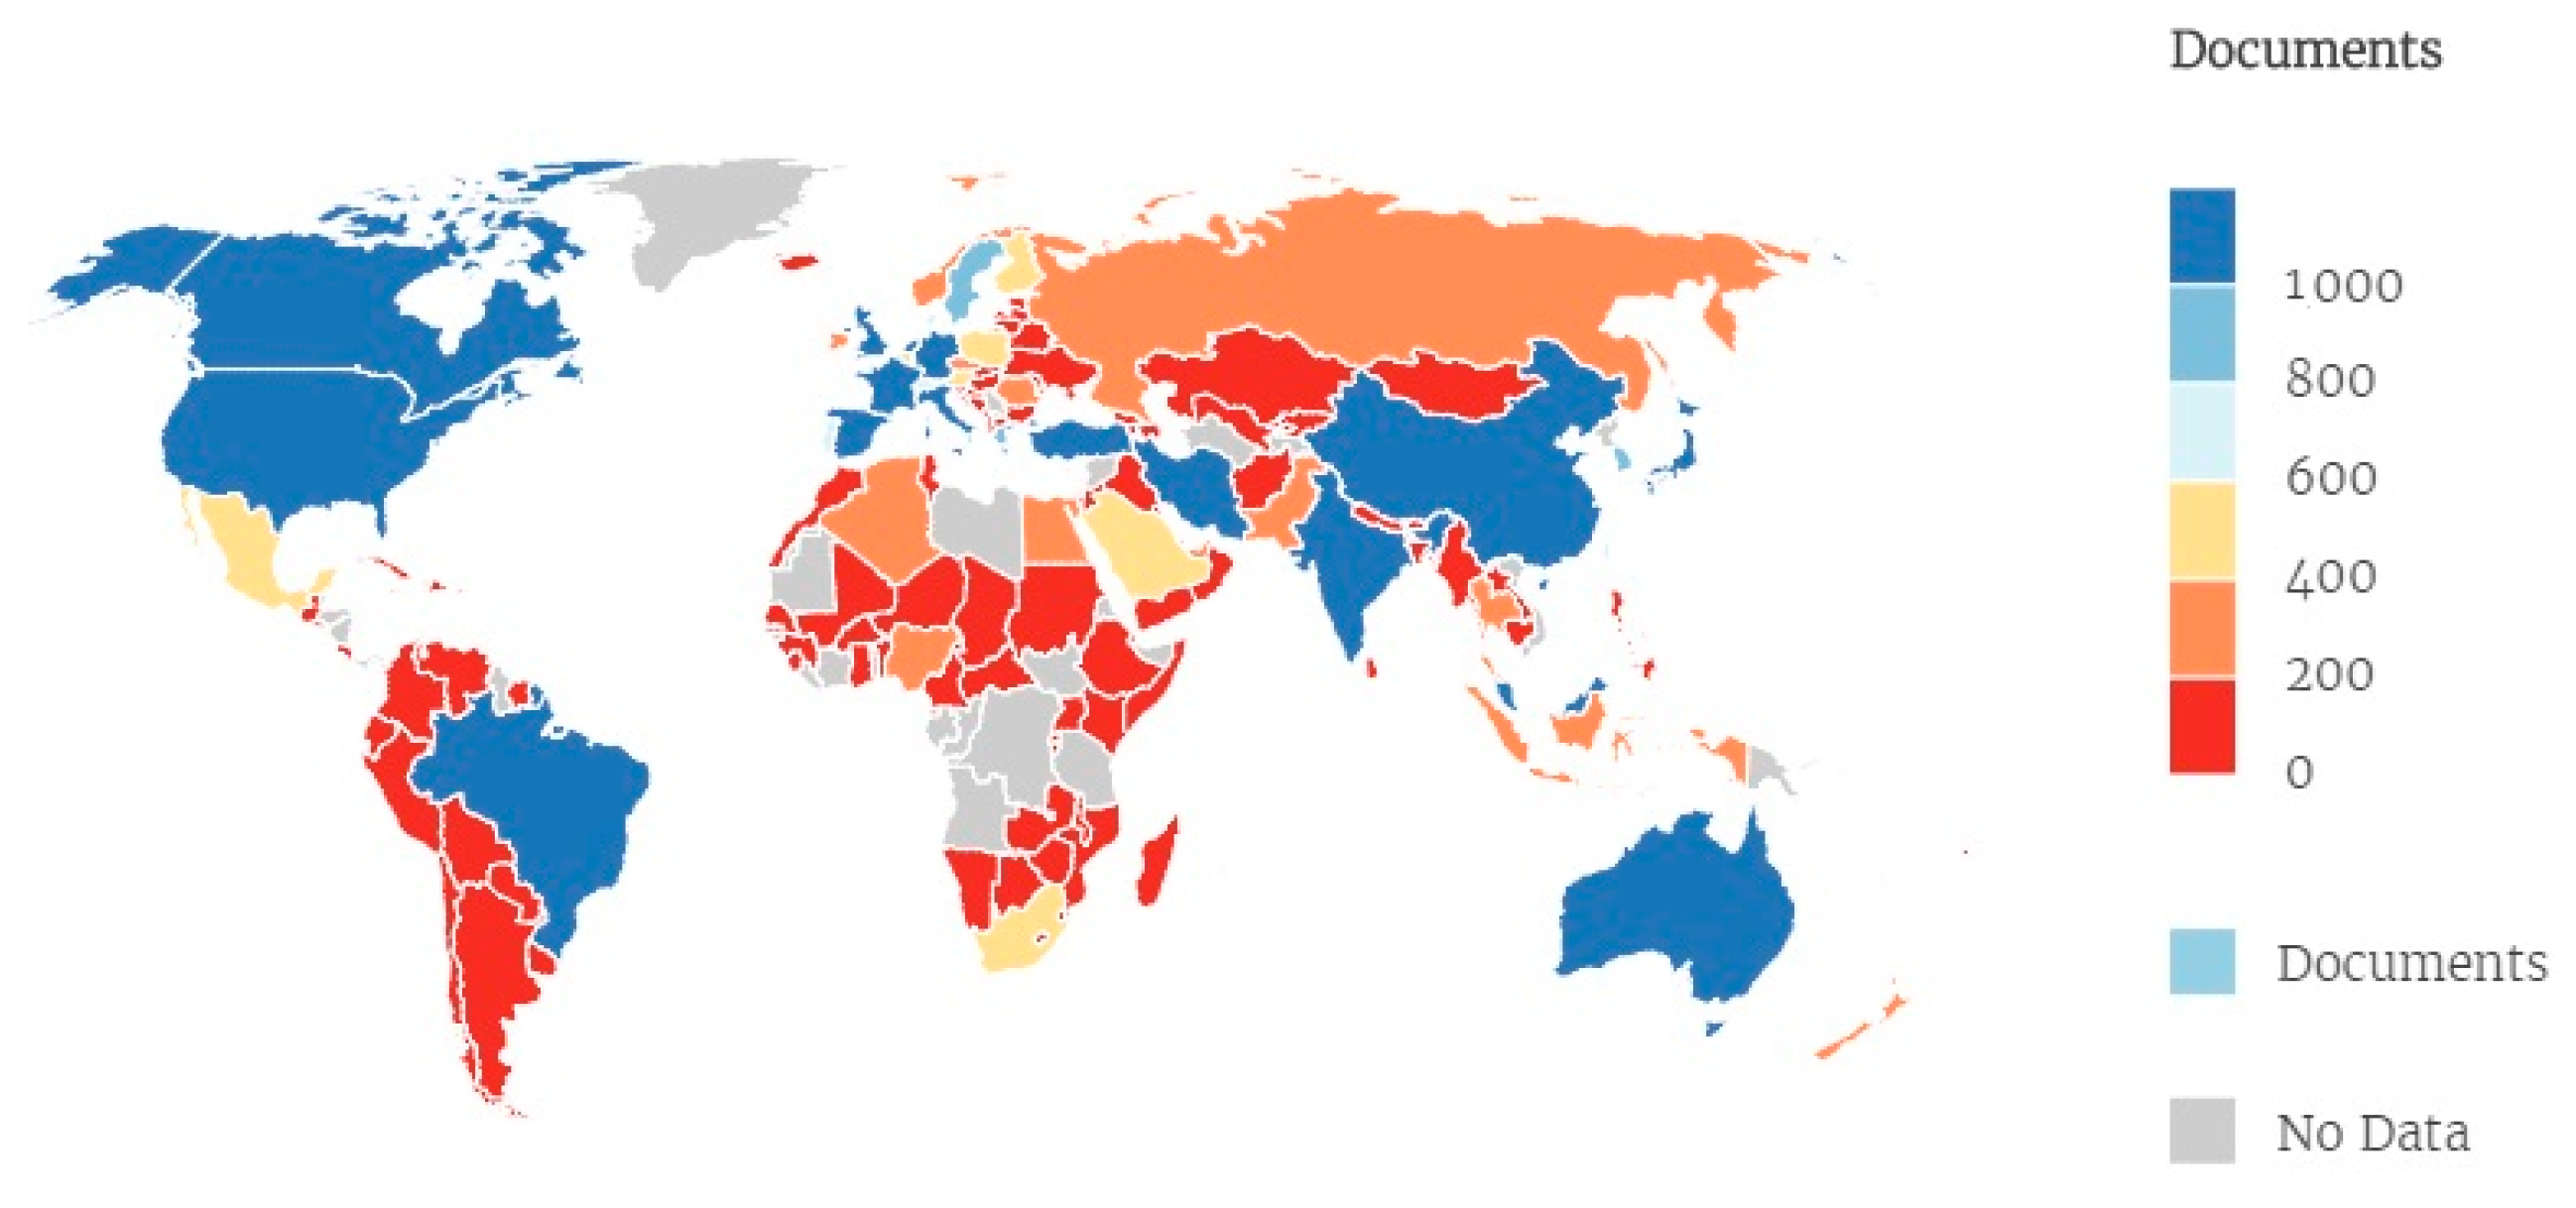
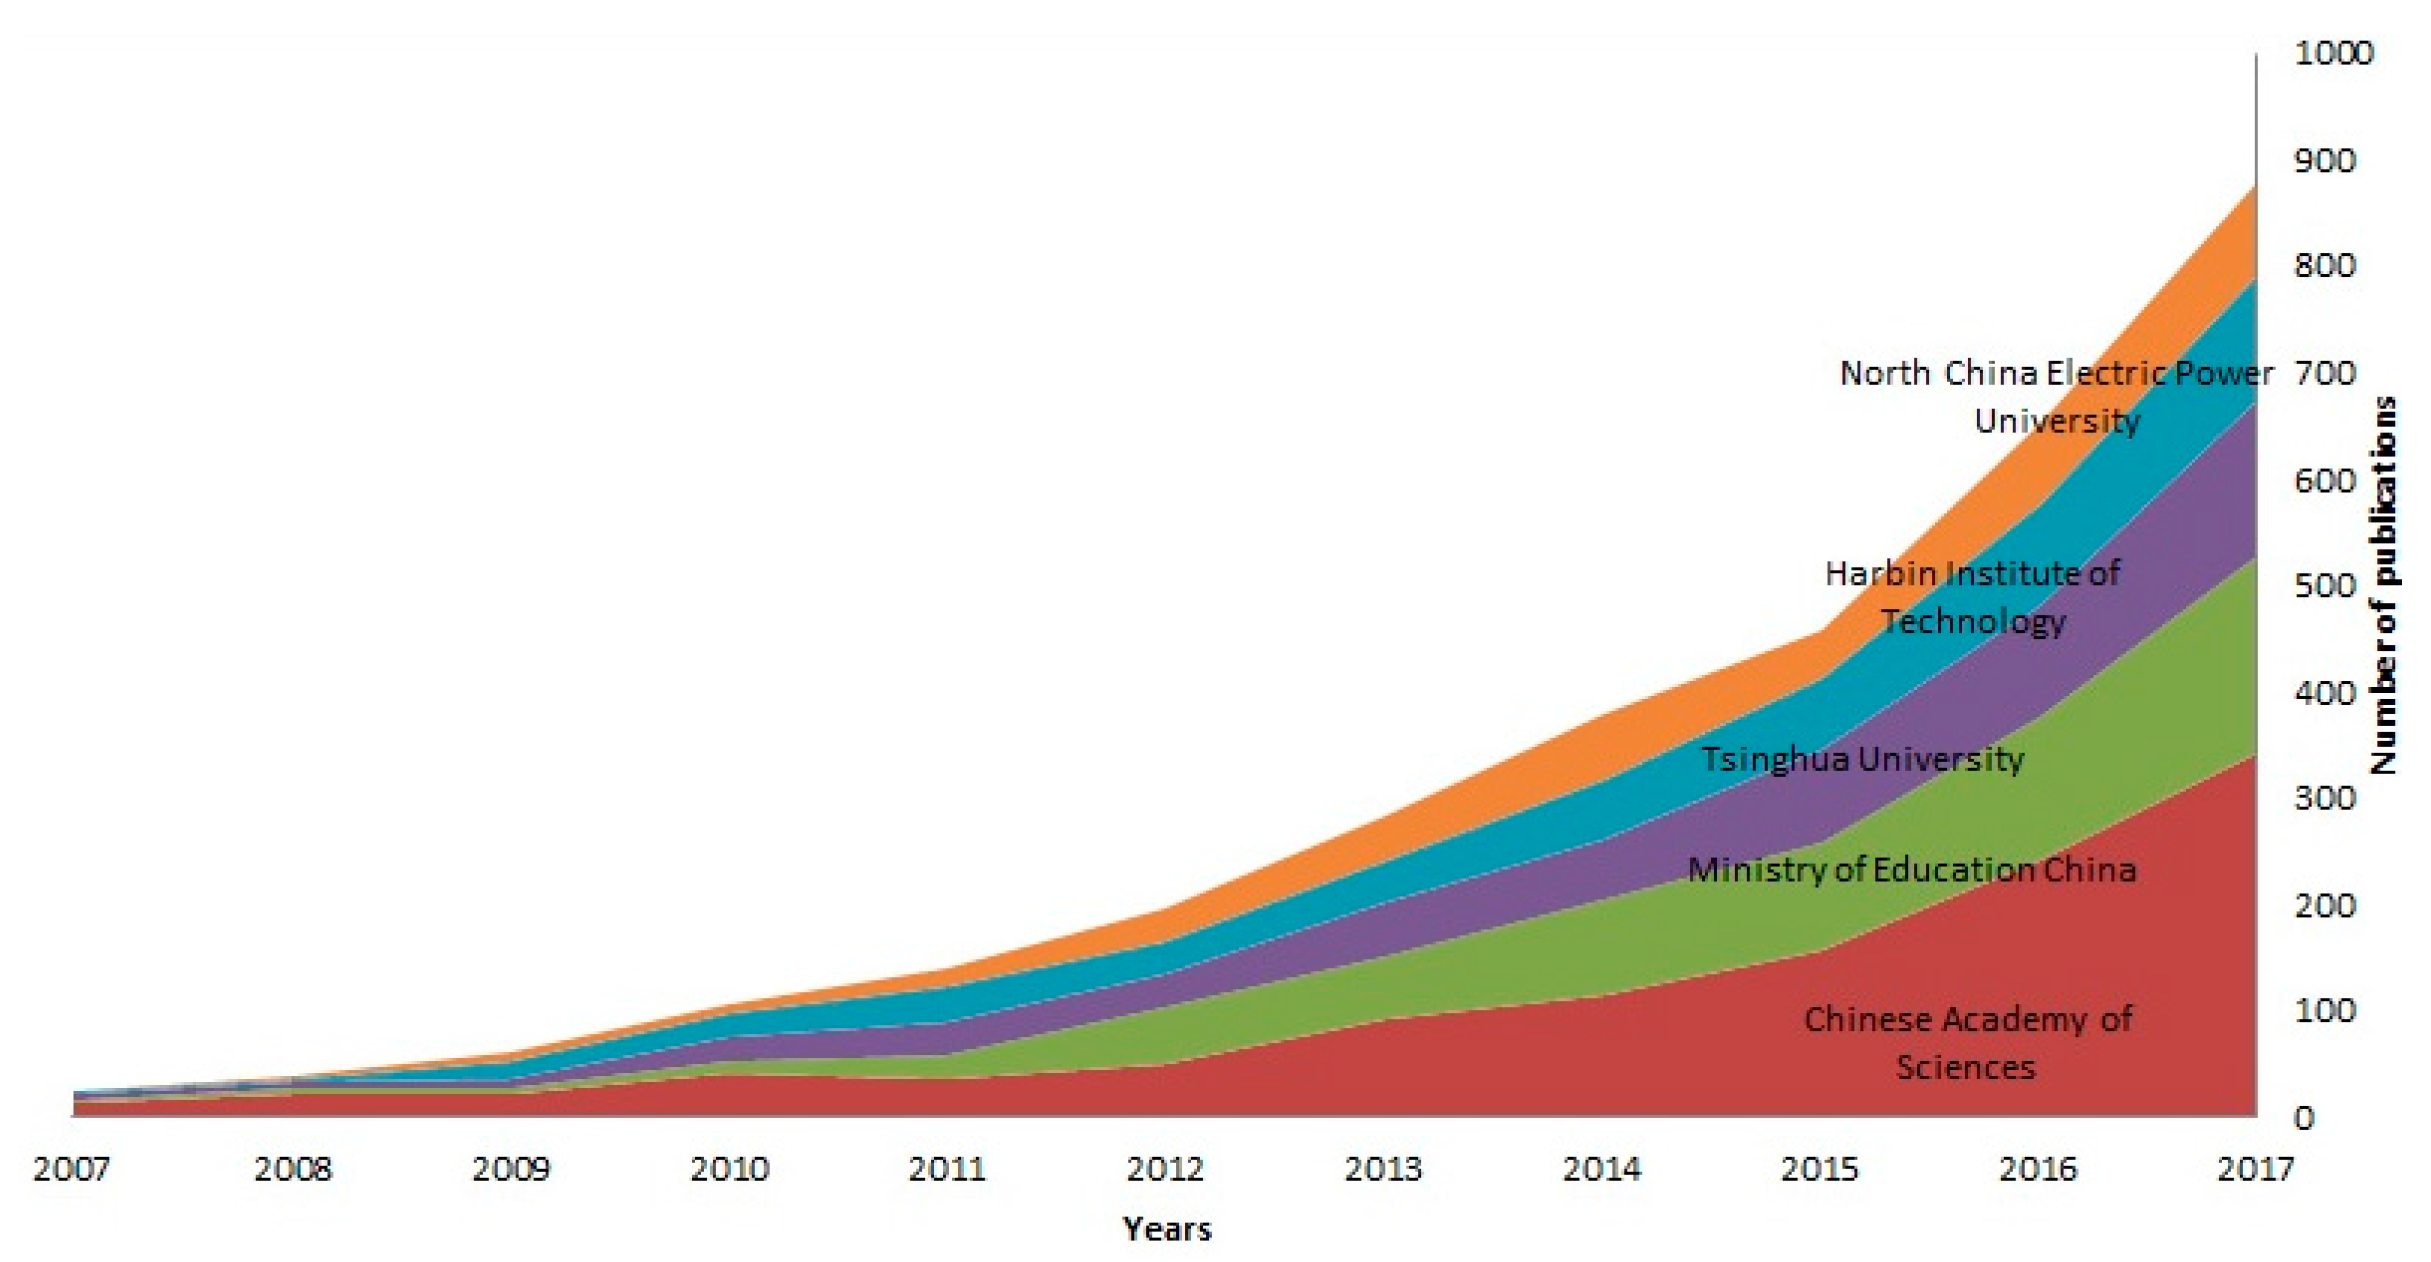
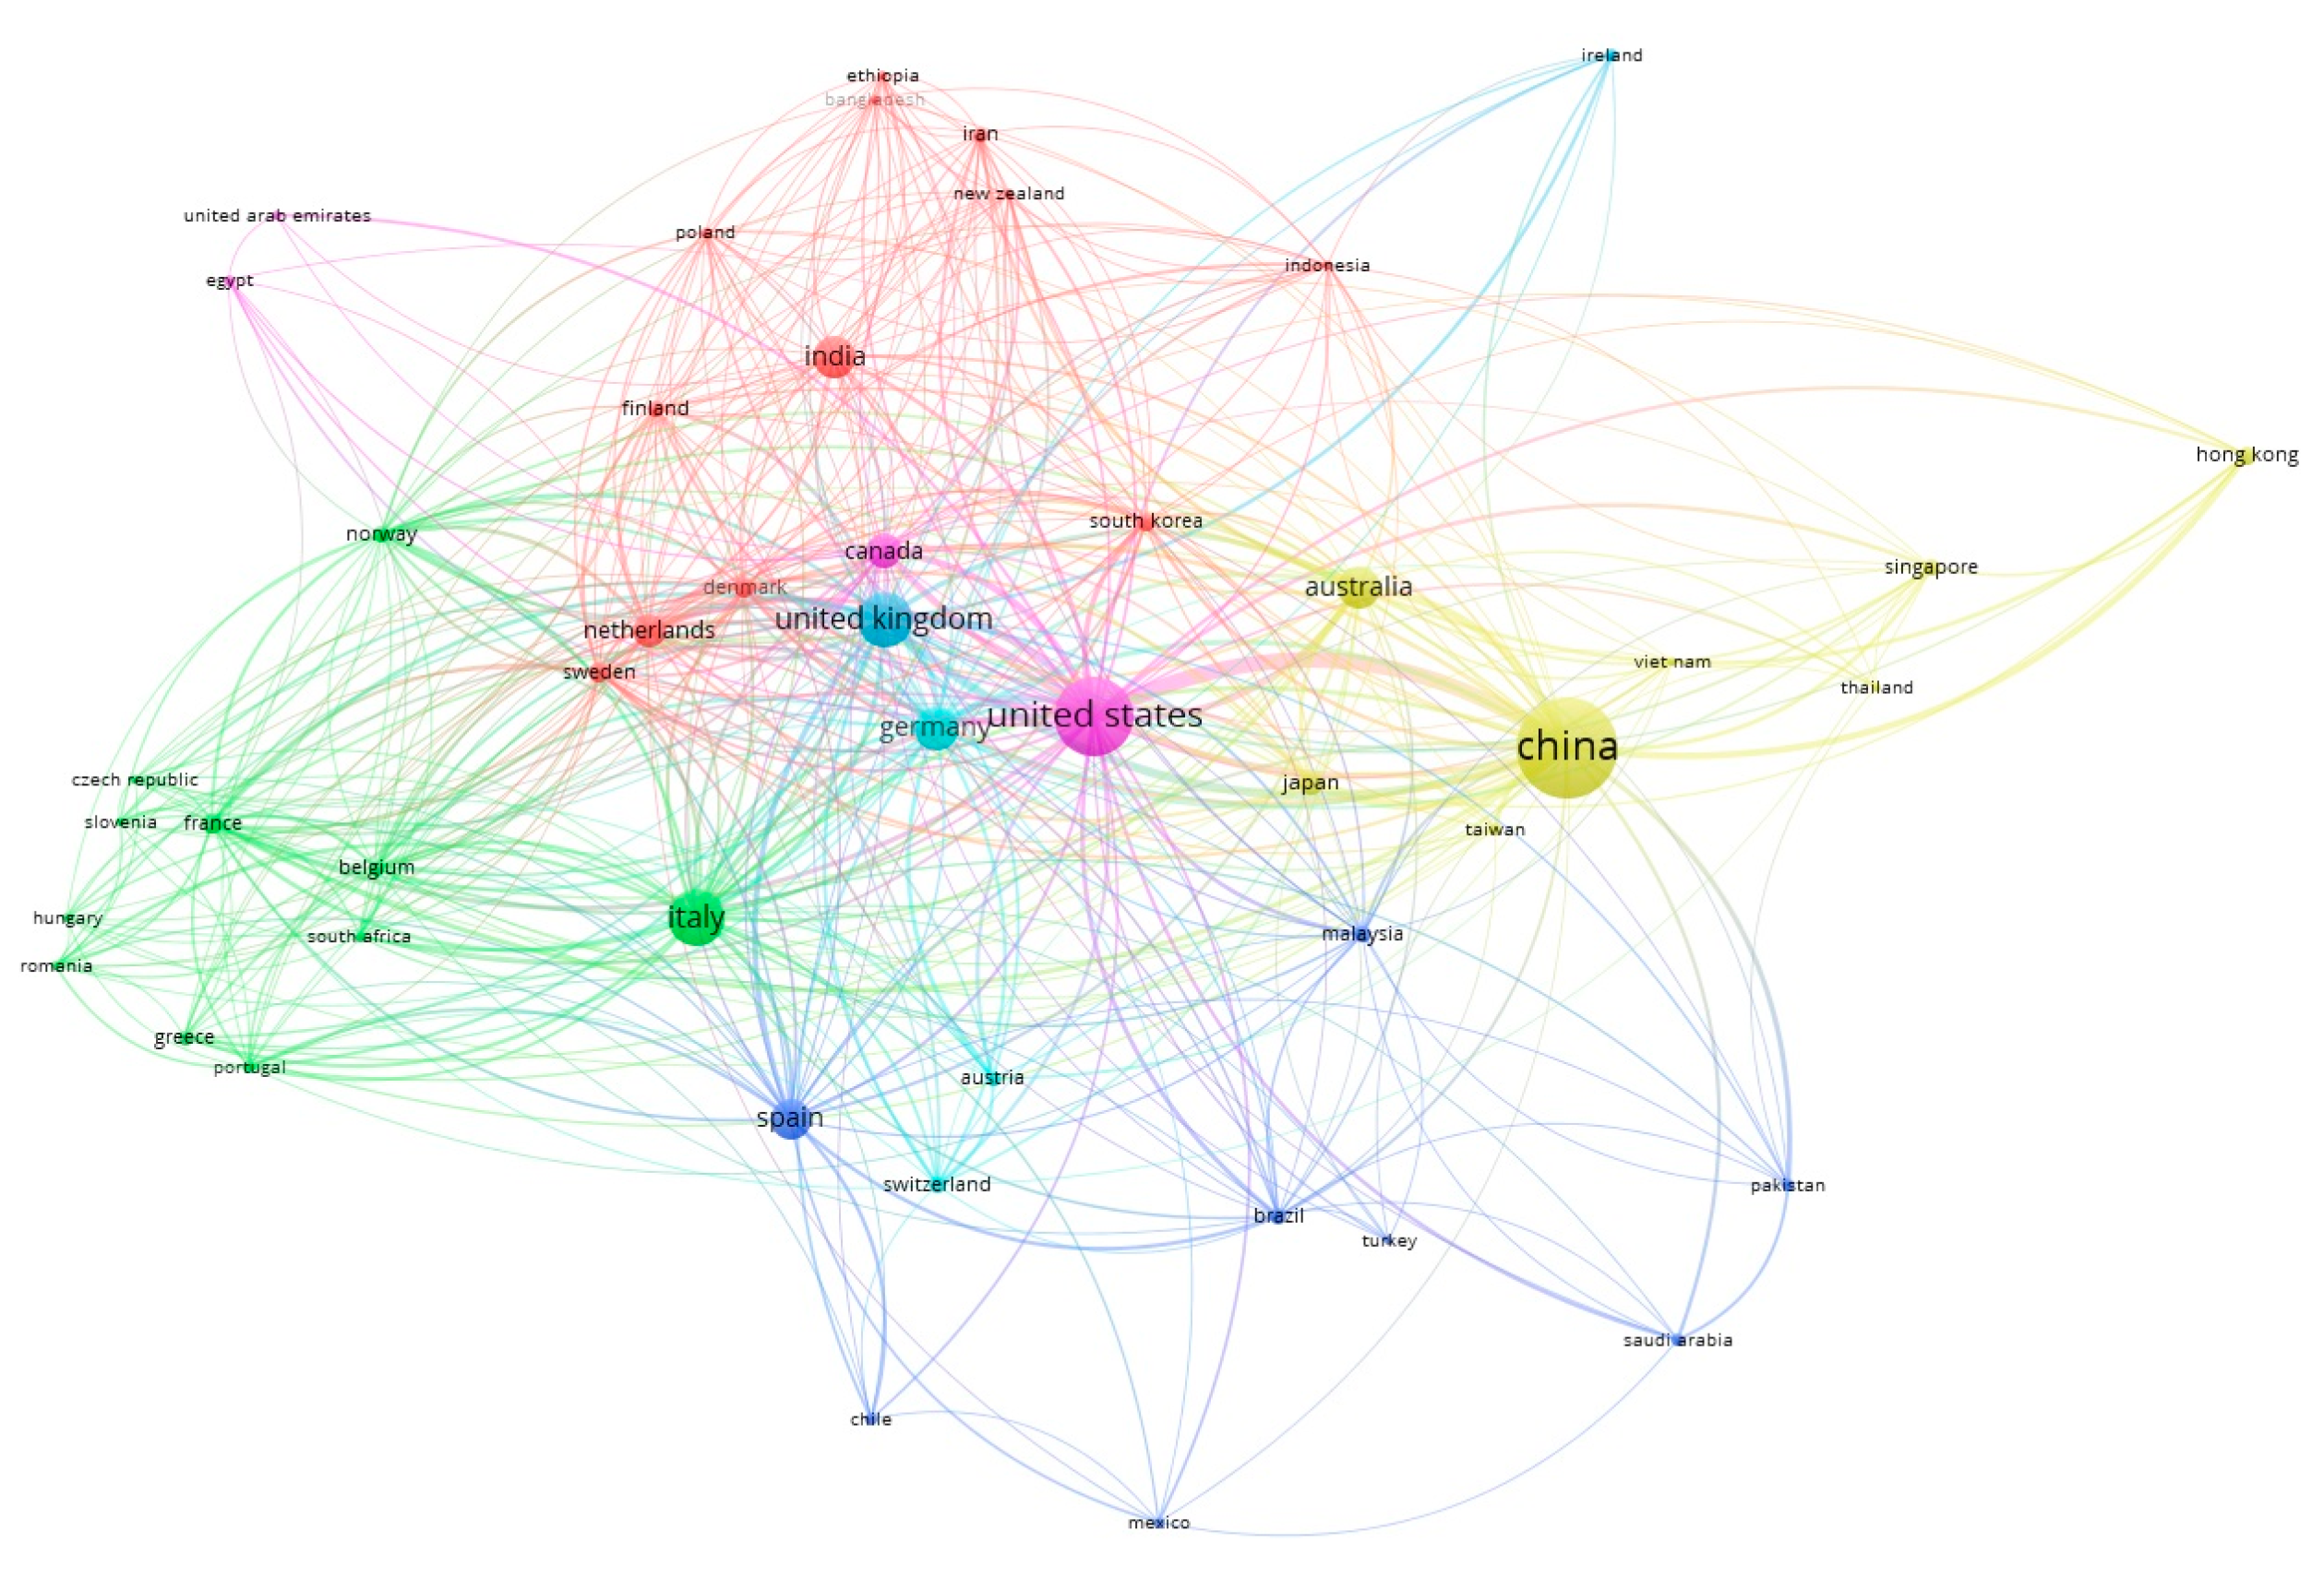
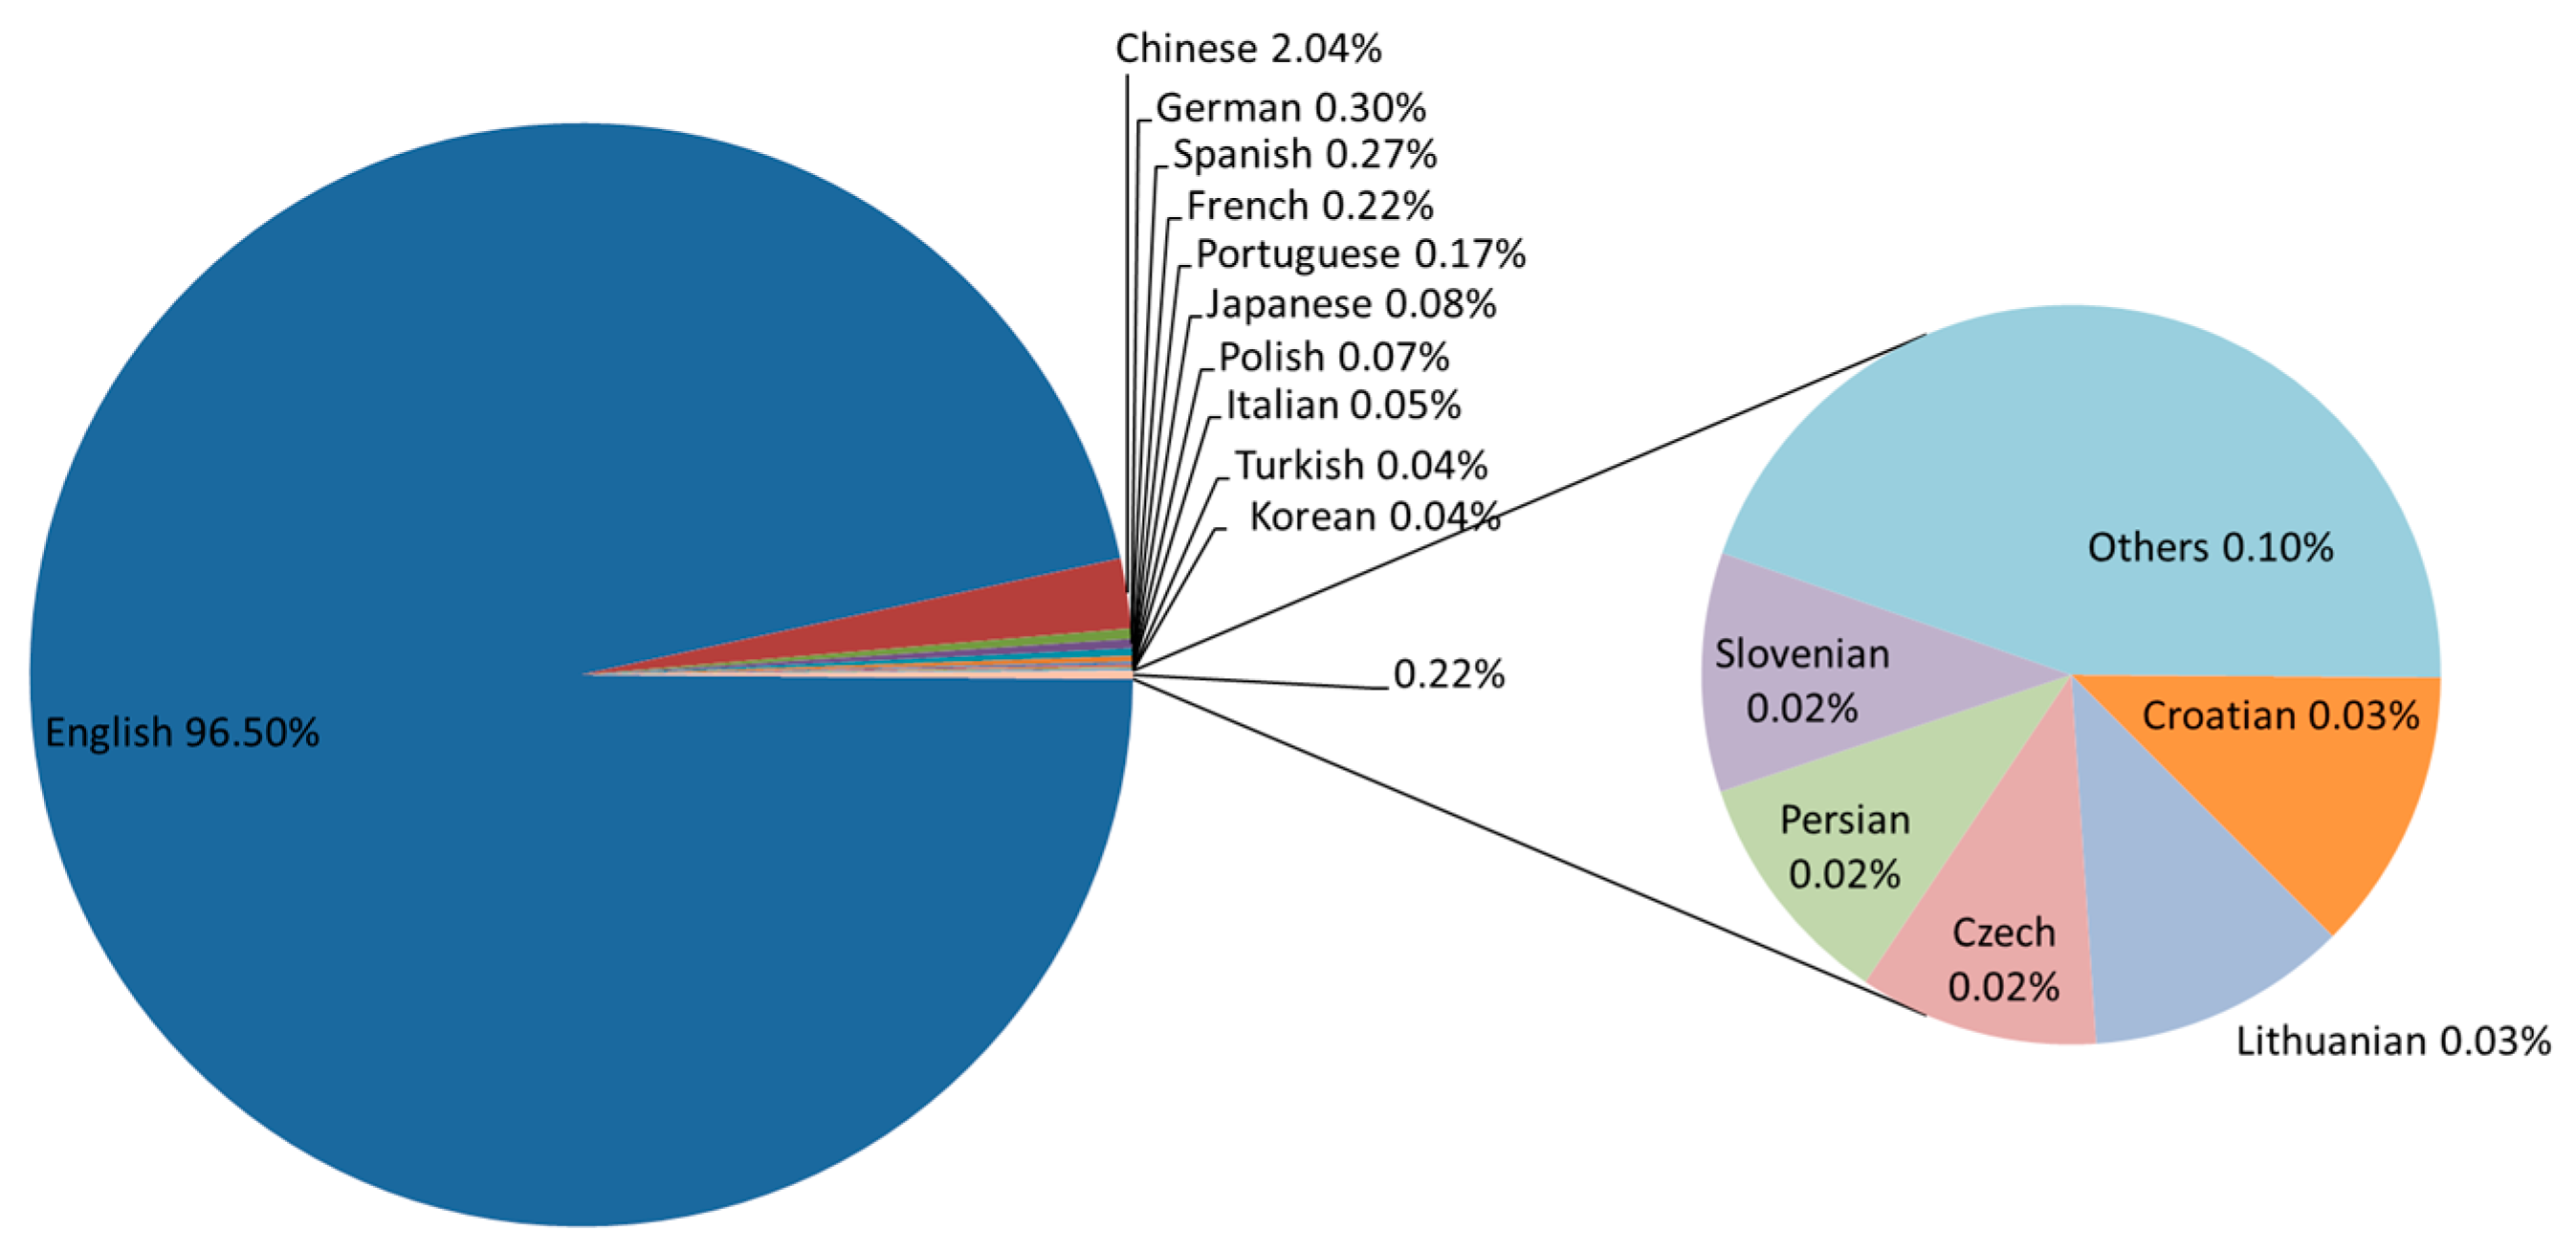
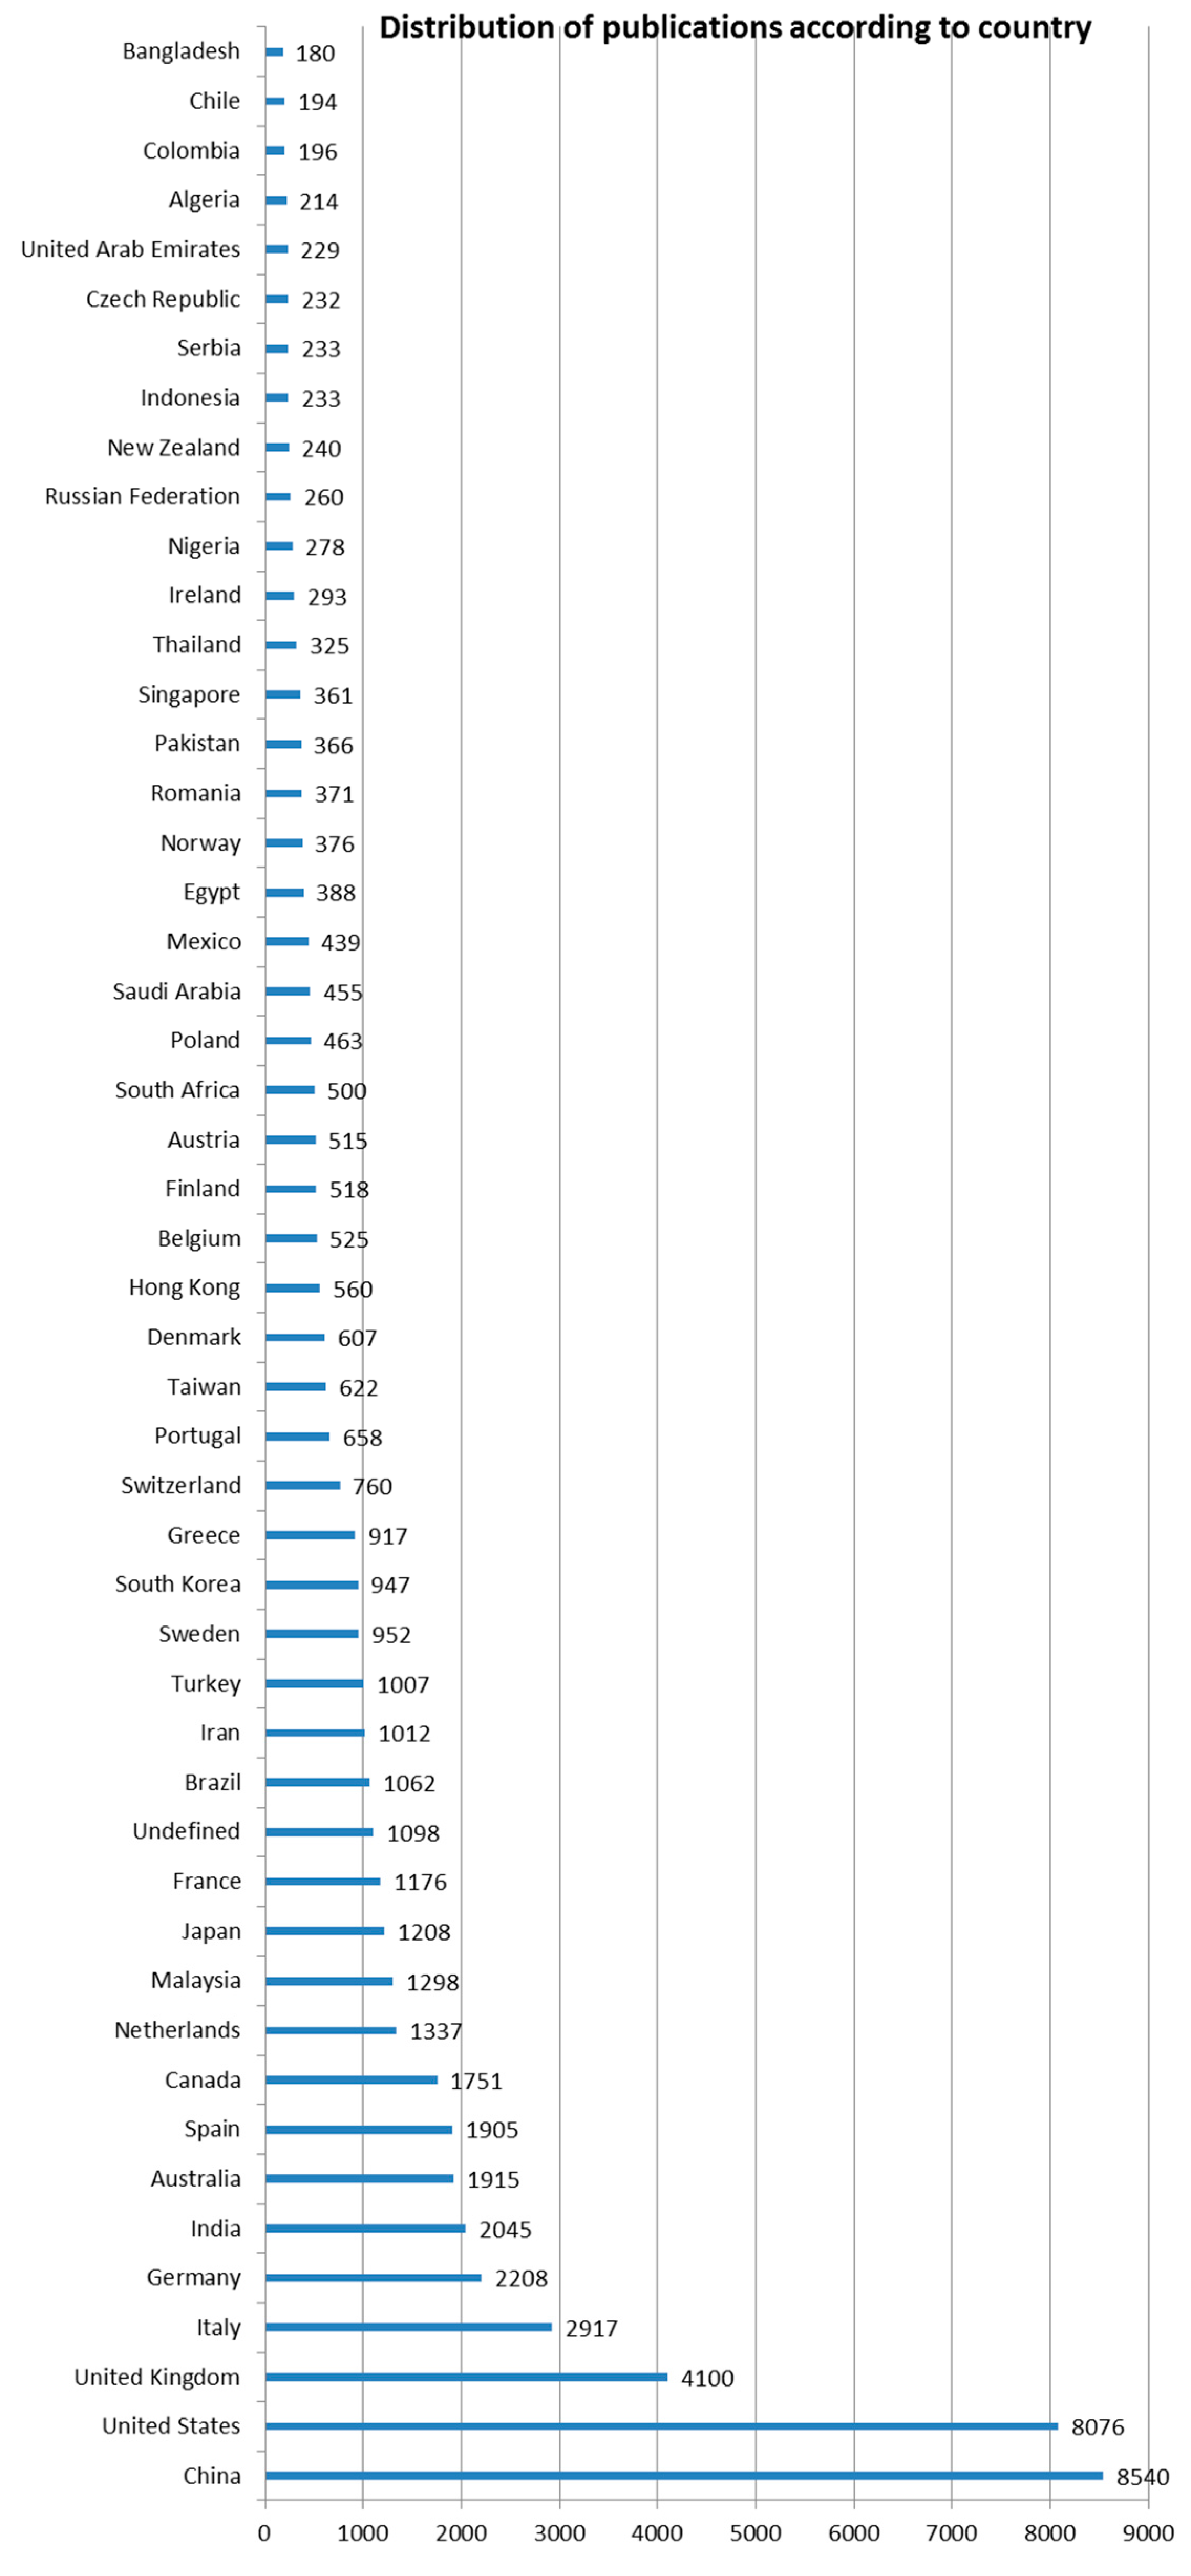
The works have been mostly released in international journals (76%) and congresses (17%), with English being the language used in more than 96.5% of the papers. Regarding the main institutions that have published most of the works in this field, stand out the Chinese Academy of Sciences, Ministry of Education of China, The University of Tsinghua and The Harbin Institute of Technology, which account for half of publications over the last decade. All these institutions (7 of the top ten) are located in China, which demonstrates the great awareness in this country about renewable energy in urban areas.
In mainland Europe, the United Kingdom, Italy, Germany, Spain, Netherlands and France highlight as the main research countries in this field, with the United Kingdom representing 23.06% of the total number of publications in European countries.
Table 6 shows information obtained from both, the World Bank and Scopus database [52]. China is the country with more documents published, however is important to see that Netherlands has the most number of researchers in Research and Development (R&D) per million people. Considering this, the ratio between these variables shows that Netherlands is the leader with 3.40 documents published per million people spending 2.0% of Gross Domestic Product (GDP) in R&D, however Germany is the country with the highest GDP in R&D with 2.9%. China only has 0.50 documents per million people and spend 2.1% of GDP, but is necessary to consider its population.
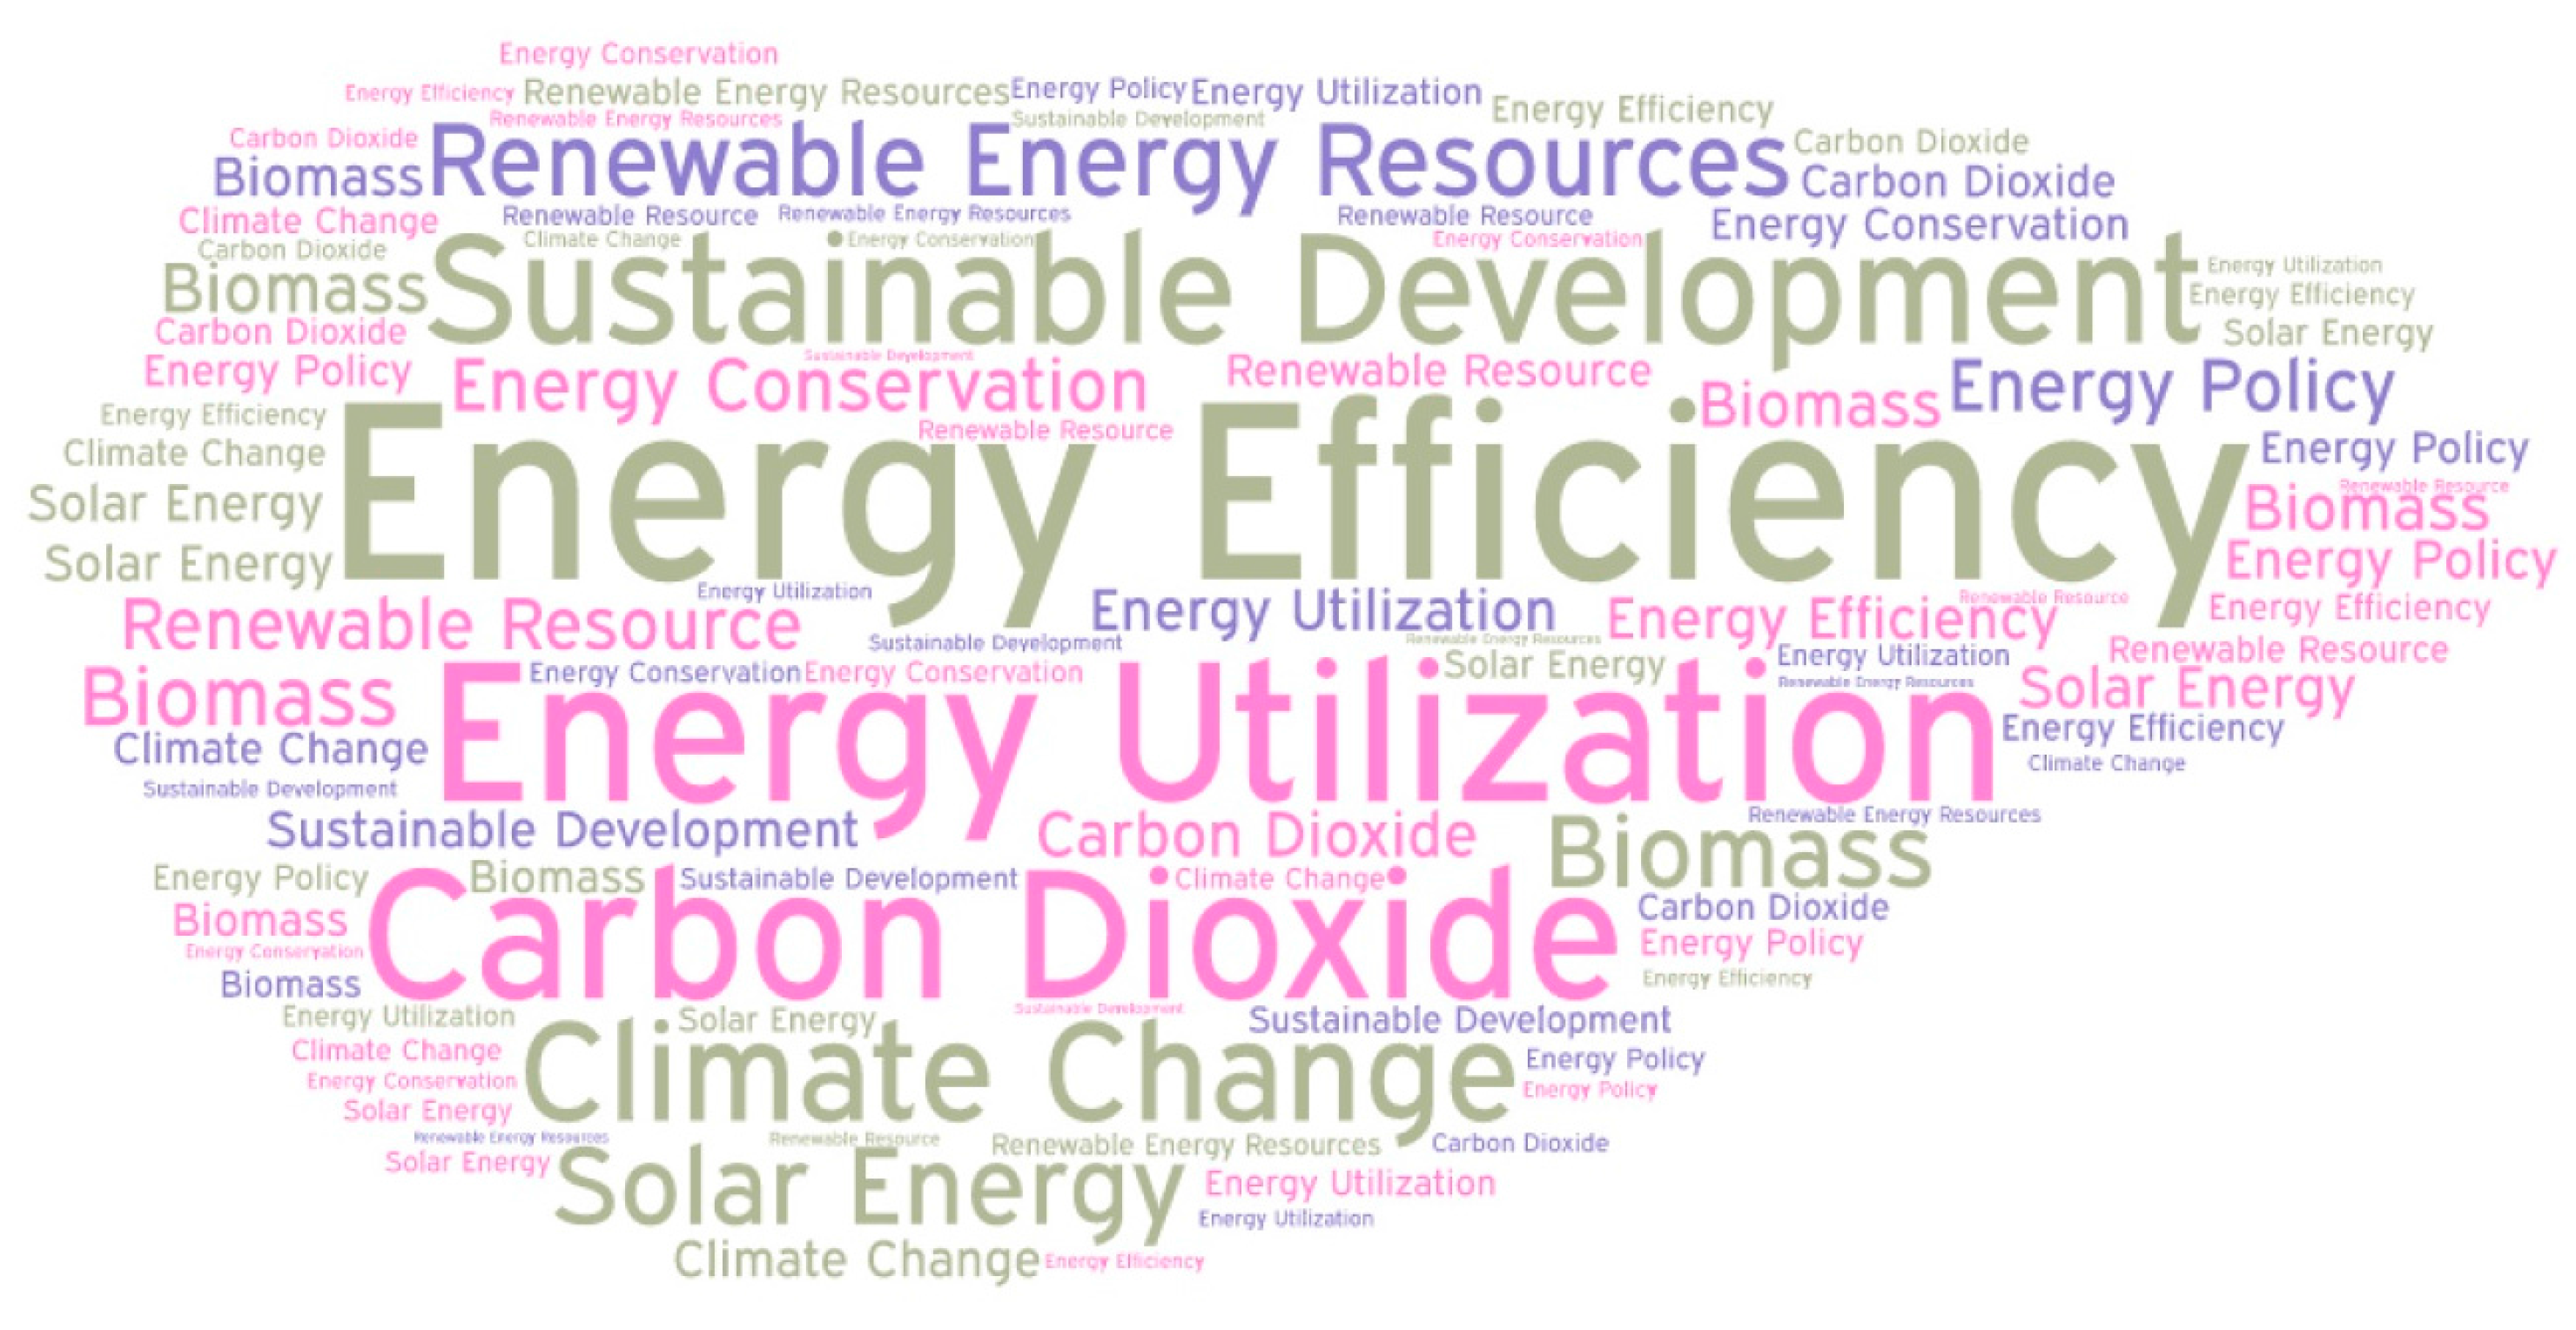
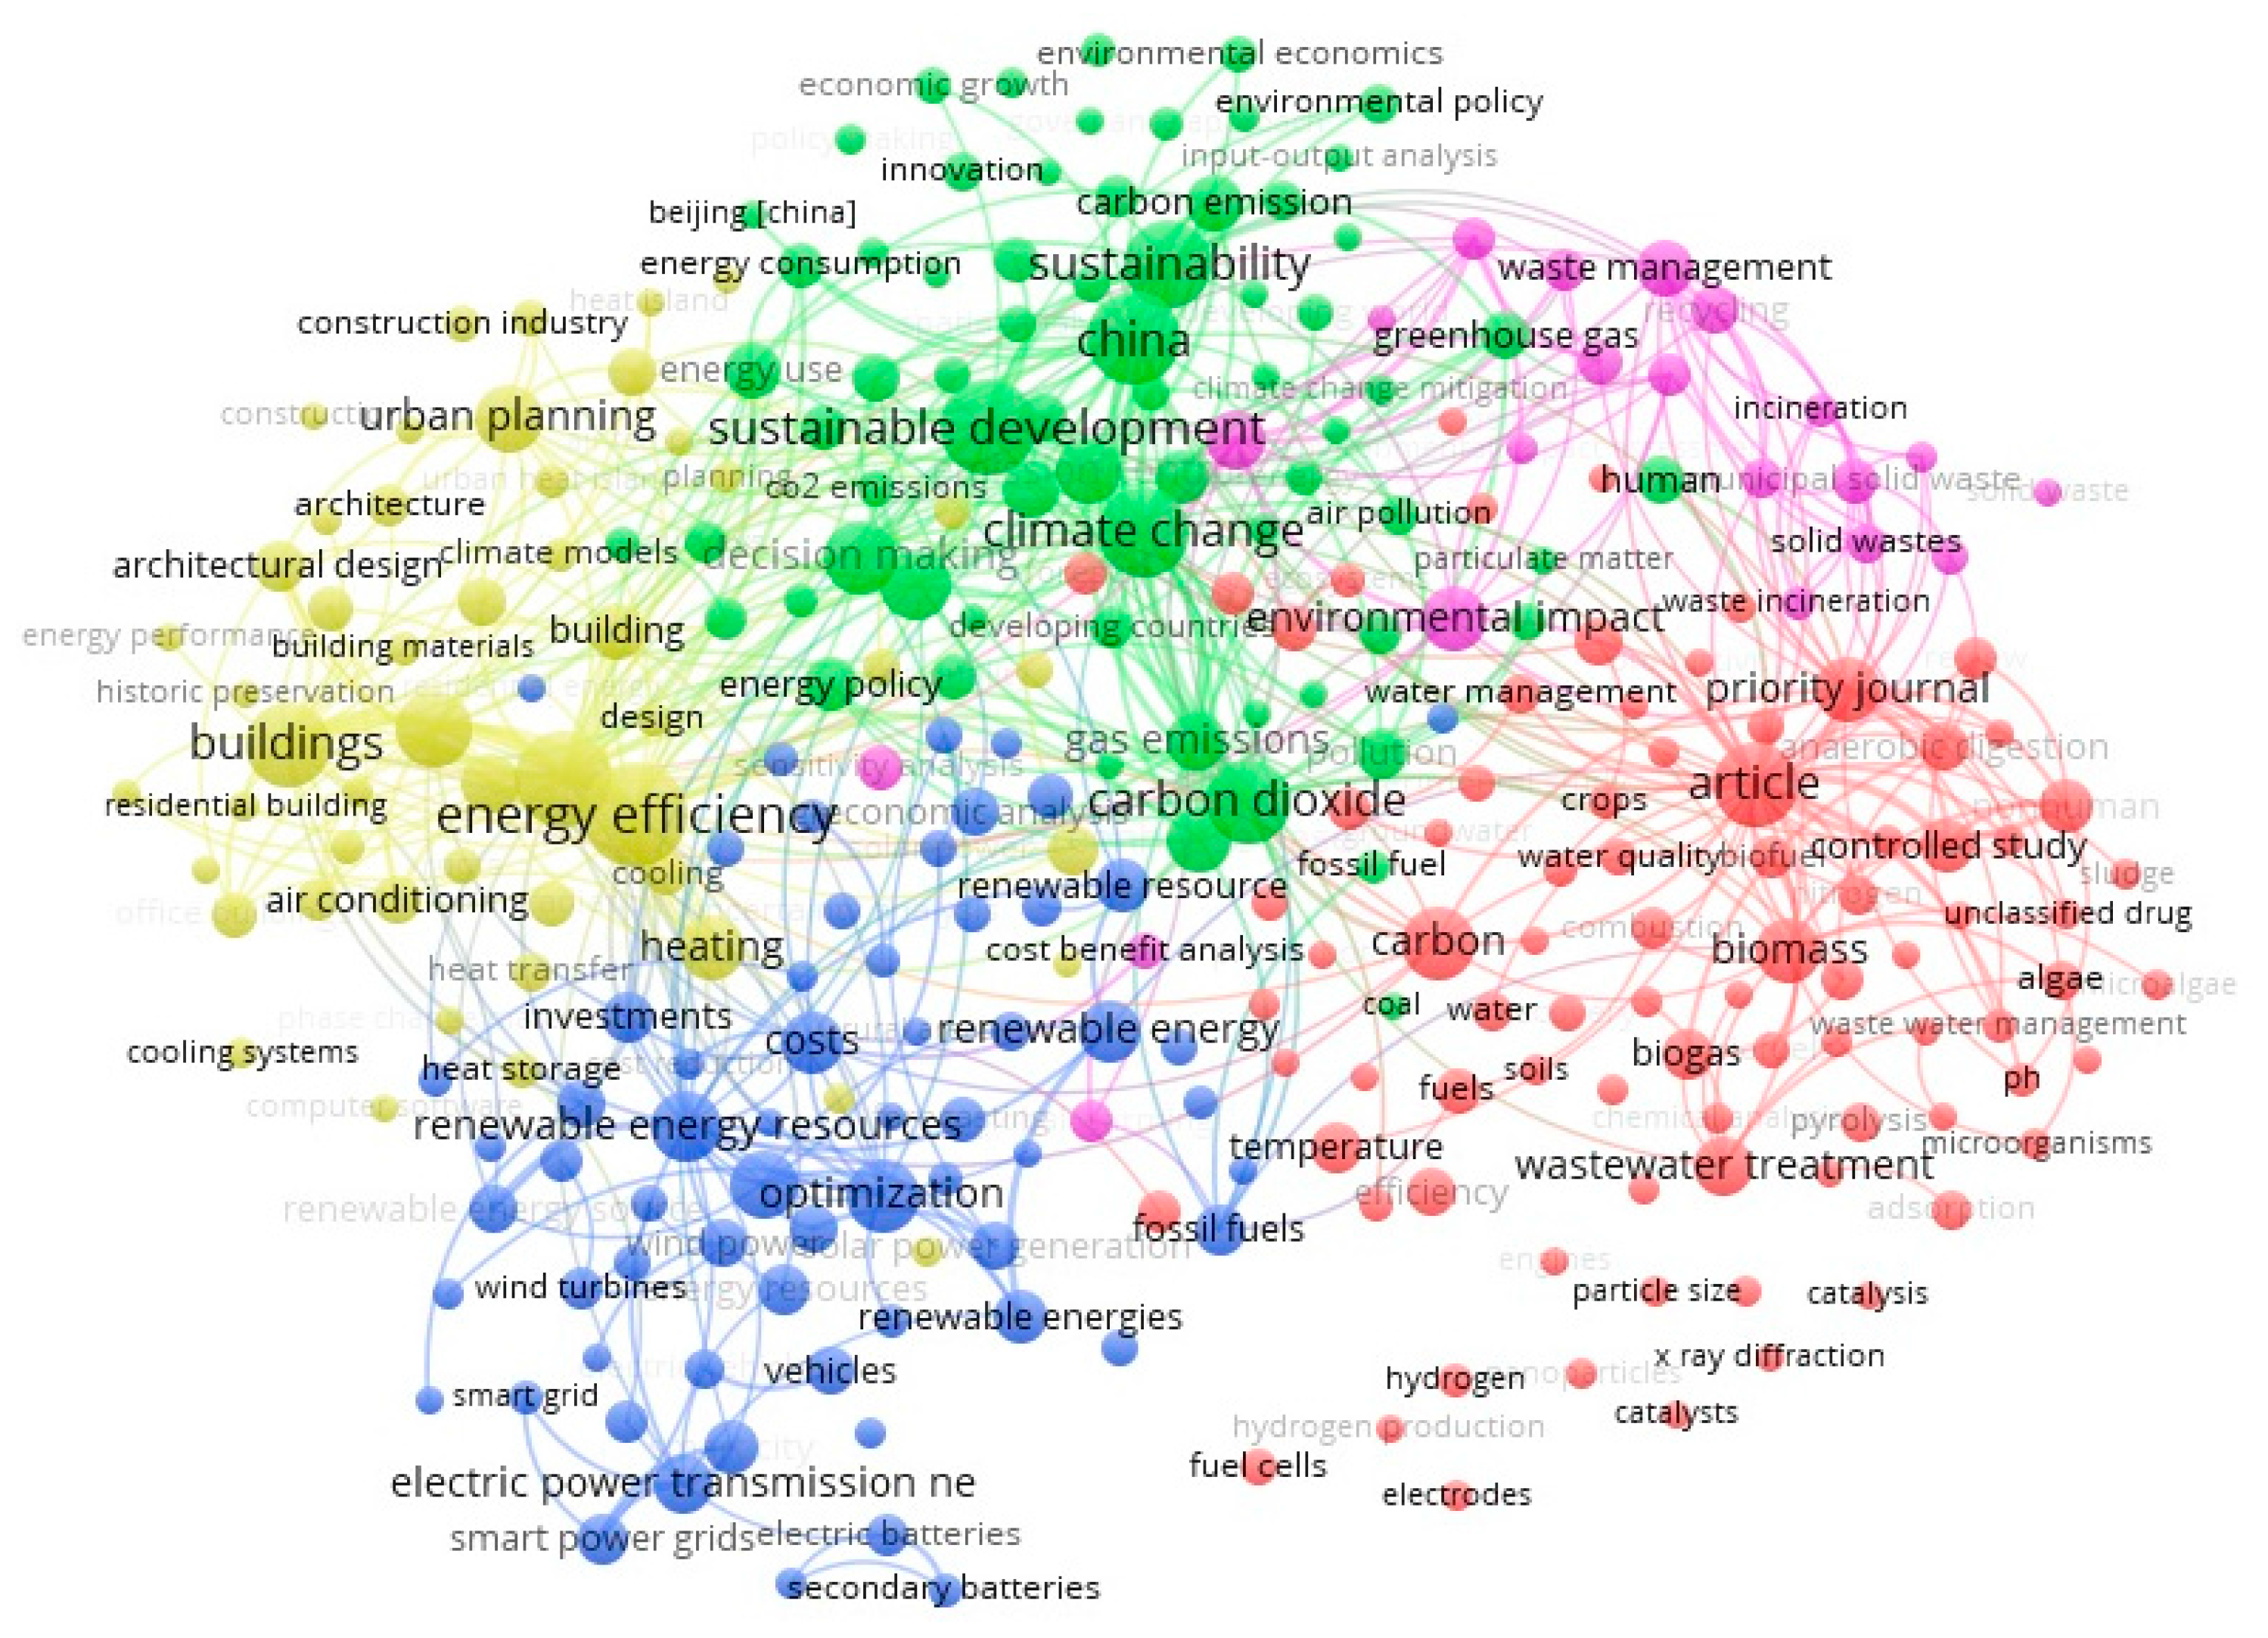
Focusing on the keywords study, found publications reveal a considerable dispersion in the utilization of the keywords group. In fact, many compound words are employed, which increase the number of unique terms. In addition, the same term can be typed differently according to the author, giving rise to a broader fictitious range.
The terms most frequently used are “energy efficiency”, “sustainable development”, “energy utilization”, “carbon dioxide”, and “renewable energy resources”. There is a clear trend towards the use of the term energy efficiency, which refers to the increase of productivity with the same energy utilization, and whose synergy with renewable energy is considered a key dynamic duo to achieve a sustainable development.
The analysed data comes to the conclusion that the international contribution to the scientific knowledge of renewable energies in urban areas is outstanding, producing a vast quantity of publications in congresses and high-impact journals. The important boom in renewable energy throughout the world, and especially in industrialized countries, as a key element to mitigate the climate change effects, has also boosted the research in this field. However, it is also necessary to promote research and use of renewable energy in urban areas of developing countries, where there will be a significant increase in urban population in the coming decades, as in the case of Latin American countries. Therefore policy makers in these countries should promote better urban conditions in terms of stricter efficiency standards in buildings, as well as to boost sustainable mobility in order to achieve a sustainable urban development. Analyses made show that countries with stable regulatory frameworks in renewable energies are the ones that benefit the most from the value generated by this sector at the local level.

Author Contributions

Miguel-Angel Perea-Moreno, Quetzalcoatl Hernandez-Escobedo and Alberto-Jesus Perea-Moreno conceived, designed the search and wrote the paper. All authors have read and approved the final manuscript.

Conflicts of Interest

The authors declare no conflict of interest.

Abbreviations

EEEnergy Efficiency
GDPGross Domestic Product
JCRJournal Citation Report
kWhKilowatts hours
MSWMunicipal Solid Waste
PVPhotovoltaic
R&DResearch and Development
SJRScientific Journal Ranking
WoS Web of Science

References

  1. Shen, Y.; Wei, R.; Xu, L. Energy consumption prediction of a greenhouse and optimization of daily average temperature. Energies 2018, 11, 65. [Google Scholar] [CrossRef]
  2. Perea-Moreno, A.-J.; Perea-Moreno, M.-A.; Hernandez-Escobedo, Q.; Manzano-Agugliaro, F. Towards forest sustainability in mediterranean countries using biomass as fuel for heating. J. Clean. Prod. 2017, 156, 624–634. [Google Scholar] [CrossRef]
  3. Perea-Moreno, A.-J.; Aguilera-Ureña, M.-J.; Manzano-Agugliaro, F. Fuel properties of avocado stone. Fuel 2016, 186, 358–364. [Google Scholar] [CrossRef]
  4. Sorgato, M.J.; Schneider, K.; Rüther, R. Technical and economic evaluation of thin-film CdTe building-integrated photovoltaics (BIPV) replacing façade and rooftop materials in office buildings in a warm and sunny climate. Renew. Energy 2018, 118, 84–98. [Google Scholar] [CrossRef]
  5. De la Cruz-Lovera, C.; Perea-Moreno, A.-J.; de la Cruz-Fernández, J.-L.; Alvarez-Bermejo, J.A.; Manzano-Agugliaro, F. Worldwide Research on Energy Efficiency and Sustainability in Public Buildings. Sustainability 2017, 9, 1294. [Google Scholar] [CrossRef]
  6. Zhao, L.; Zhou, Z. Developing a Rating System for Building Energy Efficiency Based on In Situ Measurement in China. Sustainability 2017, 9, 208. [Google Scholar] [CrossRef]
  7. Geller, H.; Harrington, P.; Rosenfeld, A.H.; Tanishima, S.; Unander, F. Polices for increasing energy efficiency: Thirty years of experience in OECD countries. Energy Policy 2006, 34, 556–573. [Google Scholar] [CrossRef]
  8. Marchi, B.; Zanoni, S. Supply chain management for improved energy efficiency: Review and opportunities. Energies 2017, 10, 1618. [Google Scholar] [CrossRef]
  9. Harvey, L.D.D. Resource implications of alternative strategies for achieving zero greenhouse gas emissions from light-duty vehicles by 2060. Appl. Energy 2018, 212, 663–679. [Google Scholar] [CrossRef]
  10. Perea-Moreno, A.-J.; Hernandez-Escobedo, Q. Solar resource for urban communities in the Baja California Peninsula, Mexico. Energies 2016, 9, 911. [Google Scholar] [CrossRef]
  11. Bilgen, S. Structure and environmental impact of global energy consumption. Renew. Sustain. Energy Rev. 2014, 38, 890–902. [Google Scholar] [CrossRef]
  12. Filippín, C.; Flores Larsen, S.; Ricard, F. Improvement of energy performance metrics for the retrofit of the built environment. Adaptation to climate change and mitigation of energy poverty. Energy Build. 2018. [Google Scholar] [CrossRef]
  13. Lee, J.; Park, J.; Jung, H.-J.; Park, J. Renewable Energy Potential by the Application of a Building Integrated Photovoltaic and Wind Turbine System in Global Urban Areas. Energies 2017, 10, 2158. [Google Scholar] [CrossRef]
  14. Hernandez-Escobedo, Q. Wind Energy Assessment for Small Urban Communities in the Baja California Peninsula, Mexico. Energies 2016, 9, 805. [Google Scholar] [CrossRef]
  15. Perea-Moreno, A.J.; García-Cruz, A.; Novas, N.; Manzano-Agugliaro, F. Rooftop analysis for solar flat plate collector assessment to achieving sustainability energy. J. Clean. Prod. 2017, 148, 545–554. [Google Scholar] [CrossRef]
  16. AlFaris, F.; Juaidi, A.; Manzano-Agugliaro, F. Energy retrofit strategies for housing sector in the arid climate. Energy Build. 2016, 131, 158–171. [Google Scholar] [CrossRef]
  17. Teymoori Hamzehkolaei, F.; Amjady, N. A techno-economic assessment for replacement of conventional fossil fuel based technologies in animal farms with biogas fueled CHP units. Renew. Energy 2018, 118, 602–614. [Google Scholar] [CrossRef]
  18. Chitsaz, A.; Sadeghi, M.; Sadeghi, M.; Ghanbarloo, E. Exergo environmental comparison of internal reforming against external reforming in a cogeneration system based on solid oxide fuel cell using an evolutionary algorithm. Energy 2018, 144, 420–431. [Google Scholar] [CrossRef]
  19. Ben Youssef, W.; Maatallah, T.; Menezo, C.; Ben Nasrallah, S. Assessment viability of a concentrating photovoltaic/thermal-energy cogeneration system (CPV/T) with storage for a textile industry application. Sol. Energy 2018, 159, 841–851. [Google Scholar] [CrossRef]
  20. Hossain, M.; Mekhilef, S.; Olatomiwa, L. Performance evaluation of a stand-alone PV-wind-diesel-battery hybrid system feasible for a large resort center in South China Sea, Malaysia. Sustain. Cities Soc. 2017, 28, 358–366. [Google Scholar] [CrossRef]
  21. Sciubba, E.; Tocci, L.; Toro, C. Thermodynamic analysis of a rankine dual loop waste thermal energy recovery system. Energy Convers. Manag. 2016, 122, 109–118. [Google Scholar] [CrossRef]
  22. Wu, X. Role of workplace charging opportunities on adoption of plug-in electric vehicles—Analysis based on GPS-based longitudinal travel data. Energy Policy 2018, 114, 367–379. [Google Scholar] [CrossRef]
  23. Martínez-Lao, J.; Montoya, F.G.; Montoya, M.G.; Manzano-Agugliaro, F. Electric vehicles in Spain: An overview of charging systems. Renew. Sustain. Energy Rev. 2017, 77, 970–983. [Google Scholar] [CrossRef]
  24. Cubito, C.; Millo, F.; Boccardo, G.; Di Pierro, G.; Ciuffo, B.; Fontaras, G.; Serra, S.; Otura Garcia, M.; Trentadue, G. Impact of Different Driving Cycles and Operating Conditions on CO2 Emissions and Energy Management Strategies of a Euro-6 Hybrid Electric Vehicle. Energies 2017, 10, 1590. [Google Scholar] [CrossRef]
  25. Zheng, J.; Zhou, Z.; Zhao, J.; Wang, J. Integrated heat and power dispatch truly utilizing thermal inertia of district heating network for wind power integration. Appl. Energy 2018, 211, 865–874. [Google Scholar] [CrossRef]
  26. Maricic, V.K.; Danilovic, D.; Lekovic, B.; Crnogorac, M. Energy policy reforms in the Serbian oil sector: An update. Energy Policy 2018, 113, 348–355. [Google Scholar] [CrossRef]
  27. Gurney, K.R.; Huang, J.; Coltin, K. Bias present in US federal agency power plant CO2 emissions data and implications for the US clean power plan. Environ. Res. Lett. 2016, 11, 64005. [Google Scholar] [CrossRef]
  28. Herrera-Quintero, L.F.; Jalil-Naser, W.D.; Banse, K.; Samper-Zapater, J.J. Smart cities approach for Colombian context. Learning from ITS experiences and linking with government organization. In Proceedings of the 2015 Smart Cities Symposium Prague, Prague, Czech Republic, 24–25 June 2015. [Google Scholar]
  29. Neves, F.D.O.; Salgado, E.G.; Beijo, L.A. Analysis of the environmental management system based on ISO 14001 on the American continent. J. Environ. Manag. 2017, 199, 251–262. [Google Scholar] [CrossRef] [PubMed]
  30. Weinmaster, M. Are green walls as “green” as they look? An introduction to the various technologies and ecological benefits of green walls. J. Green Build. 2009, 4, 3–18. [Google Scholar] [CrossRef]
  31. Deakin, M.; Reid, A. Smart cities: Under-gridding the sustainability of city-districts as energy efficient-low carbon zones. J. Clean. Prod. 2018, 173, 39–48. [Google Scholar] [CrossRef]
  32. Thellufsen, J.Z.; Lund, H. Roles of local and national energy systems in the integration of renewable energy. Appl. Energy 2016, 183, 419–429. [Google Scholar] [CrossRef]
  33. Juaidi, A.; Montoya, F.G.; Ibrik, I.H.; Manzano-Agugliaro, F. An overview of renewable energy potential in Palestine. Renew. Sustain. Energy Rev. 2016, 65, 943–960. [Google Scholar] [CrossRef]
  34. Yi, S.; Jang, Y.C.; An, A.K. Potential for energy recovery and greenhouse gas reduction through waste-to-energy technologies. J. Clean. Prod. 2018, 176, 503–511. [Google Scholar] [CrossRef]
  35. Mohajeri, N.; Assouline, D.; Guiboud, B.; Bill, A.; Gudmundsson, A.; Scartezzini, J.-L. A city-scale roof shape classification using machine learning for solar energy applications. Renew. Energy 2018, 121, 81–93. [Google Scholar] [CrossRef]
  36. Phillips, L.; Smith, P. Sustainable Urban Energy is the Future. UN Chronicle. 2015. Available online: https://unchronicle.un.org/article/sustainable-urban-energy-future (accessed on 10 February 2018).
  37. Waite, M.; Modi, V. Modeling wind power curtailment with increased capacity in a regional electricity grid supplying a dense urban demand. Appl. Energy 2016, 183, 299–317. [Google Scholar] [CrossRef]
  38. Liu, J.; Gao, C.Y.; Ren, J.; Gao, Z.; Liang, H.; Wang, L. Wind resource potential assessment using a long term tower measurement approach: A case study of Beijing in china. J. Clean. Prod. 2018, 174, 917–926. [Google Scholar] [CrossRef]
  39. Laiola, E.; Giungato, P. Wind characterization in Taranto city as a basis for innovative sustainable urban development. J. Clean. Prod. 2018, 172, 3535–3545. [Google Scholar] [CrossRef]
  40. Curreli, A.; Serra-Coch, G.; Isalgue, A.; Crespo, I.; Coch, H. Solar Energy as a Form Giver for Future Cities. Energies 2016, 9, 544. [Google Scholar] [CrossRef]
  41. Bar-Ilan, J. Citations to the “Introduction to informetrics” indexed by WOS, Scopus and Google Scholar. Scientometrics 2010, 82, 495–506. [Google Scholar] [CrossRef]
  42. Mongeon, P.; Paul-Hus, A. The journal coverage of Web of Science and Scopus: A comparative analysis. Scientometrics 2016, 106, 213–228. [Google Scholar] [CrossRef]
  43. Archambault, É.; Campbell, D.; Gingras, Y.; Larivière, V. Comparing bibliometric statistics obtained from the Web of Science and Scopus. J. Am. Soc. Inf. Sci. Technol. 2009, 60, 1320–1326. [Google Scholar] [CrossRef]
  44. Solomon, D. Types of open access publishers in Scopus. Publications 2013, 1, 16–26. [Google Scholar] [CrossRef]
  45. Rodrigues, R.S.; Taga, V.; Passos, M.F.D. Research articles about open access indexed by Scopus: A content analysis. Publications 2016, 4, 31. [Google Scholar] [CrossRef]
  46. Gimenez, E.; Manzano-Agugliaro, F. DNA Damage Repair System in Plants: A Worldwide Research Update. Genes 2017, 8, 299. [Google Scholar] [CrossRef] [PubMed]
  47. Salmerón-Manzano, E.; Manzano-Agugliaro, F. Worldwide Scientific Production Indexed by Scopus on Labour Relations. Publications 2017, 5, 25. [Google Scholar] [CrossRef]
  48. Montoya, F.G.; Baños, R.; Meroño, J.E.; Manzano-Agugliaro, F. The research of water use in Spain. J. Clean. Prod. 2016, 112, 4719–4732. [Google Scholar] [CrossRef]
  49. Manzano-Agugliaro, F.; Alcayde, A.; Montoya, F.G.; Zapata-Sierra, A.; Gil, C. Scientific production of renewable energies worldwide: An overview. Renew. Sustain. Energy Rev. 2013, 18, 134–143. [Google Scholar] [CrossRef]
  50. Liu, S.X.; Liu, H.; Zhang, Y. The new role of design in innovation: A policy perspective from China. Des. J. 2018, 21, 37–58. [Google Scholar] [CrossRef]
  51. Gimenez, E.; Salinas, M.; Manzano-Agugliaro, F. Worldwide Research on Plant Defense against Biotic Stresses as Improvement for Sustainable Agriculture. Sustainability 2018, 10, 391. [Google Scholar] [CrossRef]
  52. World Bank Open Data. Available online: https://data.worldbank.org/ (accessed on 10 February 2018).
Figure 1. Chart representation of document type distribution during period 1977–2017.
Energies 11 00577 g001
Figure 2. Chart representation of publications based on the language used.
Energies 11 00577 g002
Figure 3. (a) Trend in renewable energy in urban areas publications during the period of 1977–2017. (b) Trend in renewable energy in urban areas publications showing the data with a logarithmic scale along the y-axis.
Energies 11 00577 g003
Figure 4. Distribution of renewable energy in urban areas publications according to country.
Energies 11 00577 g004
Figure 5. Scientific production for the top 50 contributing countries.
Energies 11 00577 g005
Figure 6. Trends in publications on renewable energy in urban areas during the last 17 years for the top five countries.
Energies 11 00577 g006
Figure 7. Time evolution of the top five productive institutions over the period 2007–2017.
Energies 11 00577 g007
Figure 8. Collaborative network between countries.
Energies 11 00577 g008
Figure 9. Publication distribution by subject area, according to Scopus.
Energies 11 00577 g009
Figure 10. Overlap in the scientific areas Energy, Environmental Science, and Engineering with node size according to the SJR-2016.
Energies 11 00577 g010
Figure 11. Author distribution regarding the number of publications during the 2007–2017 period.
Energies 11 00577 g011
Figure 12. Co-authorship network.
Energies 11 00577 g012
Figure 13. Word cloud based on the main keywords related to renewable energy in urban areas worldwide research.
Energies 11 00577 g013
Figure 14. Co-occurrence-keywords.
Energies 11 00577 g014
Figure 15. Trend of the five most used terms in the period 2000–2017.
Energies 11 00577 g015
Table 1. Ranking of the top 10 most productive international institutions.
InstitutionCountryItemsMain Keywords Used
123
Chinese Academy of SciencesChina1145Carbon dioxideSustainable developmentBiomass
Ministry of Education ChinaChina669Energy utilizationEnergy efficiencyCarbon dioxide
Tsinghua UniversityChina563Energy utilizationEnergy efficiencyCarbon dioxide
Harbin Institute of TechnologyChina489Hydrogen ProductionFermentationBiomass
North China Electric Power UniversityChina380OptimitationDecision makingSustainable development
National Renewable Energy LaboratoryUSA354FuelsSolar energyBiomass
University of MalayaMalasia317Energy utilizationEnergy efficiencyRenewable Energies
Beijing Normal UniversityChina306Sustainable developmentEcologyDecision making
Tongji UniversityChina283Energy utilizationAnaerobic digestionEnergy efficiency
Delft University of TechnologyThe Netherlands278Energy efficiencySustainable developmentInnovation
Table 2. Number of publication by subject area.
Subject AreaNumber of Publications
Energy17,249
Environmental Science16,041
Engineering14,361
Social Sciences6917
Computer Science3469
Agricultural and Biological Sciences3422
Chemical Engineering3091
Earth and Planetary Sciences2717
Business, Management and Accounting2680
Chemistry2457
Materials Science2297
Economics, Econometrics and Finance1783
Physics and Astronomy1730
Biochemistry, Genetics and Molecular Biology1343
Mathematics1309
Medicine833
Decision Sciences668
Arts and Humanities528
Immunology and Microbiology512
Multidisciplinary337
Psychology190
Pharmacology, Toxicology and Pharmaceutics168
Neuroscience35
Veterinary35
Nursing31
Health Professions28
Undefined5
Dentistry1
Table 3. International journal classification according to the impact factor of scientific publications.
JournalsQSJRH-IndexJCRTotal Docs (2016)Total Docs (3 Years)Total Refs.Total Cites (3 Years)Cites/Doc (2 Years)Country
Renewable and Sustainable Energy ReviewsQ13.0511768.05013542716125,28025,0938.78The Netherlands
Applied EnergyQ13.0581257.1821673349484,34826,6777.58United Kingdom
Energy PolicyQ12.1971464.140595211928,58293624.40United Kingdom
Energy and BuildingsQ12.0931234.067962223336,50010,2154.42The Netherlands
Journal of Cleaner ProductionQ11.6151165.7152002310496,46615,1645.35The Netherlands
Renewable EnergyQ11.6971344.3571208223145,47610,9414.80United Kingdom
EnergyQ11.9991344.5201619364266,71418,2564.95United Kingdom
Energy Procedia-0.46751-1414796621,25191151.02United Kingdom
SustainabilityQ20.524351.7891342162973,60131591.96Switzerland
Energy Conversion and ManagementQ12.2781395.5891021273642,58116,2776.06United Kingdom
Bioresource TechnologyQ12.1912165.6511655508954,79530,0045.74The Netherlands
EnergiesQ10.691482.262672154327,30238102.23Switzerland
Table 4. Publications number of the most relevant authors between 2007 and 2017.
YearRen, N.Huang, G.H.Zuo, J.Sovacool, B.K.Chen, G.Q.TOTAL
2007000224
2008110103
2009111102125
201011812426
201131219732
2012105210128
201396891042
2014910461241
20151314179760
2016135105841
2017154199956
TOTAL9576626461358
Table 5. List of the 40 most used keywords.
OrderTERMItems%
1Energy Efficiency40692.34
2Sustainable Development39982.30
3Energy Utilization34471.98
4Renewable Energy Resources32431.86
5Carbon Dioxide27931.61
6Climate Change26001.49
7Solar Energy24341.40
8Energy Conservation23961.38
9Biomass23741.36
10China23351.34
11Renewable Resource22541.30
12Energy Policy22011.27
13Optimization21851.26
14Buildings21691.25
15Sustainability21611.24
16Renewable Energies21531.24
17Environmental Impact21471.23
18Renewable Energy20651.19
19Economics19771.14
20Greenhouse Gases19491.12
21Wind Power19241.11
22Decision Making17811.02
23Carbon17431.00
24Costs15860.91
25Emission Control15490.89
26Heating15070.87
27Investments14550.84
28Energy Use14410.83
29Gas Emissions13420.77
30Solar Radiation13370.77
31Life Cycle13240.76
32Global Warming12360.71
33Biofuel12300.71
34United States12200.70
35Photovoltaic Cells12140.70
36Waste Management11800.68
37Biofuels11650.67
38Economic Analysis11630.67
39Housing11380.65
40Nonhuman11250.65
Table 6. Research information by country.
CountryDocumentsResearchers in R&D (per Million People)Ratio R&D/DocumentsResearch and Development Expenditure (% of GDP)
China854042320.502.1
United States807611770.152.8
United Kingdom410044711.091.7
Italy291720180.691.3
Germany220844312.012.9
India20452160.110.6
Australia191526551.392.2
Spain190545312.381.2
Canada175145192.581.6
Netherlands133745483.402.0

