Article

Influence of Reservoir Stimulation on Marine Gas Hydrate Conversion Efficiency in Different Accumulation Conditions

1
Engineering College, Jilin University, Changchun 130026, China
2
State Key Laboratory of Superhard Materials, Changchun 130012, China
3
Key Laboratory of Drilling and Exploitation Technology in Complex Conditions, Ministry of Land and Resources, Changchun 130026, China
4
National Geophysical Exploration Equipment Engineering Research Center, Jilin University, Changchun 130026, China
*
Authors to whom correspondence should be addressed.
Energies 2018, 11(2), 339; https://doi.org/10.3390/en11020339
Submission received: 10 December 2017 / Revised: 19 January 2018 / Accepted: 24 January 2018 / Published: 2 February 2018
(This article belongs to the Section I: Energy Fundamentals and Conversion)

Abstract

:
In this paper, we used a method of combining reservoir stimulation technique (RST) with depressurization to investigate the conversion efficiency of marine natural gas hydrate (NGH) reservoirs in the Shenhu area, on the northern slope of the South China Sea, which differ in intrinsic permeability and initial NGH saturation conditions. We also analyzed the influence of the variable-stimulation effect on marine NGH conversion efficiency in different accumulation conditions, providing a reference scheme for improving the NGH conversion efficiency in the Shenhu area. In this work, we performed calculations for the variations in CH4 production rate and cumulative volume of CH4 in different initial NGH saturation, intrinsic permeability, and stimulation effect conditions. Variance analysis and range analysis methods were used to analyze the significance of these key factors and their interaction. Furthermore, we investigated the sensitivity of stimulation effect on NGH conversion efficiency. The simulation results showed that the stimulation effect has a significant influence on NGH conversion efficiency, and the influence of interaction between these three factors was not obvious. Possibly most importantly, we clarified that the sparsely fractured networks (N = 3) had a better effect for higher NGH conversion efficiency under higher saturation conditions. For lower permeability cases, the influence between sparsely (N = 3) and densely (N = 5) fractured networks were similar.

1. Introduction

1.1. Background

Natural gas hydrates (NGH) are white and pale yellow, solid, ice-like cage type crystalline compounds [1]; formed by small-molecule gases such as light hydrocarbons, carbon dioxide, and water under low-temperature and high-pressure conditions. These are also known as “combustible ice” [2]. NGH is an alternate energy resource with great reserves [3], very clean natural gas can be produced from NGH deposits, especially from sandy turbidites, from which conventional hydrocarbons can be produced [4]. It is estimated that natural gas from NGH in sands are >40,000 Tcf [5,6]. NGH should be converted in situ to its constituent gas and water [7]. However, it is a potential geohazard as hydrates can trigger submarine landslides [8]. In addition, hydrate dissociation releases methane in to the atmosphere which is a powerful greenhouse gas. Therefore, efficient and safe exploitation methods are the focus of NGH study. A number of conversion methods exist [9,10], but early production testing and modeling indicate that depressurization will be the ideal method to use [11,12].
The NGH enriched area of the Shenhu area is located on the northern slope of the South China Sea, between Xisha Trough and Dongsha Islands (Figure 1) [13,14]. The NGH enrichment area is characterized by thickness of sedimentary formations, high content of organic matter, and high sedimentation; the thermogenic gas from deep formations and microbial and thermogenic gases from the shallow formations provided a sufficient gas source for the formation of NGH [15,16]. In this area, the water depth is 1000–1700 m [17]. The temperature of the ocean floor, heat flow, geothermal gradient and organic matter contents are 3.3–3.7 °C, 74–78 mW/m2, 43–67.7 °C/km and 0.46–1.4%, respectively, which satisfied the favorable geological and thermodynamic conditions of NGH formation and stability [14,15,18,19].

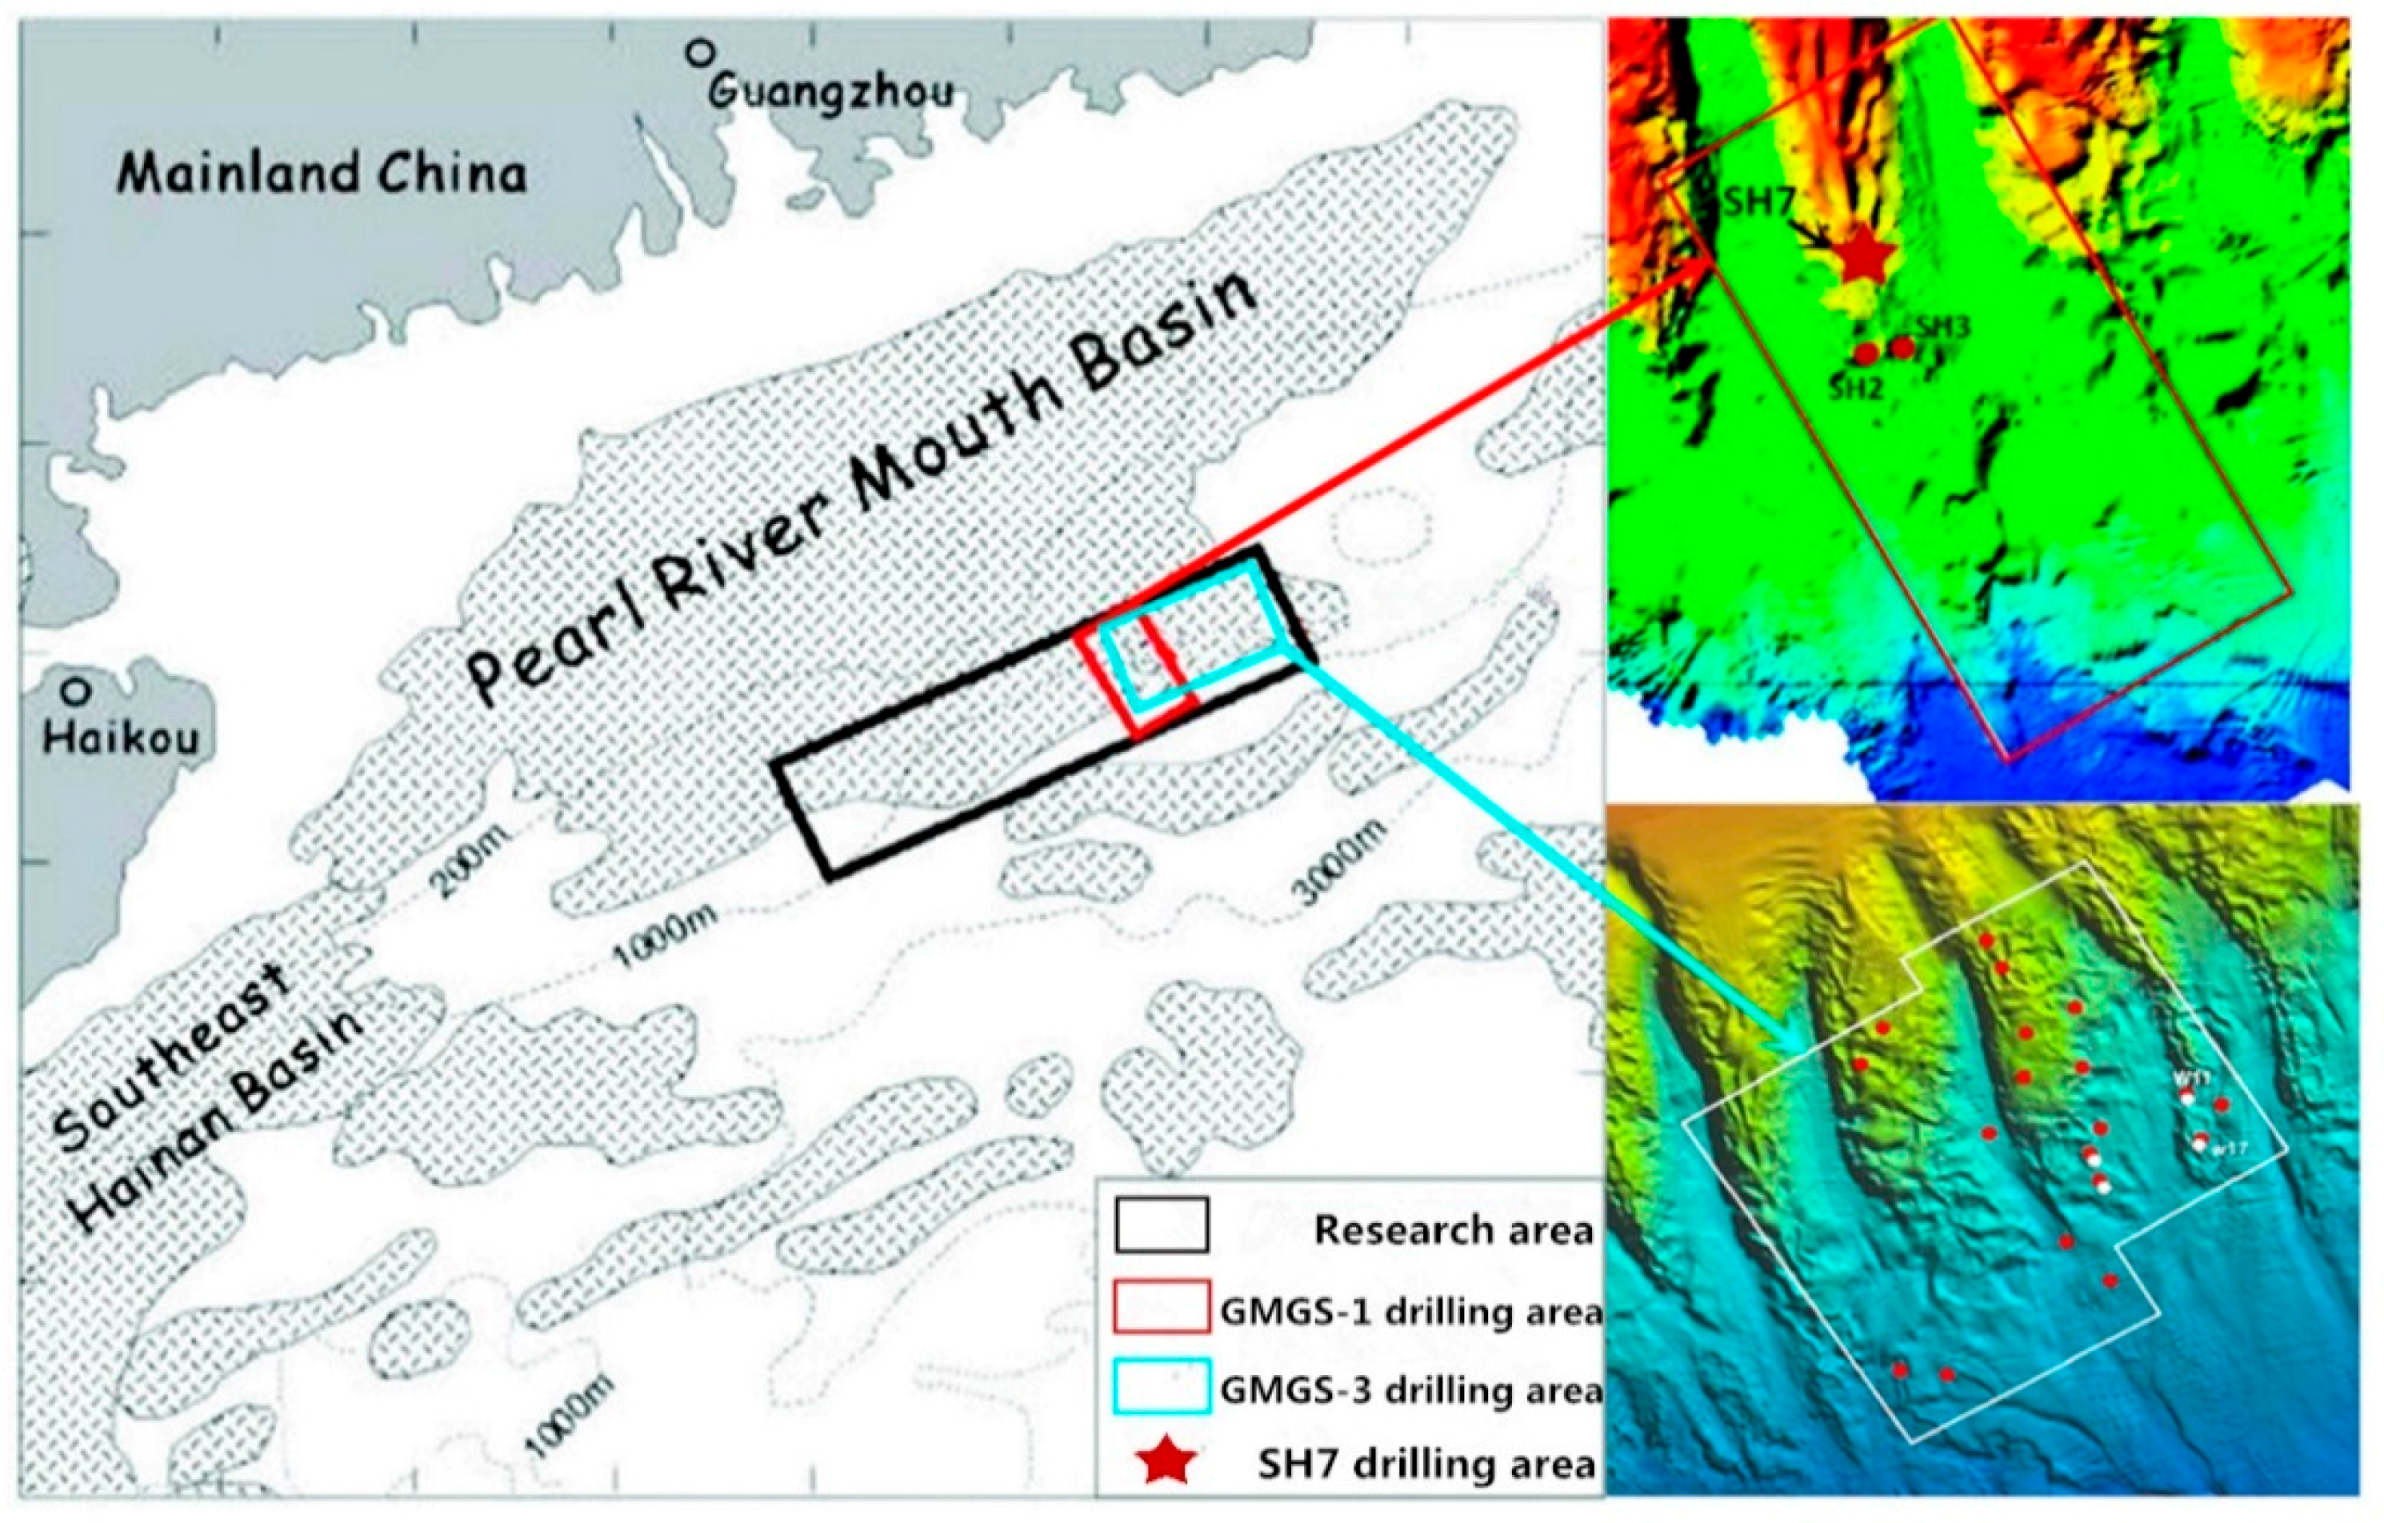
1.2. Hydrates in the Shenhu Area

In 2007, NGH samples were successfully drilled from the SH2, SH3, and SH7 sites of GMGS-1 research area in the Shenhu area, in the northern South China Sea (Figure 1) [14]. The drilling results showed that the top of the hydrate-bearing layers (HBL) are located at 115–229 m below the ocean floor [14,15]. In 2015, a total of 23 wells across 19 sites, were drilled in GMGS-3 research area in the Shenhu area in the northern South China Sea (Figure 1) [15,20,21]. The well logging data showed that all of these stations have NGH. Hydrate samples were collected in four of these wells. The hydrate layers are 13–70 m thick. The NGH saturation varies from 13% to 53% in these wells. High saturations of up to 75% were observed sporadically in some of these wells [15,20]. The exploration results of GMGS-1 and GMGS-3 showed that the NGH enrichment area in the Shenhu area holds large NGH reserves; however, NGH saturations and permeability of reservoirs show clear differences both in horizontal and vertical directions, and strong heterogeneity [20]. Table 1 showed the characteristics of the NGH deposits with greater exploitation potential.

1.3. Significance and Feasibility of Stimulation for Marine NGH Reservoir

NGHs are mainly stored in sandy and silty marine sediments. Clay and clastic limestone and secondary permeability related to structure also host NGH in some areas of the South China Sea [18]. The NGH-enriched reservoirs in the Shenhu area have poor permeability, which hinders the transfer of heat and pressure between the production wells and the reservoir, and reduces the conversion efficiency of the continuous dissociation of NGH [14,22,23]. The problem of how to efficiently and economically exploit natural gas hydrates in low-permeability marine sediment reservoirs is an important issue. Being able to exploit NGHs from marine sediments, especially in low-permeability silt and clay sediments with a less producible capacity, will greatly expand the potential use of NGH as a gas resource [23].
The reservoir stimulation technique (RST) is to stimulate the reservoir through hydraulic fracturing method [24]. RST is aimed at fracturing more main cracks and multi-level secondary cracks to form a fractured network system, creating communication between main cracks and natural cracks at the same time [25]. ‘Breaking up’ the effective reservoir to increase the contact area between cracked walls and the reservoir, and reduce the seepage distance from effective reservoir to cracks, would greatly improve the permeability of the reservoir [26,27]. RST has expanded to include low-permeability oil and gas shale, as well as tight sand reservoirs [28]. The depressurization method and RST combine to exploit NGHs, which will increase the transmission rate of depressurization within NGH deposits and promote NGH decomposition in fractured zones, in addition to being conducive to the discharge of methane [23,29,30,31].
The formation of NGH in host sediment pore space results in a higher bulk modulus and increased mechanical strength [4,6]. In an ideal case, a hydrate deposit probably had a sufficiently brittle response to fracturing; our model would provide a base case with which actual testing can be compared in order to assess the likelihood of artificial fracturing when inducing additional permeability in semi-consolidated marine sediments, which, without NGH, would be expected to respond in a more mechanically-ductile manner [23].

1.4. Objective

The main objective of this study is to investigate the influence of RST on the conversion efficiency of NGHs under different accumulation conditions such as initial NGH saturation, intrinsic permeability, and variable-stimulation effect of the depressurization method. We provide a reference program for increasing conversion efficiency of NGH accumulations from the Shenhu area in the northern South China Sea, in different permeability and saturation conditions, especially in low-permeability and high-saturation conditions.

2. Materials and Methods

2.1. Numerical Model and Simulation Parameters

2.1.1. Numerical Simulation Code

The simulator model used in this work was TOUGH+HYDRATE v1.0, a numerical simulator developed by Moridis from the Lawrence Berkeley National Laboratory (Berkeley, CA, USA), which is the first iteration of TOUGH+, and the successor to TOUGH2. The model can simulate the formation and decomposition of natural gas hydrates, phase equilibrium, seepage, and heat and mass transfer processes under complex conditions and non-isothermal conditions. In addition, the model can simulate production from natural CH4-hydrate deposits in the subsurface (that is, in permafrost and deep ocean sediments) as well as laboratory experiments of hydrate dissociation and formation in porous and fractured media, using the methods of depressurization, heating injection, and injection inhibition [32]. TOUGH+HYDRATE v1.0 can also simulate the formation and decomposition of gas hydrate under equilibrium and kinetics. The model includes four phases (liquid, gas, hydrate, and ice), and four components (water, methane, hydrate, and water-soluble inhibitors, such as salt, alcohol, etc.). In recent years, TOUGH+HYDRATE v1.0 models have been widely used in NGH simulations. Li et al. [14] used this model to evaluate NGH conversion potential through depressurization and thermal stimulation from the SH7 site. Su et al. [22] used depressurization and thermal stimulation method to analyze NGH conversion efficiency from the SH2 site. Chen et al. [23] used this model to investigate the effect of fracturing technology on the production efficiency of NGHs by depressurization from the SH7 site.

2.1.2. System Parameters and Initialization of the Model

The geologic system used in this study was according to the drilling results of GMGS-1 and GMGS-3 in the Shenhu area, the northern South China Sea. The hydrate samples from this area were dominated by methane hydrate, and in some areas, they were almost pure methane hydrate (99.2%) [14]. Therefore, only methane hydrate was simulated. The system parameters, part of the initial conditions and mathematical models of the simulation are shown in Table 2. The main parameters in the simulation were derived from the previous literature on NGH reservoirs in this area [14,20,23].

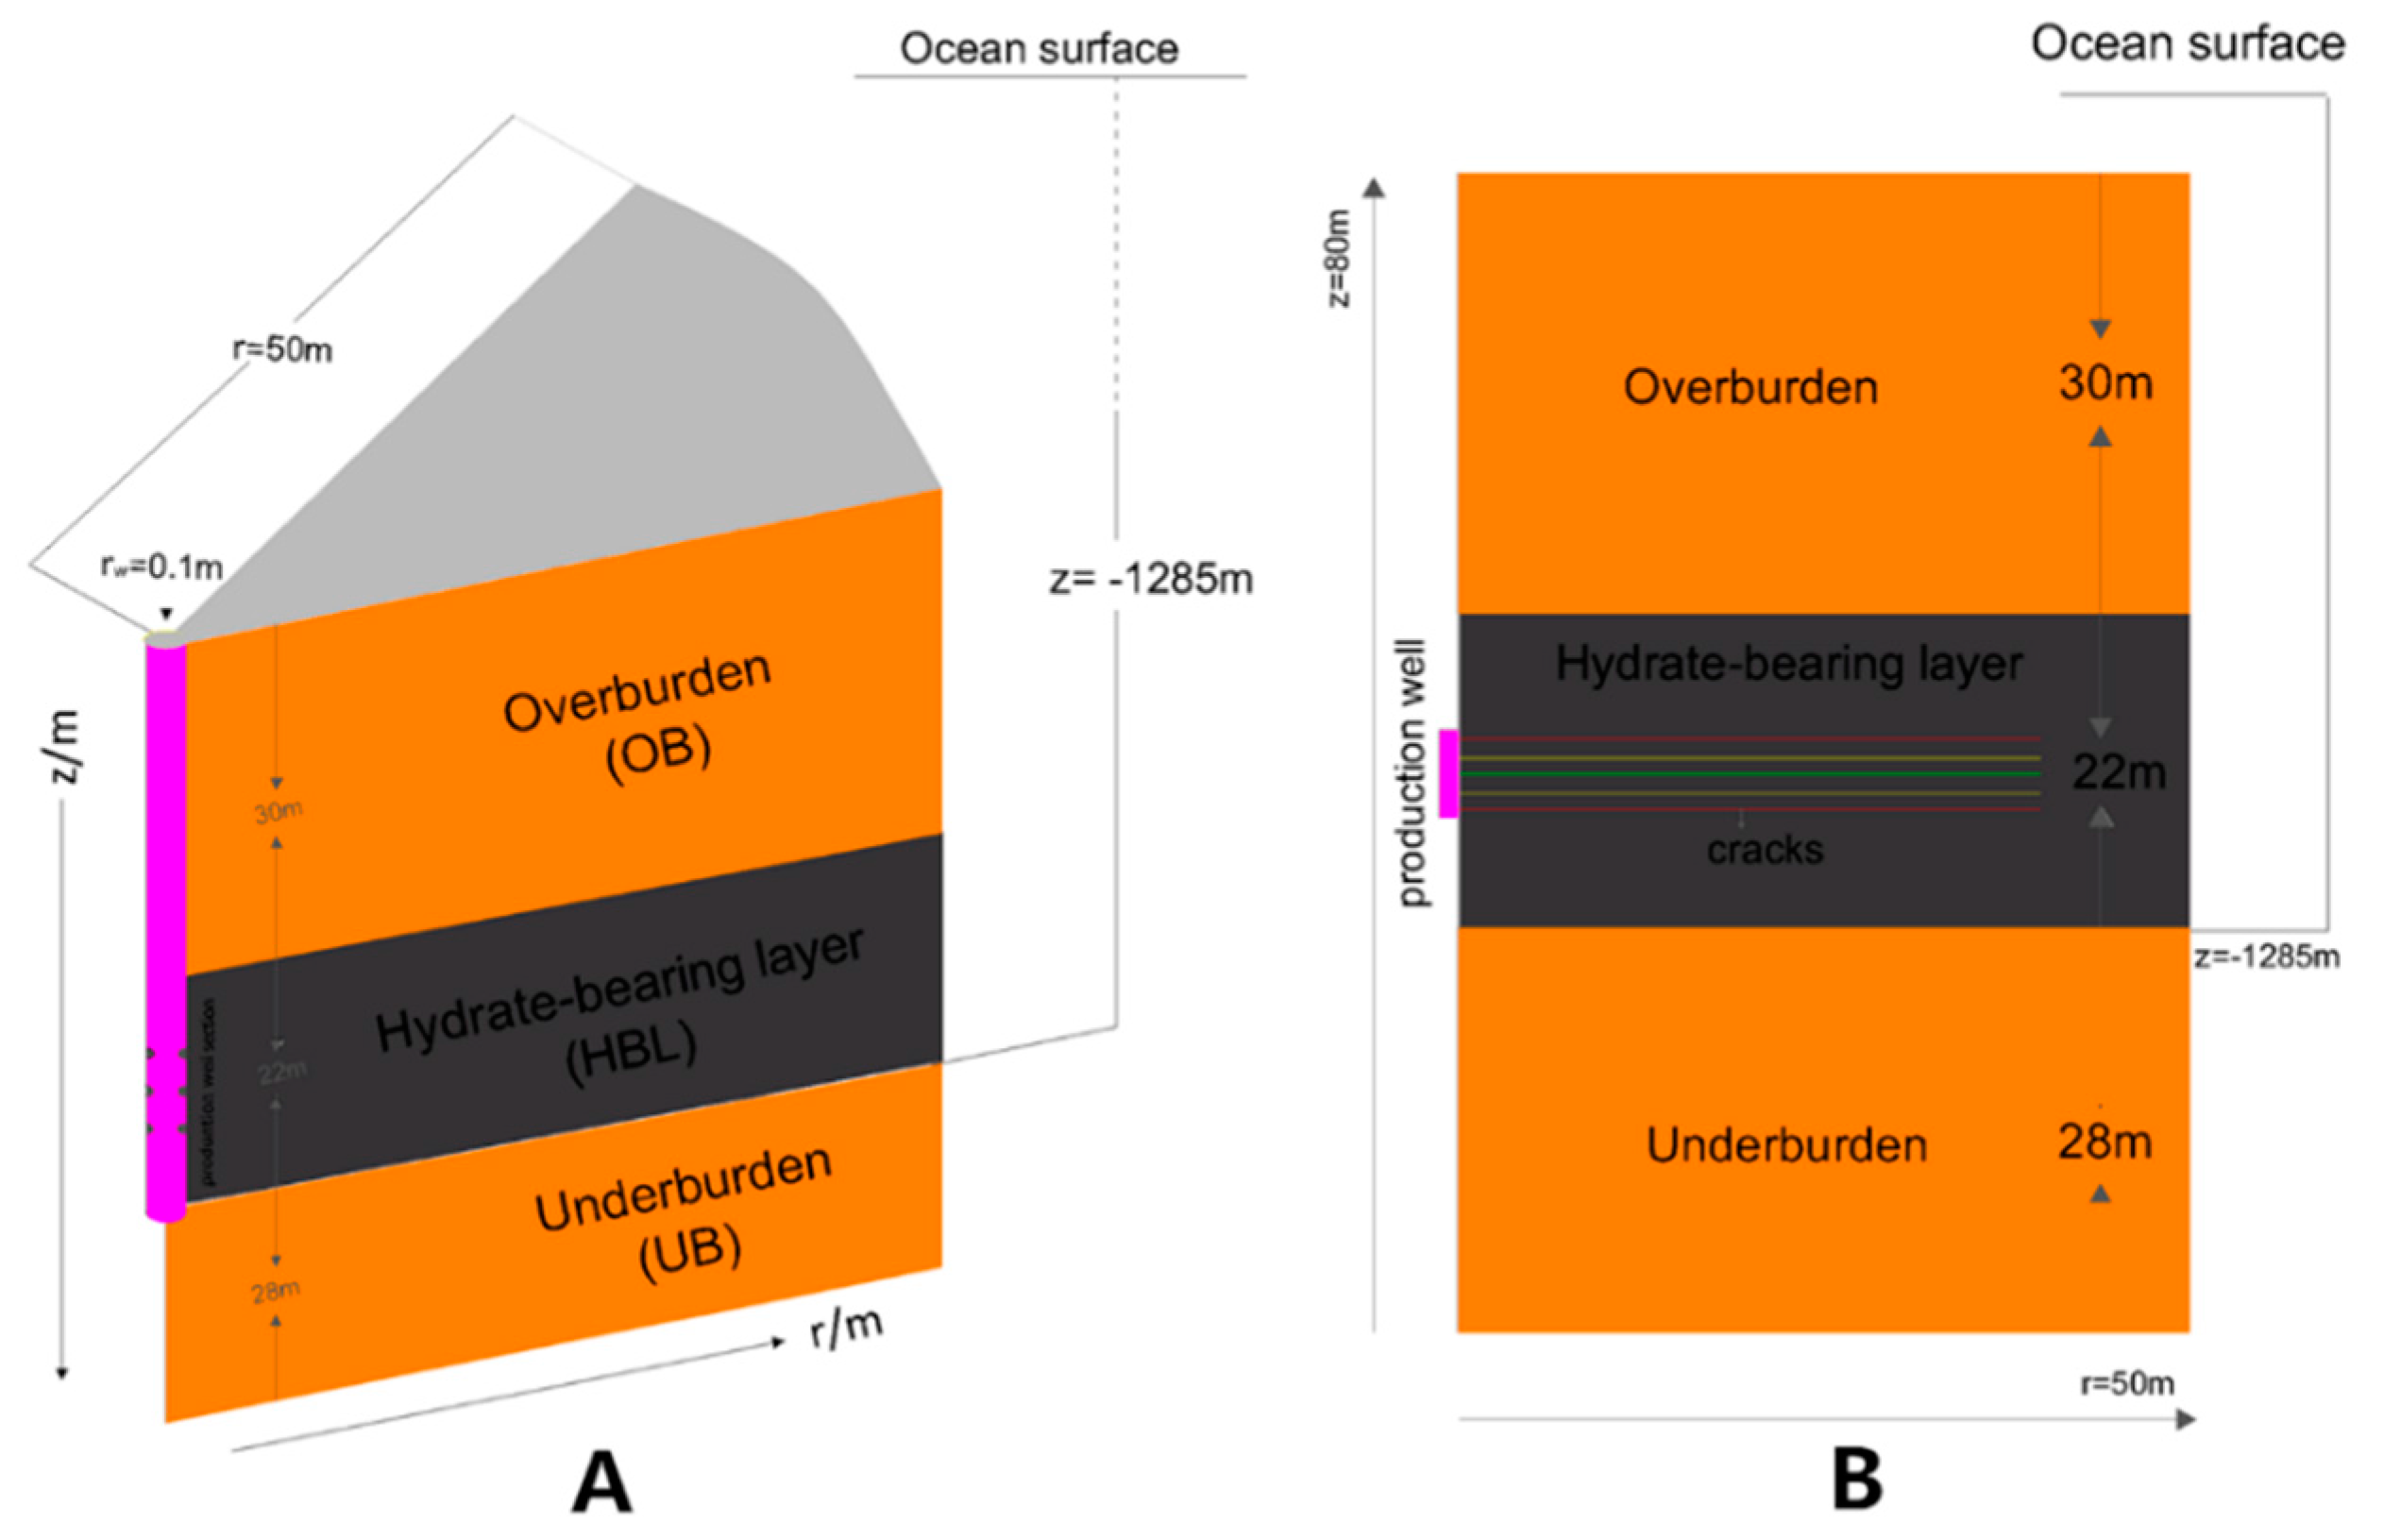
2.2. Design of the Production Well and Reservoir Stimulation Cracks

2.2.1. Production Well Design

In this paper, a single vertical well which had a 6 m height production interval was located in the middle of the NGH deposit with a radius of rw = 0.1 m, and the simulation system was cylindrical (Figure 2A). The production interval design referred to Su [22] and Li’s [35] studies. Setting the production well in the middle of the NGH deposit was to reduce natural gas spillage through overburden (OB) or underburden (UB).

2.2.2. Cracks Stimulation Design

Reservoir stimulation is a complex process. The fracturing cracks morphology were affected by a lot of parameters such as the physical and mechanical properties of the formation, and the stress distribution of target formation [23]. Therefore, in this work, in order to simplify the physical model, the fractured network system was simplified into multiple horizontal cracks, with different crack densities to represent the different stimulation effects. The larger crack quantity and smaller crack spacing represents better stimulation effects with a densely fractured network in the fracturing zone. The opposite conditions represent poor stimulation effects, with a sparsely fractured network in the fracturing zone. According to the different stimulation effect, the cracks were divided into spacing categories, Δl = 3, 2, 1 m, for three, four, and five cracks respectively, and these cracks were uniformly distributed through the production well, which increased the communication between the production well and the NGH deposit. The parameters of cracks were showed in Table 3. Furthermore, the crack length was Lf = 40 m, and crack height was h = 10 mm, as shown in Figure 2B.
The permeability of the cracks varied according to the porosity. The porosity and permeability have the following relationships [36,37,38]
k k 0 = F Φ S = ( Φ Φ 0 ) n
k k 0 = F Φ S = ( Φ Φ c Φ 0 Φ c ) n
where k0 is the formation permeability, k is the formation permeability after the porosity change, Φ 0 is the formation porosity,   Φ is the porosity of the formation after the change, and Φ c is a non-zero critical porosity. In Equation (1), n is 2 or 3; in Equation (2), n is 10 or more.

3. Simulation Experiment Results and Discussion

3.1. Analysis of the Factors’ Significance and Influence Rules on Gas Production Efficiency

In this work, we considered the interaction of various factors and used the whole simulation experiments method (L27(3)13) to analyze the significance of intrinsic permeability k, initial NGH saturation SH0, and the stimulation effect (represented by cracks quantity N) and their interaction on NGH conversion efficiency of NGH deposits in the Shenhu area. Because these factors and their interactions both would affect NGH conversion efficiency, it was inaccurate to use a single variable approach to describe the influence rules of these three factors on NGH conversion efficiency; thus, a whole simulation experiment program which contained the interactions between these factors was necessary. In this work, using CH4 cumulative volume Qcv to represent NGH conversion efficiency, the depressurization exploitation time was set to five years, because the CH4 production rates were stabilized at this time.
Table 4 showed the levels of these three key factors, and Table 5 showed the 33 whole simulation experiments program and the simulation experiments results. As shown in Table 5, for example, the k × SH0, k × N and SH0 × N meant the interaction column between intrinsic permeability k and initial NGH saturation SH0, intrinsic permeability k and crack quantity N, and initial NGH saturation SH0 and crack quantity N, respectively, and the 9th, 10th, 12th, and 13th columns were used for error analysis, which were vacant columns and not written into Table 5 in this work.
As shown in Table 5, x ¯ was the average value of the same level of each factor. As shown in Table 6, analysis of variance was applied to analyze the significance and sensitivity of these three factors on NGH conversion efficiency. In these two tables,
S S T = Q c v 2 C , C = T c v 2 / n
S S i   = k ,   S H 0 ,   N ,   k   ×   S H 0 ,   k   ×   N   a n d   S H 0   ×   N =   T i 2 K i C ,
S S e = S S T S S i
where, SST was total sum of the square, C was the correction parameter, n was the test quantity and n = 27. In Equations (4) and (5), SSi were the sum of the square of each factor and SSe was the error sum of the square, while the number of repetitions of each factor Ki = 9.
dfT = n − 1
dfj=k,SH0,N = xj − 1, xj = 3
dfm=k×SH0,k×N,SH0×N = dfk + dfSH0 = dfk + dfN = dfSH0 + dfN
d f e = d f T d f j     d f m
MS = SS/df
F = S S i / d f i S S e / d f e
where, dfT is the total degree of freedom, dfe is the degree of freedom for error, dfj,m are the degrees of freedom for factors j and m, xj is the level of each factor and MS is mean square. F0.05(2,8) and F0.01(2,8) are derived from the standard F(f1,f2) table.
By comparing Fi and F0.05(2,8) and F0.01(2,8), the impact of factor i was significant when Fi > F0.05(2,8), and had a more significant influence when Fi > F0.01(2,8). As shown in Table 6, Fk > FSH0 > F0.05(2,8) > F0.01(2,8), which meant intrinsic permeability k and initial NGH saturation SH0 had a more significant influence on CH4 cumulative volume. Furthermore, when F0.01(2,8) > FN > F0.05(2,8), crack quantity N had a significant influence on CH4 cumulative volume, which was smaller than that of k and SH0, and the significance of interaction between k, SH0, and N were small. The results showed that the impact of intrinsic permeability, initial NGH saturation, and the stimulation effect on NGH conversion efficiency were significant; however, the interaction had no significant effect.
In order to identify the influence rules of each factor for NGH conversion efficiency, multiple comparisons of the three factors were used. As shown in Table 7, Table 8 and Table 9, by comparing x c v ¯ of each level, the results showed, for intrinsic permeability k, NGH conversion efficiency was substantially increased while increasing k; however, the growth rate decreased. For initial NGH saturation SH0, a lower SH0 led to a higher NGH conversion efficiency. For crack quantity N, a densely fractured network had a higher NGH conversion efficiency, but the impact of a sparsely fractured network was slightly less than that of a densely fractured network. By comparing the difference between the maximum and minimum x c v ¯ of each level, it was showed that the influence on NGH conversion efficiency was increased by about four times, in comparison with SH0 and k.

3.2. Sensitivity to Stimulation Effect

3.2.1. Range Analysis Method

As shown in Table 6, the sensitivity of the stimulation effect (represented by crack quantity N) on the cumulative volume of CH4 was significant. In order to investigate the influence of the stimulation effect on NGH conversion efficiency using range analysis method, we compared the values of CH4 cumulative volume Qcv under different stimulation conditions as shown in Table 10 and Table 11.
Where x c v ¯ was the average value of CH4 cumulative volume Qcv, Rcv was the range of CH4 cumulative volume Qcv, and rcv was the rate of change between maximum x c v ¯ and minimum x c v ¯ . Value of Rcv was calculated by subtracting the minimum x ¯ from the maximum x ¯ , with the following expression,
R = x m a x ¯ x m i n ¯
r   =   R / x m i n ¯
As shown in Table 10, rcv was decreased with increasing SH0, and the rcv for case SH0 = 0.3 was the largest. This was because a higher SH0 had a lower effective permeability, and stimulation effect was more obvious in lower effective permeability condition, which led to a less difference of Qcv. The results showed that the sensitivity of variable stimulation effect on NGH conversion efficiency is significant in low-saturation conditions.
As shown in Table 11, rcv for case k = 7.5 mD was much bigger than that for cases k = 40 mD and 75 mD, and rcv for cases k = 40 mD and k = 75 mD were similar. This was because, RST had a greater improvement on effective permeability under low permeability conditions, and there were enough seepage channels for the discharge of methane in higher permeability conditions. The results showed that the sensitivity of the variable stimulation effect on NGH conversion efficiency was significant in low-permeability conditions.
The influence of intrinsic permeability on the sensitivity of stimulation effects on NGH conversion efficiency was bigger than that of initial NGH saturation, in comparison with the rcv of Table 10 and Table 11.

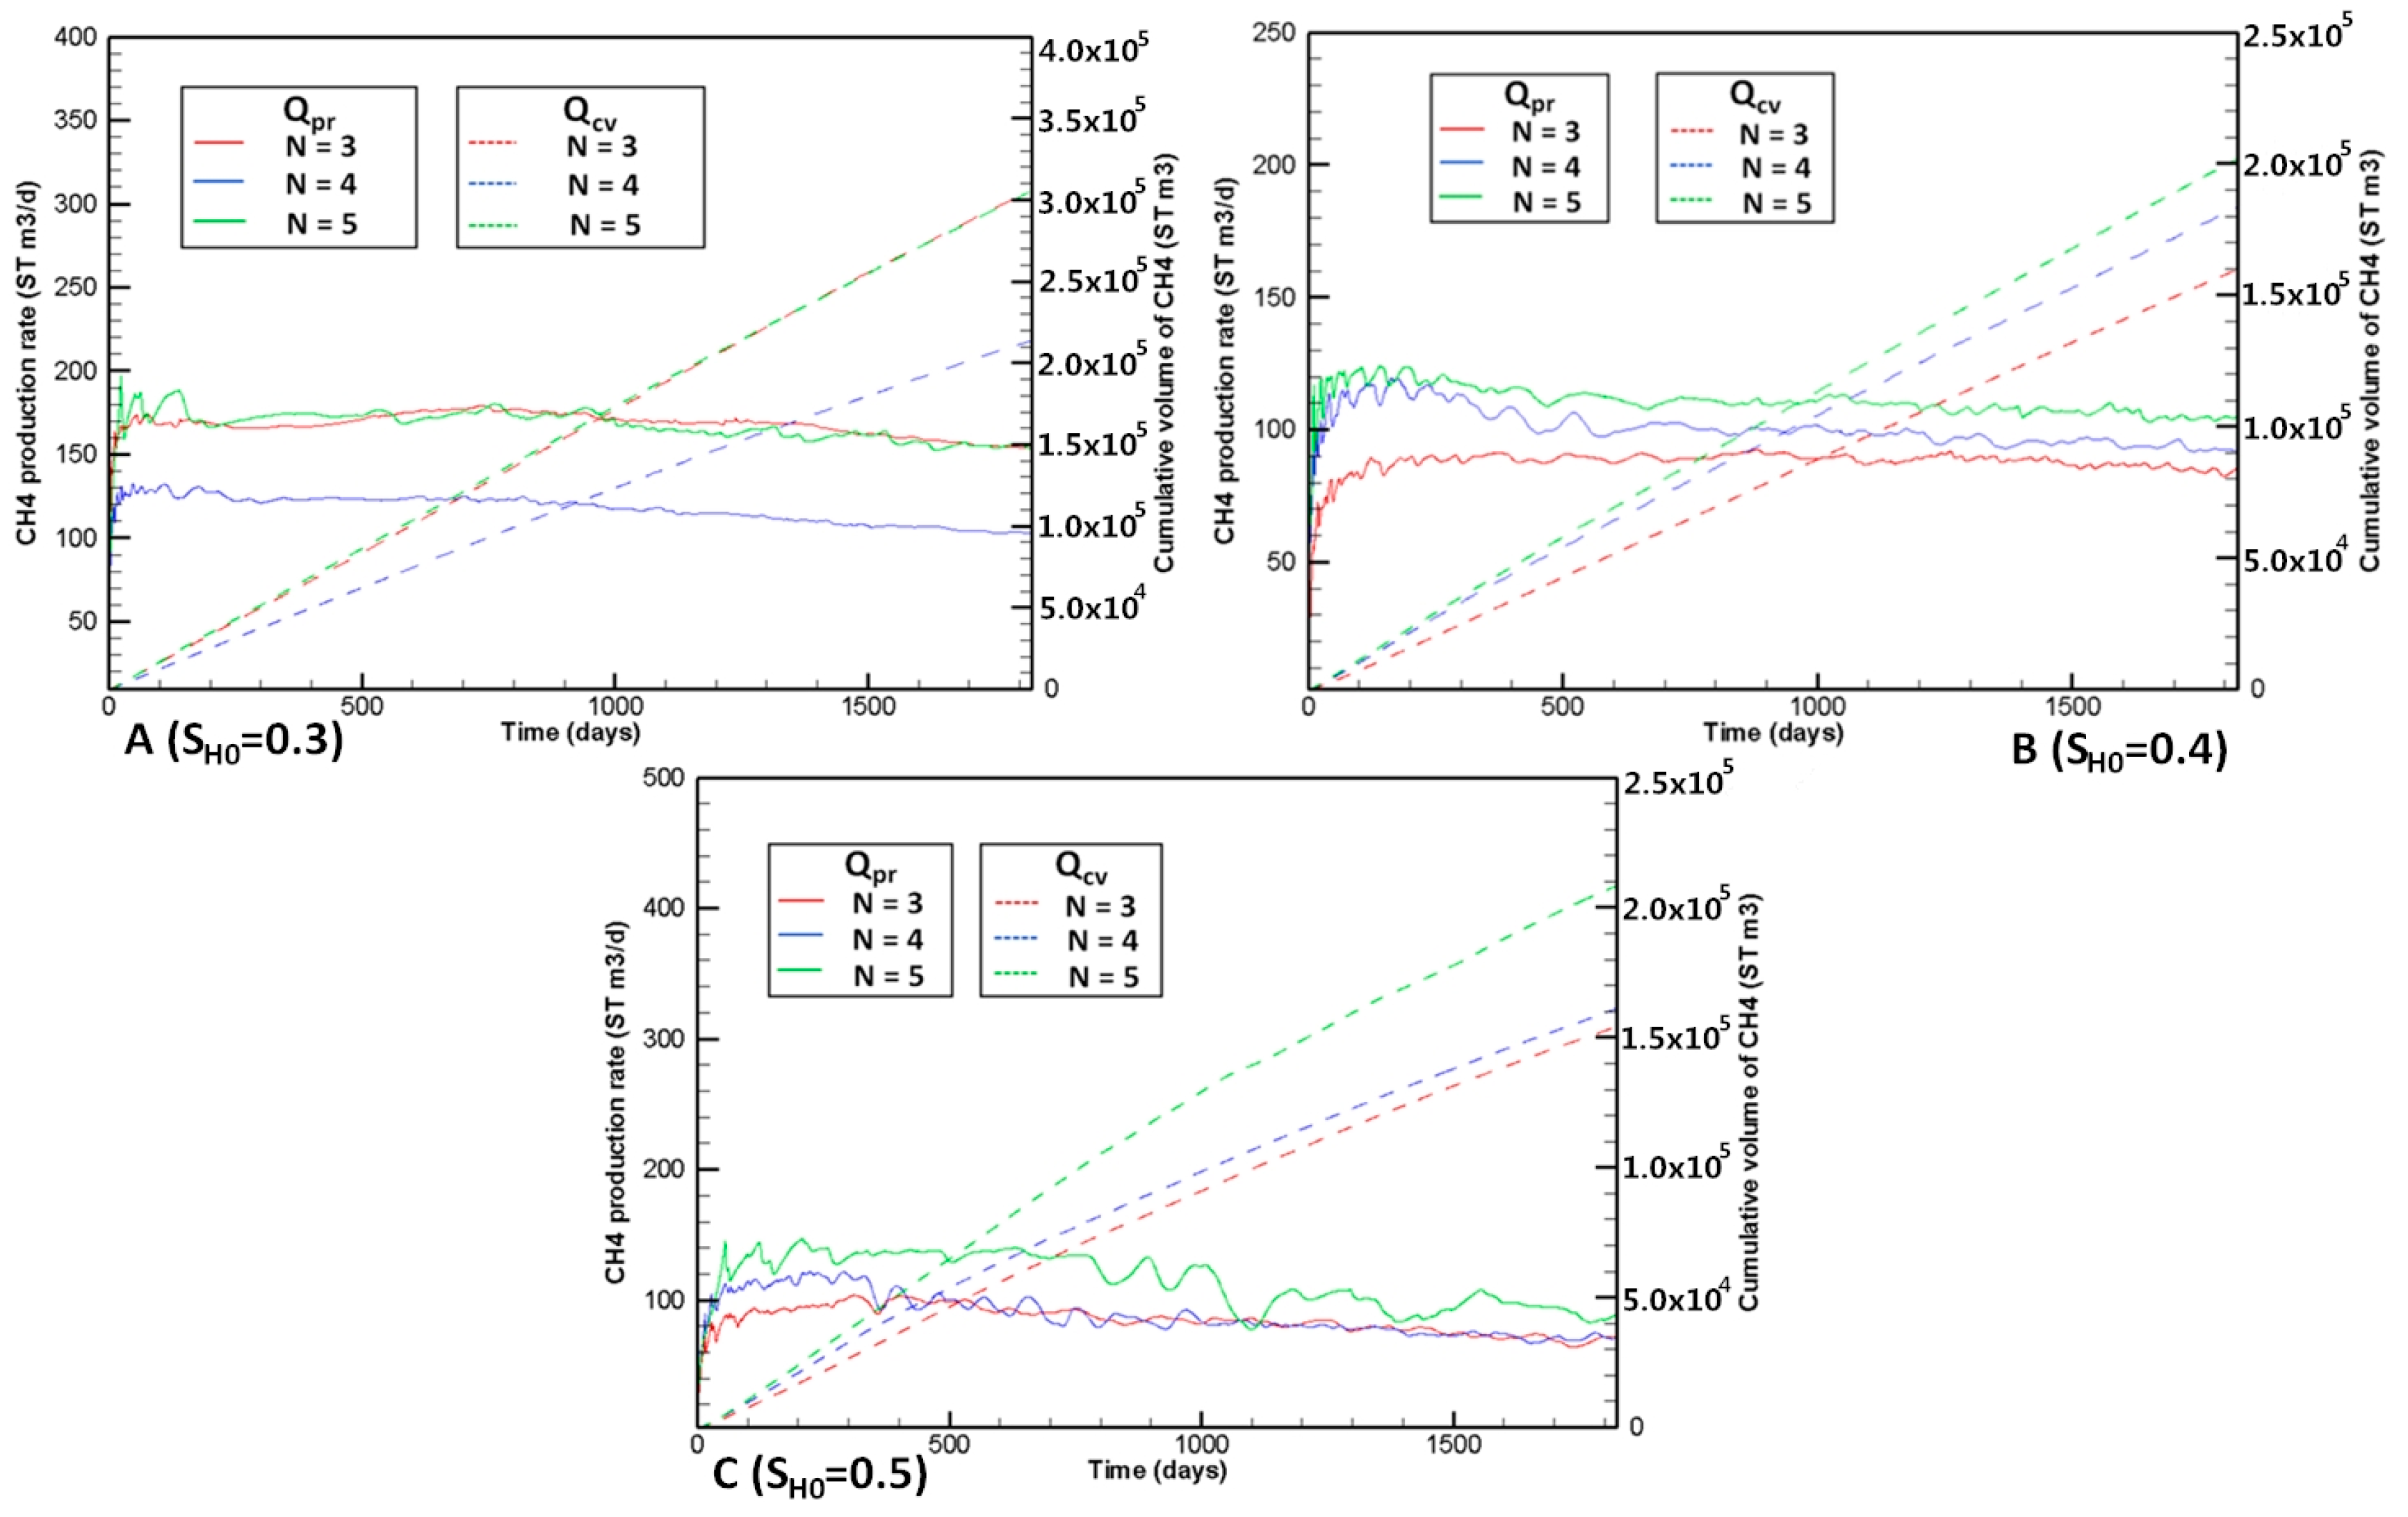
3.2.2. Analysis under Low-Permeability Condition (k = 7.5 mD)

Figure 3 showed the CH4 production rate (Qpr) and the cumulative volume (Qcv) curves under low-permeability conditions for different values of N. As shown in Qpr curves of Figure 3A, in the early stage of exploitation, the Qpr changed greatly, then tended to stabilize after about 200 days. The Qpr for cases N = 3 and N = 5 were similar and much bigger than that for case N = 4. As shown in Qcv curves, the Qcv for cases N = 3 and N = 5 were similar and much bigger than that for case N = 4, and the Qcv increased by 52.4%, in comparison with cases N = 3, N = 5, and N = 4. Our previous research results indicated that the crack spacing Δl and crack quantity N are the significant parameters for NGH exploitation, and the effect of crack spacing on gas production efficiency is greater than that of crack quantity [23]. Crack spacing Δl = 3 m is the most favorable crack spacing, and the gas production efficiency is increased with increasing crack quantity N [23]. The effective permeability is bigger under low-saturation conditions such that crack spacing Δl = 3 m had a better improvement effect for gas production efficiency. Therefore, the Qpr for cases N = 3 and N = 5 were similar and much bigger than that for case N = 4.
In Figure 3B, SH0 = 0.4. As shown in Qpr curves of Figure 3B, the differences of Qpr were small under three crack quantity conditions, and the Qpr for case N = 5 was the largest. As shown in Qcv curves, the Qcv for case N = 5 was the largest, and increased by 26.4%, in comparison with cases N = 3 and N = 5.
In Figure 3C, SH0 = 0.5. As shown in Qpr curves of Figure 3C, in the early stage of exploitation, the Qpr for case N = 5 was the biggest, and the Qpr for case N = 4 was bigger than that for case N = 3. As exploitation progressed, the Qpr for case N = 4 decreased and trended to stability, and the Qpr for cases N = 3 and N = 4 were similar. As shown in Qcv curves, the Qcv for case N = 5 was much bigger than that for cases N = 3 and N = 4, and case N = 4 was slightly bigger than case N = 3. This was because densely fractured networks had more cracks in the fracturing zone, with a high-density fractured network, which had a better improvement effect for the permeability of NGH deposits. In comparison with cases N = 5 and N = 3, the Qcv increased by 30.6%.
These results showed that, under low-permeability conditions, the influence of densely fractured networks on NGH conversion efficiency was most significant. However, the influences were similar for densely and sparsely fractured networks in low-permeability and low-saturation cases.

3.2.3. Analysis under High-Saturation Conditions (SH0 = 0.5)

Figure 3C and Figure 4 showed the CH4 production rate Qpr and the cumulative volume Qcv curves under high-saturation (SH0 = 0.5) and different N conditions. By comparing the Qpr curves of Figure 3C and Figure 4A,B, under k = 7.5 mD and 40 mD conditions, the Qpr for case N = 5 was bigger than that for cases N = 3 and 4 during the whole exploitation process, and Qpr for cases N = 3 and 4 were similar. In high-permeability cases, the Qpr and Qcv for case N = 3 were the largest.
In Figure 4A, k = 40 mD. As shown in Qcv curves, the Qcv for case N = 5 was much bigger than that for cases N = 3 and N = 4, and the Qcv for cases N = 3 and N = 4 were similar, and Qcv increased by 14.1%, in comparison with cases N = 4 and N = 5. In Figure 4B, k = 75 mD. As shown in Qcv curves, in the early stage, the Qcv of three cases were similar, and then, the Qcv for case N = 3 was the biggest, and the Qcv for case N = 5 was bigger than that for case N = 4 at later time. The Qcv increased by 21.3%, in comparison with cases N = 3 and N = 4. This was because intrinsic permeability was the most important factor affecting gas production efficiency. Under high-permeability conditions, the decomposition front was close to the production well in the early stage, the effects of crack spacing and crack quantity on gas production efficiency were small in this time. As exploitation progressed, hydrate decomposition area was gradually removed from the production well, the effect of RST on gas production efficiency became significant. Therefore, production rate and cumulative volume were higher for N = 3 compared to N = 4 and N = 5 at later time. However, in low-permeability cases, densely fractured networks had more cracks in the fracturing zone, which had a better improvement effect for the permeability of NGH deposits.
These results showed that, under high-saturation conditions, the influence of densely fractured networks on NGH conversion efficiency was most significant. However, the influence of sparsely fractured networks was better in high-permeability and high-saturation cases.

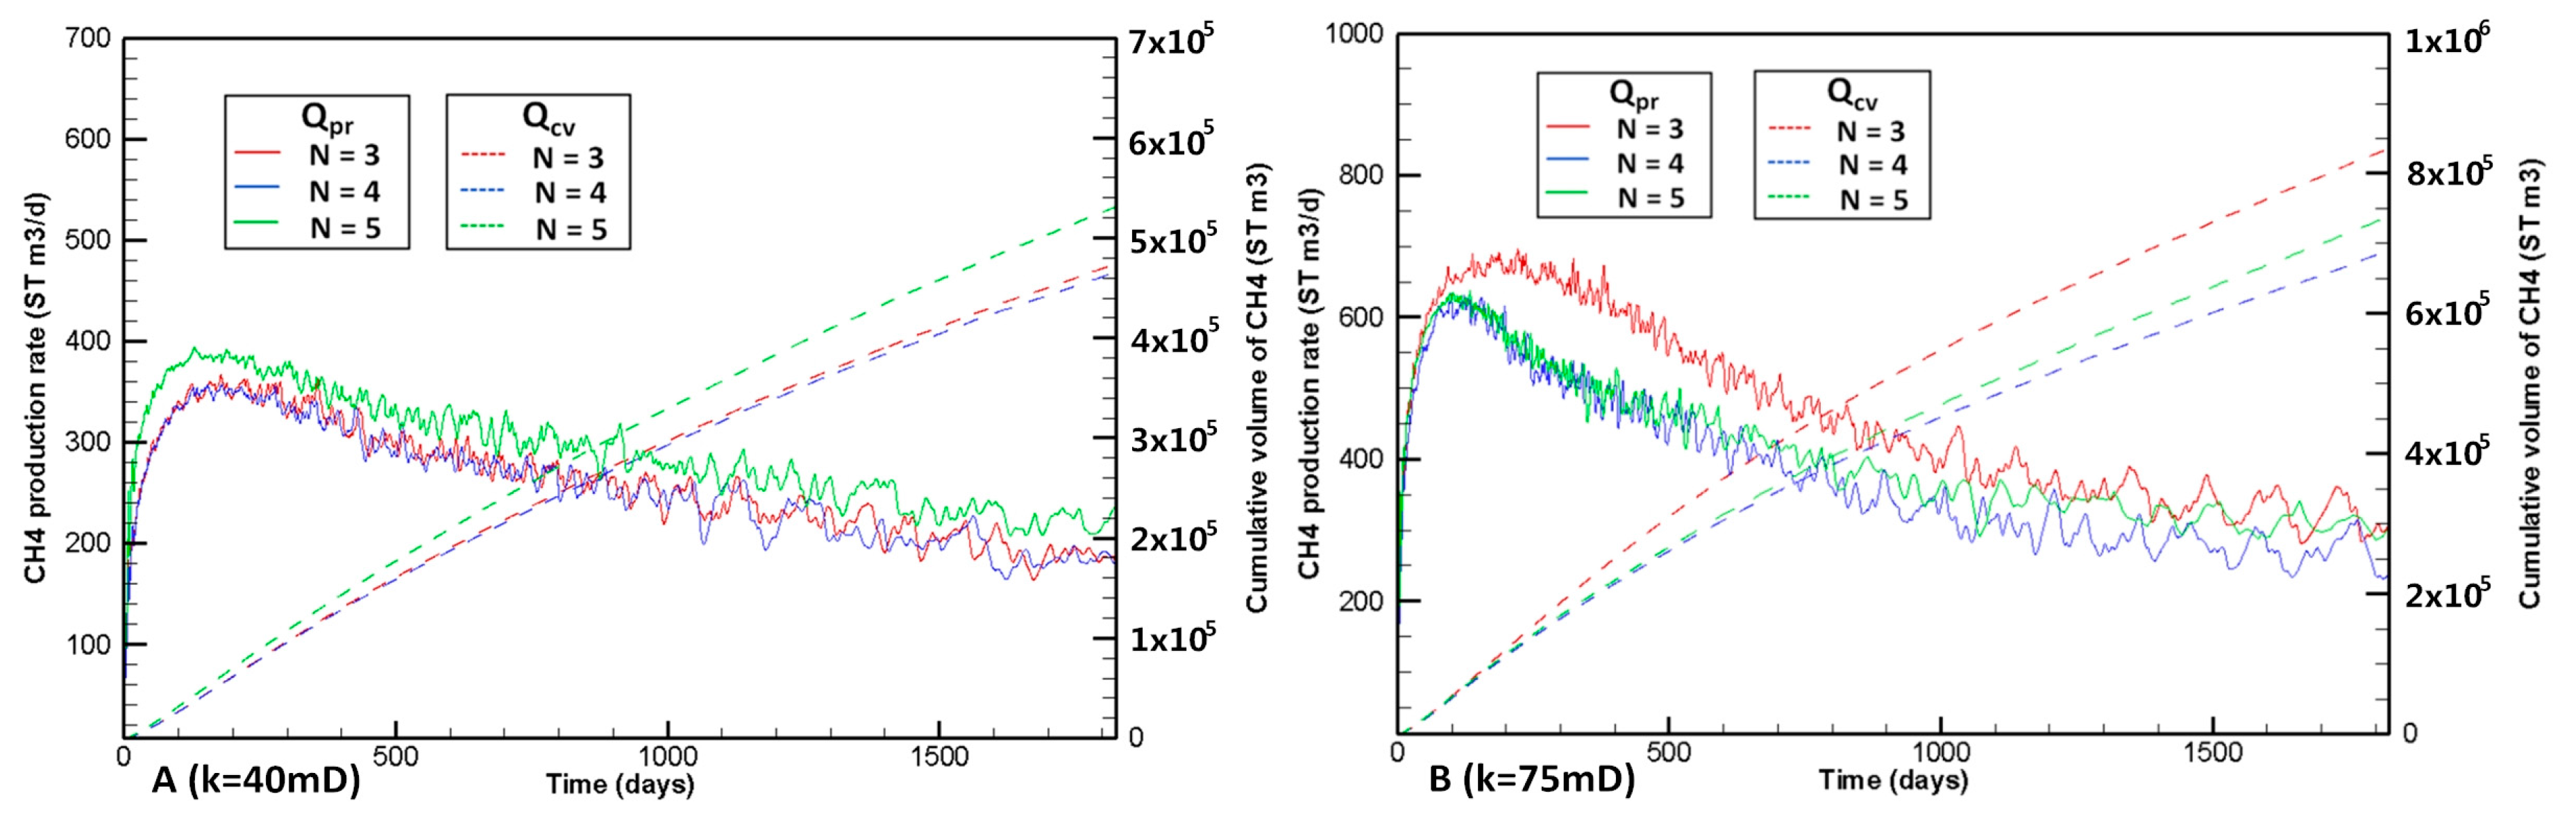
3.2.4. Analysis under Other Accumulation Conditions

Figure 5 showed the CH4 production rate Qpr and the cumulative volume Qcv curves under other accumulation conditions. As showed in Qpr curves of Figure 5, in the early stage of exploitation, the Qpr for case N = 5 was smaller than that for case N = 3. However, as exploitation progressed, the Qpr for case N = 5 reached the stable value earlier, and the stable value for case N = 5 was larger than that for case N = 3. By comparing the Qpr curves of Figure 5, the higher the permeability, the lower the saturation, the earlier the Qpr for case N = 5 exceeded case N = 3. This was because, under higher permeability and lower saturation conditions, there were more seepage channels to facilitate the discharge of methane to the production well, and the NGH dissociation area was closed to the production well in the early stage of exploitation, therefore, the improvement effect of densely fractured networks for NGH deposit permeability was not obvious. As exploitation progressed, the improvement effect of densely fractured networks was increased with increasing the distance between the production well and decomposition front. Additionally, in higher permeability and lower saturation cases, the NGH dissociation rates were faster.
In Figure 5A, k = 40 mD, SH0 = 0.3. As shown in Qcv curves, the Qcv for cases N = 3 and N = 5 were similar and bigger than that for case N = 4 at five years, and the Qcv increased by about 13.3%, in comparison with cases N = 3, N = 5, and N = 4. Furthermore, as exploitation progressed, the Qcv for cases N = 5 was bigger than that for case N = 3. In Figure 5B, SH0 = 0.4. As shown in Qcv curves, the Qcv for case N = 3 was slightly bigger than that for case N = 5, and the Qcv increased by 33.8%, in comparison with cases N = 4 and N = 3. In Figure 5C, SH0 = 0.3. As shown in Qcv curves, the Qcv for case N = 5 was bigger than that for cases N = 3 and N = 4, and the Qcv increased by 13.8% in comparison with cases N = 5 and N = 4. In Figure 5D, SH0 = 0.4. As shown in Qcv curves, the Qcv for cases N = 3 and 5 were much bigger than that for case N = 4, and the Qcv for case N = 5 was the largest. The Qcv increased by 18.4%, in comparison with cases N = 4 and N = 5. This was because crack spacing Δl = 3 m is the most favorable crack spacing, and the effect of crack spacing on gas production efficiency is greater than that for crack quantity. Therefore, the production rate for N = 3 was bigger that for N = 4. Under low-saturation cases, the effective permeability was higher than that for high-saturation cases, there were more heat and mass transfer channels in low-saturation conditions. Therefore, a higher effective permeability led to a higher gas production efficiency.
These results showed that the influence of densely fractured networks on NGH conversion efficiency was most significant under these accumulation conditions.

4. Conclusions

In this paper, NGH deposits in the Shenhu area, on the northern slope of the South China Sea was simulated using TOUGH+HYDRATE v1.0 via RST and the single vertical well depressurization method. Based on the simulation results, the following conclusions were drawn:
(1)
Combining RST and the single vertical well depressurization method to exploit NGH deposits under different intrinsic permeability and initial NGH saturation conditions, the sensitivity of stimulation effects on NGH conversion efficiency was significant. Furthermore, the sensitivity of intrinsic permeability was larger than that for initial NGH saturation, and the influence of the interaction between these three factors was not obvious.
(2)
For the stimulated NGH deposits, NGH conversion efficiency was substantially increased with increasing intrinsic permeability. However, the growth rate decreased, and a lower NGH saturation led to a higher NGH conversion efficiency. The influence on NGH conversion efficiency was increased by about four times in comparison with initial NGH saturation and intrinsic permeability.
(3)
The sensitivity of the variable stimulation effect on NGH conversion efficiency decreased with increasing initial NGH saturation and intrinsic permeability, respectively, and the sensitivity was most significant under lower intrinsic permeability condition. The influence of intrinsic permeability on the sensitivity of stimulation effect on NGH conversion efficiency was bigger than that for initial NGH saturation.
(4)
The stimulation effects required for a higher NGH conversion efficiency were different under different accumulation conditions. For sparsely fractured networks, the influence was significant under higher permeability and saturation conditions. Furthermore, under lower permeability and saturation conditions, the influence between sparsely and densely fractured networks were similar. For other accumulation cases, dense fracture networks had a significant influence.
It should be stressed here the conclusions above are based on purely numerical simulations. With the development of the reservoir stimulation technique, it would probably be applied to exploit marine gas hydrates and improve conversion efficiency. This will greatly expand the potential use of NGH as a gas resource. Of course, it still requires experimental verification, which is currently under consideration.

Acknowledgments

This study has been supported by National Natural Science Foundation of China (grant no. 41672361, 41502343, and 51474112), Scientific and Technological Development Program of Jilin Province (grant no. 20170414044GH and 20160204011SF), New energy projects (grant no. SXGJSF2017-5), and Program for JLU Science and Technology Innovative Research Team (JLUSTIRT).

Author Contributions

Lin Yang analyzed the data and wrote the manuscript. Lin Yang, Dongbin Pan, Yong Chen, and Xitong Li performed the simulations. Rui Jia, Lin Yang, and Chen Chen conceived the original ideas. All authors discussed the results and commented on the manuscript. Chen Chen, Youhong Sun, and Wei Guo directed the overall project.

Conflicts of Interest

The authors declare no conflicts of interest.

Nomenclature

TCFTrillion cubic feet, 1 Tcf = 283.17 × 10⁹ m3
zposition of HBL below ocean surface(m)
ZHHBL thickness(m)
H1Depth of hydrate bearing layer (HBL) below seafloor(m)
H2Depth of seafloor(m)
HwProduction well length(m)
GThermal gradient below seafloor(°C/m)
P0Initial pressure (at base of HBL)(MPa)
ΔPProduction pressure(MPa)
PcapCapillary pressure(MPa)
P01Atmosphere pressure(Pa)
T0Initial temperature (at base of HBL)(°C)
k, kx, ky, kzIntrinsic permeability(mD)
kcPermeability of fracturing cracks (h2 = 10 mm)(mD)
krAAqueous relative permeability(mD)
krGGas relative permeability(mD)
KdryDry thermal conductivity(W/(kg·°C))
KwetWet thermal conductivity(W/(kg·°C))
KΘThermal conductivity(W/(kg·°C))
ΦPorosity
ρRGrain density(kg/m3)
SHSaturation of natural gas hydrate
SH0Initial saturation of natural gas hydrate
SASaturation of aqueous
rRadius(m)
XsSalinity
λVan Genuchten exponent—Table 2
hCrack height(mm)
LfCrack length(m)
ΔlCrack spacing(m)
*, **, ***Significance level

Subscripts and Superscripts

AAqueous phase
BBase of HBL
capCapillary
GGas phase
HBLHydrate-bearing layer
irAIrreducible aqueous phase
irGIrreducible gas
NPermeability reduction exponent—Table 2
nGGas permeability reduction exponent—Table 2
OBOverburden
UBUnderburden

References

  1. Sloan, E.D.; Koh, C.A. Clathrate Hydrates of Natural Gases, 3rd ed.; CRC Press: Boca Raton, FL, USA, 2008. [Google Scholar]
  2. Qorbani, K.; Kvamme, B.; Kuznetsova, T. Using a reactive transport simulator to simulate CH4 production from bear island basin in the Barents Sea utilizing the depressurization method. Energies 2017, 10, 187. [Google Scholar] [CrossRef]
  3. Kvenvolden, K.A. Potential effects of gas hydrate on human welfare. Proc. Natl. Acad. Sci. USA 1999, 96, 3420. [Google Scholar] [CrossRef] [PubMed]
  4. Max, M.D.; Johnson, A.H. Exploration and Production of Oceanic Natural Gas Hydrate: Critical Factors for Commercialization; Springer: Basel, Switzerland, 2016; p. 405. [Google Scholar]
  5. Ruan, X.; Li, X.S.; Xu, C.G. Numerical investigation of the production behavior of methane hydrate under depressurization conditions combined with well-wall heating. Energies 2017, 10, 161. [Google Scholar] [CrossRef]
  6. Kezirian, M.T.; Phoenix, S.L. Natural gas hydrate as a storage mechanism for safe, sustainable and economical production from offshore petroleum reserves. Energies 2017, 10, 828. [Google Scholar] [CrossRef]
  7. Lim, J.Y.; Kim, E.; Seo, Y.W. Dual inhibition effects of diamines on the formation of methane gas hydrate and their significance for natural gas production and transportation. Energy Convers. Manag. 2016, 124, 578–586. [Google Scholar] [CrossRef]
  8. Yelisetti, S.; Spence, G.D.; Riedel, M. Role of gas hydrates in slope failure on frontal ridge of northern Cascadia margin. Geophys. J. Int. 2014, 199, 441–458. [Google Scholar] [CrossRef]
  9. Max, M.D.; Johnson, A.H. Diagenetic methane hydrate formation in permafrost: A new gas play? In Proceedings of the OTC Arctic Technology Conference, Houston, TX, USA, 7–9 February 2011. [Google Scholar]
  10. Birkedal, K.A.; Hauge, L.P.; Graue, A.; Ersland, G. Transport Mechanisms for CO2-CH4 Exchange and Safe CO2 Storage in Hydrate-Bearing Sandstone. Energies 2015, 8, 4073–4095. [Google Scholar] [CrossRef]
  11. Feng, J.C.; Li, G.; Li, X.S.; Li, B.; Chen, Z.Y. Evolution of hydrate dissociation by warm brine stimulation combined depressurization in the South China Sea. Energies 2013, 6, 5402–5425. [Google Scholar] [CrossRef]
  12. Konno, Y.; Masuda, Y.; Akamine, K.; Naiki, M.; Nagao, J. Sustainable gas production from methane hydrate reservoirs by the cyclic depressurization method. Energy Convers. Manag. 2016, 108, 439–445. [Google Scholar] [CrossRef]
  13. Wang, B.; Huo, P.; Luo, T.; Fan, Z.; Liu, F.L.; Xiao, B.; Yang, M.J.; Zhao, J.F.; Song, Y.C. Analysis of the Physical Properties of Hydrate Sediments Recovered from the Pearl River Mouth Basin in the South China Sea: Preliminary Investigation for Gas Hydrate Exploitation. Energies 2017, 10, 531. [Google Scholar] [CrossRef]
  14. Li, G.; Moridis, G.J.; Zhang, K.; Li, X.S. Evaluation of NGH conversion potential from marine gas hydrate deposits in Shenhu area of South China Sea. Energy Fuels 2010, 24, 6018–6033. [Google Scholar] [CrossRef]
  15. Zhang, W.; Liang, J.Q.; Lu, J.A.; Wei, J.G.; Su, P.B.; Fang, Y.X.; Guo, Y.Q.; Yang, S.X.; Zhang, G.X. Accumulation mechanisms of high saturation natural gas hydrate in Shenhu Area, northern South China Sea. Pet. Explor. Dev. 2017, 44, 1–11. [Google Scholar] [CrossRef]
  16. He, J.X.; Yan, W.; Zhu, Y.H.; Zhang, W.; Gong, F.X.; Liu, S.L.; Zhang, J.R.; Gong, X.F. Bio-genetic and sub-biogenetic gas resource potential and genetic types of natural gas hydrate in the northern marginal basins of South China Sea. Nat. Gas Ind. 2013, 33, 121–134. [Google Scholar]
  17. Su, M.; Yang, R.; Wu, N.Y. Structural characteristics in the Shenhu Area, northern continental slope of South China Sea, and their influence on gas hydrate. Acta Geol. Sin. 2014, 88, 318–326. [Google Scholar]
  18. Liang, J.Q.; Wang, H.B.; Su, X. Natural gas hydrate formation conditions and the associated controlling factors in the northern slope of the South China Sea. Nat. Gas Ind. 2014, 34, 128–135. [Google Scholar]
  19. McDonnell, S.L.; Max, M.D.; Cherkis, N.Z.; Czarnecki, M.F. Tectono-sedimentary controls on the likelihood of gas hydrate occurrence near Taiwan. Mar. Pet. Geol. 2000, 17, 929–936. [Google Scholar] [CrossRef]
  20. Guo, Y.Q.; Yang, S.X.; Liang, J.Q.; Lu, J.A.; Lin, L.; Kuang, Z.G. Characteristics of high gas hydrate distribution in the Shenhu Area on the northern slope of the South China Sea. Earth Sci. Front. 2017, 24, 24–31. [Google Scholar]
  21. Yang, S.X.; Liang, J.Q.; Liu, C.L.; Sha, Z.B. Progresses of gas hydrate resources exploration in sea area. Geol. Surv. China 2017, 4, 1–8. [Google Scholar] [CrossRef]
  22. Su, Z.; Li, H.; Wu, N.Y.; Yang, S.X. Effect of thermal stimulation on NGH conversion from hydrate deposits in Shenhu area of the South China Sea. Earth Sci. 2013, 56, 601–610. [Google Scholar]
  23. Chen, C.; Yang, L.; Jia, R.; Sun, Y.H.; Guo, W.; Chen, Y.; Li, X.T. Simulation study on the effect of fracturing technology on the production efficiency of natural gas hydrate. Energies 2017, 10, 1241. [Google Scholar] [CrossRef]
  24. Wu, Q.; Xu, Y.; Liu, Y.Z.; Ding, Y.H.; Wang, X.Q.; Wang, T.F. The current situation of stimulated reservoir volume for shale in U.S. and its inspiration to China. Oil Drill. Prod. Technol. 2011, 33, 1–7. [Google Scholar] [CrossRef]
  25. Lancaster, D.E.; Holditch, S.A.; Mcketta, S.F.; Hill, R.E.; Guidry, F.K.; Jochen, J.E. Reservoir evaluation, completion techniques, and recent results from Barnett shale development in the Fort Worth basin. In Proceedings of the SPE Annual Technical Conference and Exhibition, Washington, DC, USA, 4–7 October 1992. [Google Scholar]
  26. Li, Y.; Cao, G. Development technology for low-permeability sandstone reservoirs in Shengli Oil field. Pet. Explor. Dev. 2005, 32, 123–126. [Google Scholar]
  27. Wu, Q.; Xu, Y.; Wang, T.F.; Wang, X.Q. The revolution of reservoir stimulation: An introduction of volume fracturing. Nat. Gas Ind. 2011, 31, 7–12. [Google Scholar]
  28. Zhang, Y.J.; Li, Z.W.; Guo, L.L.; Gao, P.; Jin, X.P.; Xu, T.F. Electricity generation from enhance geothermal systems by oilfield produced water circulating through reservoir stimulated by staged fracturing technology for horizontal wells: A case study in Xujiaweizi area in Daqing Oilfield, China. Energy 2014, 78, 788–805. [Google Scholar] [CrossRef]
  29. Sun, Y.H.; Li, B.; Wei, G. Comparative Analysis of a Production Trial and Numerical Simulations of NGH conversion from Multilayer Hydrate Deposits in the Qilian Mountain Permafrost. J. Nat. Gas Sci. Eng. 2014, 21, 456–466. [Google Scholar] [CrossRef]
  30. Song, Y.; Zhang, L.; Lv, Q.; Yang, M.; Ling, Z.; Zhao, J. Assessment of NGH conversion from natural gas hydrate using depressurization, thermal stimulation and combined method. RSC Adv. 2016, 6, 47357–47367. [Google Scholar] [CrossRef]
  31. Qorbani, K.; Kvamme, B. Non-equilibrium simulation of CH4 production from gas hydrate reservoirs through the depressurization method. J. Nat. Gas Sci. Eng. 2016, 35, 1544–1554. [Google Scholar] [CrossRef]
  32. Moridis, G.J.; Kowalsky, M.B.; Pruess, K. TOUGH+HYDRATE v1.0 User’s Manual: A Code for the Simulation of System Behavior in Hydrate-Bearing Geologic Media; Lawrence Berkeley National Laboratory: Berkeley, CA, USA, 2008.
  33. Moridis, G.J.; Seol, Y.; Kneafsey, T.J. Studies of reaction kinetics of methane hydrate dissociation in porous media. In Proceedings of the 5th International Conference on Gas Hydrate, Trondheim, Norway, 13–16 June 2005; p. 1004. [Google Scholar]
  34. Van Genuchten, M.T. A closed-form equation for predicting the hydraulic conductivity of unsaturated soil. Soil Sci. Soc. Am. J. 1980, 44, 892–898. [Google Scholar] [CrossRef]
  35. Li, G.; Li, X.S.; Chen, Q.; Chen, Z.Y. Numerical simulation of NGH conversion from gas hydrate zone in Shenhu are, South China Sea. Acta Chim. Sin. 2010, 68, 1083–1092. [Google Scholar]
  36. Phillips, O.M. Flow and Reactions in Permeable in Permeable Rocks; Cambridge University Press: Cambridge, UK, 1991. [Google Scholar]
  37. Verma, A.; Pruess, K. Thermohydrologic conditions and silica redistribution near high-level nuclear wastes emplaced in saturated geological formations. J. Geophys. Res. 1988, 93, 1159–1173. [Google Scholar] [CrossRef]
  38. Xu, T.; Ontoy, Y.; Molling, P.; Spycher, N.; Parini, M.; Pruess, K. Reactive transport Modeling of injection well scaling and acidizing at Tiwi field, Philippines. Geothermics 2004, 33, 477–491. [Google Scholar] [CrossRef]
Figure 1. Location of the research area and drilling sites in the Shenhu area, on the northern slope of the South China Sea.
Energies 11 00339 g001
Figure 2. (A) Design of the production well, and (B) diagram of the horizontal stimulation cracks.
Energies 11 00339 g002
Figure 3. Qpr and Qcv from NGH deposit in the Shenhu area under low-permeability (k = 7.5 mD) conditions for different N values (N = 3, 4, and 5). (A) SH0 = 0.3; (B) SH0 = 0.4; (C) SH0 = 0.5.
Energies 11 00339 g003
Figure 4. Qpr and Qcv from NGH deposit in the Shenhu area under high-saturation (SH0 = 0.5) conditions for different N values (N = 3, 4, and 5). (A) k = 40 mD; (B) k = 75 mD.
Energies 11 00339 g004
Figure 5. Qpr and Qcv from NGH deposit in the Shenhu area under different accumulation conditions for different N values (N = 3, 4, and 5). (A) k = 40 mD, SH0 = 0.3; (B) k = 40 mD, SH0 = 0.4; (C) k = 75 mD, SH0 = 0.3; (D) k = 75 mD, SH0 = 0.4.
Energies 11 00339 g005
Table 1. The characteristics of the NGH deposits with greater exploitation potential.
GroupHBL Thick/mRange of SHAverage SHk/mD
SH2430–48%21%10
SH718–3420–44%41%75
W022413.7%
W072045–75%50%22–40
W11>7021–53%40%
W174519.4%
W196817–64%45.2%5.5
Table 2. Production trial properties and mathematical models.
ParameterValue
Initial pressure P0 (at base of HBL)13.83 MPa
Initial temperature T0 (at base of HBL)14.15 °C
Depth of seafloor1108 m
Thermal gradient0.0433 °C/m
HBL thickness ZH22 m
Production well length Hw6 m
Depth of HBL H1155–177 m
Gas composition100% CH4
Porosity Φ0.38
Water salinity (mass fraction) Xs0.0305
Grain density ρR2600 kg/m3
Dry thermal conductivity Kdry1.0 W/(kg·°C)
Wet thermal conductivity Kwet3.1 W/(kg·°C)
Production pressure Pw0.5P0
Composite thermal conductivity model [32,33] K θ = K d r y + ( S A + S H )
( K w e t K d r y ) + α S I K I
Capillary pressure model [34] P c a p =   P 01 [ ( S * ) 1 / λ 1 ] 1 λ
S * = ( S A S i r A ) / ( S m x A S i r A )
SirA0.29
λ0.45
P01105 Pa
Relative permeability model [32] K r A = ( S * ) n
K r G = ( S G * ) n G
S A * = ( S A S i r A ) / ( 1 S i r A )
S G * = ( S G S i r G ) / ( 1 S i r G )
EPM #2 model
N3.572
nG3.572
SirA0.30
SirG0.05
Table 3. Parameters of cracks.
ParameterValue of Cracks
Crack quantity3, 4, 5
Crack spacing Δl3 m (three cracks), 2 m (four cracks), 1 m (five cracks)
Permeability k0520 mD
Table 4. The simulation experiments factor level table.
LevelFactor
Intrinsic Permeability kInitial NGH Saturation SH0Cracks Quantity N
17.5 mD0.33
240 mD0.44
375 mD0.55
Table 5. L27(3)13 whole simulation experiment and results.
Test NumberkSH0k × SH0Nk × NSH0 × NQcv (m3)
1234567811
11 (7.5 mD)1 (0.3)111 (3)1111306,394.8
211112 (4)2222201,014.4
311113 (5)3333305,693.9
412 (0.4)2211123159,854.8
5122222231183,312.3
6122233312202,049.4
713 (0.5)3311132154,356.7
8133322213161,279.1
9133333321208,541.0
102 (40 mD)12312311697,573.4
11212323122615,799.1
12212331233692,369.2
13223112323643,712.3
14223123131541,653.4
15223131212618,998.9
16231212332473,955.6
17231223113465,767.0
18231231221531,254.1
193 (75 mD)13213211964,843.5
20313221322901,046.6
213132321331,025,723.8
22321313223898,493.9
23321321331792,966.1
24321332112939,190.8
25332113232835,660.1
26332121313688,925.5
27332132121737,725.1
T---------1.493 × 107
x 1 c v ¯ 211,589.9634,495.4--570,538.3-----
x 2 c v ¯ 582,270.1552,043.6--505,751.5-----
x 3 c v ¯ 864,952.8472,273.8--582,523.0-----
Table 6. Analysis of variance of Qcv.
ParametersSSdfMSFF0.05(2,8)F0.01(2,8)Significance
k1.933 × 101229.663 × 1011506.594.468.65***
SH01.118 × 101125.921 × 101031.044.468.65**
N3.070 × 101021.535 × 10108.054.468.65*
k × SH01.246 × 101043.114 × 1091.63---
k × N5.695 × 10941.424 × 1090.75---
SH0 × N2.028 × 10945.069 × 1080.27---
Error (e)1.526 × 101081.907 × 109----
Total (T)2.117 × 101226-----
Table 7. Multiple comparison of factor k.
Factor k x c v ¯ x 3 c v ¯ − 211,589.9 x 3 c v ¯ − 582,270.1
k3864,952.8653,362.9 **282,682.7 *
k2582,270.1370,680.2 **-
k1211,589.9--
Table 8. Multiple comparison of factor SH0.
Factor SH0 x c v ¯ x 1 c v ¯ − 472,273.8 x 1 c v ¯ − 552,043.6
SH01634,495.4162,221.6 **82,451.8 **
SH02552,043.679,769.8 *-
SH03472,273.8--
Table 9. Multiple comparison of factor N.
Factor N x c v ¯ x 3 c v ¯ − 505,751.5 x 3 c v ¯ − 570,538.3
N3582,523.076,771.5 **11,984.7 *
N1570,538.364,786.8 **-
N2505,751.5--
Table 10. Range analysis of Qcv for varying N in different SH0 conditions.
SH0N x c v ¯ (m3) (k = 7.5, 40, 75 mD)Rcvrcv
0.33656,270.6101,975.60.178
4572,620.0
5674,595.6
0.43567,353.780,769.10.160
4505,977.3
5586,746.4
0.53487,990.853,849.50.123
4438,657.2
5492,506.7
Table 11. Range analysis of Qcv of variably N in different k conditions.
k/mDN x c v ¯ (m3) (SH0 = 0.3, 0.4, 0.5)Rcvrcv
7.53271,034.489,165.80.490
4181,868.6
5238,761.4
403605,080.473,134.20.135
4541,073.2
5614,207.4
753899,665.8106,567.10.134
4794,312.7
5900,879.8

