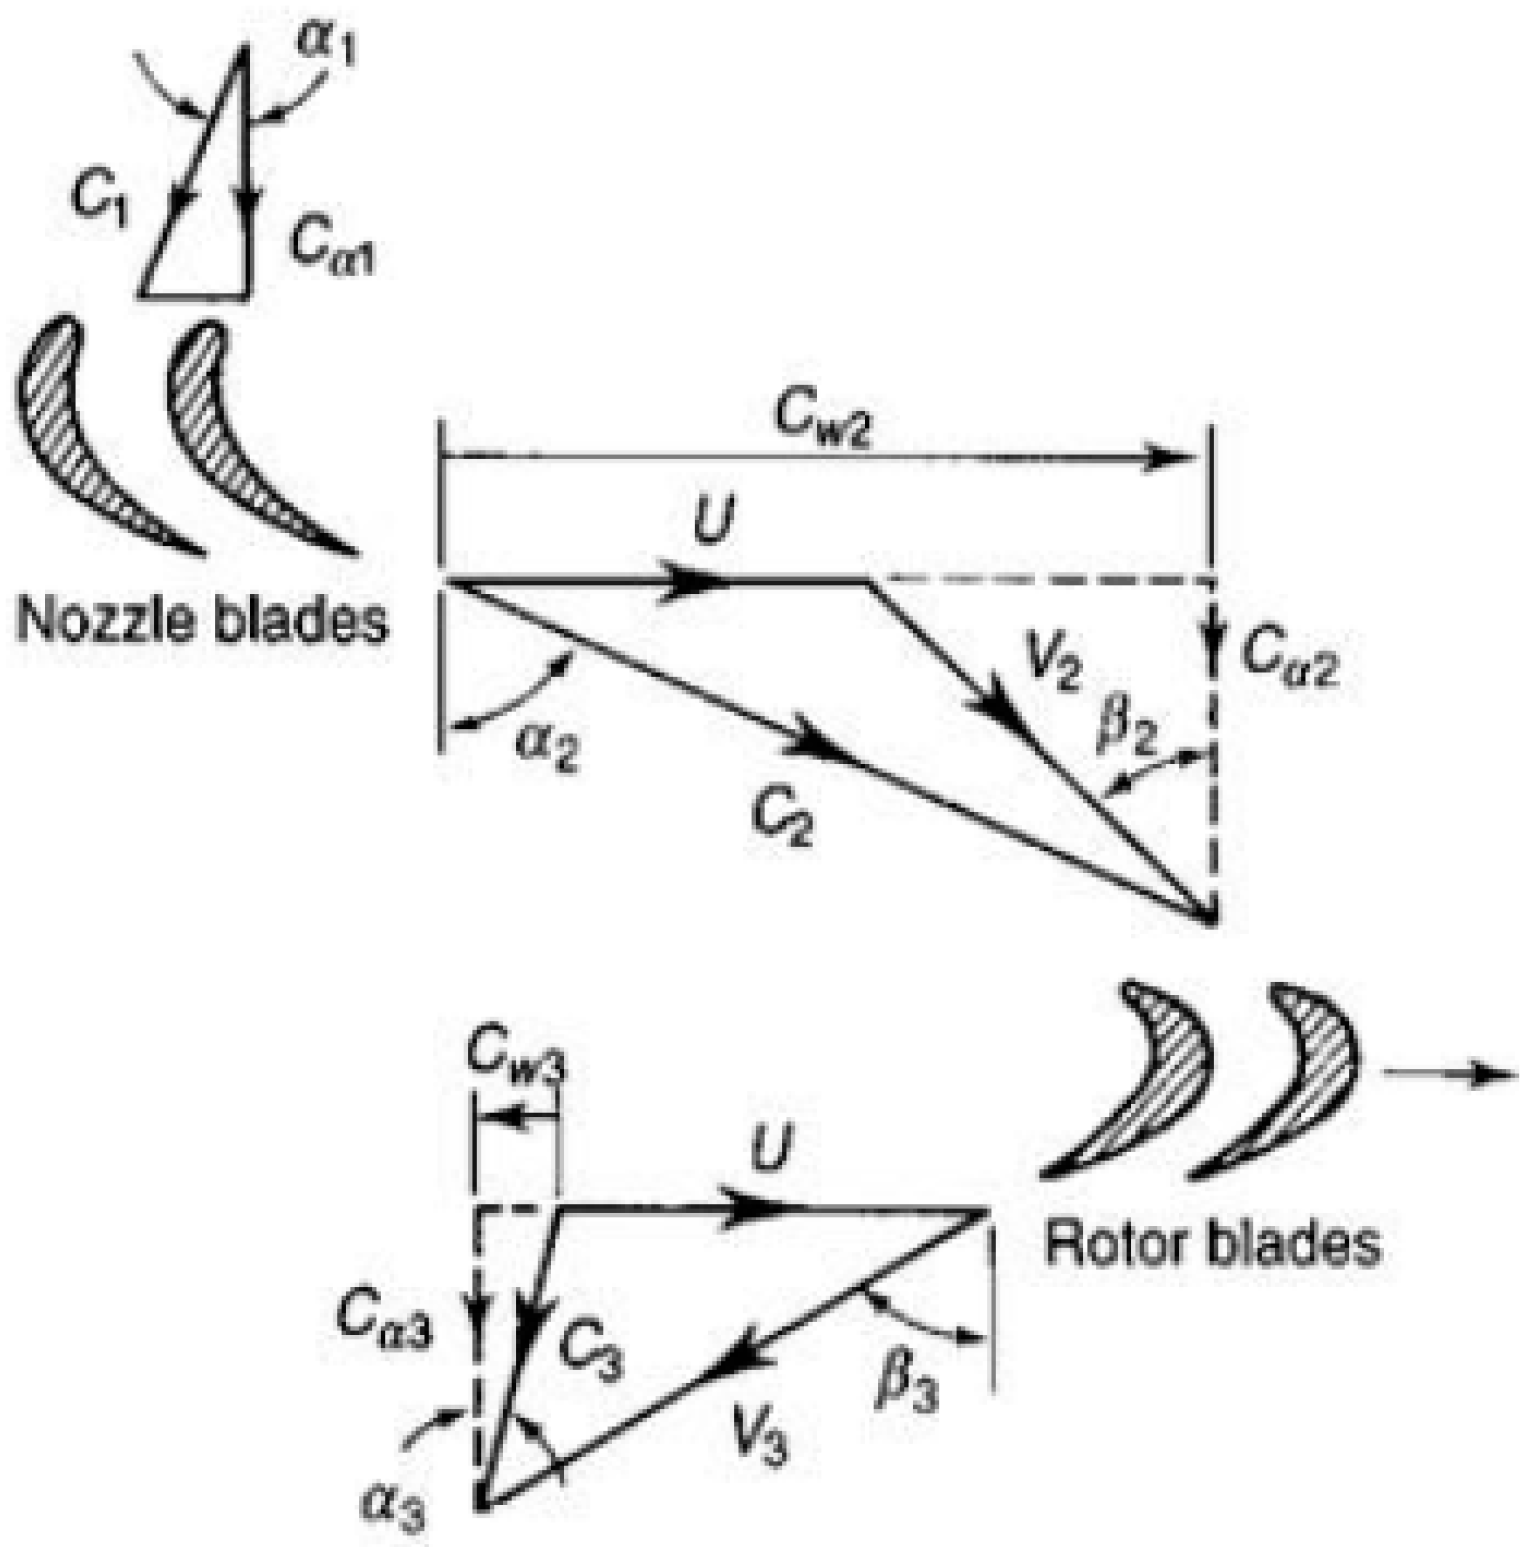
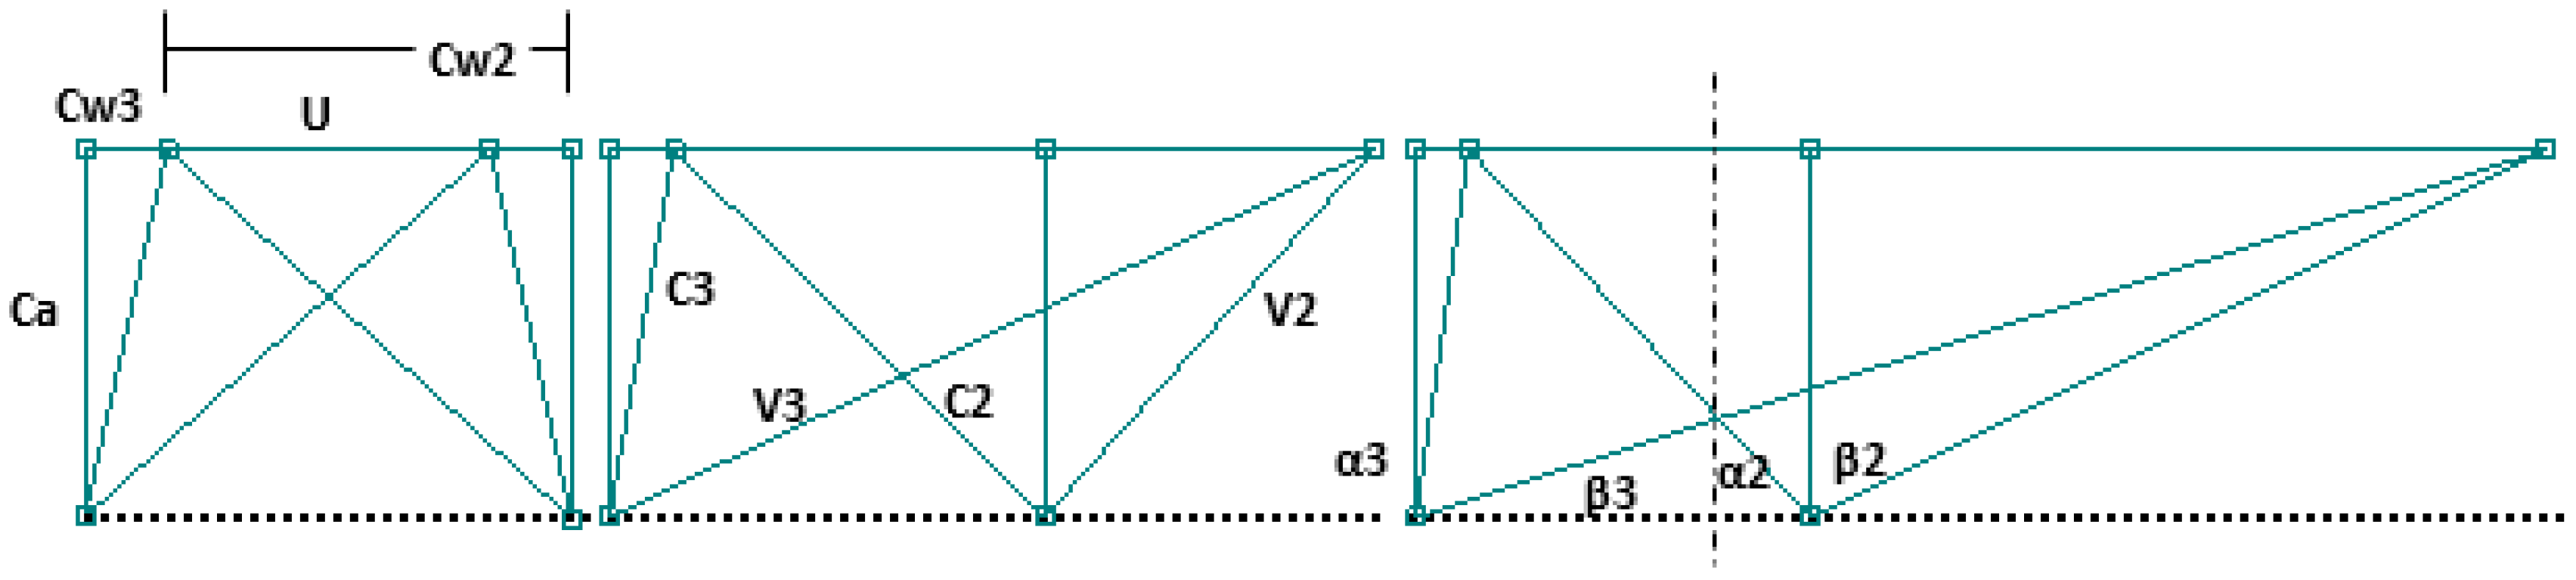
Figure 1.
Velocity diagram of a turbine nozzle inlet and exit as well as as the turbine rotor exit [
12].
Figure 1.
Velocity diagram of a turbine nozzle inlet and exit as well as as the turbine rotor exit [
12].
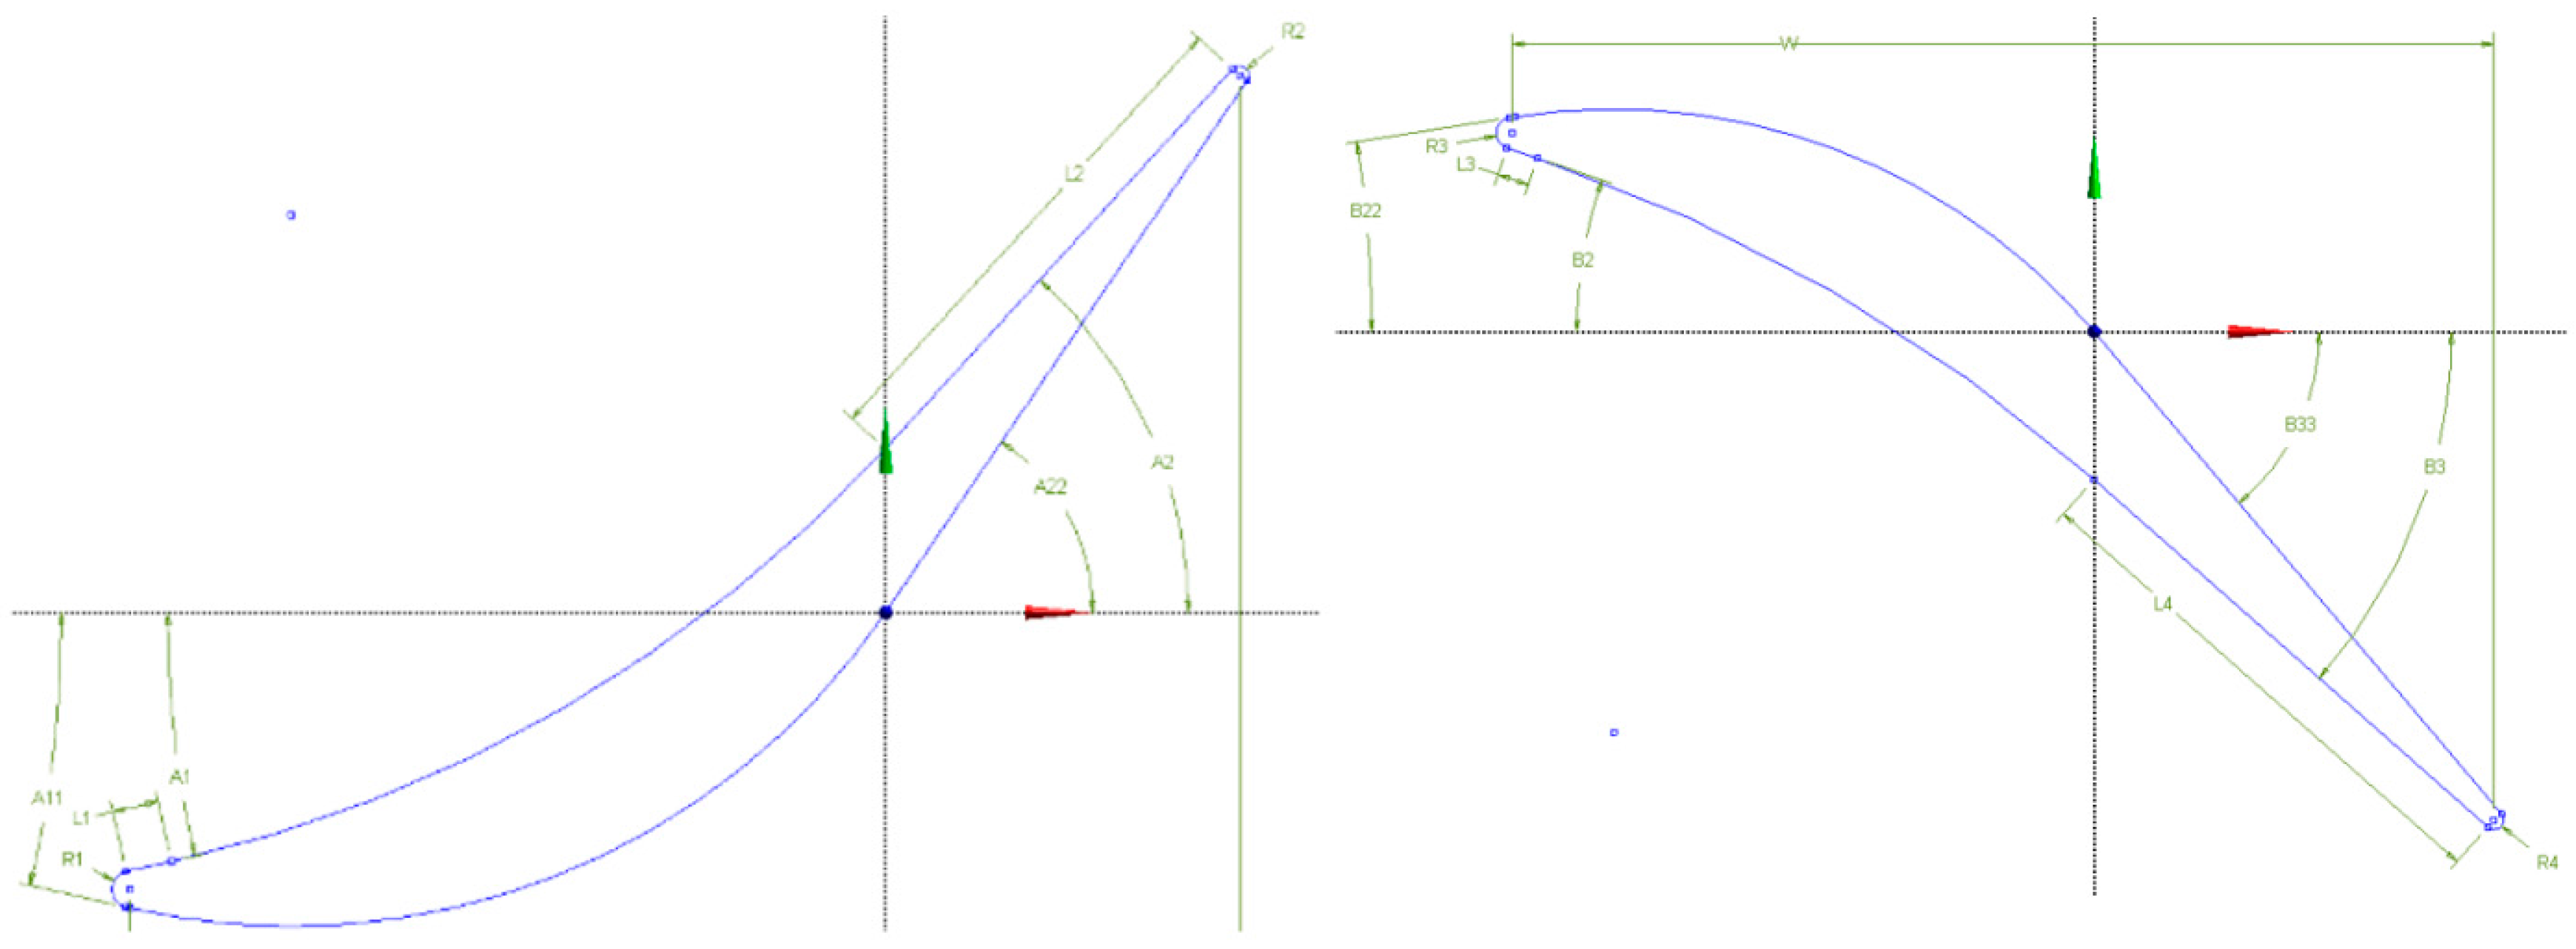
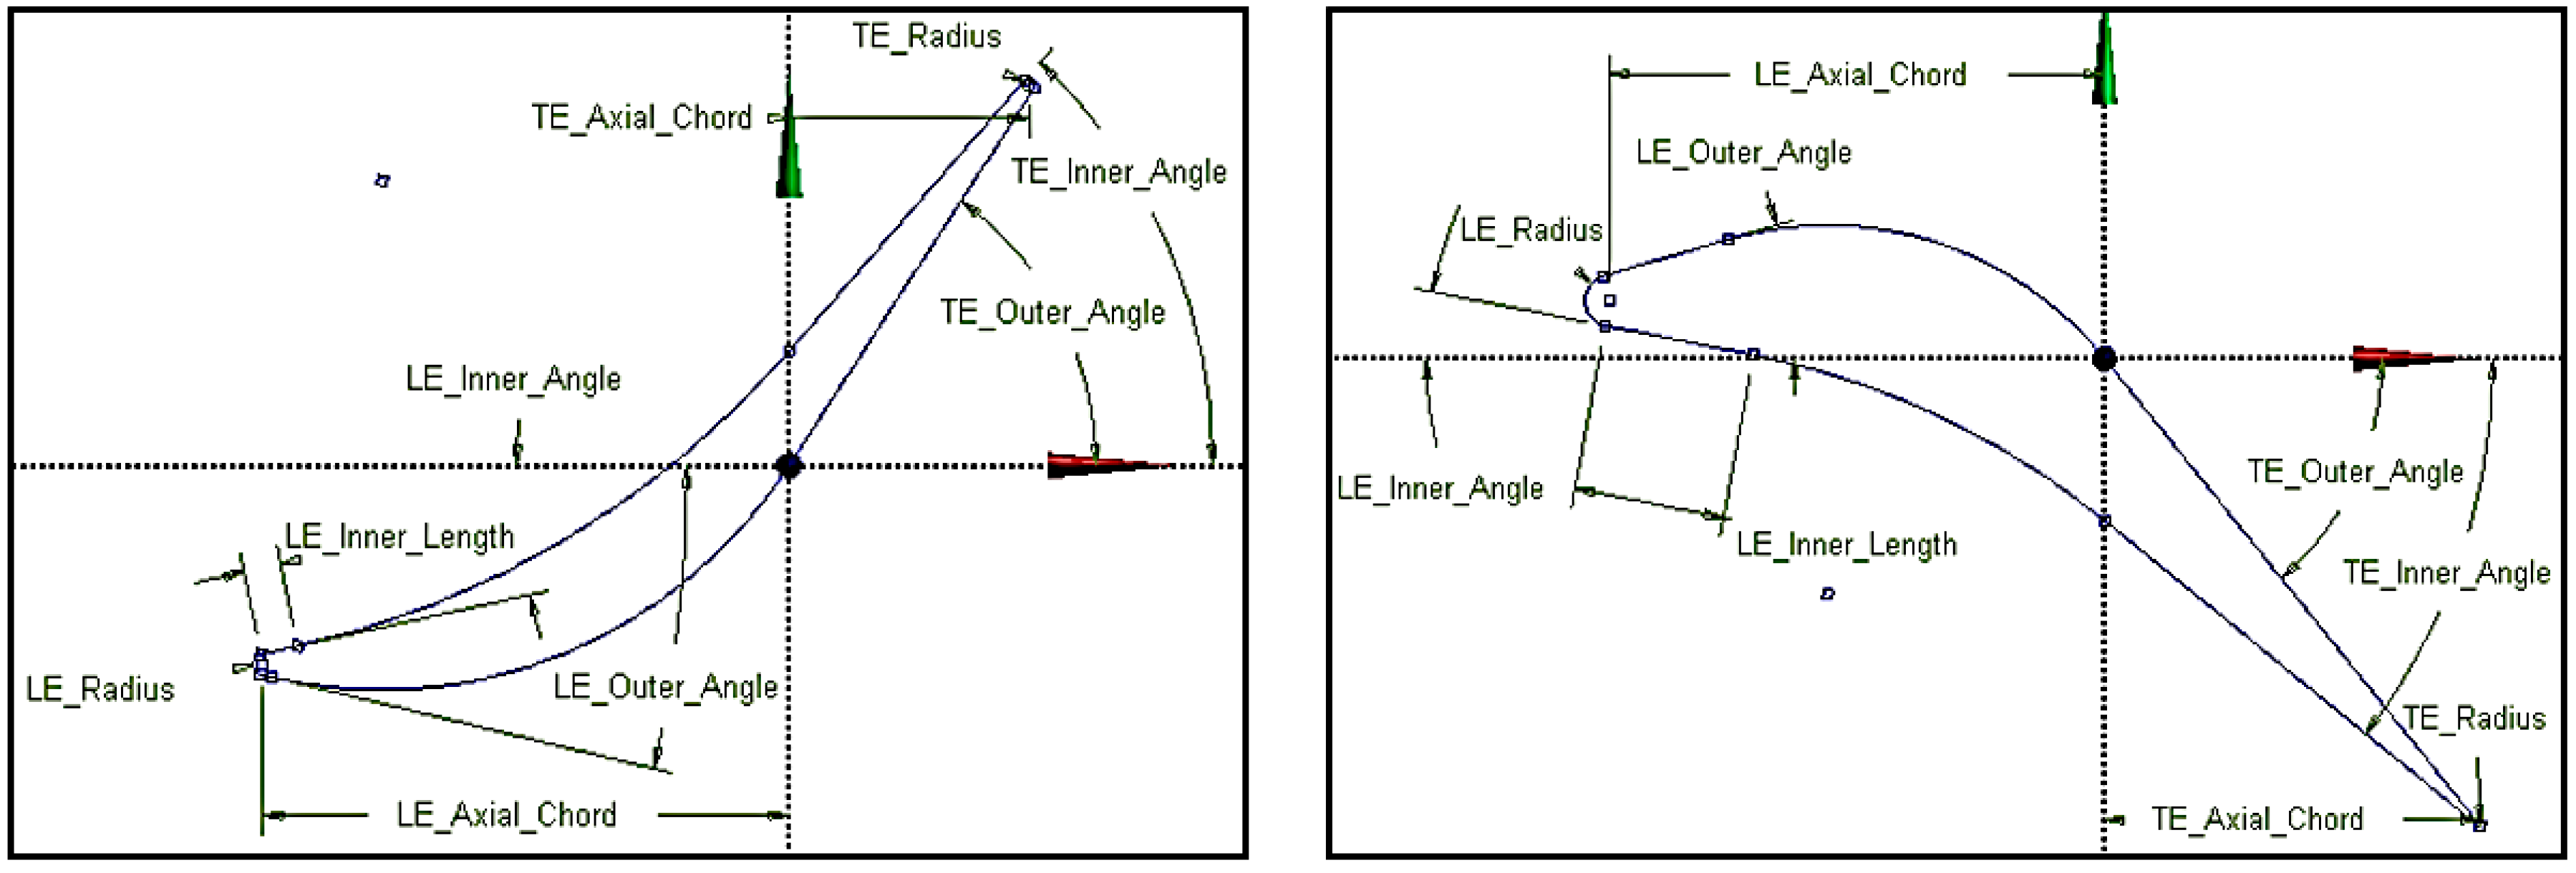
Figure 2.
Stator (left) and Rotor (right) blade profiles with calculated angles.
Figure 2.
Stator (left) and Rotor (right) blade profiles with calculated angles.
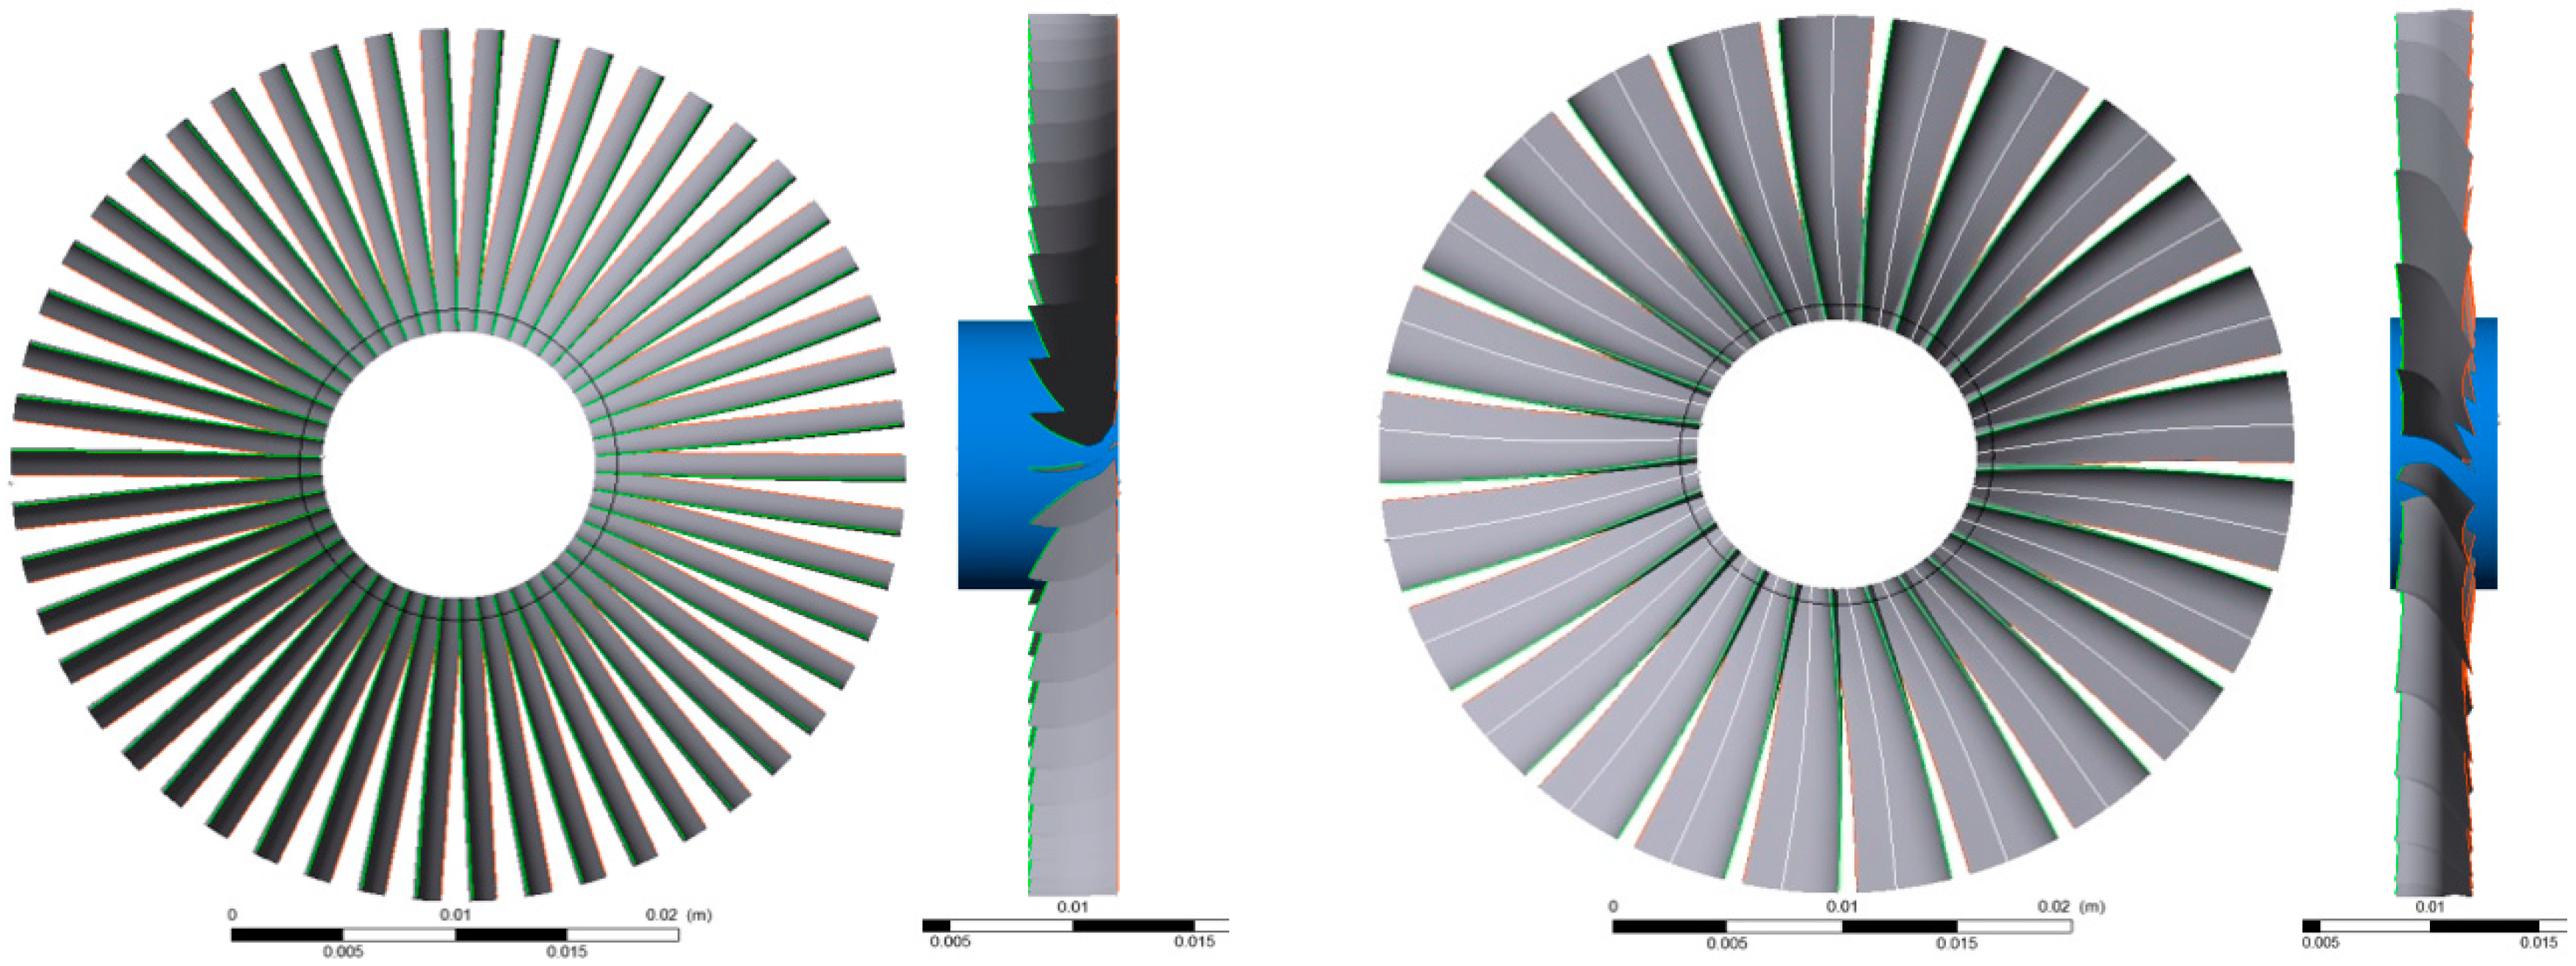
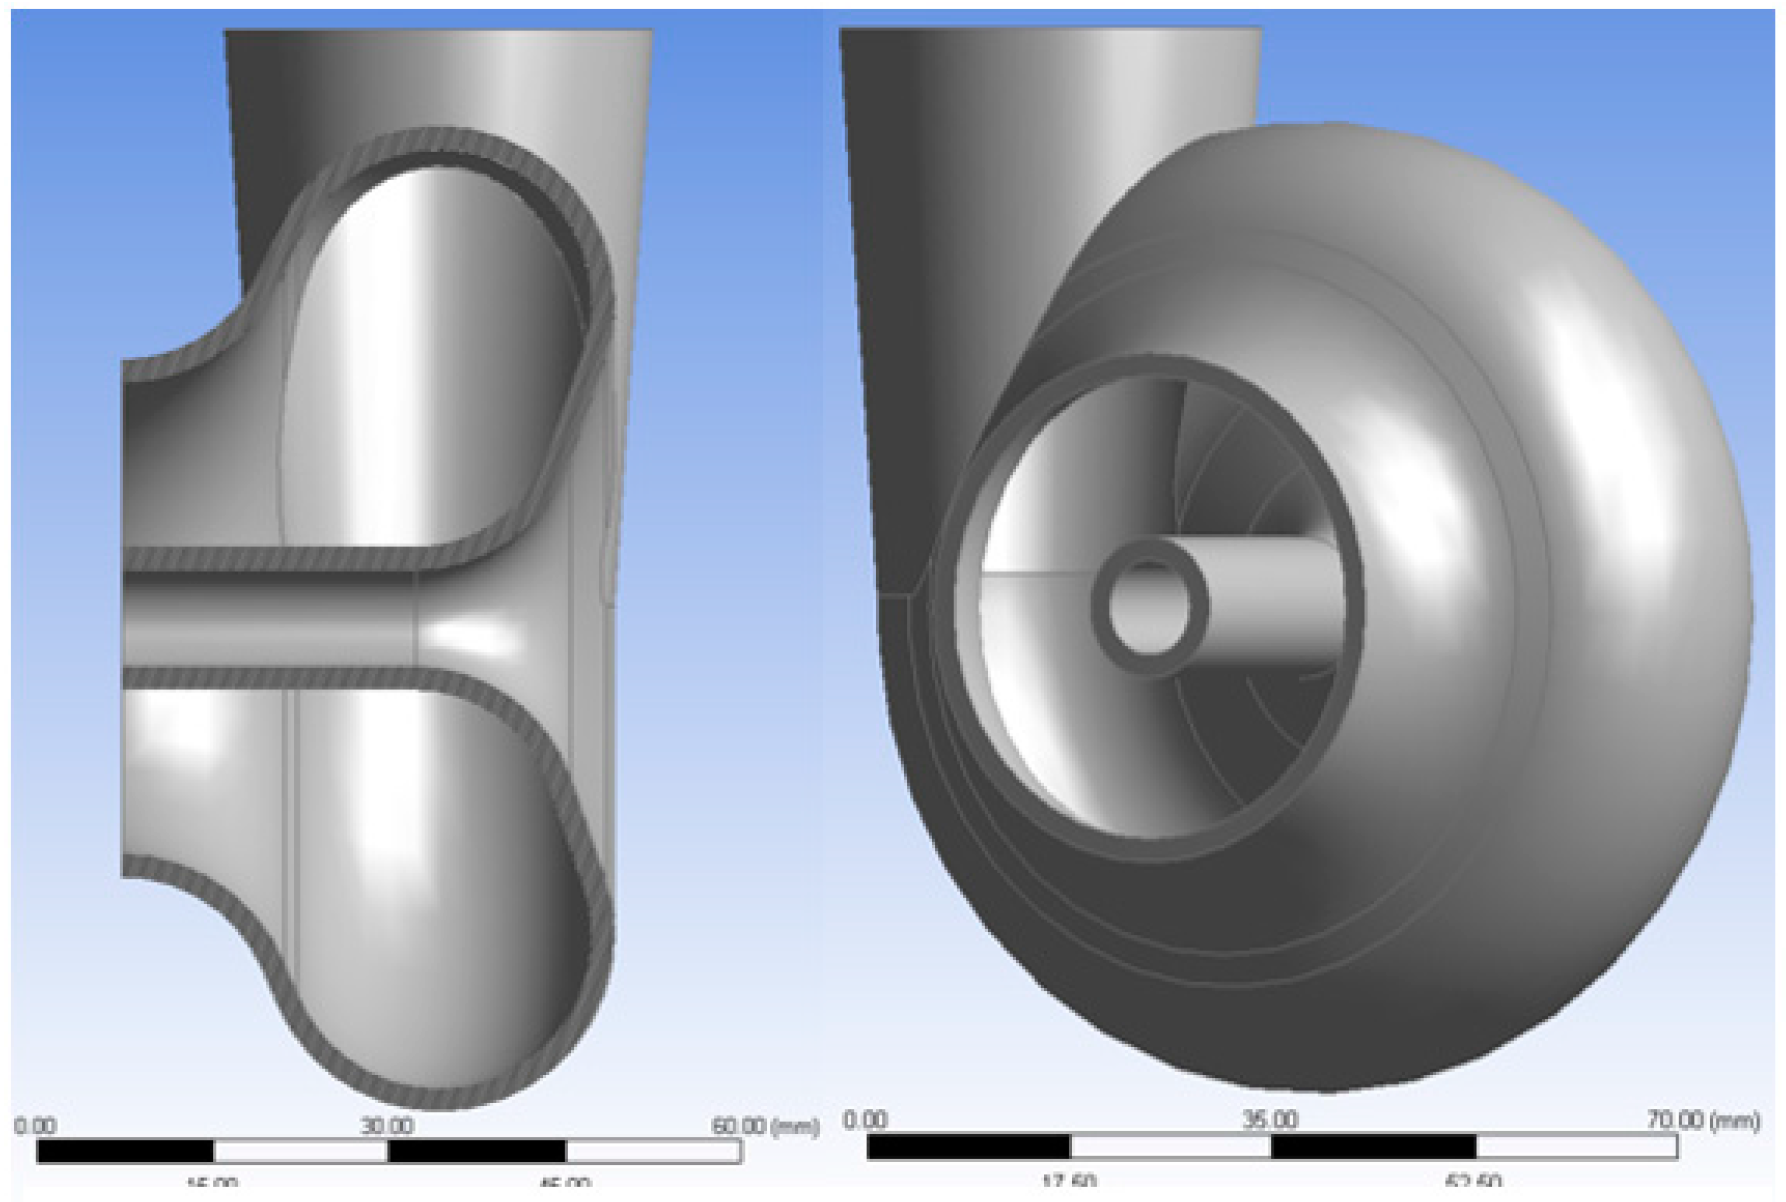
Figure 3.
Front and side view of stator (left) and rotor (right) in TurboGrid.
Figure 3.
Front and side view of stator (left) and rotor (right) in TurboGrid.
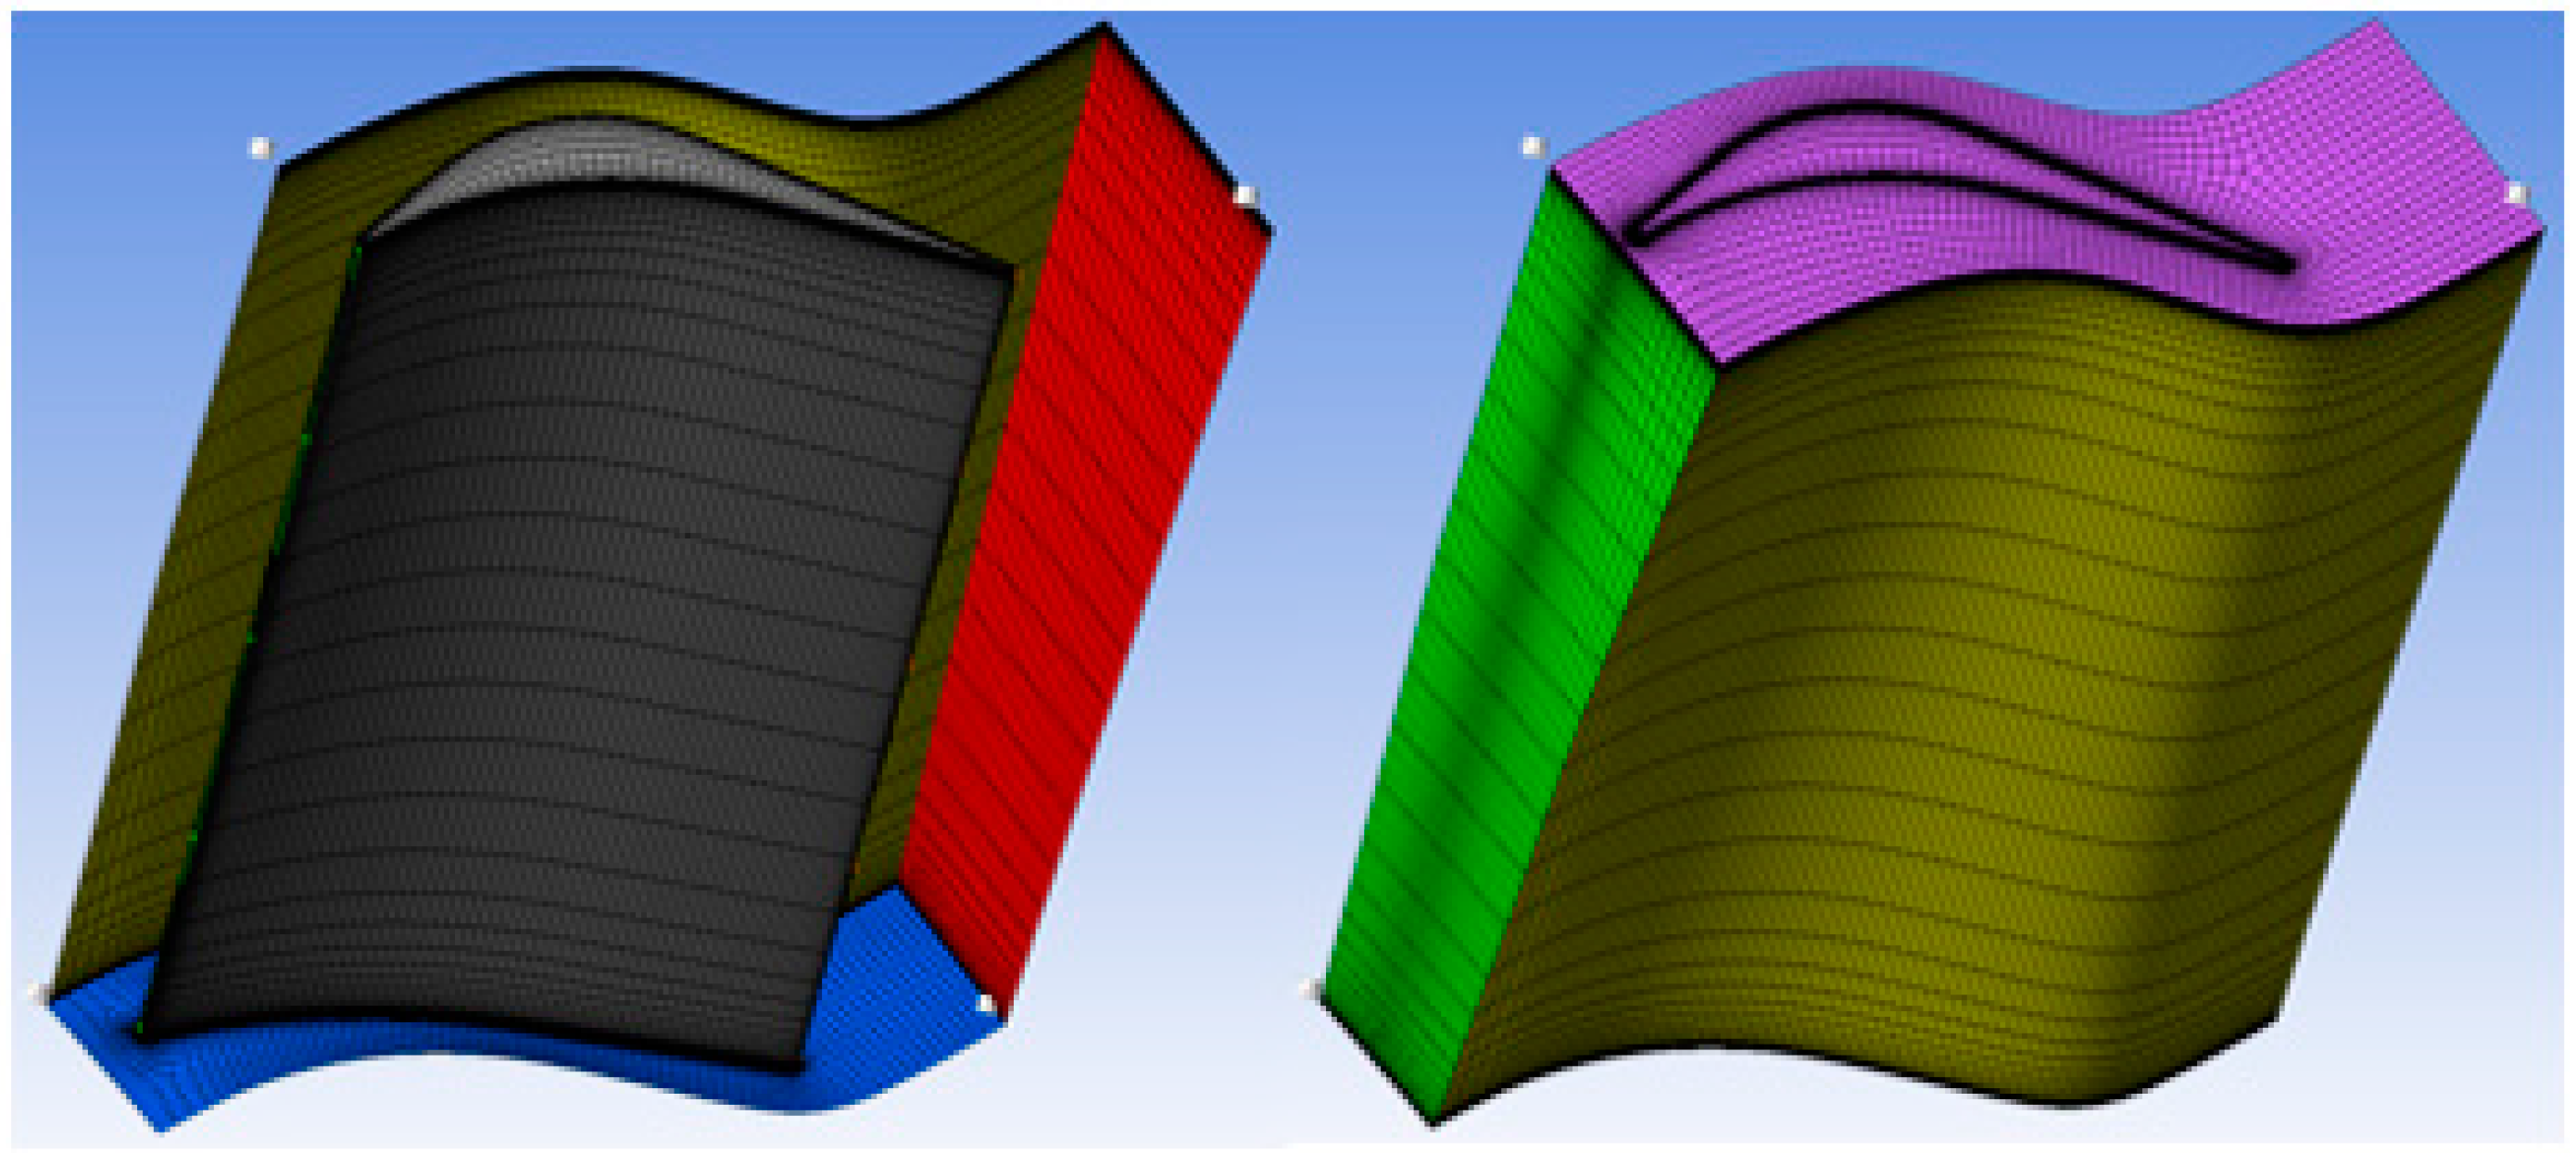
Figure 4.
Rotor blade mesh, inner walls of the domain (left) and outer walls (right).
Figure 4.
Rotor blade mesh, inner walls of the domain (left) and outer walls (right).
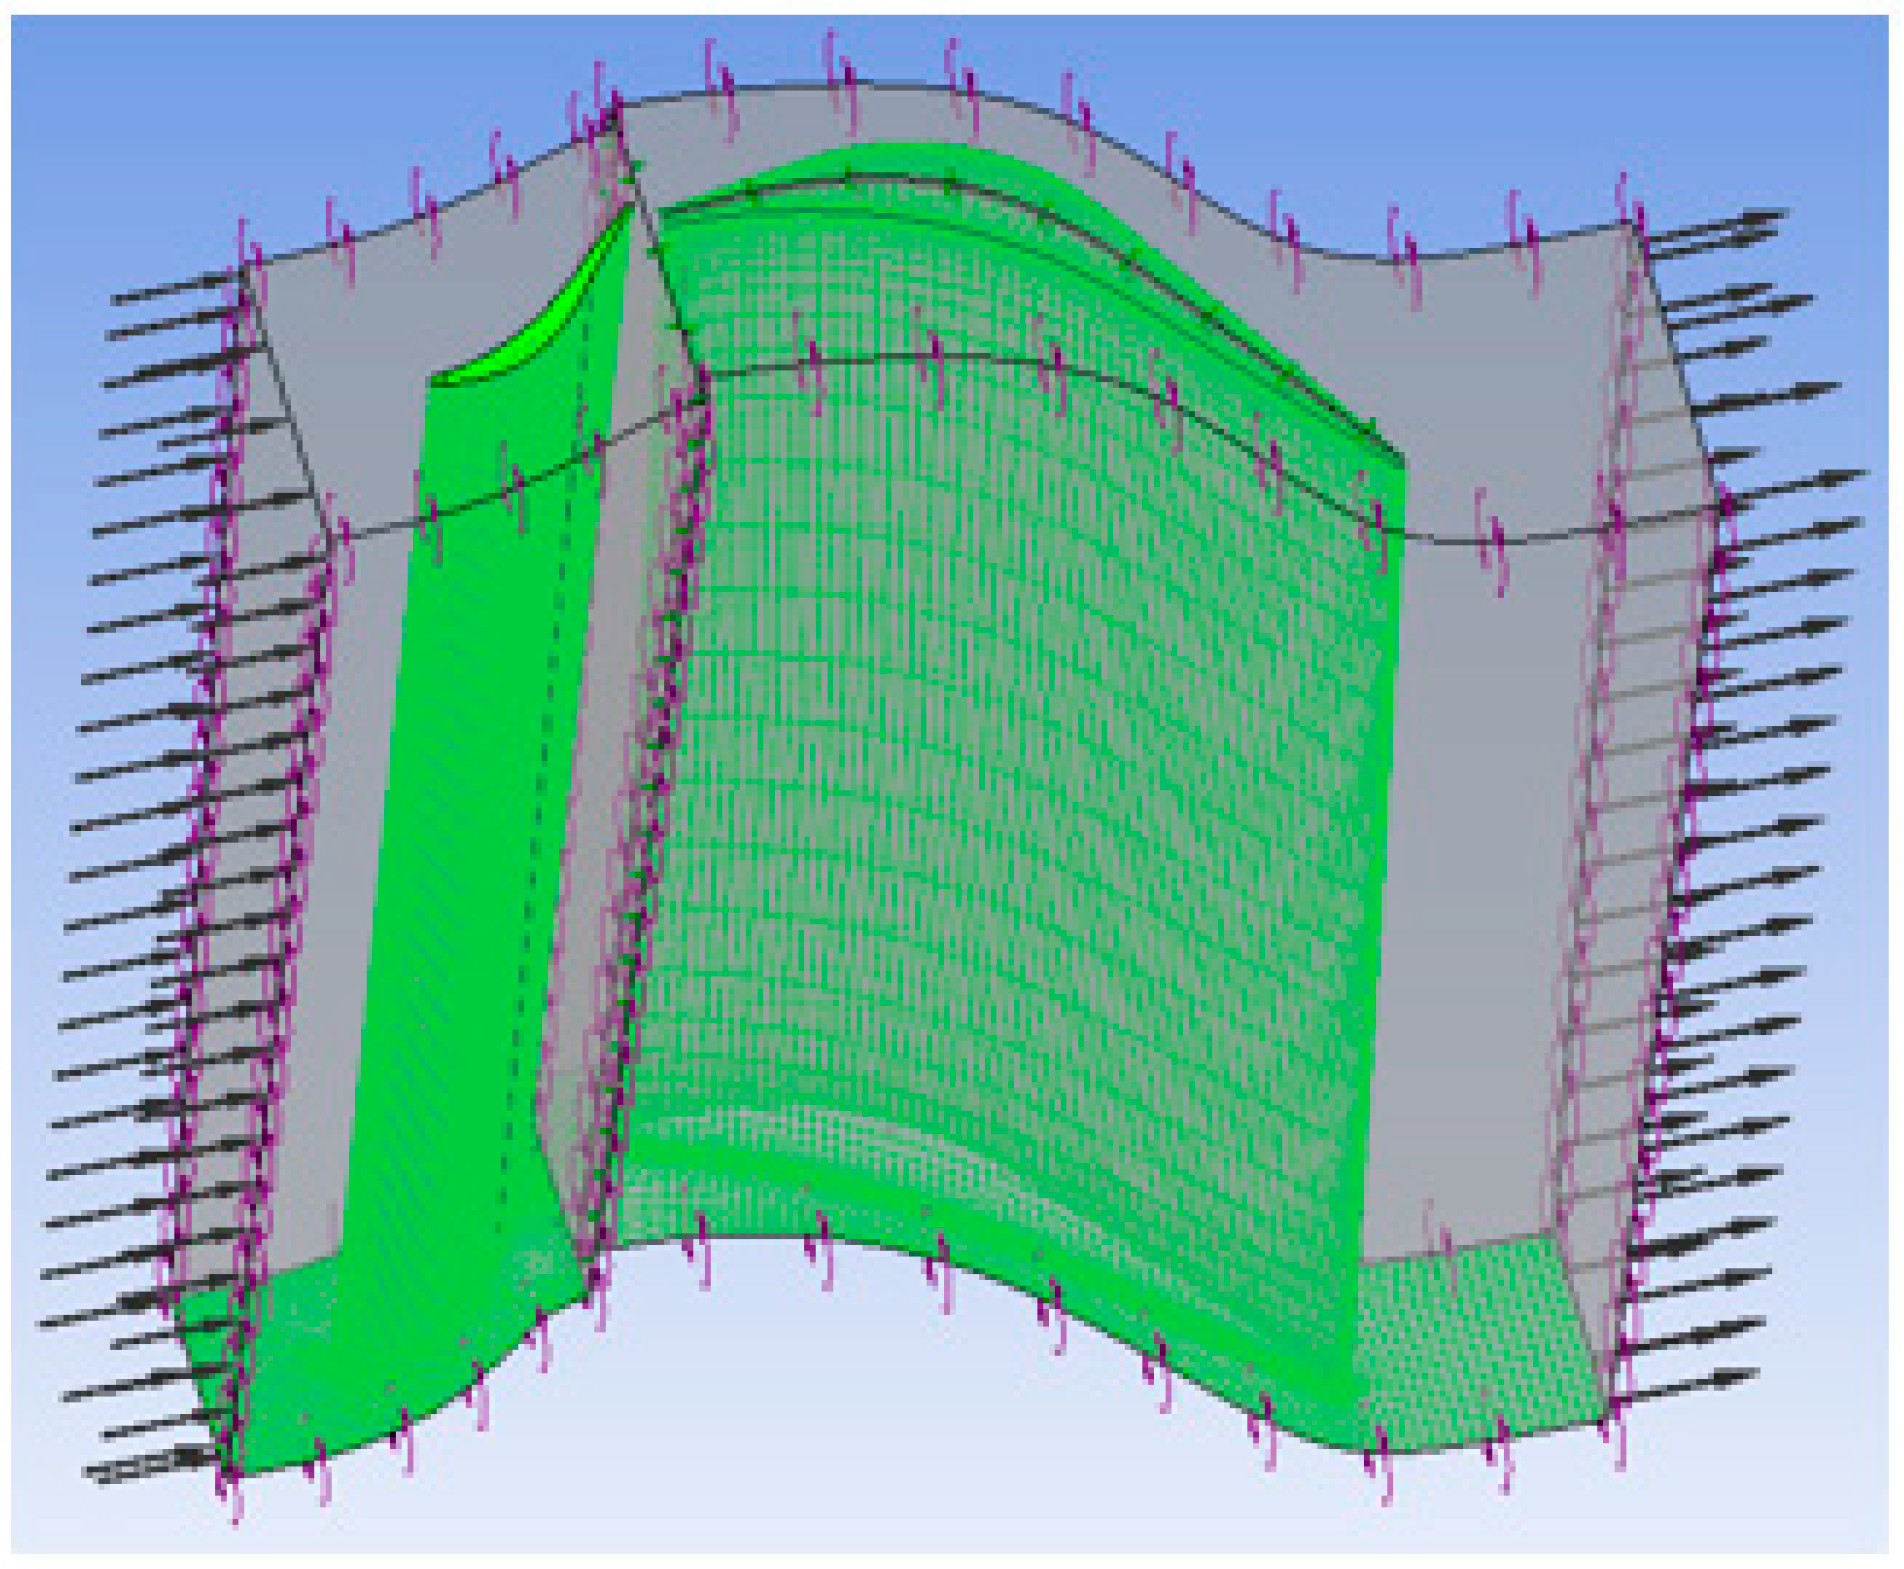
Figure 5.
CFX setup for rotor blade and stator blade meshes.
Figure 5.
CFX setup for rotor blade and stator blade meshes.
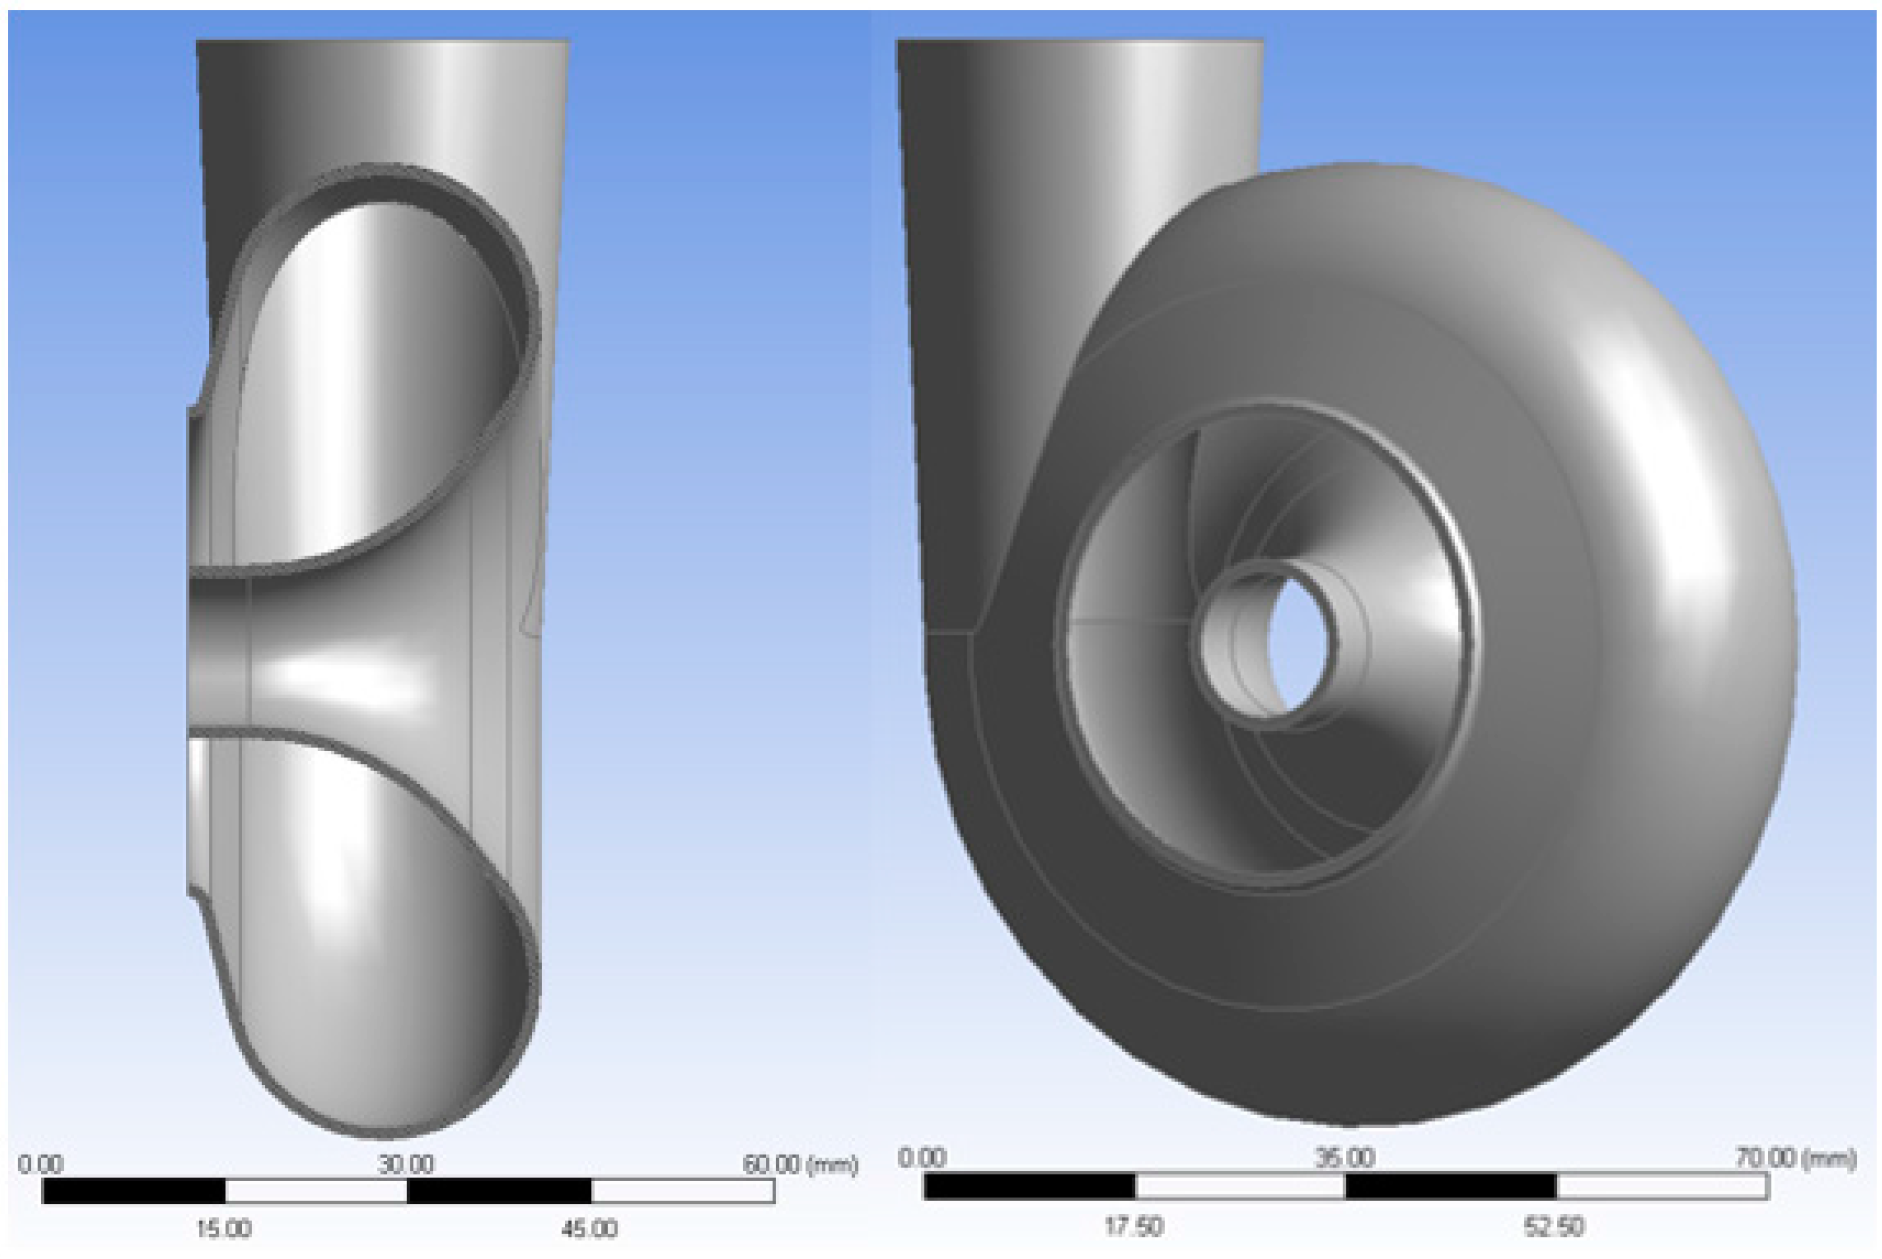
Figure 6.
First volute design.
Figure 6.
First volute design.
Figure 7.
Second volute design.
Figure 7.
Second volute design.
Figure 8.
Third volute design.
Figure 8.
Third volute design.
Figure 9.
Third volute design.
Figure 9.
Third volute design.
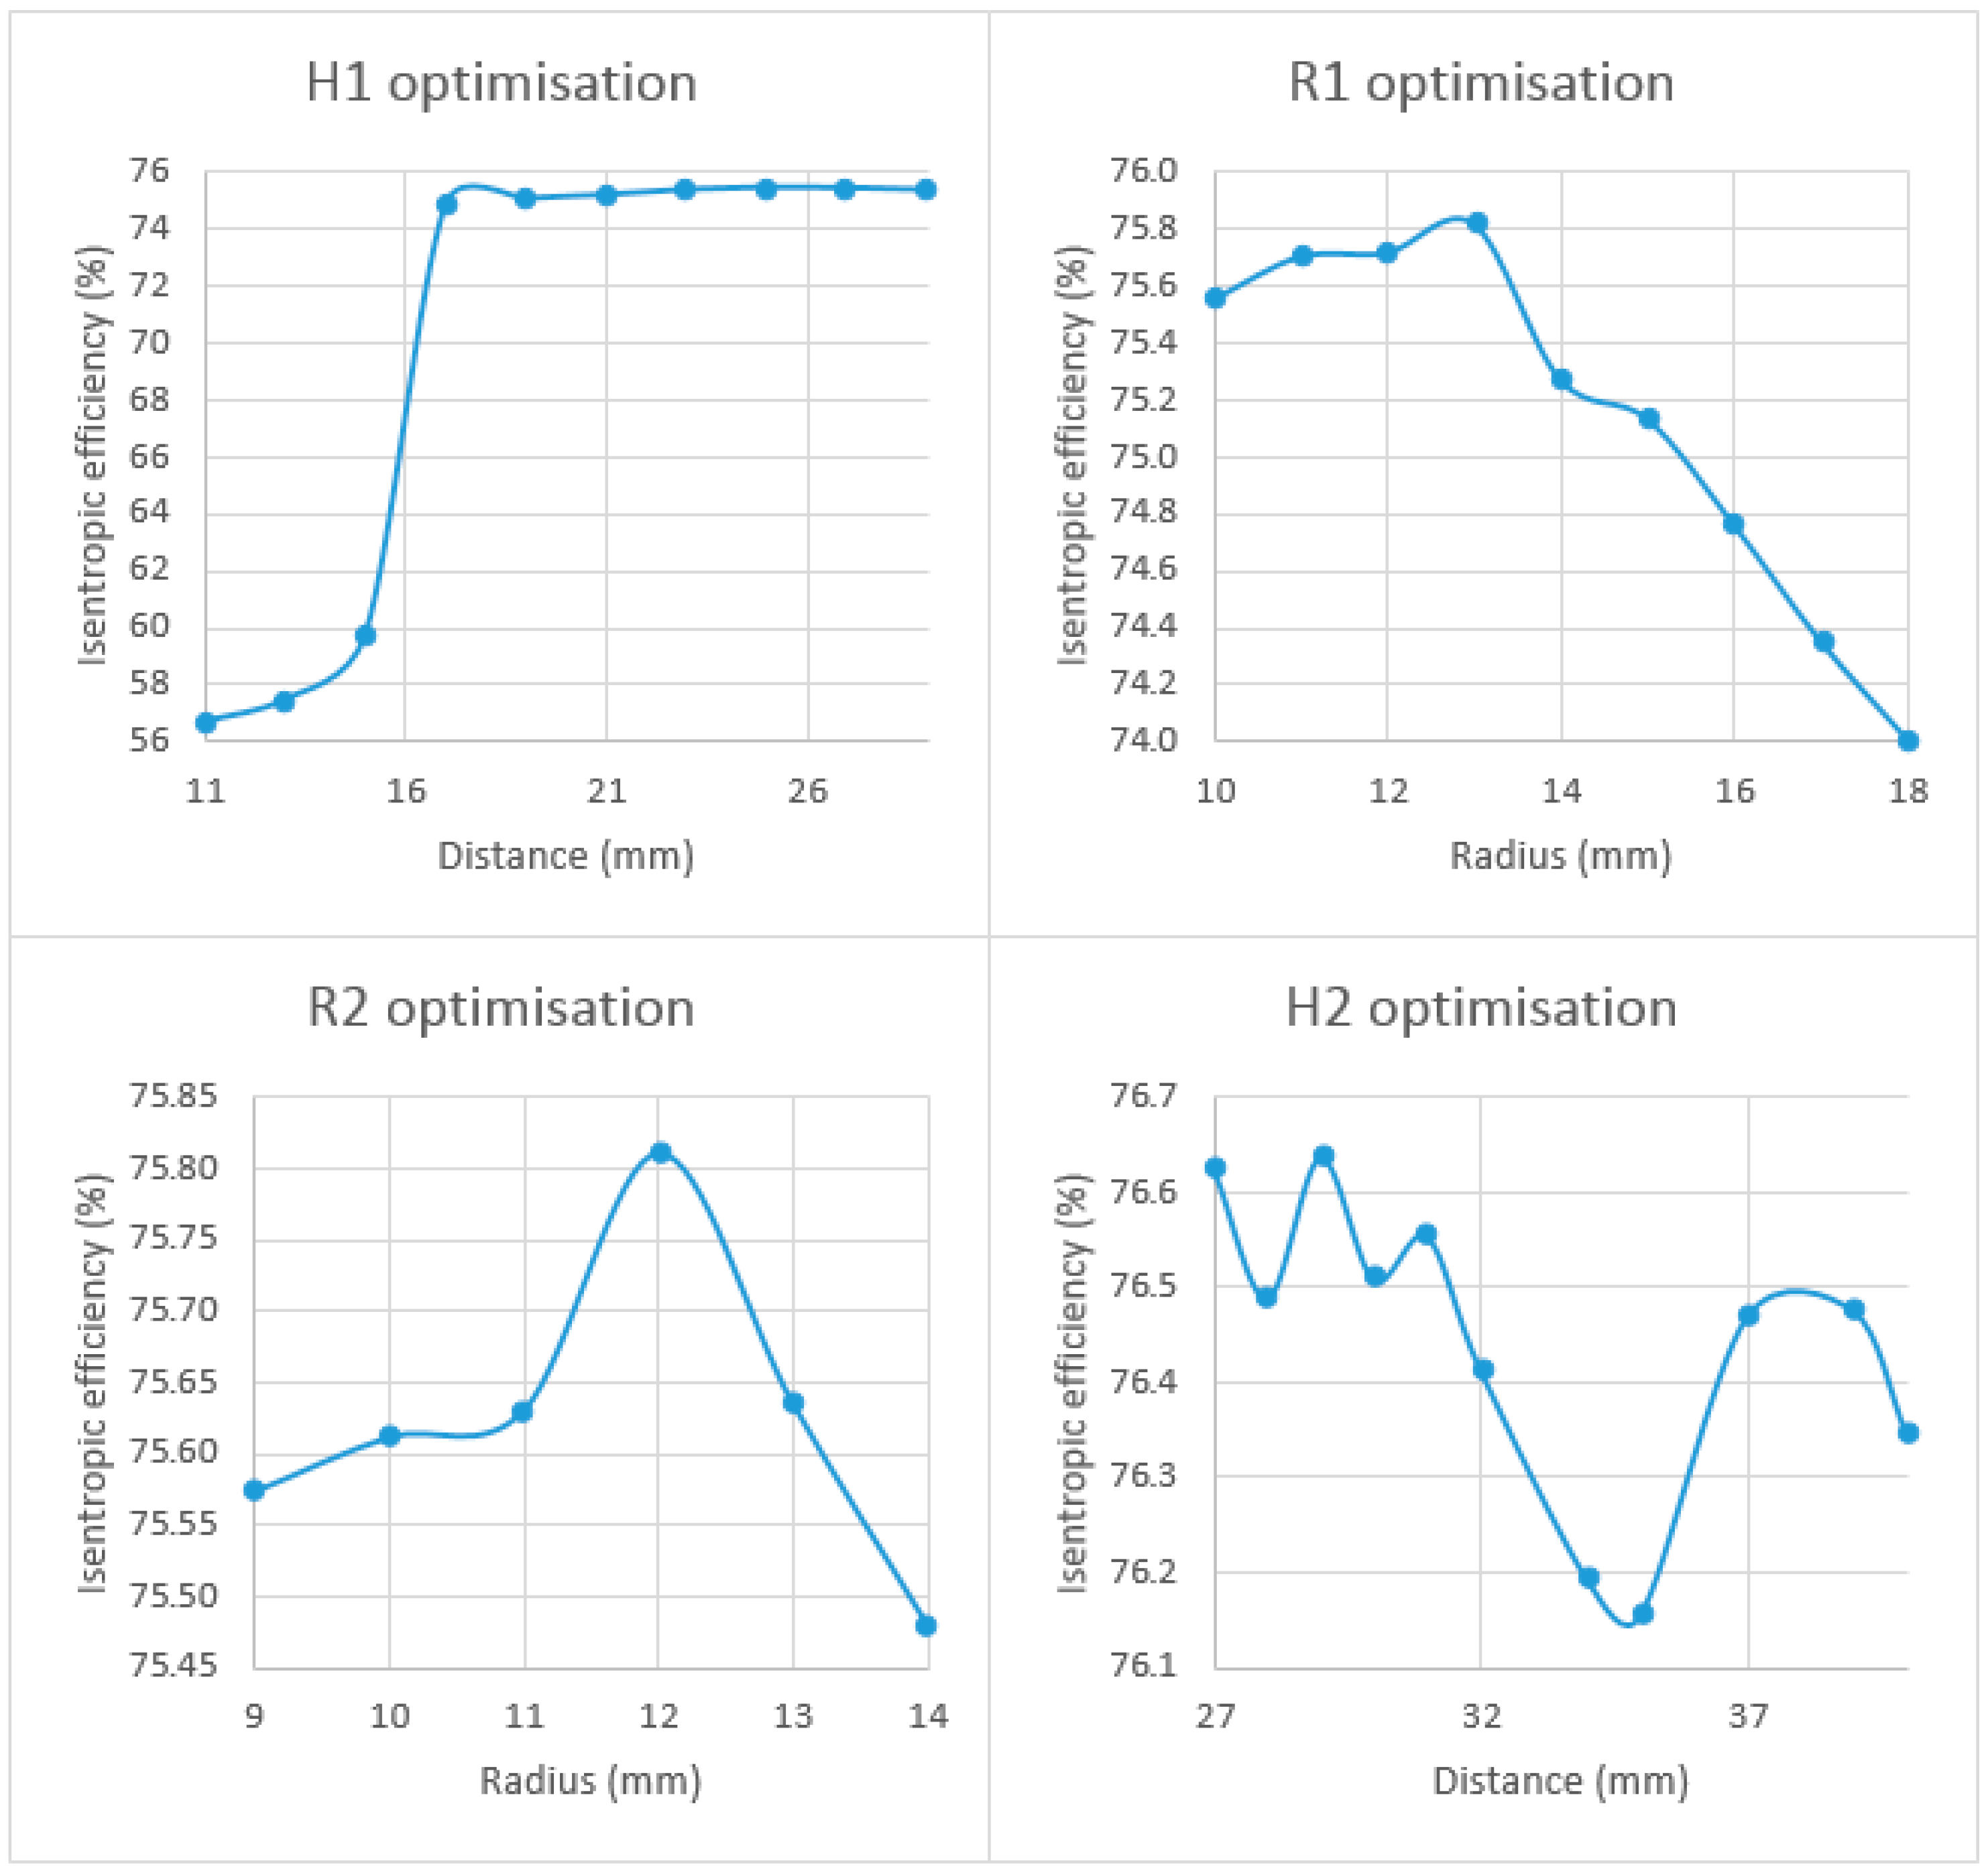
Figure 10.
Results of the first stage of the parametric volute optimisation process.
Figure 10.
Results of the first stage of the parametric volute optimisation process.
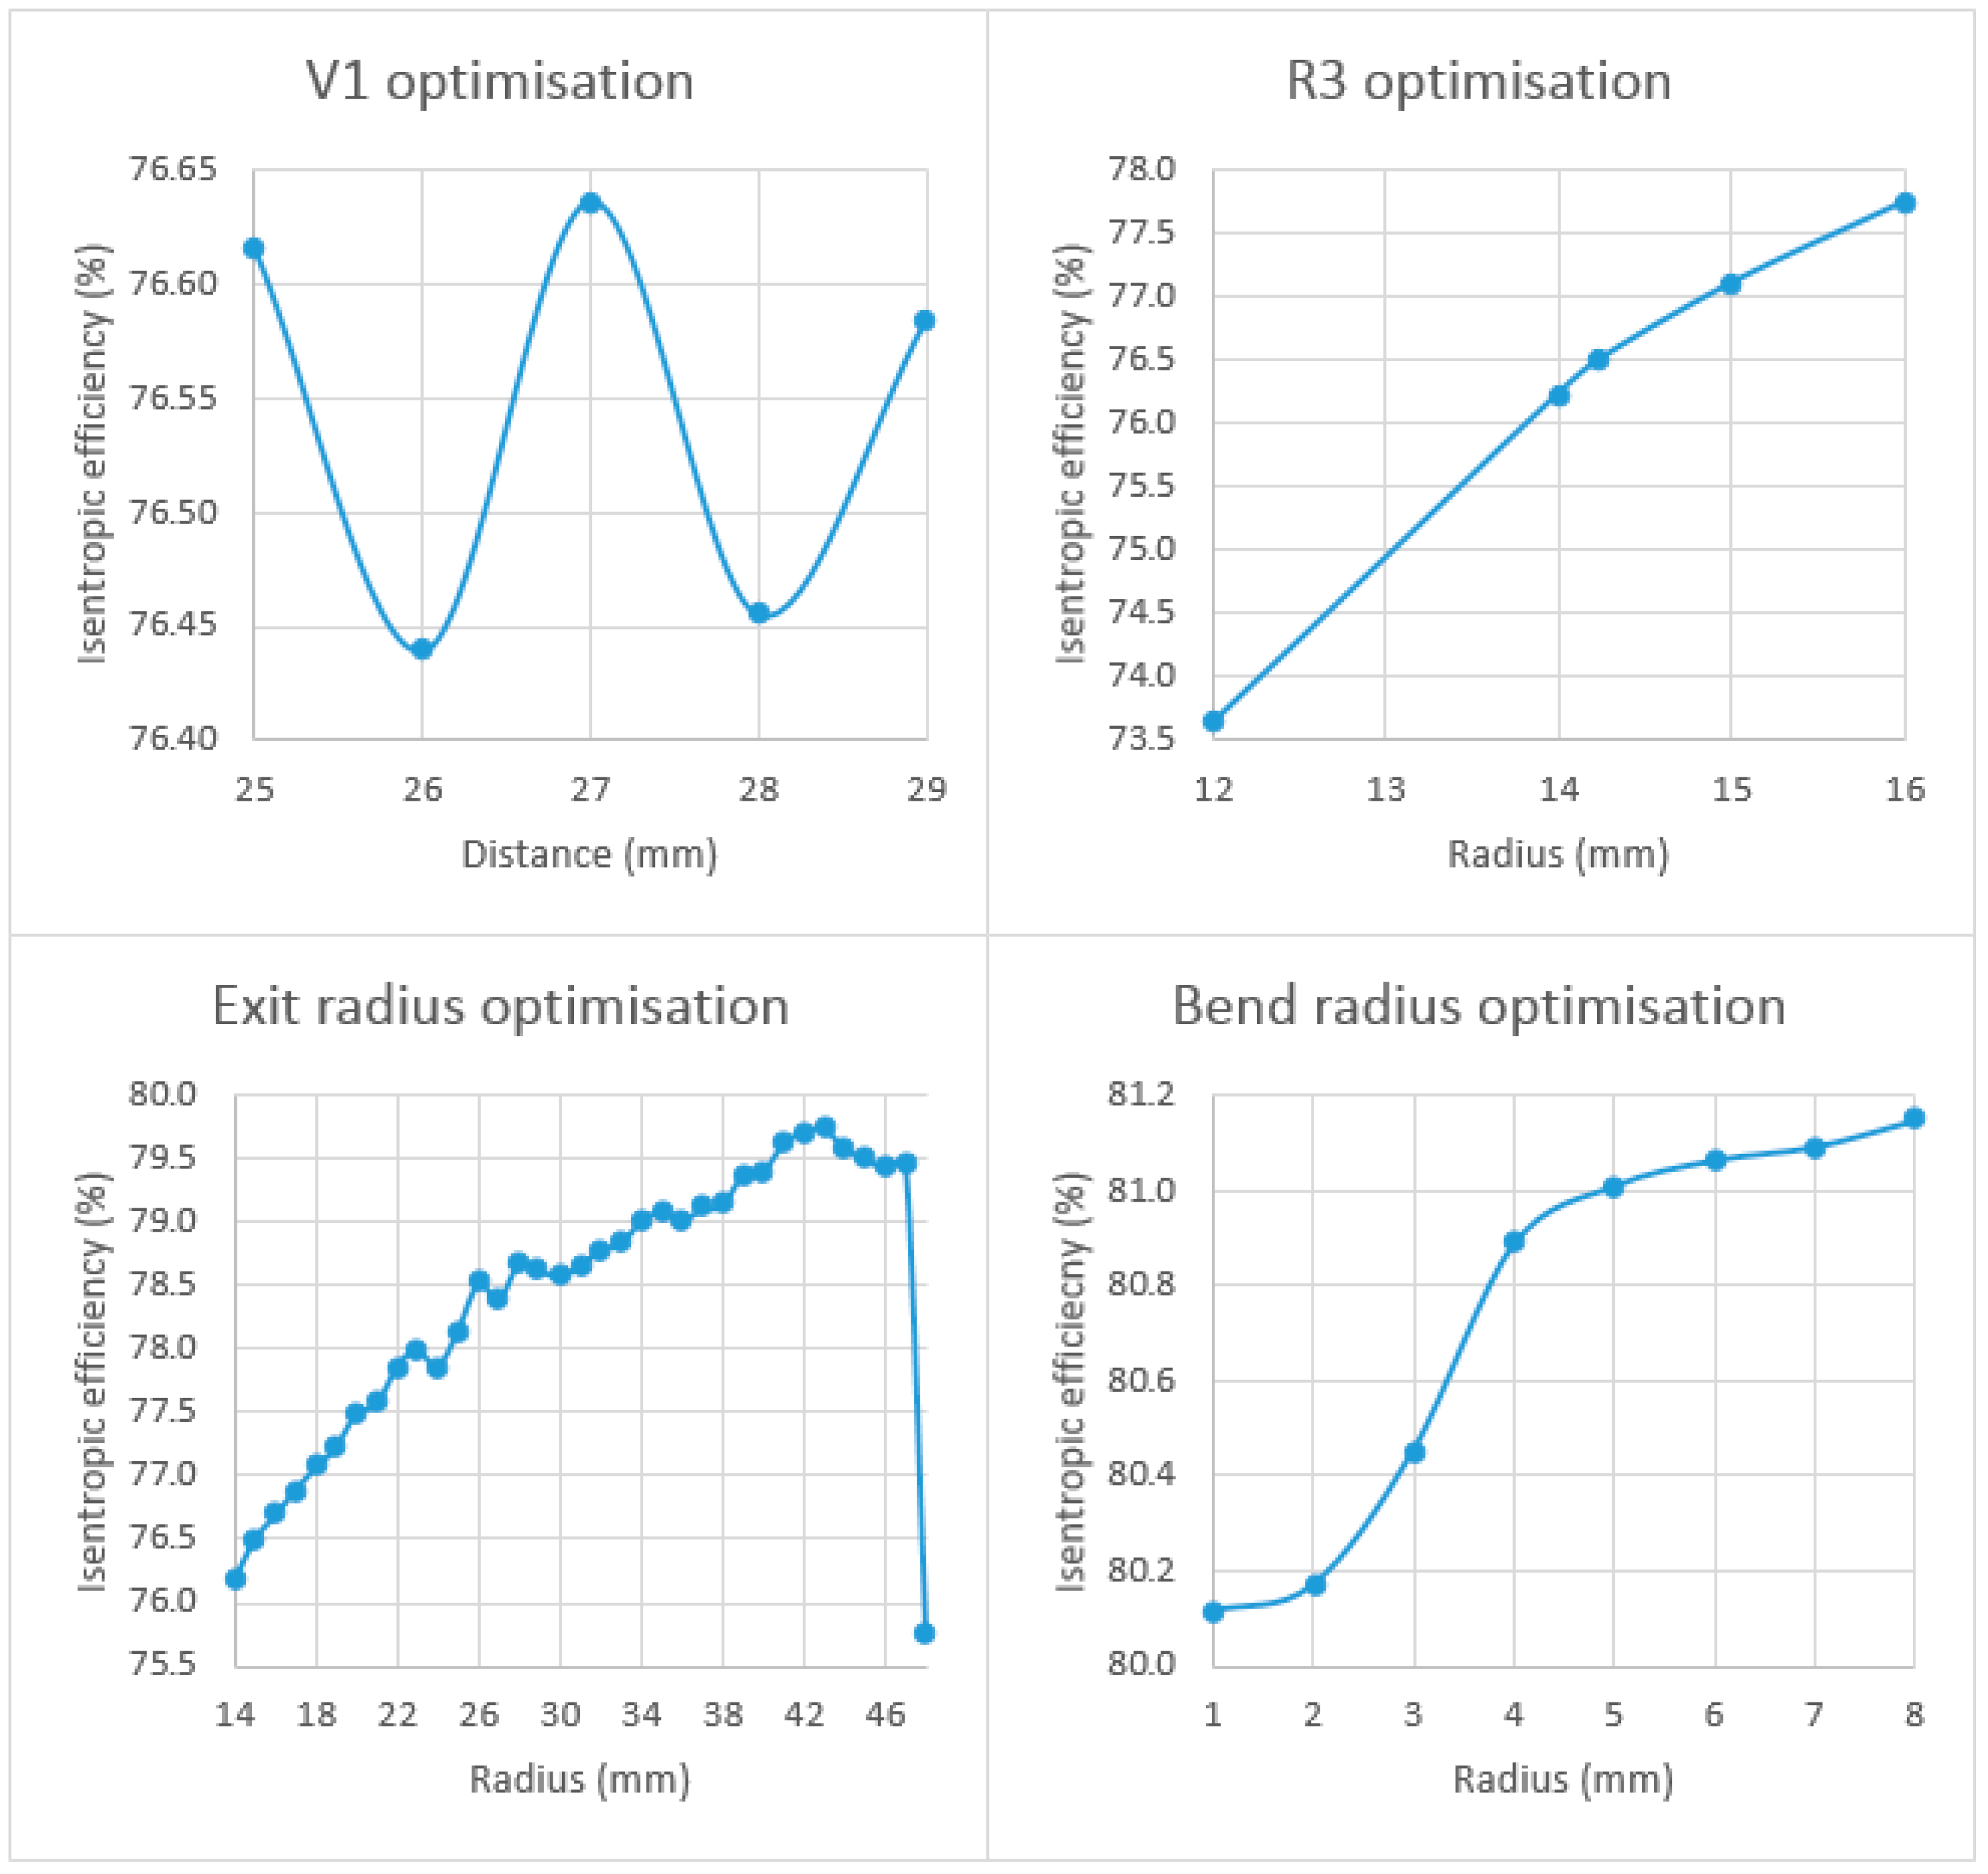
Figure 11.
Results of the second stage of the parametric volute optimisation process.
Figure 11.
Results of the second stage of the parametric volute optimisation process.
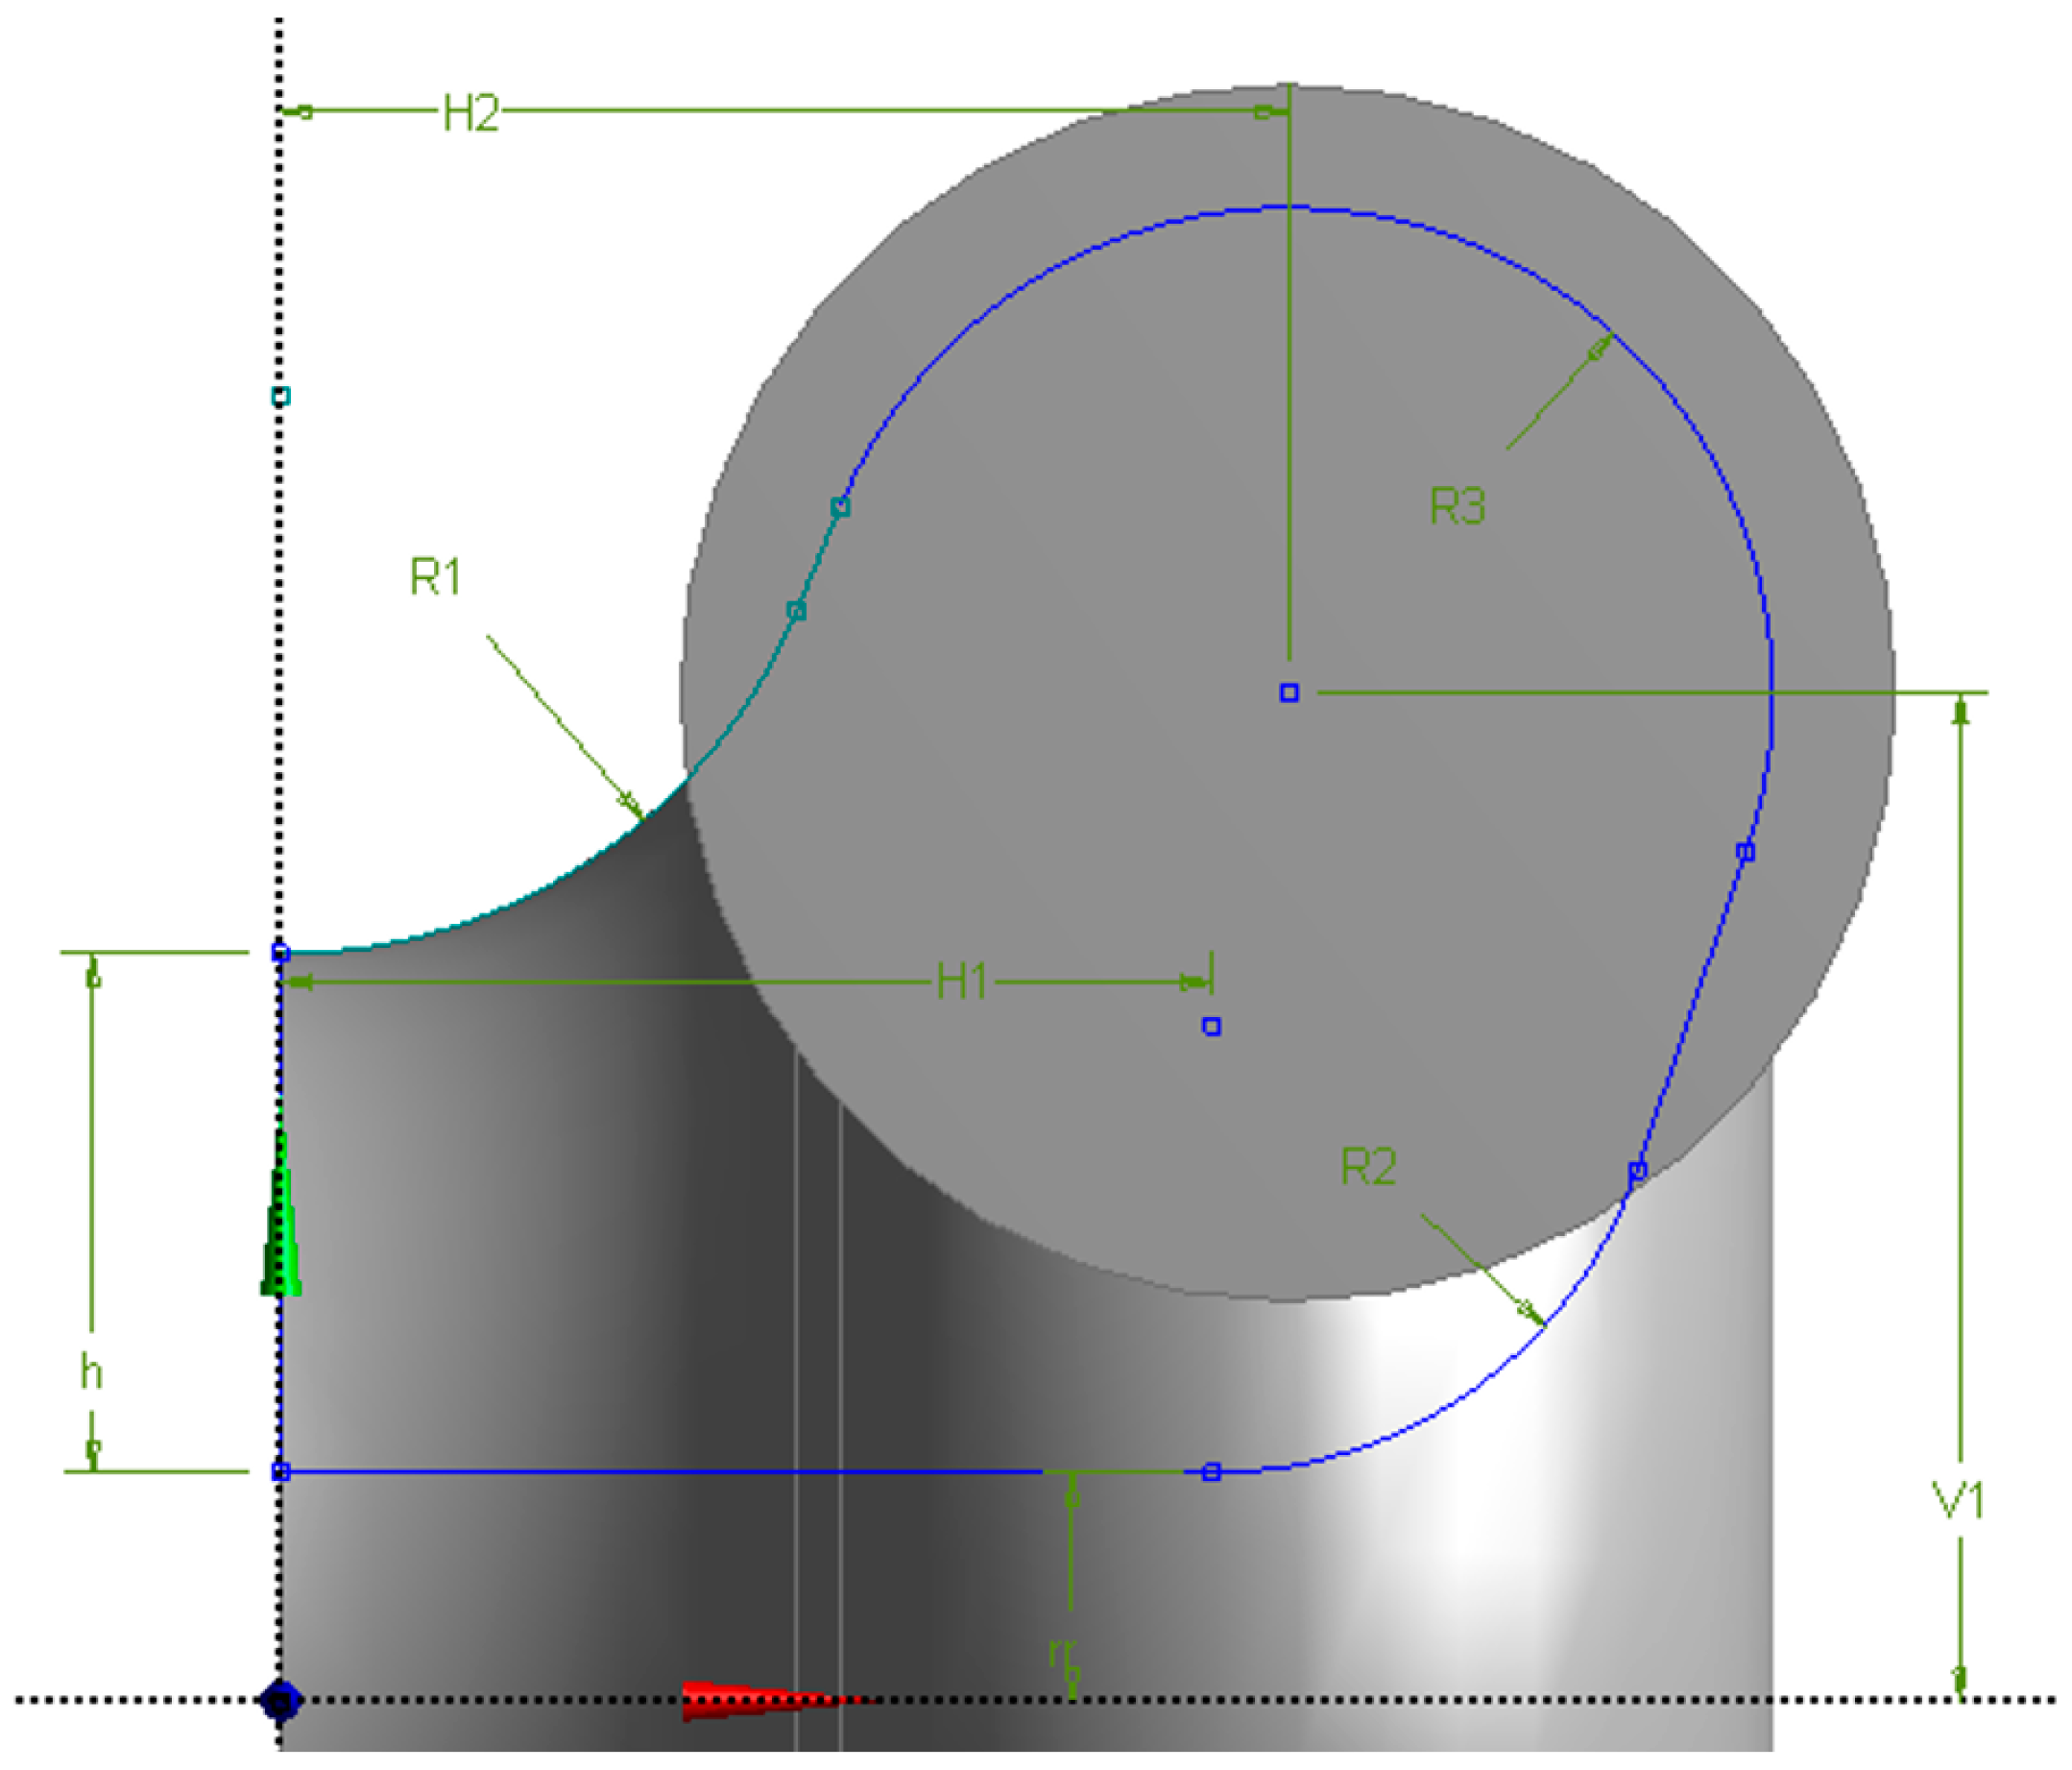
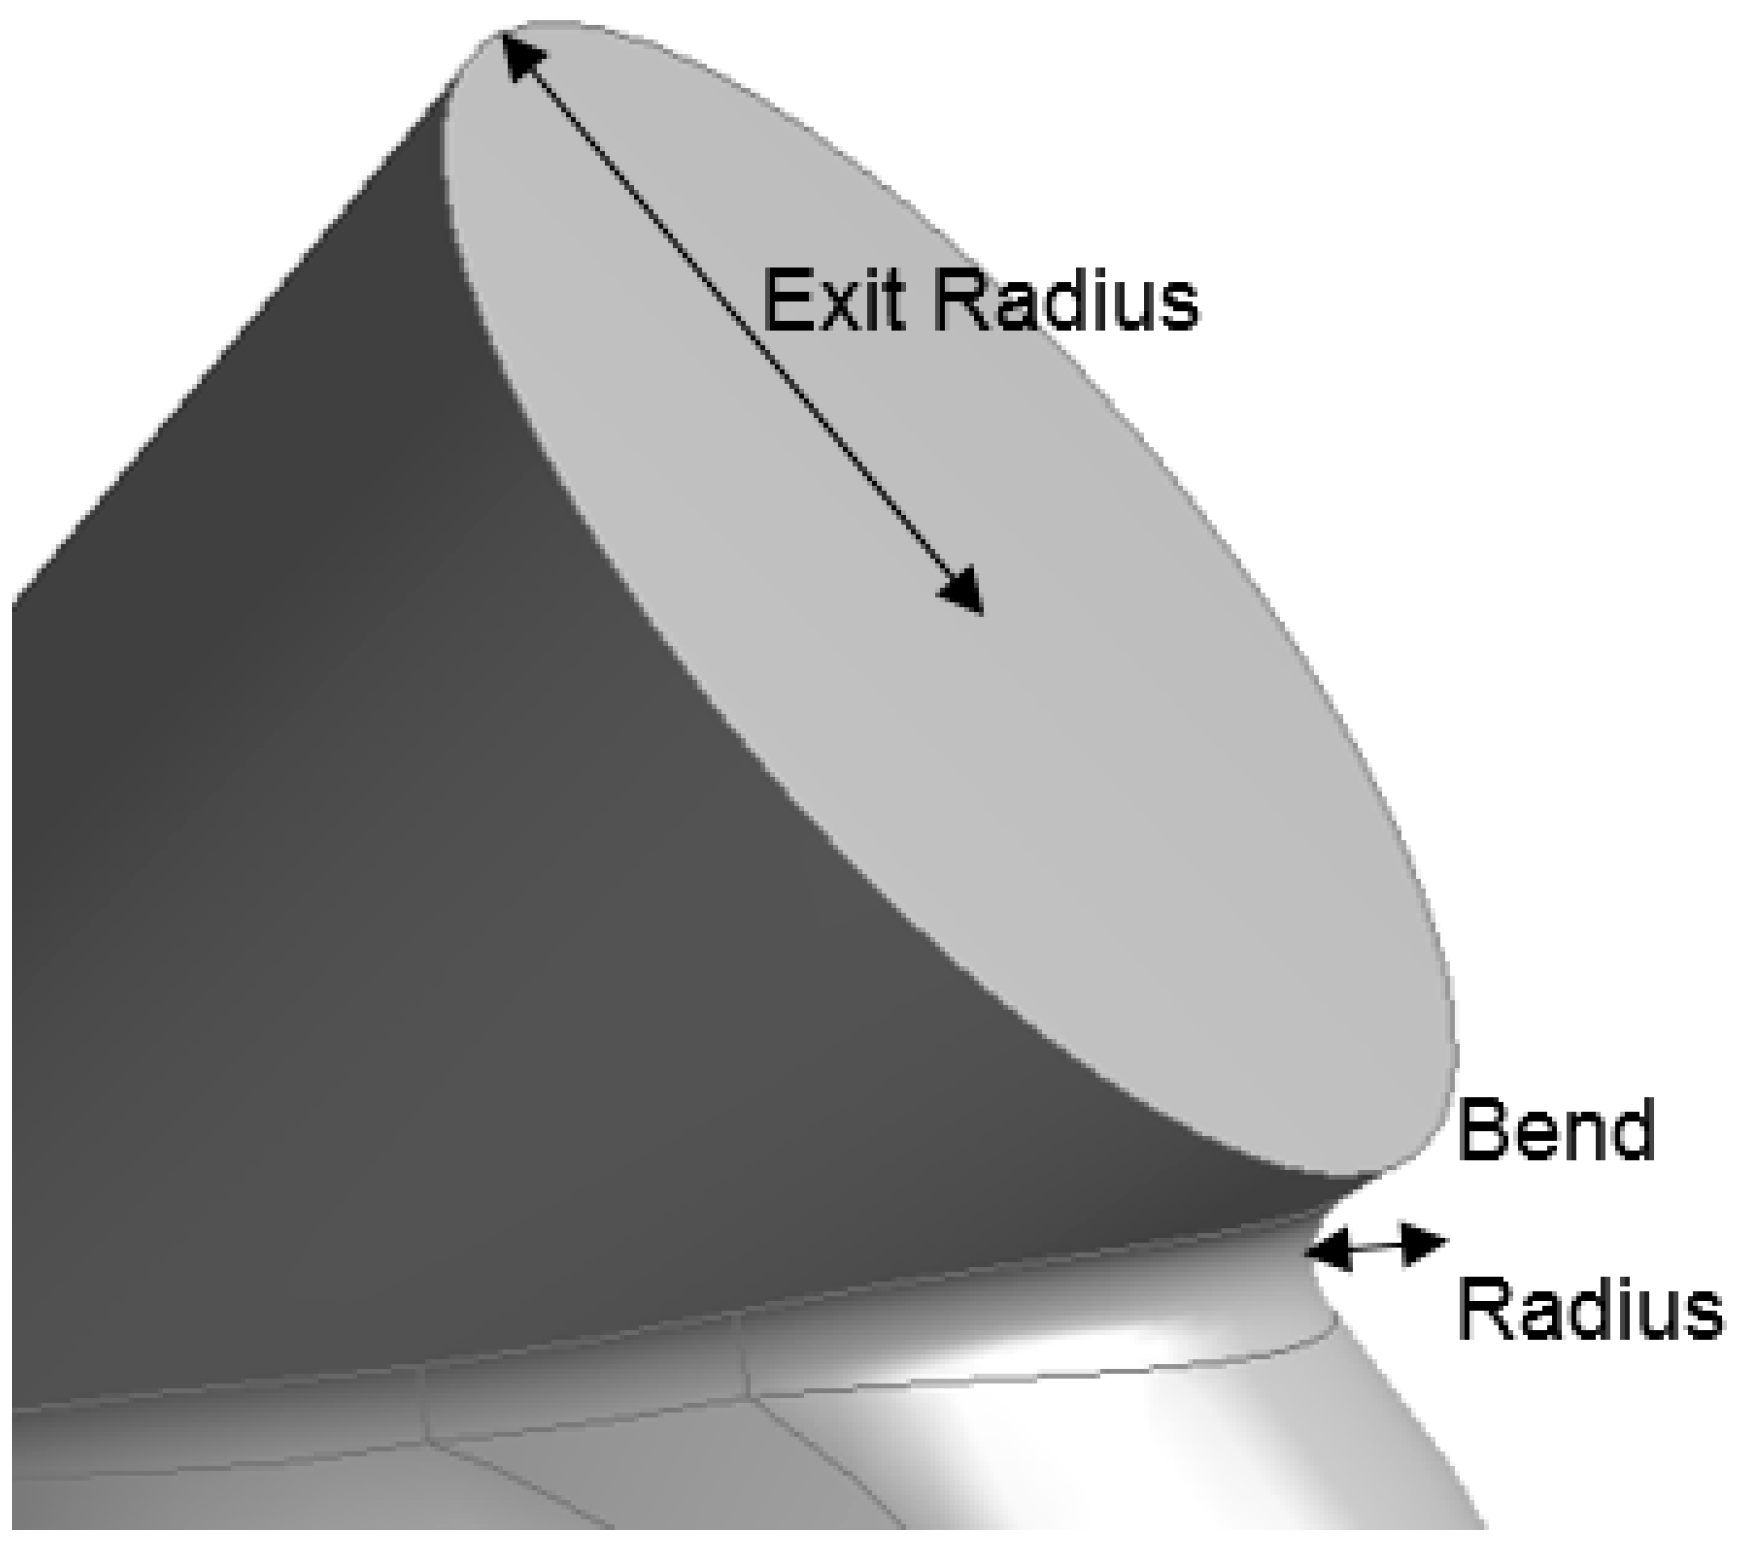
Figure 12.
Volute exit parameters.
Figure 12.
Volute exit parameters.
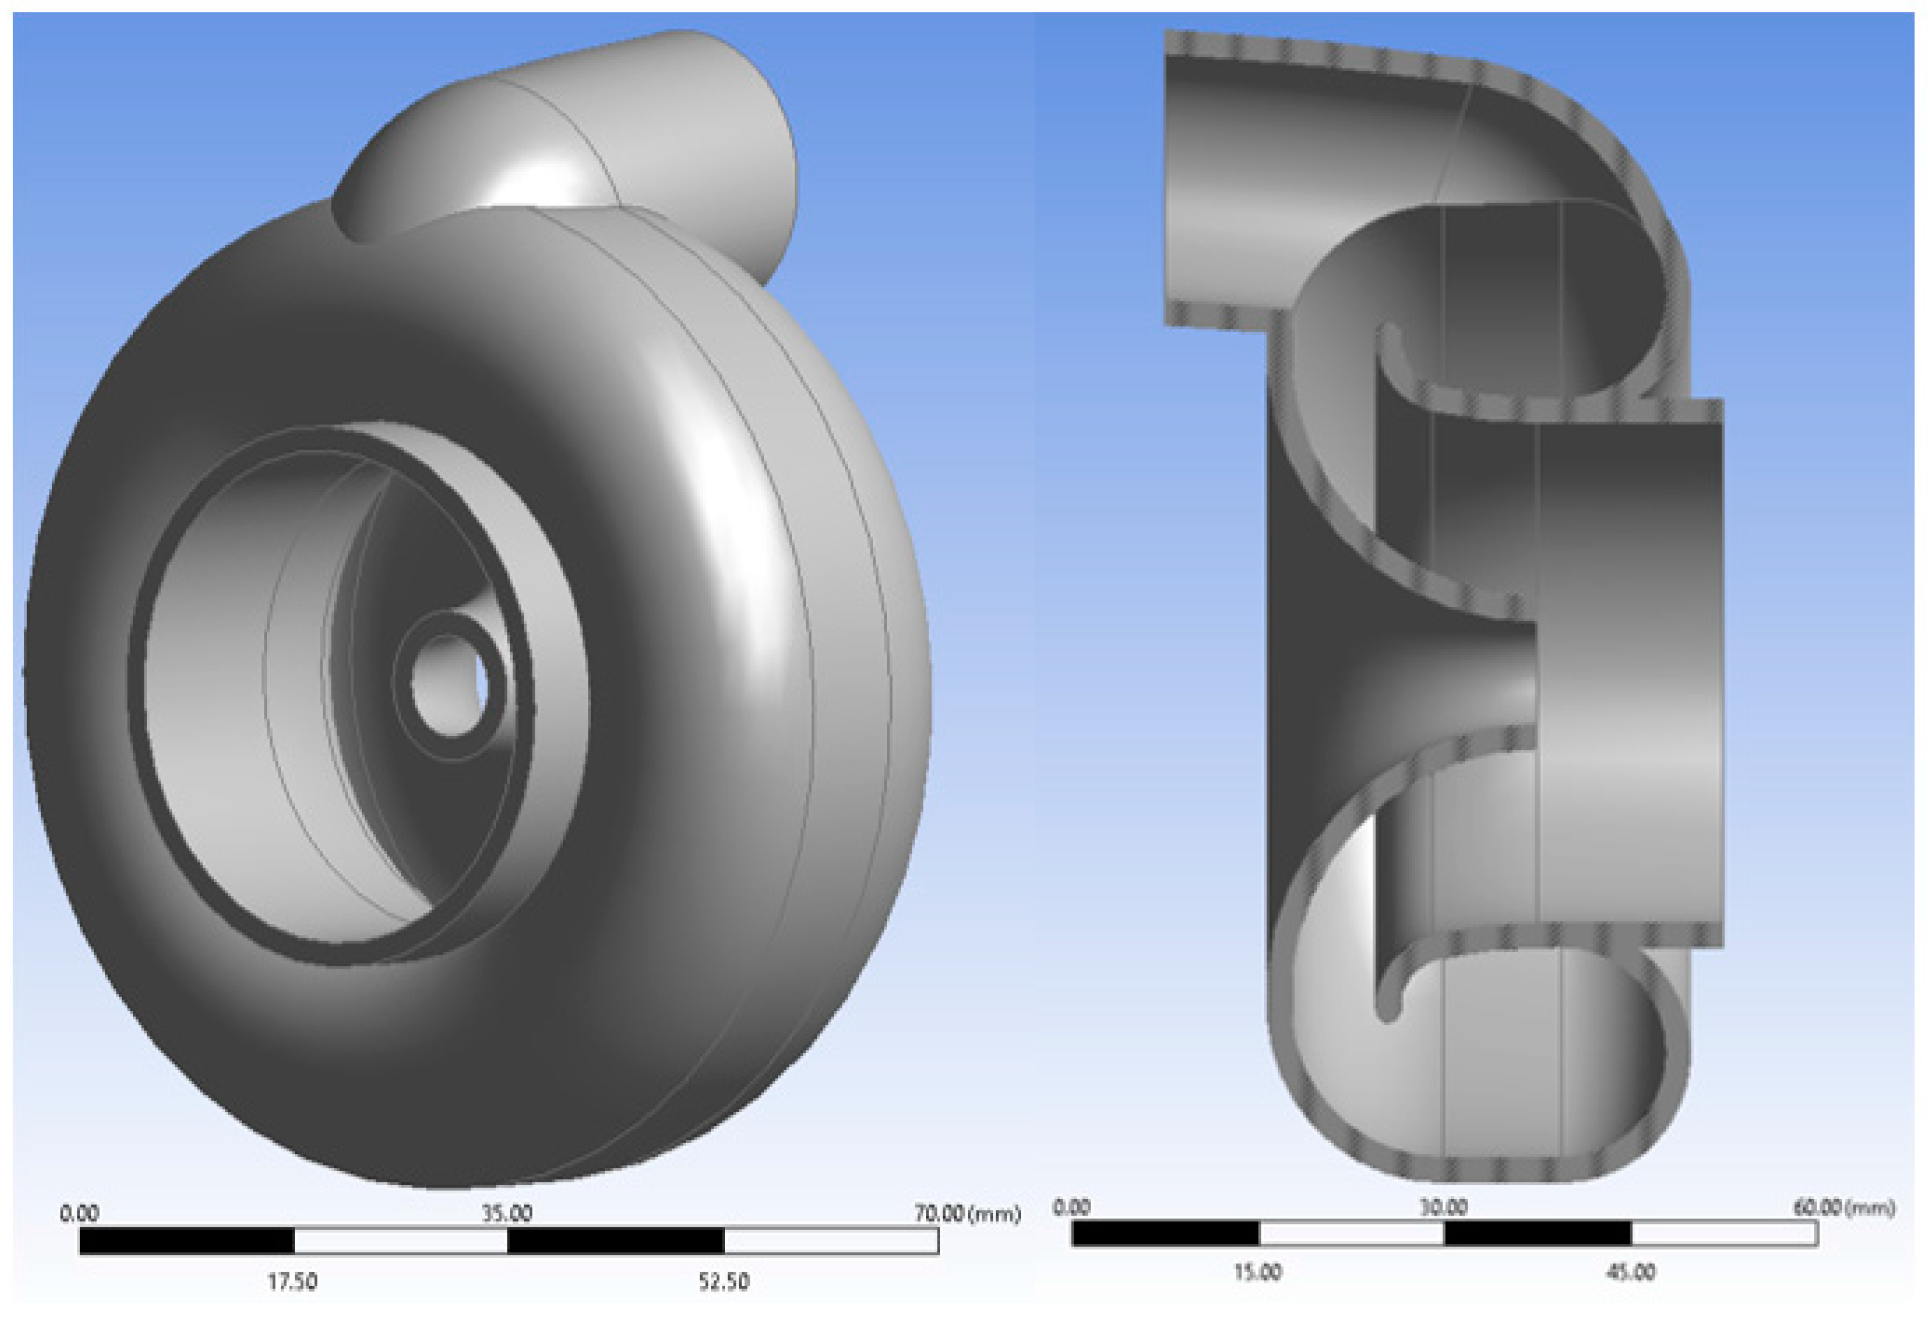
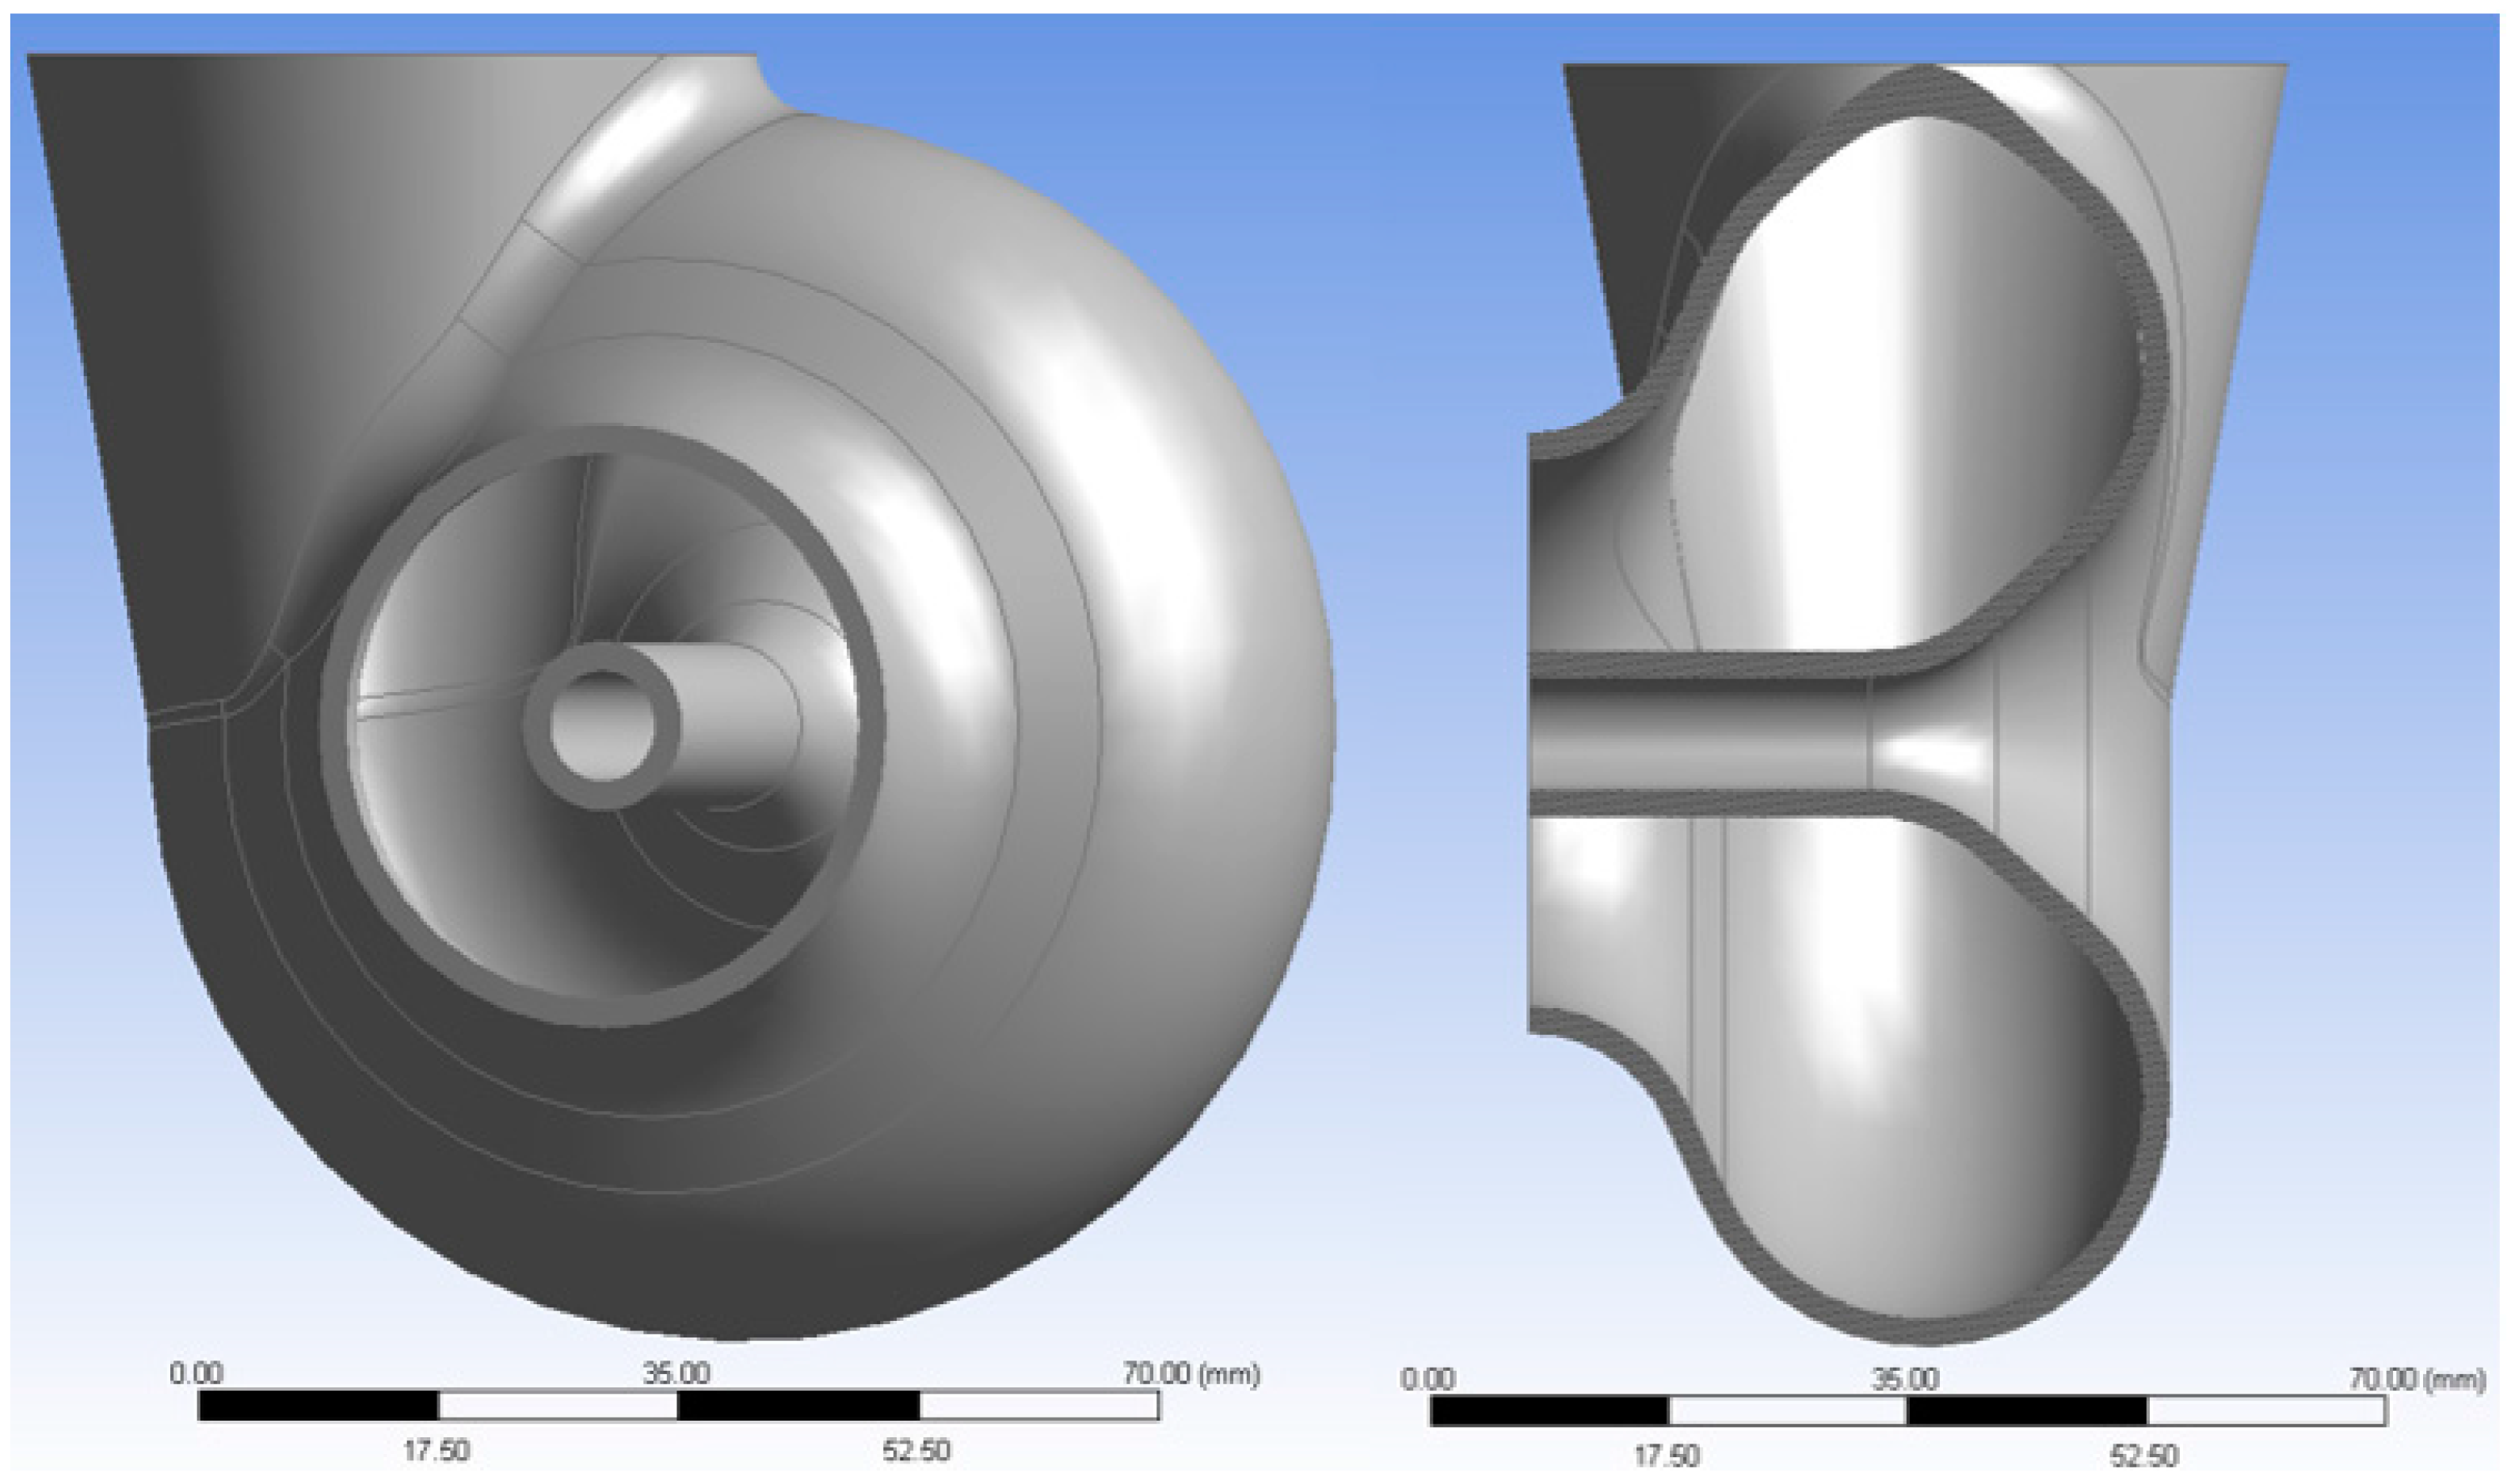
Figure 13.
3D model of the optimised volute.
Figure 13.
3D model of the optimised volute.
Figure 14.
Original volute, velocity streamlines.
Figure 14.
Original volute, velocity streamlines.
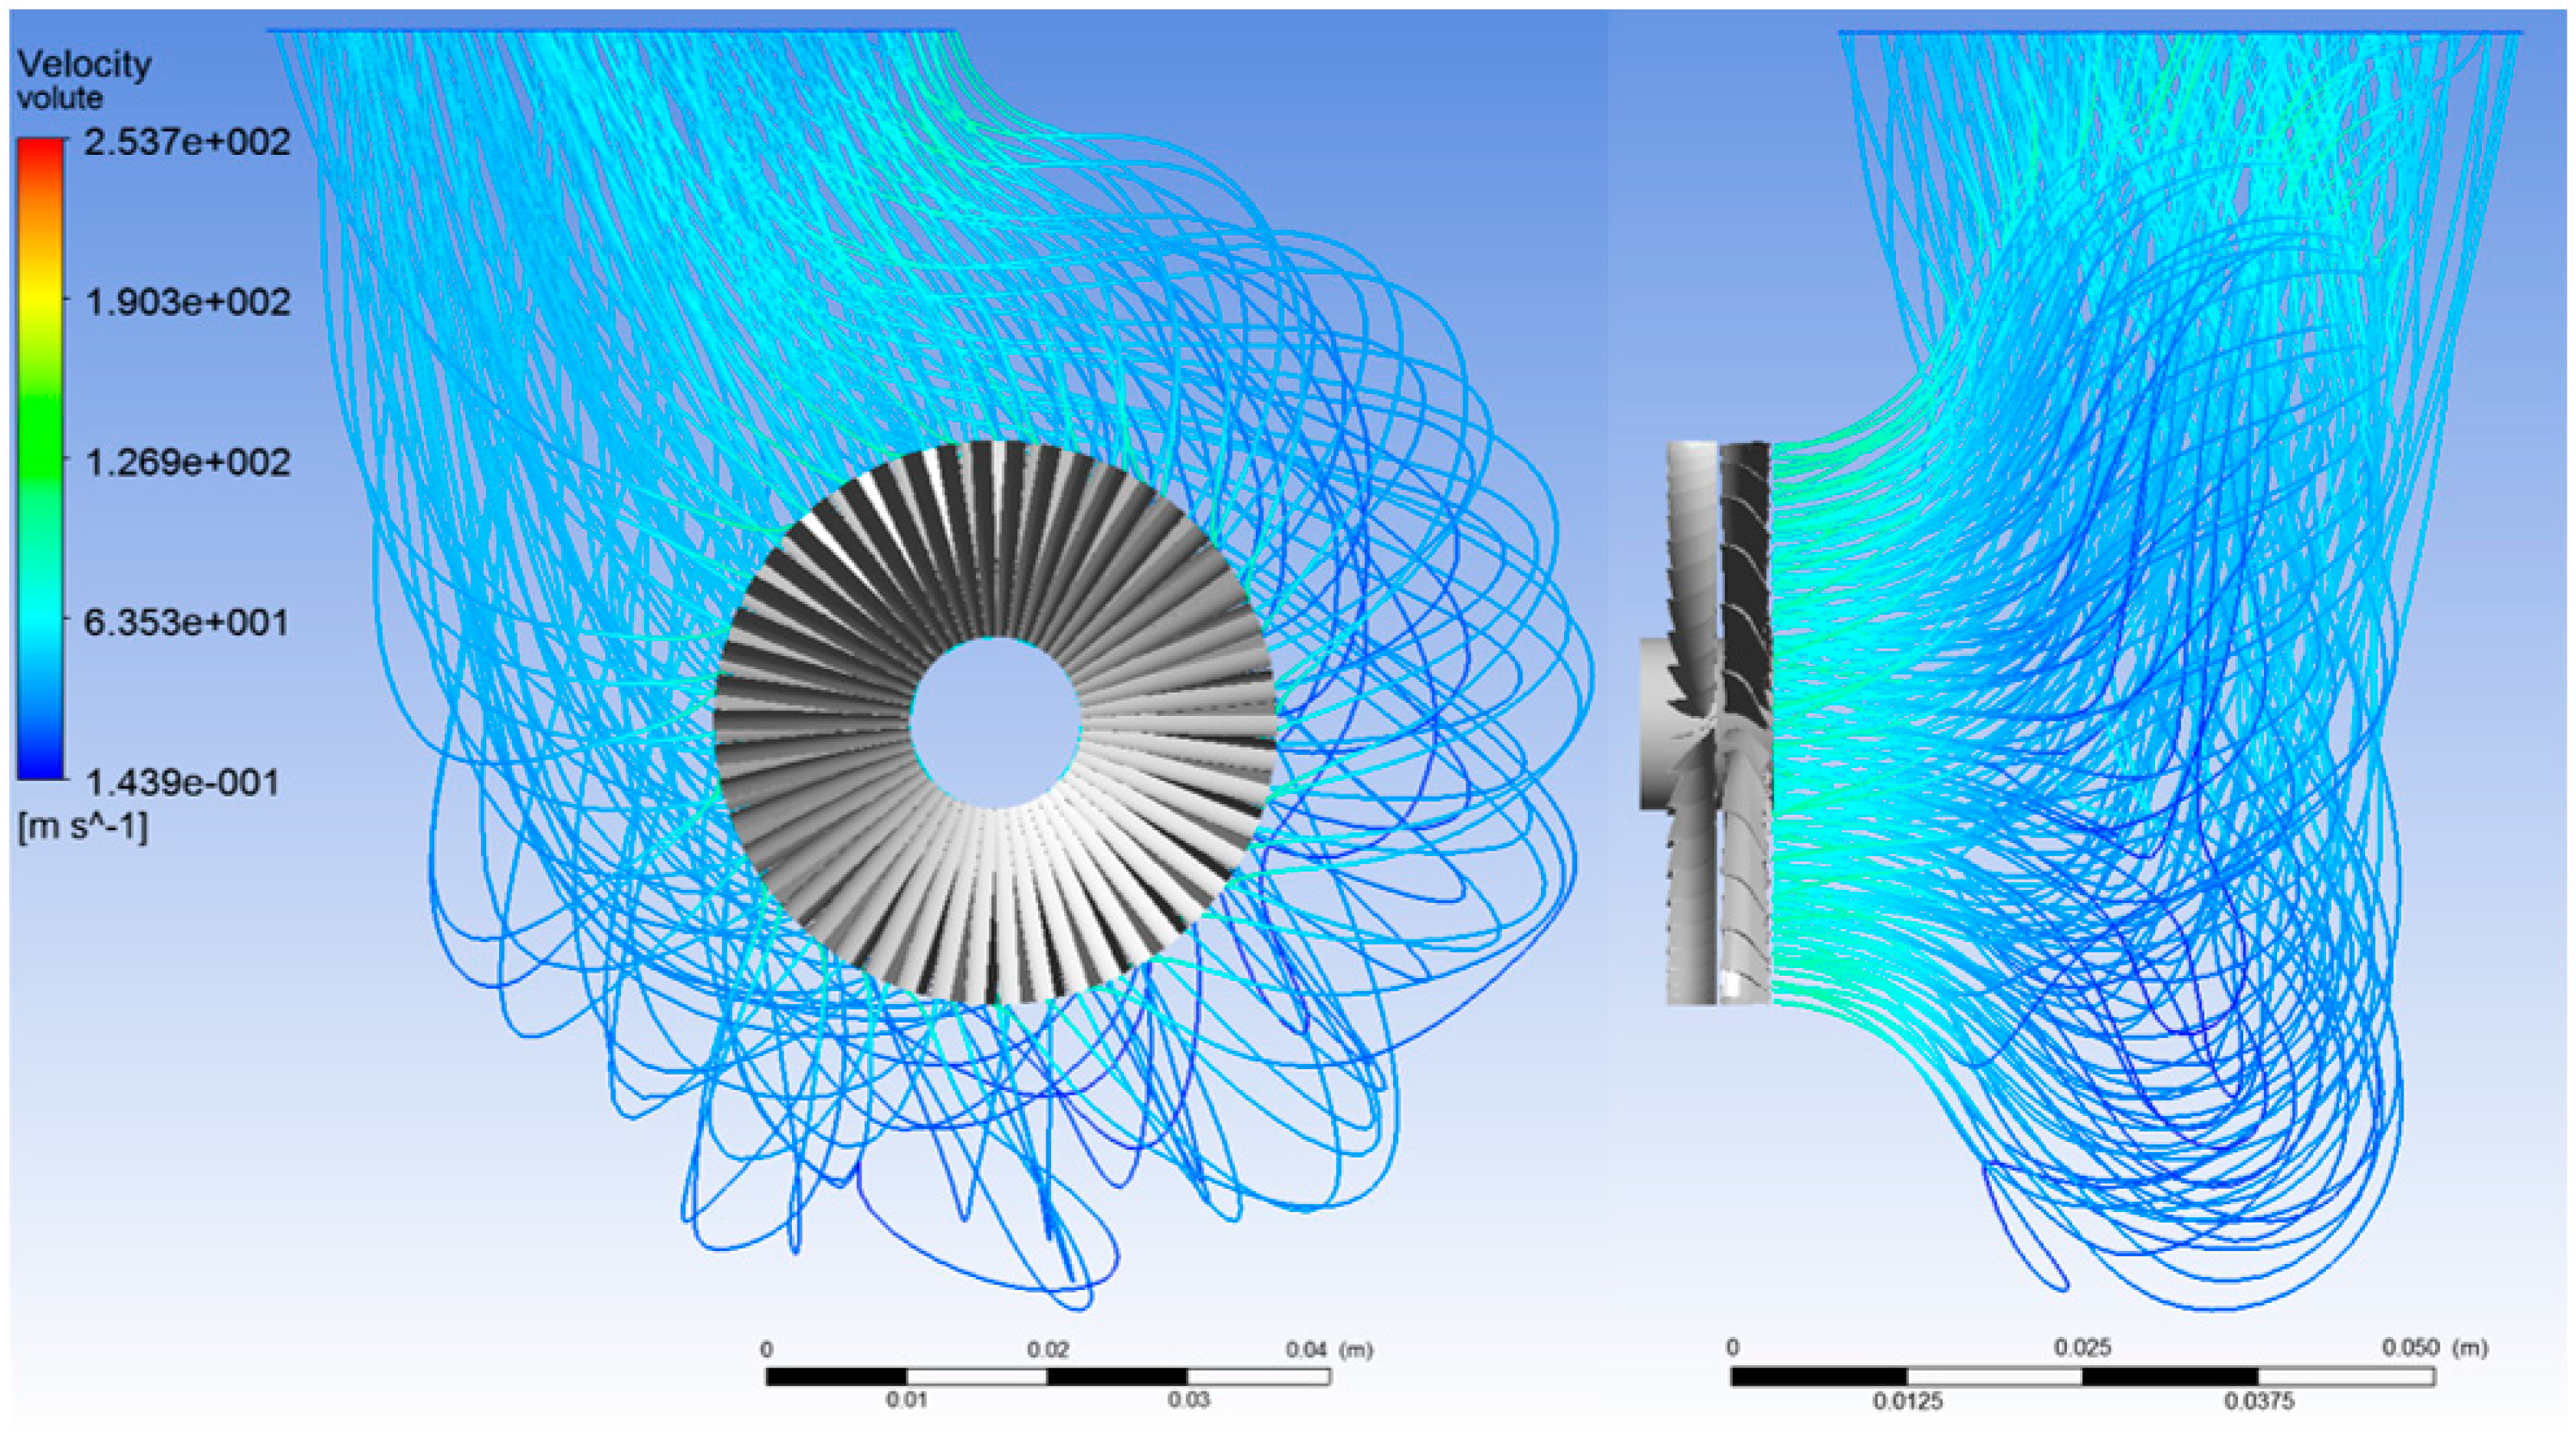
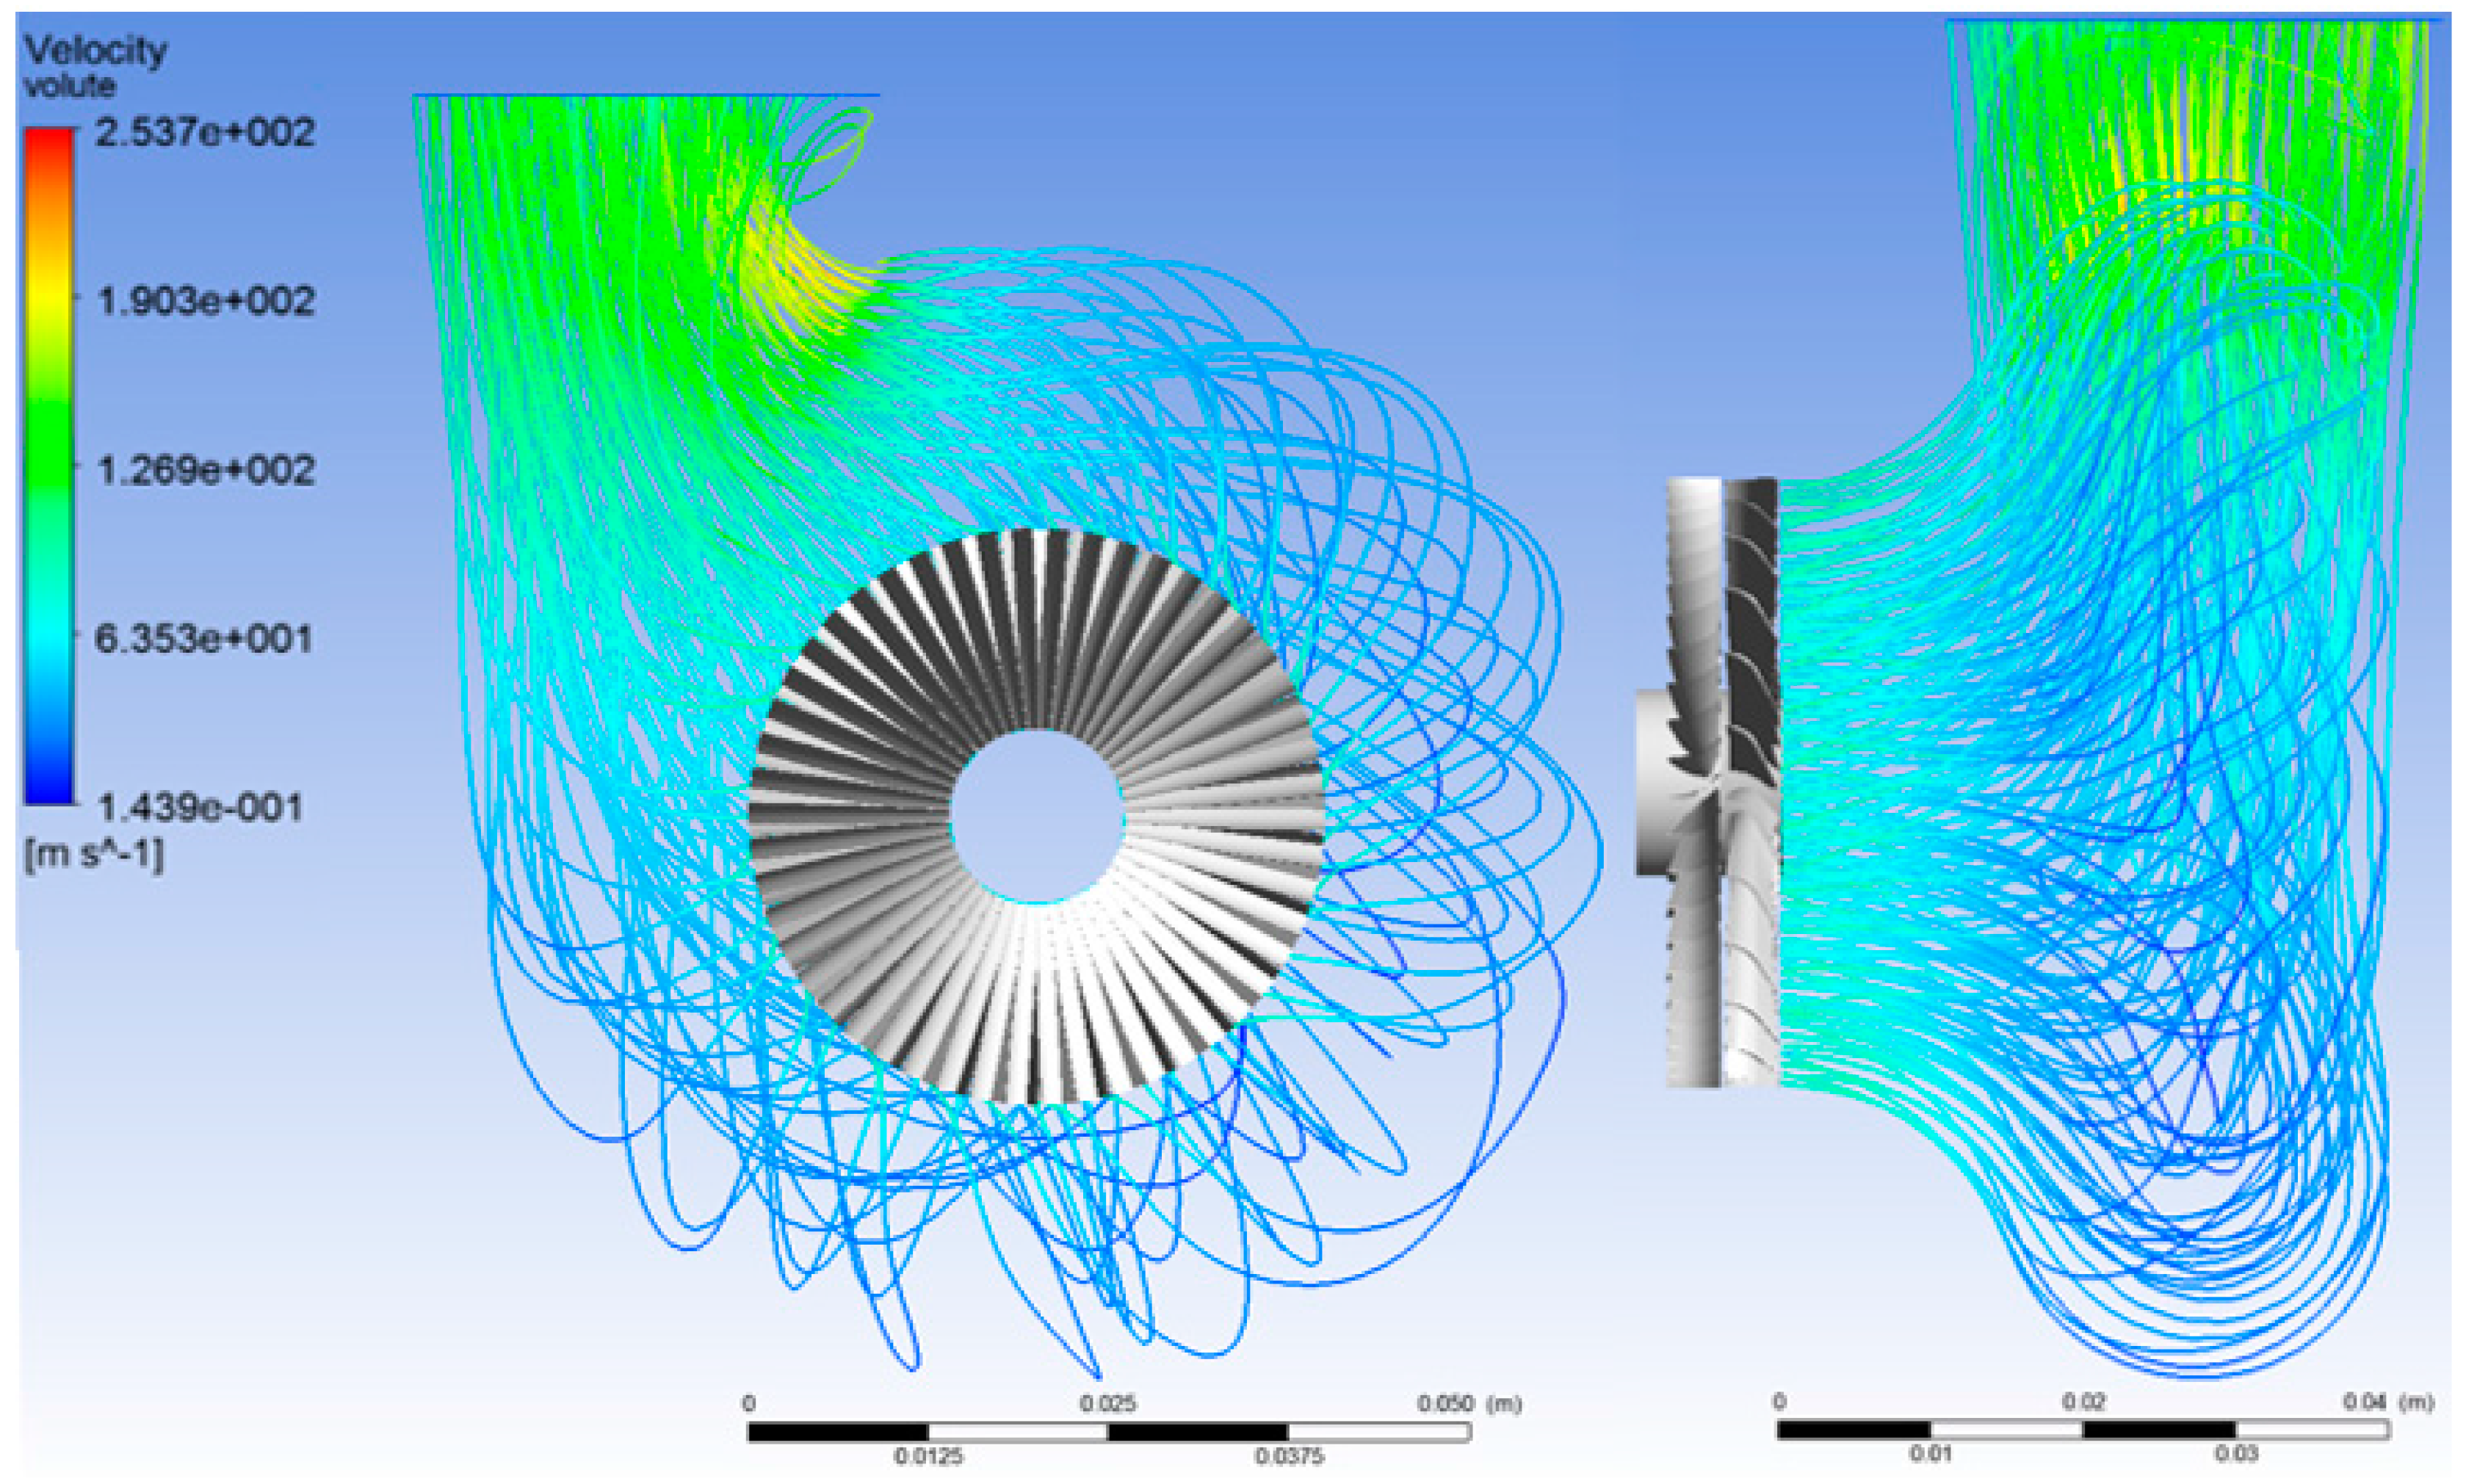
Figure 15.
Optimised volute, velocity streamlines.
Figure 15.
Optimised volute, velocity streamlines.
Figure 16.
Preliminary design velocity triangles at root (left) mean (centre) and tip (right).
Figure 16.
Preliminary design velocity triangles at root (left) mean (centre) and tip (right).
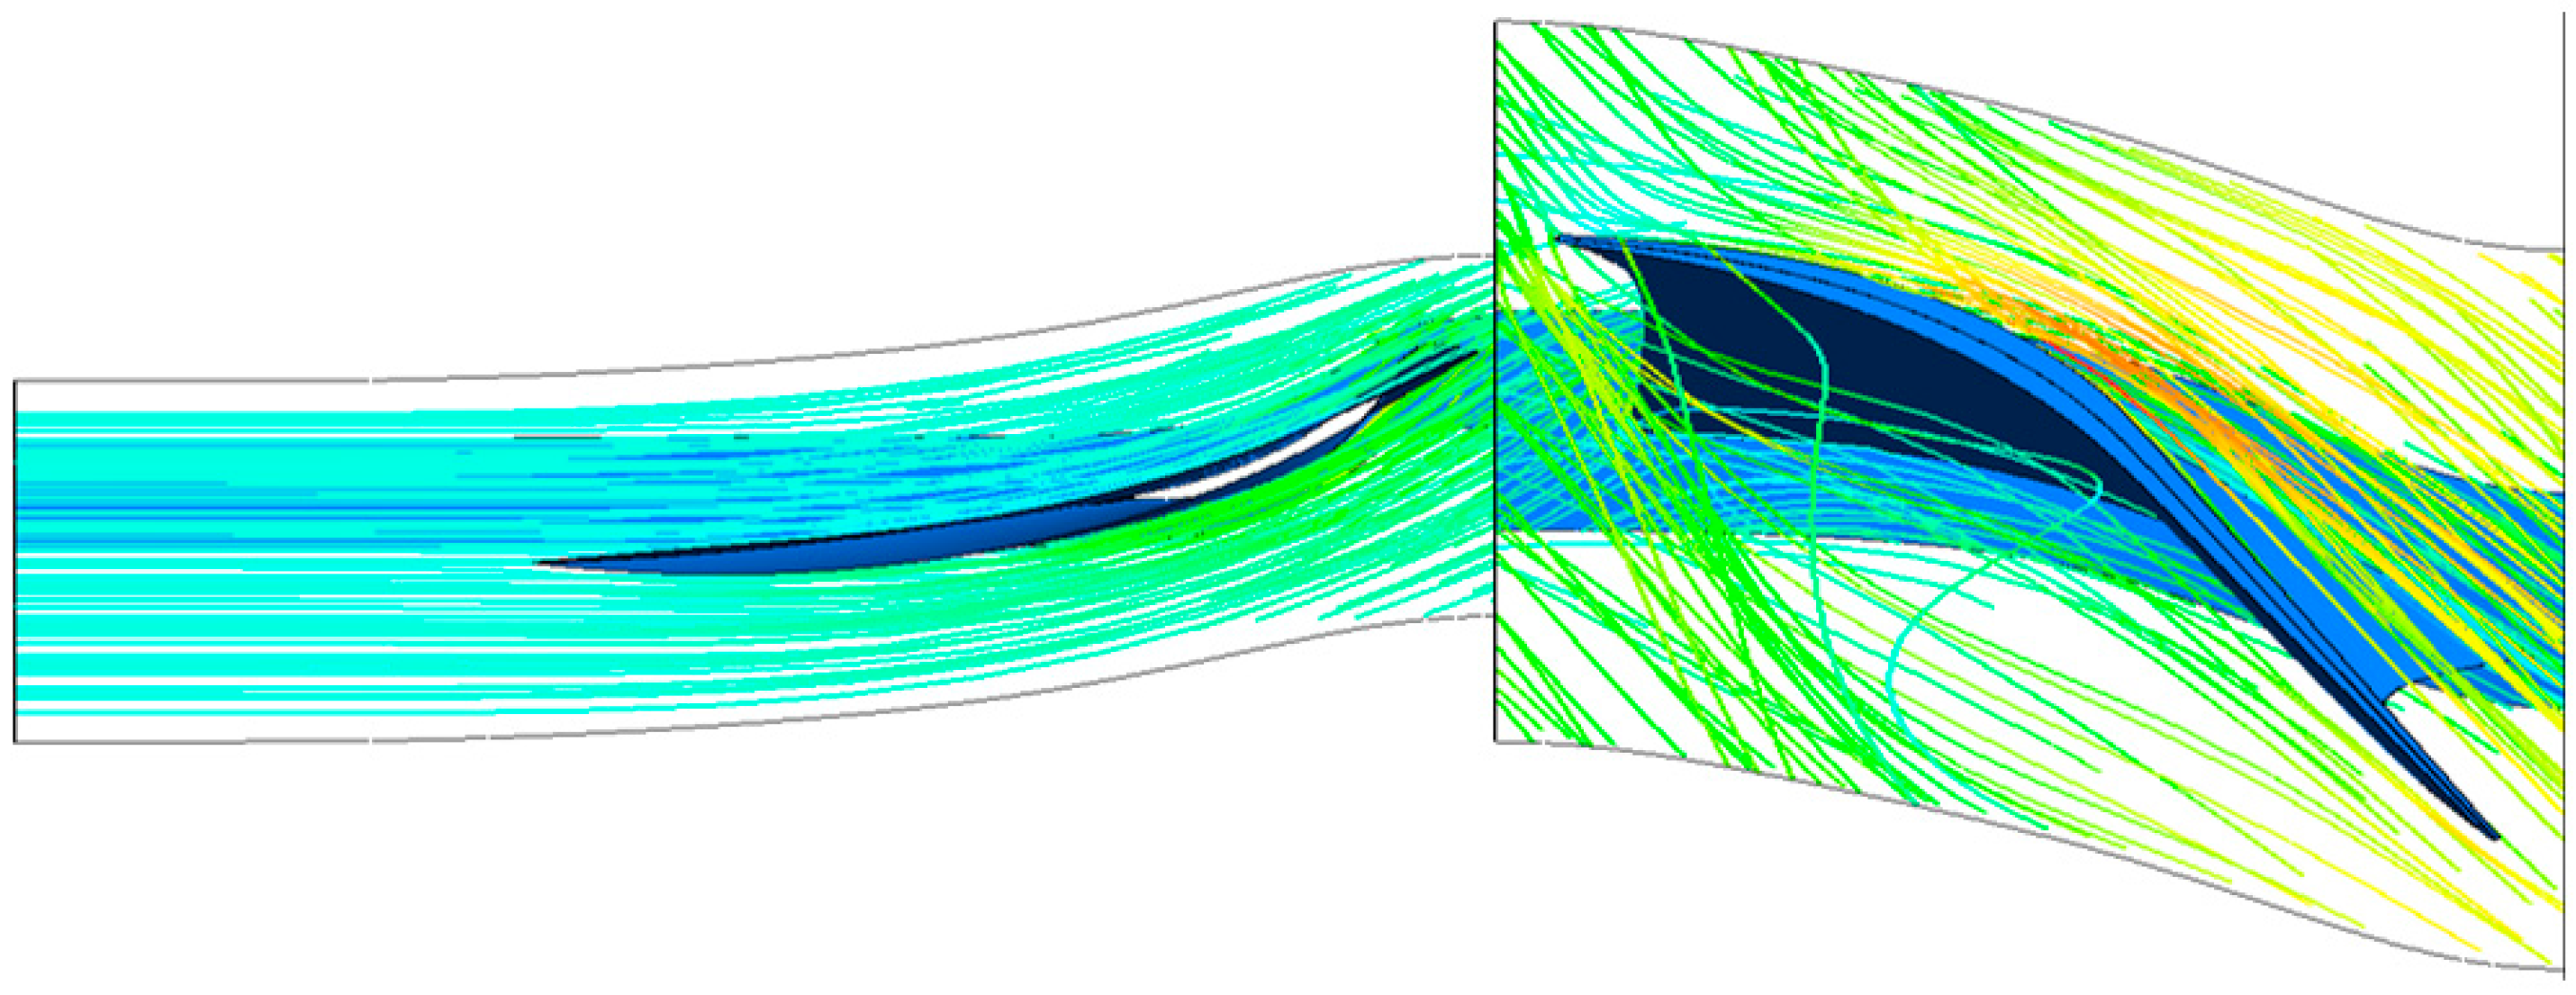
Figure 17.
CFX results contour illustrating the translational flow path through the turbine.
Figure 17.
CFX results contour illustrating the translational flow path through the turbine.
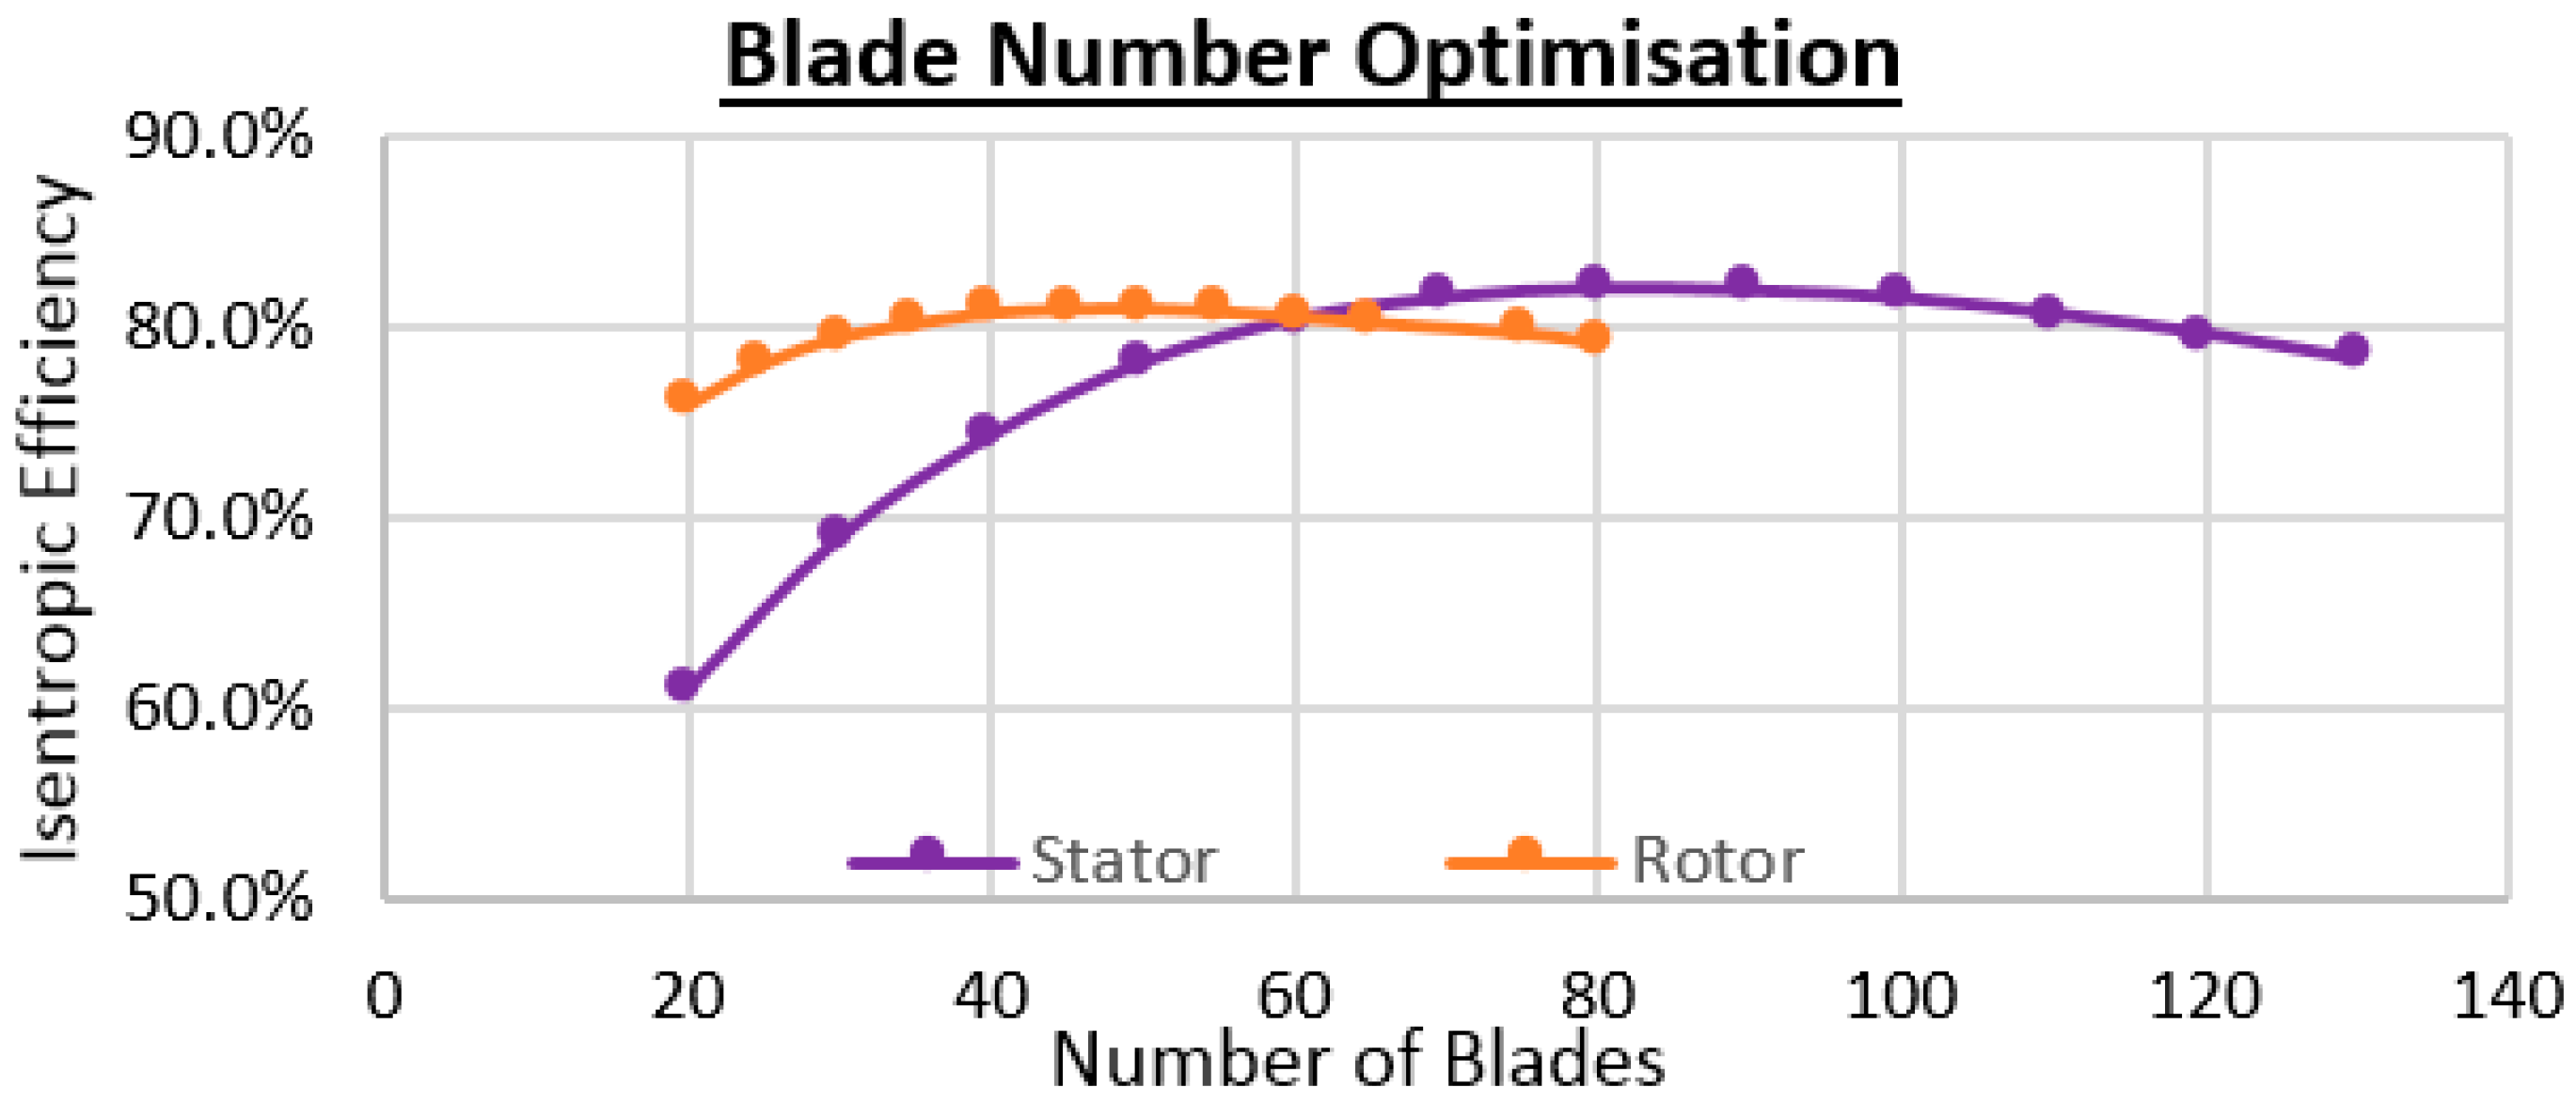
Figure 18.
Data regarding the optimisation of the allocated blade numbering.
Figure 18.
Data regarding the optimisation of the allocated blade numbering.
Figure 19.
Root sketch for the stator (left) and rotor (right) illustrating blade constraints.
Figure 19.
Root sketch for the stator (left) and rotor (right) illustrating blade constraints.
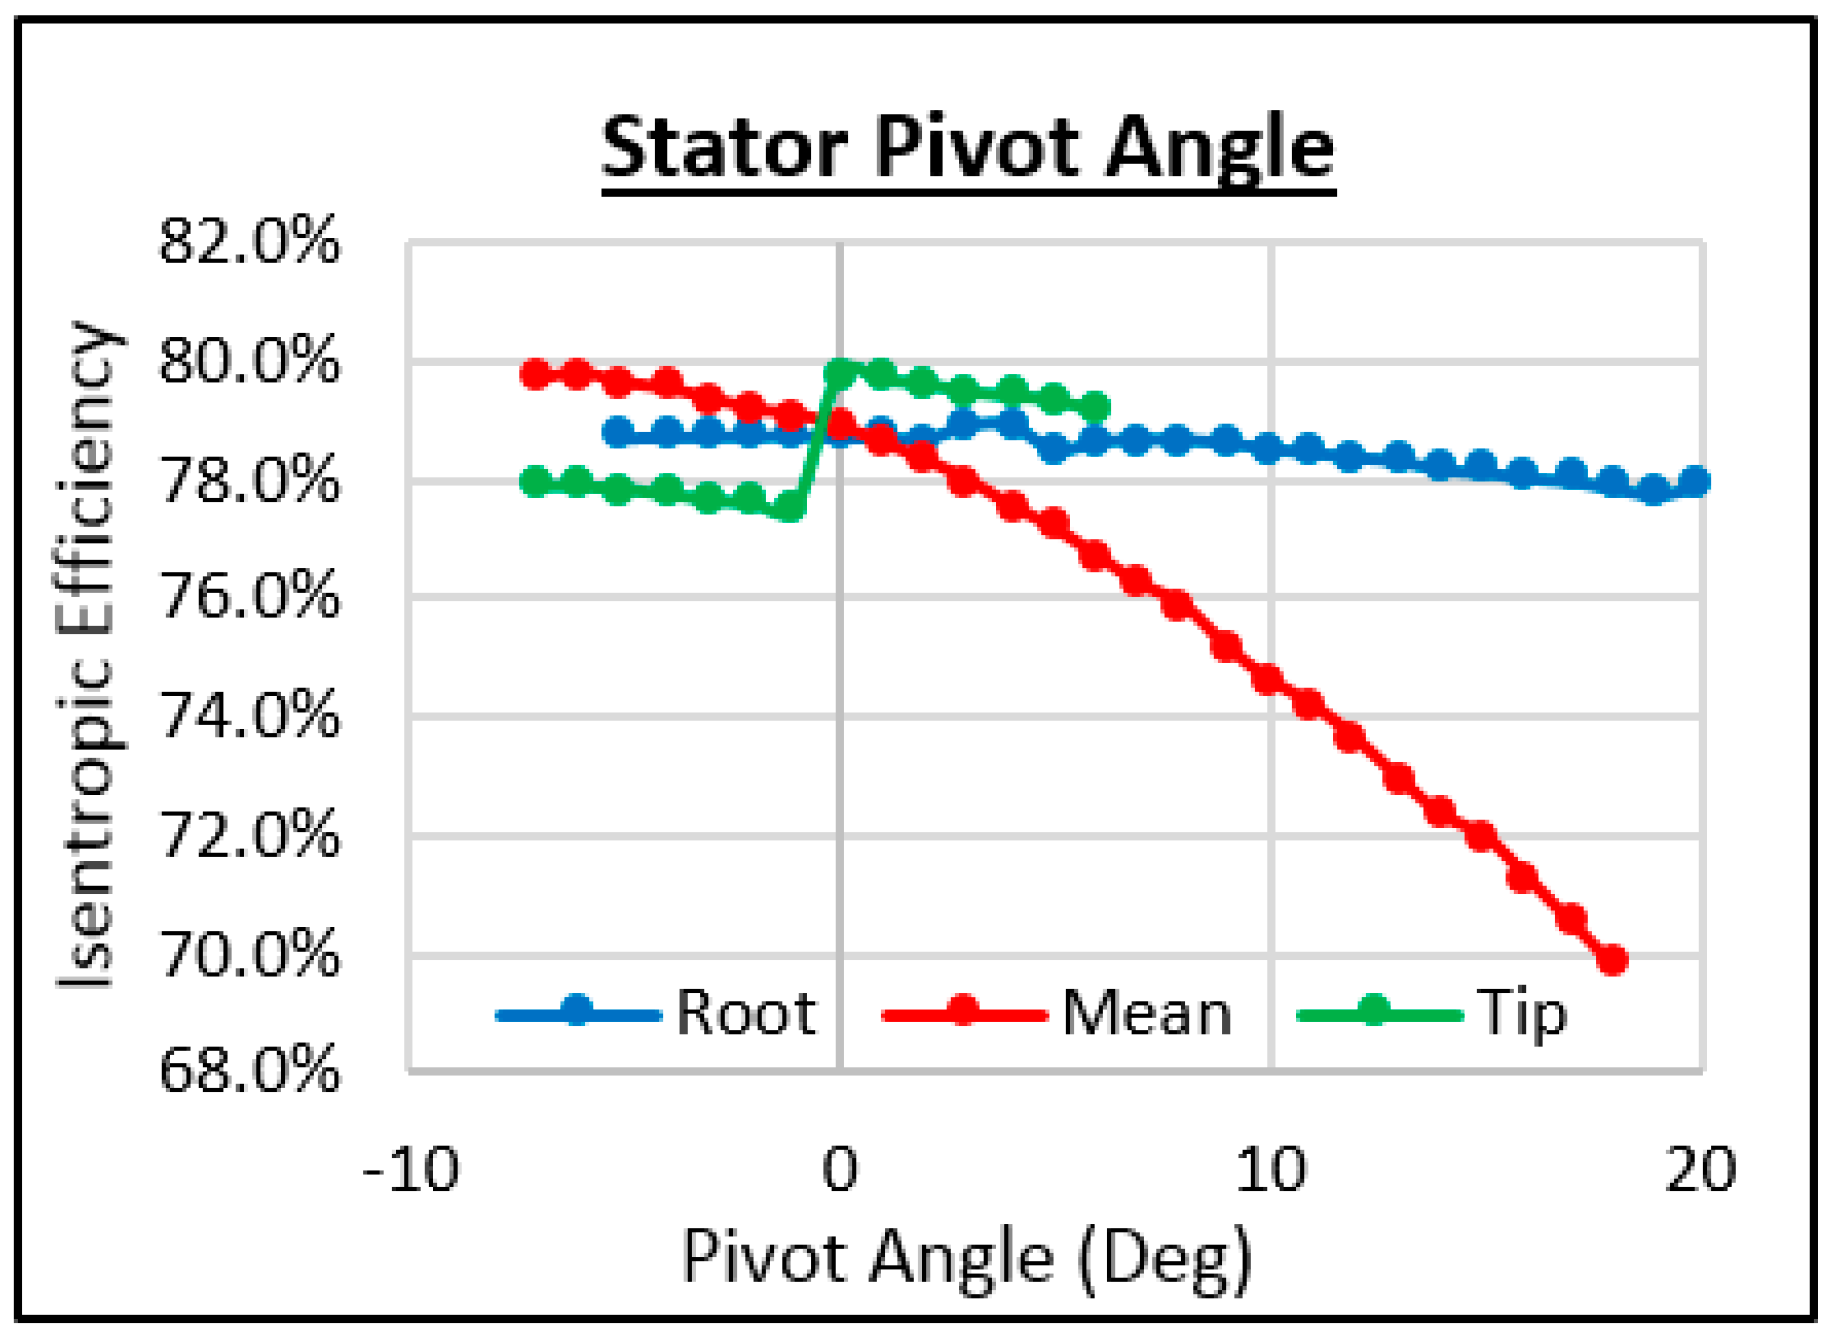
Figure 20.
Study of the stator pivot angle.
Figure 20.
Study of the stator pivot angle.
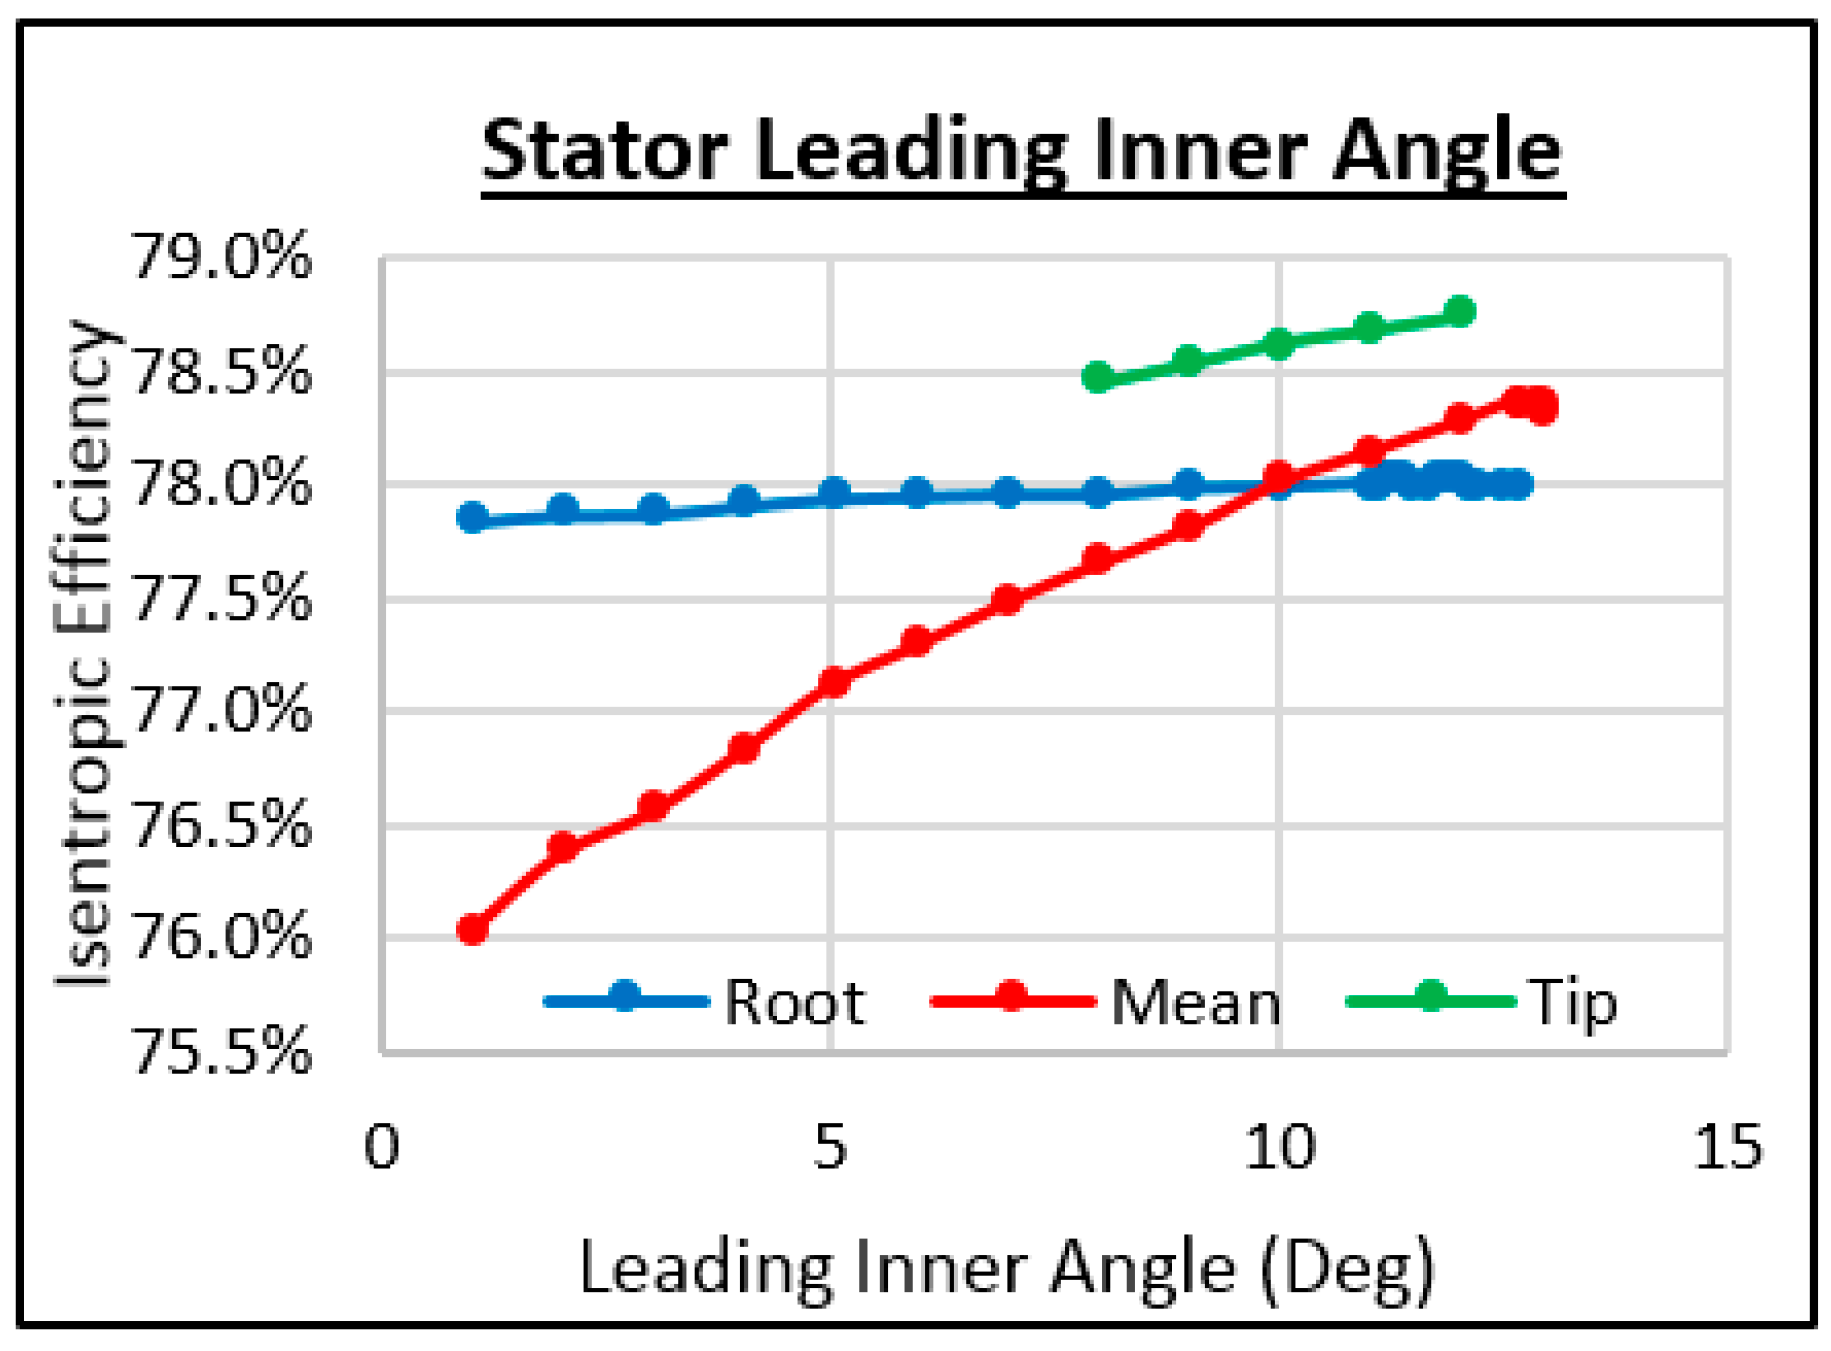
Figure 21.
Study of the stator leading inner angle.
Figure 21.
Study of the stator leading inner angle.
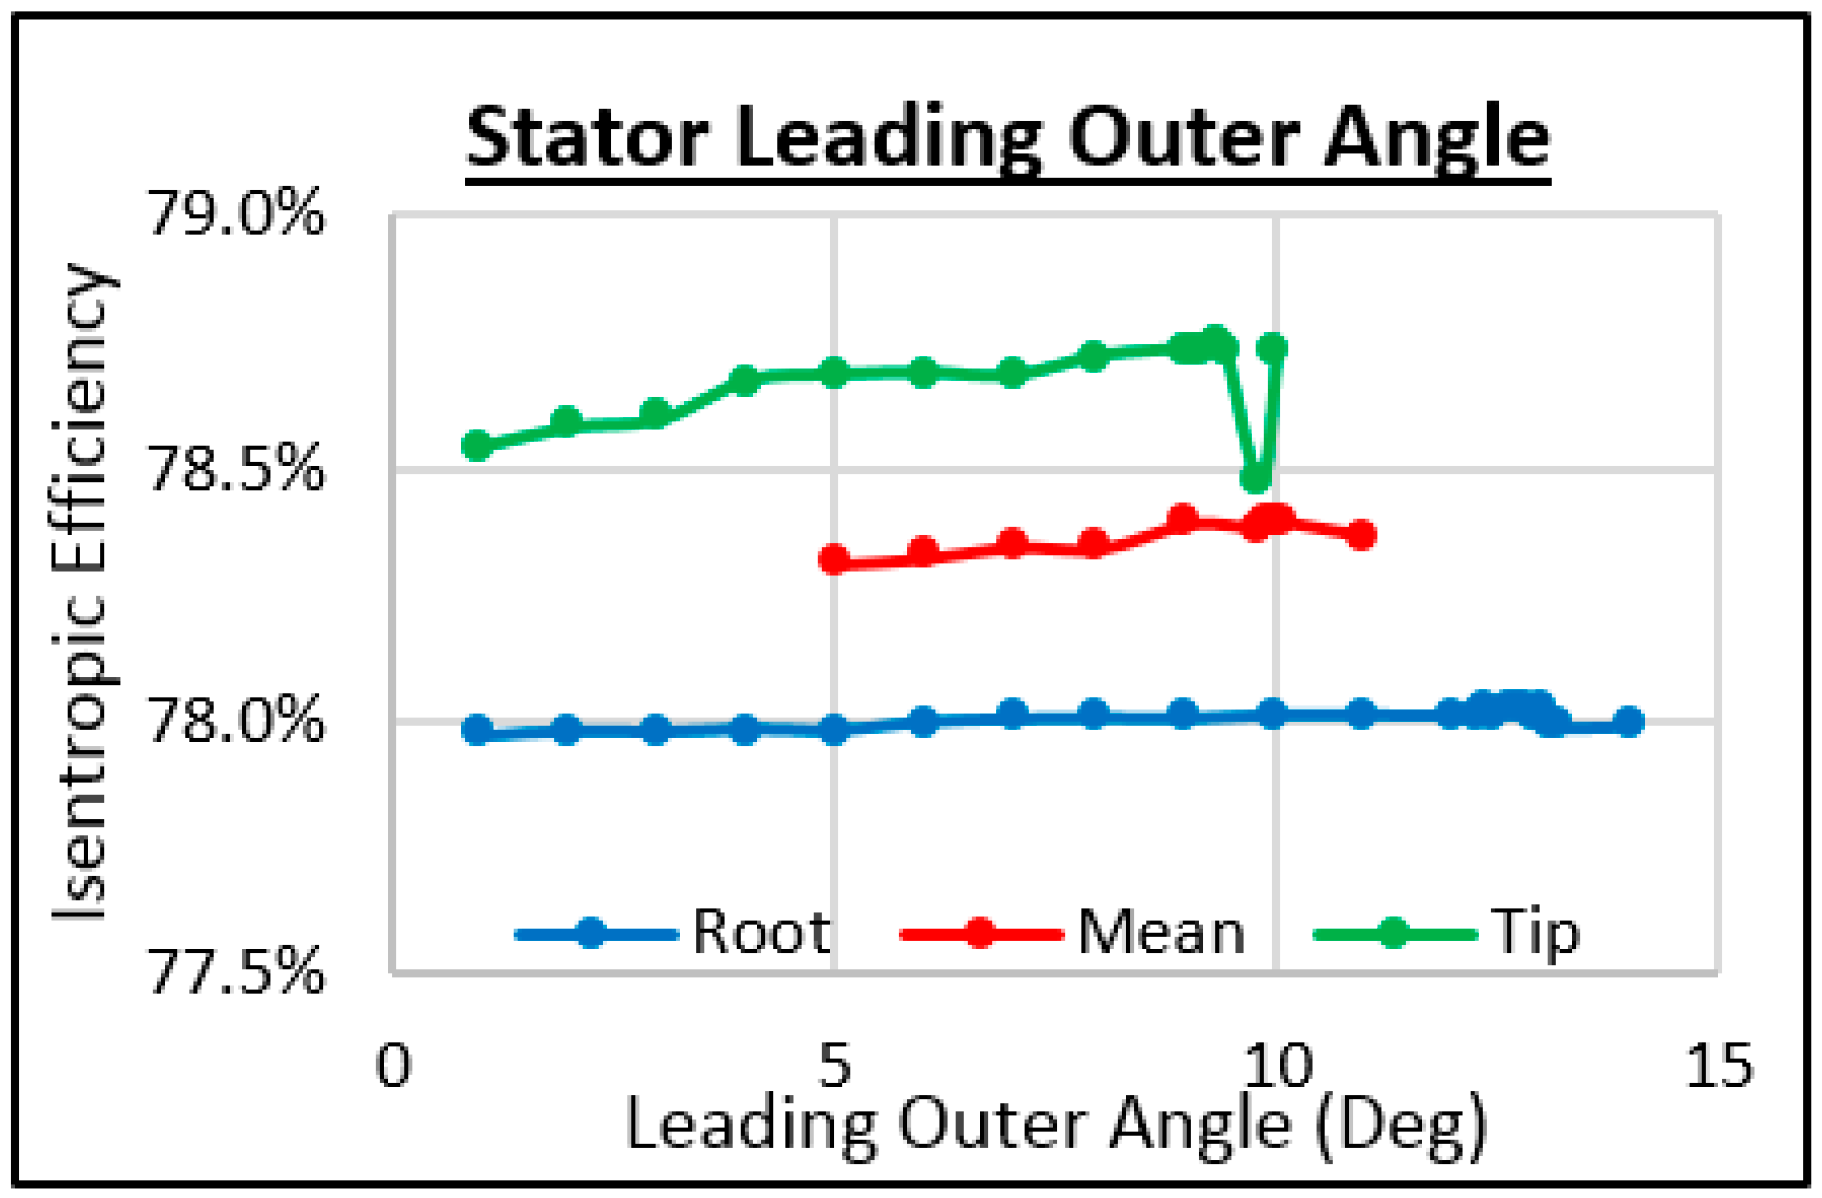
Figure 22.
Study of the stator leading outer angle.
Figure 22.
Study of the stator leading outer angle.
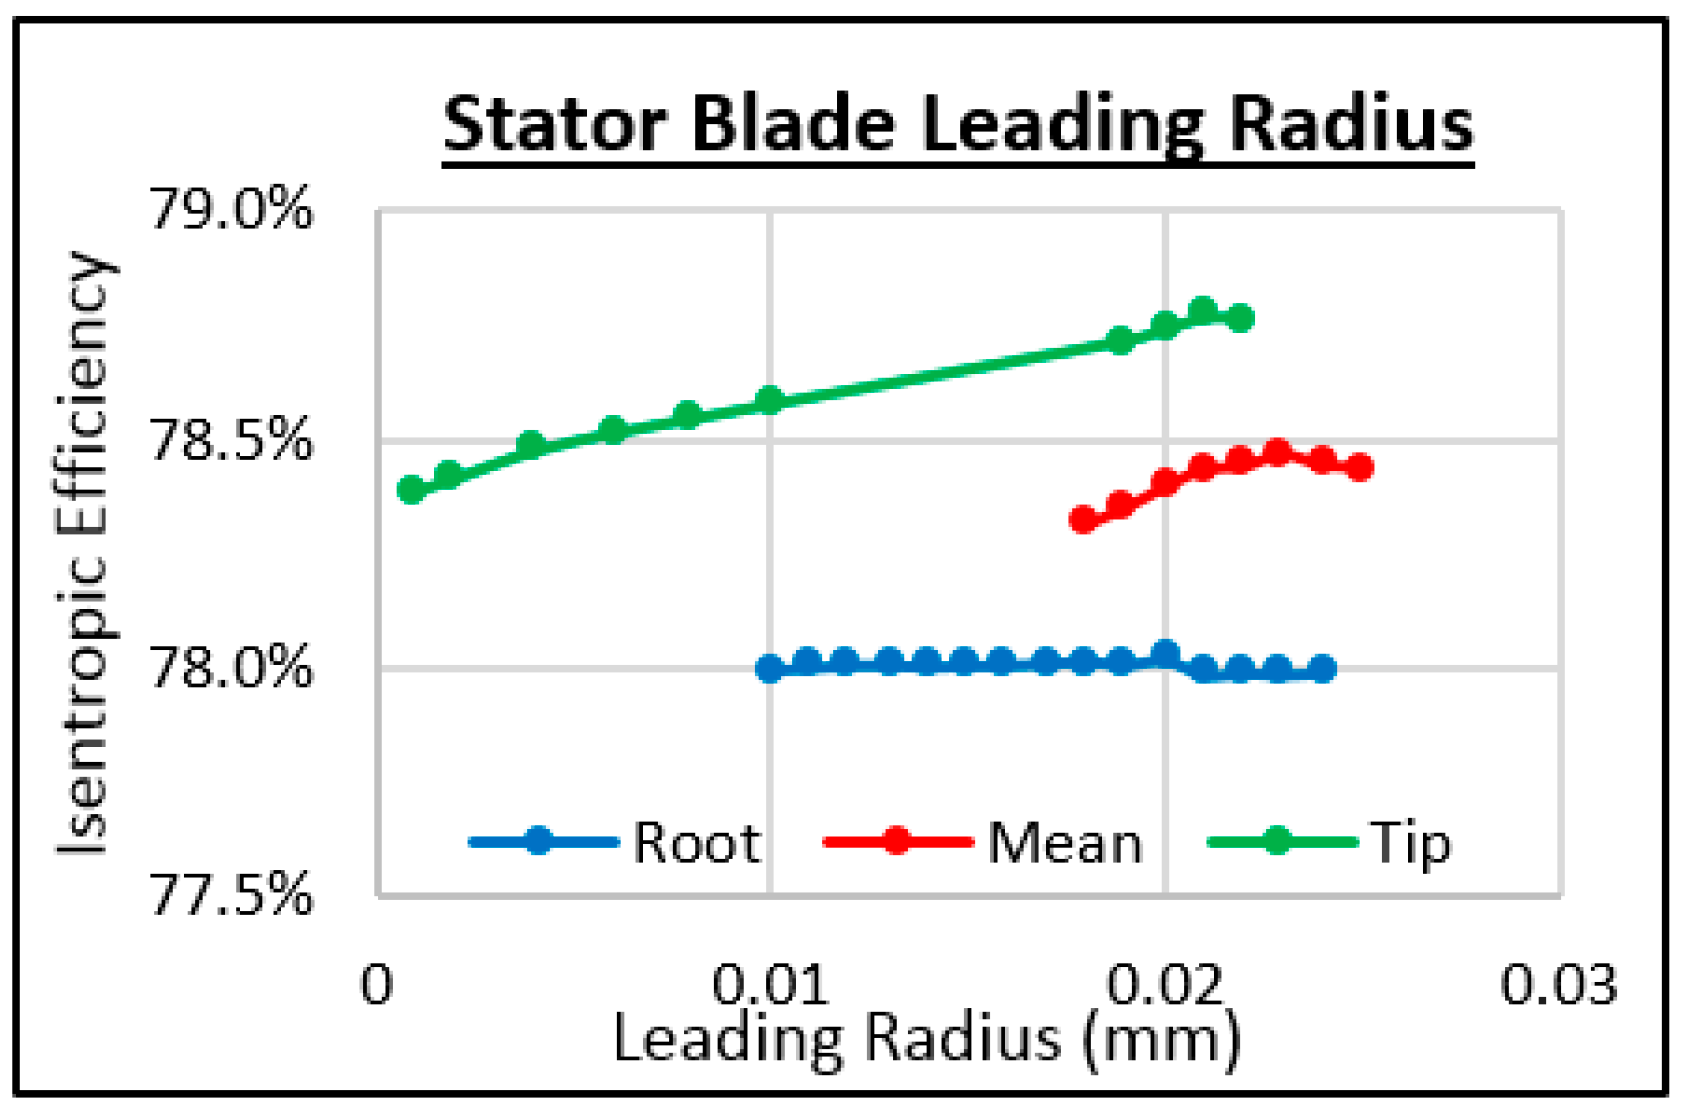
Figure 23.
Study of the stator leading radius.
Figure 23.
Study of the stator leading radius.
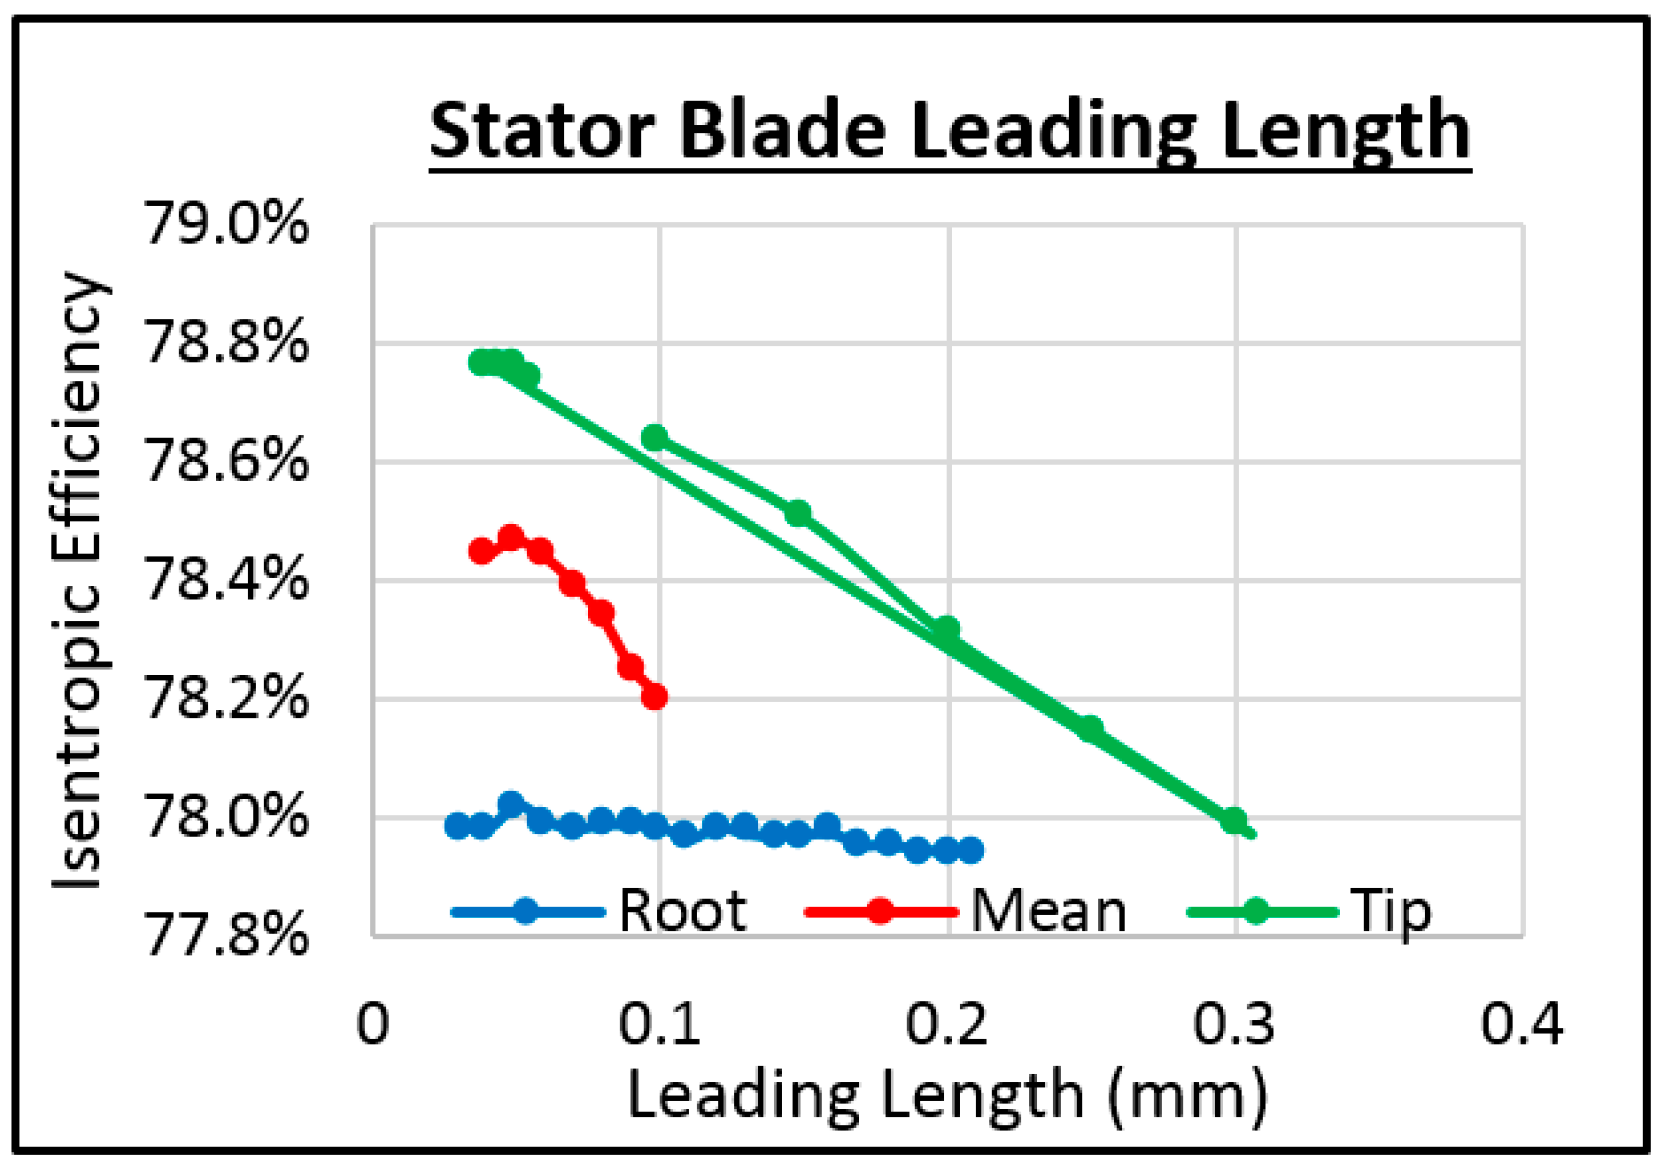
Figure 24.
Study of the stator leading length.
Figure 24.
Study of the stator leading length.
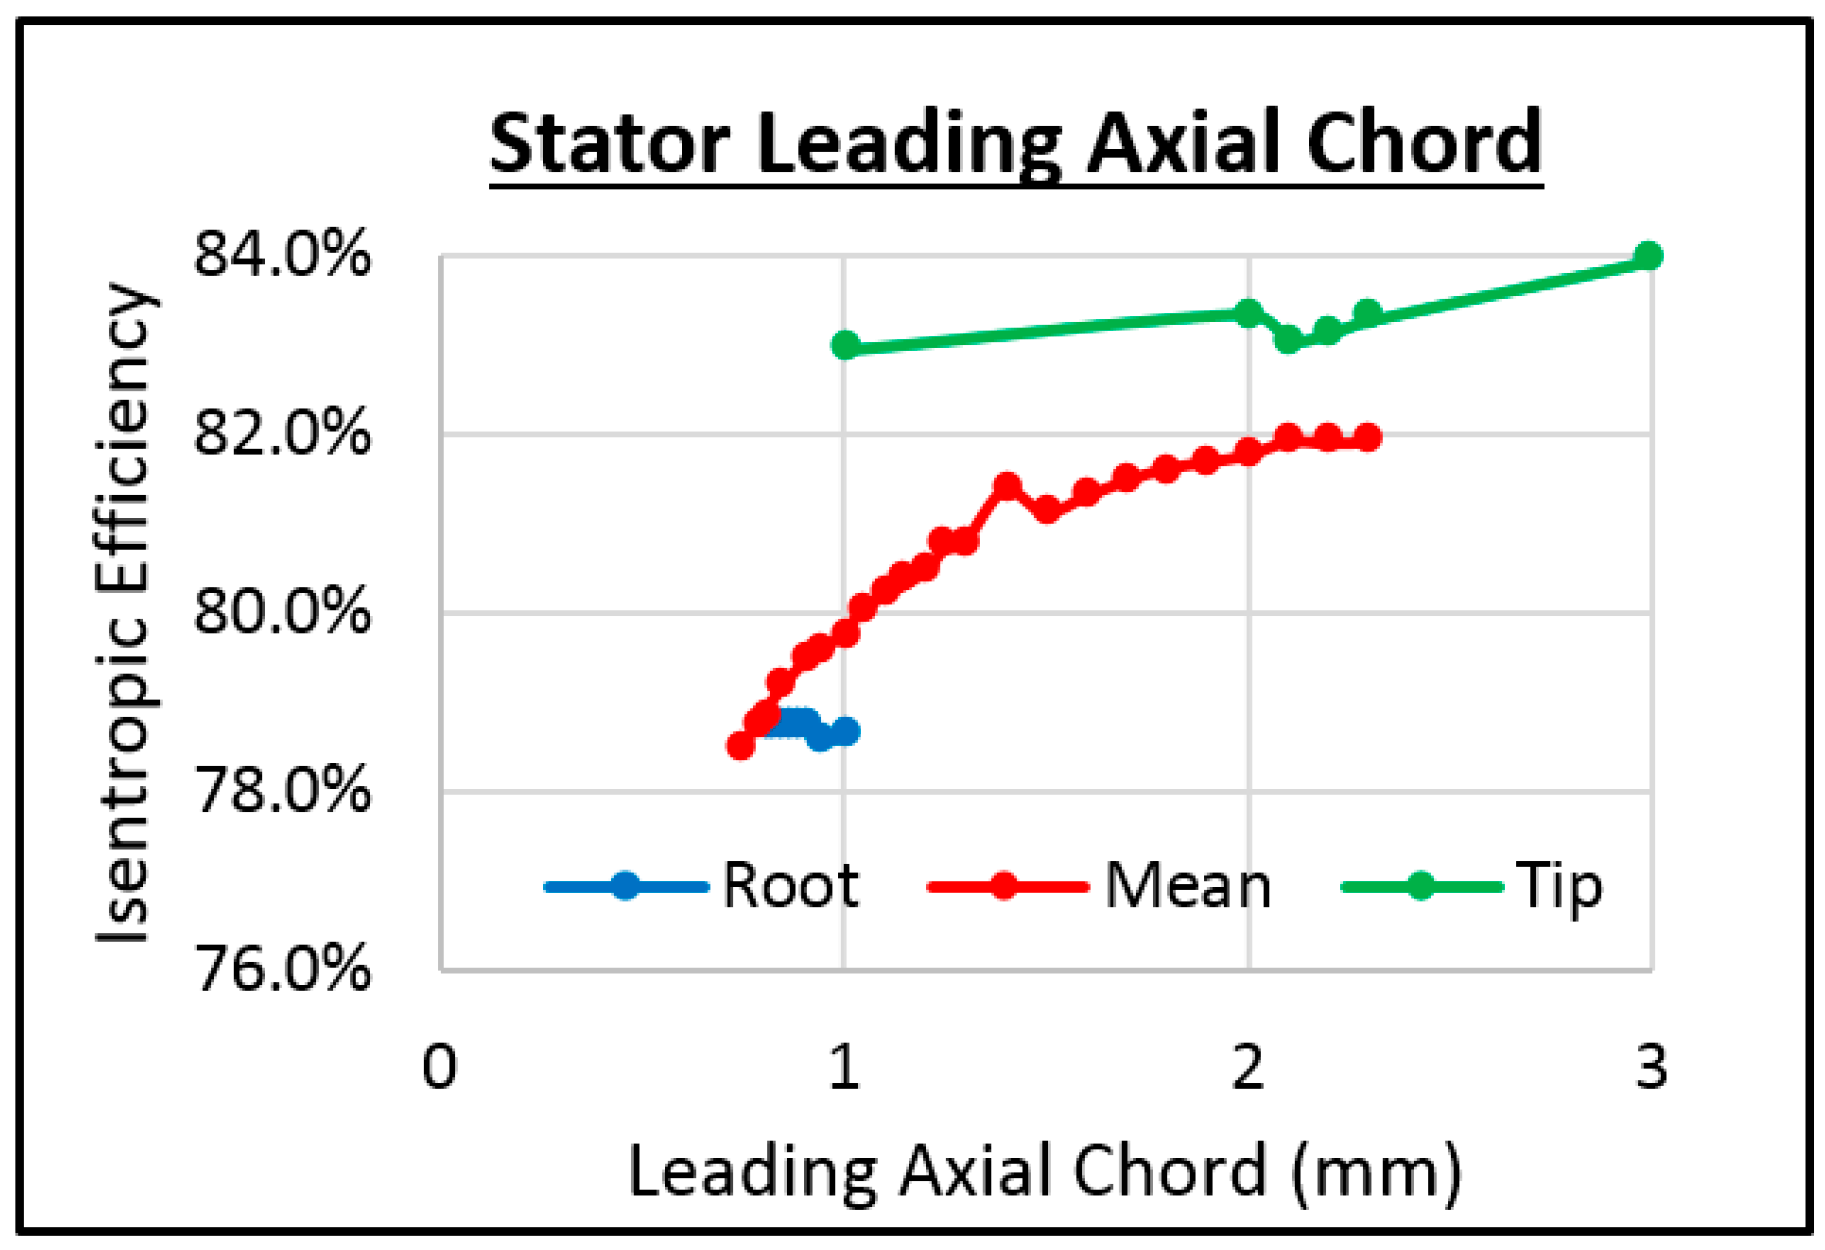
Figure 25.
Study of the stator leading axial chord.
Figure 25.
Study of the stator leading axial chord.
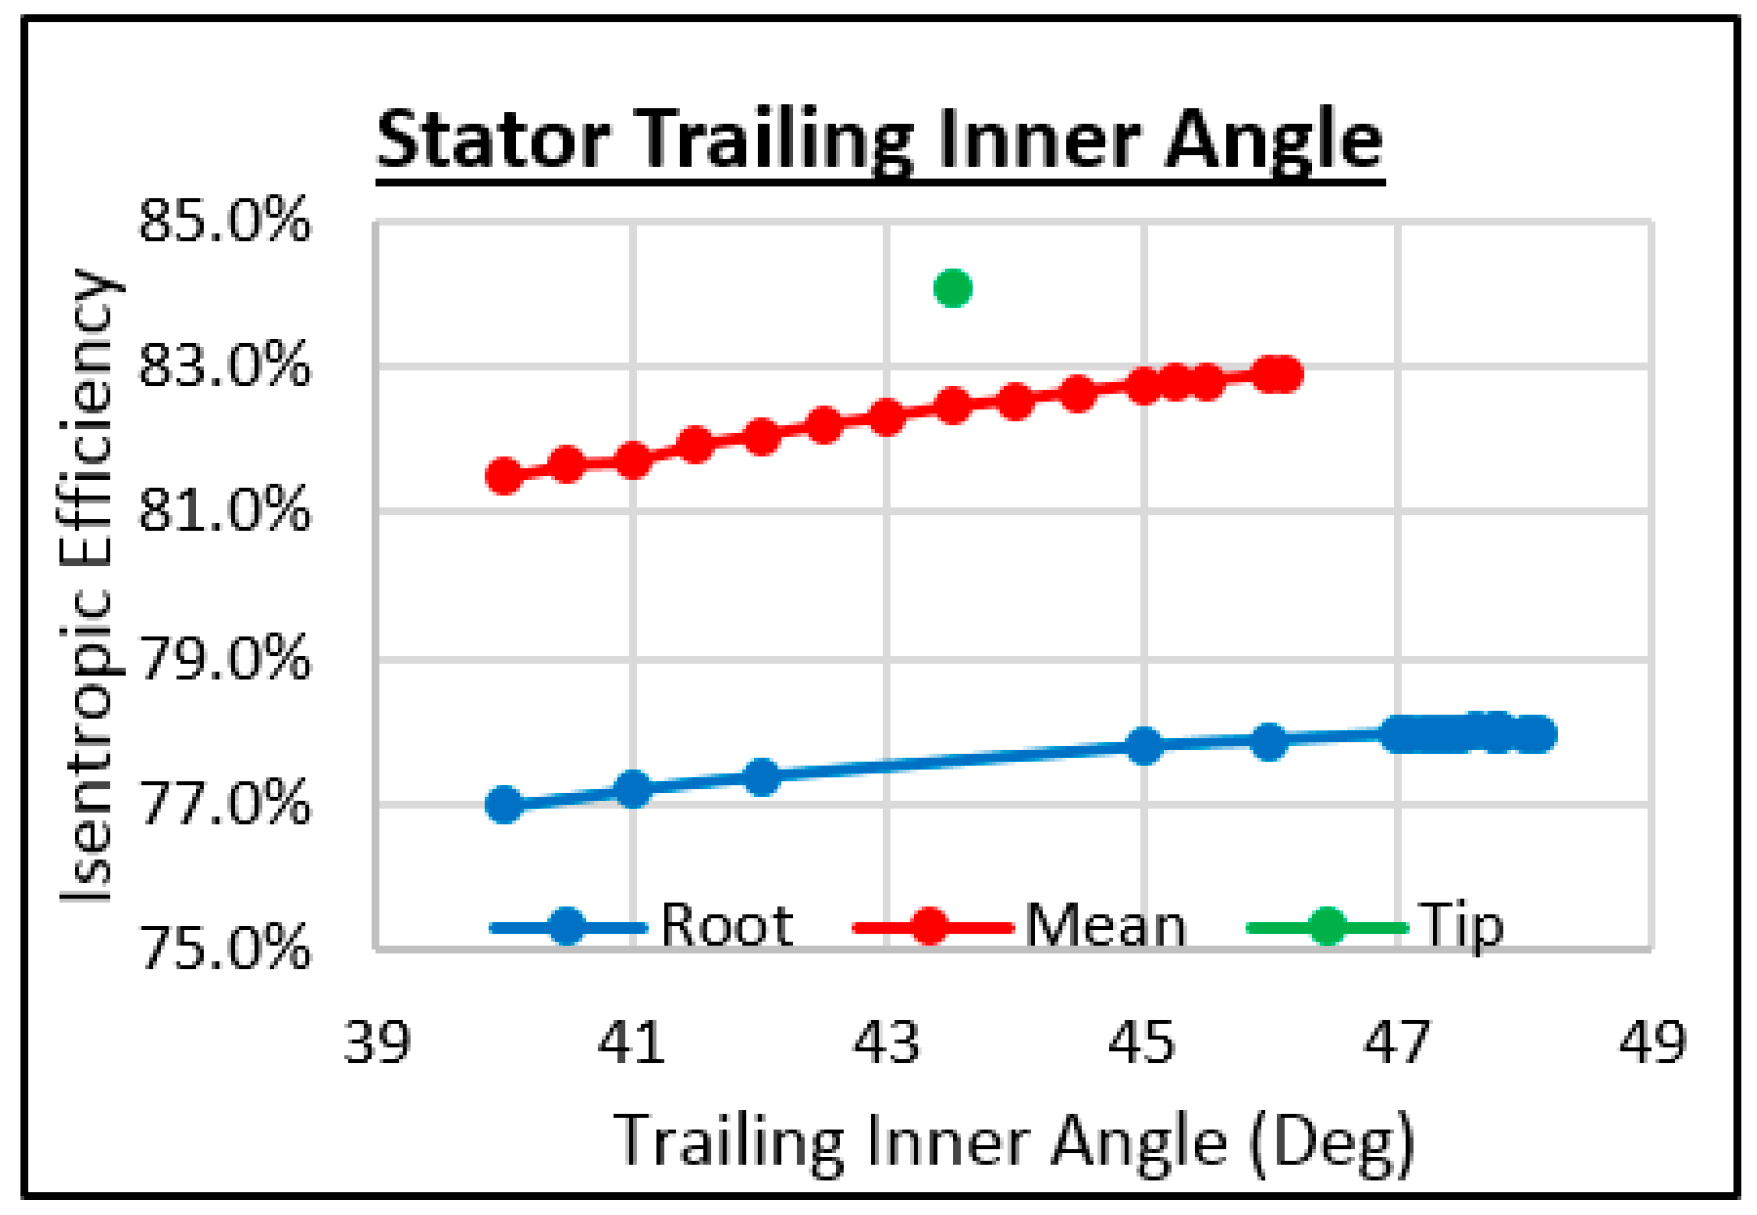
Figure 26.
Study of the stator trailing inner angle.
Figure 26.
Study of the stator trailing inner angle.
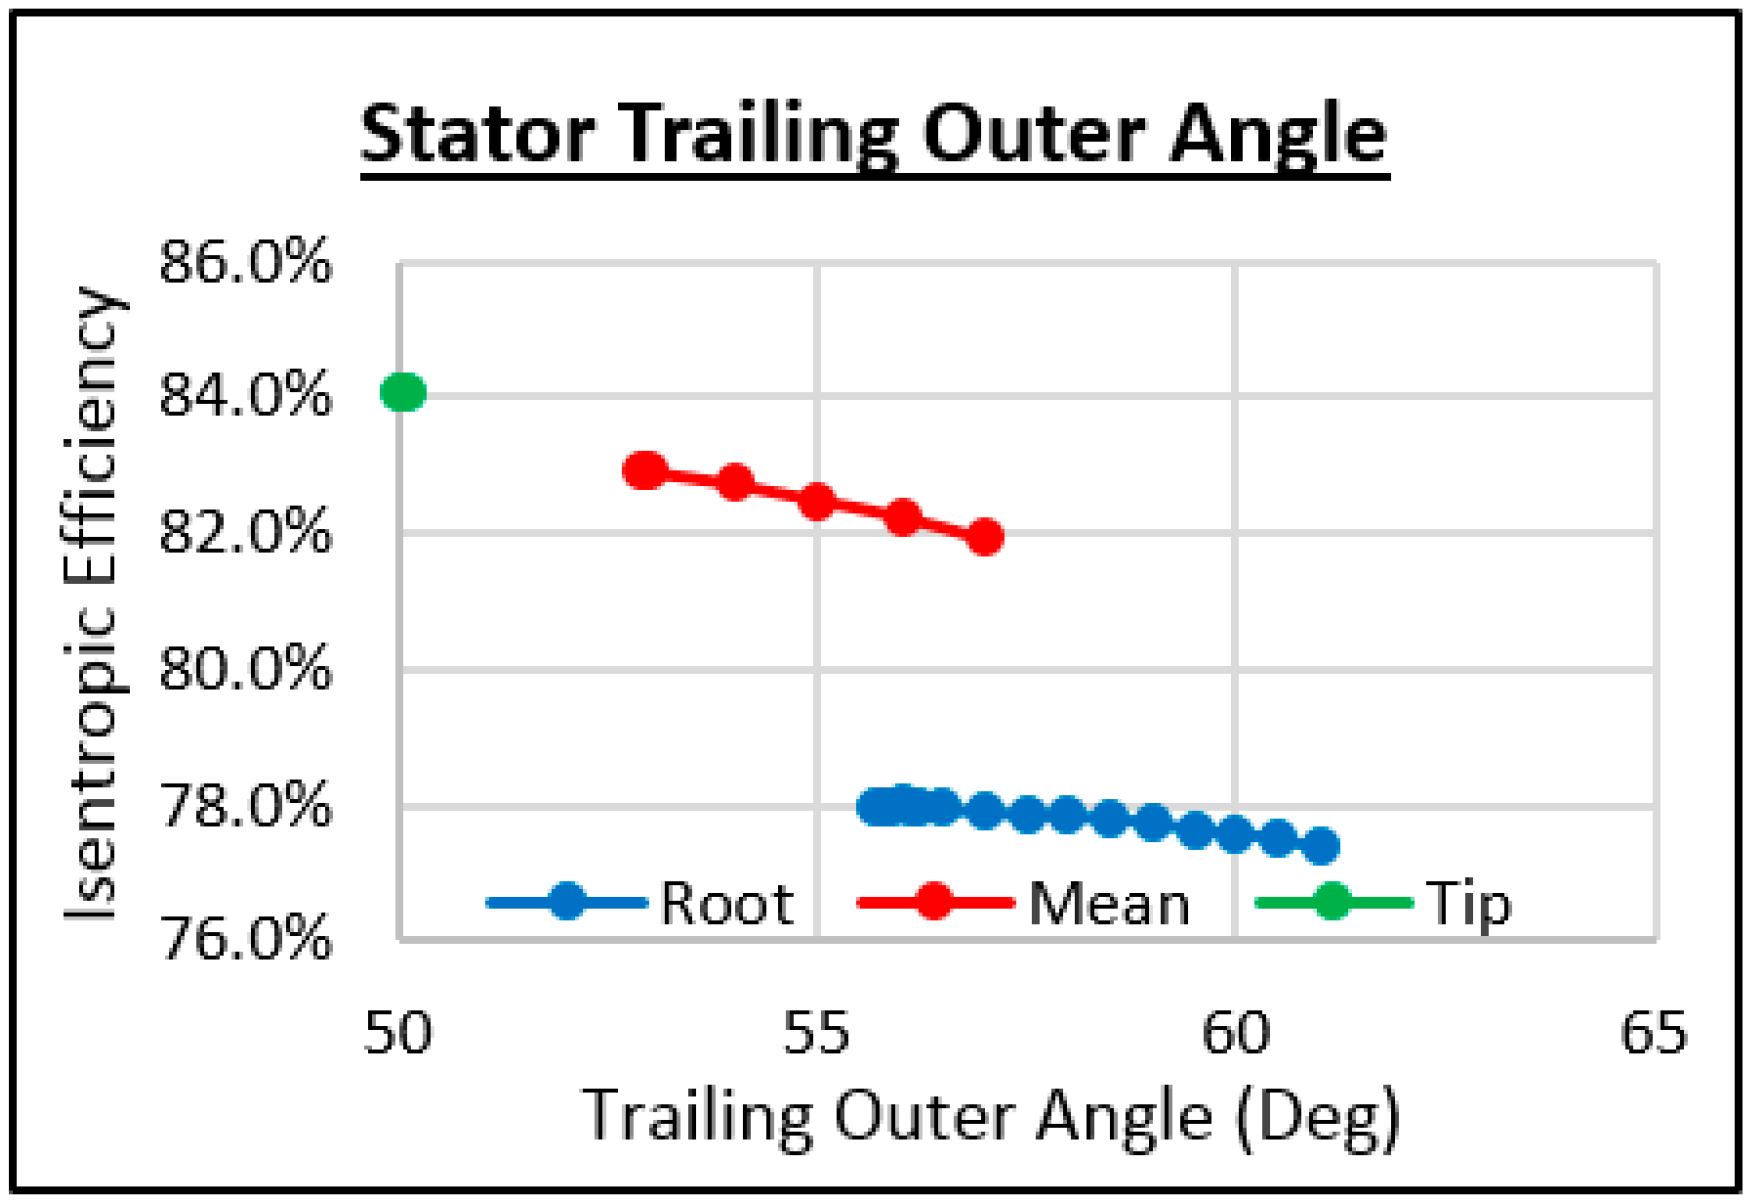
Figure 27.
Study of the stator trailing outer angle.
Figure 27.
Study of the stator trailing outer angle.
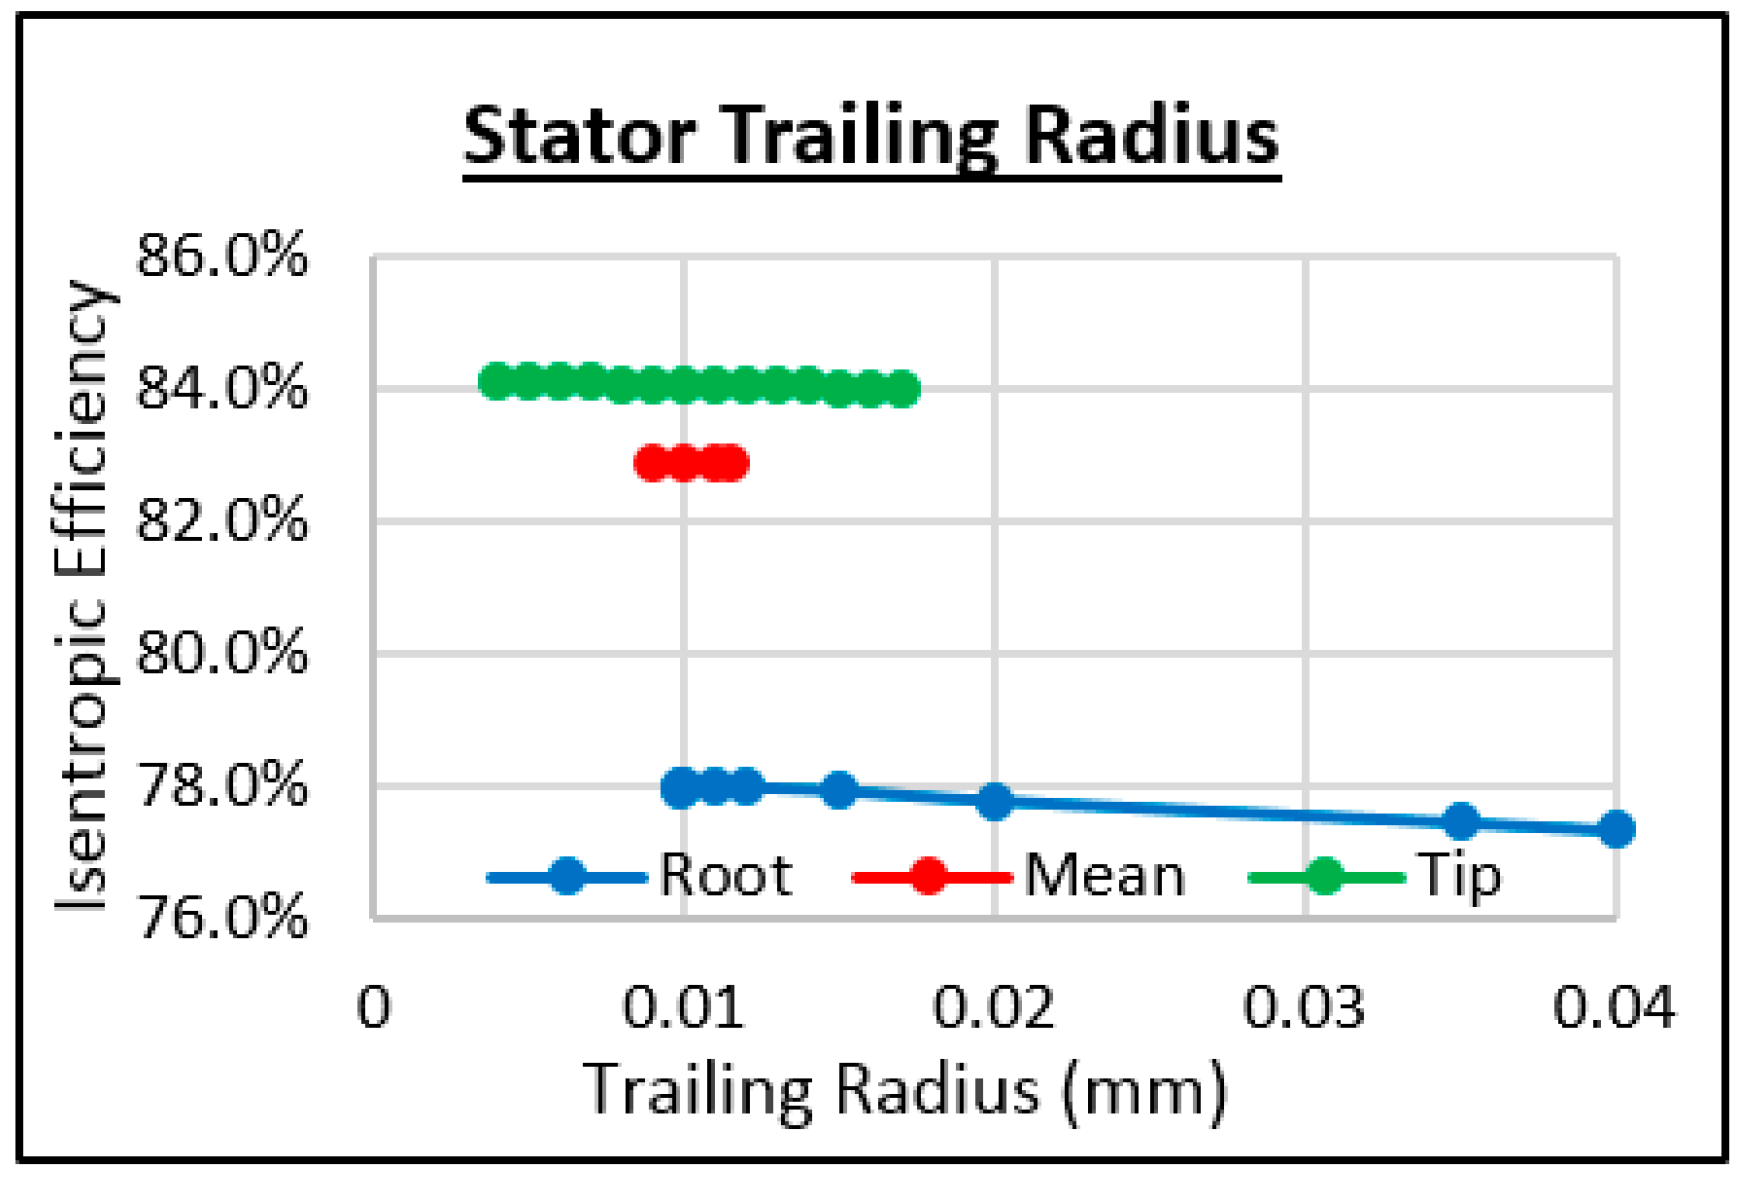
Figure 28.
Study of the stator trailing radius.
Figure 28.
Study of the stator trailing radius.
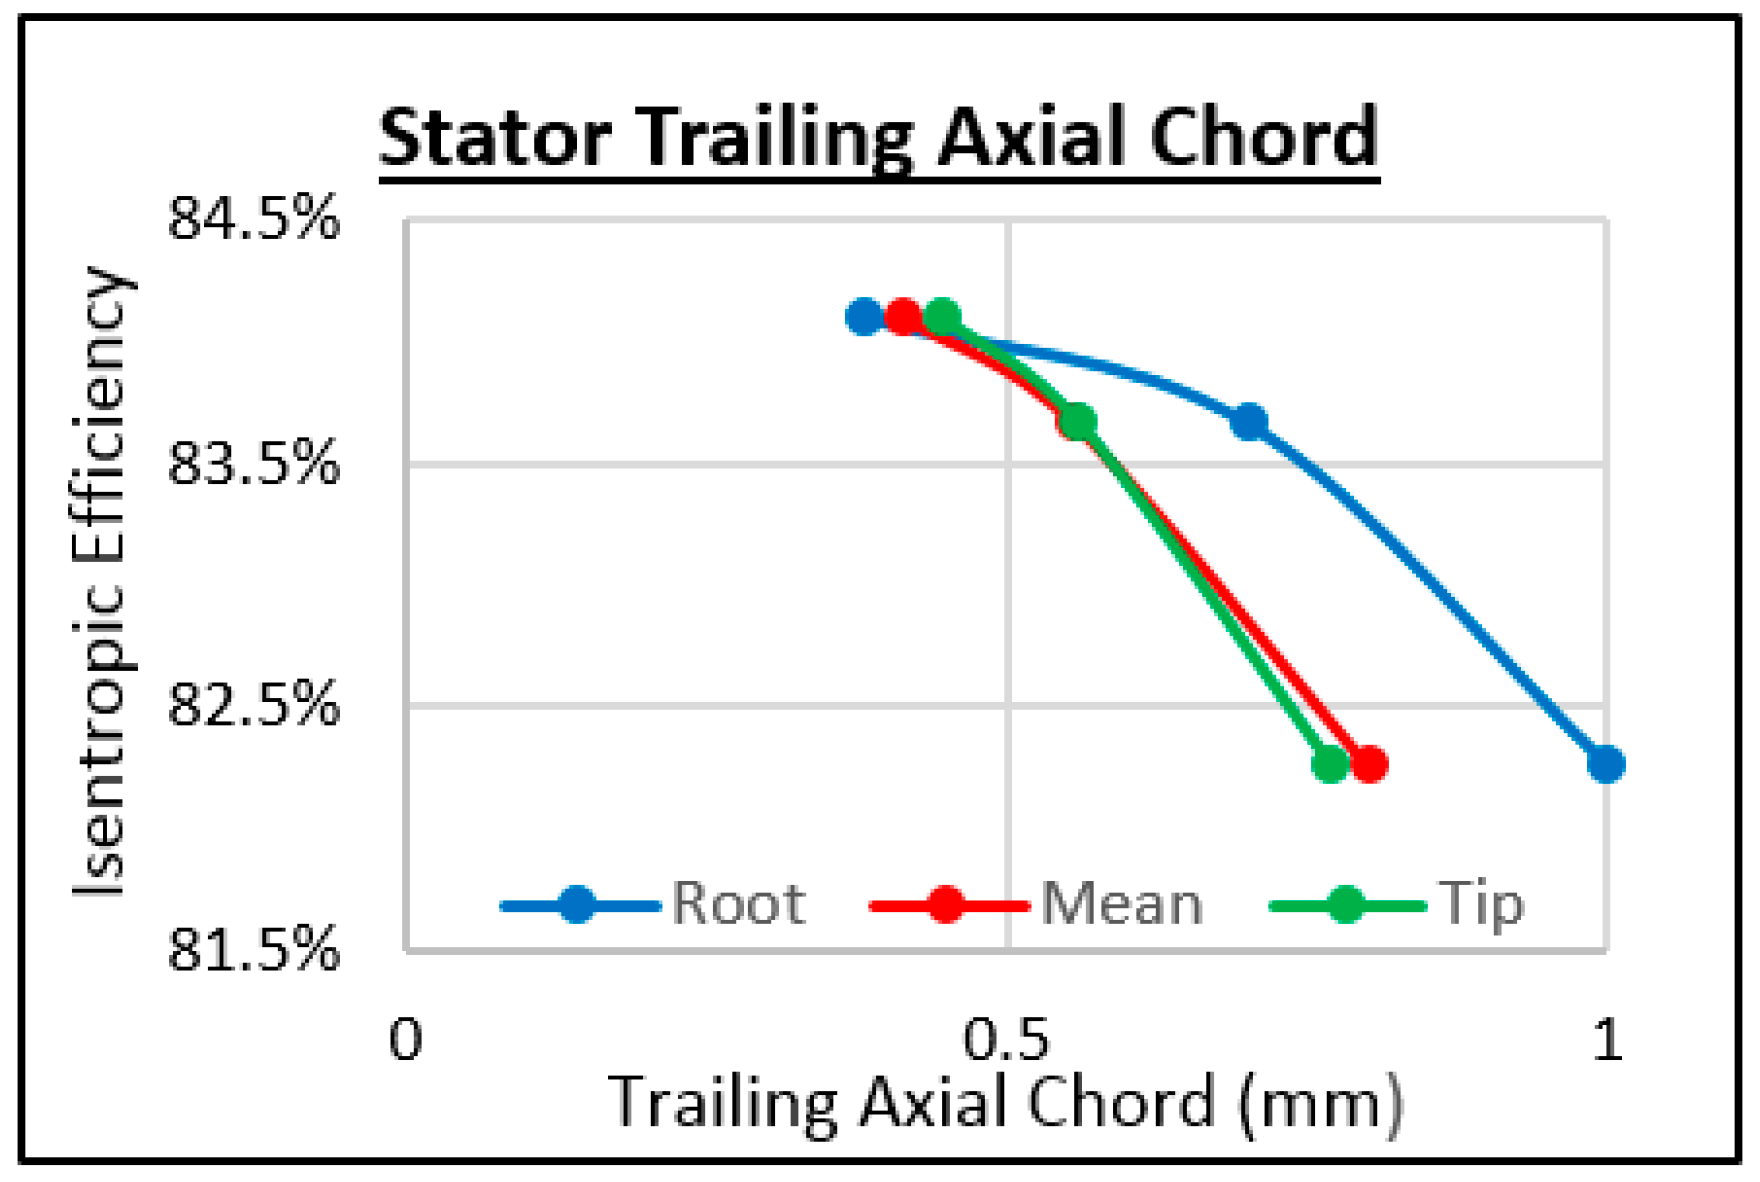
Figure 29.
Study of the stator trailing axial chord.
Figure 29.
Study of the stator trailing axial chord.
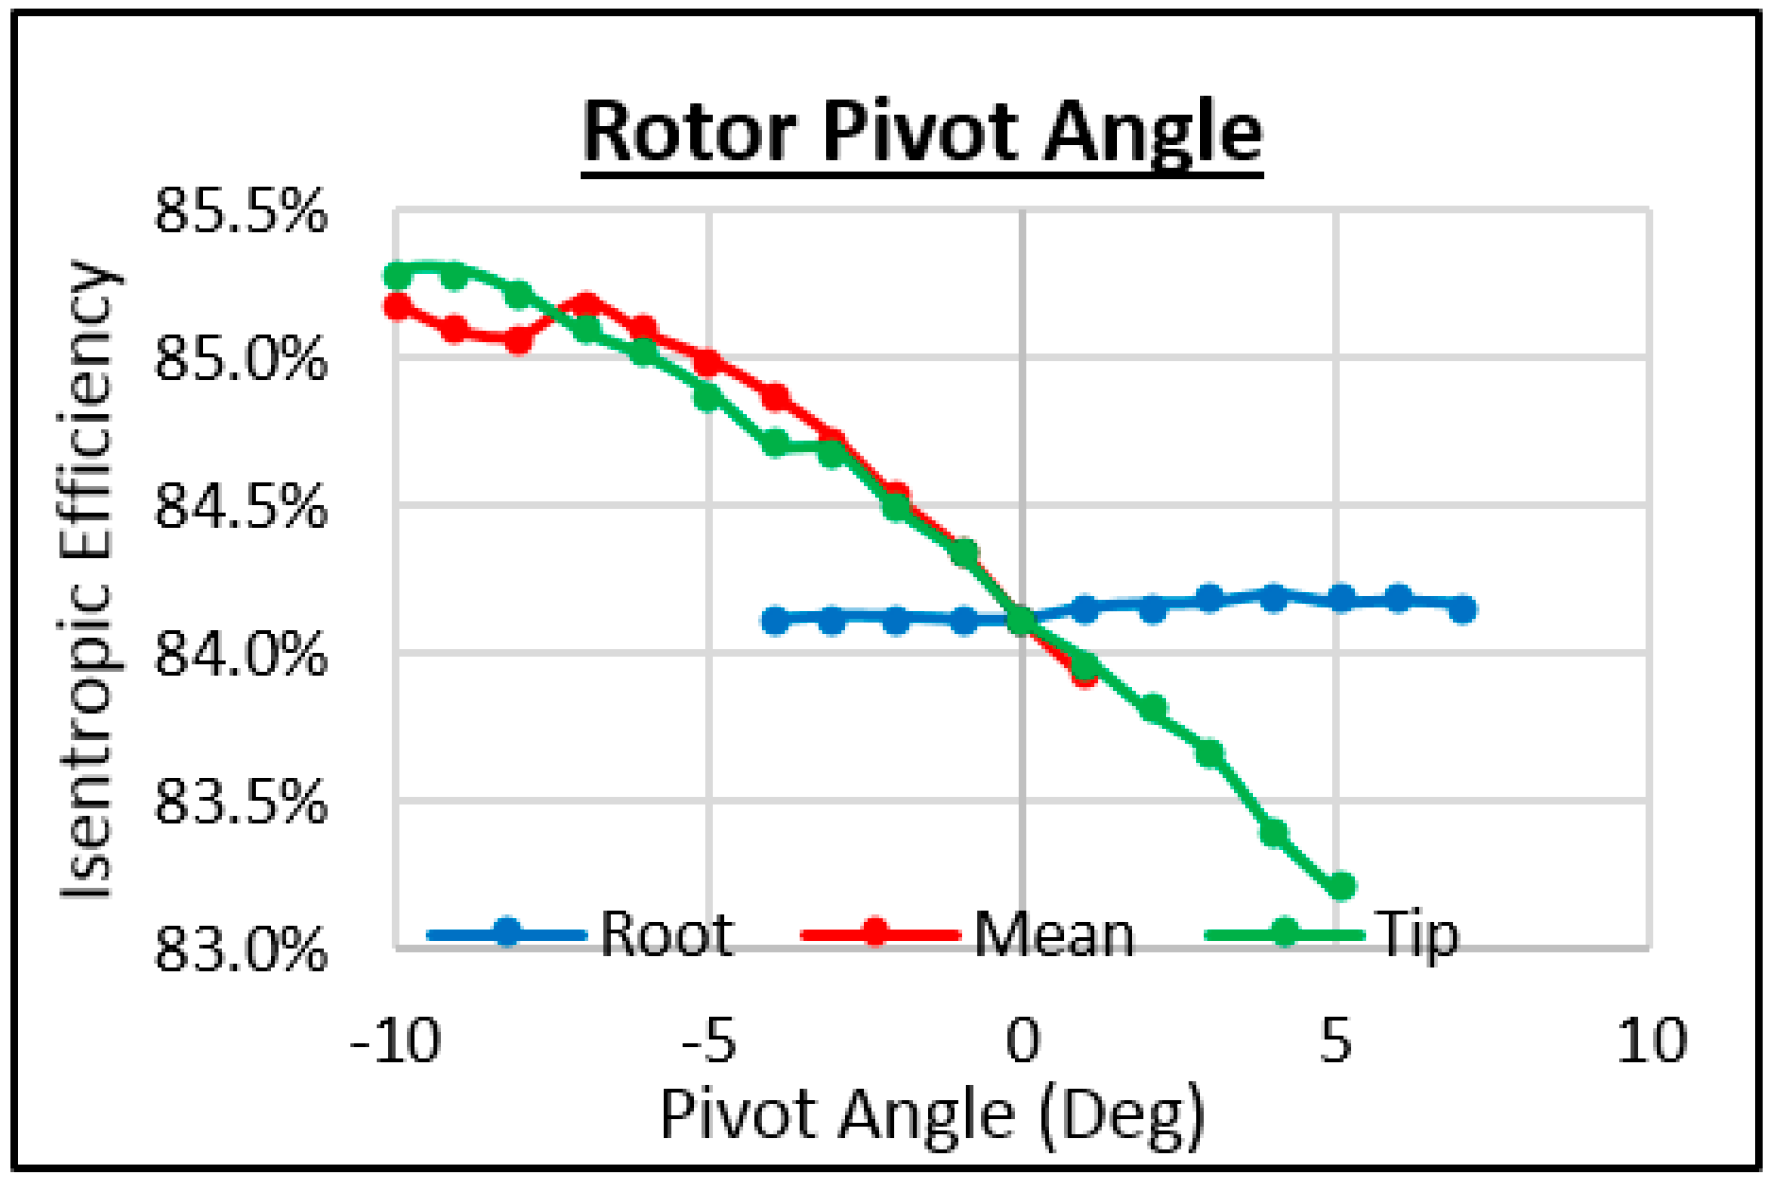
Figure 30.
Study of the rotor pivot angle.
Figure 30.
Study of the rotor pivot angle.
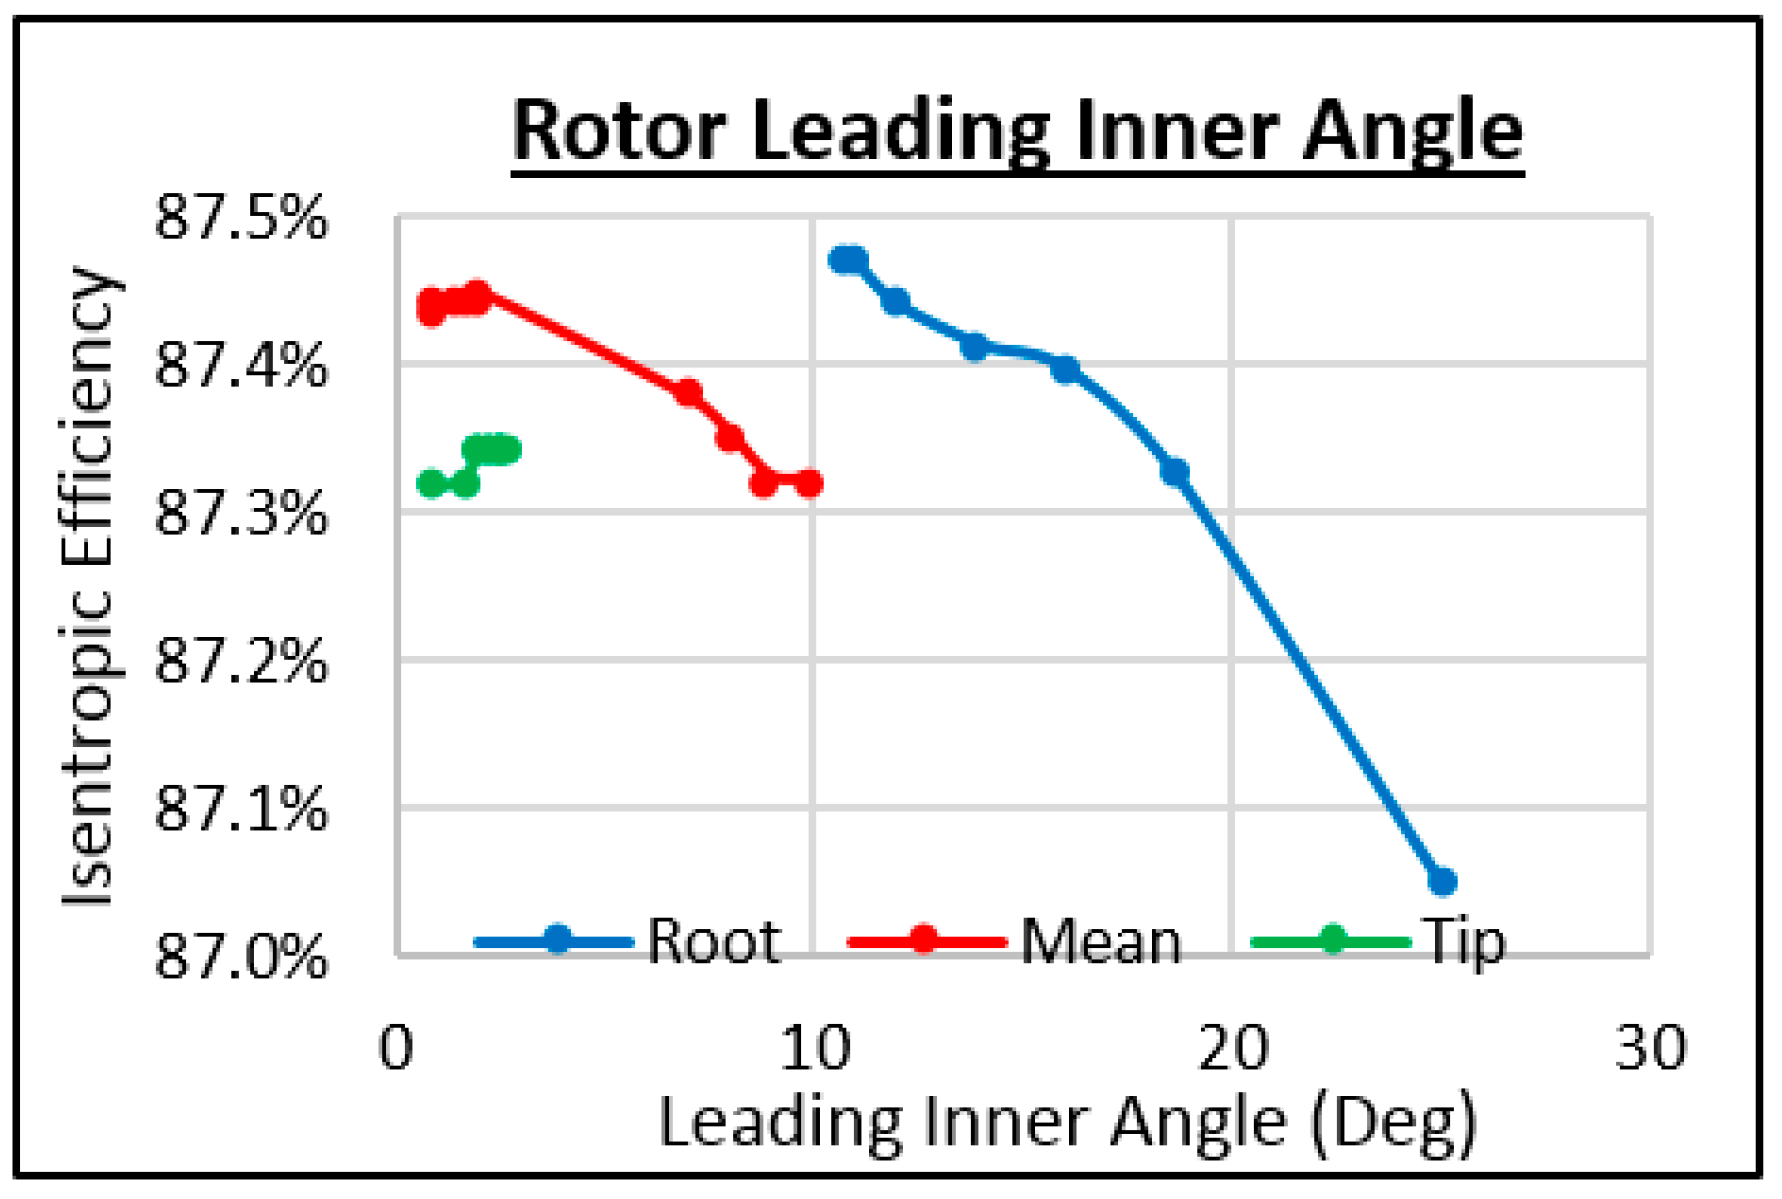
Figure 31.
Study of the rotor leading inner angle.
Figure 31.
Study of the rotor leading inner angle.
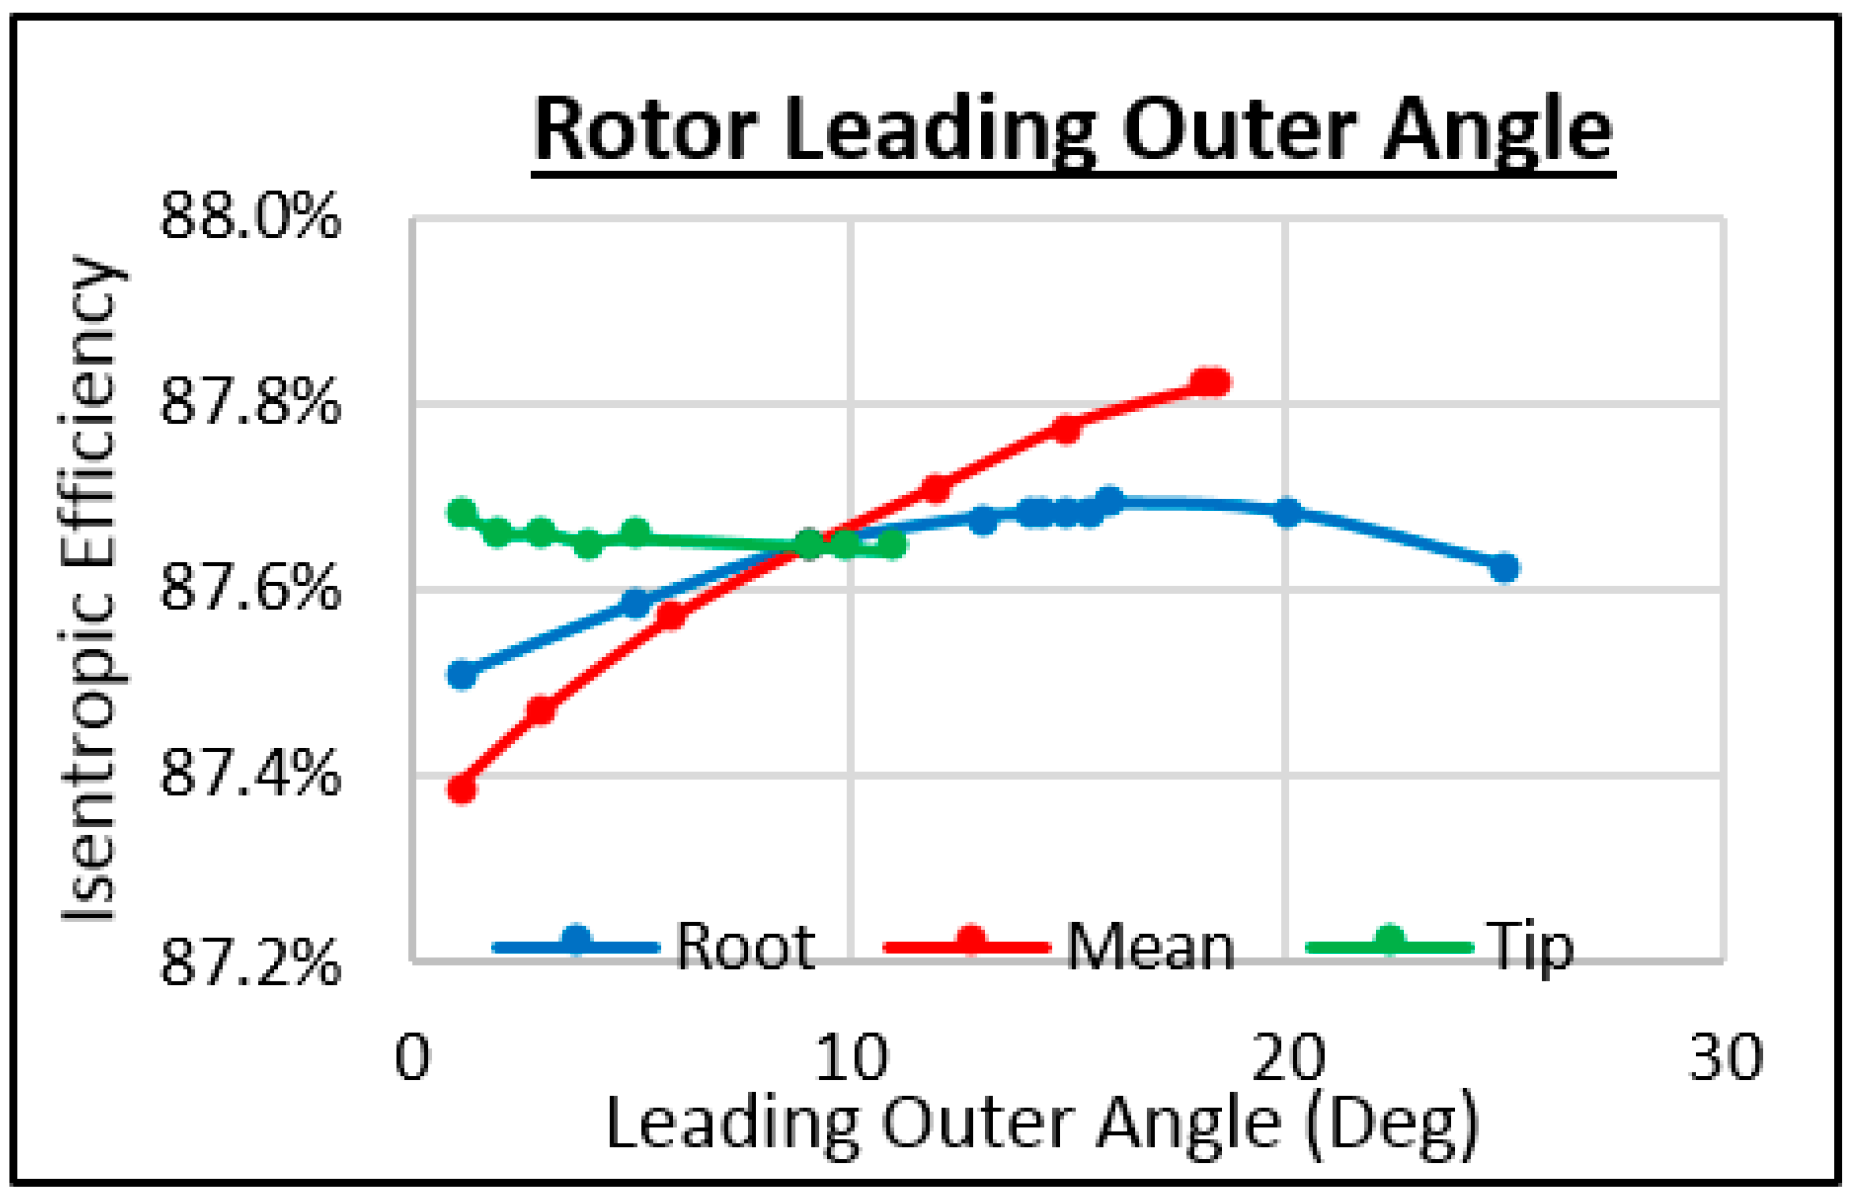
Figure 32.
Study of the rotor leading outer angle.
Figure 32.
Study of the rotor leading outer angle.
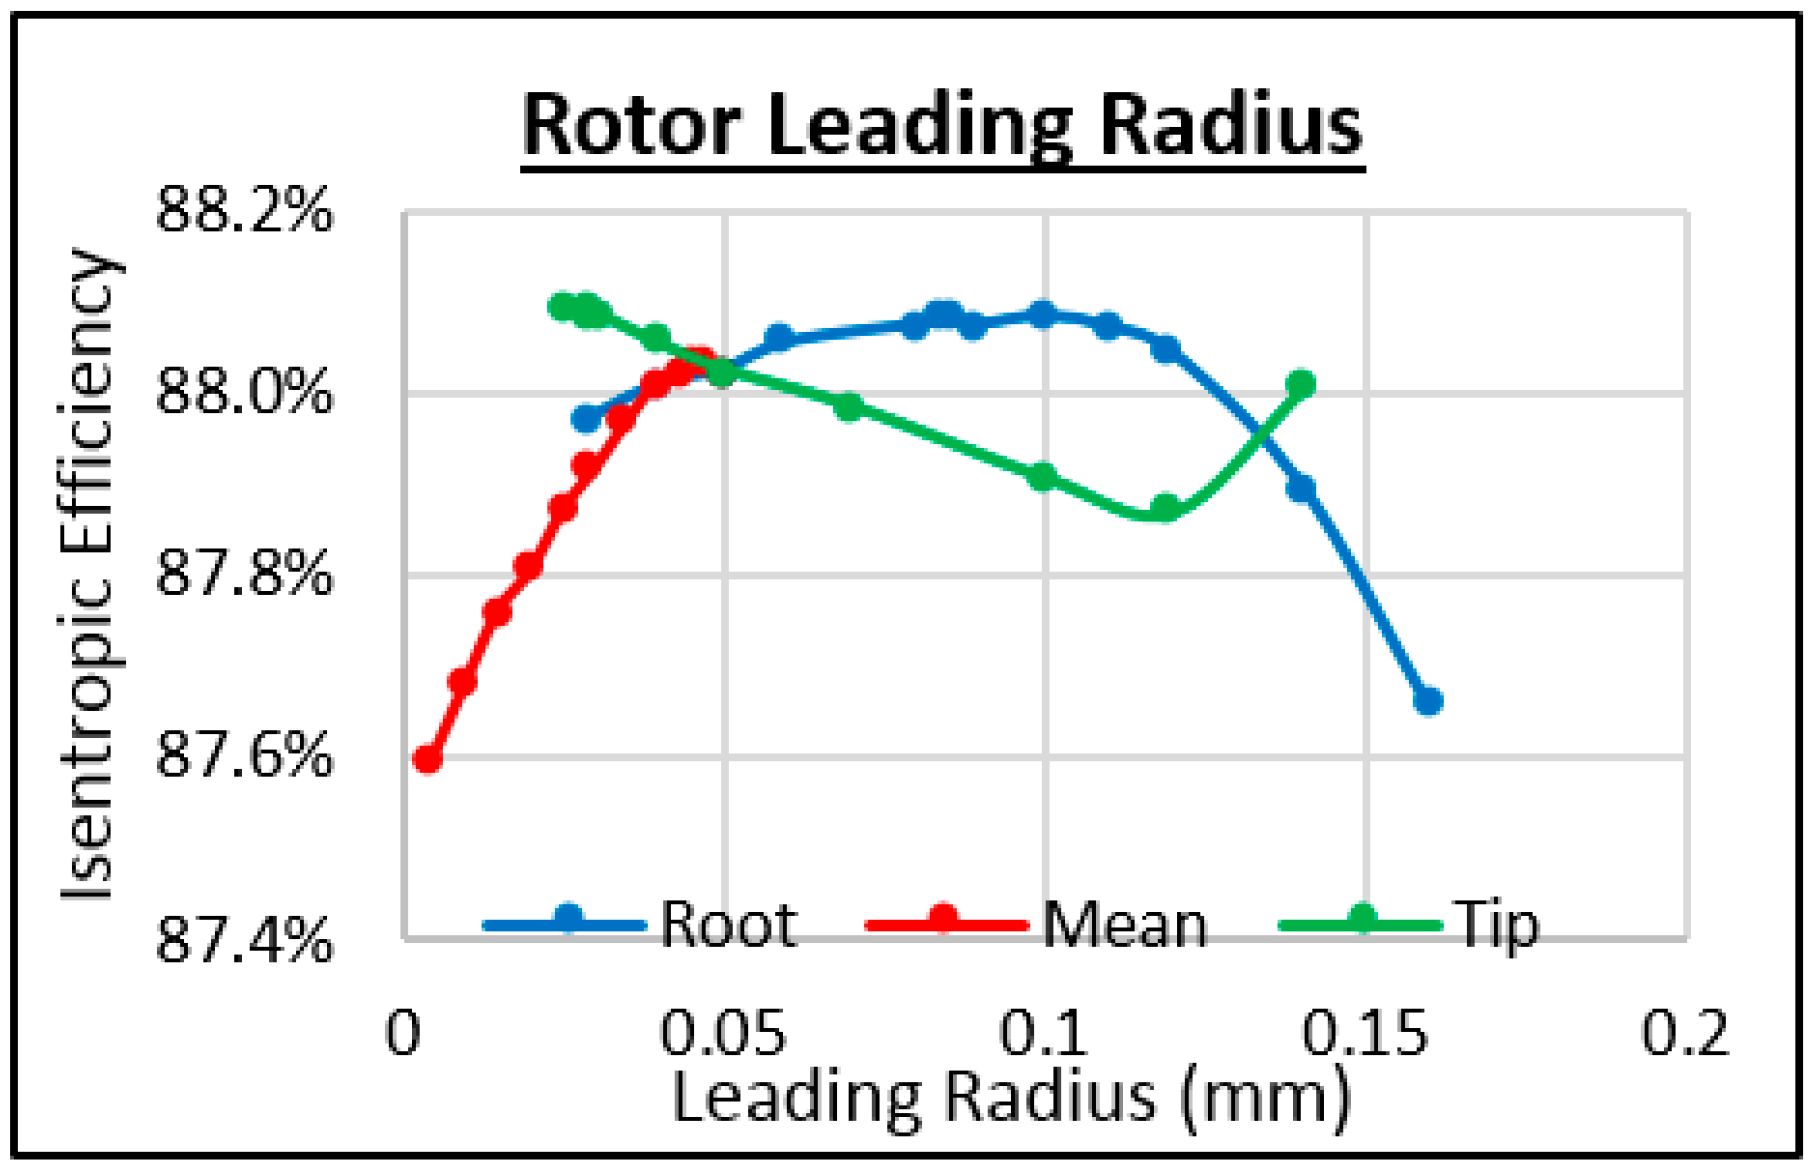
Figure 33.
Study of the rotor leading radius.
Figure 33.
Study of the rotor leading radius.
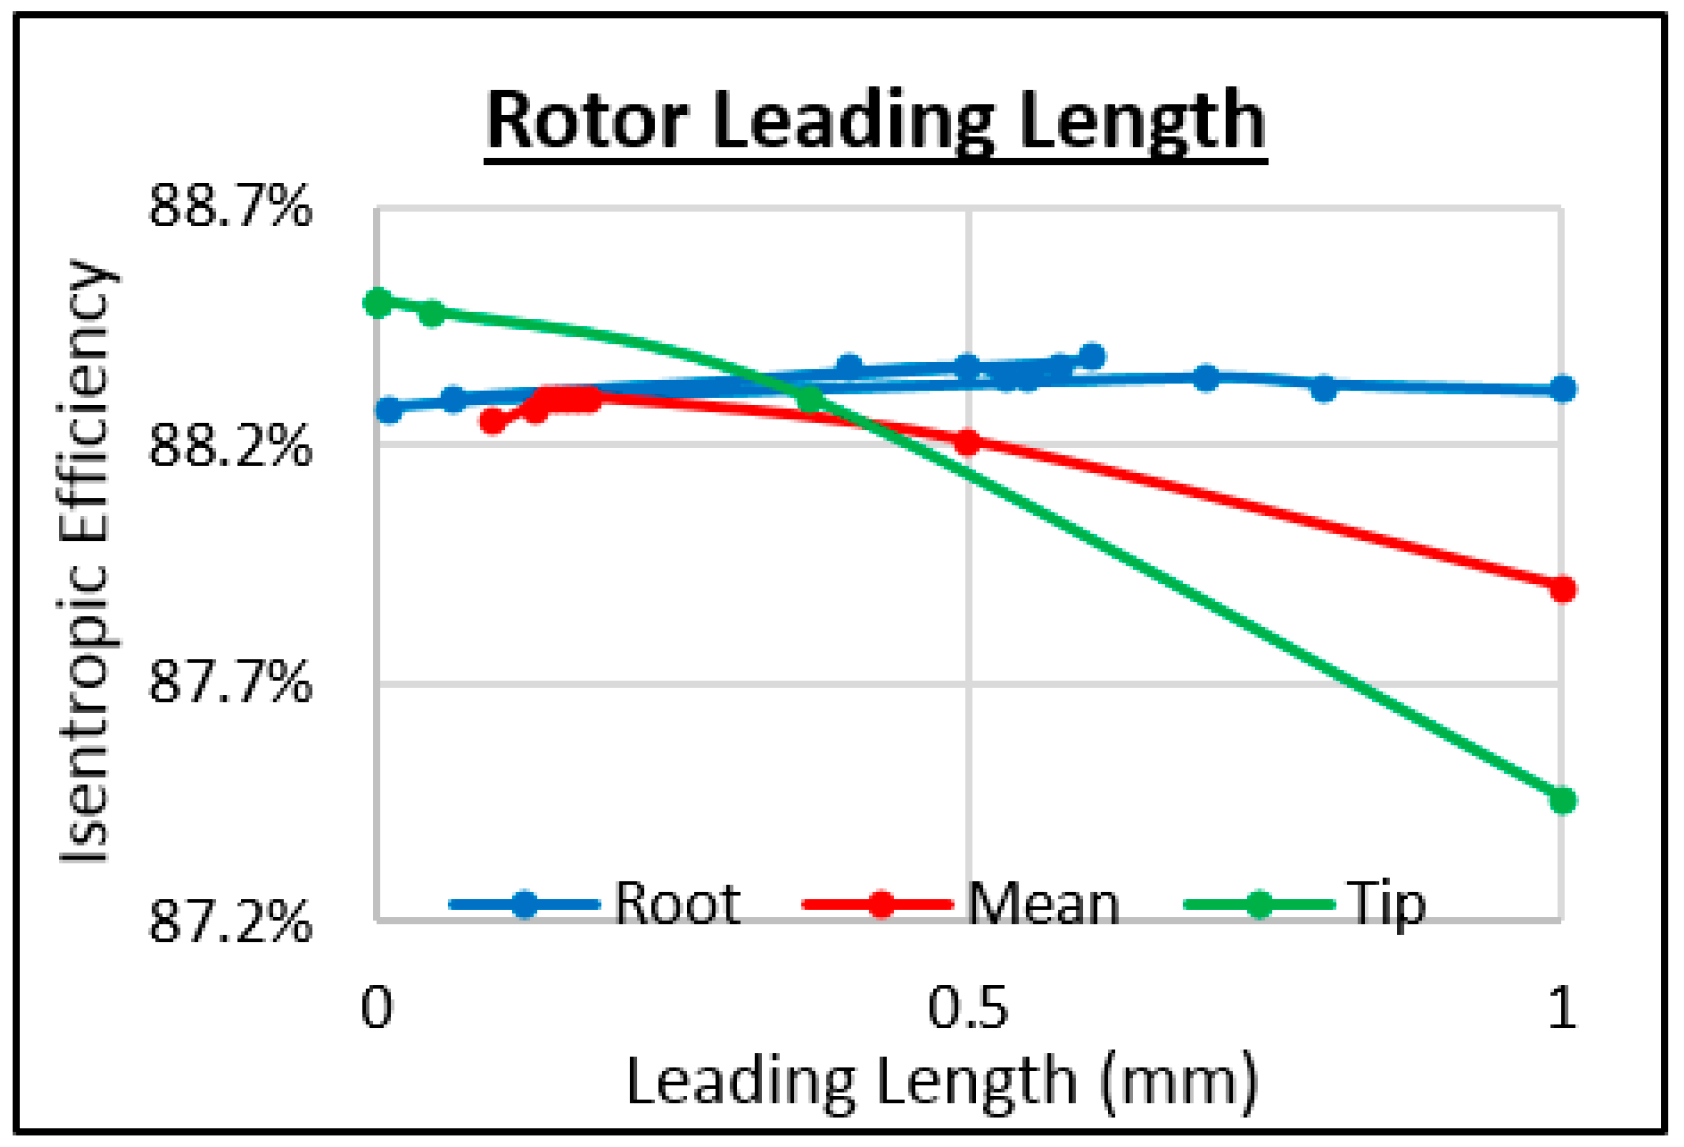
Figure 34.
Study of the rotor leading length.
Figure 34.
Study of the rotor leading length.
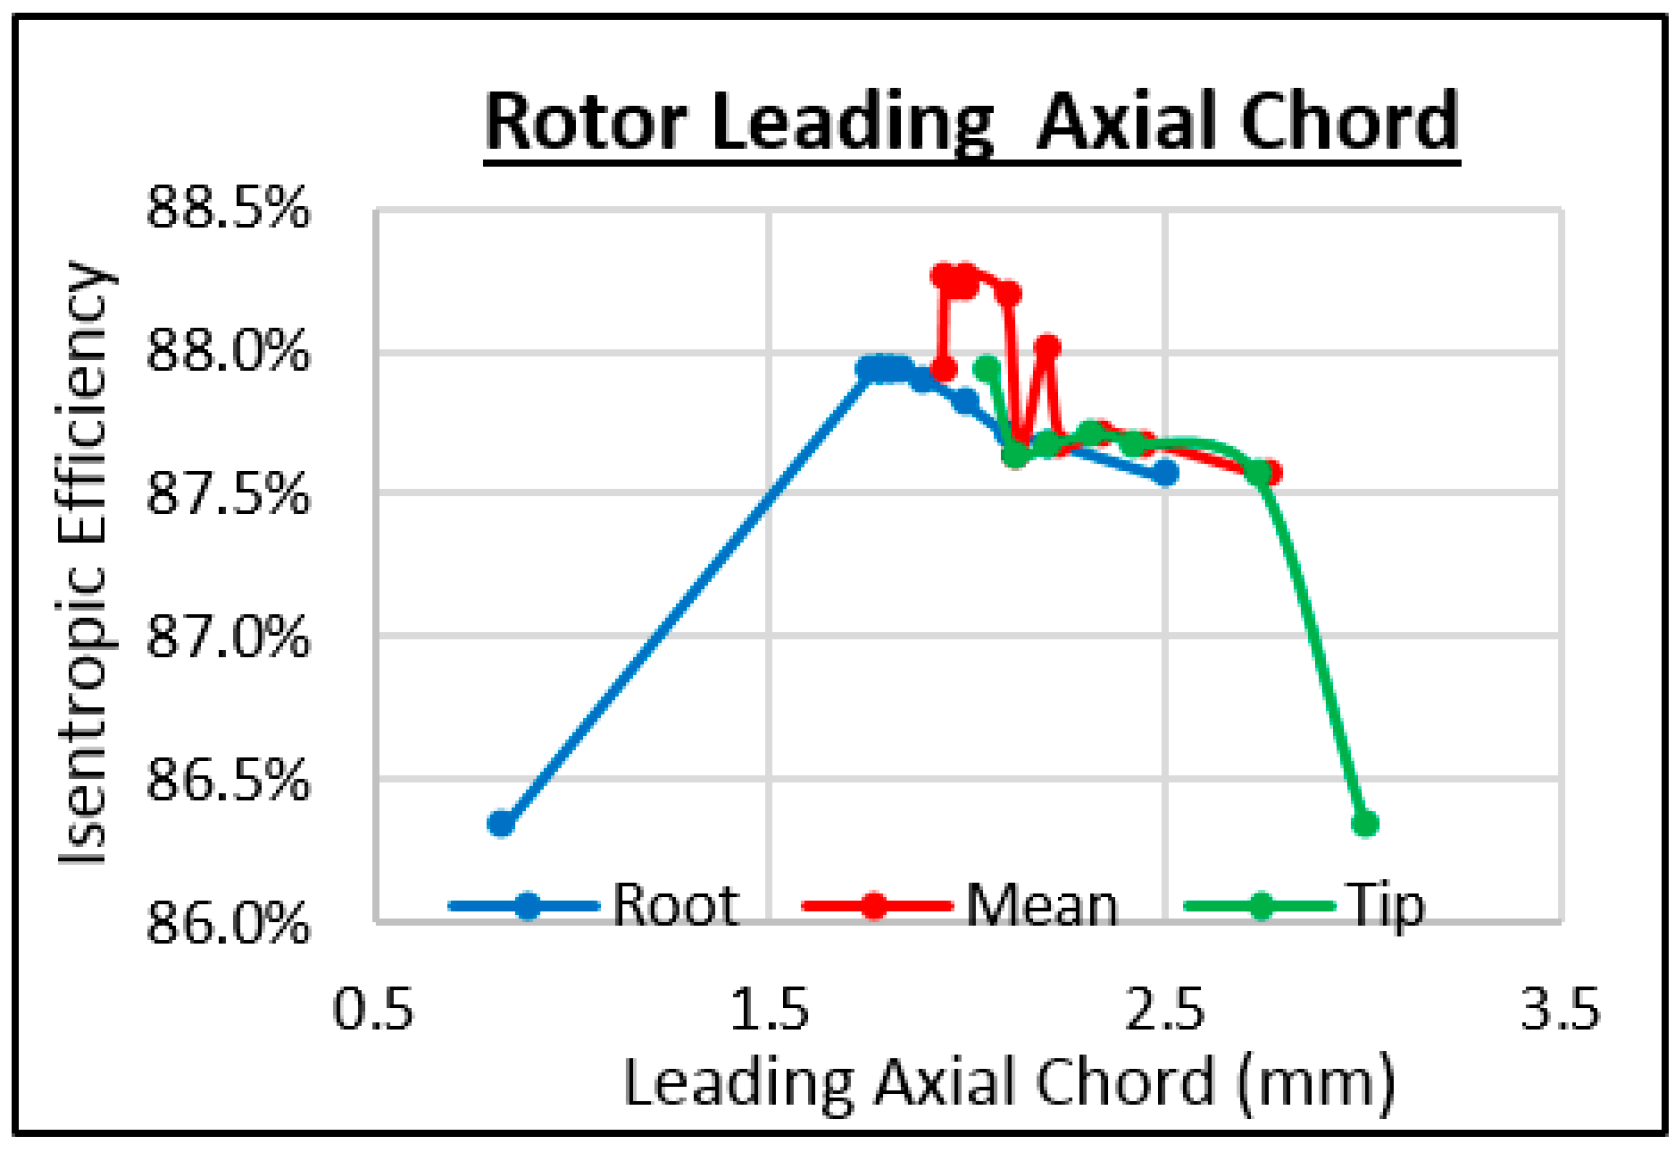
Figure 35.
Study of the rotor leading axial chord.
Figure 35.
Study of the rotor leading axial chord.
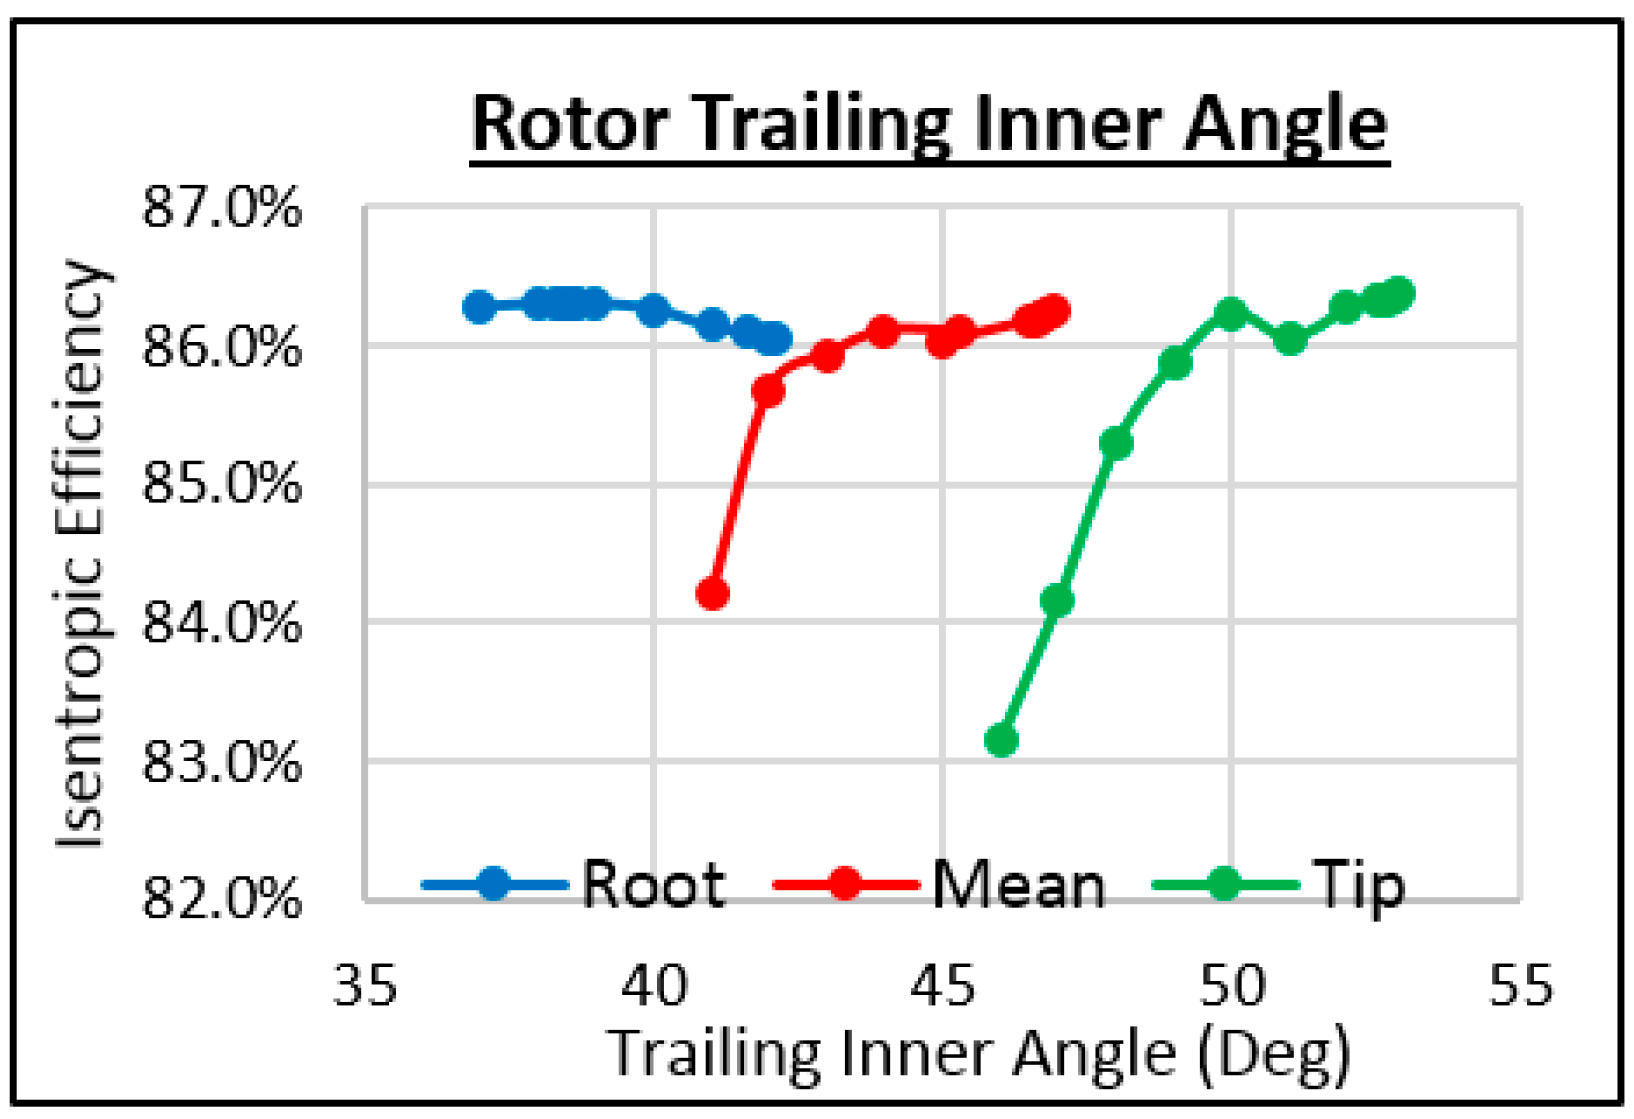
Figure 36.
Study of the rotor trailing inner angle.
Figure 36.
Study of the rotor trailing inner angle.
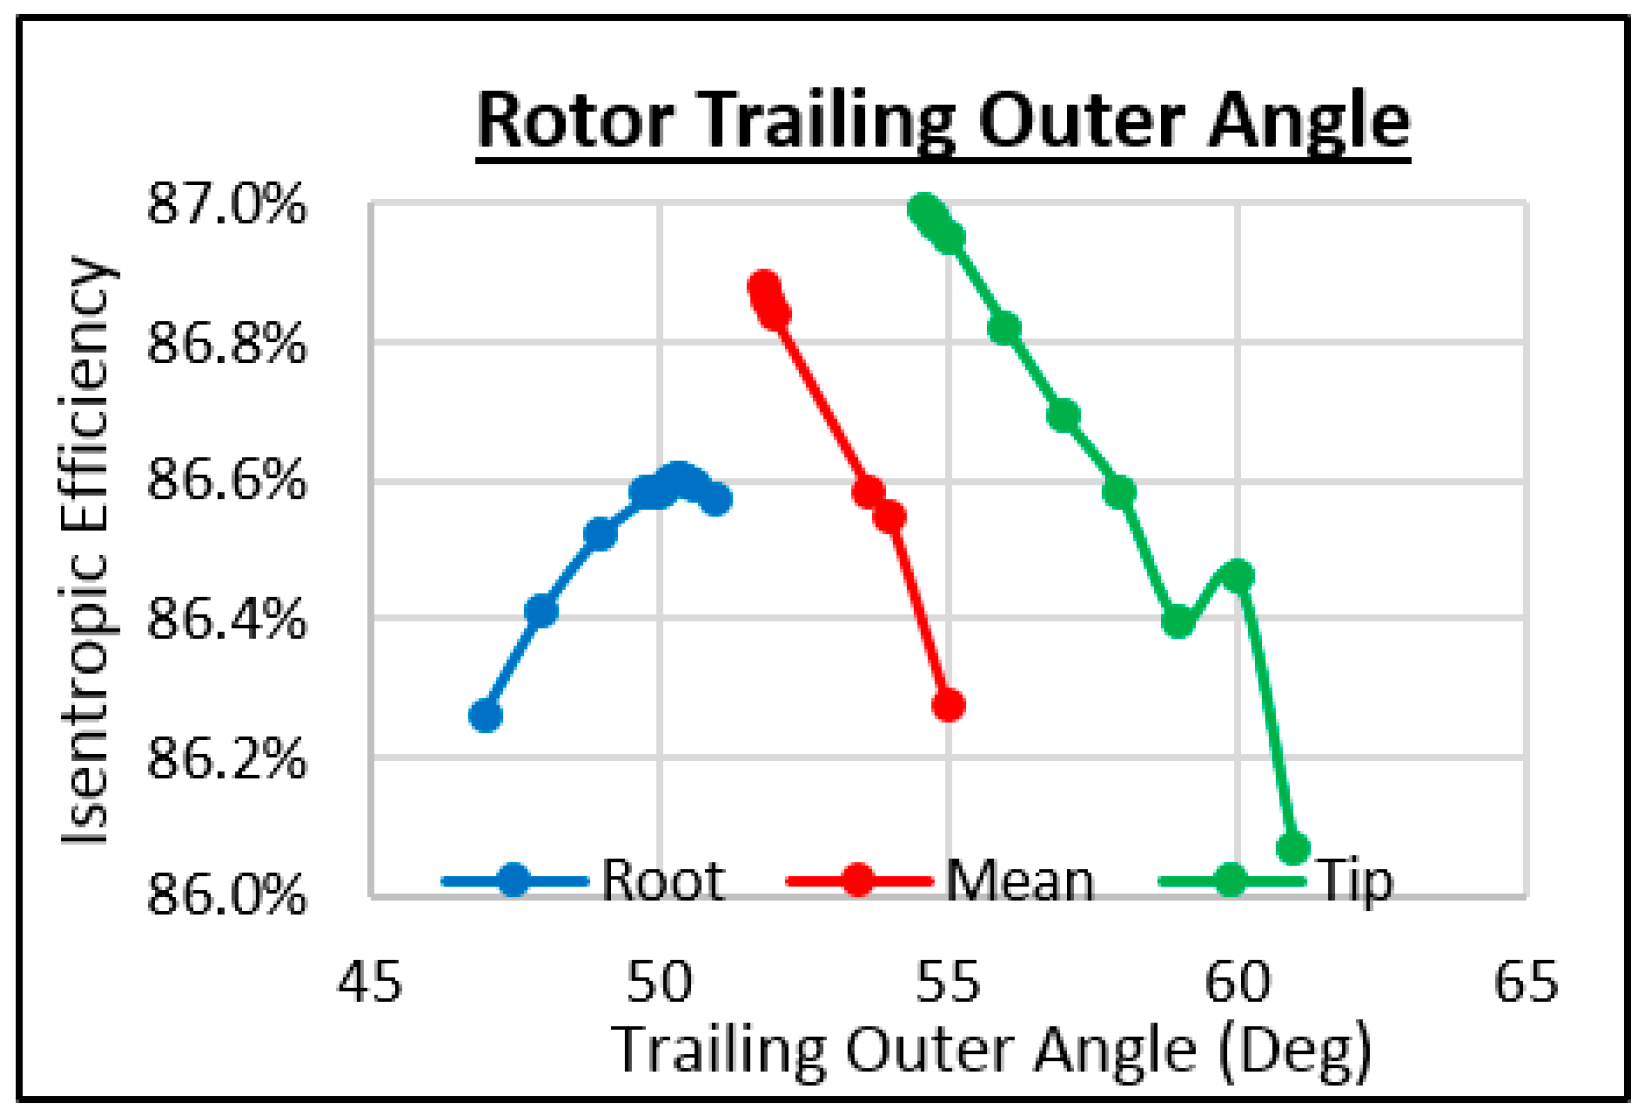
Figure 37.
Study of the rotor trailing outer angle.
Figure 37.
Study of the rotor trailing outer angle.
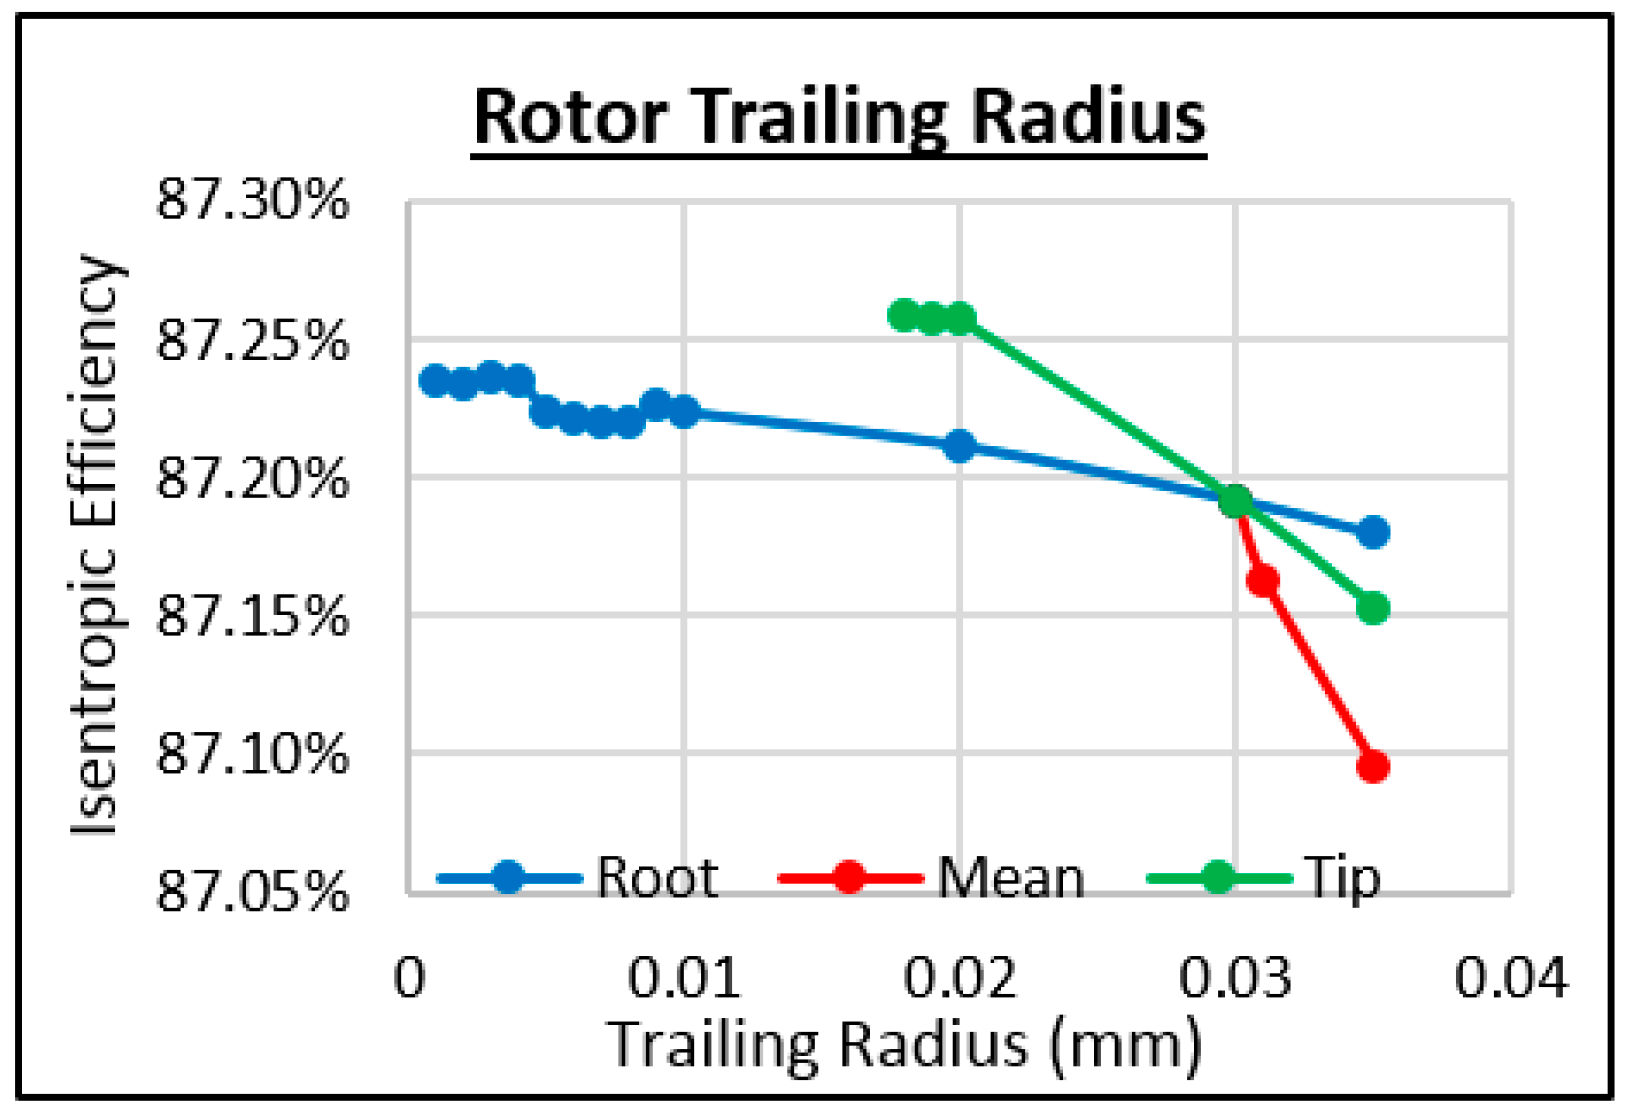
Figure 38.
Study of the rotor trailing radius.
Figure 38.
Study of the rotor trailing radius.
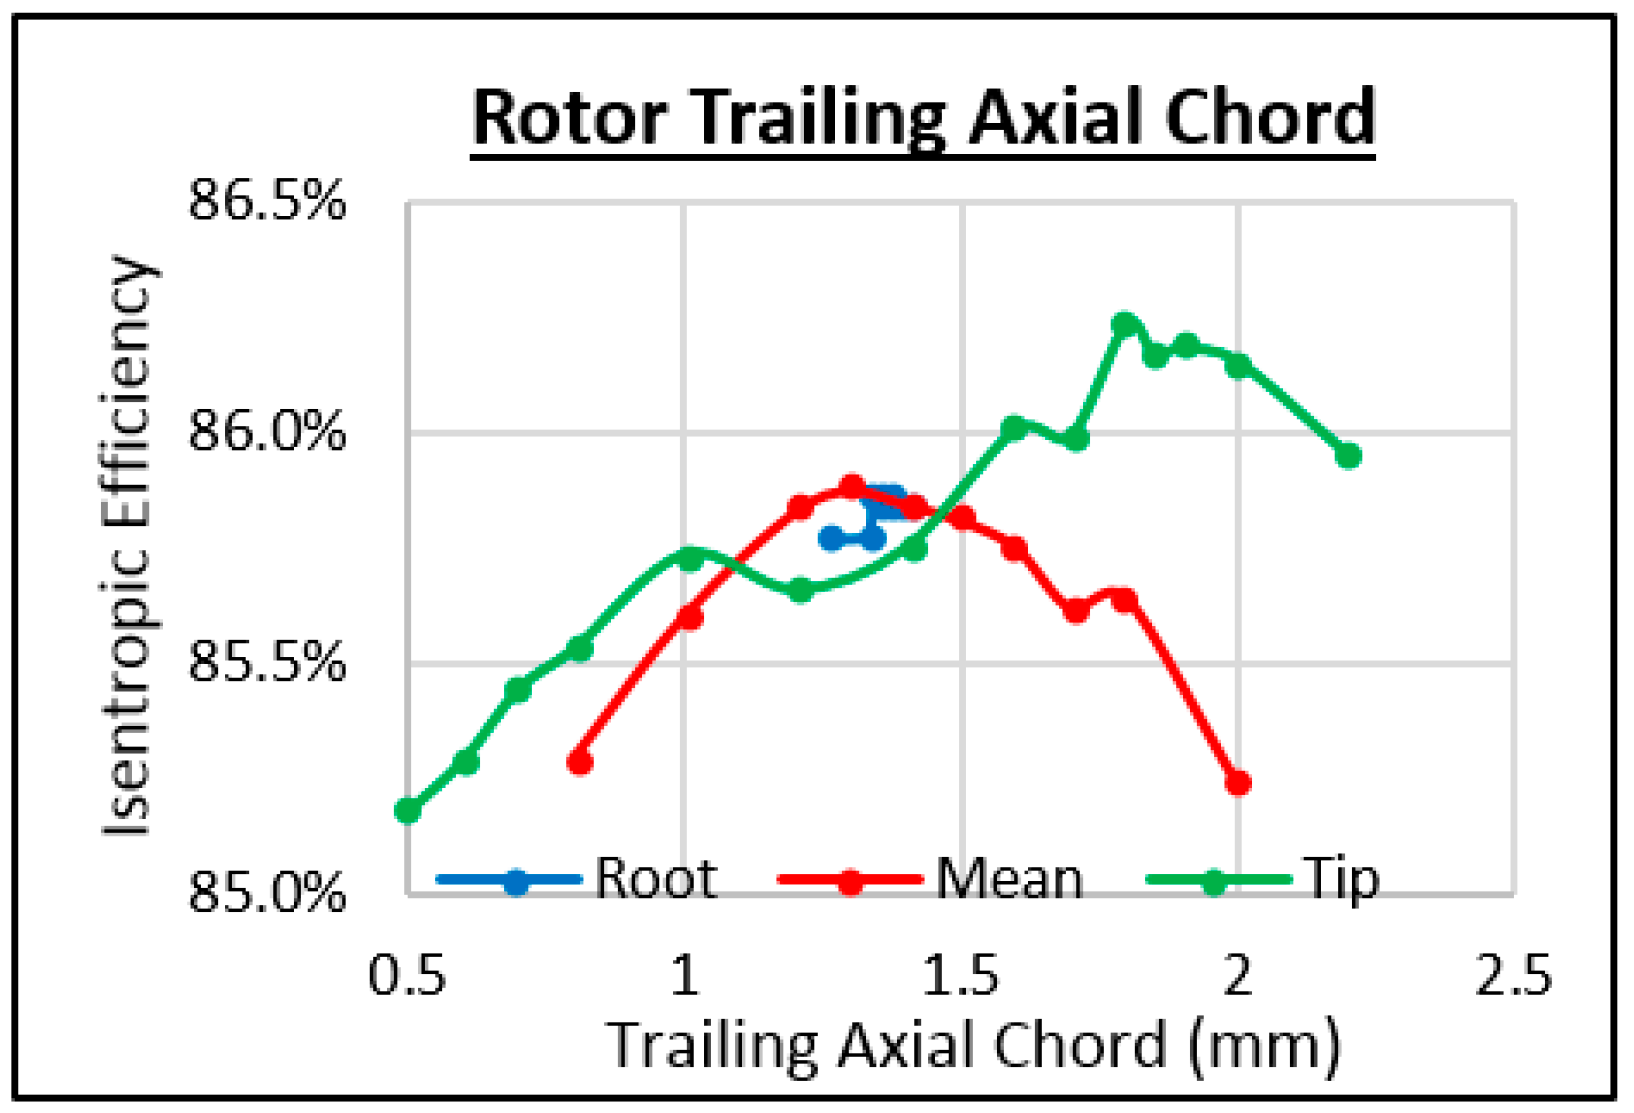
Figure 39.
Study of the rotor’s trailing axial chord.
Figure 39.
Study of the rotor’s trailing axial chord.
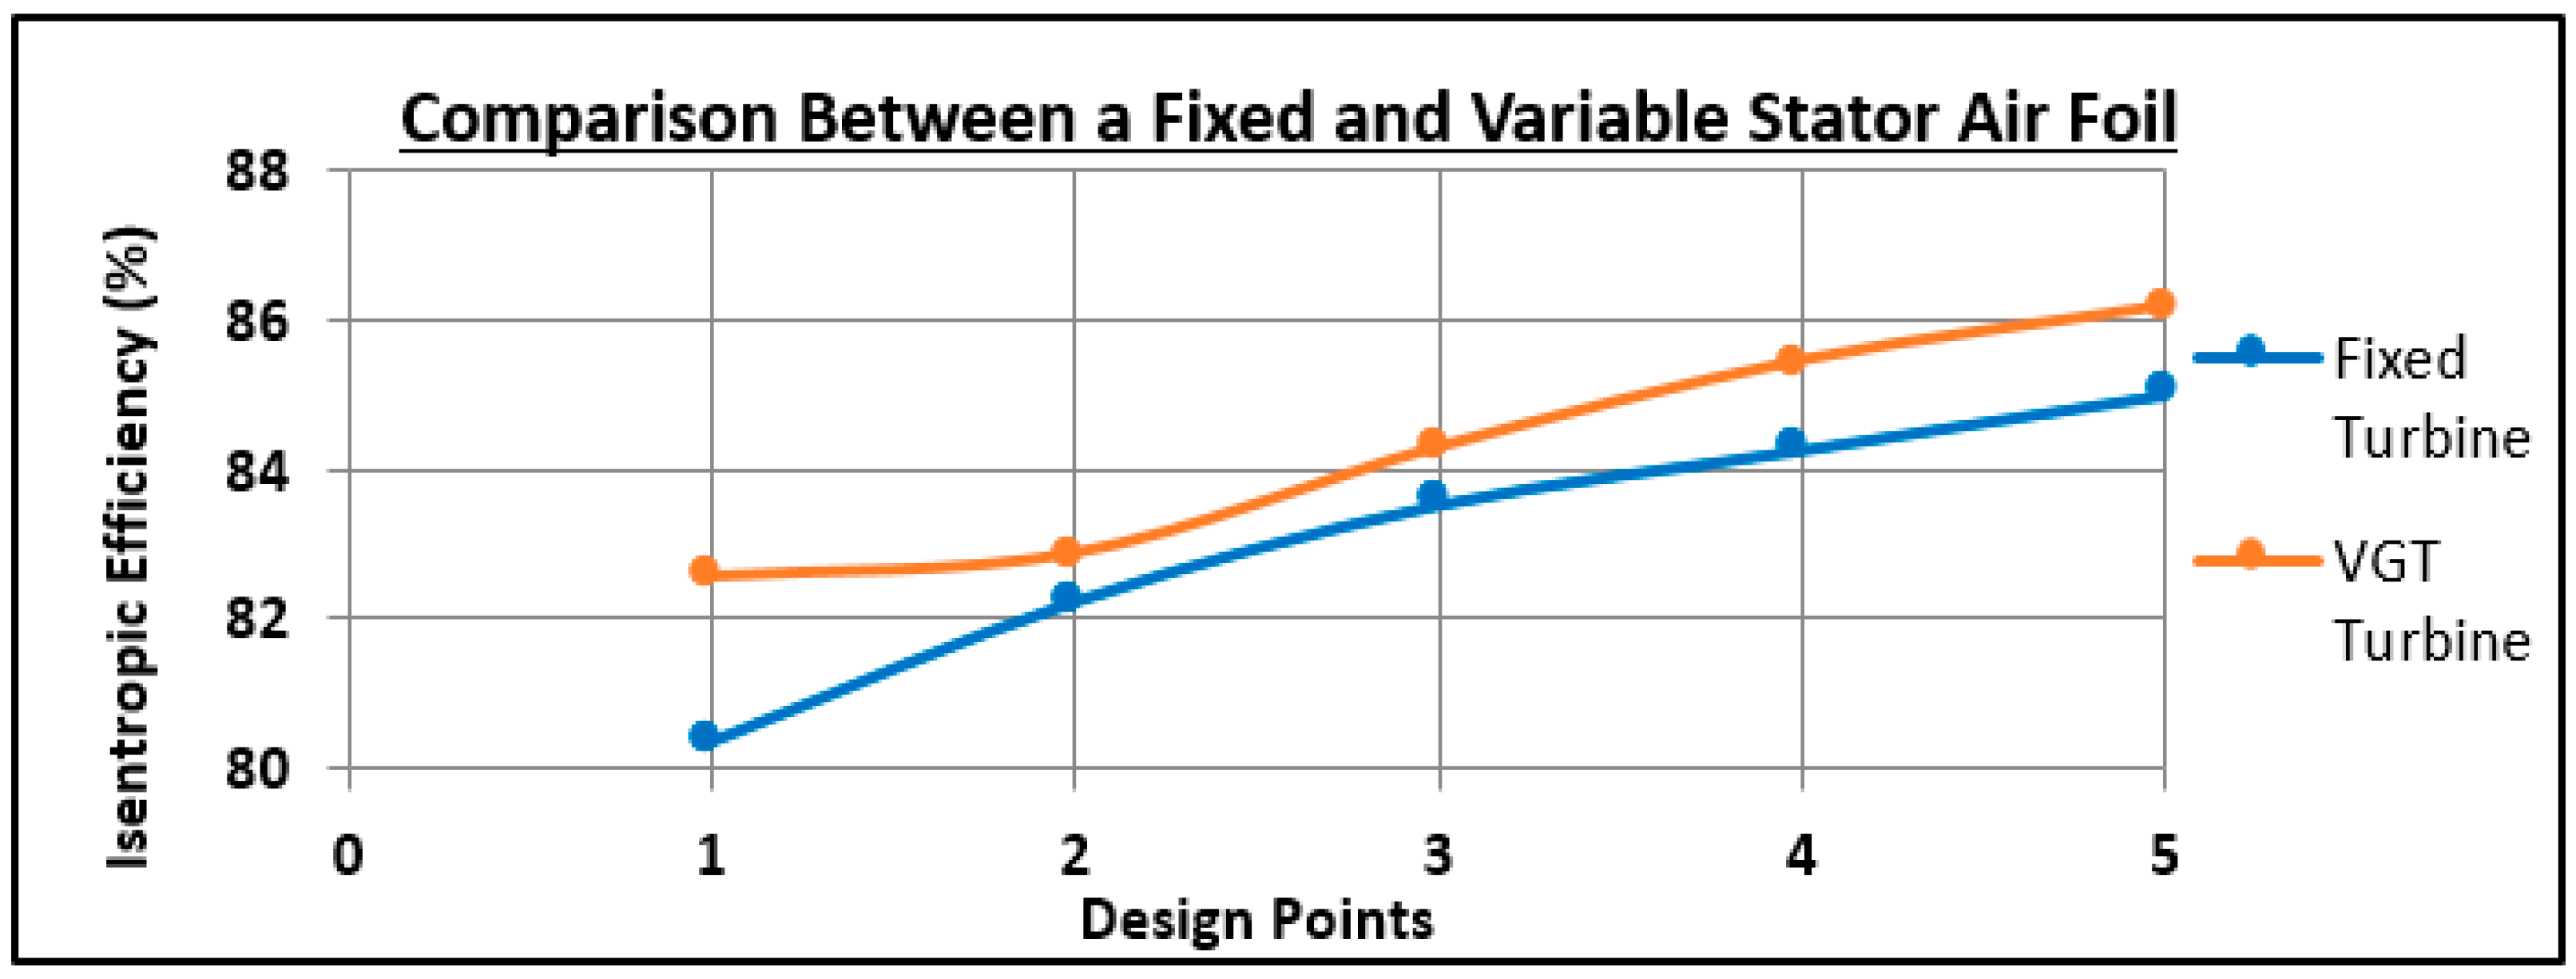
Figure 40.
Graphical representation of the improvement of efficiency through variable geometry.
Figure 40.
Graphical representation of the improvement of efficiency through variable geometry.
Table 1.
Baseline turbocharger data.
Table 1.
Baseline turbocharger data.
| Parameter | Value |
|---|
| Mass flow rate (kg/s) | 0.2 |
| Inlet temperature (K) | 881 |
| Inlet pressure (kPa) | 504.554 |
| Outlet pressure (kPa) | 101.627 |
| Turbine speed (rpm) | 123,142 |
Table 2.
Assumptions for preliminary design.
Table 2.
Assumptions for preliminary design.
| Parameter | Value |
|---|
| Temperature drop (K) | 60 |
| Blade speed (m/s) | 220 |
| Nozzle loss coefficient | 0.5 |
| Flow coefficient | 1.2 |
| α3 (degrees) | 10 |
Table 3.
Test data used for calculations of VGT boundary conditions.
Table 3.
Test data used for calculations of VGT boundary conditions.
| Inlet Parameters | Mass Flow Rate (kg/s) |
|---|
| 0.048 | 0.079 | 0.119 | 0.153 | 0.2 |
|---|
| Pressure (kPa) | 155.7 | 209.6 | 309.8 | 394.6 | 503.9 |
| Temperature (K) | 906 | 857 | 908 | 915 | 881 |
Table 4.
Turbine dimensions.
Table 4.
Turbine dimensions.
| Parameters of Turbine Inlet | Baseline | Axial Inflow |
|---|
| Outer radius (mm) | 0.02 | 0.02 |
| Inner radius (mm) | 0.0045 | 0.006 |
Table 5.
Preliminary design parameters for stator and rotor blades.
Table 5.
Preliminary design parameters for stator and rotor blades.
| | Stator | Rotor |
|---|
| Profile | A1 = A3 (deg) | A2 (deg) | r (mm) | B2 (deg) | B3 (deg) | r (mm) |
|---|
| root | 12.67 | 47.77 | 19.5 | 18.67 | 41.62 | 16.7 |
| mean | 10.00 | 45.27 | 21.2 | 10.00 | 45.28 | 21.2 |
| tip | 8.25 | 42.98 | 23.0 | 1.66 | 49.57 | 25.8 |
Table 6.
Measurements regarding the initial and final blade profile heights and axial chords.
Table 6.
Measurements regarding the initial and final blade profile heights and axial chords.
| | Root (mm) | Mean (mm) | Tip (mm) | Axial Chord (mm) |
|---|
| Stator (Initial) | 19.5 | 21.25 | 23 | 1.2 |
| Stator (Final) | 6 | 13 | 20 | 1.2 |
| Rotor (Initial) | 16.7 | 21.25 | 25.8 | 3.1 |
| Rotor (Final) | 6 | 13 | 20 | 3.1 |
Table 7.
Velocity vector data collected from preliminary design.
Table 7.
Velocity vector data collected from preliminary design.
| (m/s) | U | C2 | V2 | | C3 | V3 | |
|---|
| Root | 77.28 | 130.51 | 89.83 | 96.64 | 89.91 | 117.34 | 19.72 |
| Mean | 167.44 | 124.64 | 117.98 | 88.55 | 89.07 | 124.67 | 15.46 |
| Tip | 257.61 | 119.90 | 196.53 | 81.74 | 88.64 | 135.26 | 12.74 |
Table 8.
Initial angular profile of the stator and rotor blades calculated.
Table 8.
Initial angular profile of the stator and rotor blades calculated.
| | Ca (m/s) | α1 (°) | α2 (°) | β2 (°) | β3 (°) |
|---|
| Root | 87.72 | 12.67 | 47.77 | 18.67 | 41.62 |
| Mean | 87.72 | 10 | 45.27 | 10 | 45.28 |
| Tip | 87.72 | 8.25 | 42.98 | 1.66 | 49.57 |
Table 9.
Final parameters of the stator’s leading edge blade profiles.
Table 9.
Final parameters of the stator’s leading edge blade profiles.
| Pivot Angle (°) | Leading Inner Angle (°) | Trailing Outer Angle (°) | Trailing Radius (mm) |
|---|
| R | M | T | R | M | T | R | M | T | R | M | T |
| 3 | –6 | –9 | 12 | 12.6 | 12 | 13 | 11 | 9.3 | 0.016 | 0.002 | 0.004 |
Table 10.
Final parameters of the stator’s leading length and trailing edge blade profiles.
Table 10.
Final parameters of the stator’s leading length and trailing edge blade profiles.
| Leading Axial Chord (mm) | Trailing Axial Chord (mm) |
|---|
| Root | Mean | Tip | Root | Mean | Tip |
| 0.84 | 2.10 | 3.00 | 0.383 | 0.414 | 0.447 |
Table 11.
Final parameters of the stator’s leading and trailing axial chords.
Table 11.
Final parameters of the stator’s leading and trailing axial chords.
| Leading Length (mm) | Leading Inner Angle (°) | Trailing Outer Angle (°) | Trailing Radius (mm) |
|---|
| R | M | T | R | M | T | R | M | T | R | M | T |
| 0.06 | 0.7 | 1.16 | 48 | 46 | 43.5 | 56 | 53 | 50 | 0.01 | 0.009 | 0.004 |
Table 12.
Final parameters of the rotor’s leading edge blade profiles.
Table 12.
Final parameters of the rotor’s leading edge blade profiles.
| Pivot Angle (°) | Leading Inner Angle (°) | Trailing Outer Angle (°) | Trailing Radius (mm) |
|---|
| R | M | T | R | M | T | R | M | T | R | M | T |
| 4 | –3 | –9 | 10.8 | 2 | 2.5 | 16 | 18.5 | 1 | 0.09 | 0.045 | 0.03 |
Table 13.
Final parameters of the rotor’s leading length and trailing edge blade profiles.
Table 13.
Final parameters of the rotor’s leading length and trailing edge blade profiles.
| Leading Length (mm) | Trailing Inner Angle (°) | Trailing Outer Angle (°) | Trailing Radius (mm) |
|---|
| R | M | T | R | M | T | R | M | T | R | M | T |
| 0.55 | 0.15 | 0.001 | 38.5 | 46.9 | 52.9 | 50.4 | 51.8 | 555 | 0.0025 | 0.025 | 0.018 |
Table 14.
Final parameters of the rotor, leading and trailing axial chords.
Table 14.
Final parameters of the rotor, leading and trailing axial chords.
| Leading Axial Chord (mm) | Trailing Axial Chord (mm) |
|---|
| Root | Mean | Tip | Root | Mean | Tip |
| 1.8 | 2.0 | 2.33 | 1.365 | 1.3 | 1.8 |
Table 15.
Data comparison of the cross-sectional area of the GT1548 and axial-inflow turbines.
Table 15.
Data comparison of the cross-sectional area of the GT1548 and axial-inflow turbines.
| | GT1548 Radial | Axial-Inflow |
|---|
| Outer Diameter Frontal Area (mm2) | 1.257 × 10⁻³ | 1.257 × 10⁻³ |
| Shaft Frontal Area (mm2) | 0.064 × 10⁻³ | 0.113 × 10⁻³ |
| Cross-Sectional Area (mm2) | 1.193 × 10⁻³ | 1.144 × 10⁻³ |
Table 16.
Inlet boundary conditions with maximum turbine speeds.
Table 16.
Inlet boundary conditions with maximum turbine speeds.
| Design Point | D.P. 1 | D.P. 2 | D.P. 3 | D.P. 4 | D.P. 5 |
|---|
| Speed without VGT (rpm) | 52,000 | 71,000 | 85,000 | 89,000 | 90,000 |
| Mass flow rate (kg/s) | 0.048 | 0.079 | 0.119 | 0.153 | 0.200 |
| inlet temperature (K) | 905.5 | 856.7 | 908.3 | 915.2 | 880.7 |
| inlet velocity (m/s) | 70.05 | 81.05 | 87.55 | 89.07 | 87.72 |
Table 17.
VGT analysis of each mass flow rate against the respective change in the stator profile.
Table 17.
VGT analysis of each mass flow rate against the respective change in the stator profile.
| Root Angle | Mean Angle | Tip Angle | D.P. 1 Efficiency | D.P. 2 Efficiency | D.P. 3 Efficiency | D.P. 4 Efficiency | D.P. 5 Efficiency |
|---|
| 9° | 0° | −3° | 82.56% | 82.87% | 84.22% | 84.68% | 86.19% |
| 8° | −1° | −4° | 82.39% | 82.78% | 84.18% | 84.69% | 86.07% |
| 7° | −2° | −5° | 82.28% | 82.87% | 84.29% | 85.46% | 85.82% |
| 6° | −3° | −6° | 81.92% | 82.65% | 84.19% | 85.12% | 85.61% |
| 5° | −4° | −7° | 81.73% | 82.42% | 83.87% | 84.87% | 85.46% |
| 4° | −5° | −8° | 81.34% | 82.21% | 83.69% | 84.49% | 85.32% |
| 3° | −6° | −9° | 80.33% | 82.22% | 83.52% | 84.26% | 85.01% |
Table 18.
Comparison between the original FGT rotational speed and the rotational speed obtained with VGT.
Table 18.
Comparison between the original FGT rotational speed and the rotational speed obtained with VGT.
| | D.P. 1 | D.P. 2 | D.P. 3 | D.P. 4 | D.P. 5 |
|---|
| Original FGT (rpm) | 52,000 | 71,000 | 85,000 | 89,000 | 90,000 |
| VGT (rpm) | 57,000 | 75,000 | 90,000 | 97,000 | 102,000 |


