New Method for Shallow and Deep Trap Distribution Analysis in Oil Impregnated Insulation Paper Based on the Space Charge Detrapping


1
The State Key Laboratory of Power Transmission Equipment & System Security and New Technology, Chongqing University, Chongqing 400044, China
2
College of Power Engineering, Chongqing University, Chongqing 400044, China
*
Author to whom correspondence should be addressed.
Energies 2018, 11(2), 271; https://doi.org/10.3390/en11020271
Submission received: 12 November 2017
/
Revised: 14 December 2017
/
Accepted: 15 January 2018
/
Published: 23 January 2018
(This article belongs to the Section F: Electrical Engineering)
Abstract
:Space charge has close relation with the trap distribution in the insulation material. The phenomenon of charges trapping and detrapping has attracted significant attention in recent years. Space charge and trap parameters are effective parameters for assessing the ageing condition of the insulation material qualitatively. In this paper, a new method for calculating trap distribution based on the double exponential fitting analysis of charge decay process and its application on characterizing the trap distribution of oil impregnated insulation paper was investigated. When compared with the common first order exponential fitting analysis method, the improved dual-level trap method could obtain the energy level range and density of both shallow traps and deep traps, simultaneously. Space charge decay process analysis of the insulation paper immersed with new oil and aged oil shows that the improved trap distribution calculation method can distinguish the physical defects and chemical defects. The trap density shows an increasing trend with the oil ageing, especially for the deep traps mainly related to chemical defects. The greater the energy could be filled by the traps, the larger amount of charges could be trapped, especially under higher electric field strength. The deep trap energy level and trap density could be used to characterize ageing. When one evaluates the ageing condition of oil-paper insulation using trap distribution parameters, the influence of oil performance should not be ignored.
1. Introduction
Oil-paper insulation has been widely applied in power transformers. It is reported that the space charge has great effect on the insulation property of the oil-paper insulation in convert transformer [1,2,3,4,5]. Space charge means the excess electric charge over a region of space, rather than distinct point-like charges [6,7]. Space charge could severely distort the local electrical field, which causes the material degradation or leads to the insulation breakdown [1,2,3]. Besides, oil-paper insulation gradually degrades under the combined stresses of thermal, electrical, and chemical during transformer routine operation [8,9,10]. The polar and conductive ageing by-products would lead to the obvious injection phenomenon of space charge [8,9,10]. It is found that the space charge injection and accumulation in oil-paper insulation is strongly dependent on its ageing condition [11,12,13,14,15]. Space charge may be an ageing condition indicator for the oil-paper insulation [1,8,9,10]. Ageing could introduce defects (physical and chemical) and lead to the rise of localised states in the material. The localised states is named trap [16,17]. Space charge are determined by the trap distribution [1,16,17,18,19], which is related to defect in material [20,21,22,23]. Therefore, understanding the trap distribution effect on the dynamic behavior of space charge is very important.
Many researches about the trap distribution characteristics for polyethylene and insulation paper have been conducted [1,16,17,18,22,23,24,25]. The space charge measurement which is non-destructive is the current popular technology for trap distribution analysis. In [16,17], trap energy level and the trap density of the low density polyethylene (LDPE) and gamma irradiated LDPE were analyzed by a trapping-detrapping model for the shallow and deep trap. It is found that trap parameter changes could reflect the LDPE ageing. Tang, Hao et al. estimated the trap distribution in oil impregnated insulation paper based on the first-order exponential fitting analysis of the charge decay [1,24,25]. The trap energy level and trap density could be calculated using the space charge detrapping parameters. Wei calculated the trap parameters of oil impregnated insulation paper with different ageing condition based on the dual-level trap model [19]. Results show that the trap density increases when the sample being thermally or electrically aged.
For the dual-level trap model, the faster charges and slower charges have been taken into account [16,18,19]. The values of trap energy level and trap density for shallow or deep trap could be obtained. However, the trap energy level and density of shallow trap or deep trap only has one value. This is not fully consistent with the actual situation that shallow or deep traps in material exist within a wide range of energy levels [16]. For the trap energy distribution calculation method based on the first-order exponential fitting analysis of charge decay, the range of trap energy and its density could be obtained [24,25]. However, the first-order exponential fitting did not consider that the charges escape from the shallow traps is faster than that of the deep traps, which leads to the shallow trap’s and deep trap’s energy level and density could not be distinguished. In addition, there are a lot of studies on the ageing state evaluation of LDPE using trap parameters [16,18,26,27]. Unlike the LDPE, the use of trap parameters to assess the ageing condition of oil-paper insulation is very rare [1]. To evaluate the ageing state of oil-paper insulation using trap parameters, which is mainly to characterize the state of oil impregnated insulation paper [28,29,30,31], it is needed to consider the influence of oil properties on the trap parameters, which is not considered in the previous publication [1,9,10,19,24,25].
In the present paper, firstly, the trapped charges and charge decay behaviors of the oil-paper insulation sample with new and aged oil were measured by the pulsed electroacoustic (PEA) method. Secondly, an improved method for calculation of the shallow and deep trap distribution in oil impregnated insulation paper based on the double exponential kinetic analysis of charge detrapping was proposed. The trap distribution calculated using the improved method and common method were compared in detail. At last, the relationship between the trapped charges and the trap distribution parameters was analyzed. The new method could improve the accuracy in estimating the trap parameters for the oil-paper insulation.
2. Experiments
The PEA principle can be seen in literatures [1,2,3,10,13,14], as shown in Figure 1a [1]. When considering the oil-paper insulation is commonly used as multi-layer, in this experiment, oil-paper insulation samples with three layers immersed in new and aged oil were measured, respectively. The acidity of the new oil is 0.023 mgKOH/g, while the aged oil is 0.43 mgKOH/g. The sample preparation and testing process could be seen in our previous publication [31]. The samples were stressed at different dc electric field strength (20 kV/mm, 30 kV/mm, and 40 kV/mm) at 15 °C for 1 h (Al: cathode, Semiconducting polymer: anode). Space charge behaviors under the “voltage-off” and the “decay” condition were analyzed.
3. Experimental Results and Discussions
3.1. Charges Trapped in the Samples
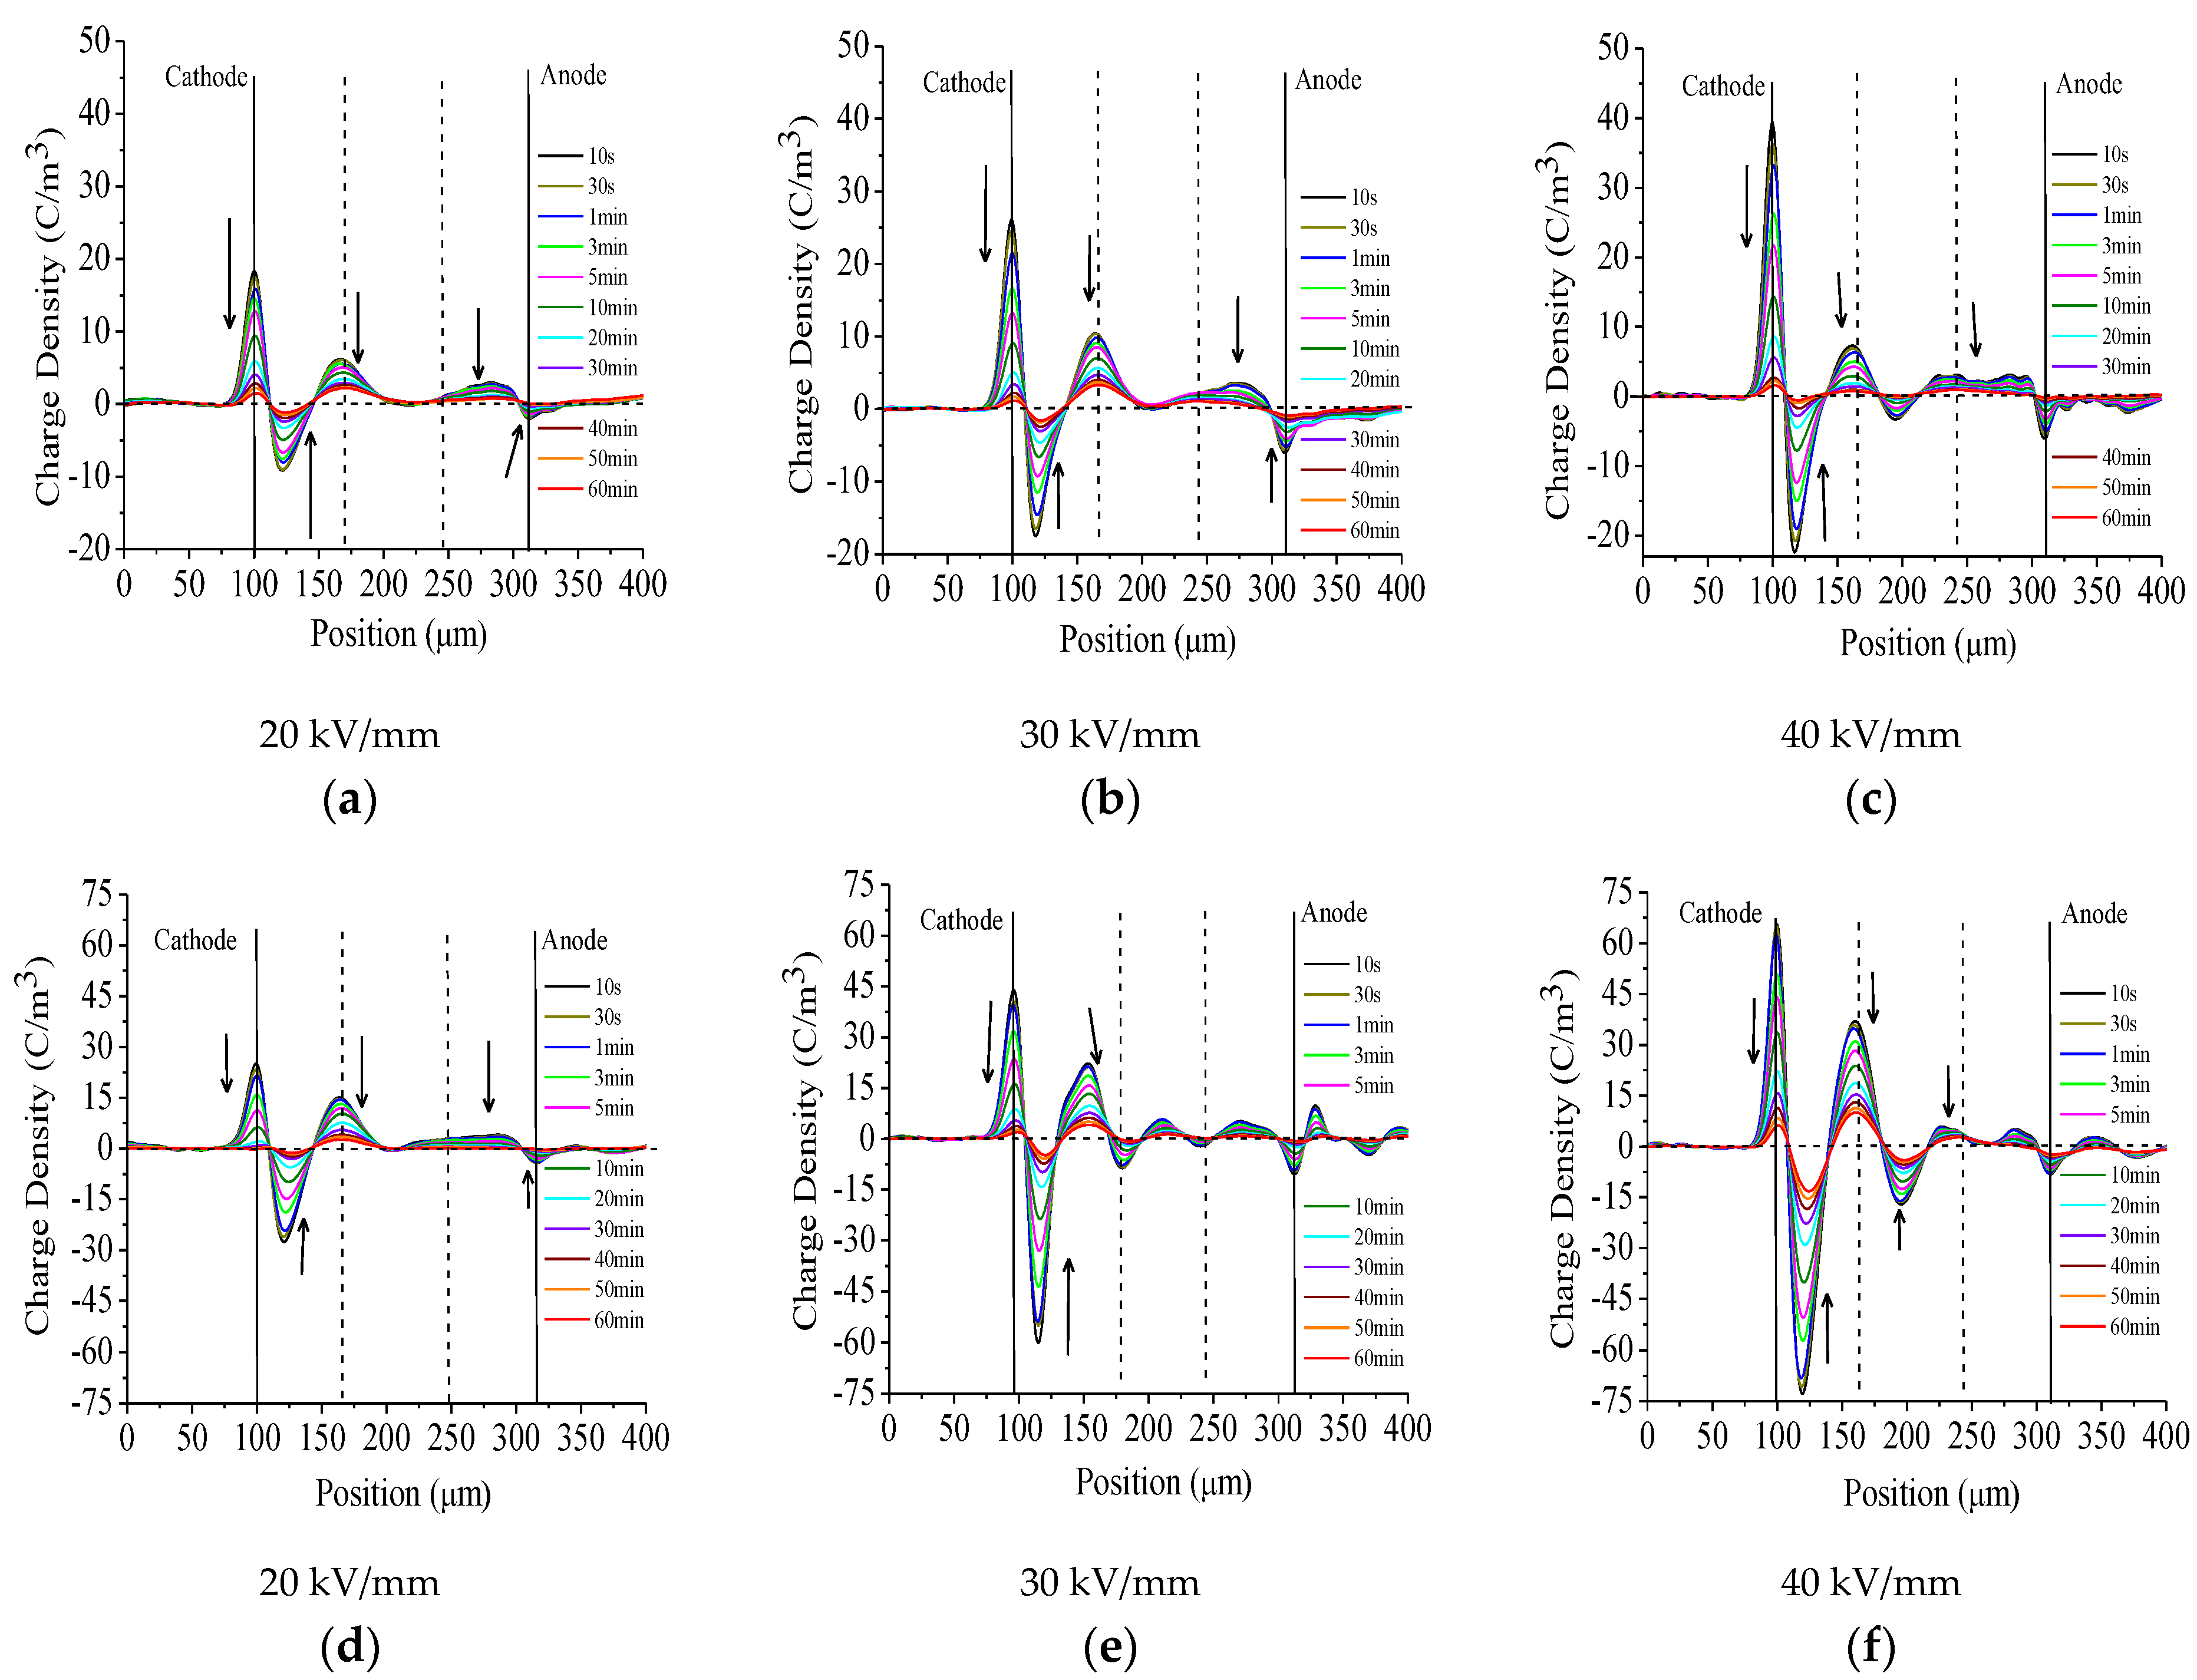
Traps can capture charges injected or generated in the material under the effect of electrical field [18,32]. The amount of charges that are trapped in shallow and deep traps attributes to the trap distribution [18,32]. In order to establish the relationship between the trapped charges and the trap parameters, the volts-off measurement mainly presents the characteristics of trapped charges was analyzed, as presented in Figure 2. The distribution behavior of the charges trapped in the sample with new and aged oil is similar. Homo-charges injection occurs in both samples. A lot of negative charges trapped in the vicinity of the cathode, and a lot of positive charges trapped in the vicinity of the anode. There are obvious positive charges trapped at the paper-paper interface. In Figure 2, what is more important is that the density of the trapped charges in both samples increase with the electric field strength enhanced, which indicates that the filling rate of the charges in the traps is higher under the higher electrical field strength.
The trapped charges amount in the sample was calculated using the Equation (1) presented in [1,13,16,24,25]. ρ(x, t) means the charge density, S is electrode area, and d is sample thickness.
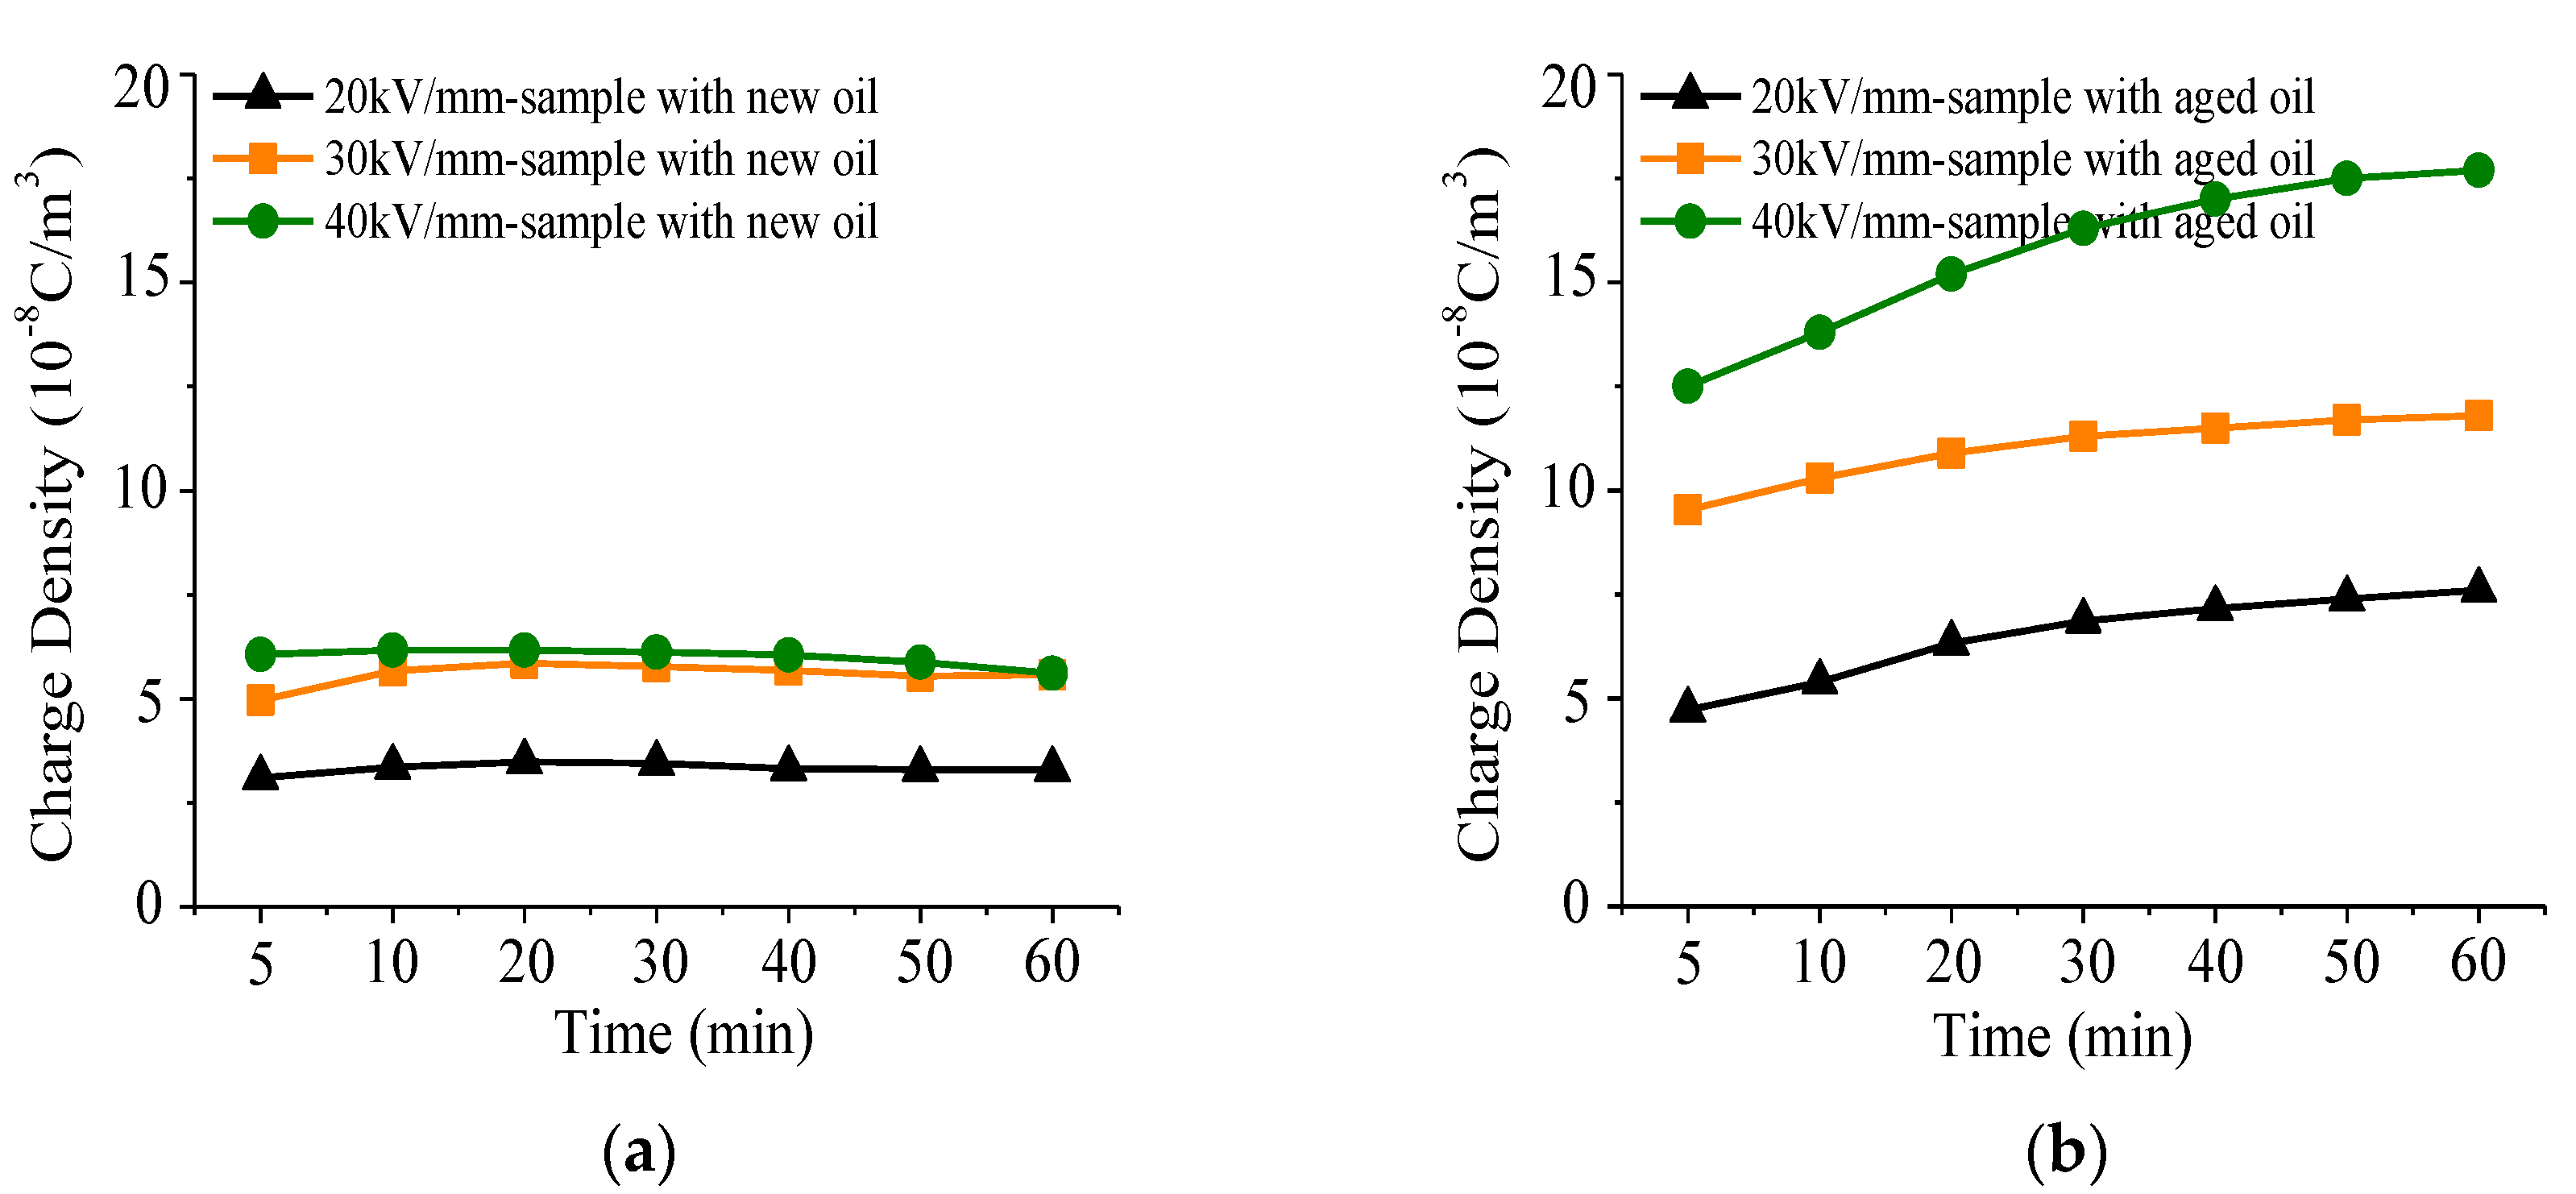
The total amount of trapped charges in the oil impregnated insulation paper with new and aged oil under volt-off condition is shown in Figure 3a,b, whether it is sample with new oil or aged oil, the total amount of charges trapped increases with enhanced electric field strength. For the sample immersed with new oil, the physical and chemical defects is limited, the traps could be fully filled when the voltage applied only for a while (Figure 3a). Thus, the amount of charges trapped in the sample shows a little increasing trend at first and then reaches saturation quickly with the voltage applied under 20 kV/mm, 30 kV/mm and 40 kV/mm, respectively. However, for the sample with aged oil, new physical and chemical defects were generated, which leads to the amount of trapped charges increases gradually, and it tends to attain a saturation value finally (Figure 3b). The saturation amount of trapped charges in the sample with aged oil is significantly larger than that in the sample with new oil under each applied electric filed. From Figure 3 it could be deduced that the saturation amount of trapped charges, and its increasing trend could reflect the changes in the material, which is related to the microscopic trap distribution.
3.2. Charges Decay Process
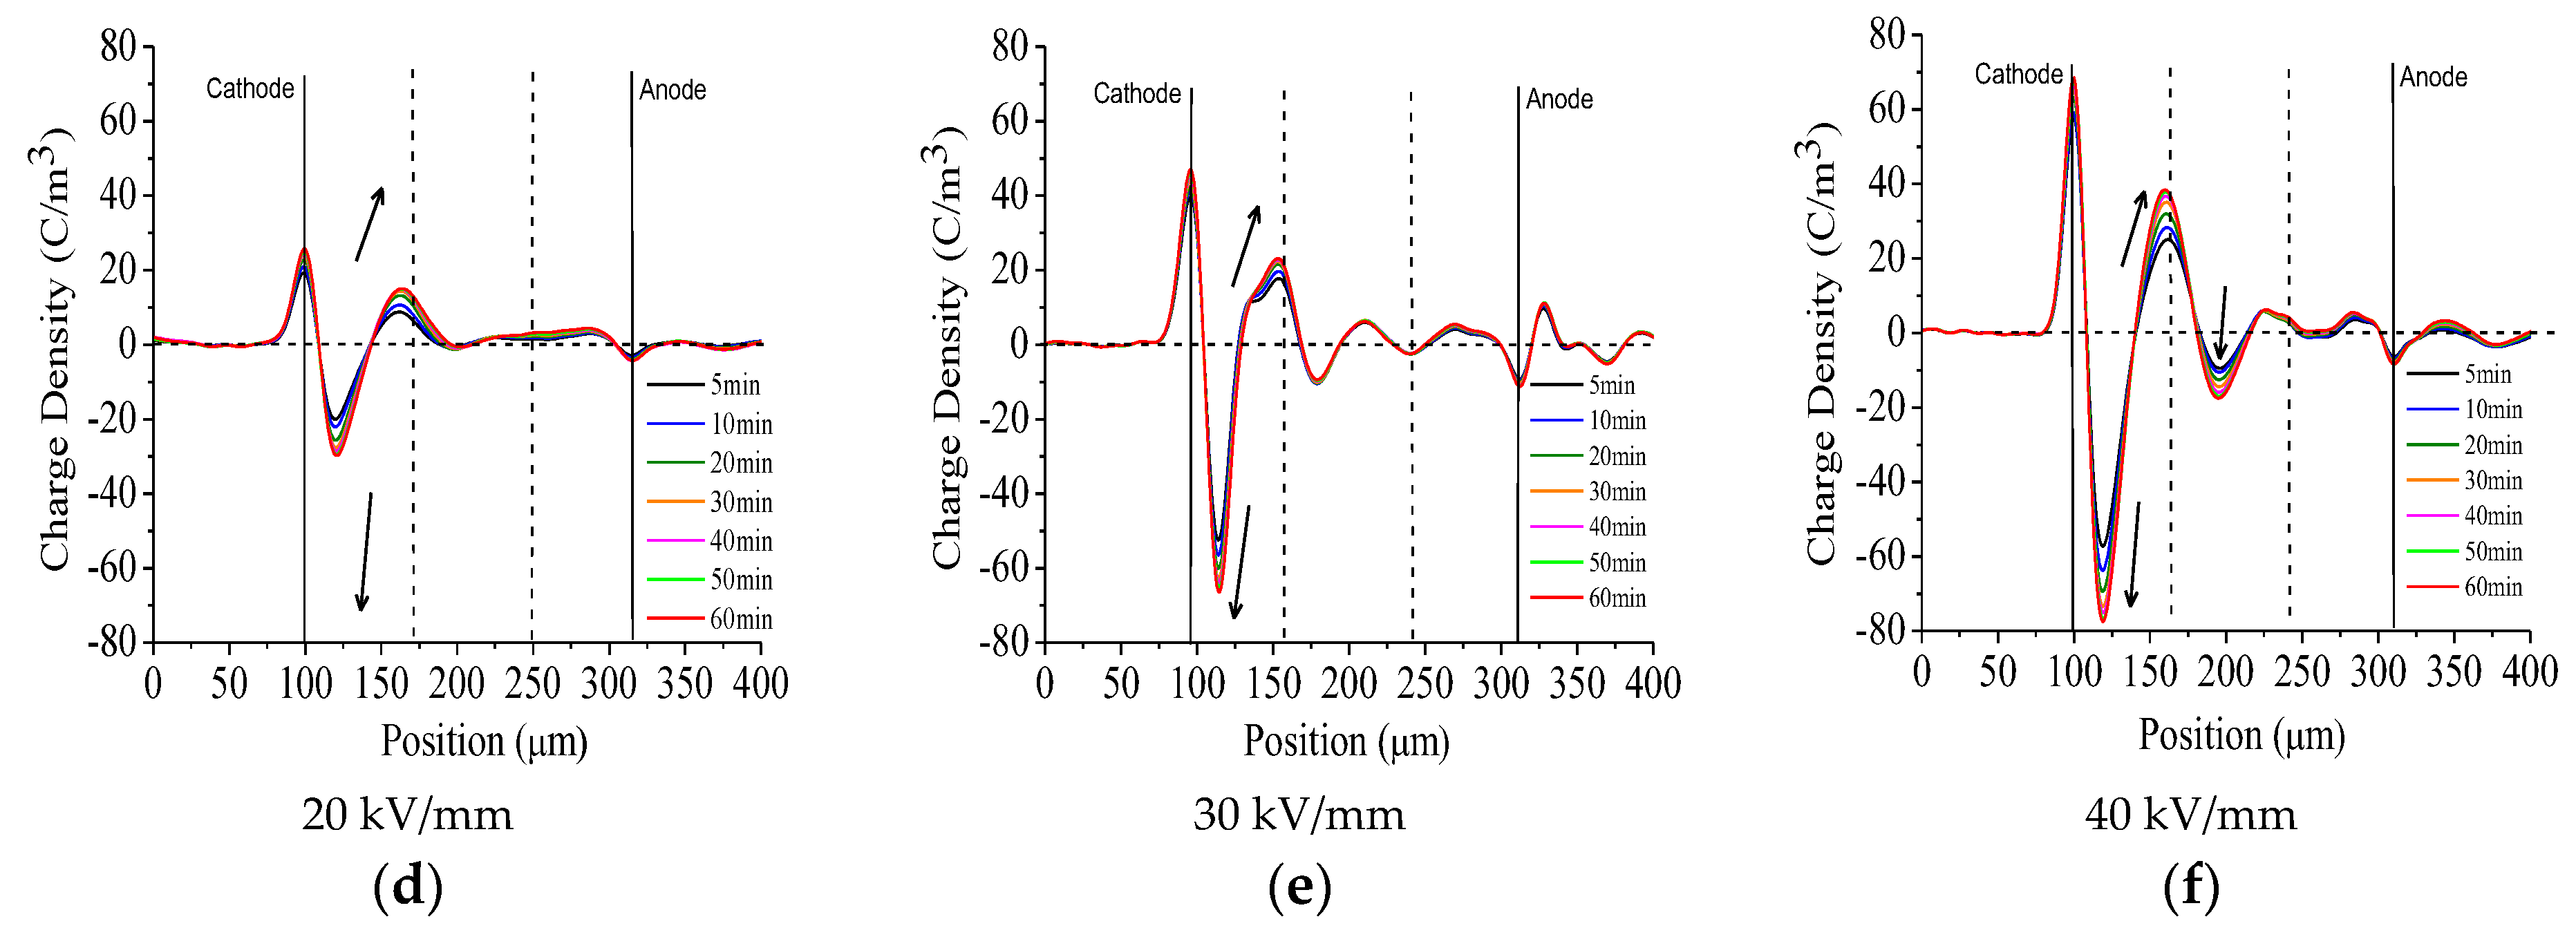
Trapped charges can release from the traps by photon assisted detrapping, thermal detrapping impact ionization, and tunneling [16,32]. Charge detrapping process of the insulation paper immersed with new and aged oil is presented in Figure 4. It is obvious that the charge density of the charges that are trapped near to the cathode increases with the voltage and the oil deterioration degree increased. The trapped charges dissipates quickly. Most of the trapped charges diminish away from the sample after being removed voltage 30 min.
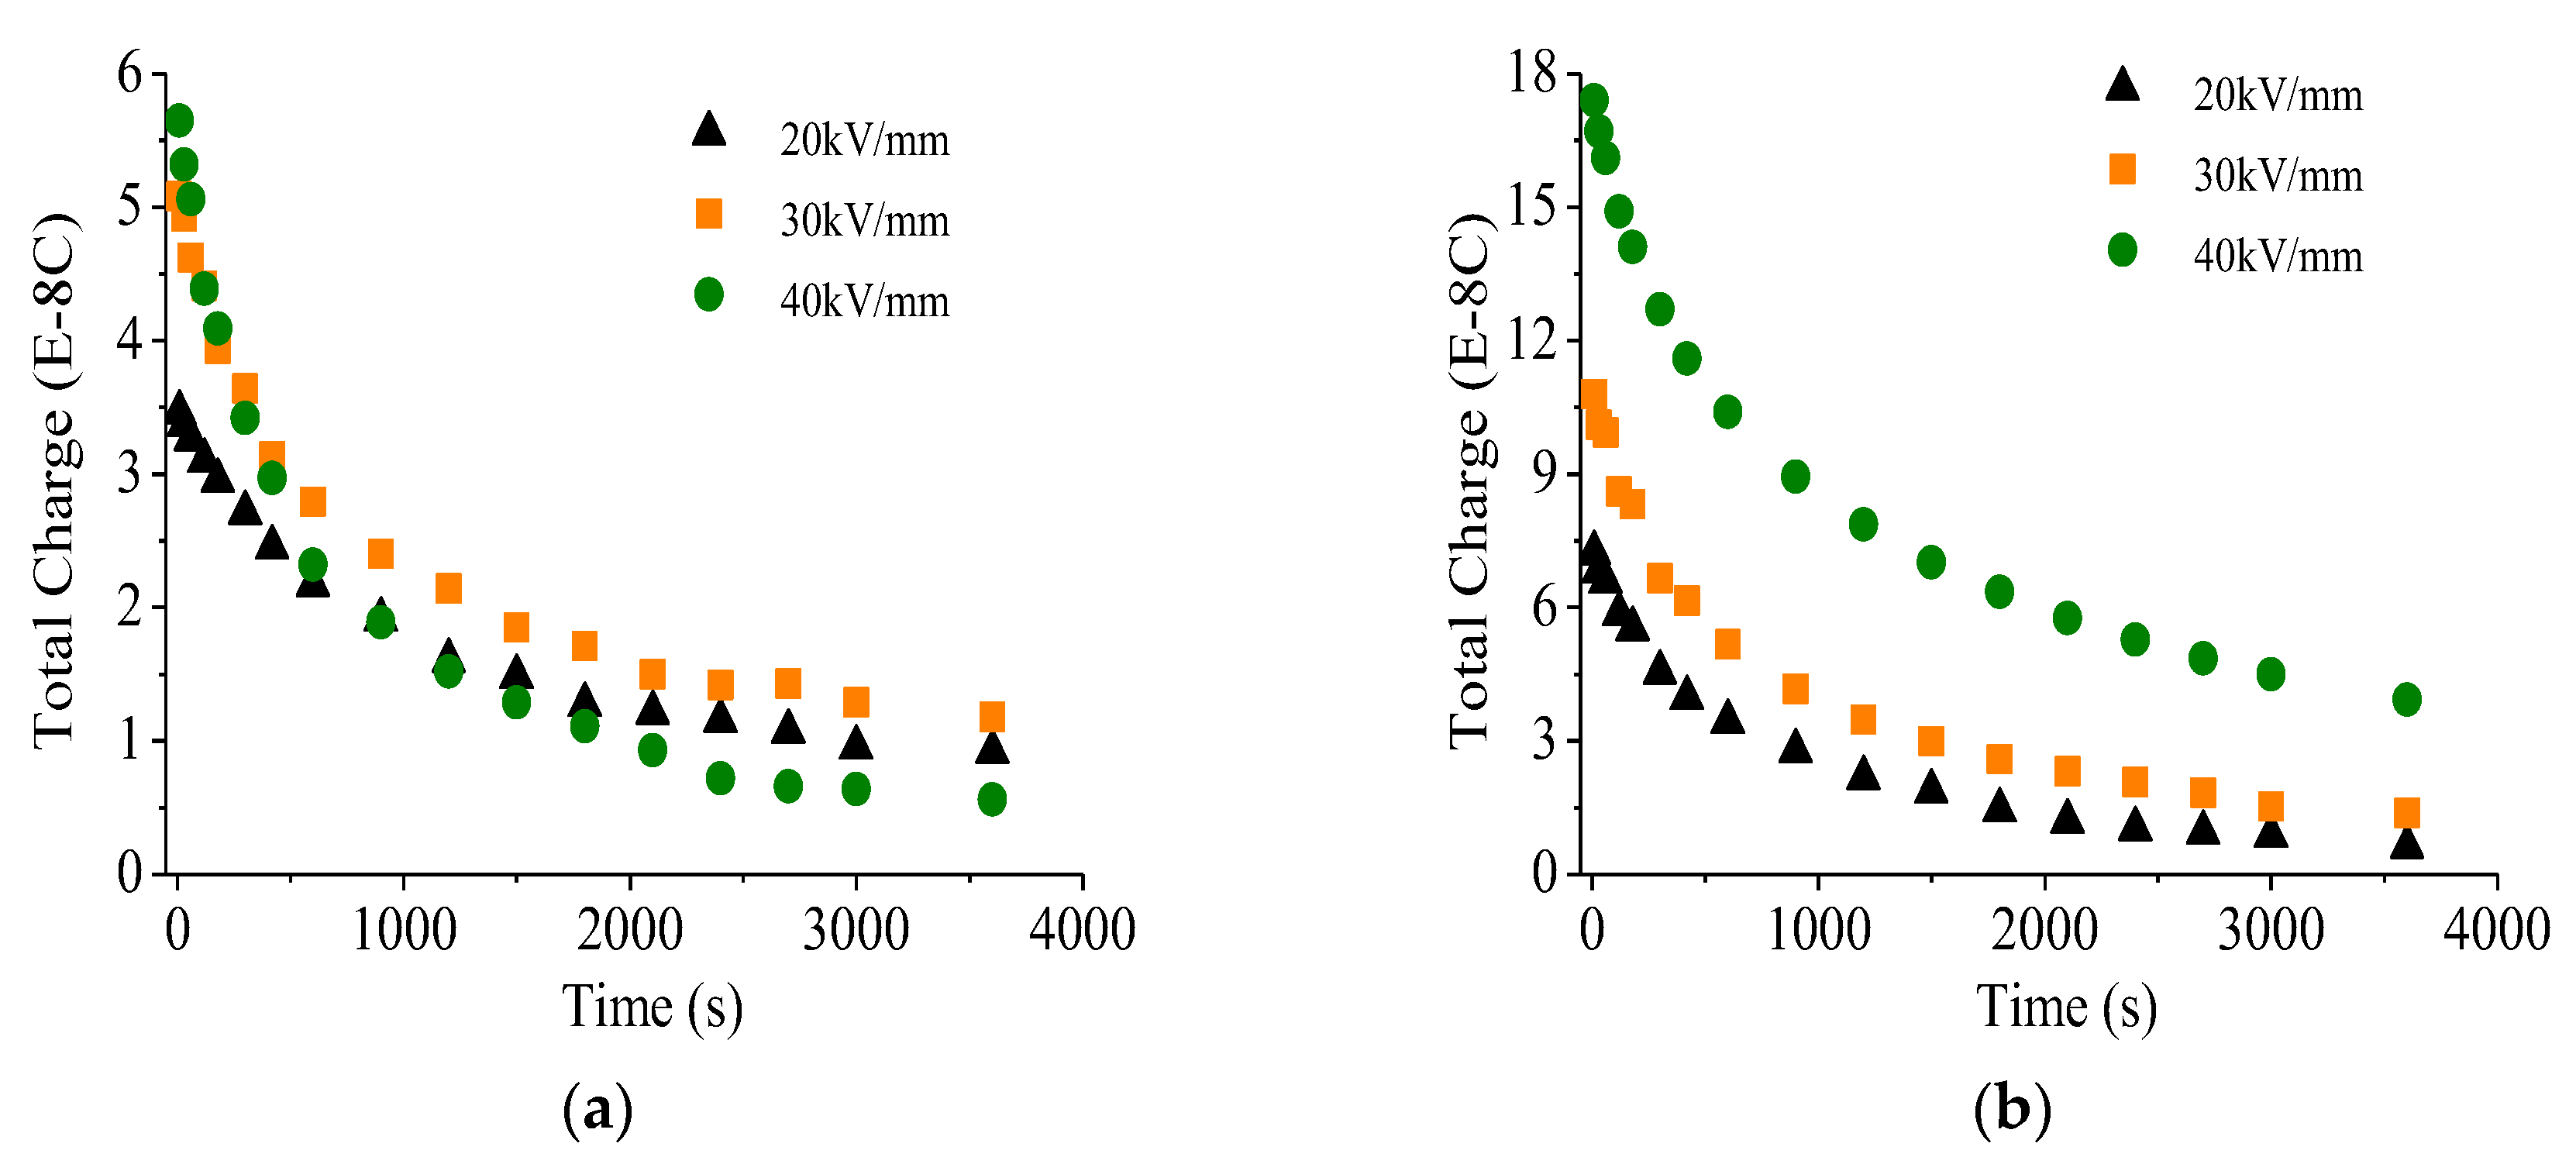
As depicted in publication [1,3,16,17], charges trapped in deep traps usually dissipate slowly, while charges that are trapped in shallow traps escape from the traps very shortly. Figure 5 shows the dissipation law of the trapped charges in the sample with new oil and aged oil. The higher the applied electric filed strength, the more charges trapped in the samples, which leads to the higher initial decay value of the total charge. In addition, it is clearly that the sample with aged oil has higher initial amount of trapped charges than that of the sample with new oil. For the sample with new oil, it is 3.46 × 10⁻⁸ C for 20 kV/mm, 5.08 × 10⁻⁸ C for 30 kV/mm, and 5.65 × 0−8 C for 40 kV/mm. For the sample with aged oil, it is 7.23 × 10⁻⁸ C for 20 kV/mm, 10.8 × 10⁻⁸ C for 30 kV/mm, and 17.4 × 0−8 C for 40 kV/mm. It is noteworthy that for both sample the amount of charges shows a significant decrease in the initial time of the voltage being removed, and then followed by a slow decay. This corresponds to the release of fast charges and slow charges, respectively.
4. Improved Method for Trap Distribution Analysis
4.1. Common Method for Trap Distribution Analysis Using Charge Detrapping Process
The common trap distribution calculation method based on the first-order exponential fitting analysis of charge decay is described in [24,25,32]. The charge density decreases according to an exponential law, as shown in Equation (2). In Equation (2), σ and A means the equivalent surface charge density and the initial surface charge density, respectively. τ and t is the time constant and decay time for trapped charges dissipation. The current density |j(t)|, including the decay time constant could be calculated by Equation (3). The current density is |j(t)|, and the average charge centroid is r′, 120 pm. L means the sample thickness.
The trap energy level Et, the trap density N(Et), and the current density |j(t)| follows Equations (4) and (5). Where ν means electron vibration frequency, 3 × 10¹² s−1. K means Boltzmann’s constant, 8.568 × 10⁻⁵ eV/K. T is the absolute temperature, K. f0(Et) is 1/2, which means the trap’s original occupation rate. e is the electron charge, 1.6 × 10⁻¹⁹ C.
If , , η1 and η2 are constant, then
Equation (6) presents that the trap density N(Et) at trap energy level Et could be calculated as long as the values of A and τ being obtained by analysis the charge detrapping behavior measured by PEA equipment, as shown in Figure 6.
4.2. Improved Method for Trap Distribution Analysis Using Charge Detrapping Process
There are majorly two types of trap with different energy level, namely shallow trap and deep trap. Charges decay faster from shallow traps than that from deep traps [16,17,32], therefore, the first-order exponential decay expression of charge detrapping shown above should be changed to double exponential decay expression, as shown in Table 1. In the following, the trap distribution of oil impregnated insulation paper based on the first-order exponential fitting analysis (common method) and the double exponential fitting analysis (improved method) is compared.
4.3. Comparison Analysis of the Charge Detrapping Process Using the Improved Method and Common Method
The charge detrapping process presented in Figure 5 was fitted using the first order exponential expression and double order exponential expression, respectively, as shown in Figure 7. The first order exponential fitting equations and the double order exponential fitting equations are shown in Table 2 and Table 3. As shown in Figure 7a,c and Table 2, the fitting curves obtained by the first order exponential fitting expression fit well with the measured data. However, in the middle and late stages of charge decay, some measured data deviate from the fitting curve. While for the fitting curves obtained by double order exponential fitting expression shown in Figure 7b,d and Table 3 is in good agreement with the measured data, especially in the middle and late stages of charge decay. This presents that the double order exponential fitting analysis accords with the law of charge dissipation, which includes the fast charge and slow charge. When compared with the common method, the improved method is more suitable for the kinetic analysis of charge detrapping.
The higher the applied electric filed strength, the more charges trapped in the samples (Figure 3), which also leads to the higher initial decay value of total charge, as shown in Figure 7a. The initial decay value of total charge increases as electrical field strength. The total trapped charge decay shows a fast decay initially and follows a much slower change. This fact approves the two trapping levels approximation used in our analysis. The charge detrapping expression based on the first order exponential fitting analysis for oil impregnated insulation paper with new oil shown in Table 2 present that the decay constant time decreases with increasing of the electric filed strength. It is 922.66 s for the 20 kV/mm, 683.25 s for the 30 kV/mm, and 577.41 s for the 40 kV/mm. The faster decay rate of the charges may lead to the less values of total charge in the decay process, although the samples applied higher electric filed having a higher decay value of total charge.
The charge detrapping expression based on the double order exponential fitting analysis for oil impregnated insulation paper with new oil shown in Table 3 presents that the sample applied 40 kV/mm for 1 h has a much faster decay rate, while there has a slower decay rate for the charges trapped in the deep traps. The faster charges detrapping from the shallow traps contributes more to the decay process due to that there is limited defects in the new sample. When the sample composed by aged oil, many chemical defects would be introduced into the sample, which contributes to deep traps. This leads to more charges be trapped in the sample and charges decay more slowly. Therefore, the less total charge under 40 kV/mm for the sample with new oil in the decay process attributes to limited trap in the new sample and faster decay rate for the charges trapped in shallow trap.
4.4. Comparison Analysis of the Trap Distribution Using the Improved Method and Common Method
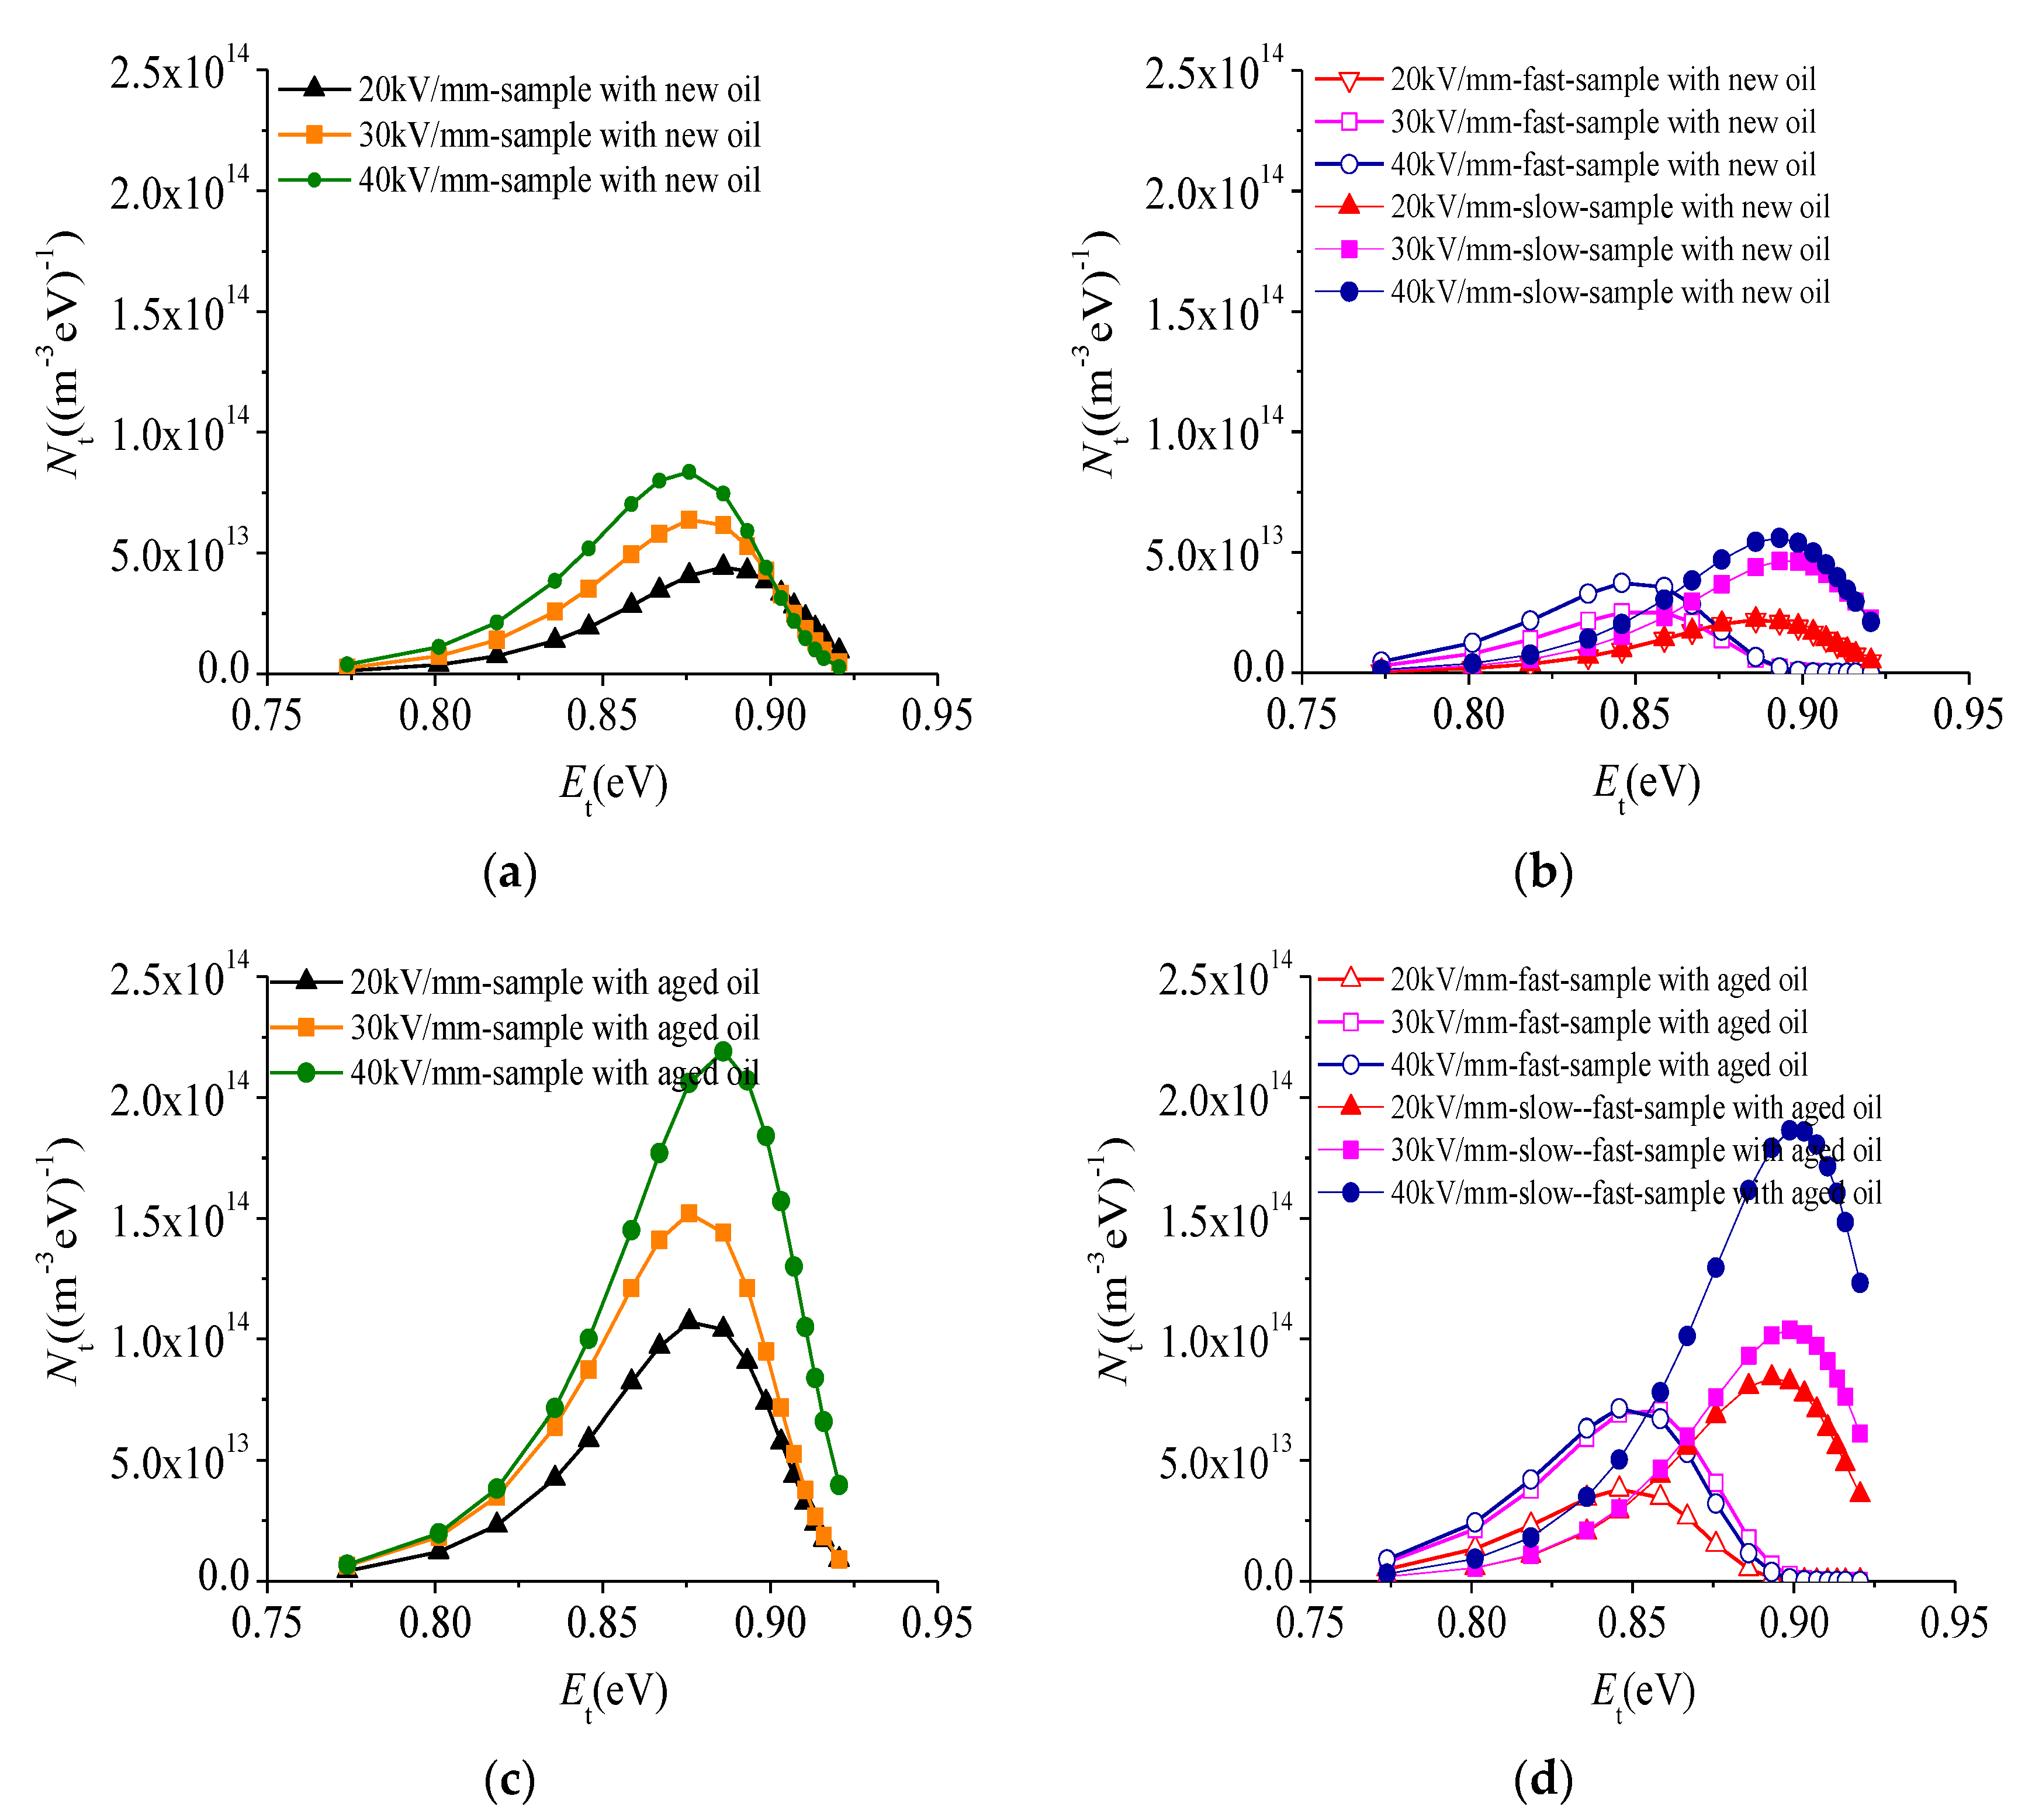
The trap energy level and its density calculated using the common method and the improved method is presented in Figure 8. It can be seen that there is only one peak for the trap distribution obtained by the first order exponential fitting expression (Figure 8a,c), which only has one decay time constant for the charge detrapping process. Therefore, the shallow trap and the deep trap could not be distinguished. However, for the trap distribution calculated using the double order exponential fitting expression, there are two energy levels of trap distribution (Figure 8b,d). The shallow traps and deep traps could be particularly distinguished according to their peaks’ energy level.
For the trap distribution of sample with new oil calculated by the common method, the energy level is from 0.77 eV to 0.92 eV (Figure 8a). With the electric field strength increased from 20 kV/mm to 40 kV/mm, the maximum trap density increases from 1.29 × 10¹² m3·eV−1 to 8.36 × 10¹³ m3·eV−1, while the trap energy level corresponding to the maximum trap density decreases form 0.89 eV to 0.88 eV. For the trap distribution of sample with aged oil calculated by the common method, the energy level is from 0.77 eV to 0.92 eV (Figure 8c). The maximum trap density increases from 4.15 × 10¹² m3·eV−1 to 2.19 × 10¹⁴ m3·eV−1 as the increasing of the electric field strength, and the trap energy level corresponding to the maximum trap density increases from 0.88 eV to 0.889 eV. In addition, the maximum trap density for the sample with aged oil is significantly higher than the sample with new oil. However, using the trap distribution obtained by the common method, it is difficult to know whether the increase in shallow trap or deep trap that is caused by oil ageing.
As shown in Figure 8b,d, for the trap distribution of sample with new oil and aged oil calculated by the improved method, it can be seen that the shallow trap density peak and the deep trap density peak being clearly separated. For the sample with new oil, the trap energy level corresponding to the maximum shallow trap density peak is 0.85 eV, and the trap energy level corresponding to the maximum deep trap density peak is 0.89 eV. For the sample with aged oil, the trap energy level corresponding to the maximum shallow trap density peak is 0.85 eV, and the trap energy level corresponding to the maximum deep trap density peak is 0.90 eV. There exists a cross region in the range of the shallow trap and deep trap. Most shallow traps are distributed from 0.80 eV to 0.87 eV, while most deep traps are distributed from 0.85 eV to 0.92 eV. The phenomenon of cross region in trap energy level is more in line with the actual situation of trap distribution in material. What is more, the maximum trap density of the shallow traps and deep traps also increases with an enhanced electric field strength.
Traps is greatly affected by the physical and chemical defects [16,18,33,34]. Morphological structure changing would introduce physical defects in the material. Chemical defects usually introduced by photo-oxidation of the material [16,32]. It has been reported that the physical defects mainly depended on the shallow traps, while the chemical defects mainly depended on the deep traps [16,18,32]. Mineral oil ageing or deterioration is normally associated with oxidation, as shown in the following chemical reactions (1), (2), (3) [35,36,37]. Where RH: hydrocarbon compounds; , , , : free radicals; ROOR: alkyl peroxide; ROOH: hydrogen peroxide. The ageing products are mainly the gaseous (CO, CO2, and volatile hydrocarbons), liquid (RCHO, R–CO–R, ROH, RCOOH, tars, and H2O) and sludge. From the chemical reactions (1), (2), (3), it can be seen clearly that oil thermal deterioration lowering the molecular weight and bring impurities to oil, especially acidic impurities [35,36,37]. Figure 8 clearly presents that the new method could describe the physical and chemical defects changes in the oil impregnated insulation paper. Though the trap energy level and trap density of the deep traps could be used as ageing markers, when one assessing the ageing condition of the oil-paper insulation by the trap parameters, the influence of oil performance should not be ignored due to the oil filter treatment during the transformer operation.
- (1)
- (2)
- (3)
4.5. Effectiveness Verify of the Improved Method
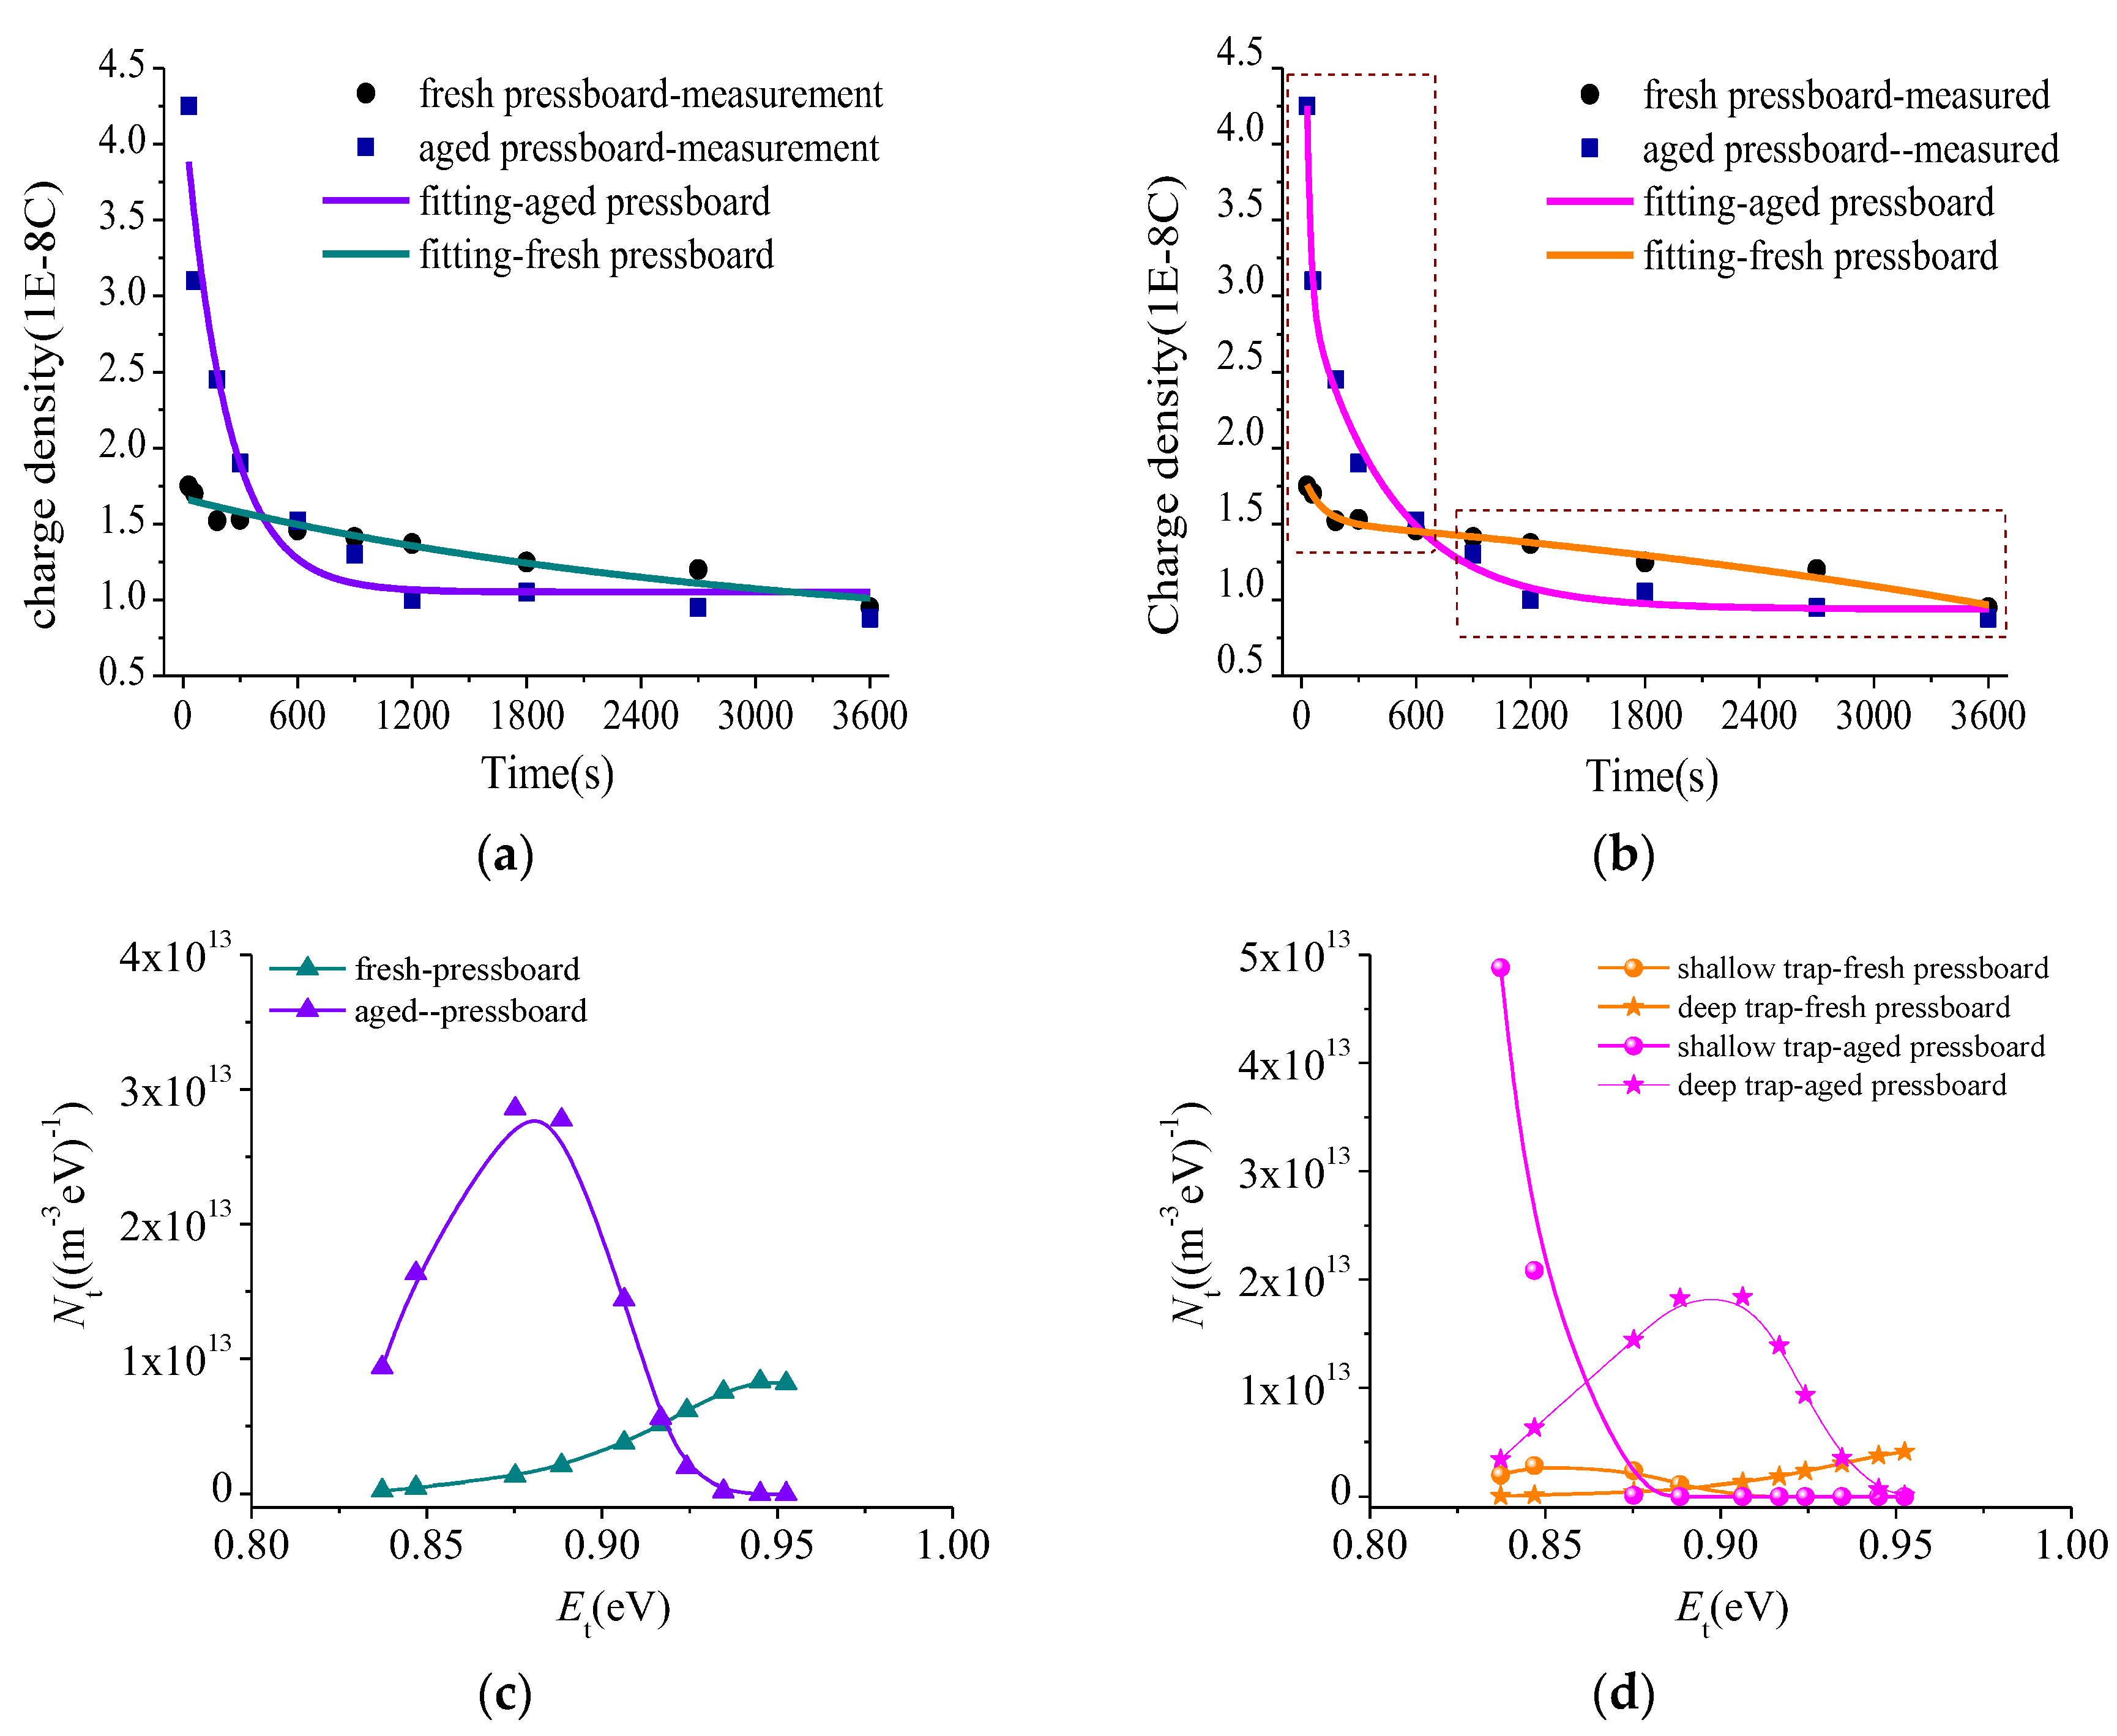
In order to further verify of the improved method proposed in this paper, the space charge decay data published in [16,38] were extracted and analyzed using the new improved method, respectively. The decay charges amount changing with decay time for the fresh and aged oil impregnated insulation pressboard after being applied negative 25 kV/mm voltage for 4 h in [38] is shown in Figure 9a,b. The charge decay behavior was fitted using the common method (first order exponential fitting equation) and new method (double order exponential fitting equation). From Figure 9a, it can be seen that the initial and the last stage of the charge dissipation was not fitted very well using the common fitting method. However, this phenomenon could be eliminated by using the new method, as shown in Figure 9b. The fitting equations is shown in Table 4. The decay charges at initial and the last stage of the charge dissipationc was fitted very well. The common fitting method regards the decay charge having the same motion behavior, while the new method (double order exponential fitting equation) includes the motion law of both the fast and slow charges, thus the new fitting method is more consistent with the reality of charge dissipation.
Figure 9c,d is the trap distribution calculated using the common method and the new method according to Table 1, respectively. The trap density for the aged pressboard is significantly higher than the fresh pressboard. However, it is difficult to know the increase degree of shallow trap or deep trap that is caused by ageing. In Figure 9d, it clearly shows the density of the shallow trap and deep trap both increases for the aged pressboard compared with the fresh pressboard. The results shown in Figure 9 further verify the effectiveness of the improved method.
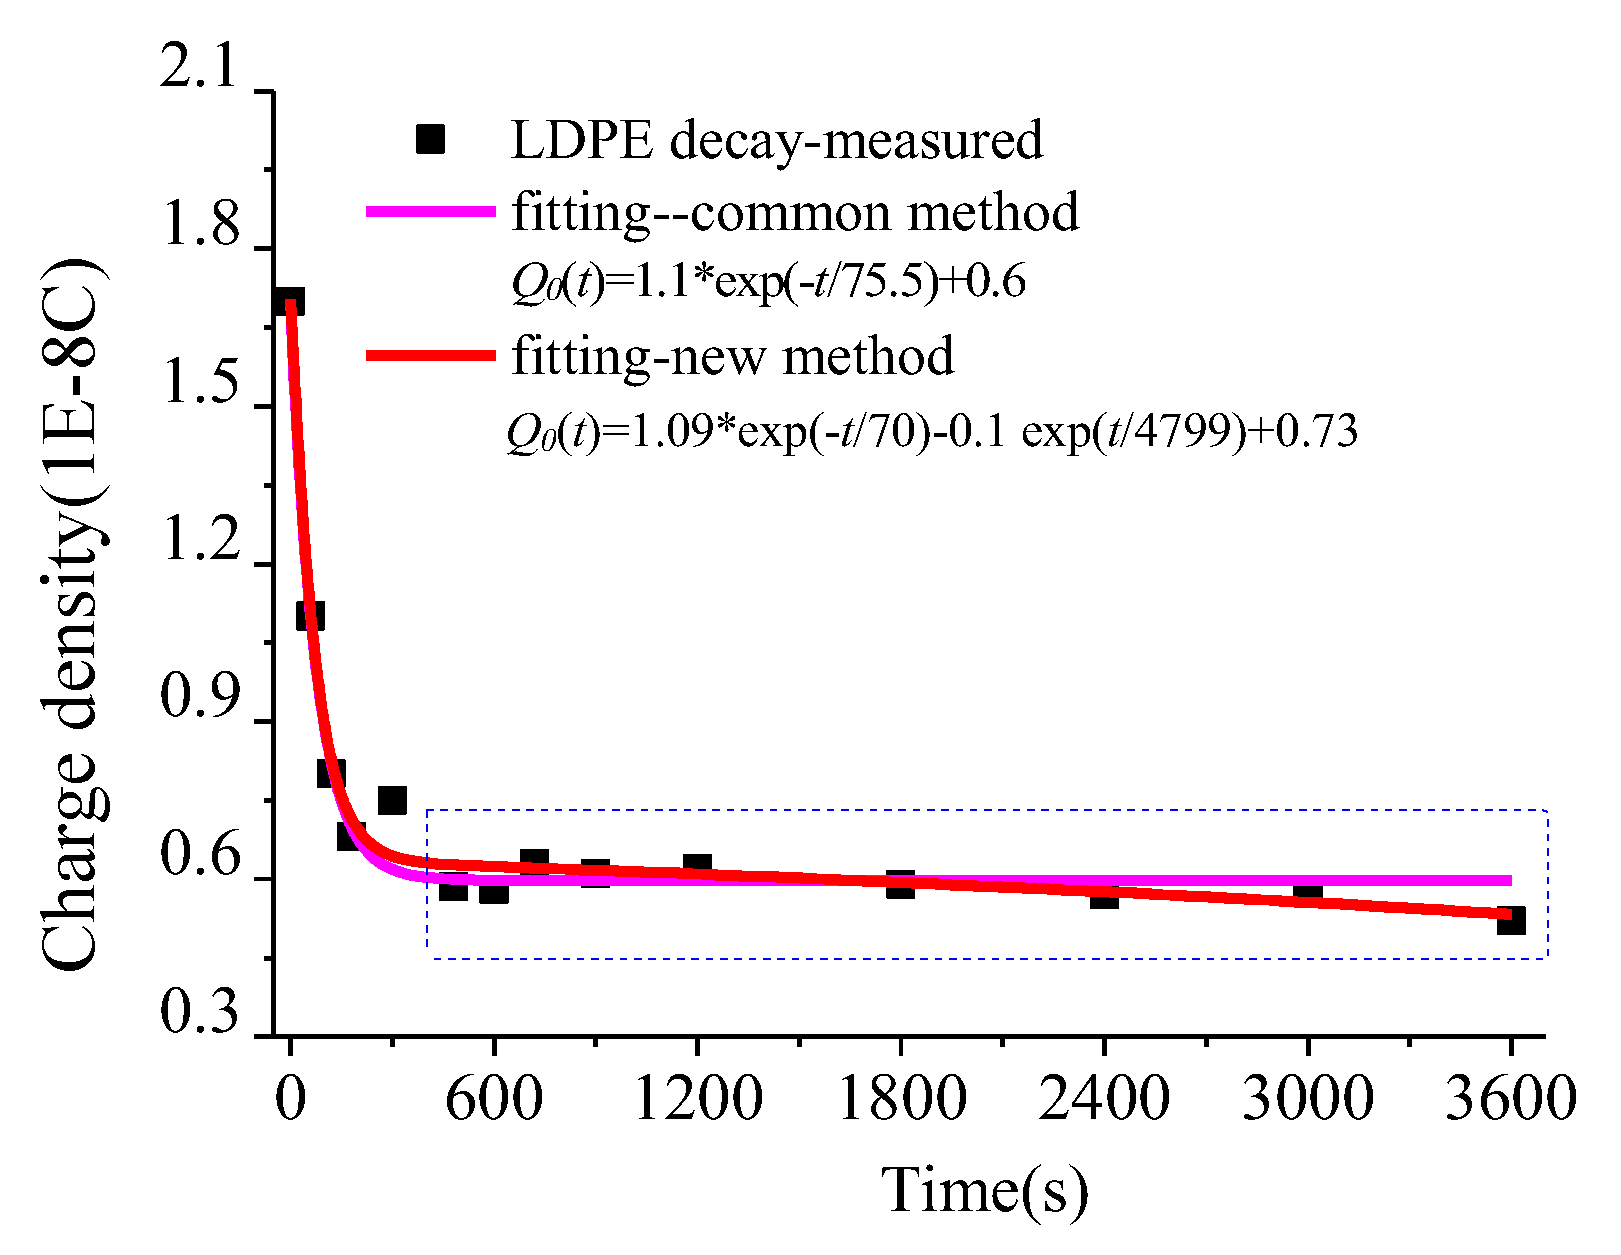
The second verification case shown in Figure 10 analyzed the charges decay data for the LDPE sample after being applied 4 kV for 10 min (charges data was derived from [16]). There is a rapid decay for the charges at the initial dissipation stage, and then the charges dissipates much slowly. The pink line and the red line represent the fitting result using the common method and the new method, respectively. According to the measured data, it can be seen that red line is closer to the measured data, especially after the rapid decay stage. Therefore, the new method considering both the fast and slow charges have obvious advantages.
4.6. Relationship between Trapped Charges and Trap Distribution
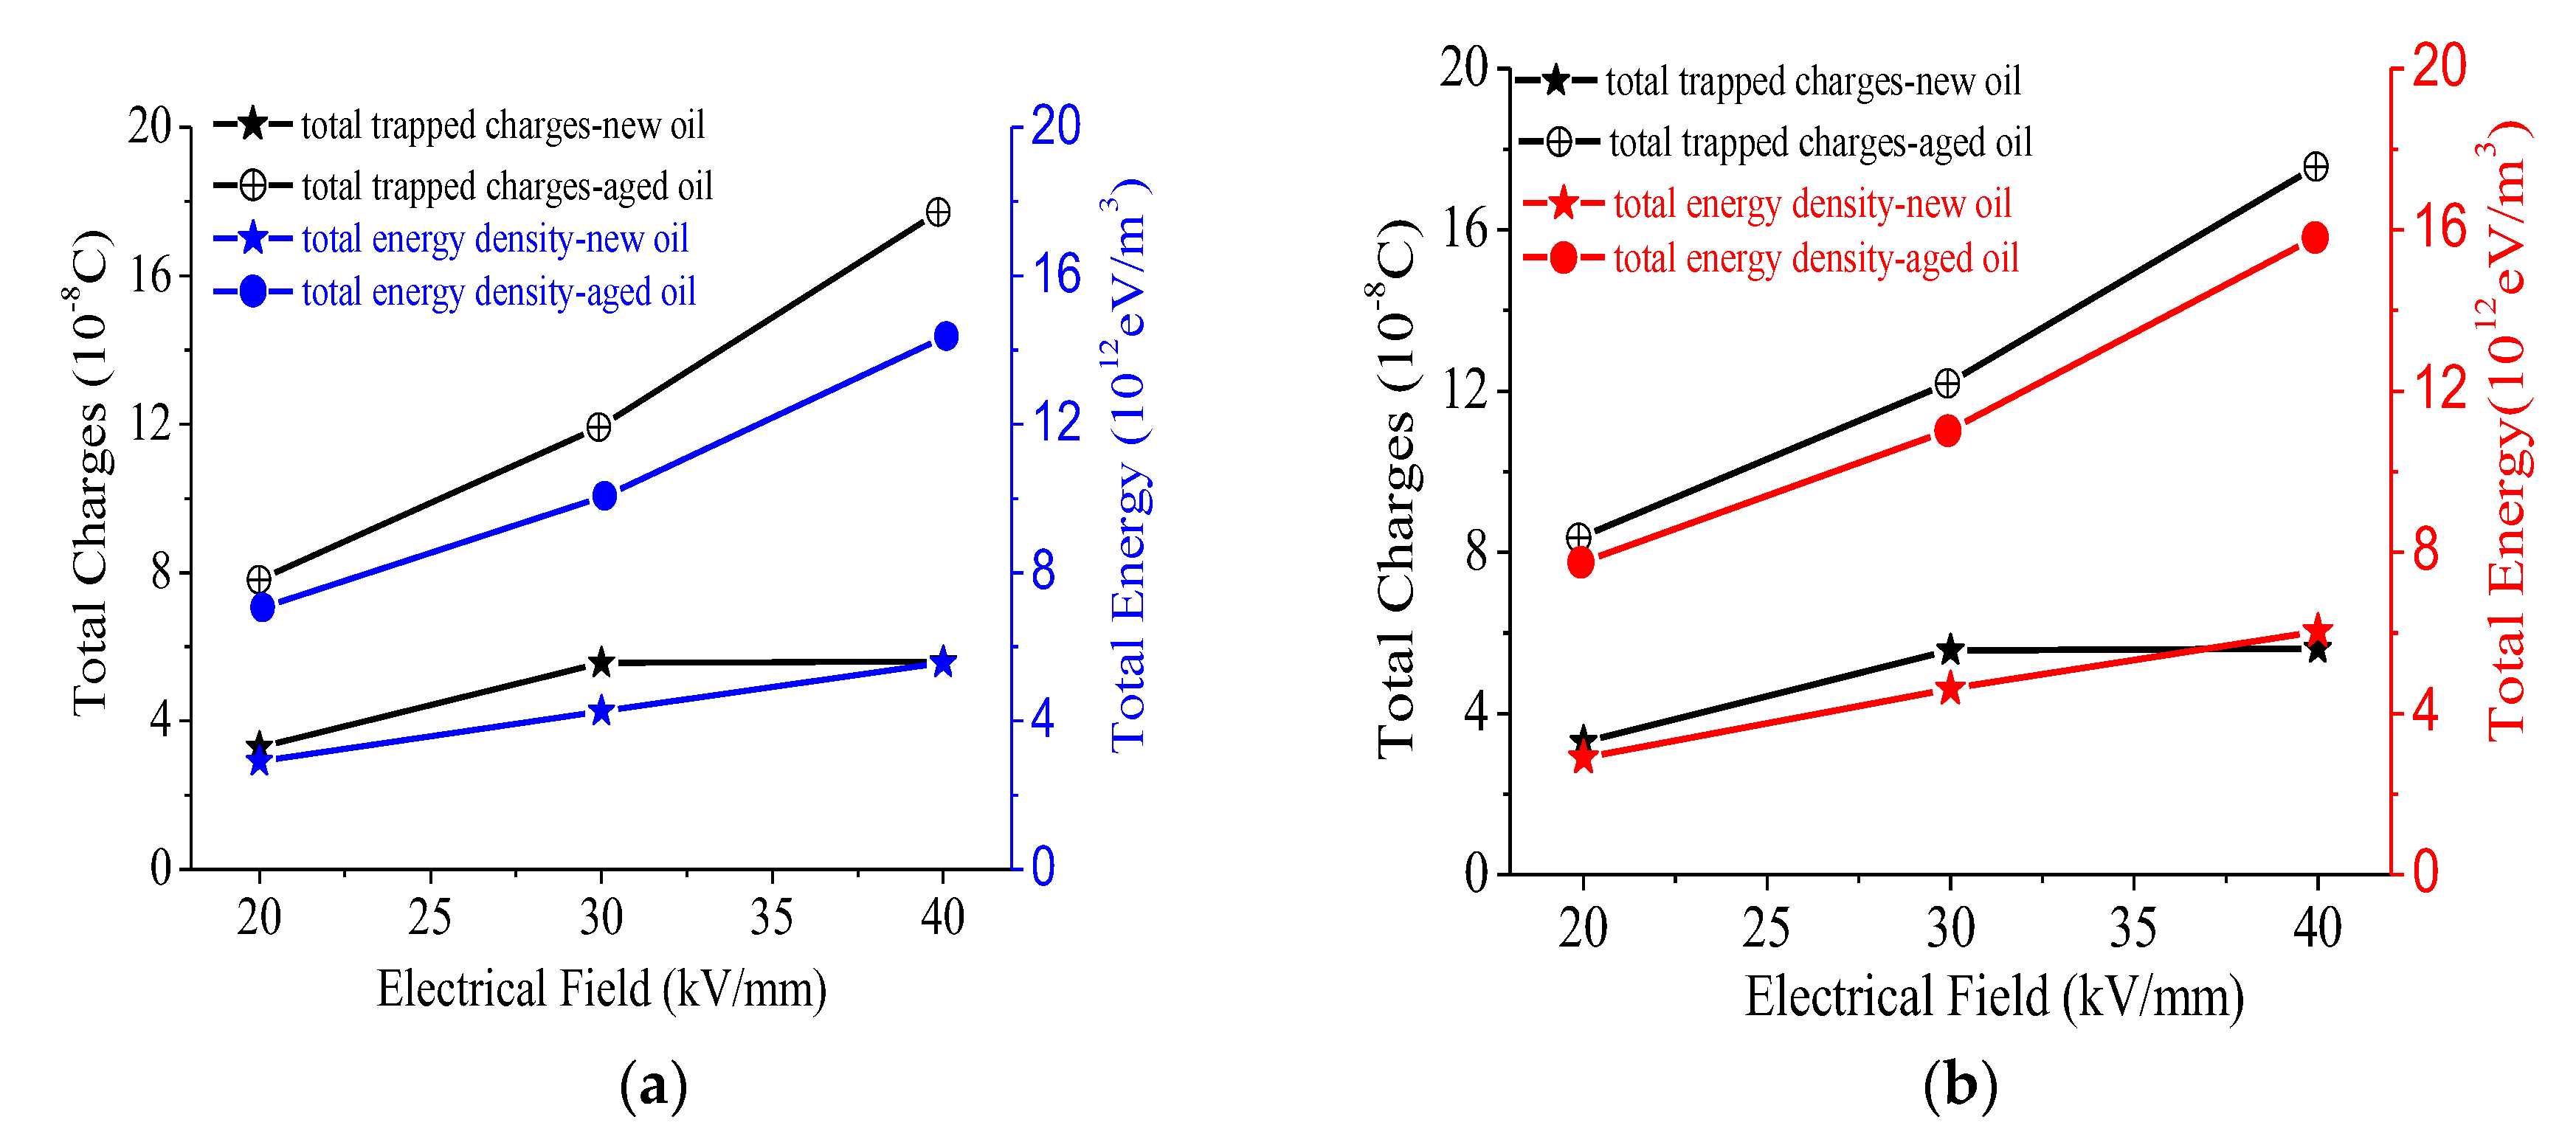
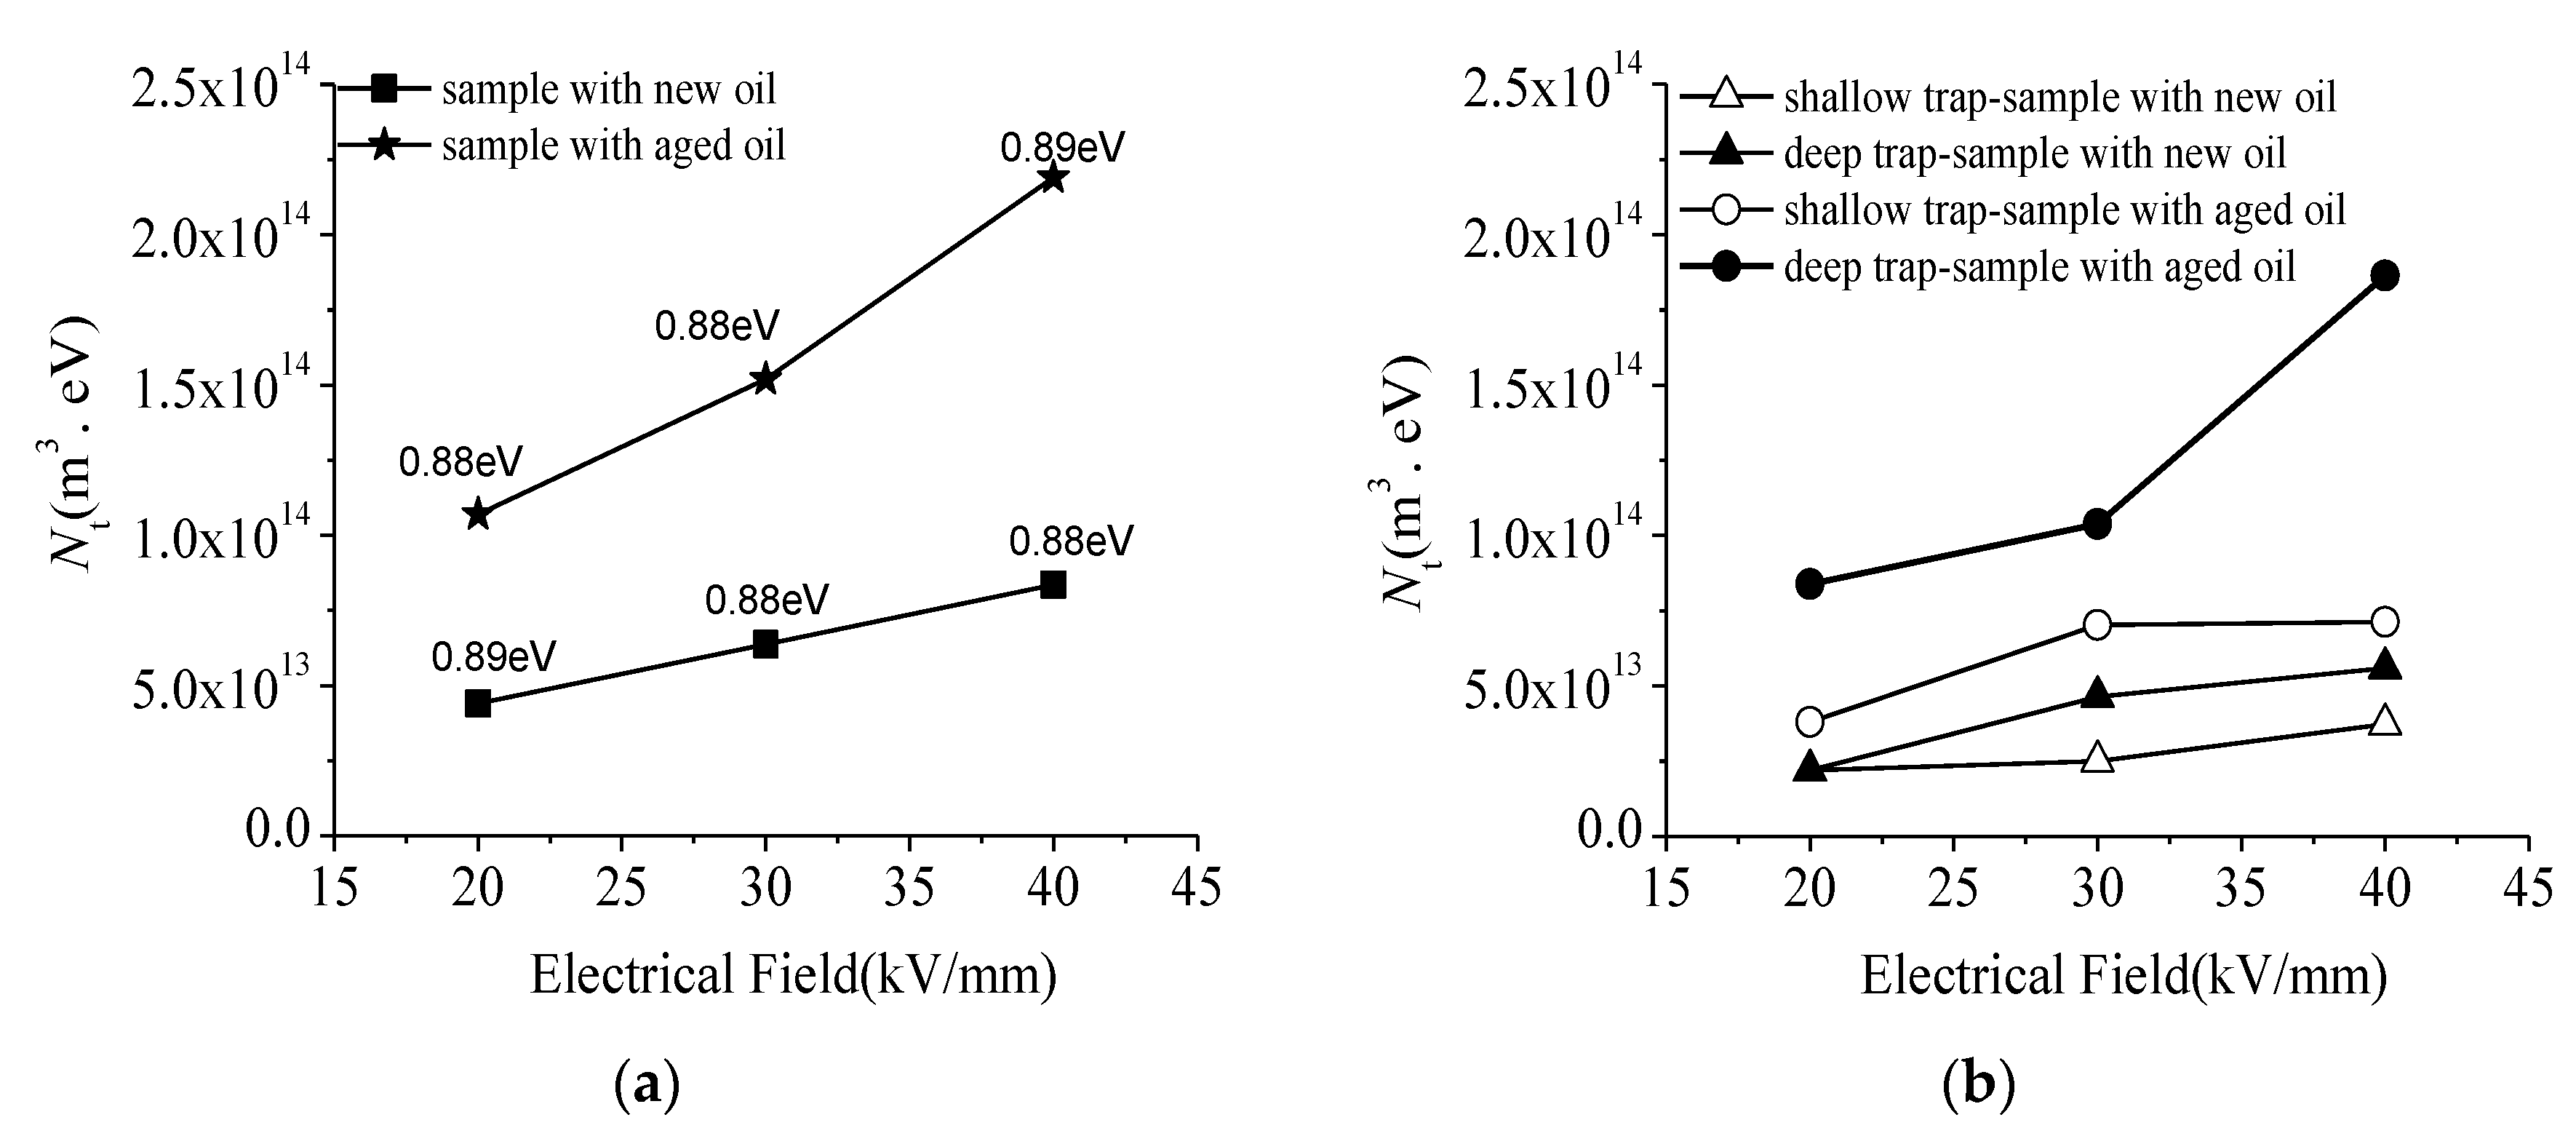
Trap density changing with electric field strength for the sample with new and aged oil was analyzed, as shown in Figure 11. It is worth noting that the trap density of the shallow traps and deep traps both shows an increasing trend with the oil ageing (Figure 9b), especially for the deep traps. The maximum trap density of the deep trap for the sample with aged oil under 20 kV/mm, 30 kV/mm, and 40 kV/mm is 8.38 × 10¹³ m3·eV−1, 1.04 × 10¹⁴ m3·eV−1, and 1.86 × 10¹⁴ m3·eV−1, respectively. While for the sample with new oil, the maximum trap density of the deep trap under 20 kV/mm, 30 kV/mm, and 40 kV/mm is only 2.20 × 10¹³ m3·eV−1, 4.64 × 10¹³ m3·eV−1, and 5.59 × 10¹³ m3·eV−1. The maximum density of deep traps for sample with aged oil is 3.81, 2.24 and 3.33 times larger than the sample with new oil under 20 kV/mm, 30 kV/mm, and 40 kV/mm, respectively. However, the maximum density of shallow traps for sample with aged oil is 1.73, 2.80, and 1.92 times larger than that for the sample with new oil under 20 kV/mm, 30 kV/mm, and 40 kV/mm, respectively. Thus, it is obvious that using the improved trap distribution calculation method, it is easy to know the degree of increase in shallow trap or deep trap caused by oil ageing.
The saturation amount of trapped charges in both sample was extracted. The relationship between the saturation amount of the trapped charges and the trap parameters was analyzed. According to the common method for the trap distribution calculation, the total energy filled by the traps could be calculated using the Equation (7). Where TNE is the total energy that is filled by the traps in the sample. l means t sample thickness. S is the space charge testing area of the sample.
According to the improved method for the trap distribution calculation, the total energy filled by the traps could be calculated using the equation defined below:
As shown in Figure 12a,b, the greater the energy could be filled by the traps, the larger amount of charges could be trapped, especially under higher electric field strength. In addition, compared with the results shown in Figure 12a, the TNE values presented in Figure 12b calculated using the parameters obtained by the improved method which considers two types of trap has a better match with the saturation amount of trapped charges in both sample.
5. Conclusions
An improved method for calculating trap distribution based on the double exponential fitting analysis of charge decay process and its application on characterizing the trap distribution of oil impregnated insulation paper was discussed in this paper. The following conclusions could be drawn.
- (1)
- The double exponential fitting analysis of charge decay includes the detrapping process of both fast charge and slow charge. Compared with the dual-level trap model and the common first order exponential fitting analysis method, the improved method is more suitable for the kinetic analysis of charge detrapping and trap distribution calculation. It could be able to obtain the energy level range and the density of shallow traps and deep traps simultaneously.
- (2)
- Using the improved trap distribution calculation method by double exponential fitting analysis of charge decay, it is not only can obtain the trap parameter changes caused by physical or chemical defects generated in material, but also can distinguish the shallow trap (physical defects) and deep trap (chemical defects). For oil impregnated insulation paper, the trap energy level and trap density representing deep traps is signal for ageing.
- (3)
- The trap density shows an increasing trend with the oil ageing, especially for the deep traps. The greater the energy that could be filled by the traps, the larger amount of charges could be trapped, especially under higher electric field strength. When one evaluating the ageing status of oil-paper insulation using trap parameters, the oil performance should not be ignored.
Acknowledgments
The authors thank the Project Supported by the National Key R&D Program of China (2017YFB0902704), the National Natural Science Foundation of China (51707022), the China Postdoctoral Science Foundation (2017M612910), the Chinese Universities Scientific Fund (2017CDJZR), the Chongqing Special Funding Project for Post-Doctoral (Xm2017040) and the Funds for Innovative Research Groups of China (51321063).
Author Contributions
Jian Hao designed the experiments, improved the calculation method, did the space charge measurement and writing; Runhao Zou performed the space charge fitting; Ruijin Liao and Lijun Yang analyzed the data; Qiang Liao contributed discussion.
Conflicts of Interest
The authors declare no conflict of interest.
References
- Tang, C.; Huang, B.; Hao, M.; Xu, Z.; Hao, J.; Chen, G. Progress of space charge research on oil-paper insulation using pulsed electroacoustic techniques. Energies 2016, 9, 53. [Google Scholar] [CrossRef]
- Du, B.X.; Zhang, J.G.; Liu, D.S. Interface charge behavior of multi-layer oil paper insulation under DC and polarity reversal voltages. IEEE Trans. Dielectr. Electr. Insul. 2015, 22, 2628–2638. [Google Scholar] [CrossRef]
- Huang, B.; Hao, M.; Hao, J.; Fu, J.; Wang, Q.; Chen, G. Space charge characteristics in oil and oil-impregnated pressboard and electric field distortion after polarity reversal. IEEE Trans. Dielectr. Electr. Insul. 2016, 23, 881–891. [Google Scholar] [CrossRef]
- Ciobanu, R.; Schreiner, C.; Pfeiffer, W.; Baraboi, B. Space charge evolution in oil-paper insulation for DC cables application. In Proceedings of the IEEE International Conference on Dielectric Liquids, Graz, Austria, 12–12 July 2002; pp. 321–324. [Google Scholar]
- Hao, J.; Chen, G.; Liao, R.; Yang, L.; Tang, C. Influence of moisture on space charge dynamics in multilayer oil-paper insulation. IEEE Trans. Dielectr. Electr. Insul. 2012, 19, 1456–1464. [Google Scholar] [CrossRef]
- Space Charge. Available online: https://en.wikipedia.org/wiki/Space_charge (accessed on 16 October 2017).
- Raju, G.G. Dielectrics in Electric Fields; Marcel Dekker Inc.: Hoboken, NJ, USA, 2003. [Google Scholar]
- Wei, Y.H.; Mu, H.B.; Deng, J.B.; Zhang, G.J. Effect of space charge on breakdown characteristics of aged oil-paper insulation under dc voltage. IEEE Trans. Dielectr. Electr. Insul. 2016, 23, 3143–3150. [Google Scholar] [CrossRef]
- Wang, S.Q.; Zhang, G.J.; Mu, H.B.; Wang, D.; Lei, M.; Suwarno, S.; Tanaka, Y.; Takada, T. Effects of paper-aged state on space charge characteristics in oil-impregnated paper insulation. IEEE Trans. Dielectr. Electr. Insul. 2013, 19, 1871–1878. [Google Scholar] [CrossRef]
- Huang, M.; Zhou, Y.; Dai, C.; Chen, W.; Lu, L.; Sha, Y. Charge transport in thermally and electrically stressed oil-impregnated paper insulation. IEEE Trans. Dielectr. Electr. Insul. 2016, 23, 266–274. [Google Scholar] [CrossRef]
- Eager, G.S.; Bader, G.; Garcia, F.G. Influence of space charges on the breakdown of oil-paper insulation. In Proceedings of the IEEE Conference on Electrical Insulation & Dielectric Phenomena, Pocono Manor, PA, USA, 18–20 September 1967; IEEE: Piscataway, NJ, USA, 2016; pp. 166–172. [Google Scholar]
- Zhou, Y.X.; Huang, M.; Chen, W.J.; Jin, F.B. Space charge behavior of oil-paper insulation thermally aged under different temperatures and moistures. J. Electr. Eng. Technol. 2015, 10, 1124–1130. [Google Scholar] [CrossRef]
- Tang, C.; Chen, G.; Fu, M.; Liao, R.J. Space charge behavior in multi-layer oil-paper insulation under different dc voltages and temperatures. IEEE Trans. Dielectr. Electr. Insul. 2010, 17, 775–784. [Google Scholar] [CrossRef]
- Zhou, Y.; Wang, Y.; Li, G.; Wang, N.; Liu, Y.; Li, B.; Li, P.; Cheng, H. Space charge phenomena in oil-paper insulation materials under high voltage direct current. J. Electrostat. 2009, 67, 417–421. [Google Scholar] [CrossRef]
- Du, B.X.; Zhang, J.G. Charge coupling behavior of double-layer oil-paper insulation under dc and pulse voltages. IEEE Trans Dielectr. Electr. Insul. 2016, 23, 1–9. [Google Scholar] [CrossRef]
- Chen, G.; Xu, Z. Charge trapping and detrapping in polymeric materials. J. Appl. Phys. 2009, 106, 123707. [Google Scholar] [CrossRef]
- Liu, N.; Zhou, C.; Chen, G.; Xu, Y.; Cao, J.; Wang, H. Model to estimate the trapping parameters of cross-linked polyethylene cable peelings of different service years and their relationships with dc breakdown strengths. High Volt. 2016, 1, 95–105. [Google Scholar] [CrossRef]
- Liu, N.; Chen, G. Changes in charge trapping/detrapping in polymeric materials and its relation with ageing. In Proceedings of the IEEE Conference on Electrical Insulation and Dielectric Phenomena, Shenzhen, China, 20–23 October 2013; pp. 800–803. [Google Scholar]
- Wei, Y.; Chen, G.; Zhang, G.J.; Liu, N.; Li, G. Trap characterization in composite of solid-liquid using dual-level trap model and TSDC method. AIP Adv. 2016, 6, 075120. [Google Scholar] [CrossRef]
- Dissado, L.A.; Fothergill, J.C. Electrical Degradation and Breakdown in Polymers; The Institution of Engineering and Technology: London, UK, 1992; Volume 9, p. 620. [Google Scholar]
- Meunier, M.; Quirke, N.; Aslanides, A. Molecular modeling of electron traps in polymer insulators: Chemical defects and impurities. J. Chem. Phys. 2001, 115, 2876–2881. [Google Scholar] [CrossRef]
- Zhang, G.J.; Shen, W.W.; Mu, H.B.; Deng, J.B. Surface trapping parameters of solid dielectrics: Novel measurement method and insulation condition characterization. In Proceedings of the International Conference on Condition Monitoring and Diagnosis, Bali, Indonesia, 23–27 September 2012; pp. 480–484. [Google Scholar]
- Yang, C.; Zhang, Y.; He, L.; Xue, Y.; Tian, F.; Jiang, X.; Lei, Q. Study on the trap distribution in polyimide thin film based on TSDC method. In Proceedings of the IEEE International Conference on the Properties and Applications of Dielectric Materials, Harbin, China, 19–23 July 2009; pp. 911–913. [Google Scholar]
- Tang, C.; Liao, R.; Chen, G.; Yang, L. Research on the feature extraction of DC space charge behavior of oil-paper insulation. Sci. China Technol. Sci. 2011, 54, 1315–1324. [Google Scholar] [CrossRef]
- Hao, M.; Zhou, Y.; Chen, G.; Wilson, G.; Jarman, P. Space charge behavior in oil gap and impregnated pressboard combined system under HVDC stresses. IEEE Trans. Dielectr. Electr. Insul. 2016, 23, 848–858. [Google Scholar] [CrossRef]
- Kostoski, D.; Dojčilović, J.; Novaković, L.; Suljovrujić, E. Effects of charge trapping in gamma irradiated and accelerated aged low-density polyethylene. Polym. Degrad. Stab. 2006, 91, 2229–2232. [Google Scholar] [CrossRef]
- Li, G.; Li, S.; Min, D.; Zhao, N.; Zhu, Y. Influence of trap depths on space charge formation and accumulation characteristics in low density polyethylene. In Proceedings of the IEEE International Conference on Solid Dielectrics, Bologna, Italy, 30 June–4 July 2013; pp. 698–701. [Google Scholar]
- Ding, H.Z.; Wang, Z.D. Kinetic analysis and modelling of the ageing process for Kraft paper aged in natural ester dielectric fluid. In Proceedings of the IEEE Conference on Electrical Insulation and Dielectric Phenomena, Kansas City, MO, USA, 15–18 October 2006; pp. 505–508. [Google Scholar]
- Institute of Electrical and Electronics Engineers. IEEE Guide for Loading Mineral Oil Immersed Transformers; Institute of Electrical and Electronics Engineers: New York, NY, USA, 1996. [Google Scholar]
- Lundgaard, L.E.; Hansen, W.; Linhjell, D.; Painter, T.J. Ageing of oil-impregnated paper in power transformers. IEEE Trans. Power Deliv. 2004, 19, 230–239. [Google Scholar] [CrossRef]
- Hao, J.; Tang, C.; Chen, G.; Liao, R. Effect of thermally aged oil on space charge dynamics in oil/paper insulation system. IEEJ Trans. Electr. Electr. Eng. 2011, 10, 1–9. [Google Scholar]
- Williams, C.K. Kinetics of trapping, detrapping, and trap generation. J. Electr. Mater. 1992, 21, 711–720. [Google Scholar] [CrossRef]
- Marsacq, D.; Hourquebie, P.; Olmedo, L.; Janah, H. Effects of physical and chemical defects of polyethylene on space charge behavior. In Proceedings of the IEEE Conference on Electrical Insulation and Dielectric Phenomena, Virginia Beach, VA, USA, 22–25 October 1995; pp. 672–675. [Google Scholar]
- Zhou, T.C.; Chen, G.; Liao, R.J.; Xu, Z. Charge trapping and detrapping in polymeric materials: Trapping parameters. J. Appl. Phys. 2011, 110, 043724. [Google Scholar] [CrossRef]
- Pukel, G.J.; Schwarz, R.; Schatzl, F.; Baumann, F.; Gerstl, A. Environmental friendly insulationg liquids-A challenge for power transformers. In Proceedings of the Cigré 2009 6th Southern Africa Regional Conference, Cape Town, South Africa, 17–21 August 2009; p. 510. [Google Scholar]
- Sanghi, R. Chemistry behind the life of a transformer. Resonance 2003, 8, 17–23. [Google Scholar] [CrossRef]
- Chen, C.Z. Insulation Oil and Its Operation Property; Industry of Mechanical Press: Beijing, China, 1975. [Google Scholar]
- Hao, M.; Zhou, Y.; Chen, G.; Wilson, G.; Jarman, P. Space charge behavior in thick oil-impregnated pressboard under HVDC stresses. IEEE Trans. Dielectr. Electr. Insul. 2015, 22, 72–80. [Google Scholar] [CrossRef]
Figure 1.
Pulsed electroacoustic (PEA) measurement principle and the measured sample. (a) PEA method principle; (b) sample arrangement.
Figure 1.
Pulsed electroacoustic (PEA) measurement principle and the measured sample. (a) PEA method principle; (b) sample arrangement.
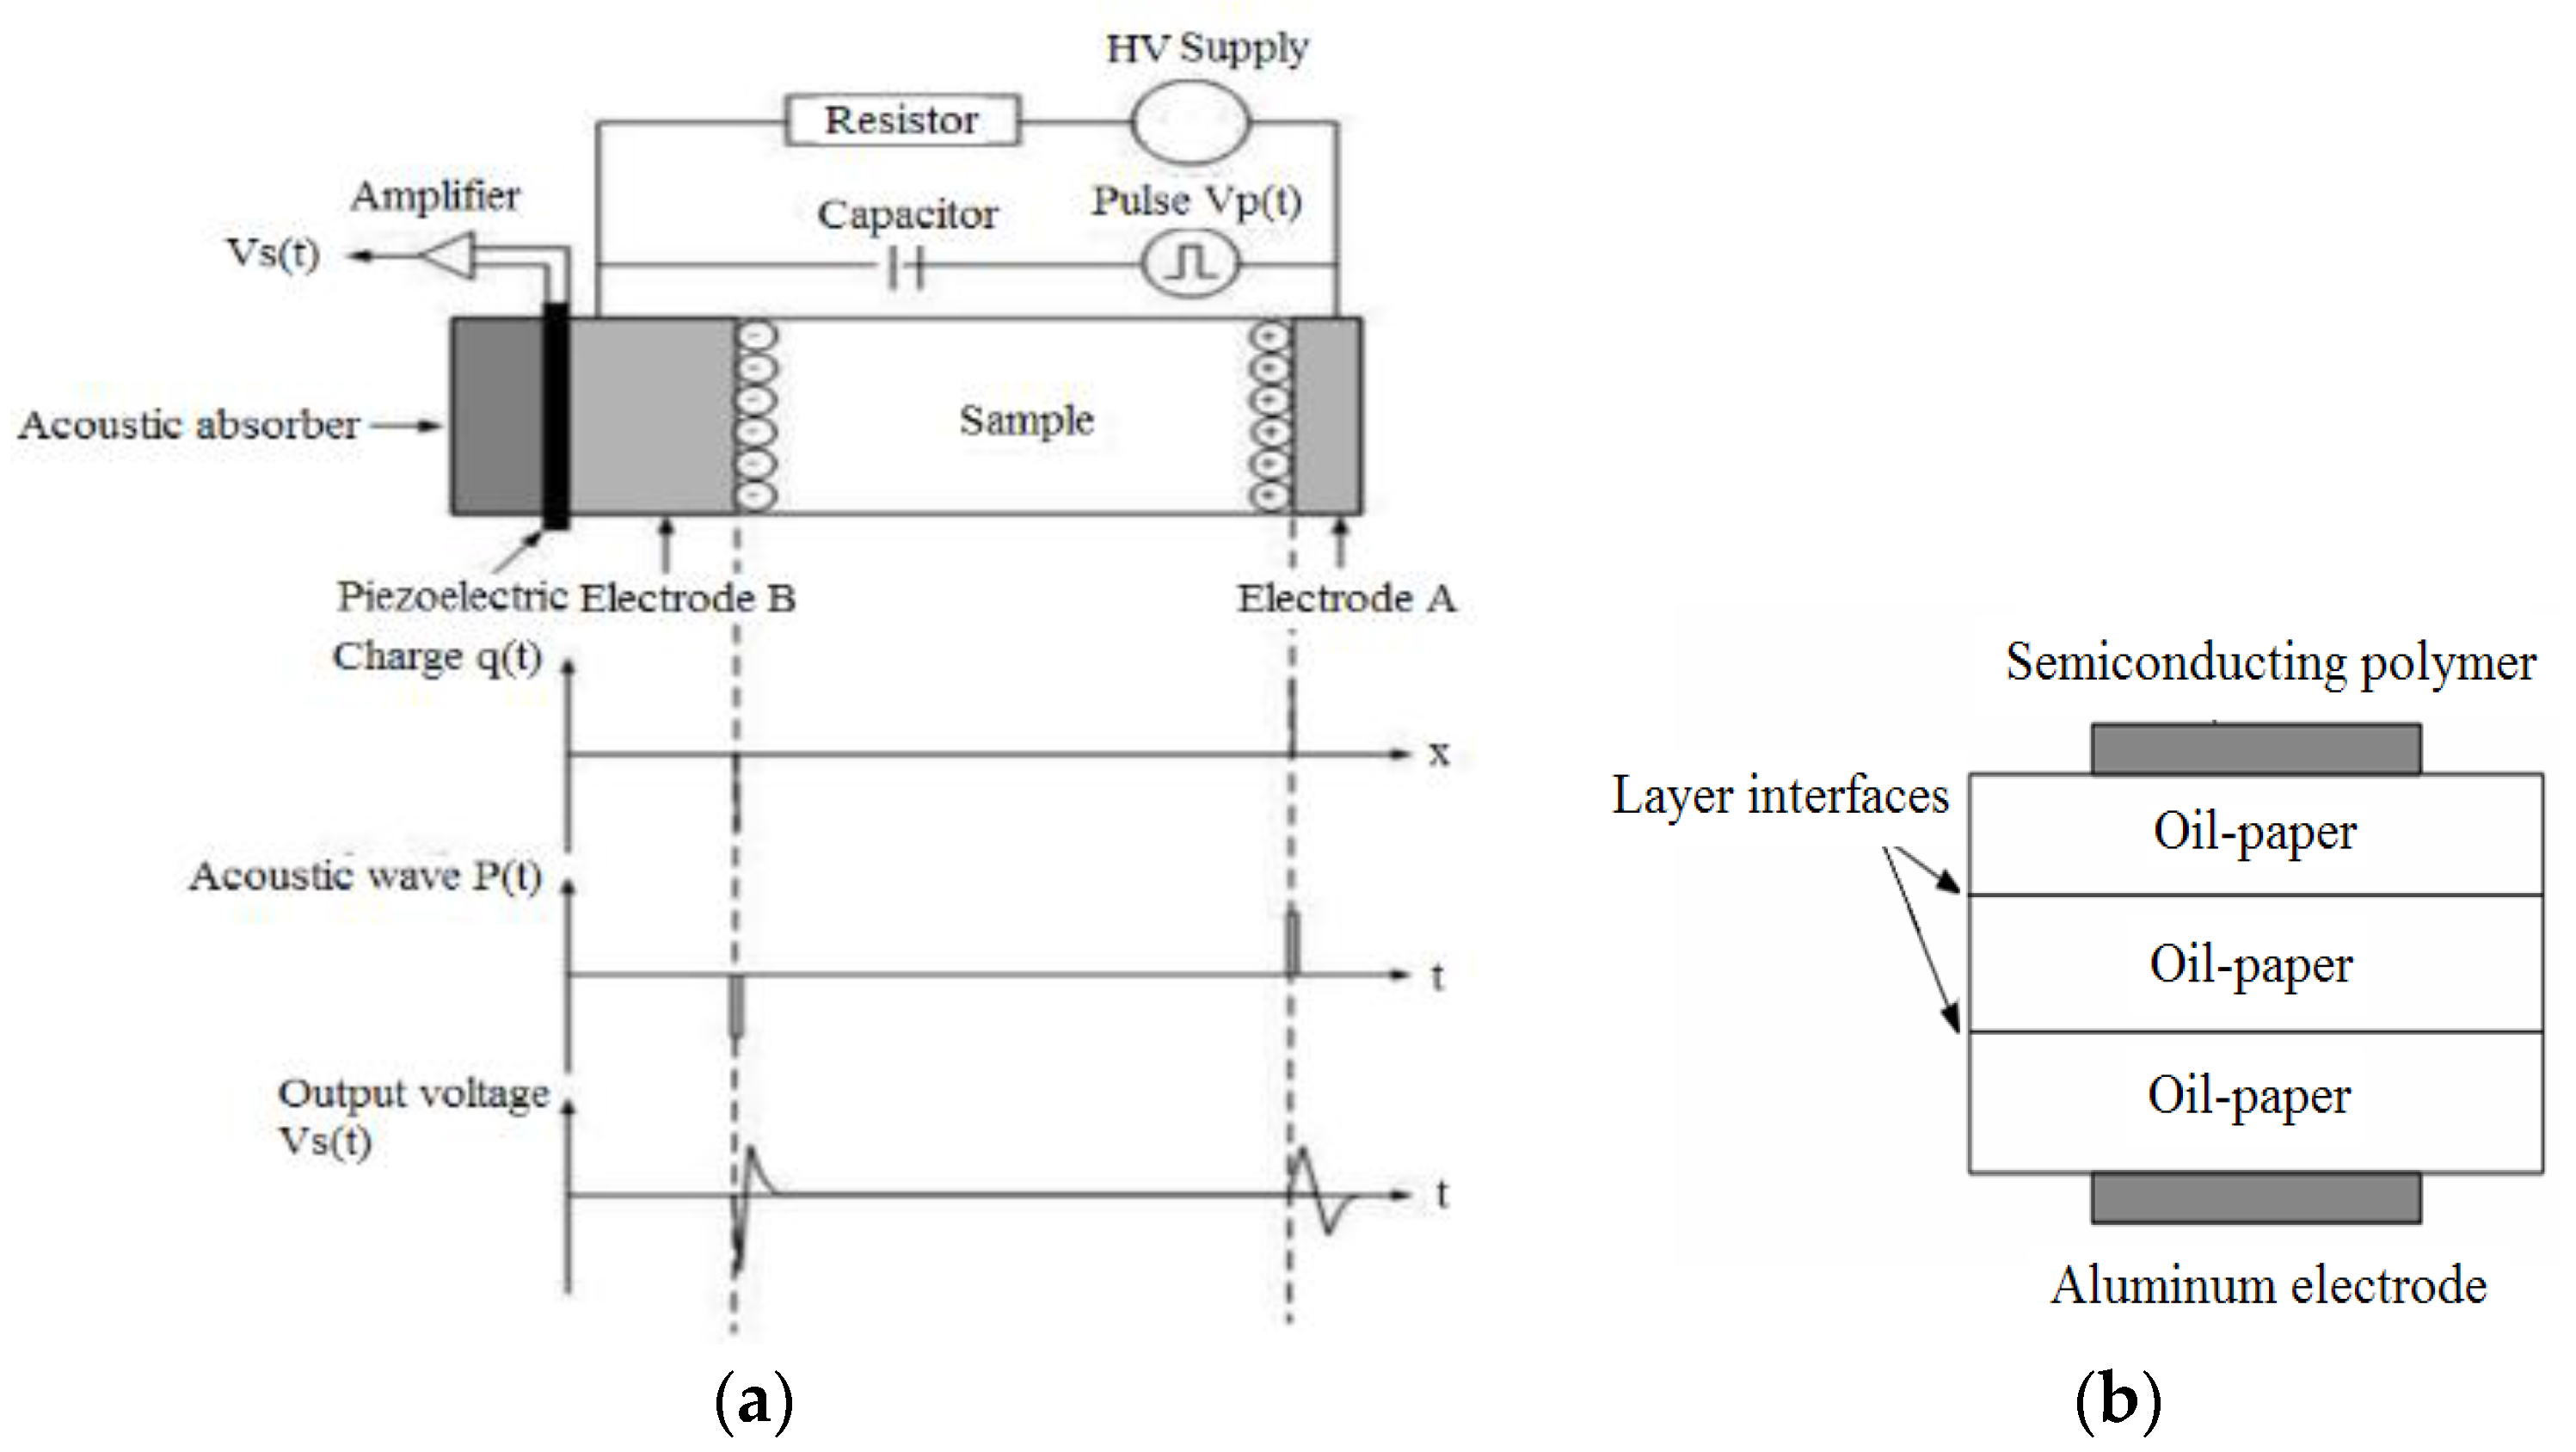
Figure 2.
Space charges trapped in the oil impregnated insulation paper with new and aged oil under DC 20 kV/mm, 30 kV/mm, and 40 kV/mm. (a) sample with new oil (20 kV/mm); (b) sample with new oil (30 kV/mm); (c) sample with new oil (40 kV/mm); (d) sample with aged oil (20 kV/mm); (e) sample with aged oil (30 kV/mm); (f) sample with aged oil (40 kV/mm).
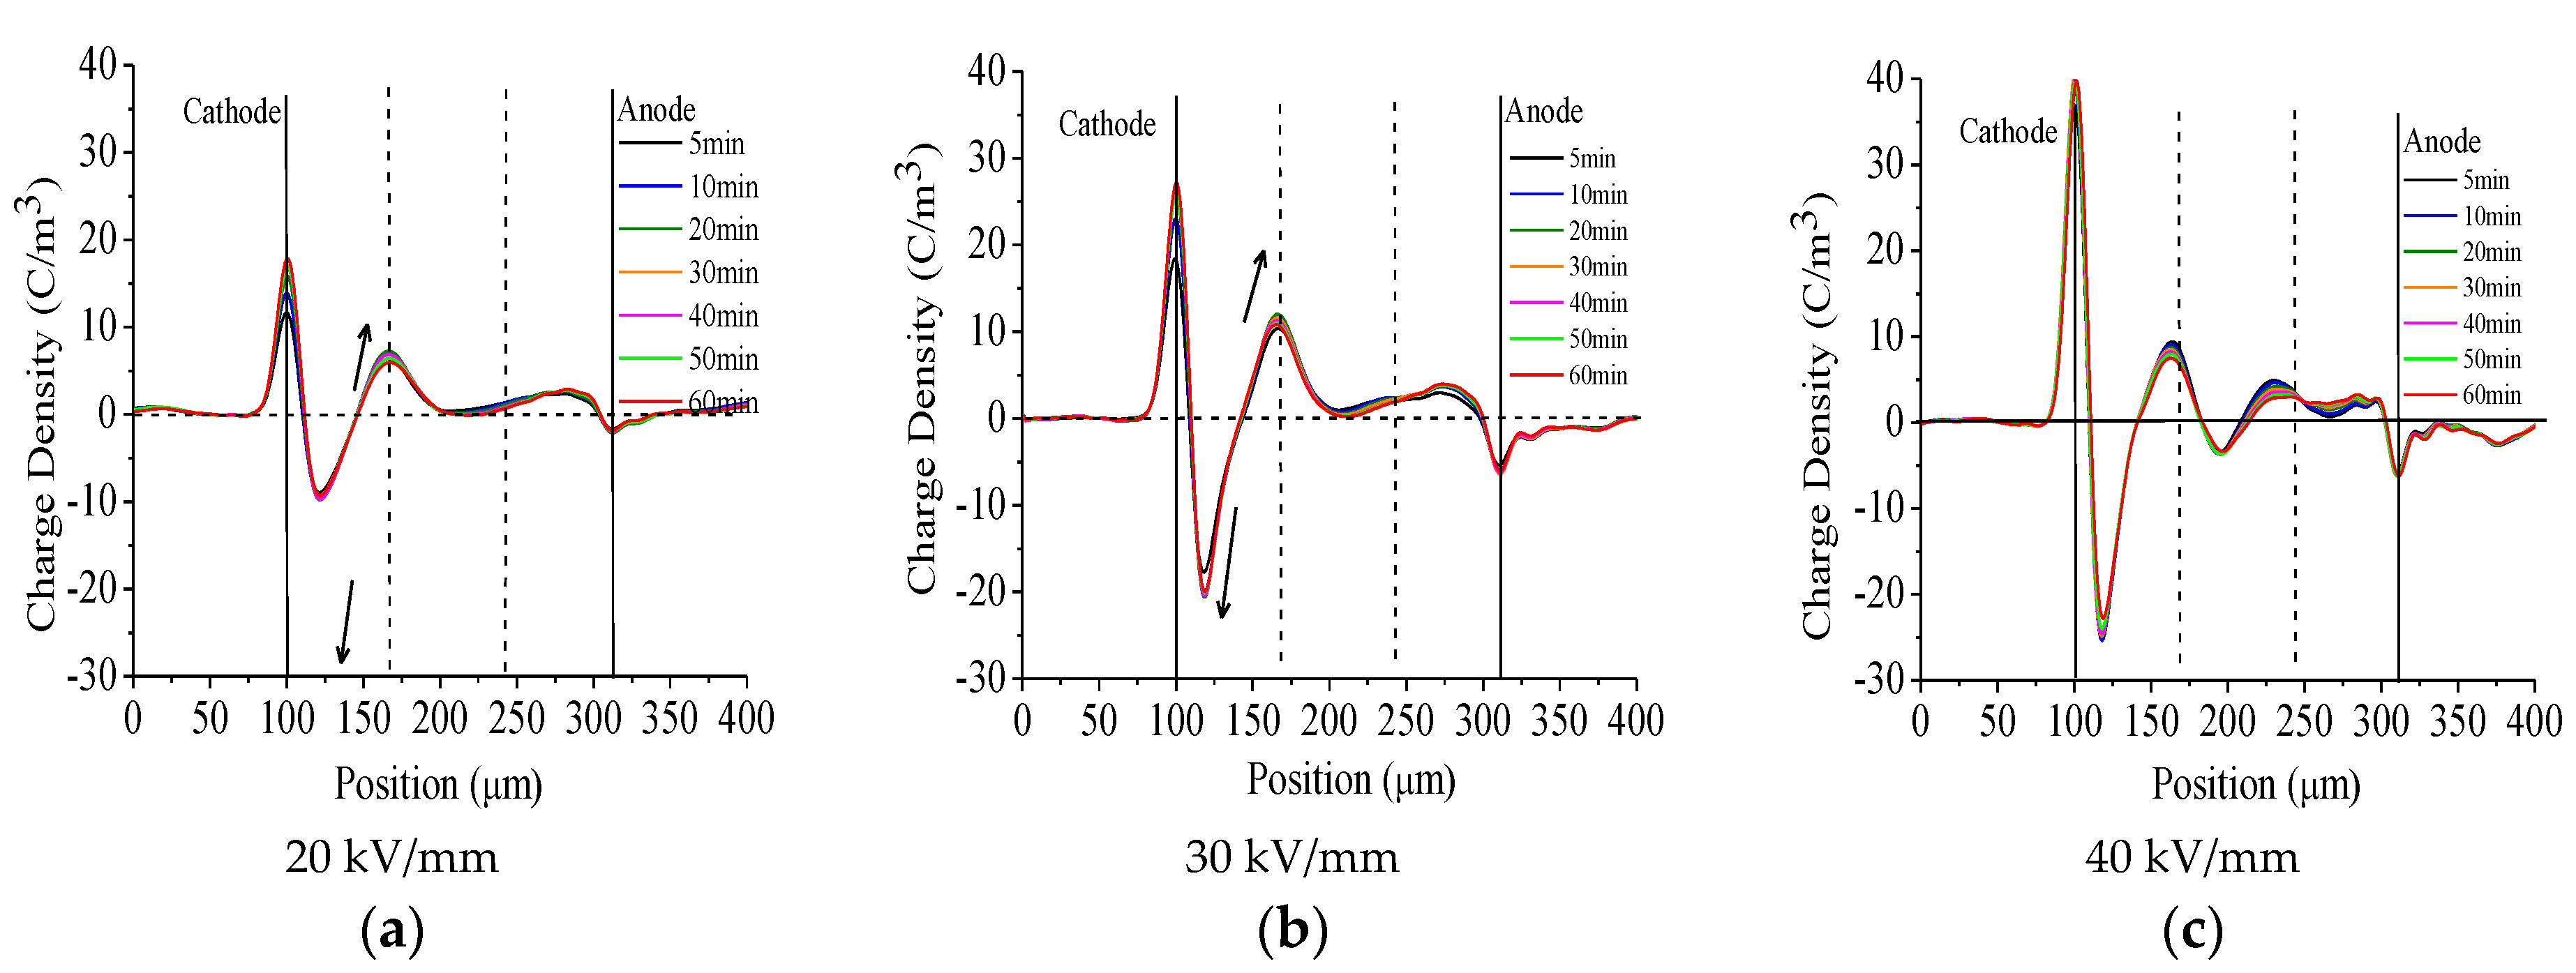

Figure 3.
Trapped charges amount in the sample with new and aged oil under volt-off condition. (a) charges amount in sample with new oil; (b) charges amount in sample with aged oil.
Figure 3.
Trapped charges amount in the sample with new and aged oil under volt-off condition. (a) charges amount in sample with new oil; (b) charges amount in sample with aged oil.

Figure 4.
Space charge detrapping process for insulation paper immersed with new and aged oil under DC 20 kV/mm, 30 kV/mm, and 40 kV/mm. (a) space charge detrapping process for insulation paper immersed with new oil (20 kV/mm); (b) space charge detrapping process for insulation paper immersed with new oil (30 kV/mm); (c) space charge detrapping process for insulation paper immersed with new oil (40 kV/mm); (d) space charge detrapping process for insulation paper immersed with aged oil (20 kV/mm); (e) space charge detrapping process for insulation paper immersed with aged oil (30 kV/mm); (f) space charge detrapping process for insulation paper immersed with aged oil (40 kV/mm).

Figure 5.
Charge detrapping process in oil impregnated insulation paper with new and aged oil after being applied DC electrical field 20 kV/mm, 30 kV/mm, and 40 kV/mm for 1 h. (a) sample with new oil; (b) sample with aged oil.
Figure 5.
Charge detrapping process in oil impregnated insulation paper with new and aged oil after being applied DC electrical field 20 kV/mm, 30 kV/mm, and 40 kV/mm for 1 h. (a) sample with new oil; (b) sample with aged oil.

Figure 6.
Trap distribution calculation based on the charge decay process.
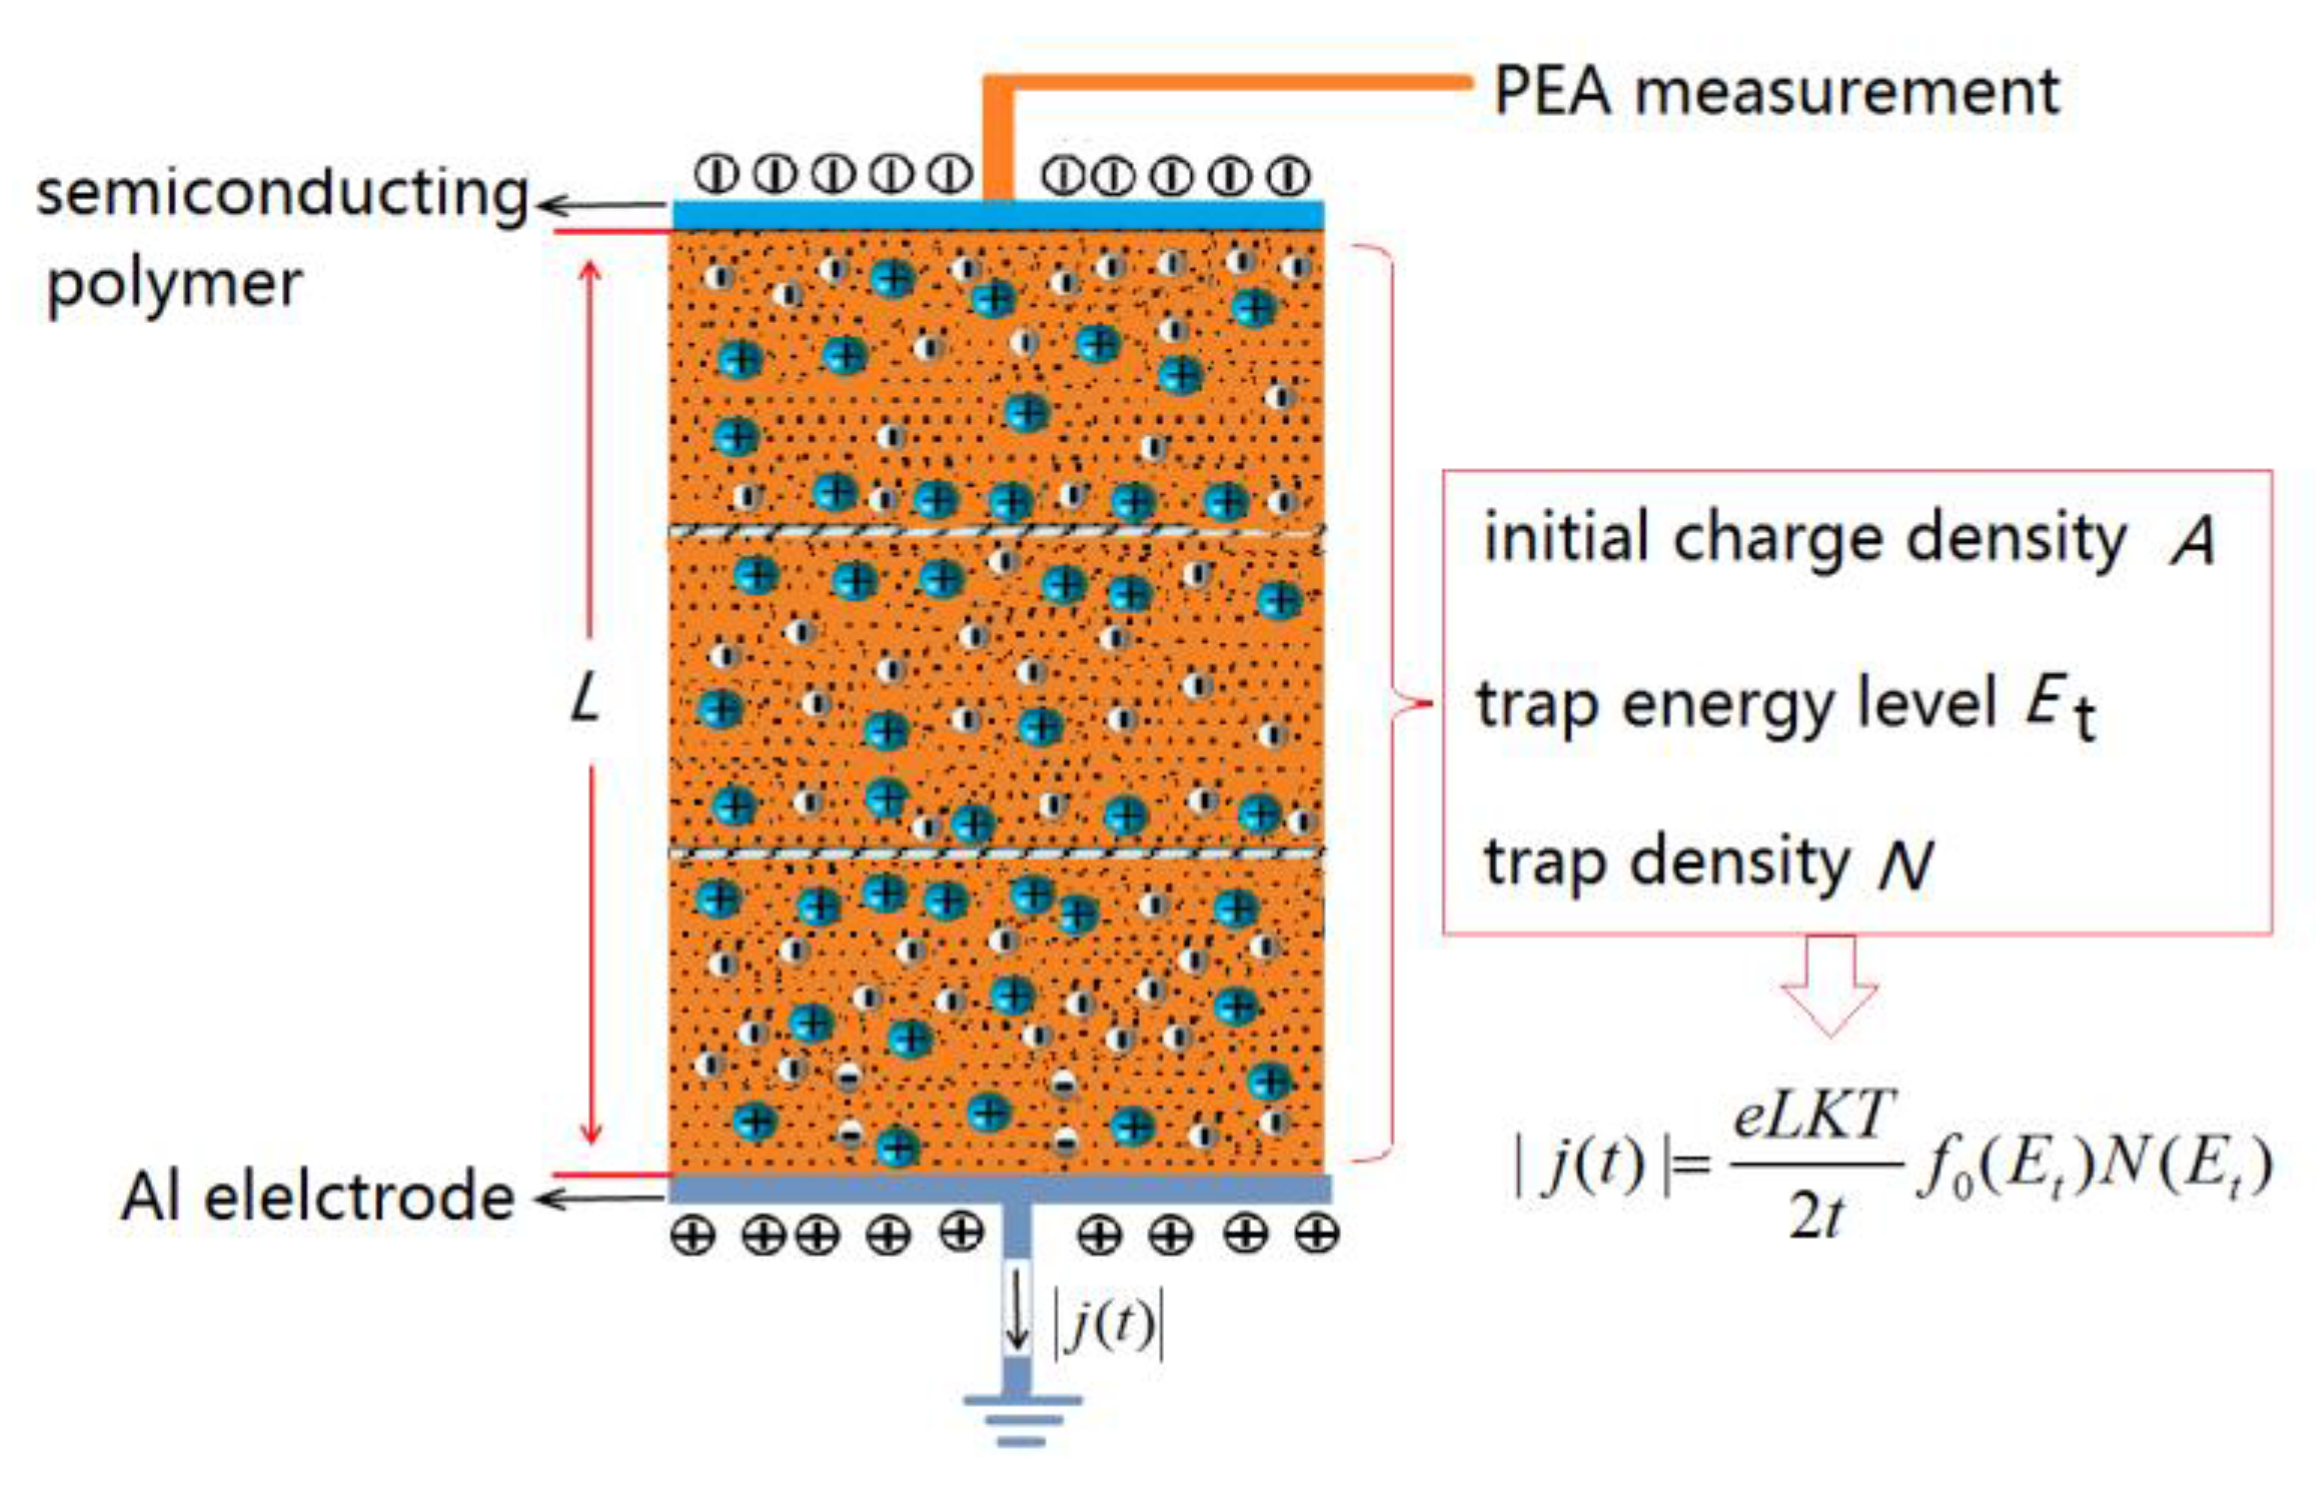
Figure 7.
Common and improved method for fitting analysis of charge detrapping for oil impregnated insulation paper with new oil and aged oil being applied DC electrical field 20 kV/mm, 30 kV/mm, and 40 kV/mm for 1 h. (a) common method: sample with new oil; (b) improved method: sample with new oil; (c) common method: sample with aged oil; (d) improved method: sample with aged oil.
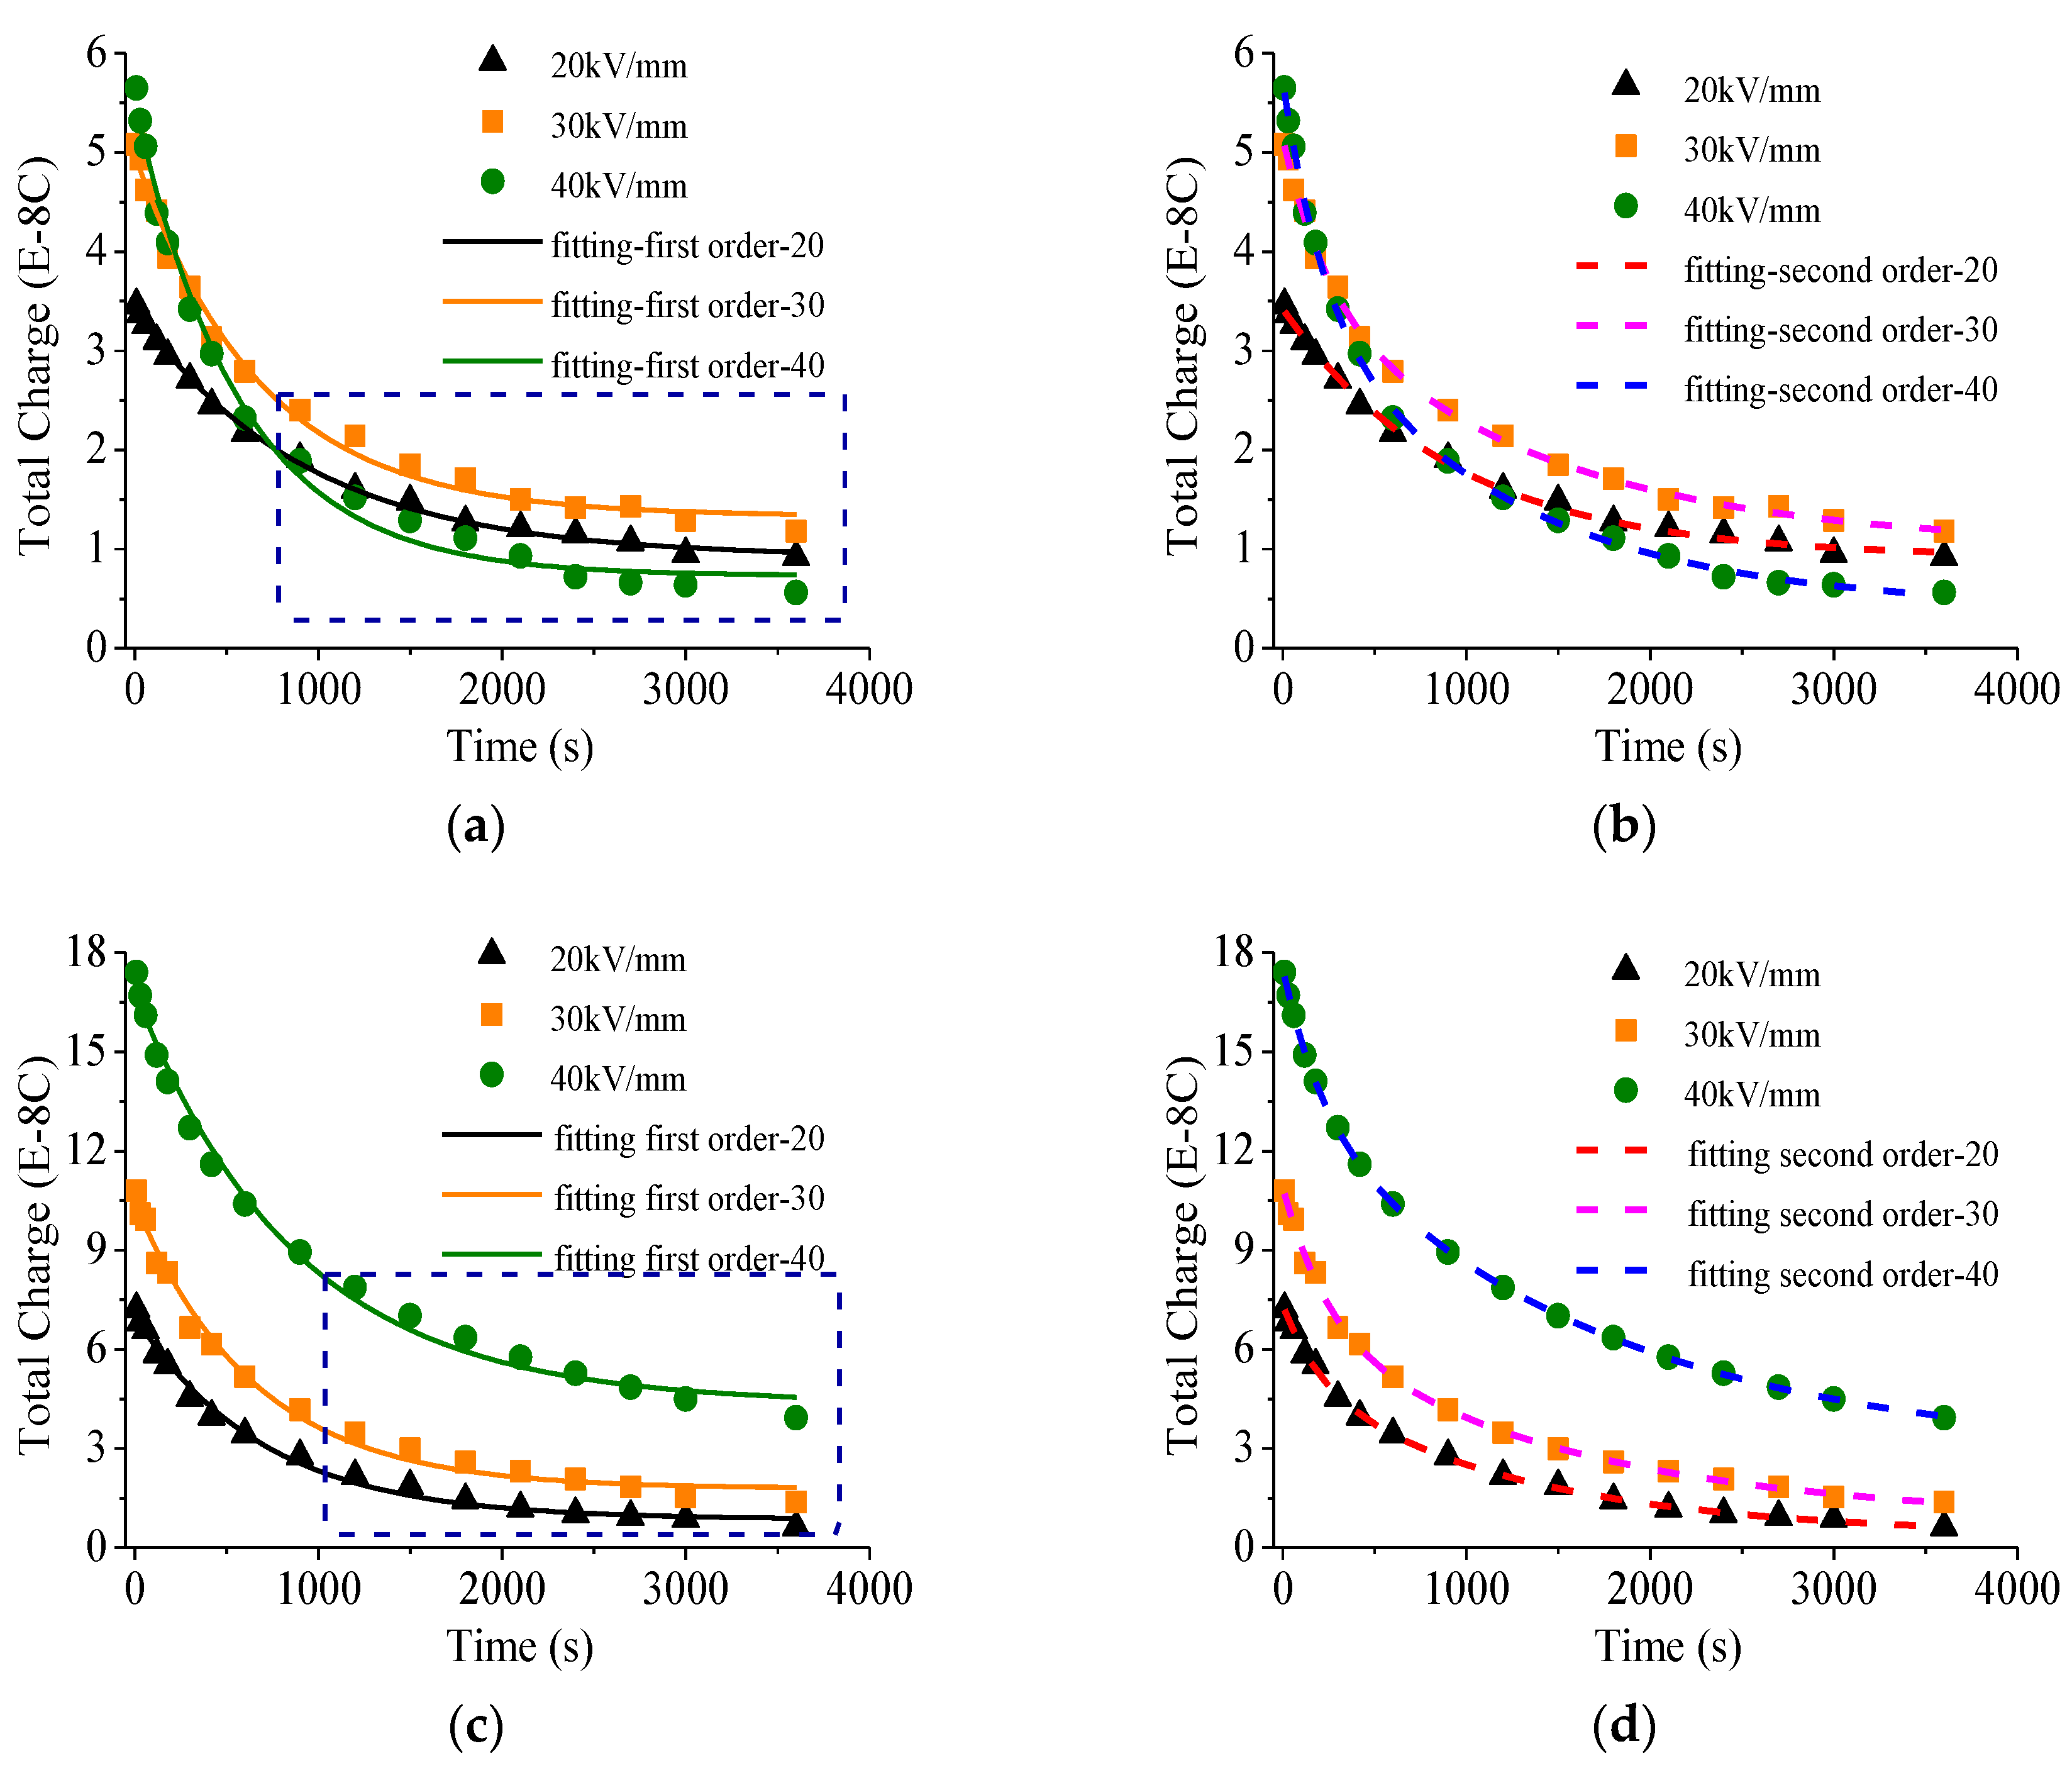
Figure 8.
Calculation result of trap distribution by using the common method and the improved method for oil impregnated insulation paper with new oil and aged oil. (a) common method: sample with new oil; (b) improved method: sample with new oil; (c) common method: sample with aged oil; (d) improved method: sample with aged oil.

Figure 9.
Charges decay and trap distribution analysis for the fresh and aged oil impregnated insulation pressboard sample applied negative 25 kV/mm voltage for 4 h (charges data was derived from [38]). (a) common method: charge decay analysis; (b) new method: charge decay analysis; (c) common method: charge decay analysis; (d) new method: charge decay analysis.

Figure 10.
Charges decay analysis for the low density polyethylene (LDPE) sample applied 4 kV for 10 min (charges data was derived from [16]).
Figure 10.
Charges decay analysis for the low density polyethylene (LDPE) sample applied 4 kV for 10 min (charges data was derived from [16]).

Figure 11.
Trap density changing with electric field strength for the sample with new and aged oil. (a) common method; (b) improved method.
Figure 11.
Trap density changing with electric field strength for the sample with new and aged oil. (a) common method; (b) improved method.

Figure 12.
Relationship between the trapped charges amount and the total energy filled by the traps obtained by common method and the improved method. (a) common method; (b) improved method.
Figure 12.
Relationship between the trapped charges amount and the total energy filled by the traps obtained by common method and the improved method. (a) common method; (b) improved method.

Table 1.
The calculation equation of the trap distribution using common method and the improved method.
Table 1.
The calculation equation of the trap distribution using common method and the improved method.
| Common Method: First Order Exponential Fitting Analysis | Improved Method: Double Exponential Fitting Analysis |
|---|---|
| σfast and σslow: equivalent surface fast and slow charge density; Afast and Aslow: initial surface fast and slow charge density. | |
| |jfast(t)| and |jslow(t)|: the current density of the fast and slow charges. τfast and τslow is the time constant of fast charge and slow decay. | |
| , and is the trap energy level of fast and slow charges. | |
| f0() and f0() represents the original occupation rate of shallow and deep traps inside the dielectrics, both are 1/2. | |
| , and are all constant. | |
| , and are all constant. | |
| , N(): the density of trap energy level for fast charges; N(): the density of trap energy level for slow charges. |
Table 2.
The charge detrapping expression based on the first order exponential fitting analysis for oil impregnated insulation paper with new and aged oil.
Table 2.
The charge detrapping expression based on the first order exponential fitting analysis for oil impregnated insulation paper with new and aged oil.
| E(kV/mm) | Fitting Equation Q0(t) (10−8 C) | τ (s) | R2 |
|---|---|---|---|
| new oil | |||
| 20 | Q0(t) = 0.92 + 2.51 × exp(−t/922.66) | 922.66 | 0.99 |
| 30 | Q0(t) = 1.33 + 3.65 × exp(−t/683.25) | 683.25 | 0.99 |
| 40 | Q0(t) = 0.73 + 4.76 × exp(−t/577.41) | 577.41 | 0.99 |
| aged oil | |||
| 20 | Q22(t) = 0.86 + 6.15 × exp(−t/698.58) | 398.58 | 0.99 |
| 30 | Q22(t) = 1.79 + 8.68 × exp(−t/647.85) | 647.85 | 0.99 |
| 40 | Q22(t) = 4.35 + 12.48 × exp(−t/873.15) | 873.15 | 0.99 |
Table 3.
The charge detrapping expression based on the double order exponential fitting analysis for oil impregnated insulation paper with new and aged oil.
Table 3.
The charge detrapping expression based on the double order exponential fitting analysis for oil impregnated insulation paper with new and aged oil.
| E(kV/mm) | Fitting Equation Q0(t) (10−8 C) | τfast | τslow | R2 |
|---|---|---|---|---|
| new oil | ||||
| 20 | Q0(t) = 1.25 × exp(−t/922.66) + 1.25 × exp(−t/922.66) + 0.92 | 922.66 | 922.66 | 1.00 |
| 30 | Q0(t) = 1.48 × exp(−t/233.89) + 2.65 × exp(−t/1312.75) + 1.02 | 233.89 | 1312.75 | 1.00 |
| 40 | Q0(t) = 2.15 × exp(−t/214.54) + 3.19 × exp(−t/1157.06) + 0.39 | 214.54 | 1157.06 | 1.00 |
| aged oil | ||||
| 20 | Q0(t) = 2.18 × exp(−t/198.20) + 4.77 × exp(−t/1228.10) + 0.39 | 198.20 | 1228.10 | 1.00 |
| 30 | Q0(t) = 4.14 × exp(−t/214.80) + 5.94 × exp(−t/1493.10) + 0.83 | 214.80 | 1493.10 | 1.00 |
| 40 | Q0(t) = 4.10 × exp(−t/210.00) + 10.63 × exp(−t/1628.40) + 0.92 | 210.00 | 1628.40 | 1.00 |
Table 4.
The charge detrapping expression for the fresh and aged oil impregnated insulation pressboard sample applied negative 25 kV/mm voltage for 4 h (charges data was derived from [38]).
Table 4.
The charge detrapping expression for the fresh and aged oil impregnated insulation pressboard sample applied negative 25 kV/mm voltage for 4 h (charges data was derived from [38]).
| Common Method | Fitting Equation Q0(t) (10−8 C)) | τ (s) | R2 | |
| fresh pressboard | Q0(t) = 0.74 + 0.93 × exp(−t/2946) | 2946 | 0.91 | |
| aged pressboard | Q0(t) = 1.05 + 3.24 × exp(−t/222.2) | 222.2 | 0.95 | |
| New Method | Fitting Equation Q0(t) (10−8 C) | τfast | τslow | R2 |
| fresh pressboard | Q0(t) = 0.34 × exp(−t/93.1) − 0.47 × exp(t/4660) + 1.99 | 93.1 | 4660 | 0.98 |
| aged pressboard | Q0(t) = 6.05 × exp(−t/19.4) + 2.16 × exp(−t/437.1) + 0.94 | 19.4 | 437.1 | 0.99 |
© 2018 by the authors. Licensee MDPI, Basel, Switzerland. This article is an open access article distributed under the terms and conditions of the Creative Commons Attribution (CC BY) license (http://creativecommons.org/licenses/by/4.0/).
Share and Cite
MDPI and ACS Style
Hao, J.; Zou, R.; Liao, R.; Yang, L.; Liao, Q. New Method for Shallow and Deep Trap Distribution Analysis in Oil Impregnated Insulation Paper Based on the Space Charge Detrapping. Energies 2018, 11, 271. https://doi.org/10.3390/en11020271
AMA Style
Hao J, Zou R, Liao R, Yang L, Liao Q. New Method for Shallow and Deep Trap Distribution Analysis in Oil Impregnated Insulation Paper Based on the Space Charge Detrapping. Energies. 2018; 11(2):271. https://doi.org/10.3390/en11020271
Chicago/Turabian StyleHao, Jian, Runhao Zou, Ruijin Liao, Lijun Yang, and Qiang Liao. 2018. "New Method for Shallow and Deep Trap Distribution Analysis in Oil Impregnated Insulation Paper Based on the Space Charge Detrapping" Energies 11, no. 2: 271. https://doi.org/10.3390/en11020271
Note that from the first issue of 2016, this journal uses article numbers instead of page numbers. See further details here.