Wind Power Monitoring and Control Based on Synchrophasor Measurement Data Mining


1
Manufacturing and Construction, Dalekovod JSC for Engineering, Zagreb 10000, Croatia
2
Faculty of Electrical Engineering and Computing, University of Zagreb, Zagreb 10000, Croatia
*
Author to whom correspondence should be addressed.
Energies 2018, 11(12), 3525; https://doi.org/10.3390/en11123525
Submission received: 31 October 2018
/
Revised: 2 December 2018
/
Accepted: 12 December 2018
/
Published: 18 December 2018
(This article belongs to the Special Issue Methods and Concepts for Designing and Validating Smart Grid Systems)
Abstract
:More and more countries and utilities are trying to develop smart grid projects to make transformation of their power infrastructure towards future grids with increased share of renewable energy production and near zero emissions. The intermittent nature of solar and wind power can in general cause large problems for power system control. Parallel to this process, the aging of existing infrastructure also imposes requirements to utility budgets in the form of a need for large capital investments in reconstruction or maintenance of key equipment. Synchrophasor and other synchronized measurement technologies are setting themselves as one of the solutions for larger wind power integration. With that aim, in this paper one possible solution for wind power control through data mining algorithms used on a large quantity of data gathered from phasor measurement units (PMU) is described. Developed model and algorithm are tested on an IEEE 14 bus test system as well as on real measurements made on wind power plants currently in operation. One such wind power plant is connected to the distribution grid and the other one to the transmission grid. Results are analyzed and compared.
1. Introduction
Many utilities are facing new challenges when trying to develop various kinds of smart grid projects in order to make transformation towards smarter and more sensible [1,2] power grids and utilities. This demanding task becomes even more complex when utilities are facing the aging of existing infrastructure which makes huge demands to public budgets regarding the need for large CAPEX (capital expenditure) amounts in reconstruction and upgrades of power system infrastructure [3,4,5]. The ageing problems combined can cause severe faults extending along the grid and to cope with the fact that new ways of power system monitoring and control are required [2].
Phasor measurement units (PMU) have already been defined as suitable for many applications of larger renewable energy integration [2,6]. Furthermore, latest developments in the information and telecommunication technologies (ICT) industry creates large possibilities in the areas of data transmission, sensor measurements, energy savings, asset management etc. [7,8] and that provides new opportunities for finding better solutions.
Probably the most suitable installation that imposes itself as an upgrade of the existing system is the usage of simple intelligent electronic devices (IEDs) [9,10]. Together with the increase of the renewable energy share that requires new paradigms and market designs [11], there is also an increasing need for improved monitoring and control possibilities in power systems. Also, operators have a great need for early warning in critical transition situations [12].
In this paper, one possible application for wind power monitoring and control is described which integrates several of these additional services as an example. This kind of project can easily be upgraded, scaled and multiplied for application in the other utilities and transmission systems.
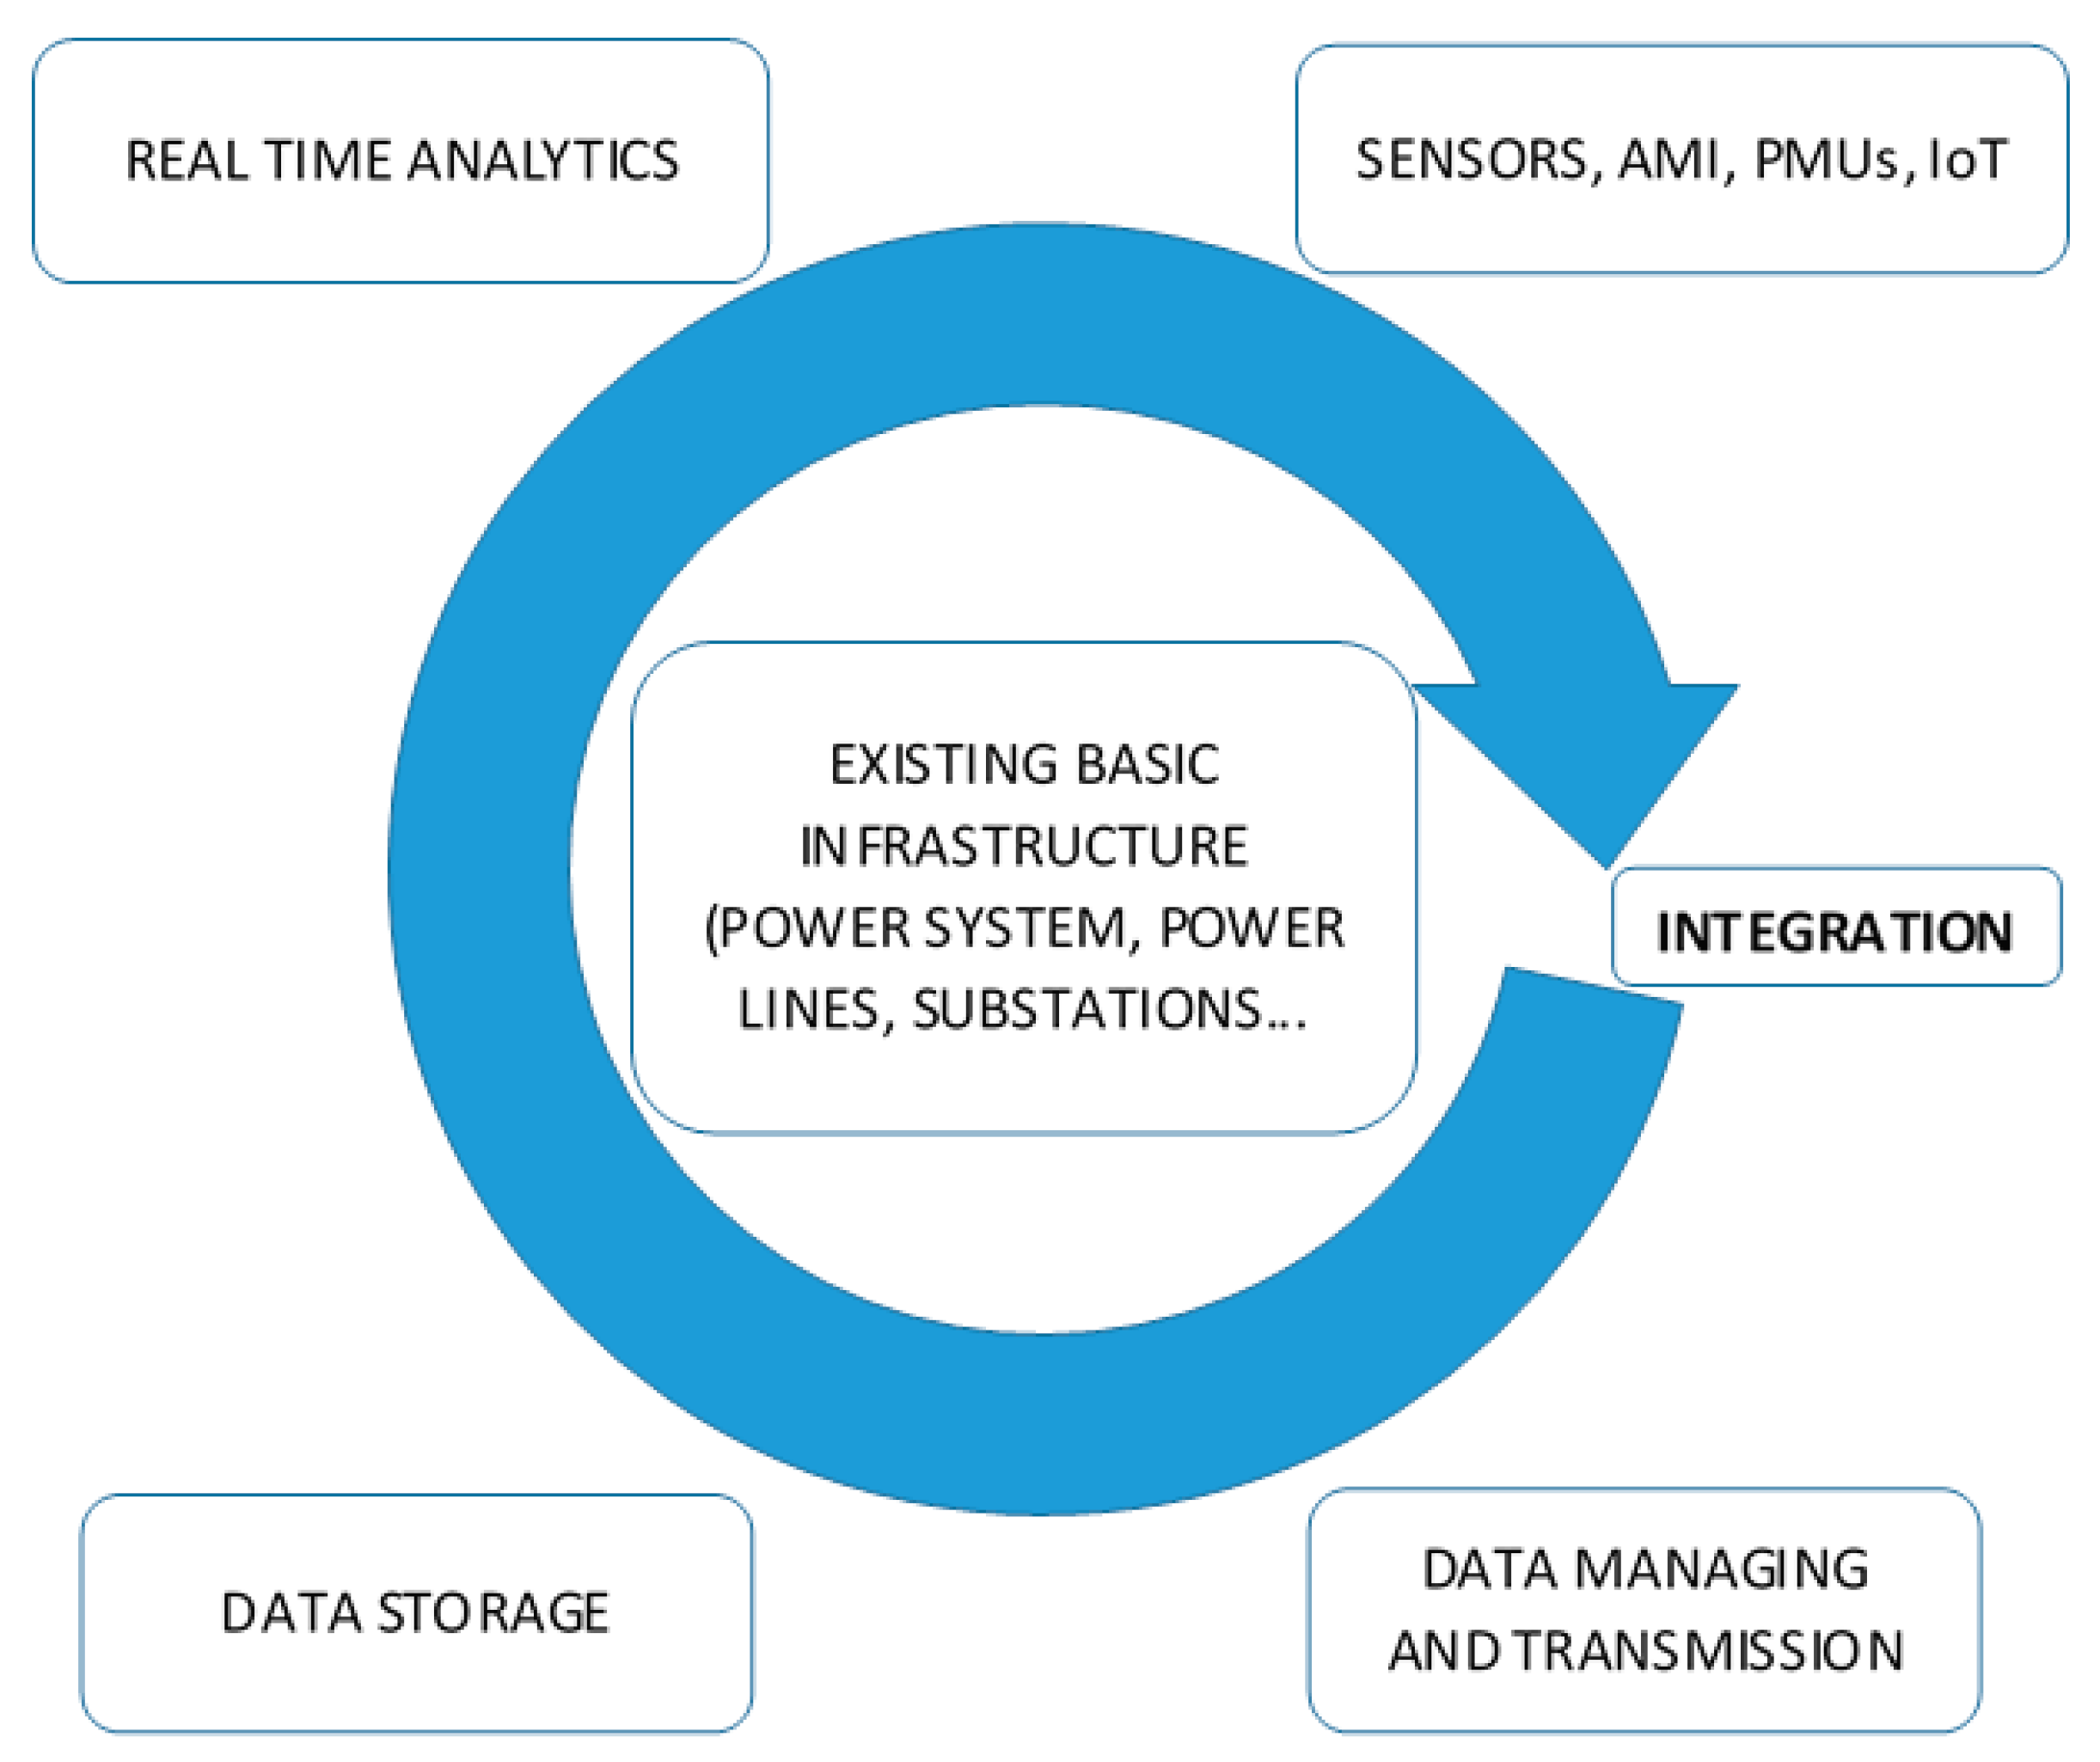
The paper is structured as follows: Section 1 gives an overview and introduction to basic concepts, Section 2 describes the developed big data algorithm and Section 3 depicts test case results. Section 4 and Section 5 describe the real system results and provide specifics for different network designs while Section 6 concludes the work and provides guidelines for future work. Fundamental system framework is structured in a way that the integration of additional modules can be arranged around existing basic infrastructure like energy distribution grid, transmission power lines, substations etc. Main groups of additional modules are shown on figure below (Figure 1).
Figure 1 depicts the importance of the integration of all components. Having such a vital role in the whole process the experts working in the field will be required to have a broader insight and understanding of the that process in order to successfully integrate all new technologies. Fundamental basic system architecture is defined as a set of nodes around telecom backbone sending crucial data of the system operation to corresponding servers.
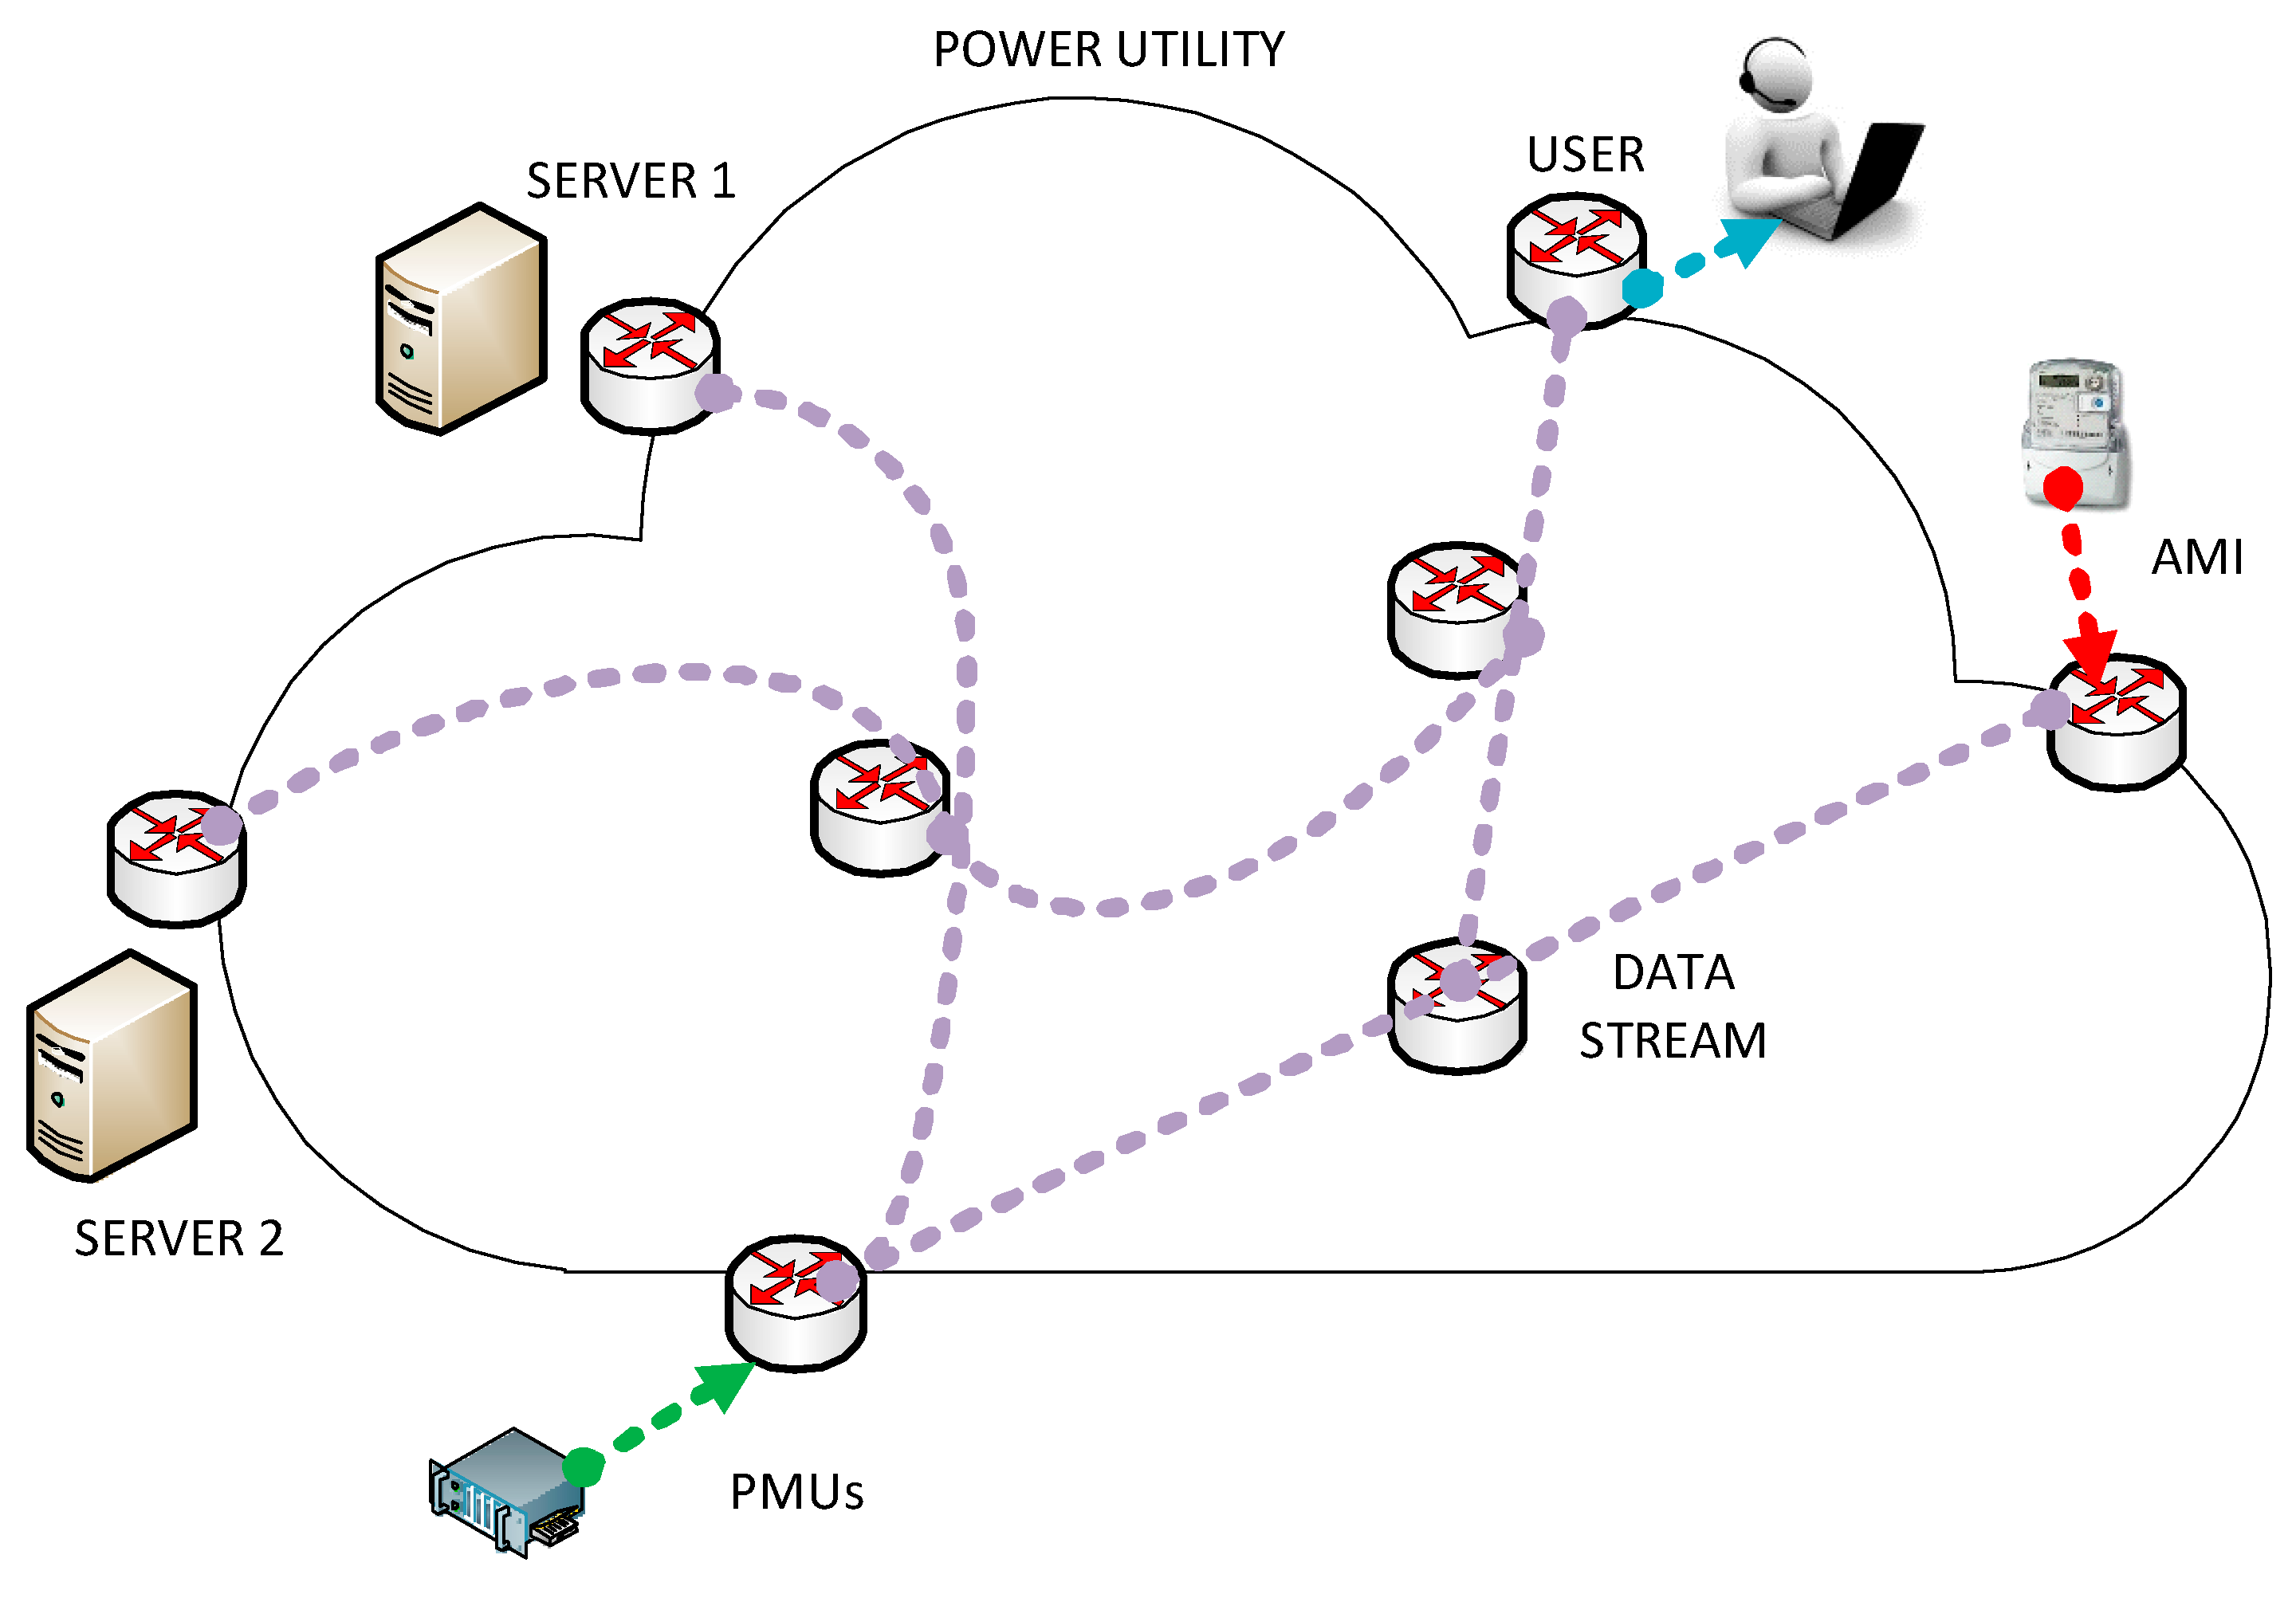
Internet Protocol (IP) multicast [13] is one such technique for one-to-many and many-to-many real-time communication over an IP infrastructure in a network. In smart grid applications, there are different protocols that need to be integrated in a system such as WAMS (Wide Area Monitoring System) that include protocols based on IEEE C37.118, substation automation protocols (IEC 61850) etc. All smart grid services and protocols (WAMS, Smart Metering infrastructure and IEC 61850 based applications) can be efficiently transported over such networks of telecommunication platforms (Figure 2).
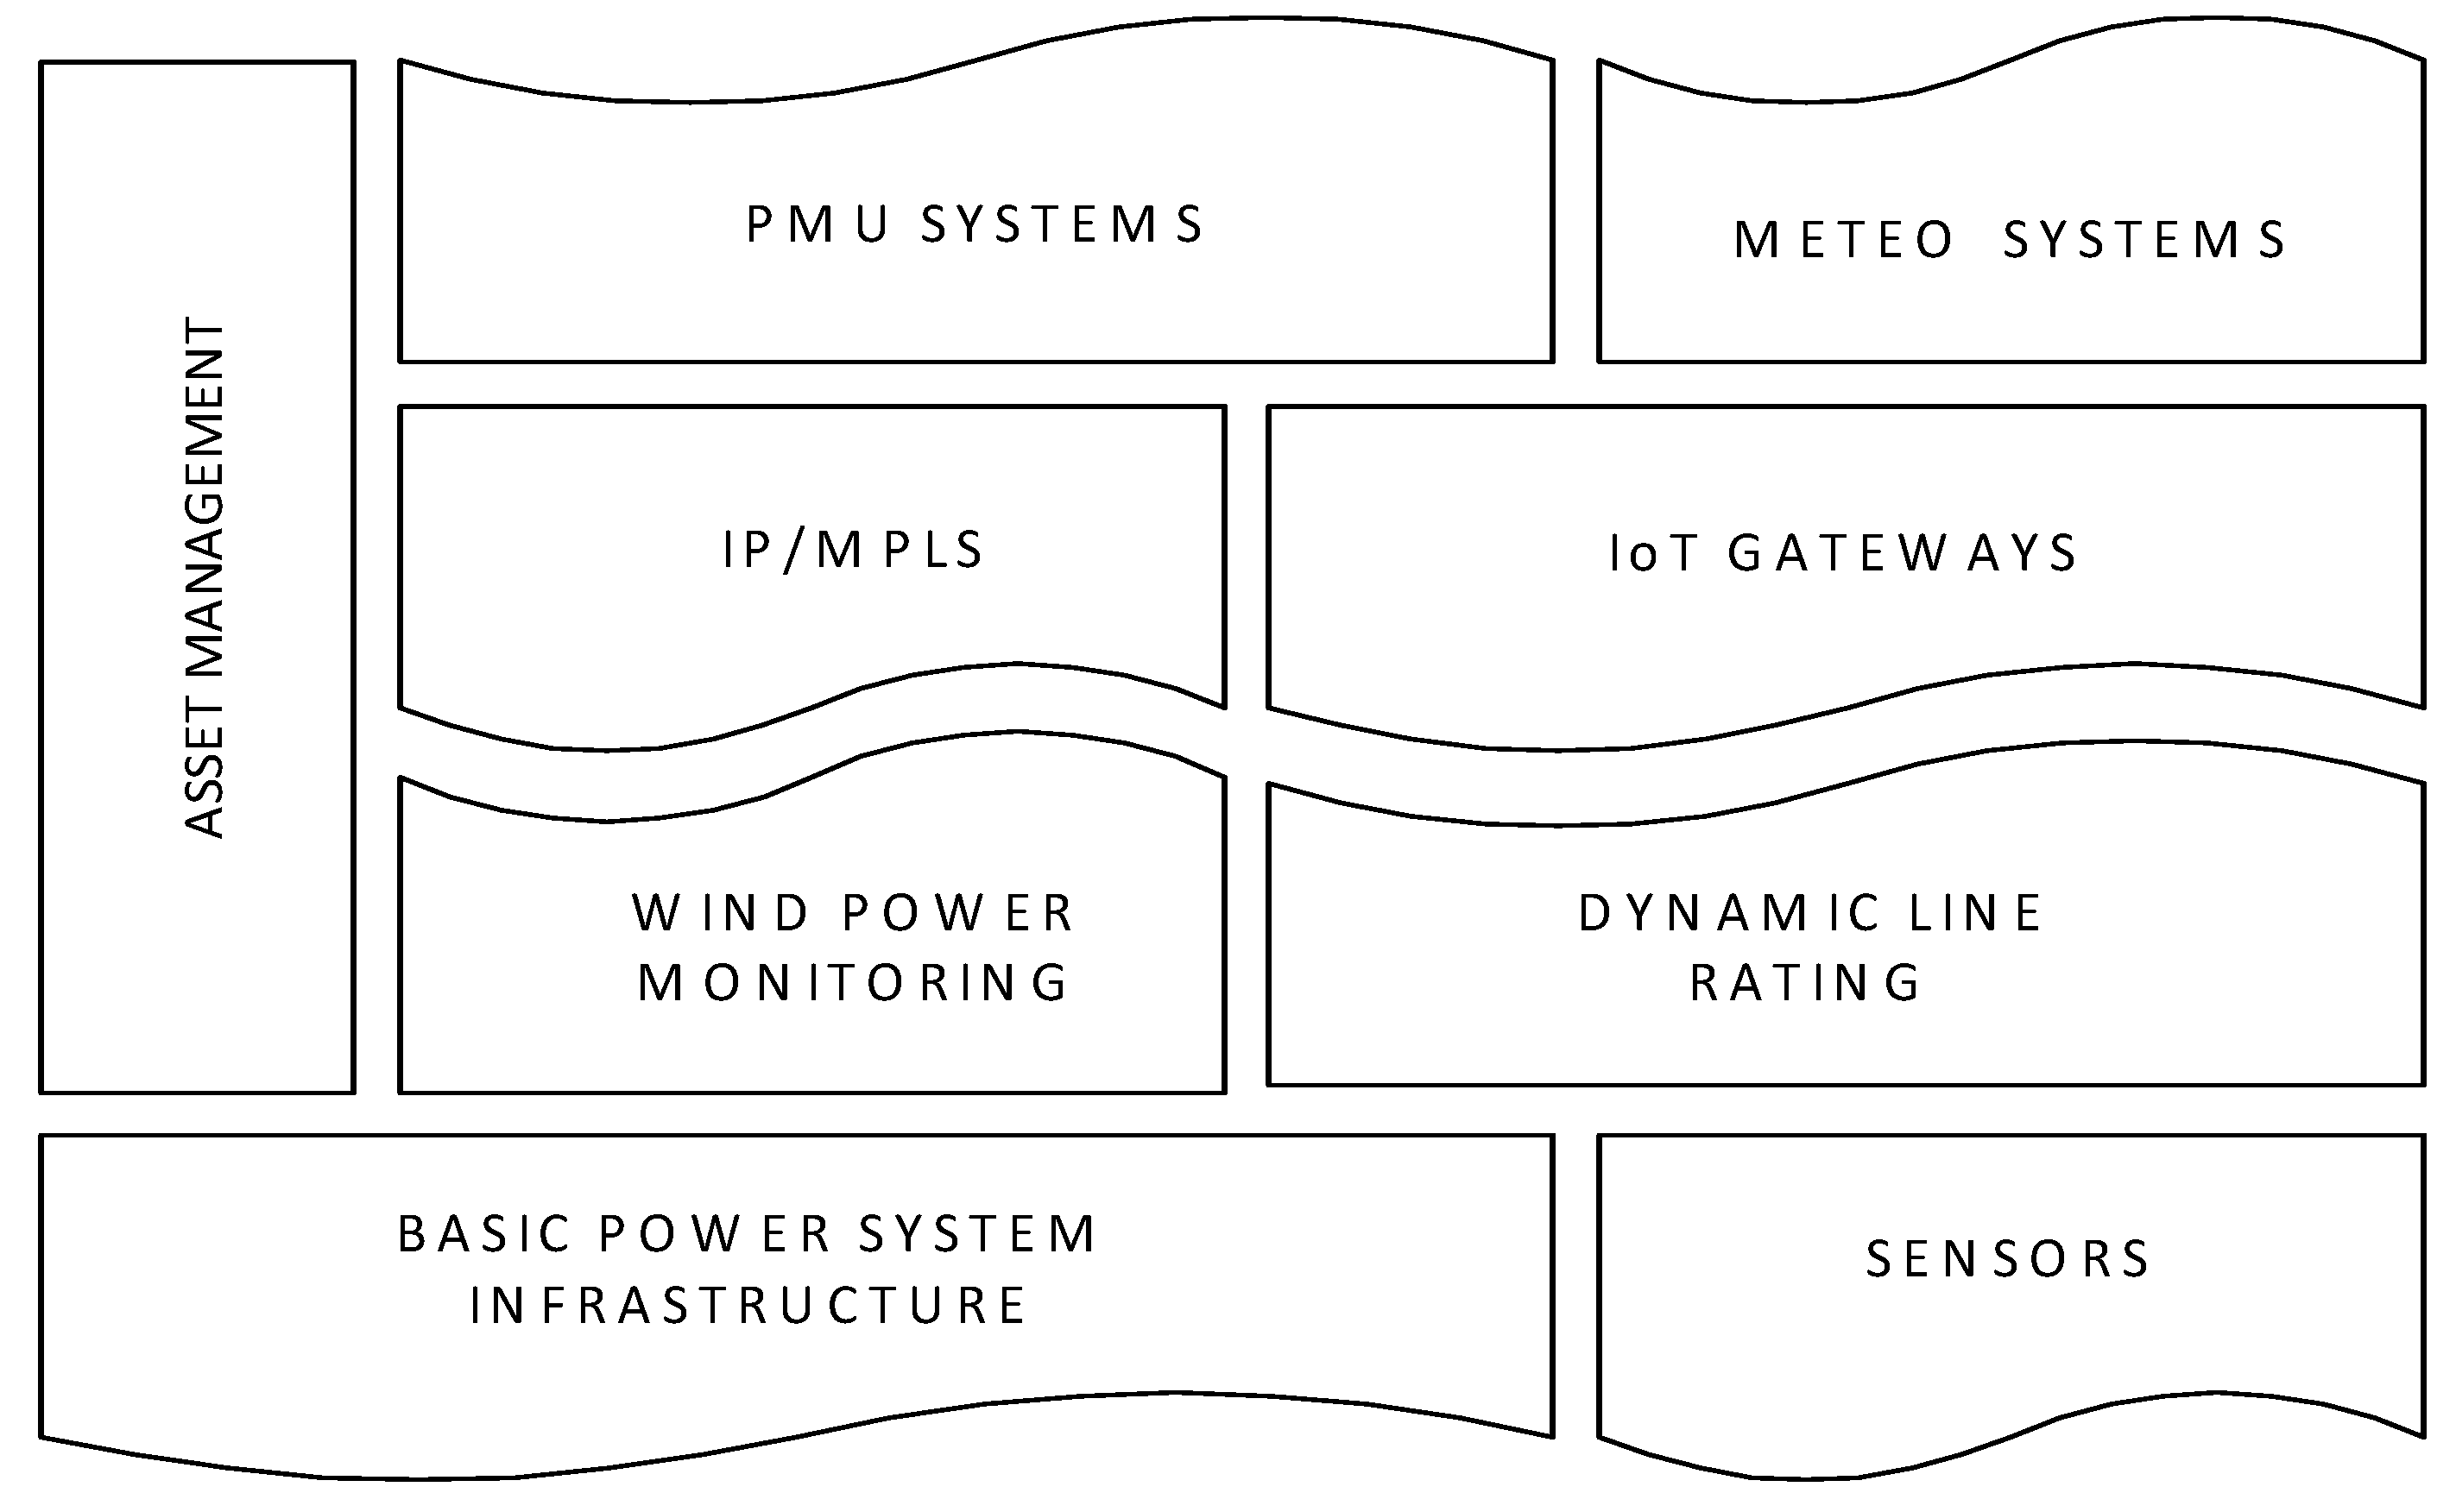
Having all the data concentrated would enable efficient data storing and processing enhancing the current information stream with the extraction of right information from the big data surrounding. Key characteristic of such future infrastructure enhancements would need to be adaptivity towards existing power grid infrastructure and modularity to allow system’s components separation and recombination (“adaptidular” infrastructure). The most important benefits of the new infrastructure (Figure 3) following the adaptidular design paradigm can be described as following:
- Existing capacities and possibilities of existing infrastructure enhancement and upgrading
- Capital expenditures (CAPEX) postponing or abolishing (building of new lines, substations, power infrastructure reconstruction) due to availability of new information in asset management systems, dynamic line rating system, PMU systems etc.
- Maintenance cost cutting through the usage of predictive maintenance enabled through sensor networks and IoT gateways
- Additional services provision: numerous additional services such as meteorological data assessment, air quality mapping, telecom services provision through IP/MPLS etc.
2. Developed Algorithm for Wind Power Monitoring and Control
In order to investigate the possibility and potential of wind power monitoring and control based on big data surrounding an algorithm for monitoring and incorporating synchrophasor measurement was developed. As described earlier, it has all the characteristics of adaptive and modular applications that can easily be installed and commissioned on the existing infrastructure. It also provides ability for later upgrades and integration into large scale applications.
2.1. Big Data Surroundings
The power system infrastructure produces huge amounts of data. The nonlinear nature of this data makes the extraction of useful information complicated [14]. Compared to standard mathematical models, data mining techniques are non-deterministic and provide a feasible and valid solution which is not exact but is simple to obtain, concise, practical and easy to understand. This characteristic is especially suitable when processing the big data streams which are inevitably involved. As mentioned earlier, large wind power capacities are being installed and connected to different voltage levels. Every wind turbine, wind measuring masts inside the wind park transformer substations, etc. represent the source of large quantities of data every second. All these data streams can be further expanded with the installation of new data sensors arrays. These large quantities of data can be deemed unnecessary, but with the usage of different big data algorithms a way to monetize this data can be found.
The most important data that can and should be used in power system data mining algorithms is the data for state estimation and future power system state predictions. These data streams can be classified into three main groups:
- Phasor values measurements;
- Loads and production measurements;
- Other influential variables measurements.
Phasor values like voltages and currents together with belonging phasor angles, can be gathered through PMU measurements and can provide valuable insights into system operation. Also, load and generation data with exact time stamp can easily be measured and collected to afterwards be used for different analyses.
Other influential variables of additional data that are not directly connected to power system monitoring and control are also sometimes highly influential. These include meteorological data from various kinds of measurement systems of which most important are wind speeds and wind directions, air temperature, humidity and pressure, solar irradiance measurements. Together with meteorological data, other measurements such as conductor temperatures, overhead line sags, partial discharges, current transmission line capacity obtained by dynamic line rating (DLR) systems etc. can also be collected [15]. All these data series can be used in wind and solar power system monitoring and control as well as for load forecasting applications and power evacuation possibilities. The prerequisite is to have an efficient solution for data transmission and processing.
2.2. Data Mining Scope
As described earlier, the huge amounts of data inside power creates the big data surroundings. The non-linear nature of the system makes the definition of new models for extraction of useful information from heaps of gathered data even more demanding [16].
Especially demanding is the usage of data from wind power plants since these stochastic sources produce even bigger amounts of data due to dependable variables which influence the output power.
Therefore, good data mining scope thus integrates wide area of variables. This paper defines simplified model which comprises of:
- Wind power plant active and reactive power production (PWind, QWind), at wind power plant point of common coupling (PCC);
- Wind power plant active and reactive power settings (PSettings, QSettings), which are operational decisions for the settings of wind power controller placed at wind power (PCC);
- Total system load measurements (PL), expressed in percentage, as a percentage of nominal load;
- Voltage amplitudes and angles (phasors) measurements (Vi, δi) on selected nodes in the system;
- Line, transformer and generator availability information.
Each operating condition (OC) is defined as a mathematical set whose members are the following elements or variables:
OCk = {V1, V2, V3, … Vi, δ1, δ2, δ3, … δi, PL, PWind, QWind, Zth}
- -
- with i = 1, 2, 3, … n; where n is the number of nodes in power system with measurements of effective values and voltage angles in the system, and
- -
- with k = 1, 2, 3, … m; where m—total number of input states over which data mining techniques are analyzed.
The abovementioned data can be expanded by defining the finely tuned fractal structures attached to it:
- Wind power total can be divided into wind power of single wind turbine or a cluster of turbines;
- Total system load can be divided into loads on busbar, consumer, or load area level;
- Voltage amplitudes and angles can be enhanced with current amplitudes and angles for each branch as well as Thevenin impedance measurements;
- Wind production is defined with wind speed and can further be detailed with wind direction, air temperature and pressure, solar irradiance and air humidity measurements;
- Line and transformer availability can further be described through breaker status in line bays and transformer bays or through transformer and line monitoring systems.
All this data needs to form large and well-organized databases for further usage in control, planning, asset management and operation and maintenance (O&M) optimization process. Therefore, to take full advantage of the available data efficient algorithms for big data analysis are needed.
2.3. Proposed Algorithm Design
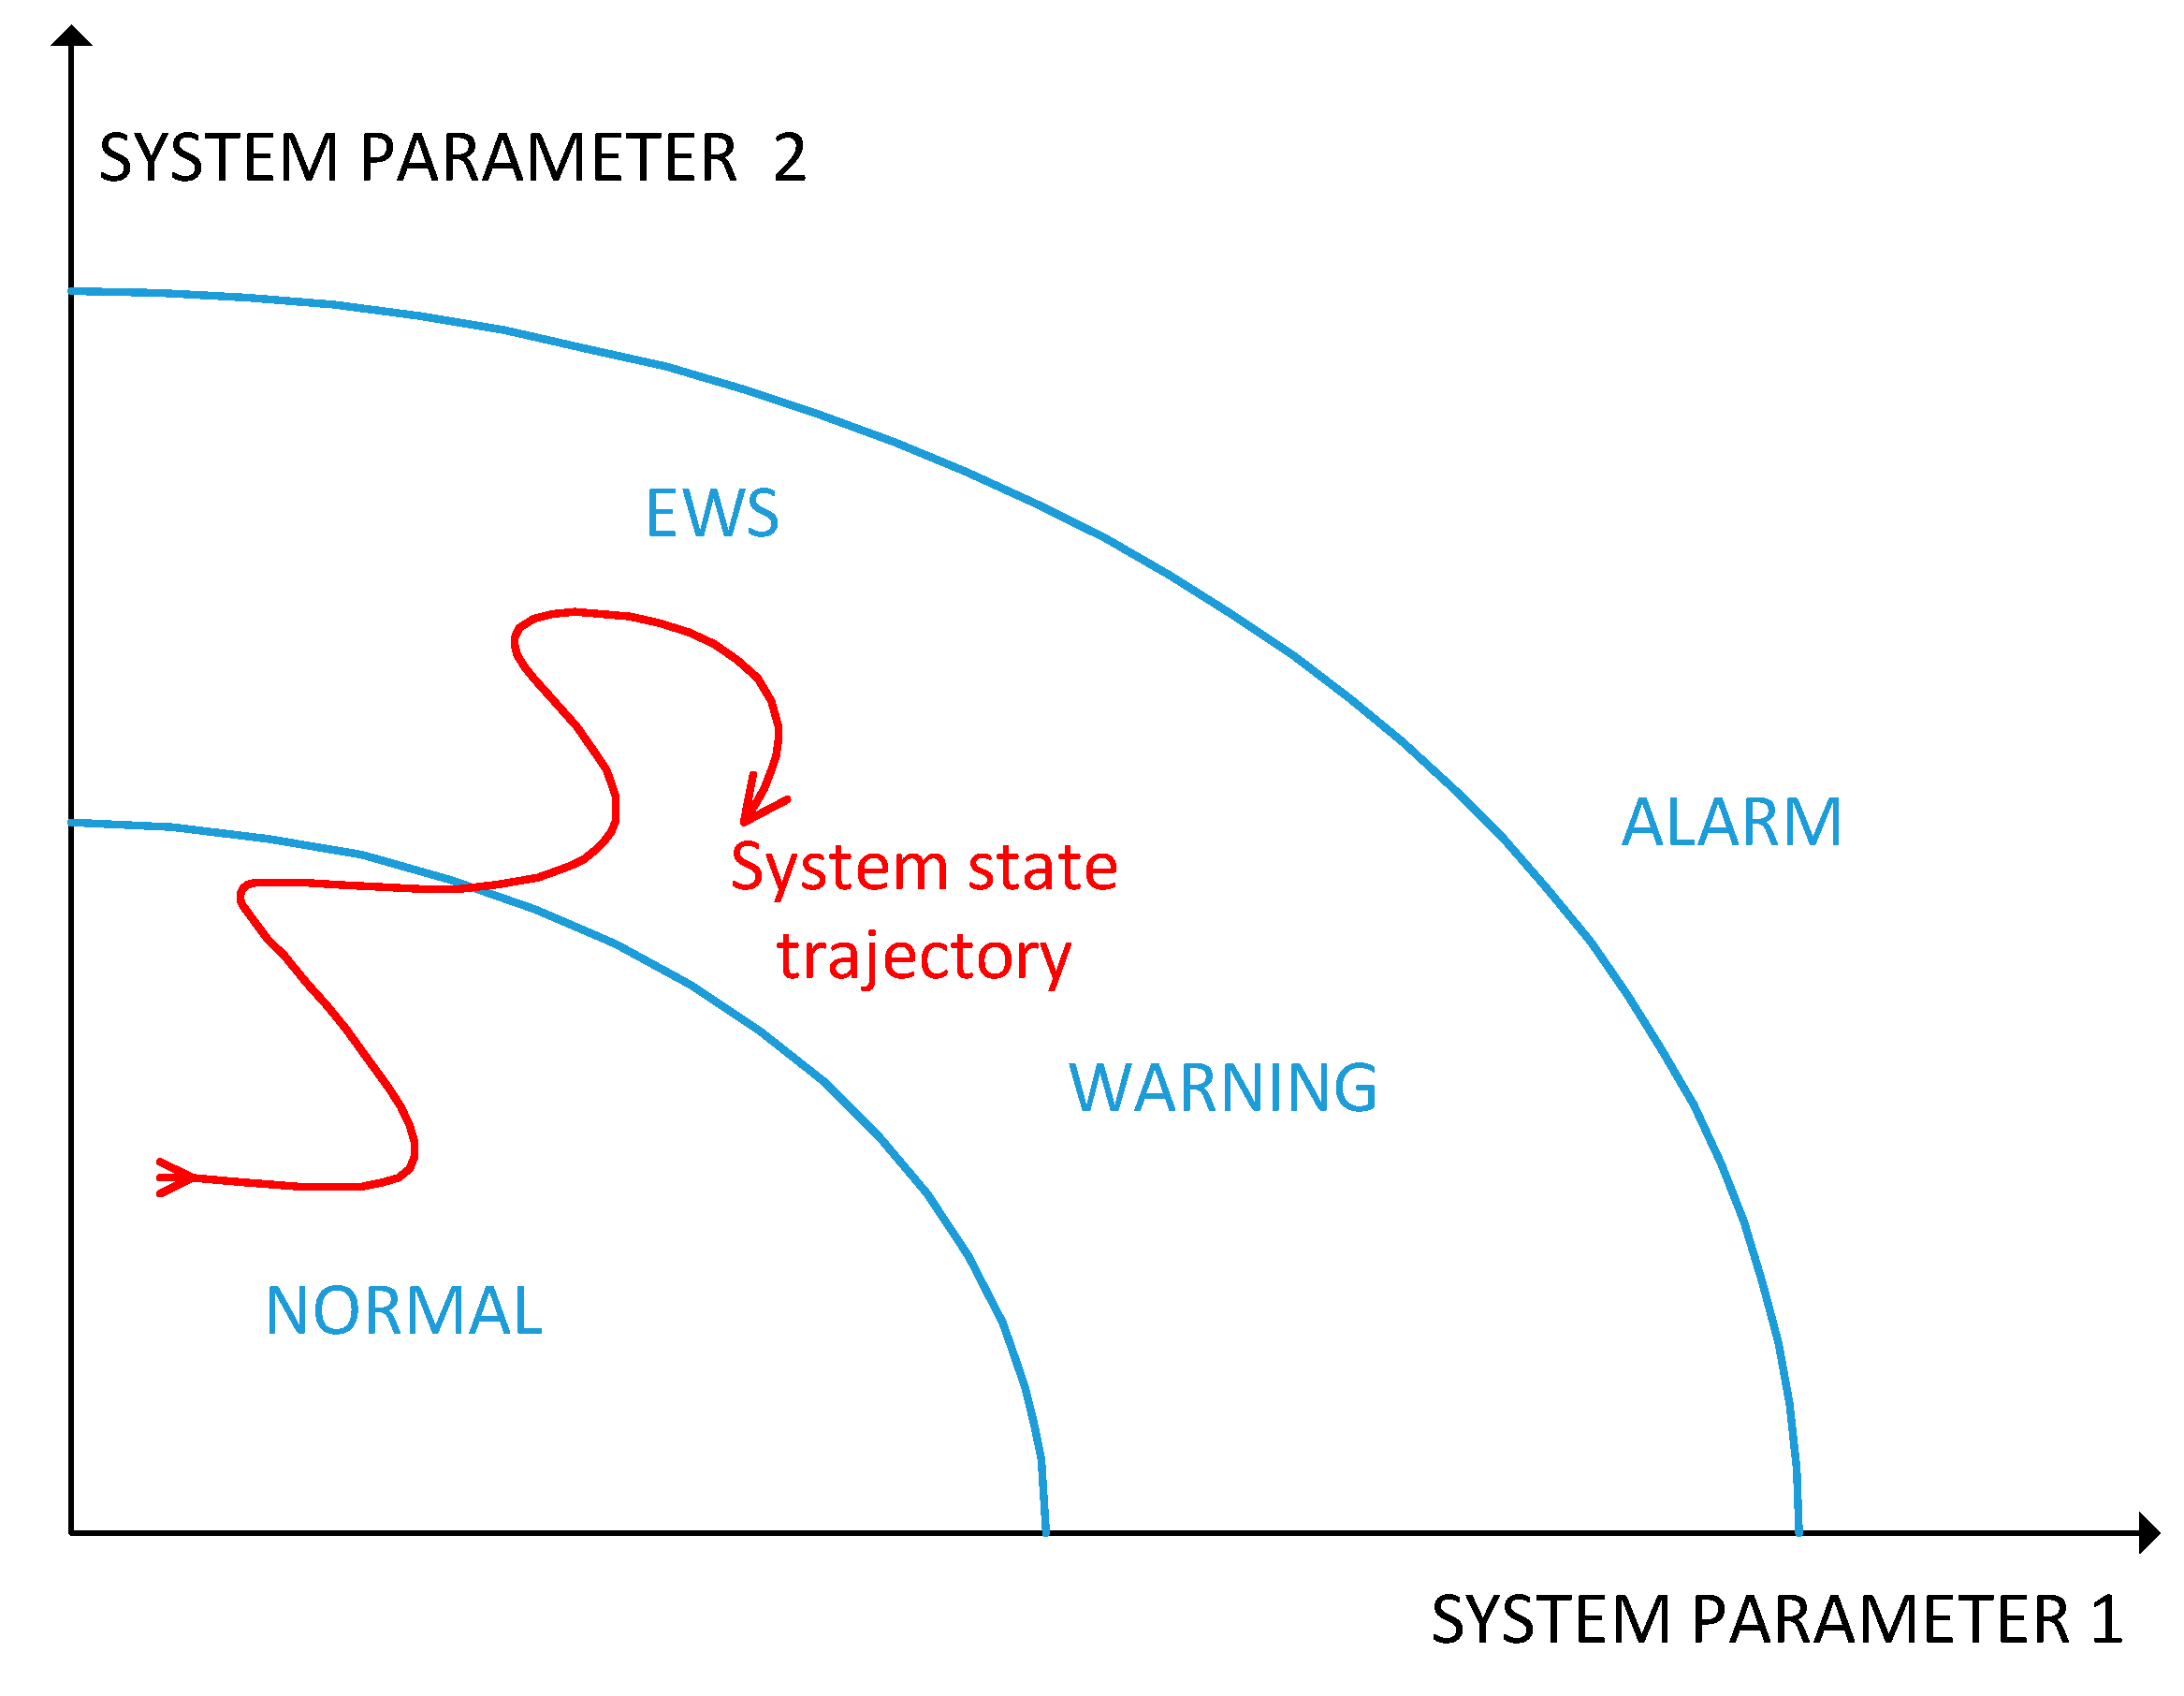
The aim of the developed algorithm is to create a new kind of early warning signal (EWS) and recognize the structure of critical transitions for transmission system and wind power operators in the form of a situational awareness (SA) indicator [17]. These signals should be structured to warn the operators that the alarming operating condition could be reached and that preventive or corrective actions should be done (e.g., wind power curtailment or reactive power support increase) and thus move the system to normal operating state, like described in figure below (Figure 4). Created EWS signal as a situational awareness indicator serves as a main triggering signal for operating decisions in wind power settings in order to change operating condition back to EWS value NORMAL. Therefore, EWS could serve as a first line of defense to reduce the risks of total or partial system blackouts and thus reducing the opportunity costs associated with the costs of electric energy not being delivered.
Commonly used data mining algorithms identified by the IEEE International Conferences on Data Mining (ICDM) are C4.5, k-Means, Support Vector Machine (SVM), Apriori, PageRank, AdaBoost, Neural Networks, Naive Bayes and Classification and regression trees (C&RT). These 10 algorithms cover classification, clustering, statistical learning, association analysis, and link mining, which are all among the most important topics in data mining research and development. In [18] a review on the applications of data mining in power systems is given.
The approach described here combines several segments of classification and clustering and statistical learning in one algorithm. Also, it brings combined solution for monitoring and preventive measures operating decisions.
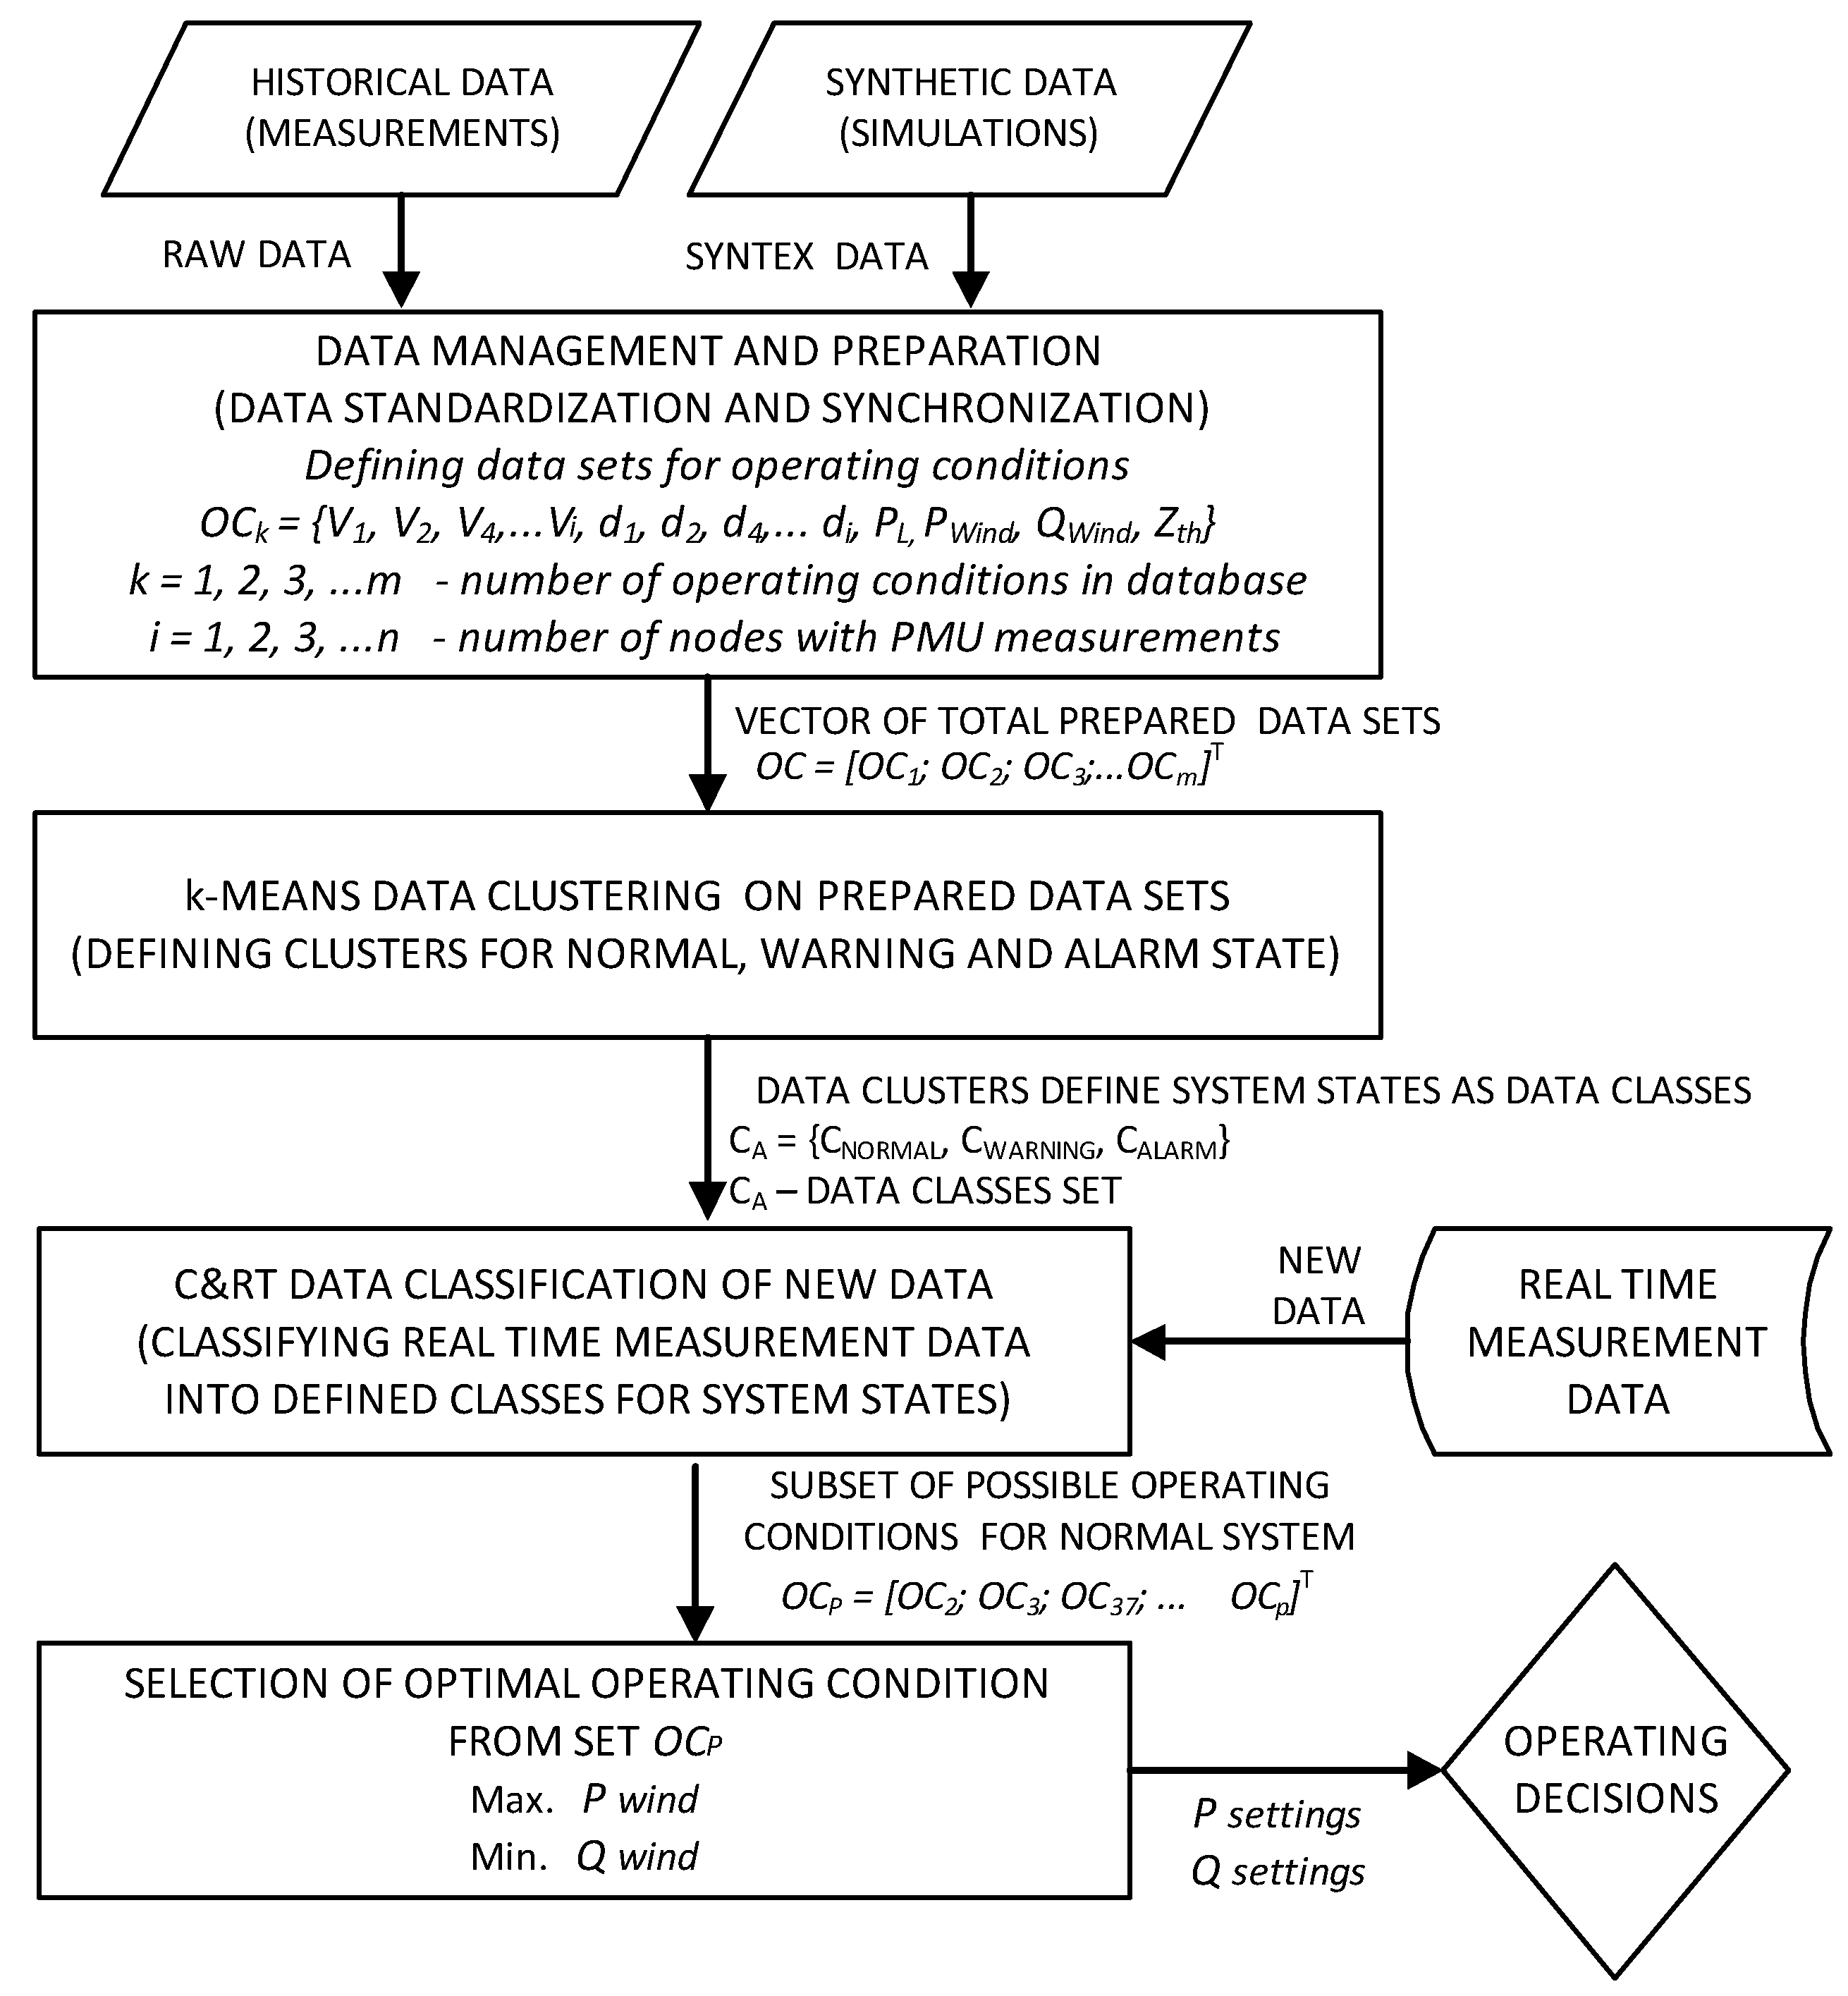
A basic workflow diagram of the proposed algorithm is described on Figure 5. The first step in the algorithm is data management and preparation which consists of time synchronization, format unifying, and ordering of historical raw data from actual power system measurements. Additionally, synthetic data which is produced and gathered from various kinds of simulations based on mathematical models is also included in this step. In this paper DigSilent Power Factory power system analysis software [19] is used as a tool for production of simulation data.
The input data vector in the clustering process is equal to:
OC = [OC1; OC2; OC3; OCm]T
In this way, mathematically defined power system states are defined as input data in the algorithm. It is important to note that except for the variables defined herein, the input set of system states can be extended to a whole range of additional input signals such as data from various measuring devices for measuring electrical and nonelectric values, meteorological measuring devices, sensors and other devices. The model is therefore adaptive and modular. It is easy to upgrade by simply expanding the operating condition (OC) math data set.
The second step is data clustering, with the aim of defining system states on a given database or set of operating conditions. For the algorithm design described in this paper, the analytics software package Statistica [20] was used. Standard variable definition from statistical theory was used where an independent variable (also called experimental or predictor variable), is being manipulated in an experiment to observe the effect on a dependent variable (also called an outcome variable). Total set of operating conditions in this example to be a representative sample needs to be large enough and cover all possible system states and. K-Means algorithm with Euclidian distances was used for clustering of the initial data set in following way:
- Thevenin impedance at bus 8 (Figure 6) was used as dependent variable;
- Thevenin impedance absolute value is used as first dependent variable;
- Thevenin impedance angle was used as second dependent variable;
Clustering was finally made into three clusters which describe normal (NORMAL), transition (WARNING) and problematic (ALARM) conditions. It is important to stress that all three system states should be present in input datasets in order to have a viable solution of this part of the algorithm.
After the clustering of the system states of a particular group or clusters for normal, warning and alarm operating conditions, the same definitions of the target groups serve as inputs for the classification part of the algorithm. With these clustered data, data classes are defined for later analysis of new metric input data:
CA = {CNORMAL, CWARNING, CALARM}
- CA—a set of data classes in the algorithm
- CNORMAL—data class for normal operating condition
- CWARNING—the class of data for transition operating condition
- CALARM—data class for normal critical condition
The third step consists of data classification of new measurement data and definition of a set of new system operating conditions (OC). Assigned system condition (NORMAL, WARNING and ALARM) were set as independent variables and previously defined variables in data mining scope (PWind, QWind, PL, Vi, δi) as dependent. New measurement data, according to its parameters, in the classification part of the algorithm are classified into predefined groups according to the values of the parameters that are taken as input data. Classification groups are defined as clusters created by earlier clustering of operating conditions.
Classification and regression trees (C&RT) method was used for this classification analysis. For that purpose, software Statistica [20] was used. To assign weight factors to decision making process, misclassification costs [21] were defined heuristically according to table below (Table 1). In columns are predicted variables and in rows are measured variables.
To prevent overfitting of the data, a V-fold cross validation is used. 5% of the cases were used as “v-value” [21]. V-fold cross validation where the data set is randomly divided into v equal parts and the learning phase of the algorithm is done on v − 1 parts and test on the remaining piece is especially suitable for such situations where a small number of cases is used for classification. Furthermore, pruning on variance that reduces the size of decision trees by removing sections of the tree that provide little power to classify instances was used to get closer look at cost sequence for all calculated classification and regression trees. Cost sequence was calculated for re-substitution and cross-validation costs for all generated C&R (Classification and Regression) trees. In this way, a more simplified decision tree can be chosen according to law of parsimony, anticipating that things are usually connected or behave in the simplest or most economical way, especially with reference to alternative evolutionary paths [22]. To reach a normal system state, as a final result there can be several operating conditions fulfilling the given conditions. This means the output from data classification process will be a set of possible operating conditions (OCs). In the final step, final wind power plant operating decisions are made according to a simple procedure of selecting the best possible solution among the vector of possible operating states (OCP) whereby:
OCP = [OC2; OC3; …OCp]T
With the requirement that each element of vector OCP is also an element of the class CNORMAL.
A final operating decision still needs to be made, meaning settings of wind power plant controller (Psetting and Qsetting) at the point of common coupling need to be defined. Variable Psetting is defined as setting of for output active power. If this setting is lower than available wind power, the result will be wind power curtailment. This variable is defined as a continuous variable. Variable Qsetting is defined as setting of regime for reactive power regulation. This variable is defined as categorical variable (of total output Q or cos φ) meaning one setting represents one possible category (e.g., cos φ = 0.9 lagging or Q equal to 0.5 p.u.). This way reactive power control variable is discretized. Final operating decisions for wind power plants are made according to simple process of selecting the best possible solution among the set of possible operating conditions (OCs). Final operating condition is chosen to minimize the opportunity costs of wind energy export and thus maximizing the produced energy. Also, according to [23], to prolong the lifetime of wind turbines it is necessary to lower reactive power production and its influence on power electronics in turbine converters. In harmony with the availability of wider range of PMU measurements the operation can be optimized with both available measurement and analysis results [24]. Therefore, final decisions can be summarized as maximization of output active power and minimization of reactive power (Equations (5) and (6)).
max {Pwind}
min {Qwind}
Power transformers at point of common coupling (PCC) have limited capacity. Therefore, additional condition needs to be fulfilled in order not to endanger operational limits (Equation (7)) where STR is the power transformer capacity (MVA).
STR ≤ (PWind2 + QWind2)1/2
3. Test System Example
3.1. Test System Description
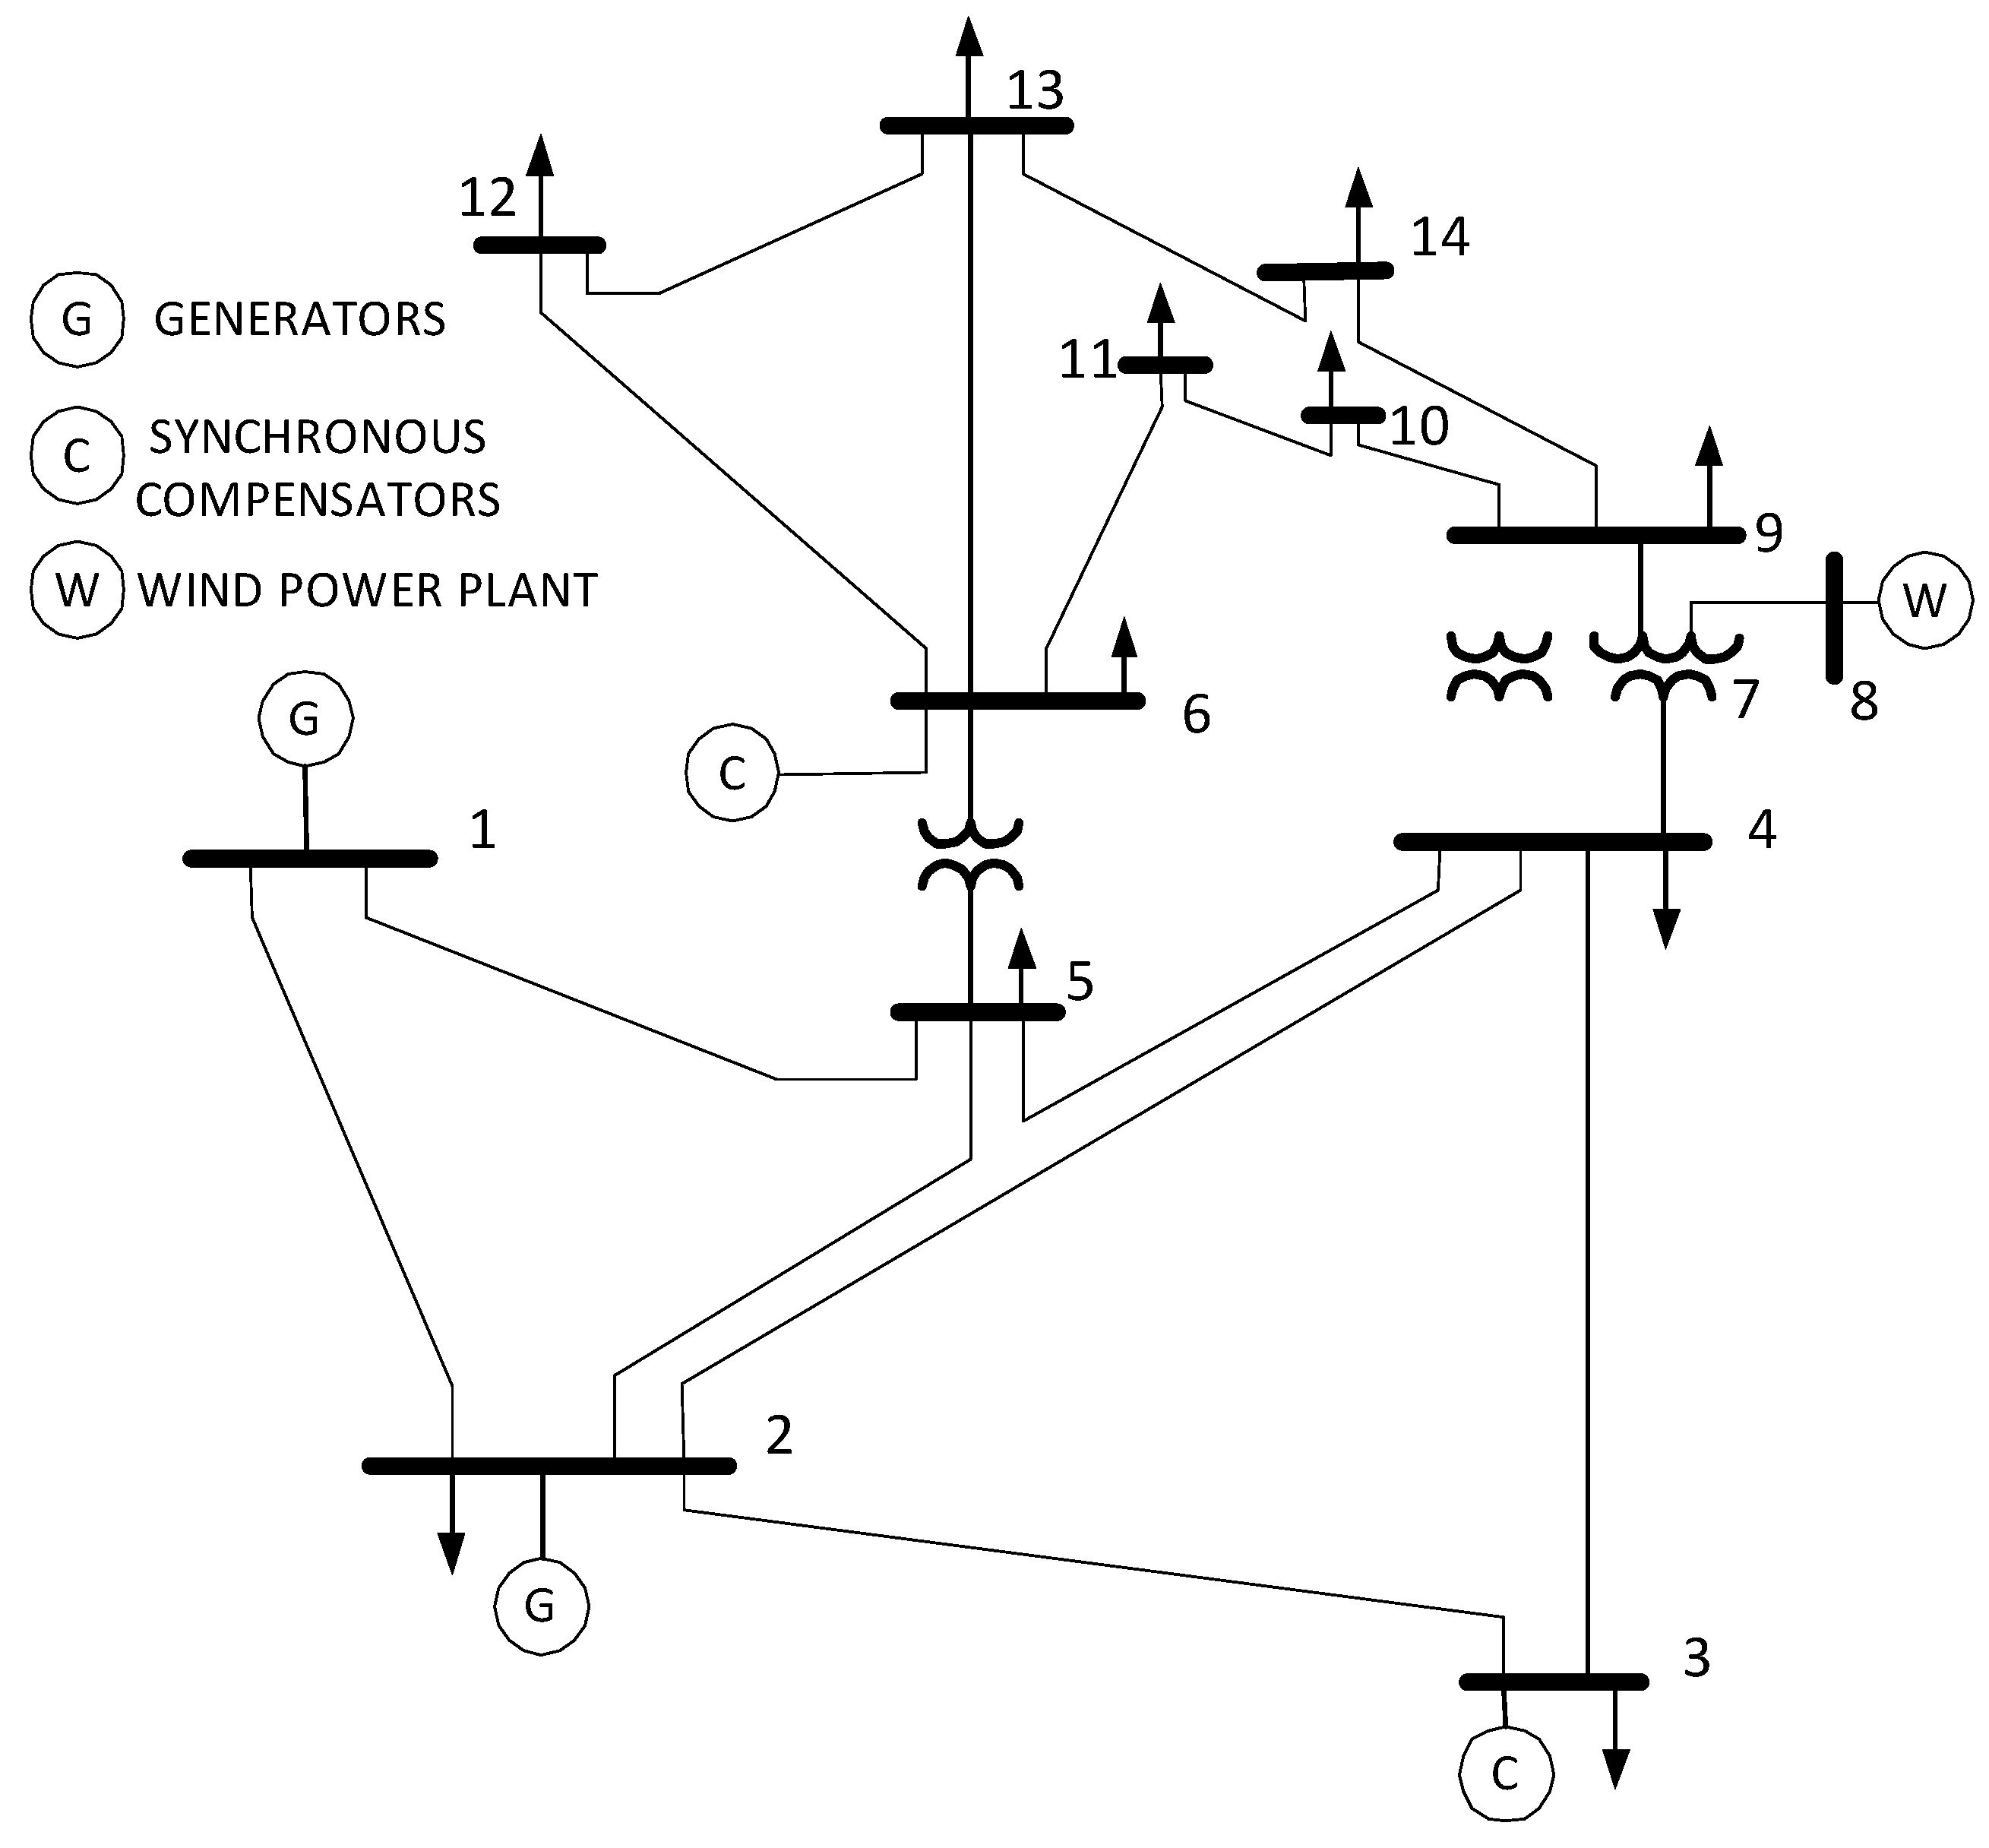
IEEE 14 bus test system was used as a first test case for the application of the proposed algorithm. Instead of synchronous compensator that is originally included in the IEEE 14 test system connected to bus 8, a wind power plant on that given bus was defined with rated power of 20 MW, which can be seen on Figure 6.
3.2. Operating Conditions
In this numerical example, only synthetic data was produced and analyzed. Power system calculations were made in DigSilent Powerfactory software (DIgSILENT GmbH, Gomaringen, Germany) as was mentioned earlier with the series of power flow simulations for different network conditions.
Operating conditions (OCs) were calculated for a wide range of different simulation scenarios including:
- Variable wind power plant active power production change in an interval from 0–100% of rated power in discrete steps of 25%;
- Variable wind power plant reactive power settings definition in three different modes:
- power factor regulation (setup point change from 0.9 p.u. lagging to 0.9 p.u. leading in steps of 0.05 p.u.);
- reactive power regulation (setup point change from 1.0 p.u lagging to 1.0 p.u. leading in steps of 0.05 p.u.);
- voltage regulation (setup point change from 0.9 p.u. lagging to 0.9 p.u. leading in steps of 0.05 p.u.).
- Power system load change in an interval from 1 p.u. to 1.6 p.u. (100–160%) in steps of 0.2 p.u. (20%);
- Line, transformer and generator availability status change switching off in different combinations for different OCs.
This way, a total of 396 OCs was created with most of the variables defined as continuous variables. Thus, large database covering a large number of possible network situations was created and further analyses were enabled.
3.3. Test Model Results
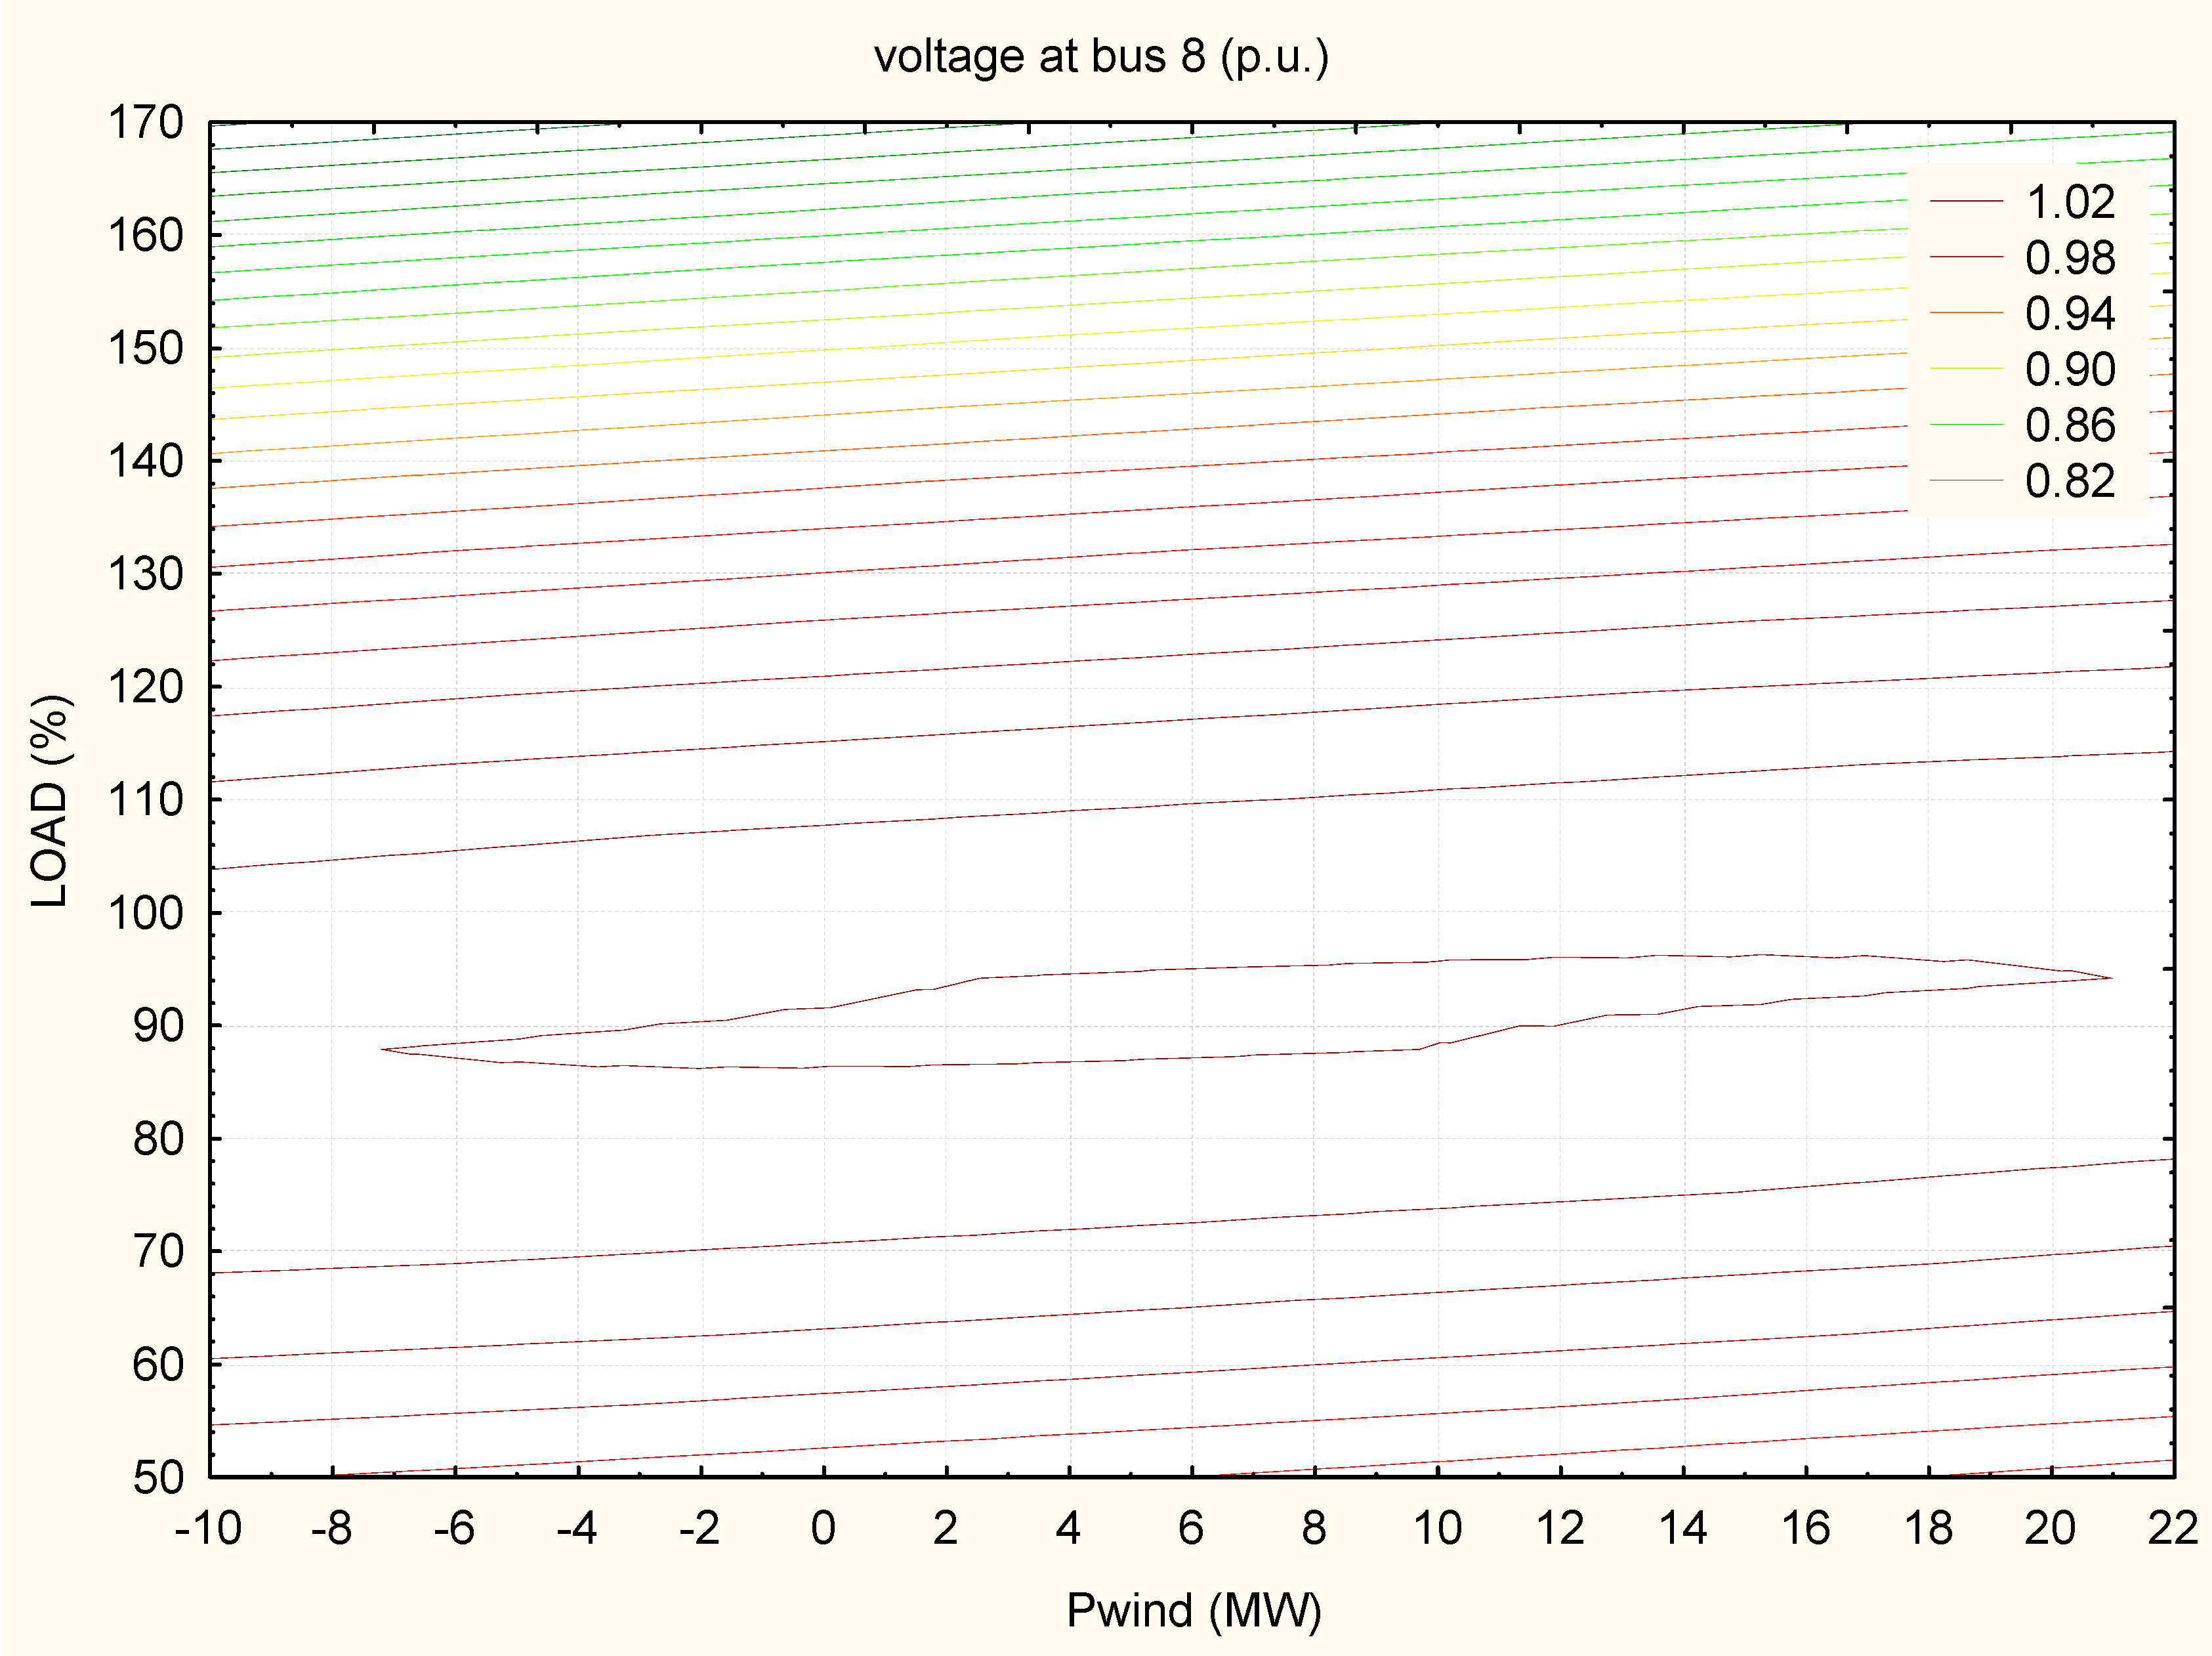
Large number of different analyses made in Statistica software, (Tibco Software, Palo Alto, CA, USA) as mentioned earlier. For example, voltage isolines for bus 8 at subject test system in various system load conditions and wind farm production (wind farm working in cos φ regulation mode with cos φ = 1) are given in following figure (Figure 7).
From Figure 7 it can be seen how with the increase of load and/or wind production, voltage isolines become denser, which is explained through larger voltage sensitivity in these operating regions and conditions.
In this series of calculations, only simulation data was used. Simulation data was generated on an IEEE 14 bus system. Thus, data preparation step was simplified and there was no need for data formatting/unifying and time synchronization.
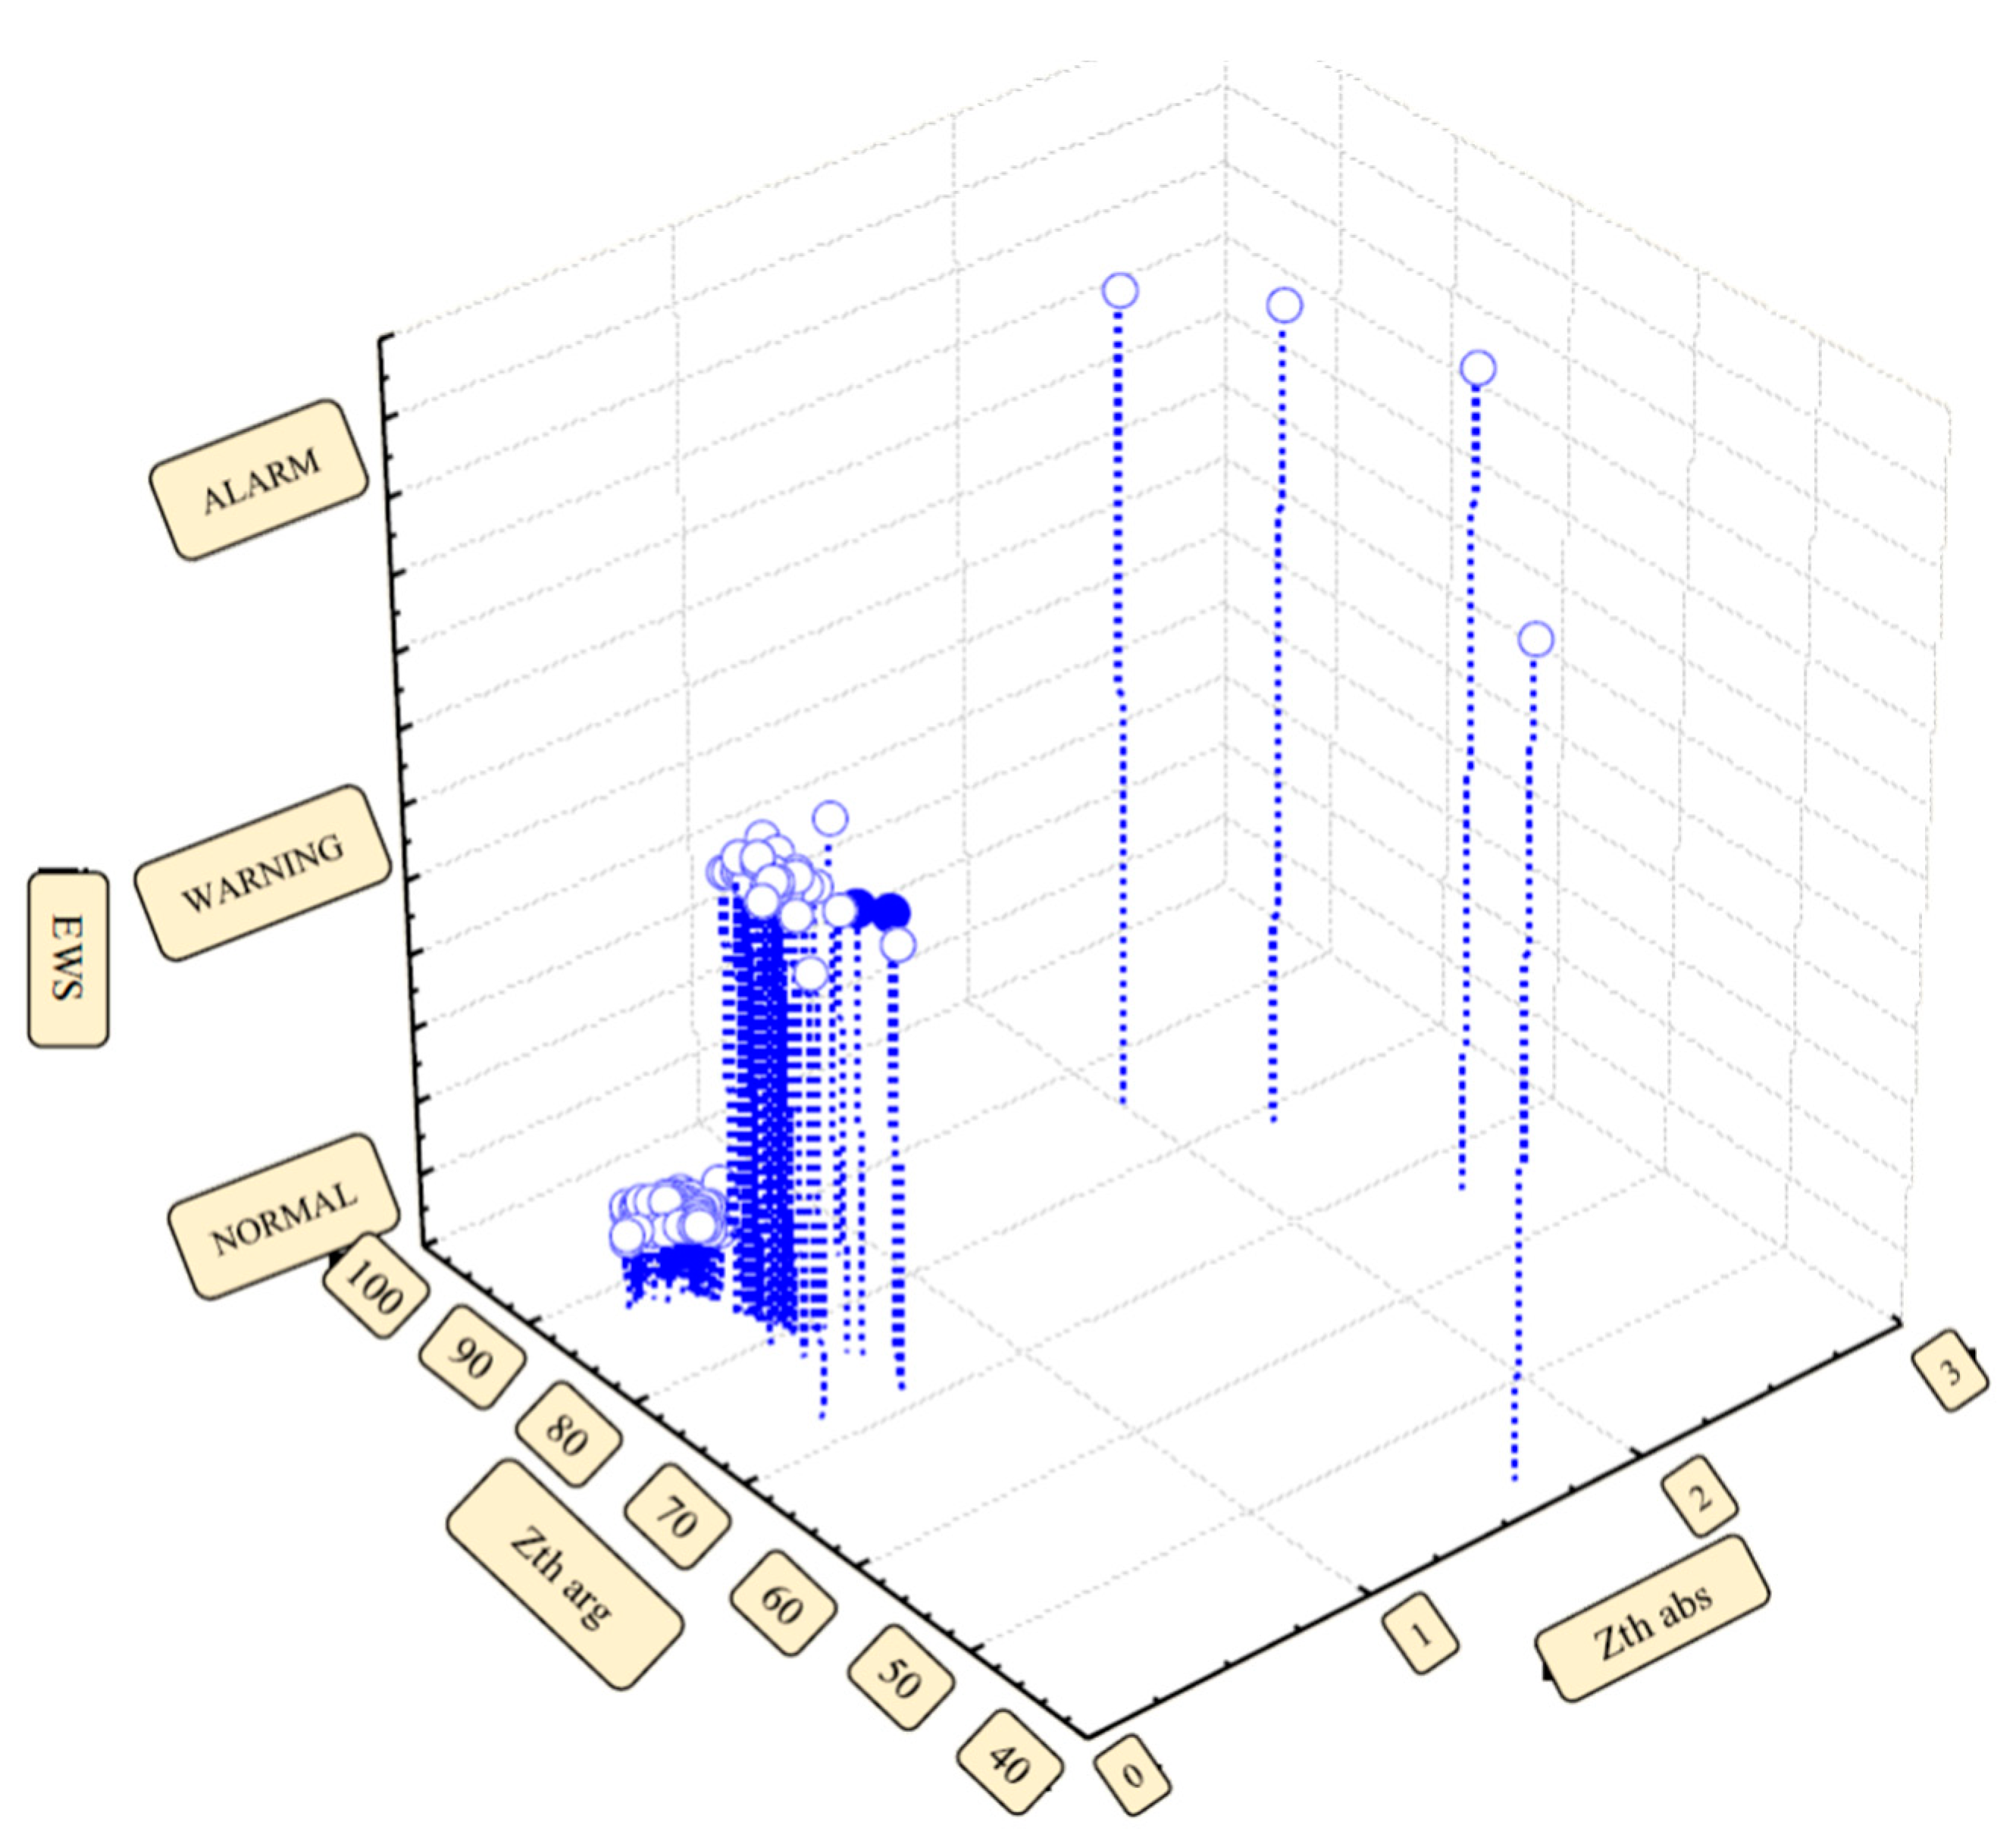
After data clustering, resulting centroids of Thevenin equivalent, for k-means clustering based on a total of 396 training cases, are given in following table (Table 2):
Thevenin impedances can be used for a wide range of protection applications [25].
According to EWS centroids given in Table 2 and EWS clustering depicted in Figure 8, it can be seen how power system changes its impedance to higher absolute and more resistive values during warning and alarm operating conditions. This represents an expected behavior that can be detected and further actions can be planned accordingly.
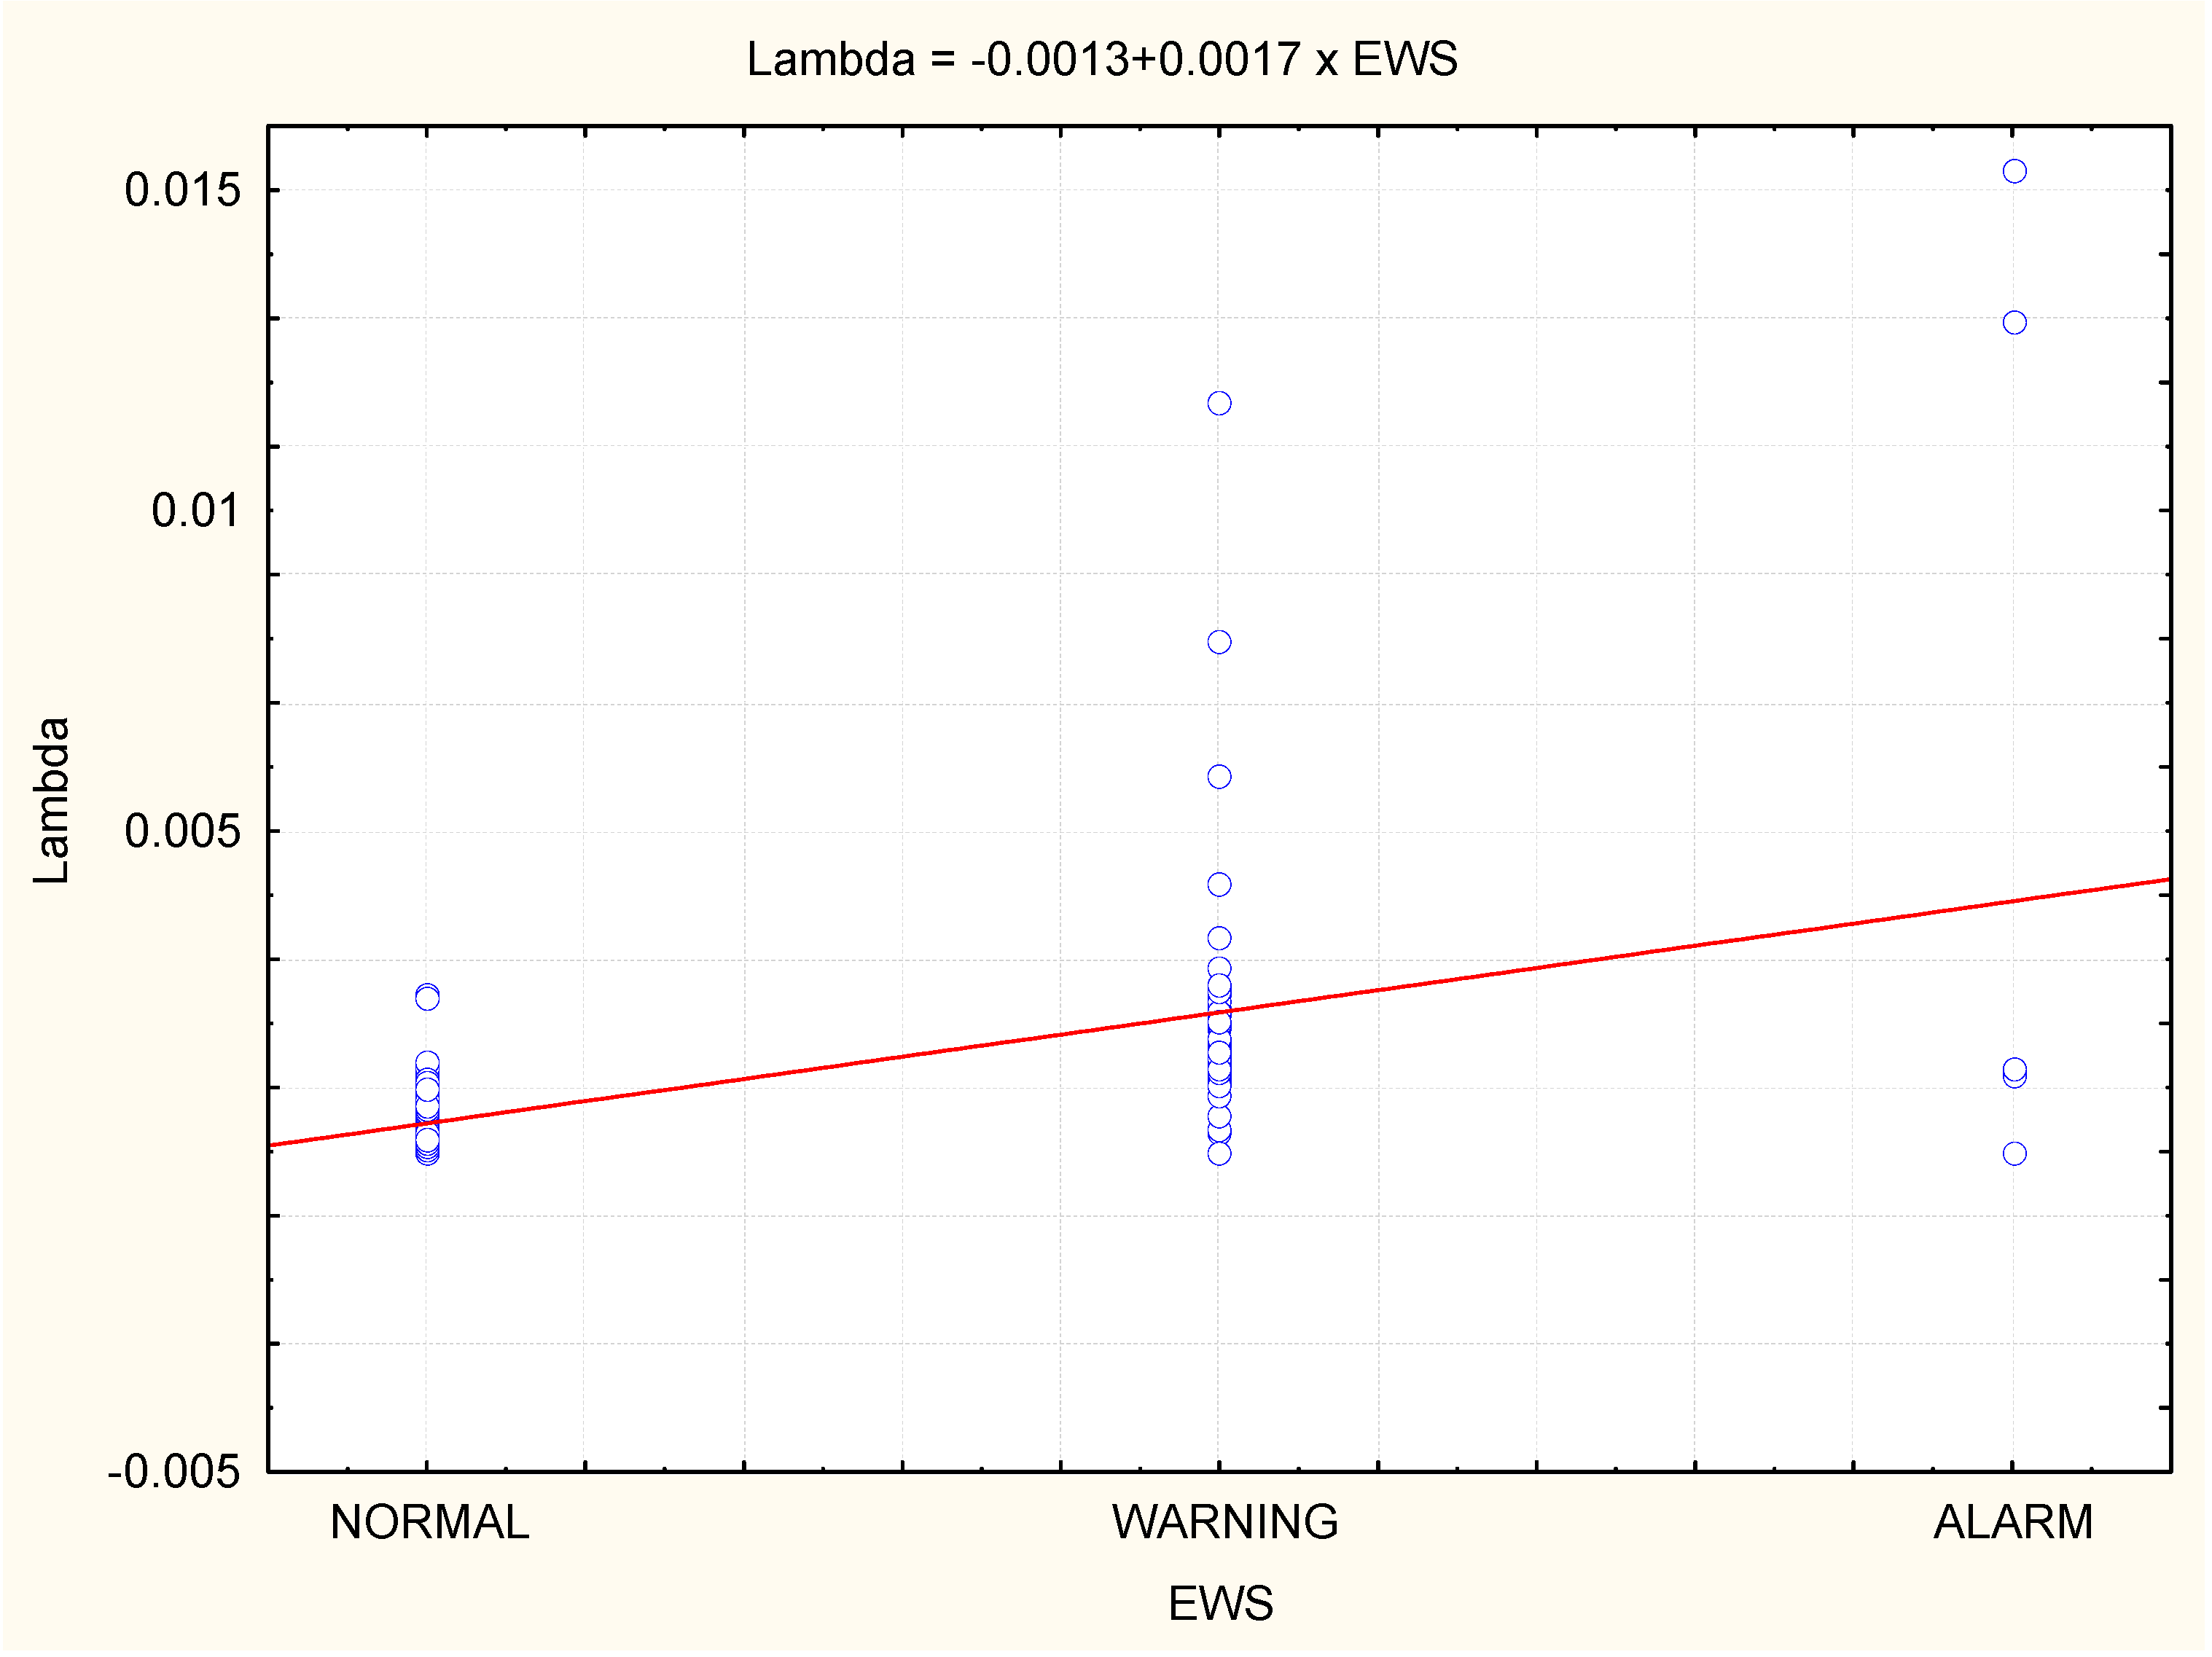
Further validation of such clustering was made using Jacobi matrix eigenvalues. Since Jacobi matrix for IEEE 14 bus test system has 14 eigenvalues, root mean square value of all 14 values was used as leveled variable which is labeled as lambda. In Figure 9 it can be seen how lambda values are clustered for normal, warning and alarm operating conditions. In this way, the early warning signal is verified with Jacobi matrix eigenvalues.
Calculated clusters are used for further classification of cases of OCs. Classification was made with the usage of clustered EWS in OCs as dependent variables. Independent variables are voltage values and voltage angles on all buses as well as total system load, wind power active power and wind power reactive power settings.
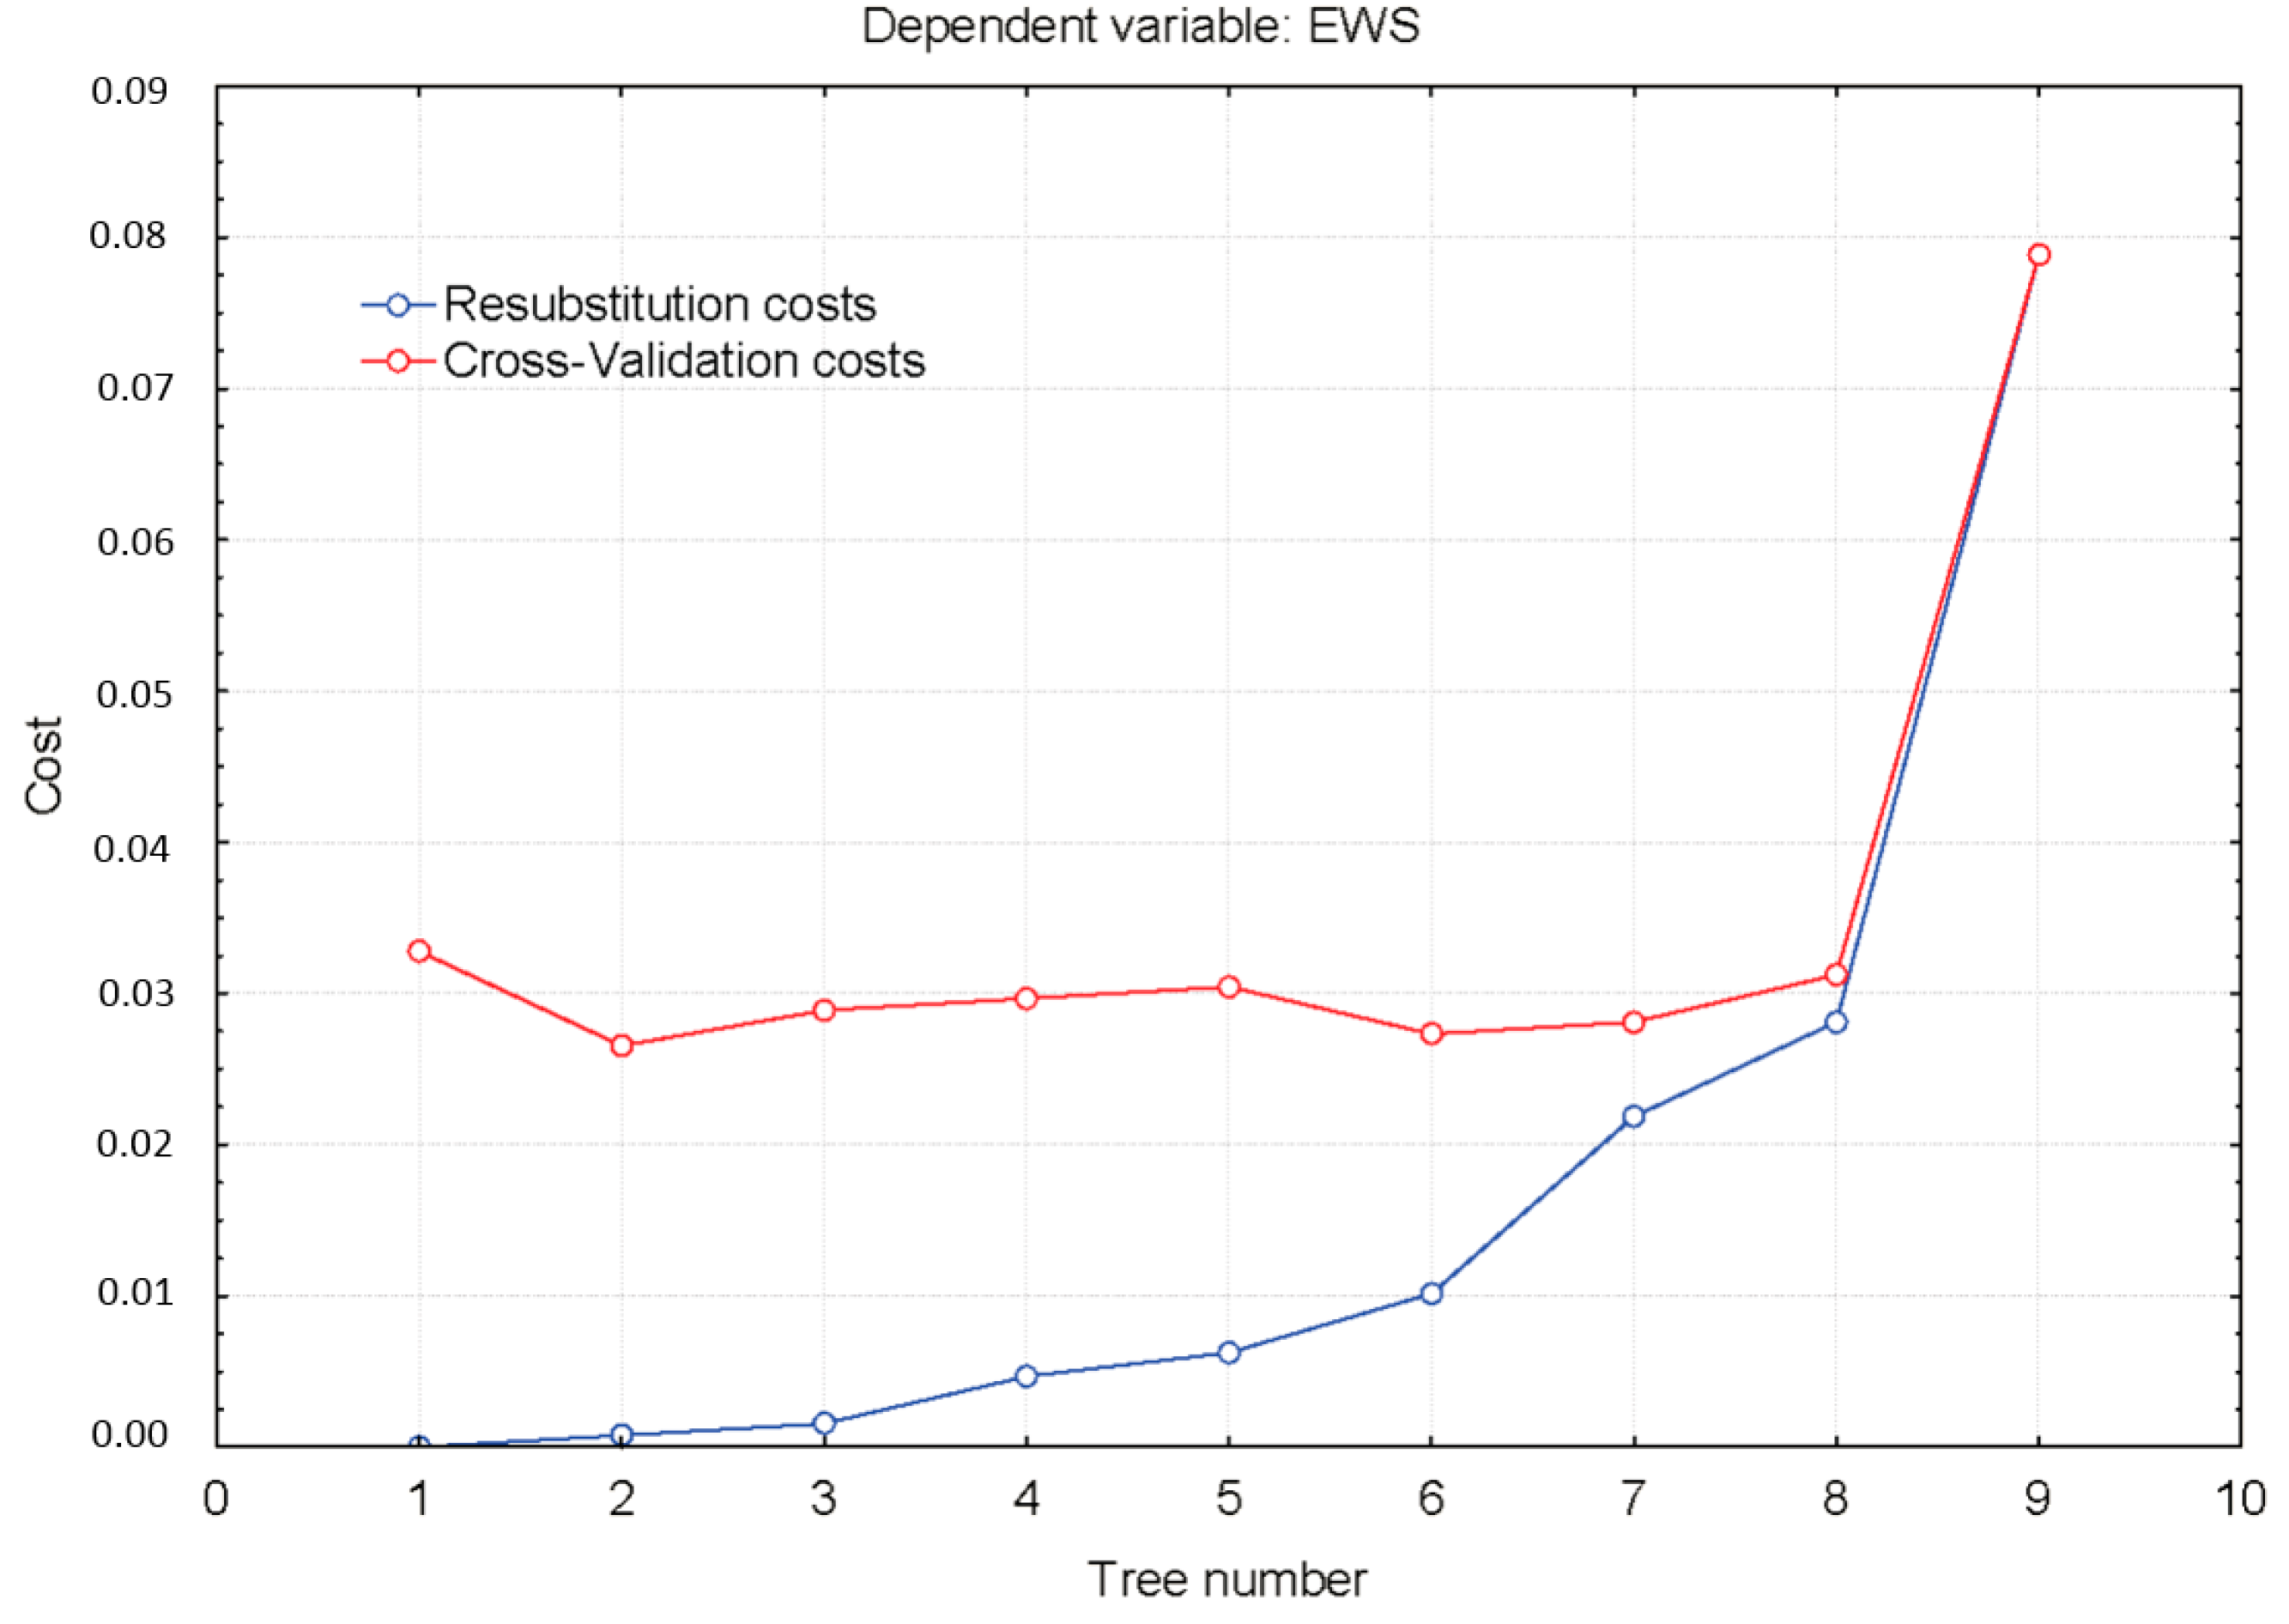
As a stopping rule during classification tree calculation, prune on misclassification error criteria was used as described in Breiman et al. [21]. The pruning process results in a sequence of optimally pruned trees and a criterion to select the “right-sized” tree is applied afterwards. Trees with smallest misclassification costs often have hidden over-fitting. Thus, it is needed to make automatic tree selection procedure to avoid “over fitting” and “under fitting” of the data. To distinguish calculated trees, re-substitution costs and cross-validation costs are calculated according to [21] for all trees and cost sequence is shown on the figure below (Figure 10).
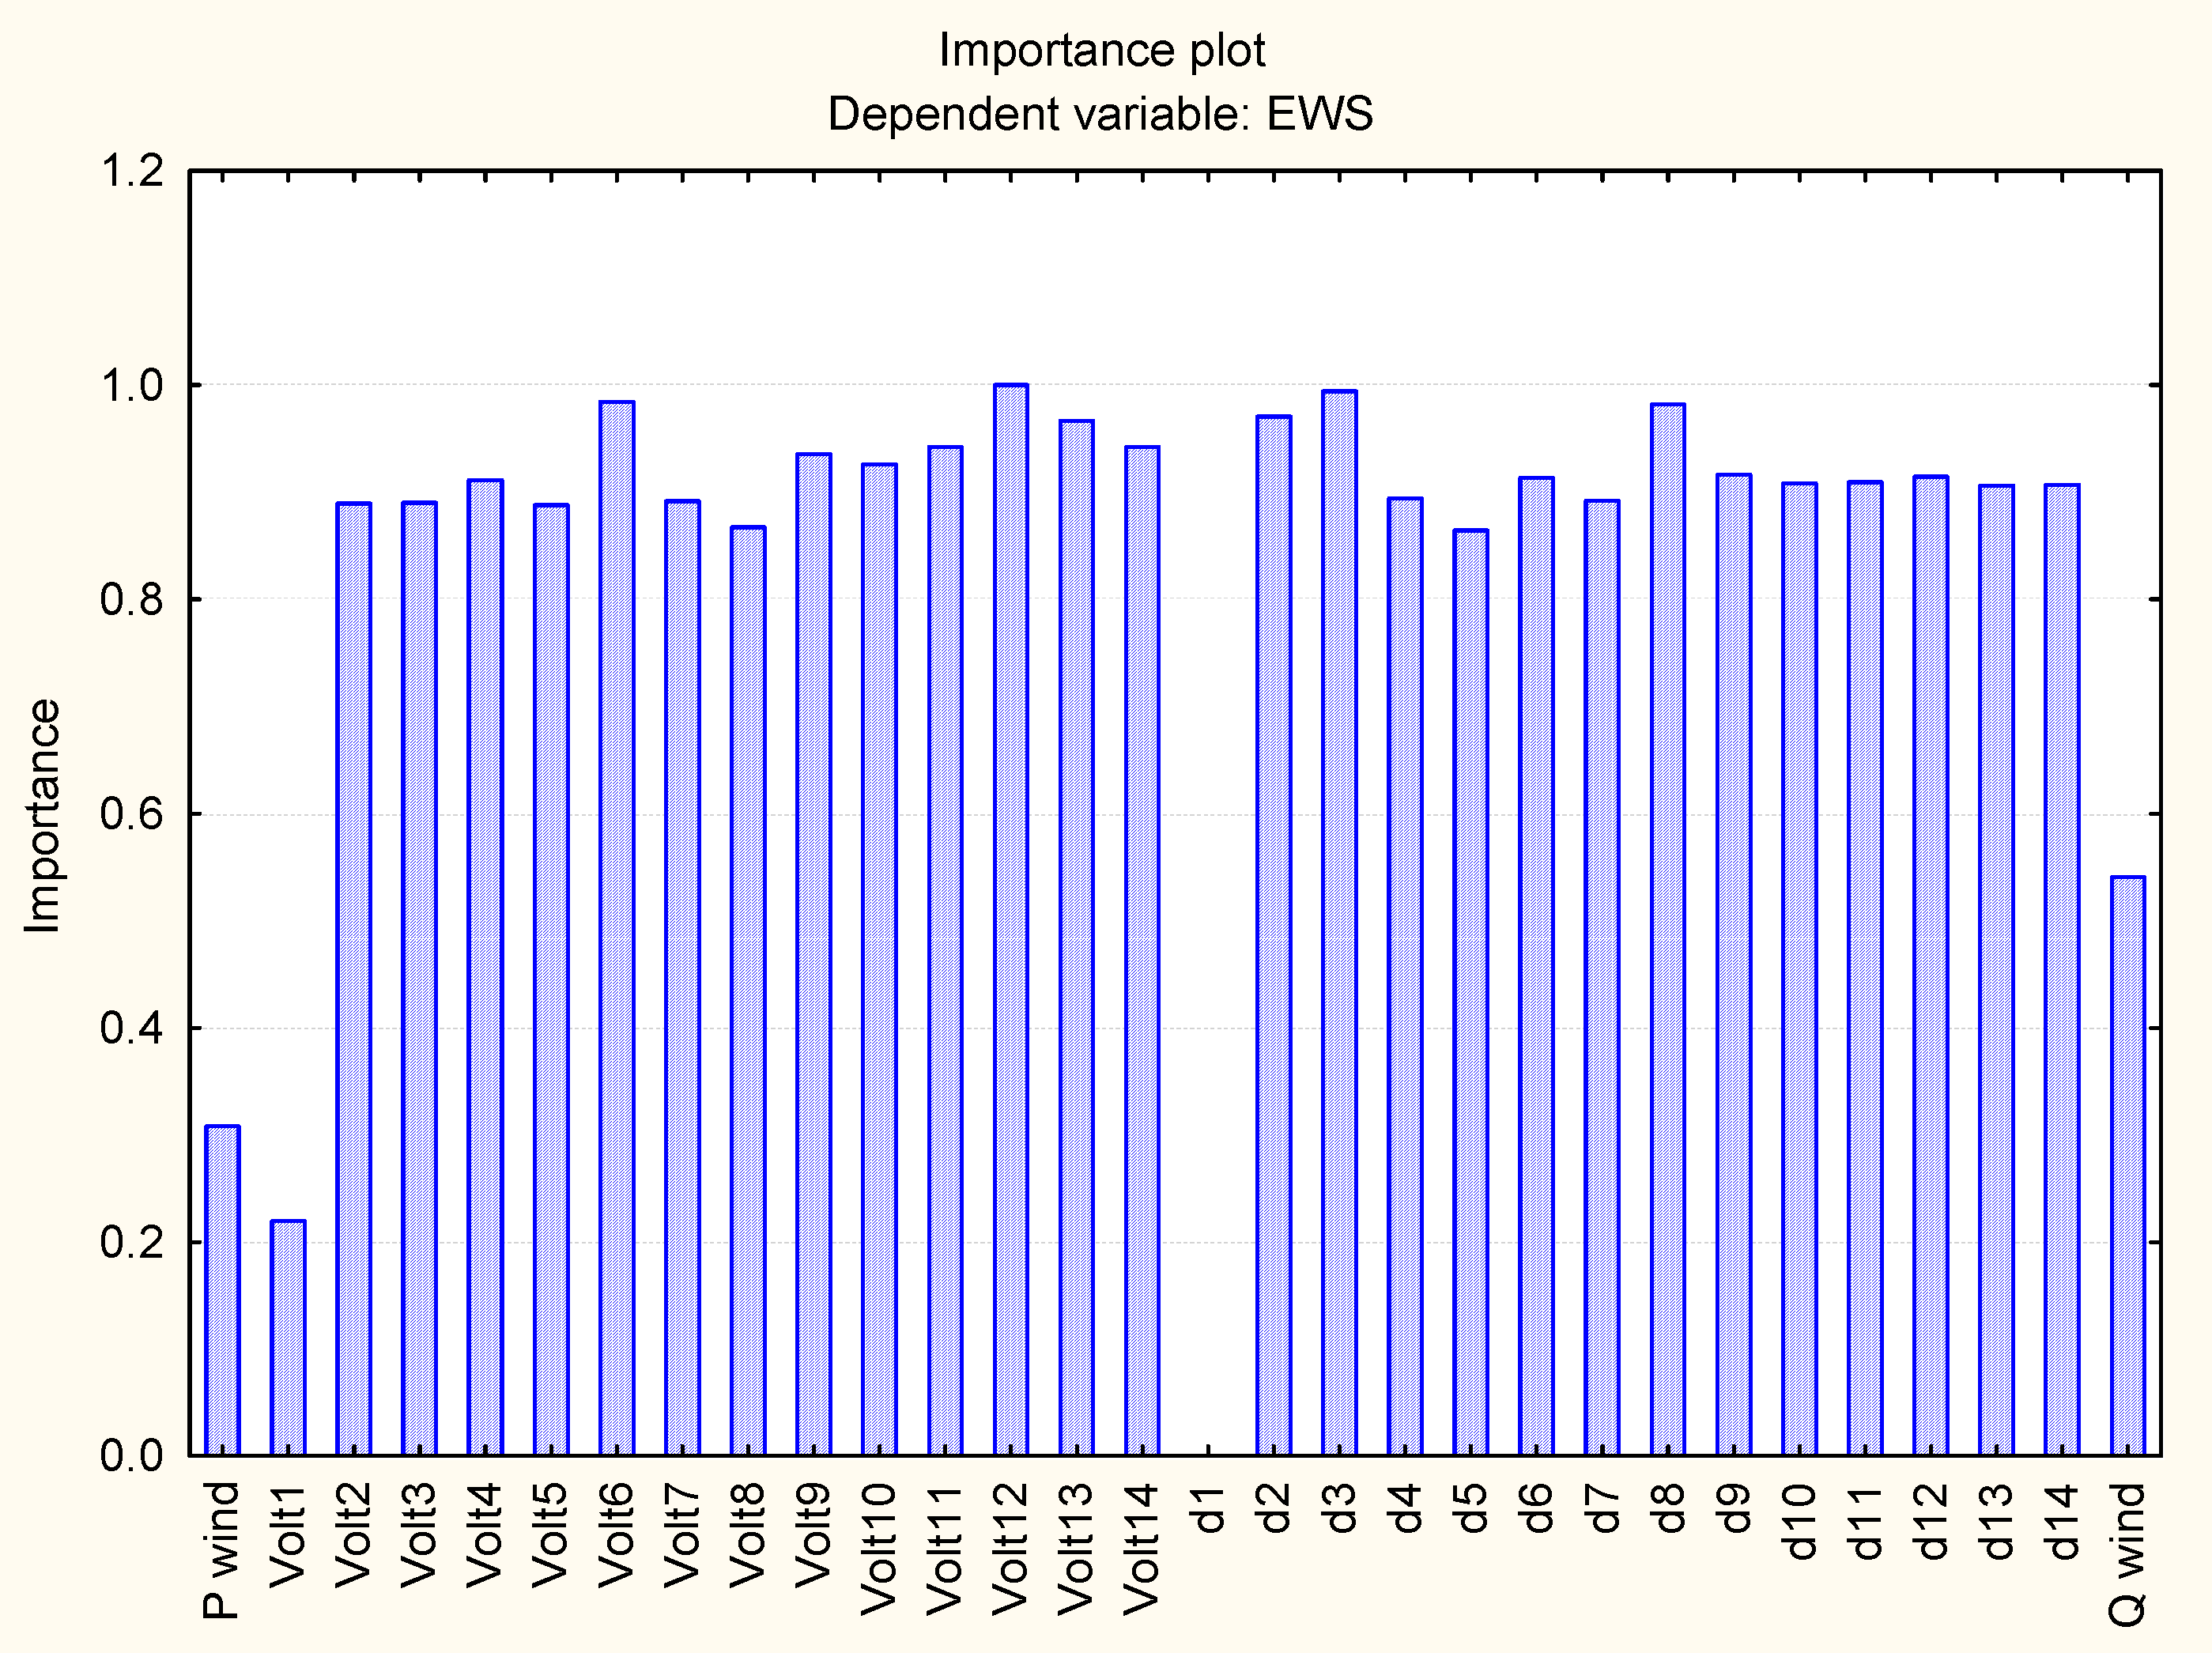
For making the selections “1 Standard error rule” proposed by Breiman et al. [21] proposed a “1, of the “right-sized” tree. In this way, tree number 2 is selected to avoid “over fitting” and “under fitting” of the data (Figure 10). Also, through this classification analysis, it is possible to calculate importance for all independent variables according to the definition of variable importance given in [21]. Importance for all dependent variables is given on a Figure 11.
Practically all voltage and angle measurements from PMU devices have very high importance, except measurements from node 1 which was chosen as the slack busbar. Voltage angles (d1, d2, to d14) have very high importance which is understandable since they represent active power flows. Wind power active power production and reactive power settings have lower importance which can be described through moderate installed power of wind power plant compared to the network size.
4. Radial Distribution System Example
4.1. Distribution System Description and Operating Conditions
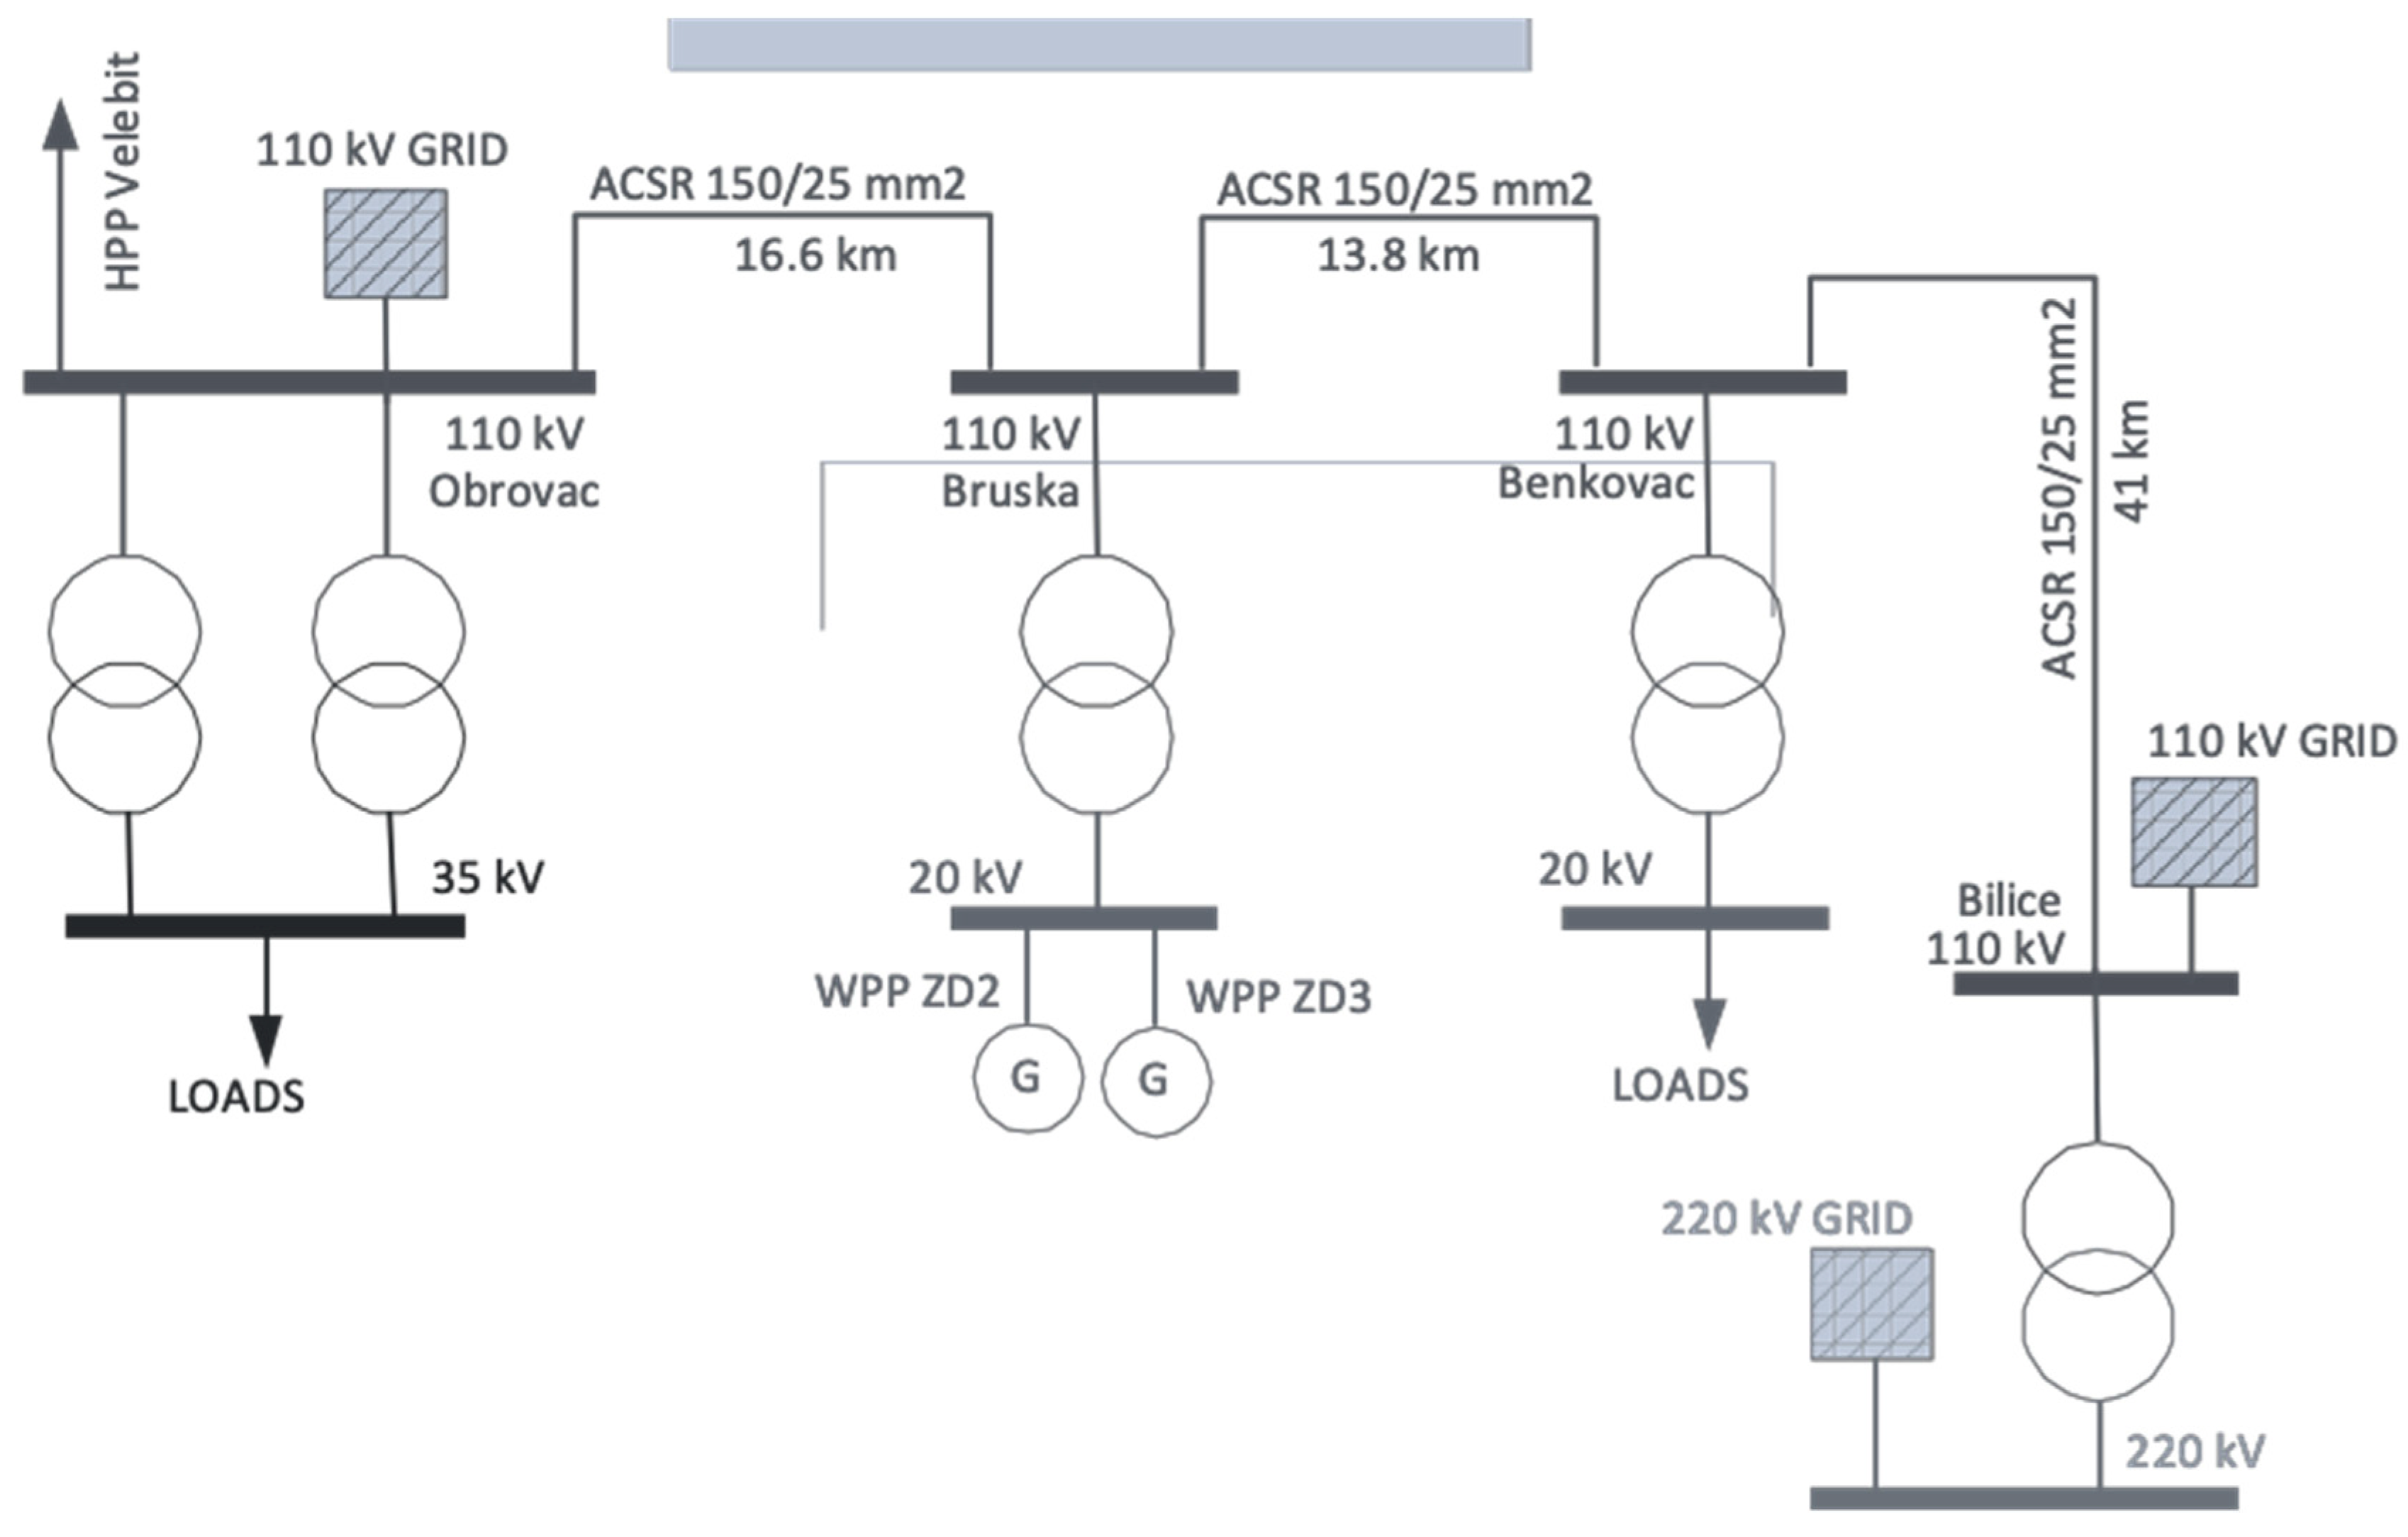
Wind power plant (WPP) VE ZD 6 is 9.2 MW renewable energy source connected to 30 km long radial transmission 35 kV voltage level line in the middle of its length (Figure 12). Subject 35 kV power line is part of distribution system operator network in central Croatia. General characteristics of this network are low loadings especially during the night time. Therefore, large voltage deviations can occur in this relatively long and lightly loaded medium voltage line. Since wind power plant is connected through a T-junction situated in the middle of its length, it can serve as a voltage controller and provide preventive measures for system support.
In this numerical example, synthetic data was used to perform data mining calculations and real operation measurement data was used to verify the model. Measurements were made on the point of common coupling (PCC) using PMU device Arbiter 1133a and metering device ION 7660.
4.2. Distribution System Results
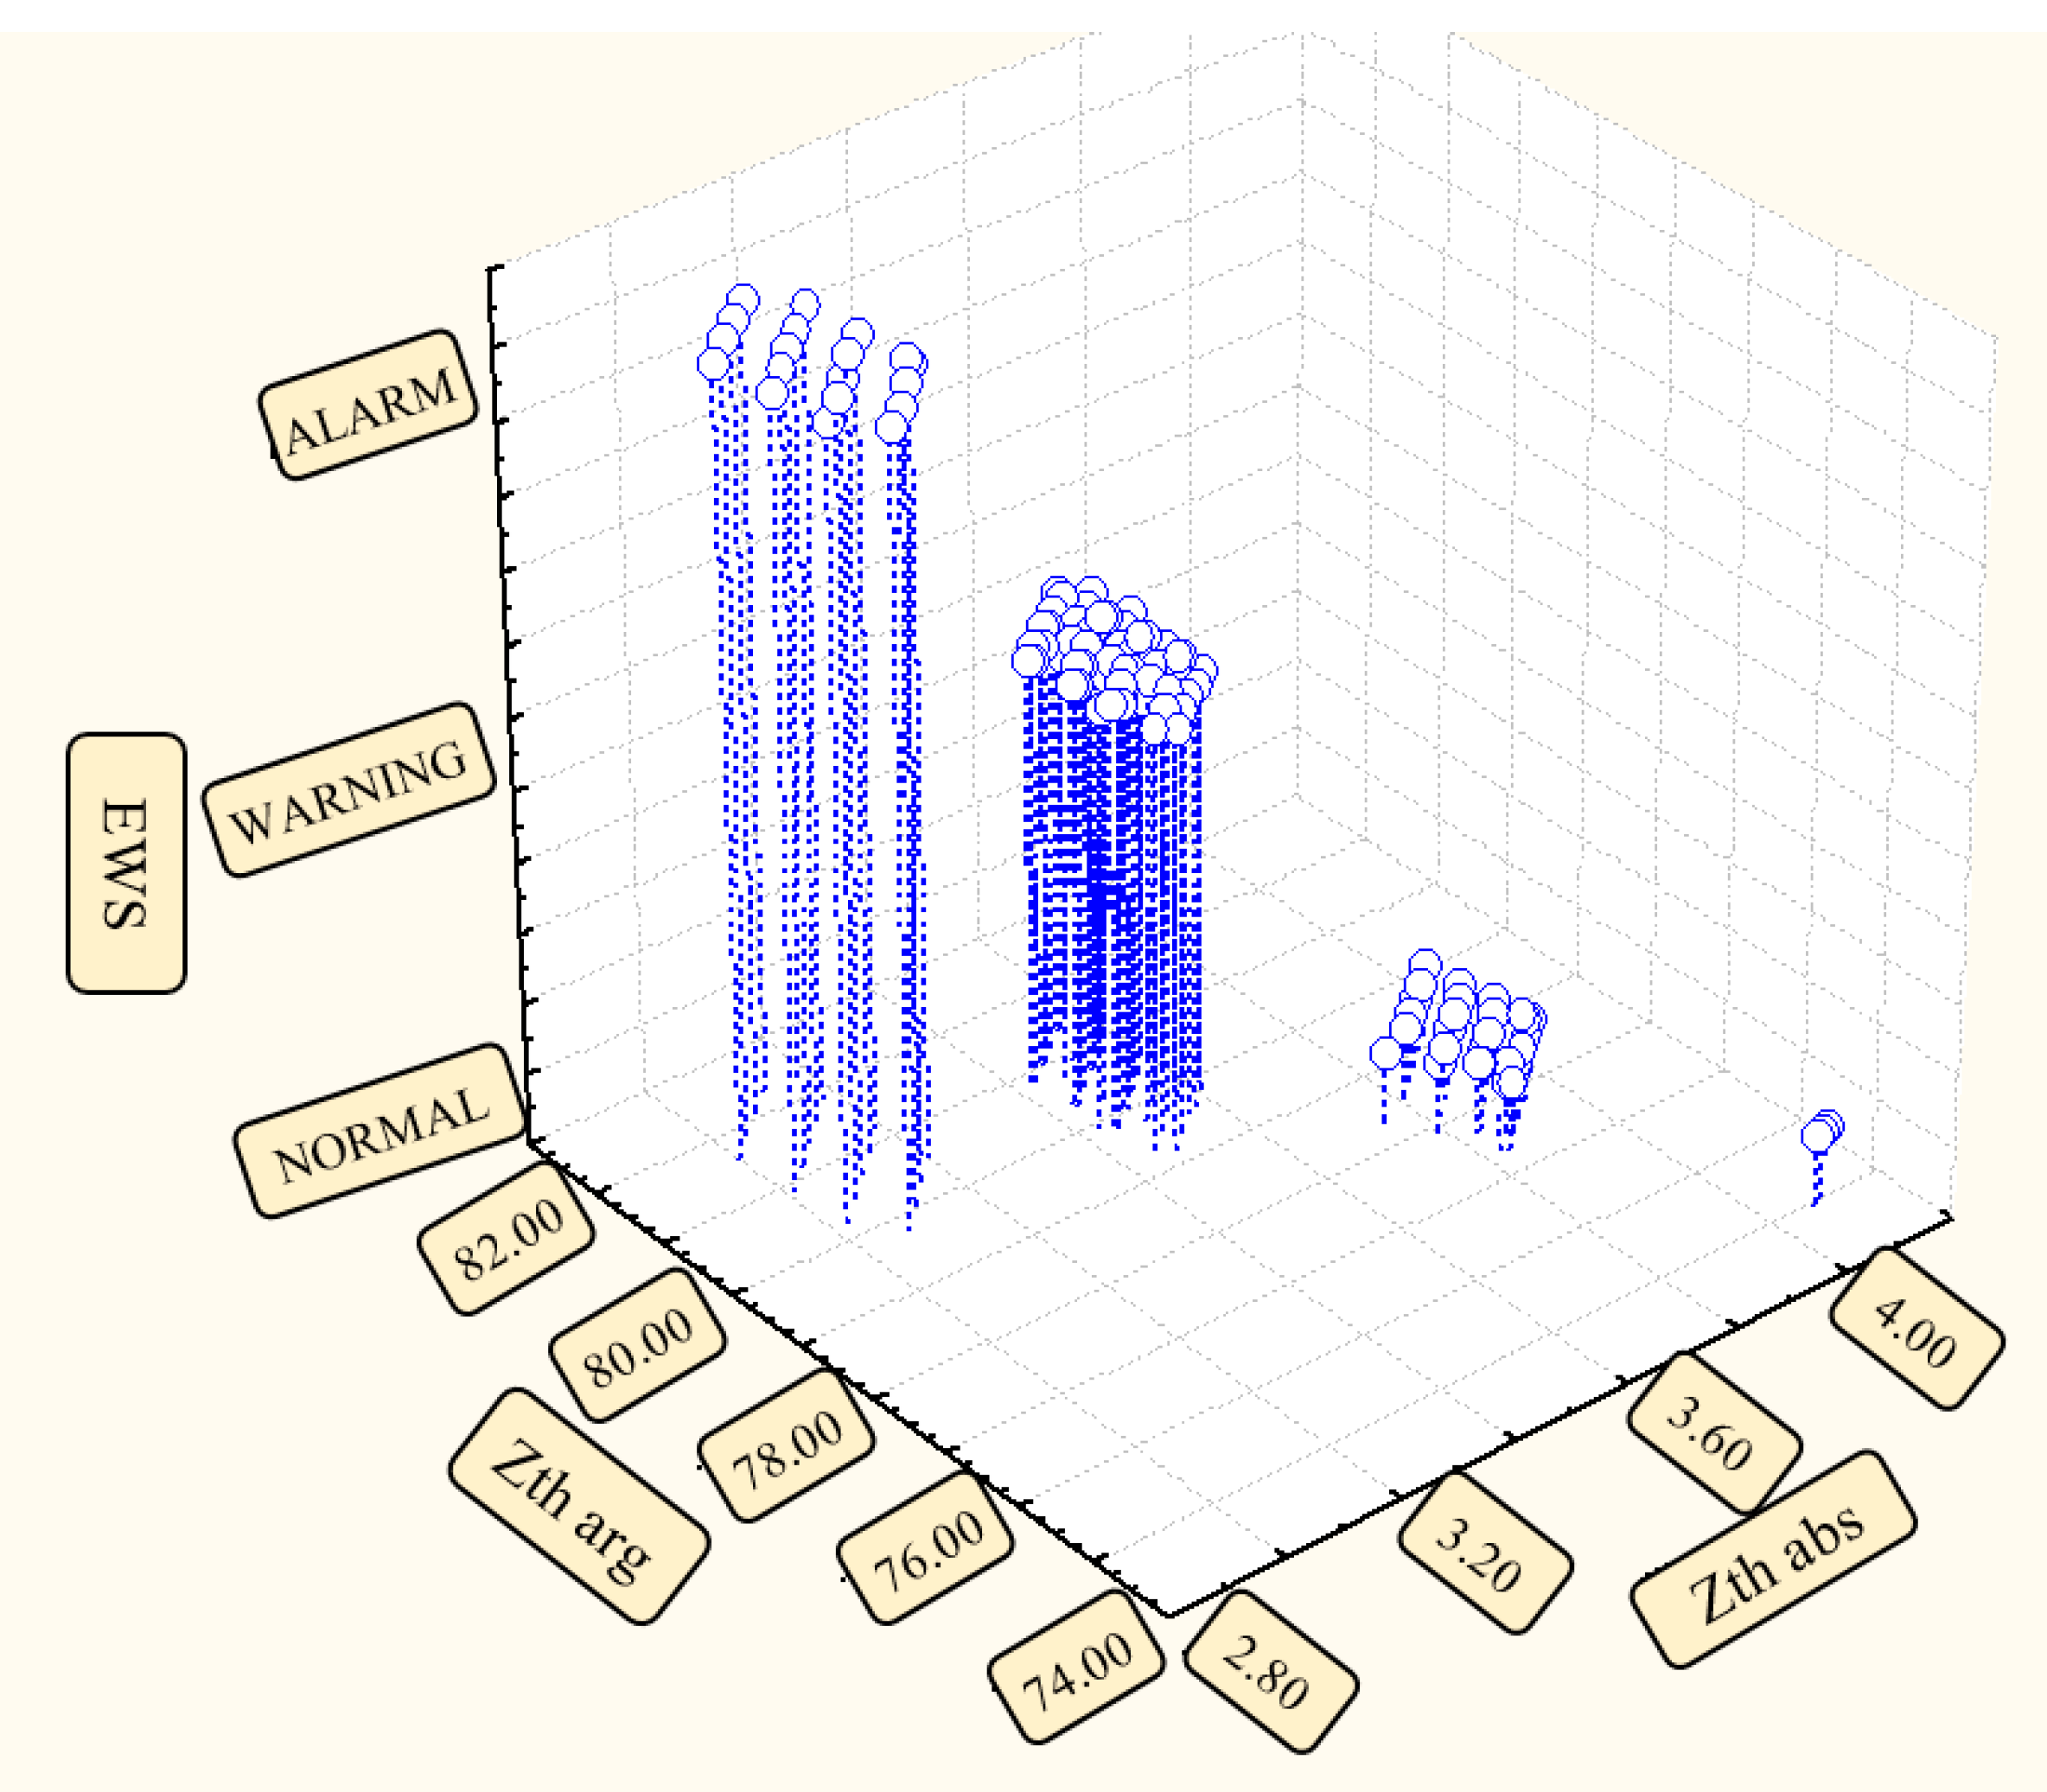
After data clustering, resulting centroids of Thevenin equivalent, for k-means clustering based on a total of 135 training cases, are given in following table (Table 3).
In accordance to the EWS centroids given in Table 3, EWS clustering was made and the results are shown on Figure 13.
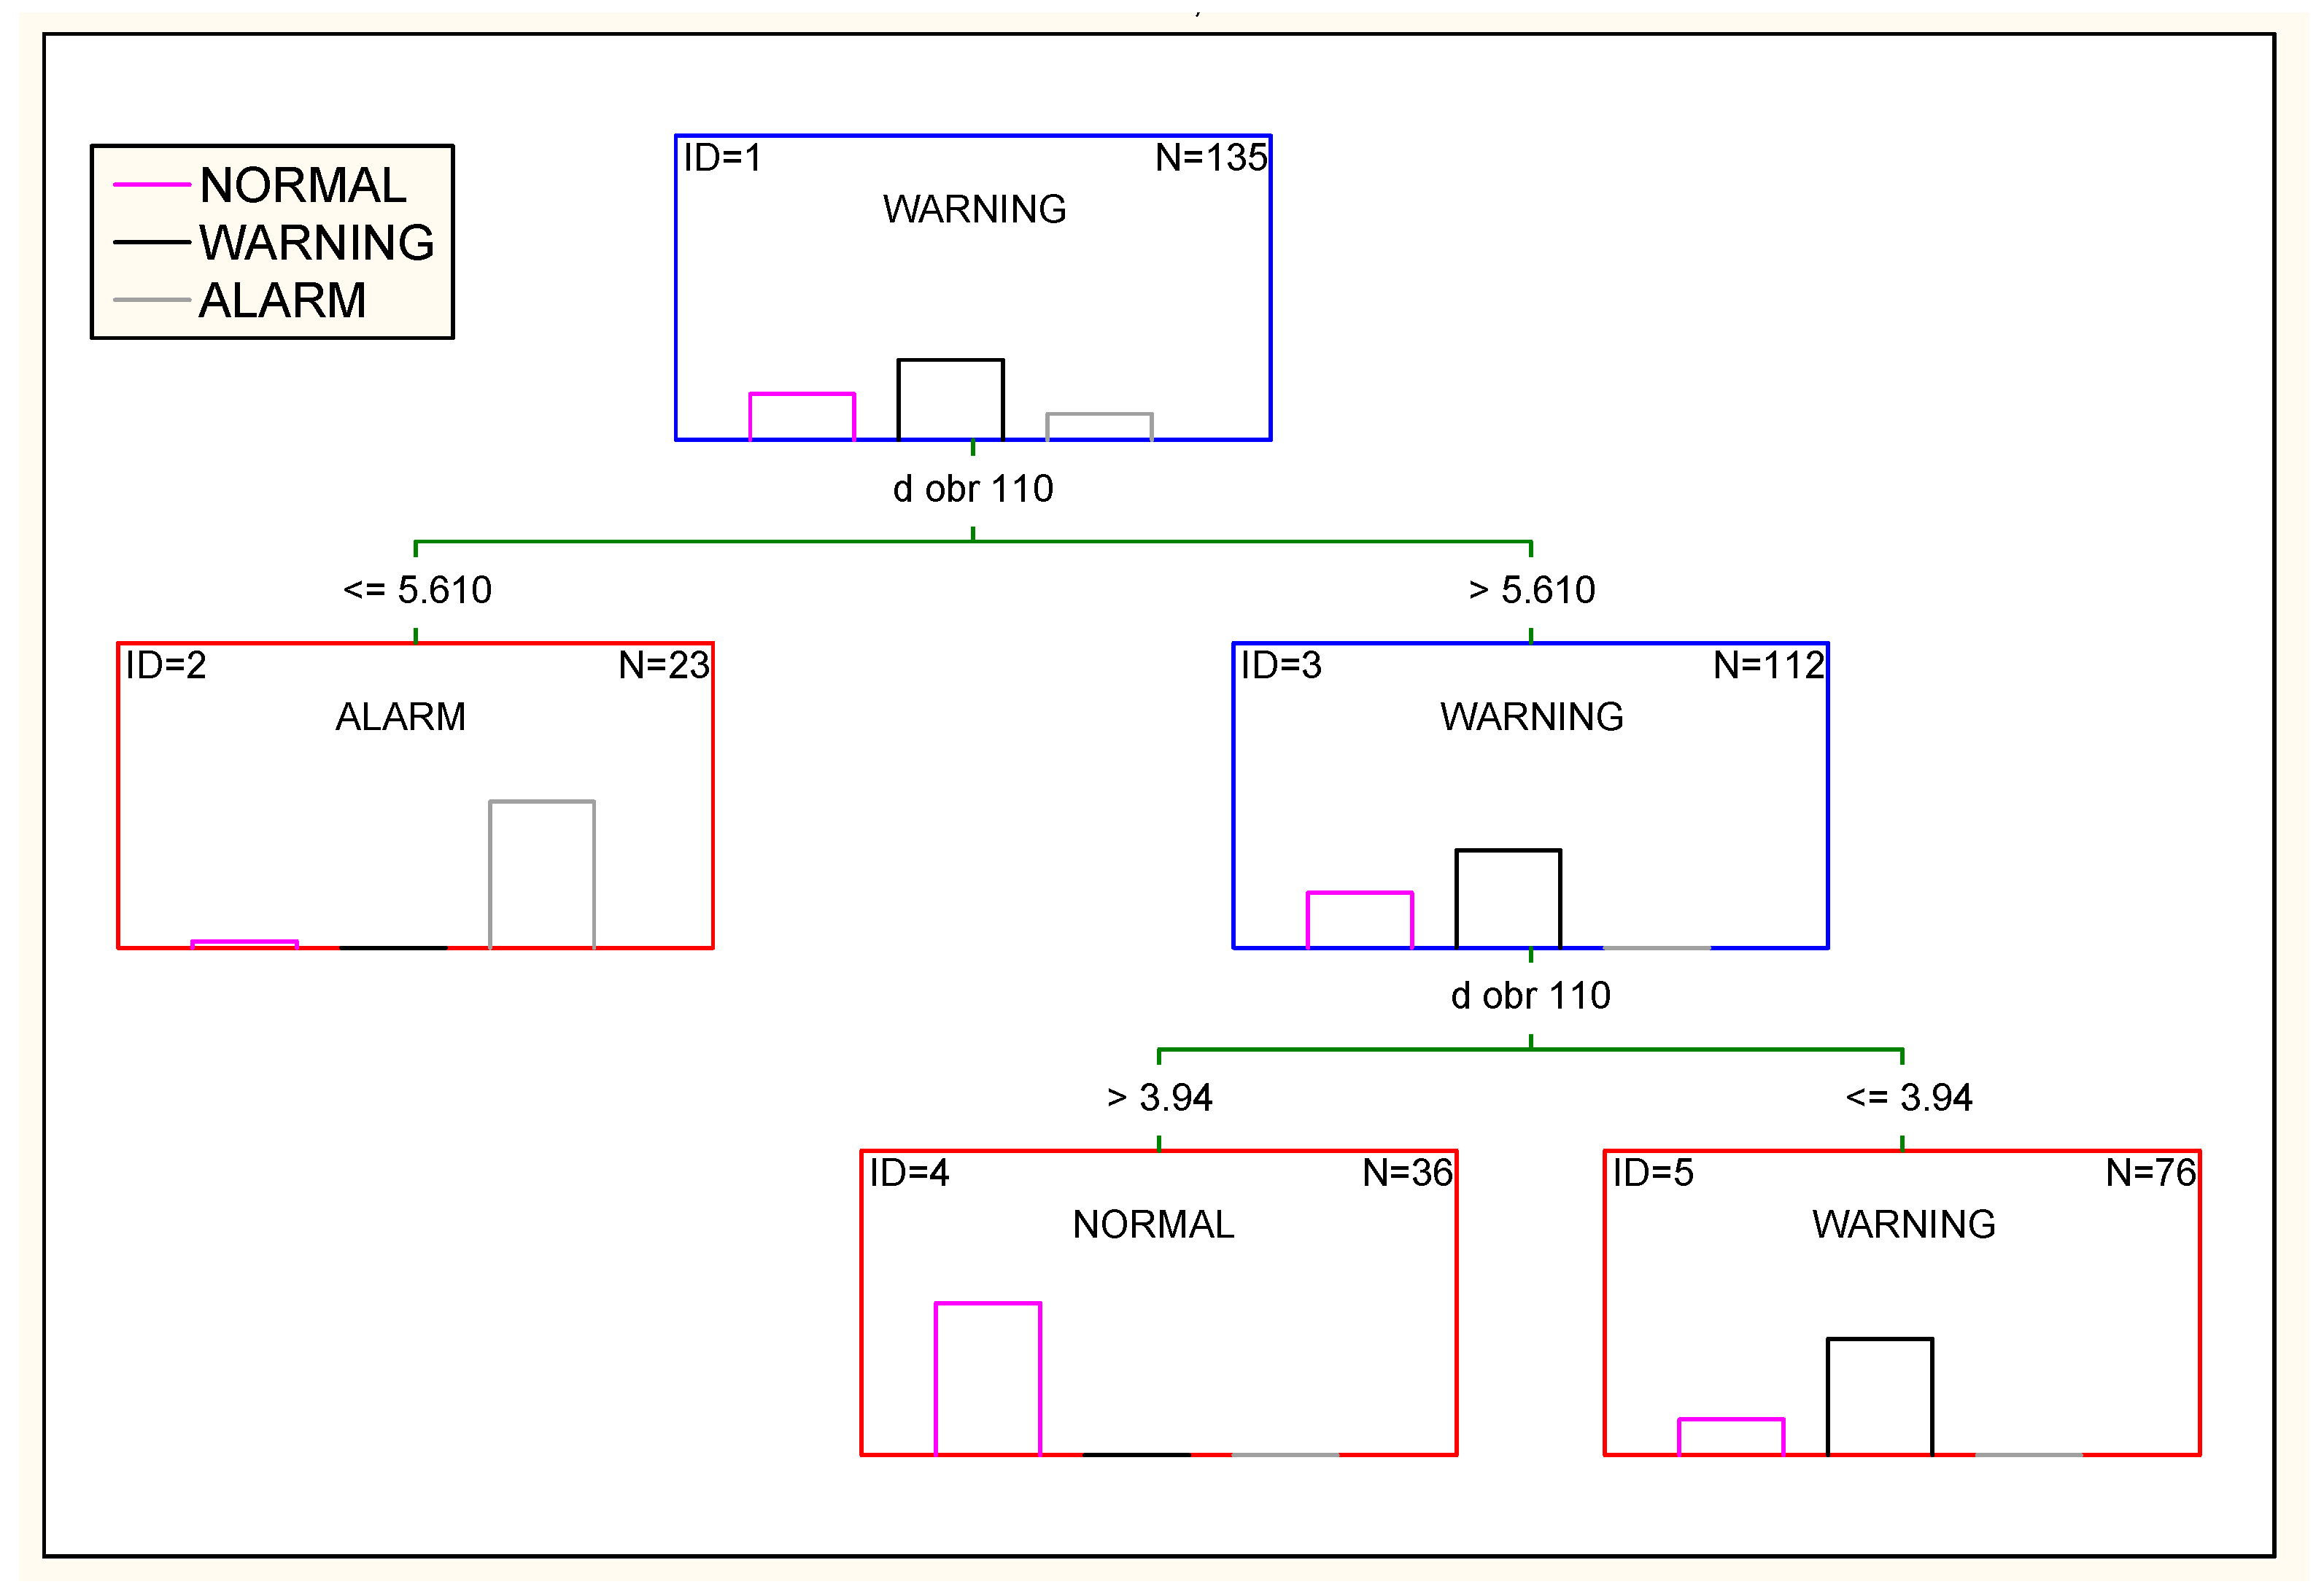
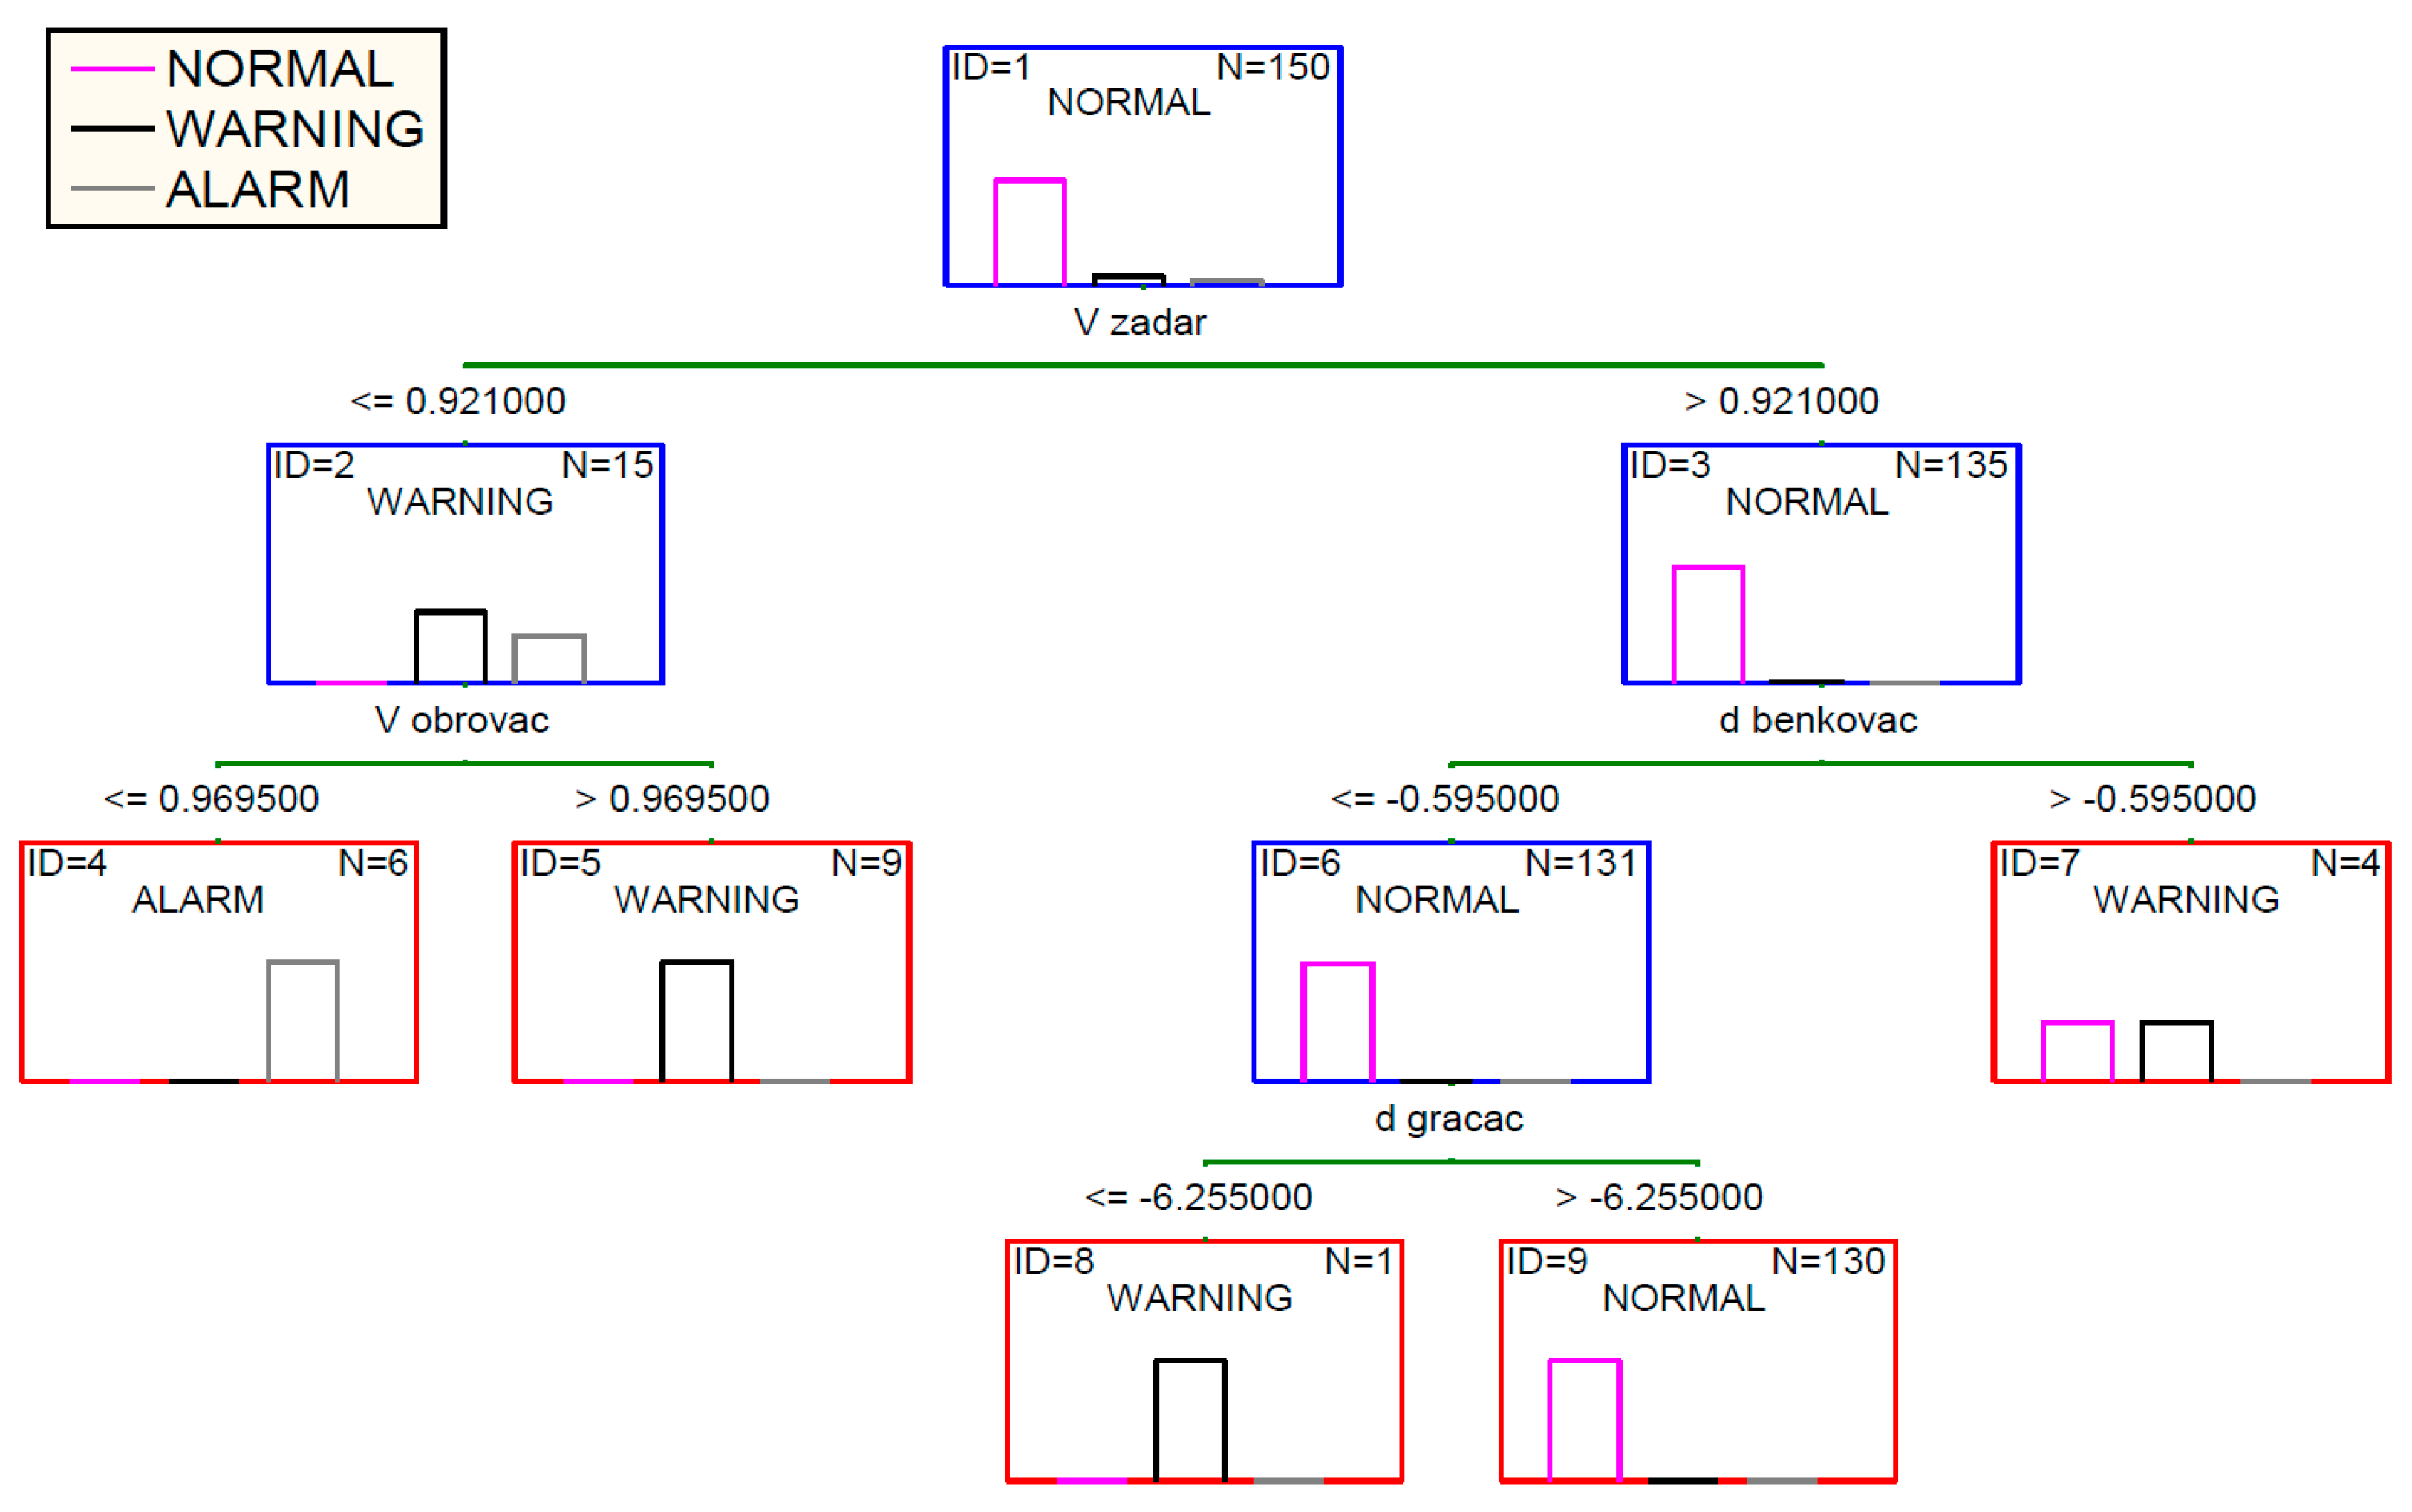
After data classification, resulting C&RT is given in Figure 14. Operating conditions can easily be recognized by monitoring voltage angle at transformer substation 110/35 kV Obrovac.
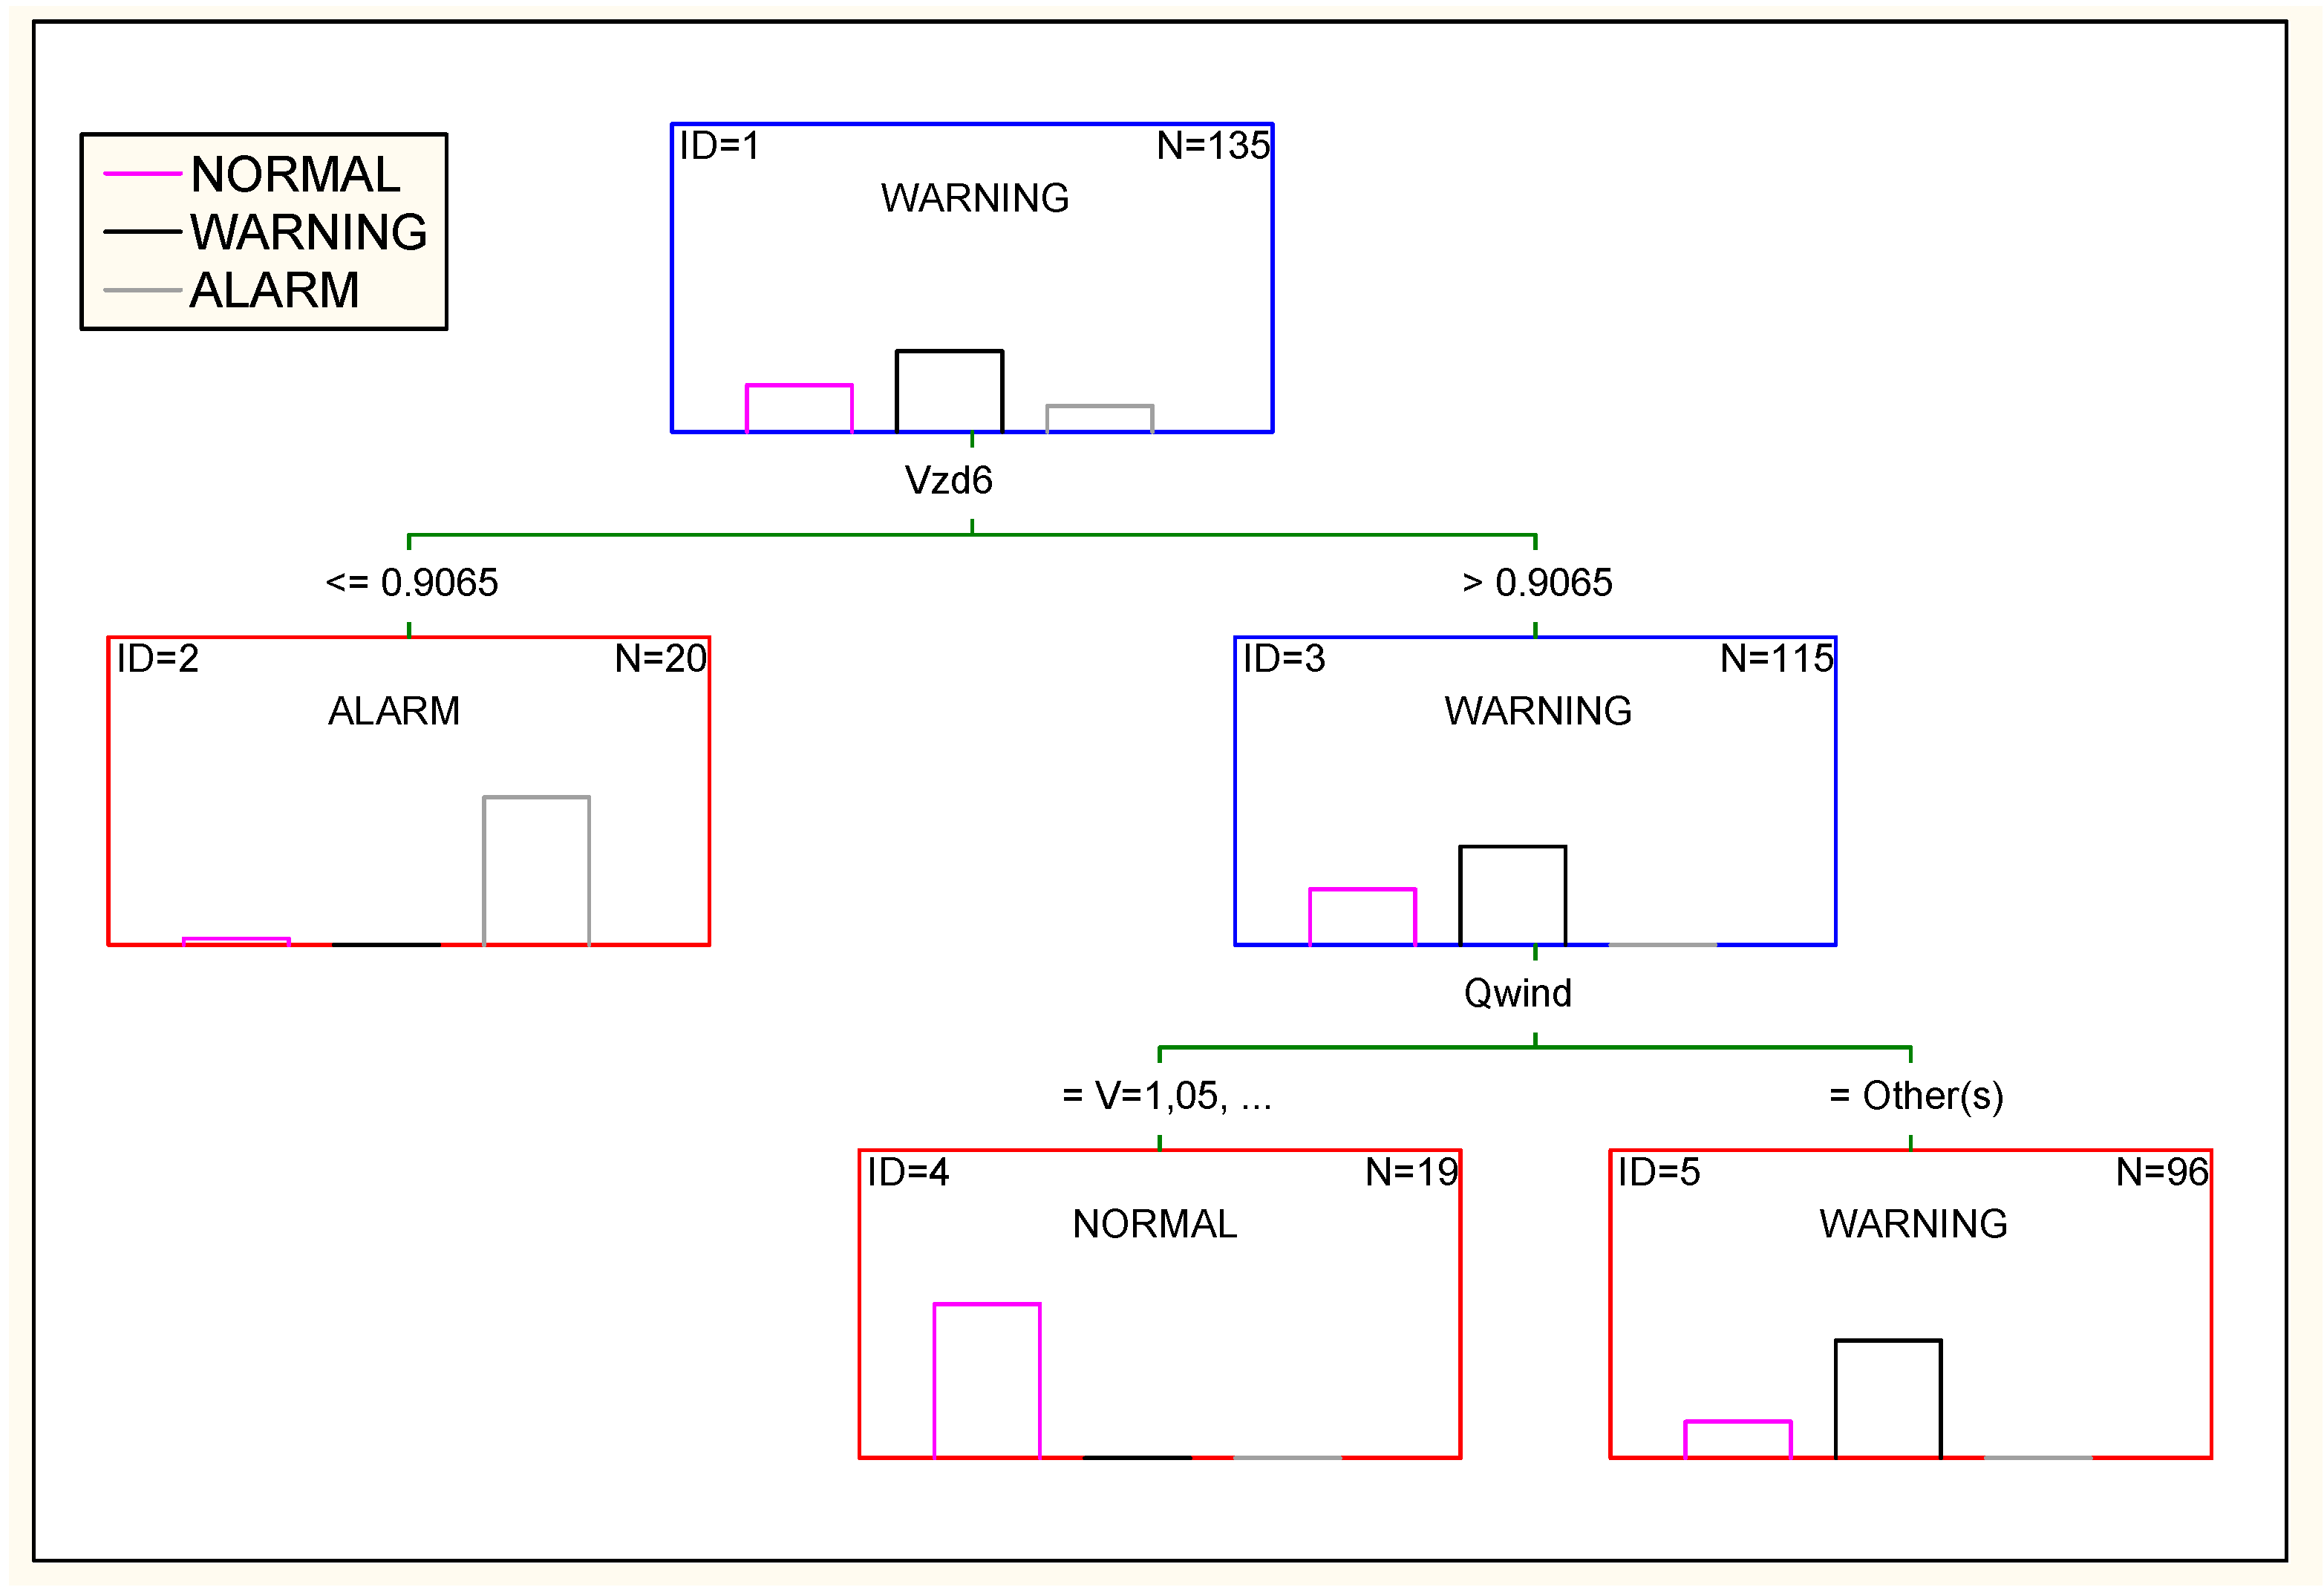
In these figures (Figure 14 and Figure 15) ID represents ordinal number of the decision tree leaf, and N the number of cases on that leaf. Additional classification was made on a reduced set of parameters for a substation 110/35 kV Obrovac, where set of input parameters was built from available measurements since at the testing period real operation measurements were not available. Those measurements include voltage amplitudes and voltage angles, as well as active and reactive power at PCC of WPP VE ZD 6. Voltage angle was measured with reference angle at transformer substation 400/110 kV Velebit. This high voltage node was also defined as slack node in the calculations of operating conditions.
With such reduced set of input parameters, it is evident that there are only two variables in the classification tree of decision-making process: effective values of voltage at the PCC and the settings of reactive power control. Therefore, in defining the conditions in the local network around the WPP, it is enough to monitor the effective voltage values at that PCC and base decision making on that variable.
Decision-making in this case refers to the change of the wind power for reactive power production to aid the system conditions. The peak power of the WPP is 9.2 MW which can easily be evacuated through the corresponding 35 kV transmission line (approximately 16 km long). The problem occurs in regard to the voltage security of the power system. Final operating decision making thus results in Psetting = max {PWIND} = 9.2 MW and Qsetting = min {QWIND} = Const. φ = 1 for all operating conditions with voltages at PCC above 31.7275 kV (0.9065 p.u). 31.7275 kV (0.9065 p.u) represents the critical voltage value that was obtained through the analysis process.
5. Meshed Transmission System Example
5.1. Transmission System Description and Operating Conditions
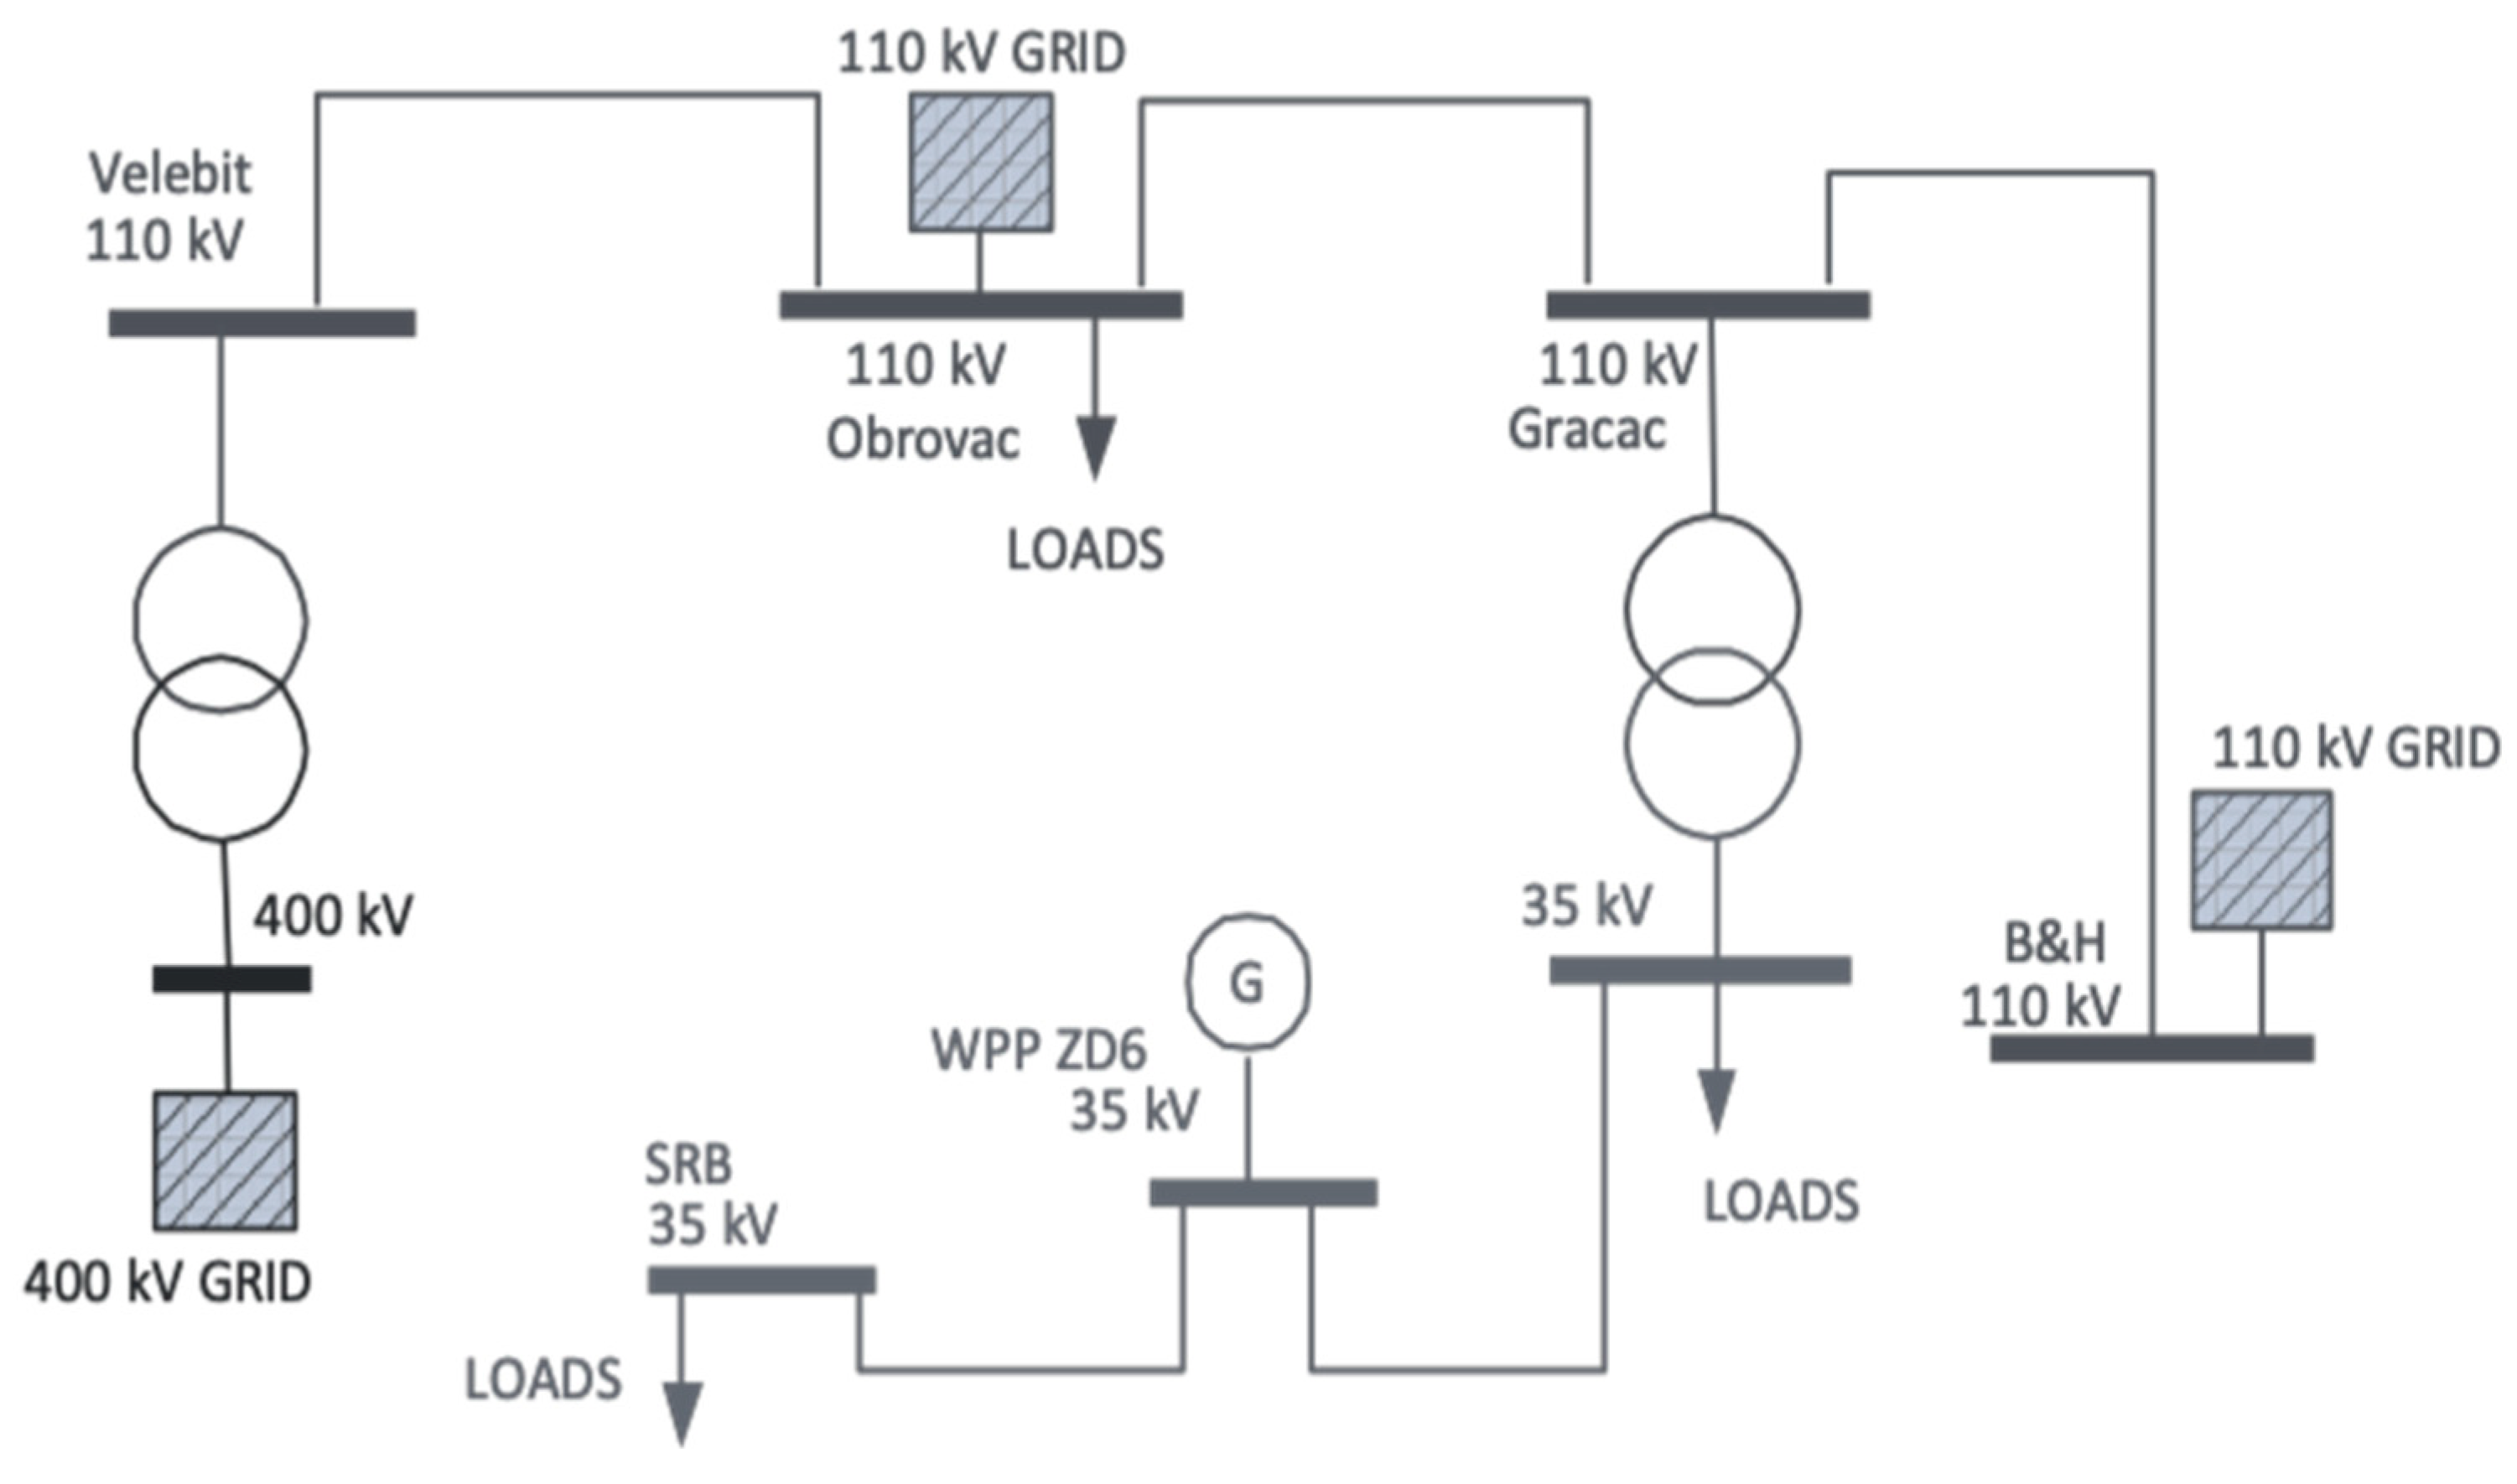
Wind power plant (WPP) VE ZD 2&ZD 3 has a capacity of 36.8 MW and is connected to meshed 110 kV grid (Figure 16). Subject 110 kV network is part of transmission system operator network in southern Croatia. General characteristic of this network are also low loadings, especially during night. Therefore, large voltage deviations occur. Furthermore, the PCC of the wind power plant is represented through the power transformer with rated power of 40 MVA.
In this numerical example, synthetic data was used in order to perform data mining calculations and measurement data was used to verify the model. Measurements were made on point of common coupling (PCC) using PMU device Arbiter 1133a and metering device ION 8800.
5.2. Transmission System Results
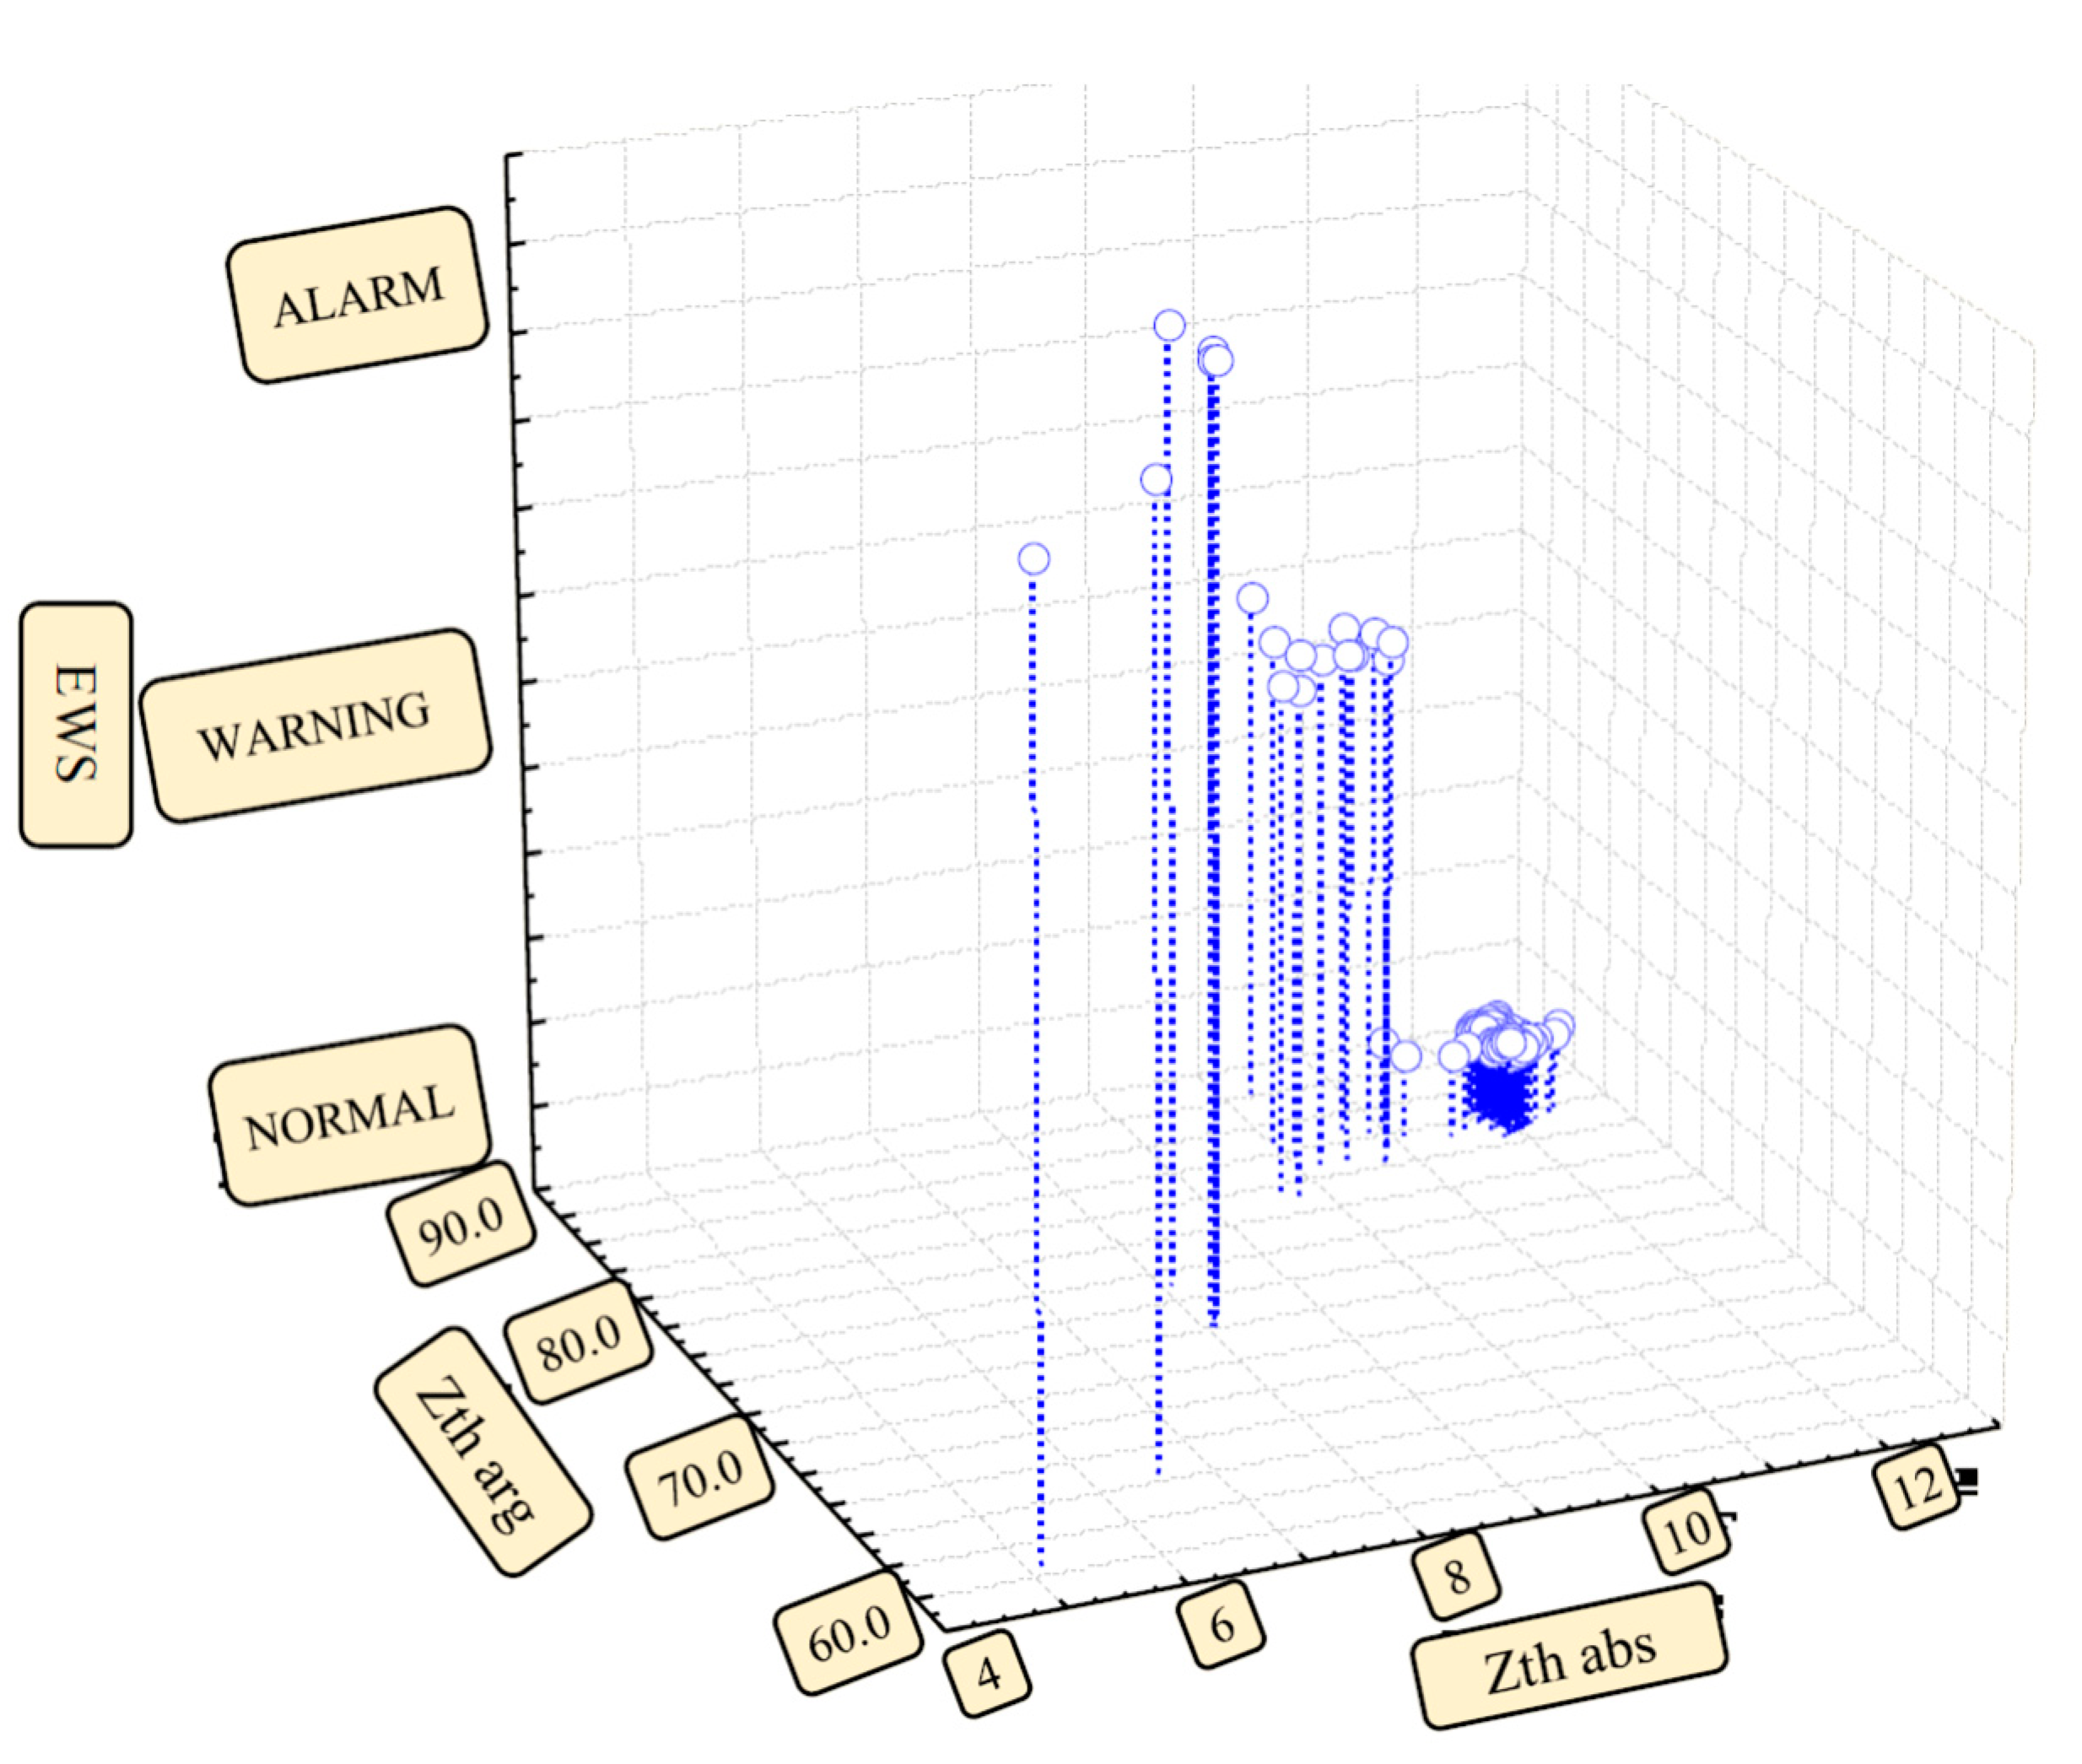
After data clustering, resulting centroids of Thevenin equivalent, for k-means clustering based on a total of 150 training cases, are given in following table (Table 4).
According to EWS centroids given in Table 4, EWS clustering was made and the results are given on Figure 17.
After data classification, resulting C&RT tree is given on figure below (Figure 18). Operating conditions can easily be recognized and predicted by monitoring of voltage amplitudes and voltage angle at 4 influential nodes of the observed segment of the transmission network.
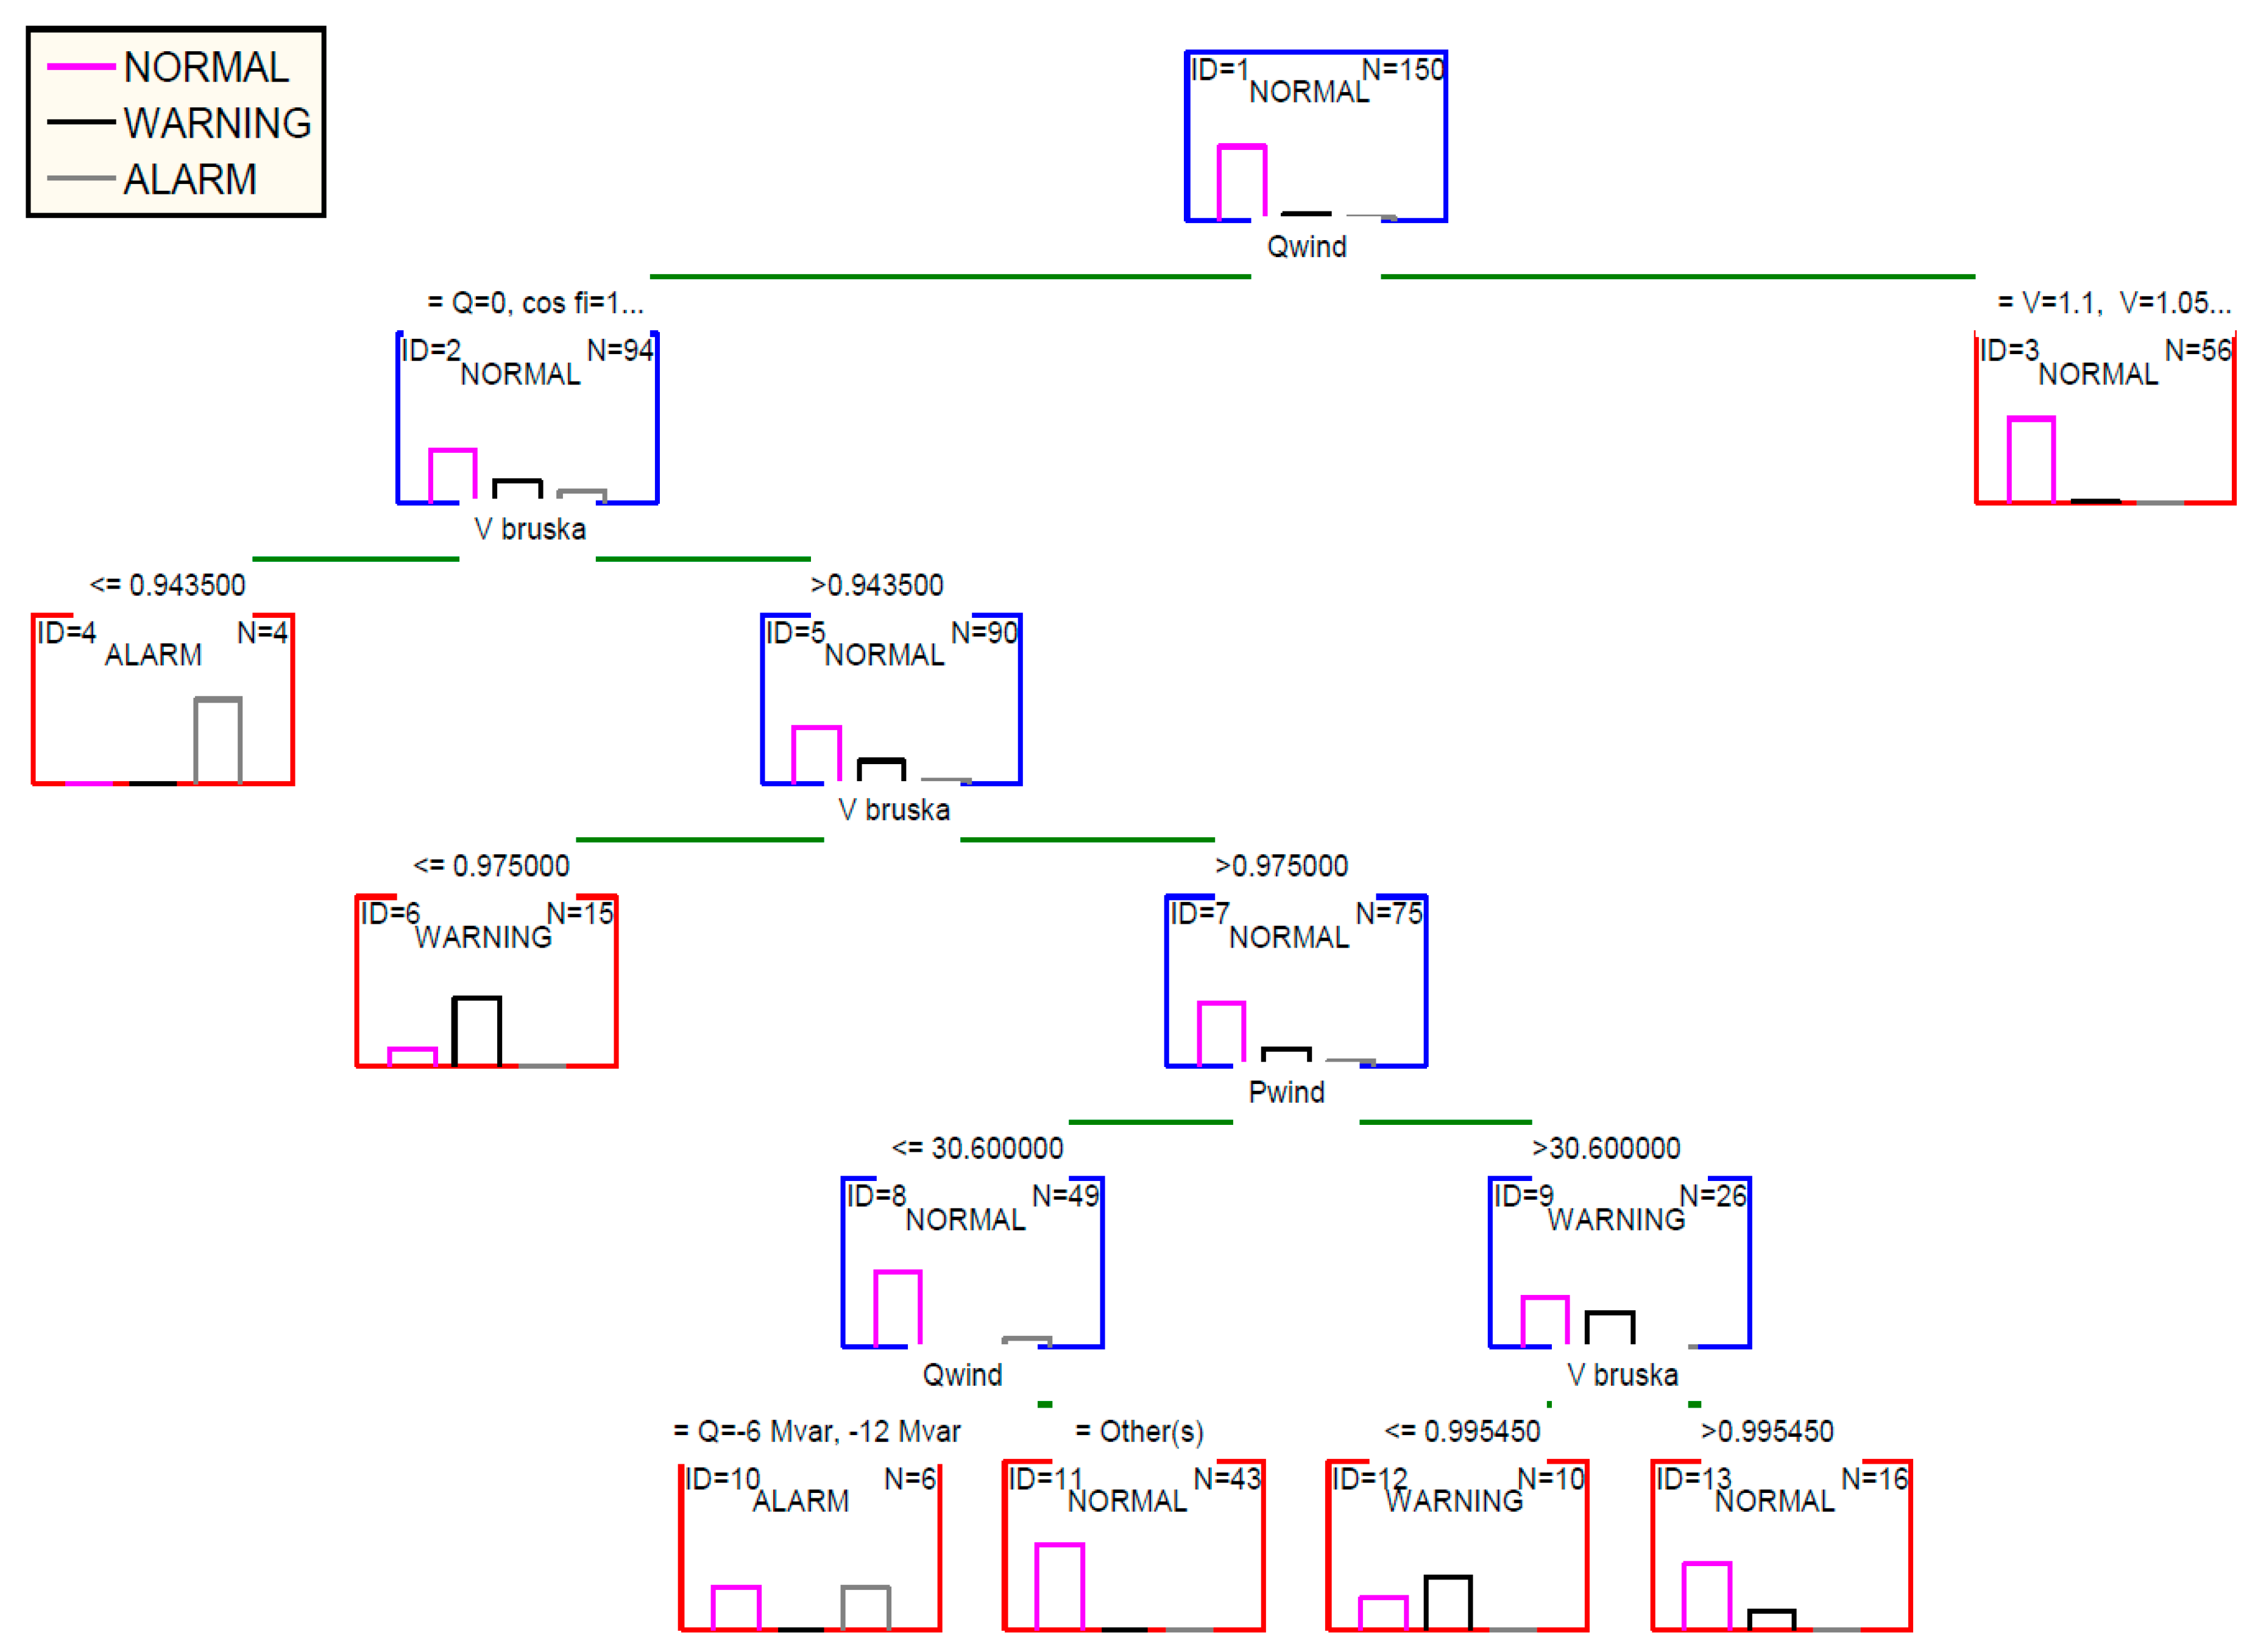
During testing, only measurements at substation 110/20 kV Bruska were made. Therefore, additional classification is made on a reduced set of parameters, where set of input parameters was built from available measurements (Figure 19). Those measurements include voltage amplitudes and voltage angles, as well as active and reactive power production measured on PCC of WPP VE ZD 2 & ZD 3. Voltage angle was measured with reference to angle at substation 400/110 kV Velebit. This node was also defined as slack node in the calculations of operating conditions.
It is evident that there are several variables in the classification tree of the decision-making process that have significant importance:
- WPP reactive power production setting;
- Voltage amplitudes at substation 110/20 kV Bruska (PCC of WPP VE ZD 2&ZD 3);
- Curtailment amount of the active power generation of the wind power plant.
Thus, to define the opportunities in a local network around the wind power plant, it is enough to monitor voltage values at that measuring point and reach decisions based on that variable. As a critical voltage value threshold, the value of 0.9435 p.u. i.e., 103.785 kV is defined. When voltage drops below the above-mentioned value at the WPP VE ZD 2 & ZD 3 or at substation 110/20 kV Bruska, critical conditions can be expected in the system.
Decision-making primarily relates to the change of wind power operational regime in regard to the reactive power production. The results are also understandable from the power flows point of view since the installed active power of the wind power plant is 36.8 MW, which is not a problem in the observed segment of the transmission system. The evacuation of installed rated power over a distance of about 16 km over the 110 kV transmission line towards substation 110/35 kV Obrovac and 110/35 kV Benkovac is done without any problems. Therefore, the only problem is the problem of voltage control to avoid out-of-limit voltages through reactive power production regulation.
5.3. Transmission System Model Validation
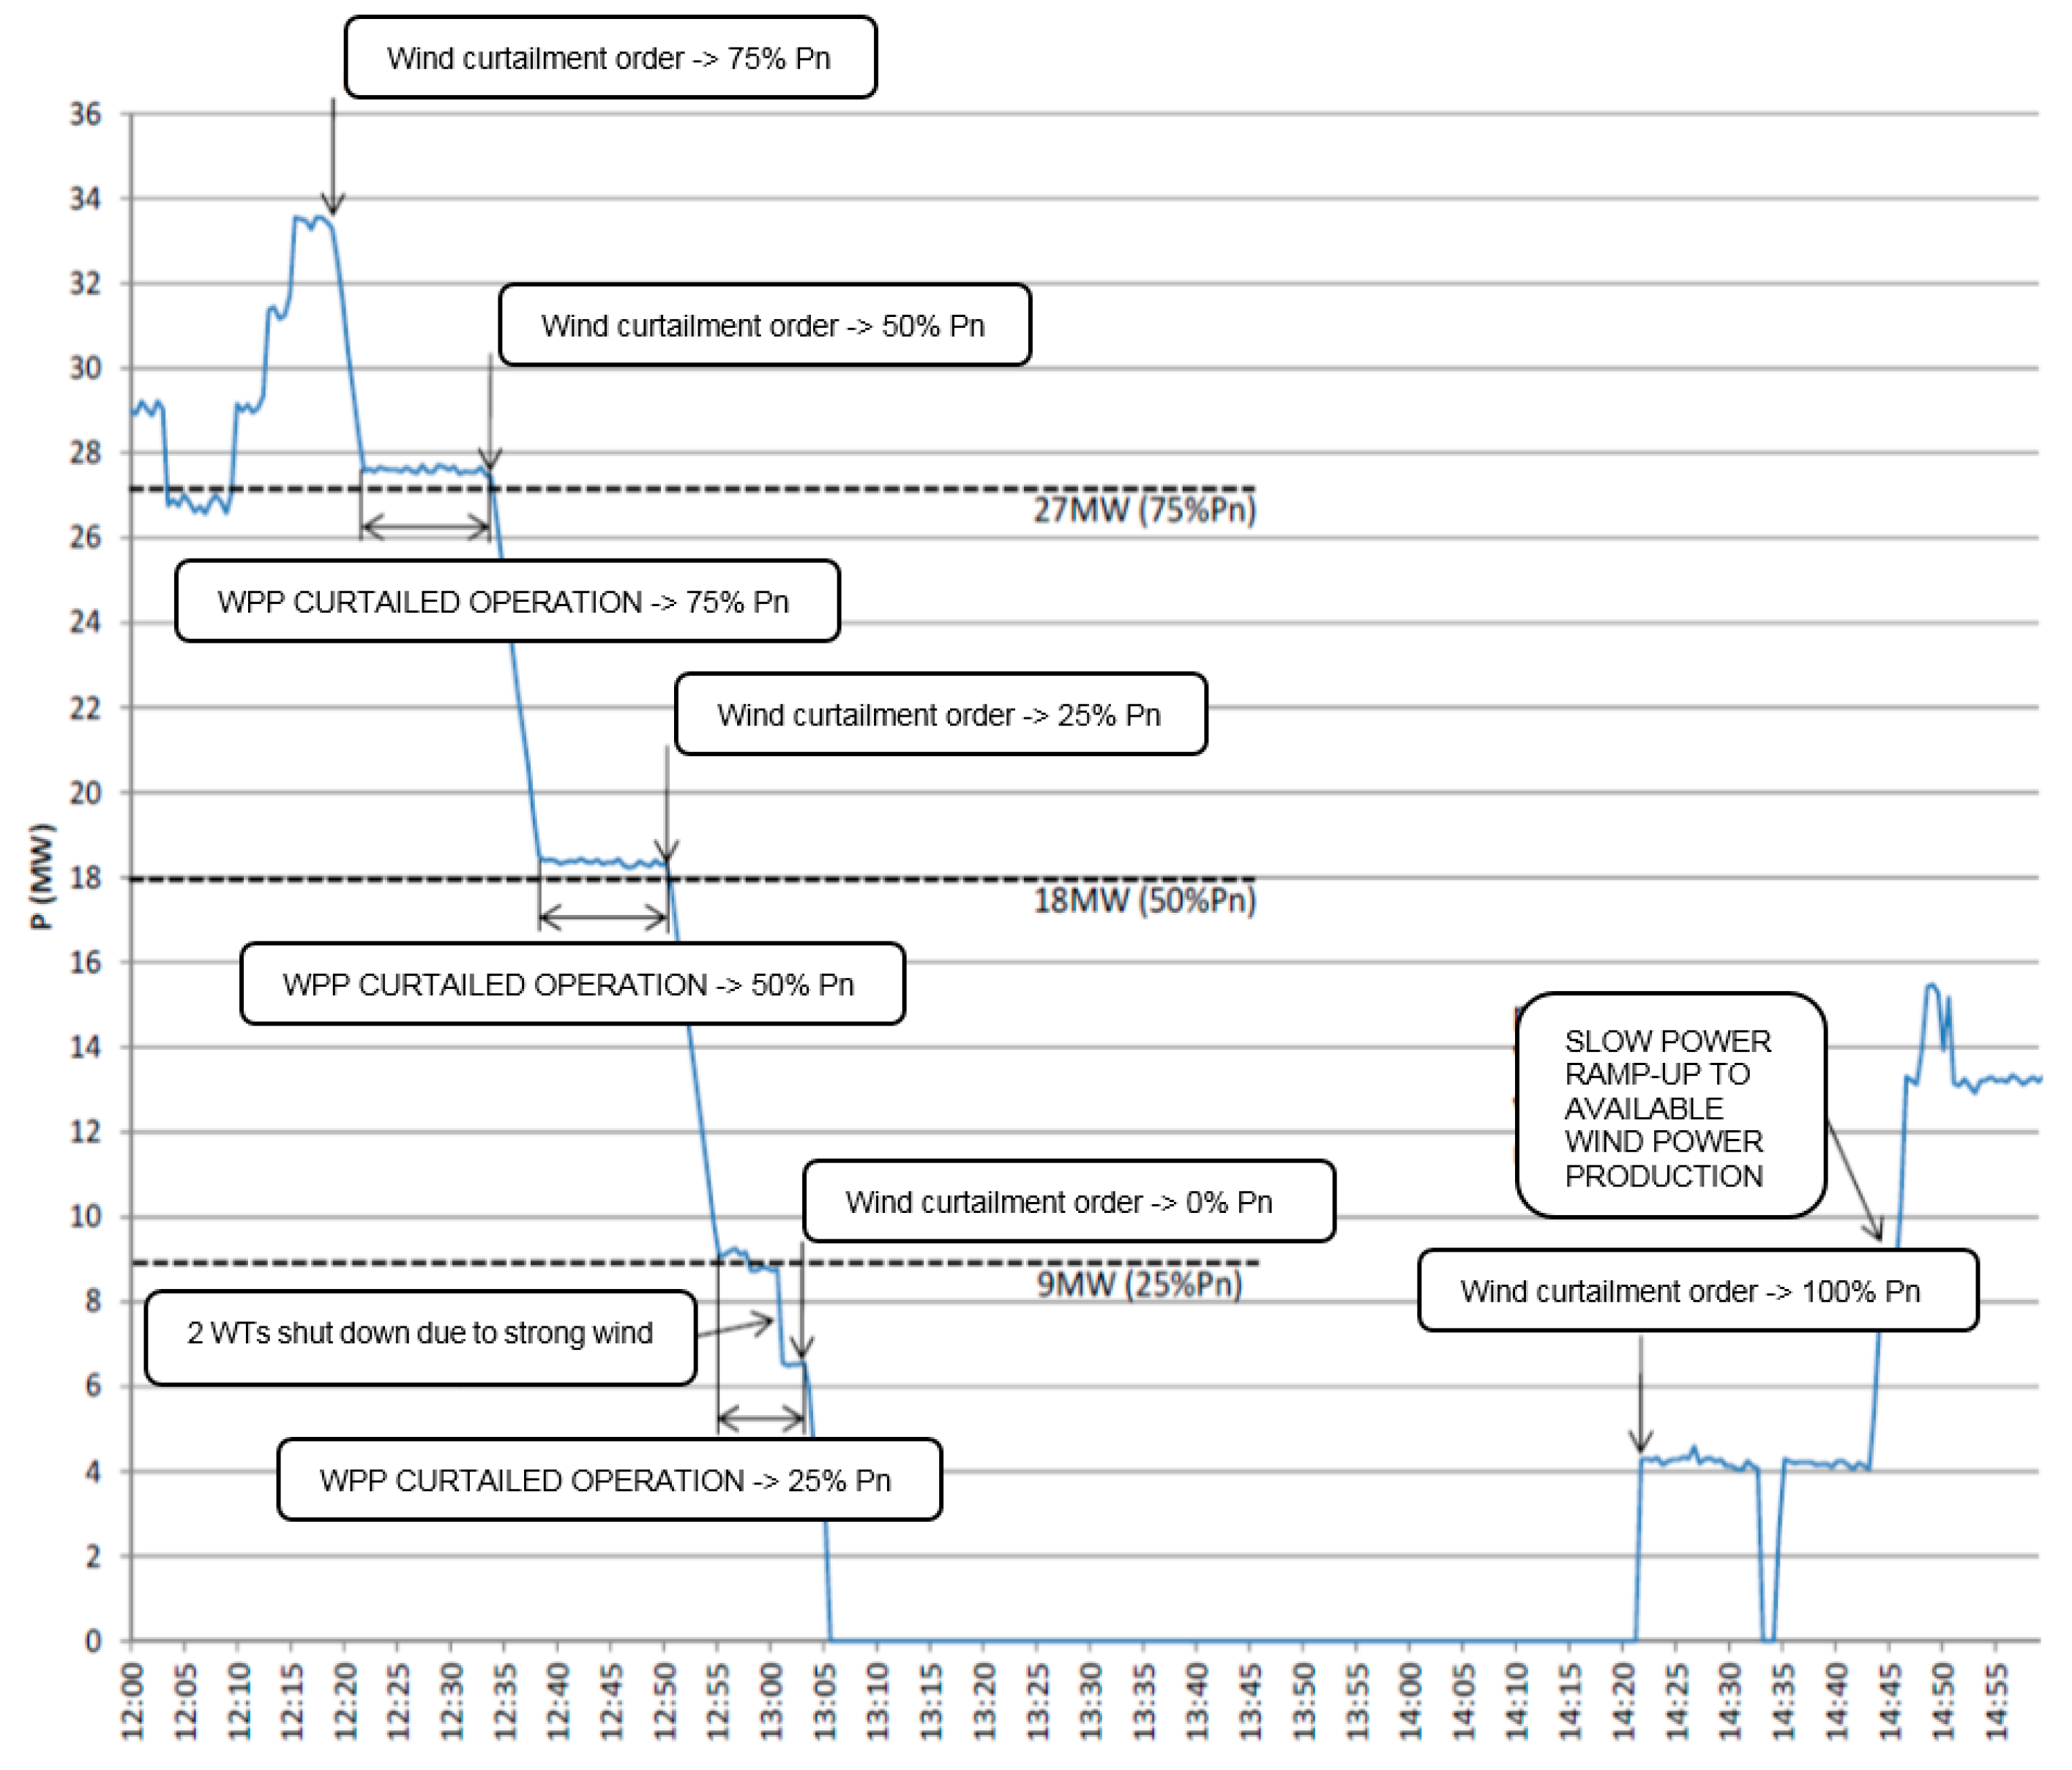
Transmission system model validation was done using real operation measurements from the same WPP and the following tests were analyzed:
- Active power curtailment test;
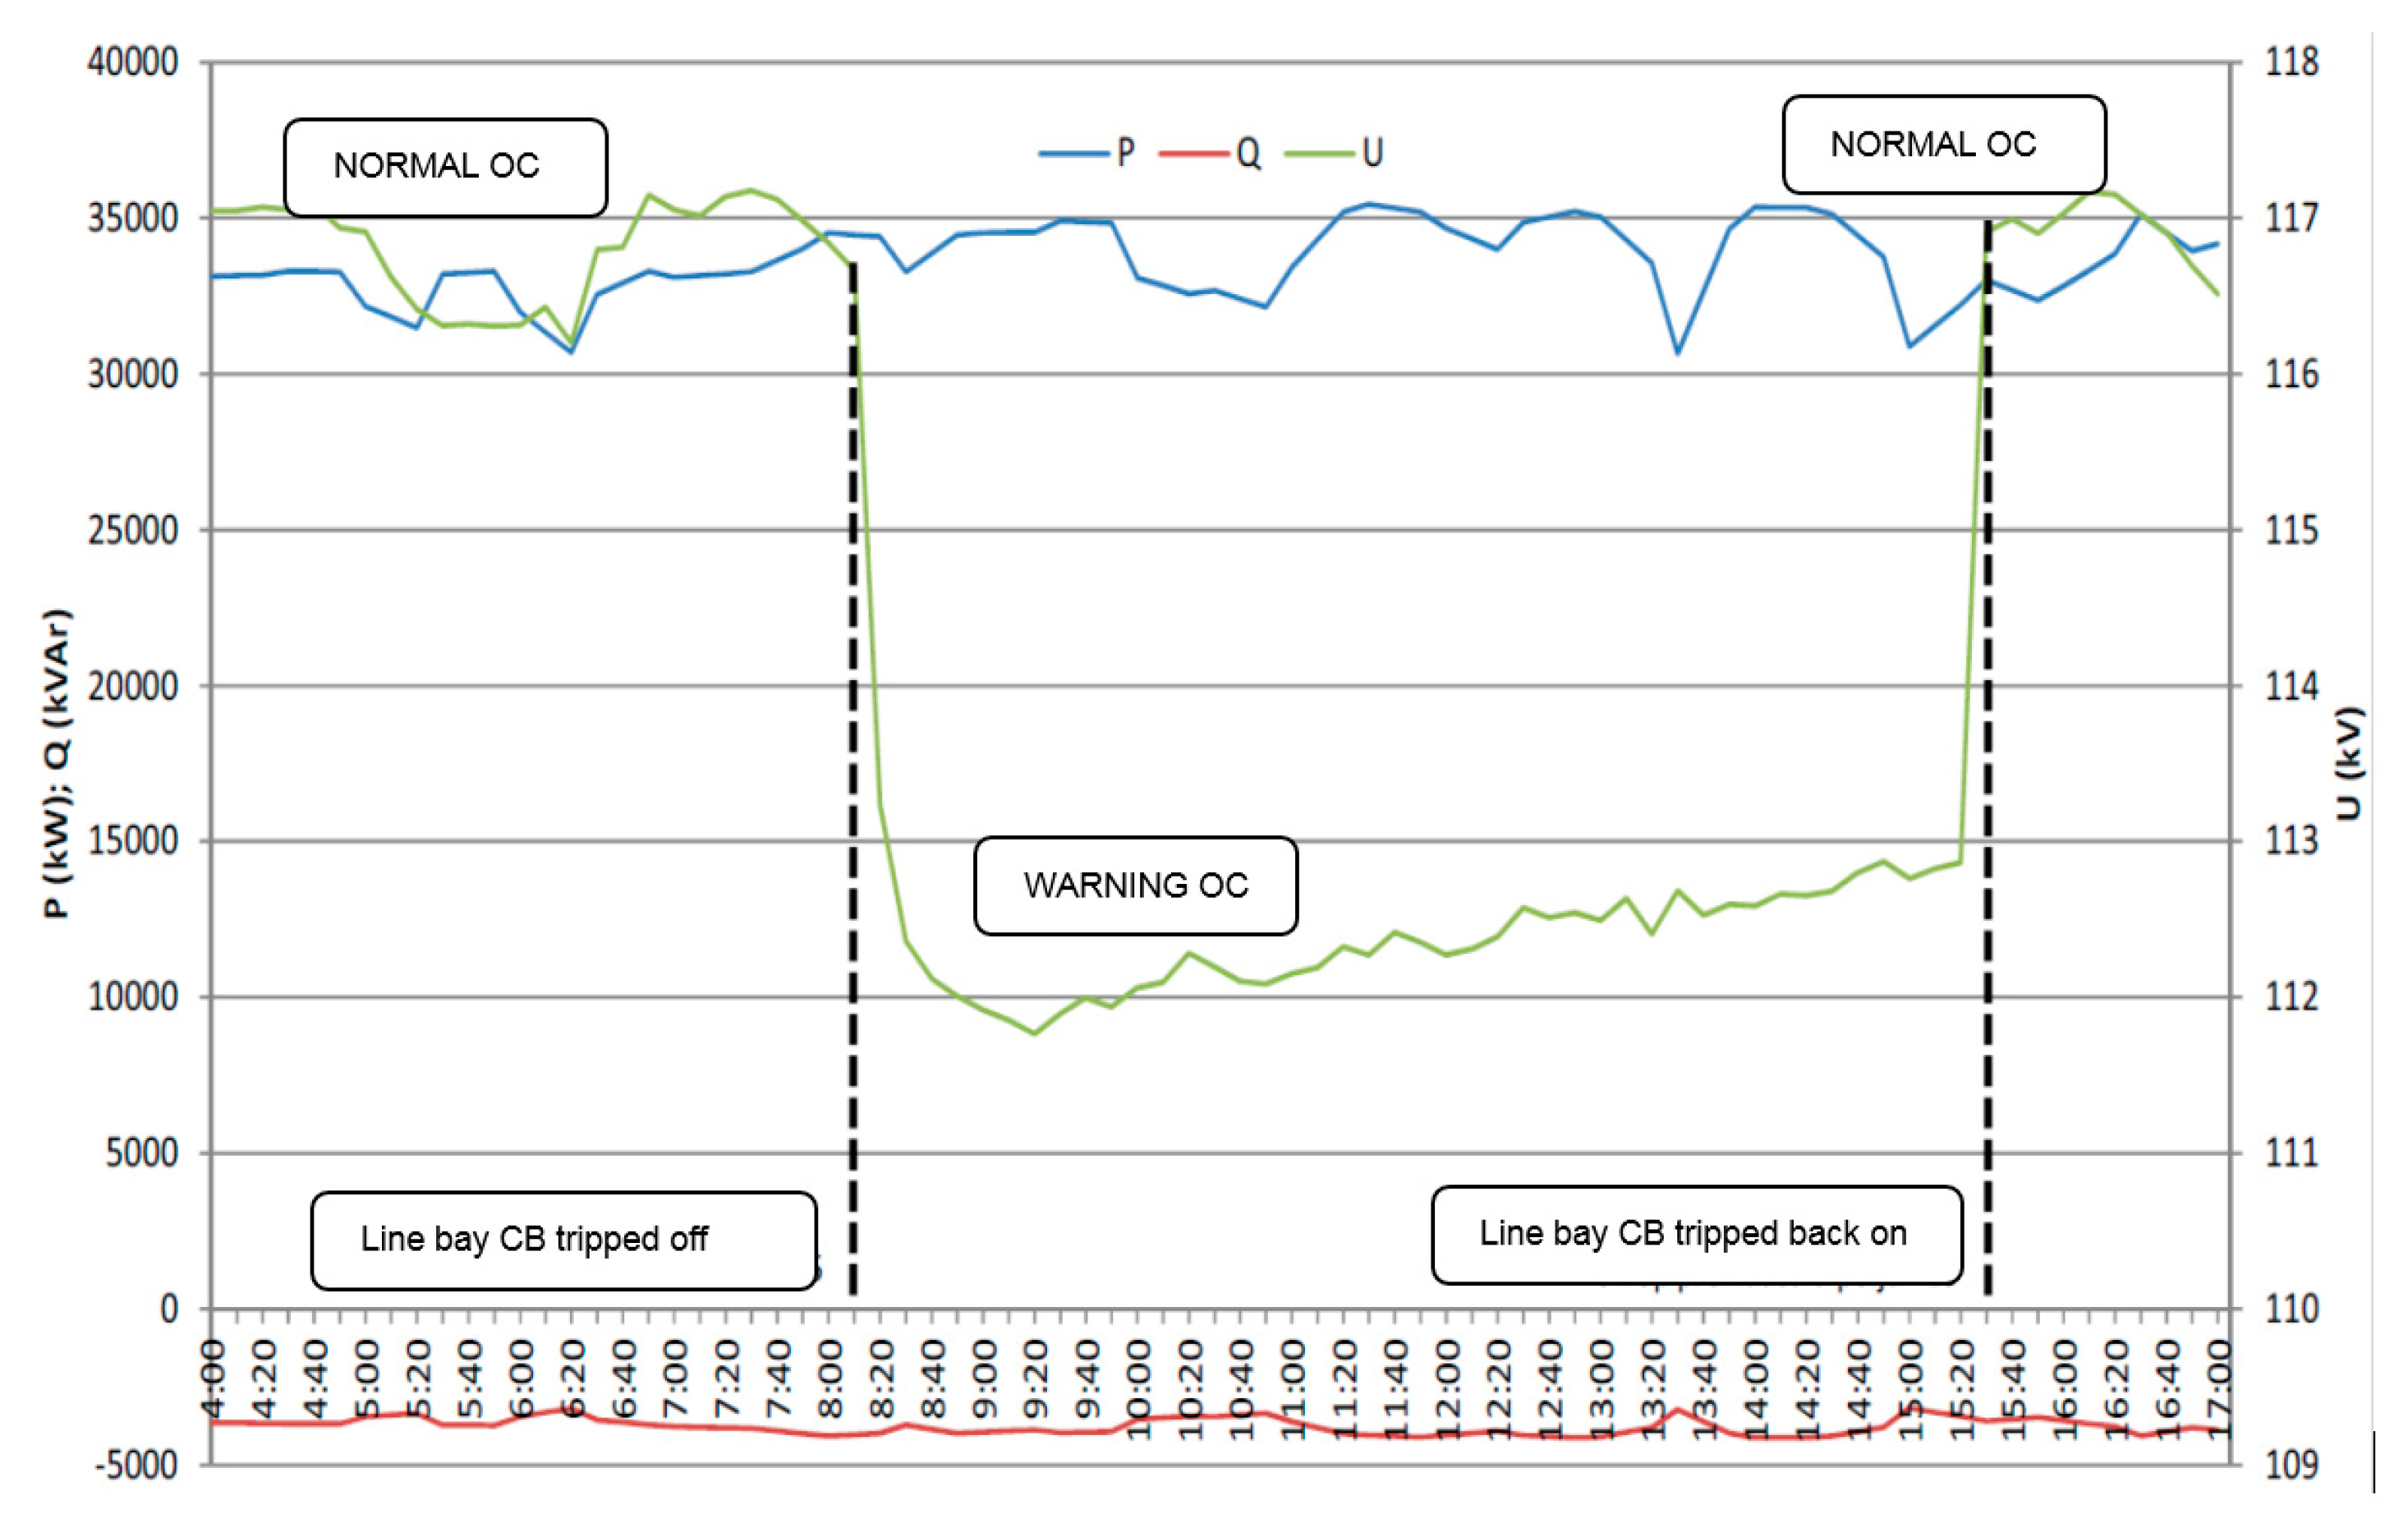
- Tripping of 110 kV transmission line Obrovac—Bruska test;
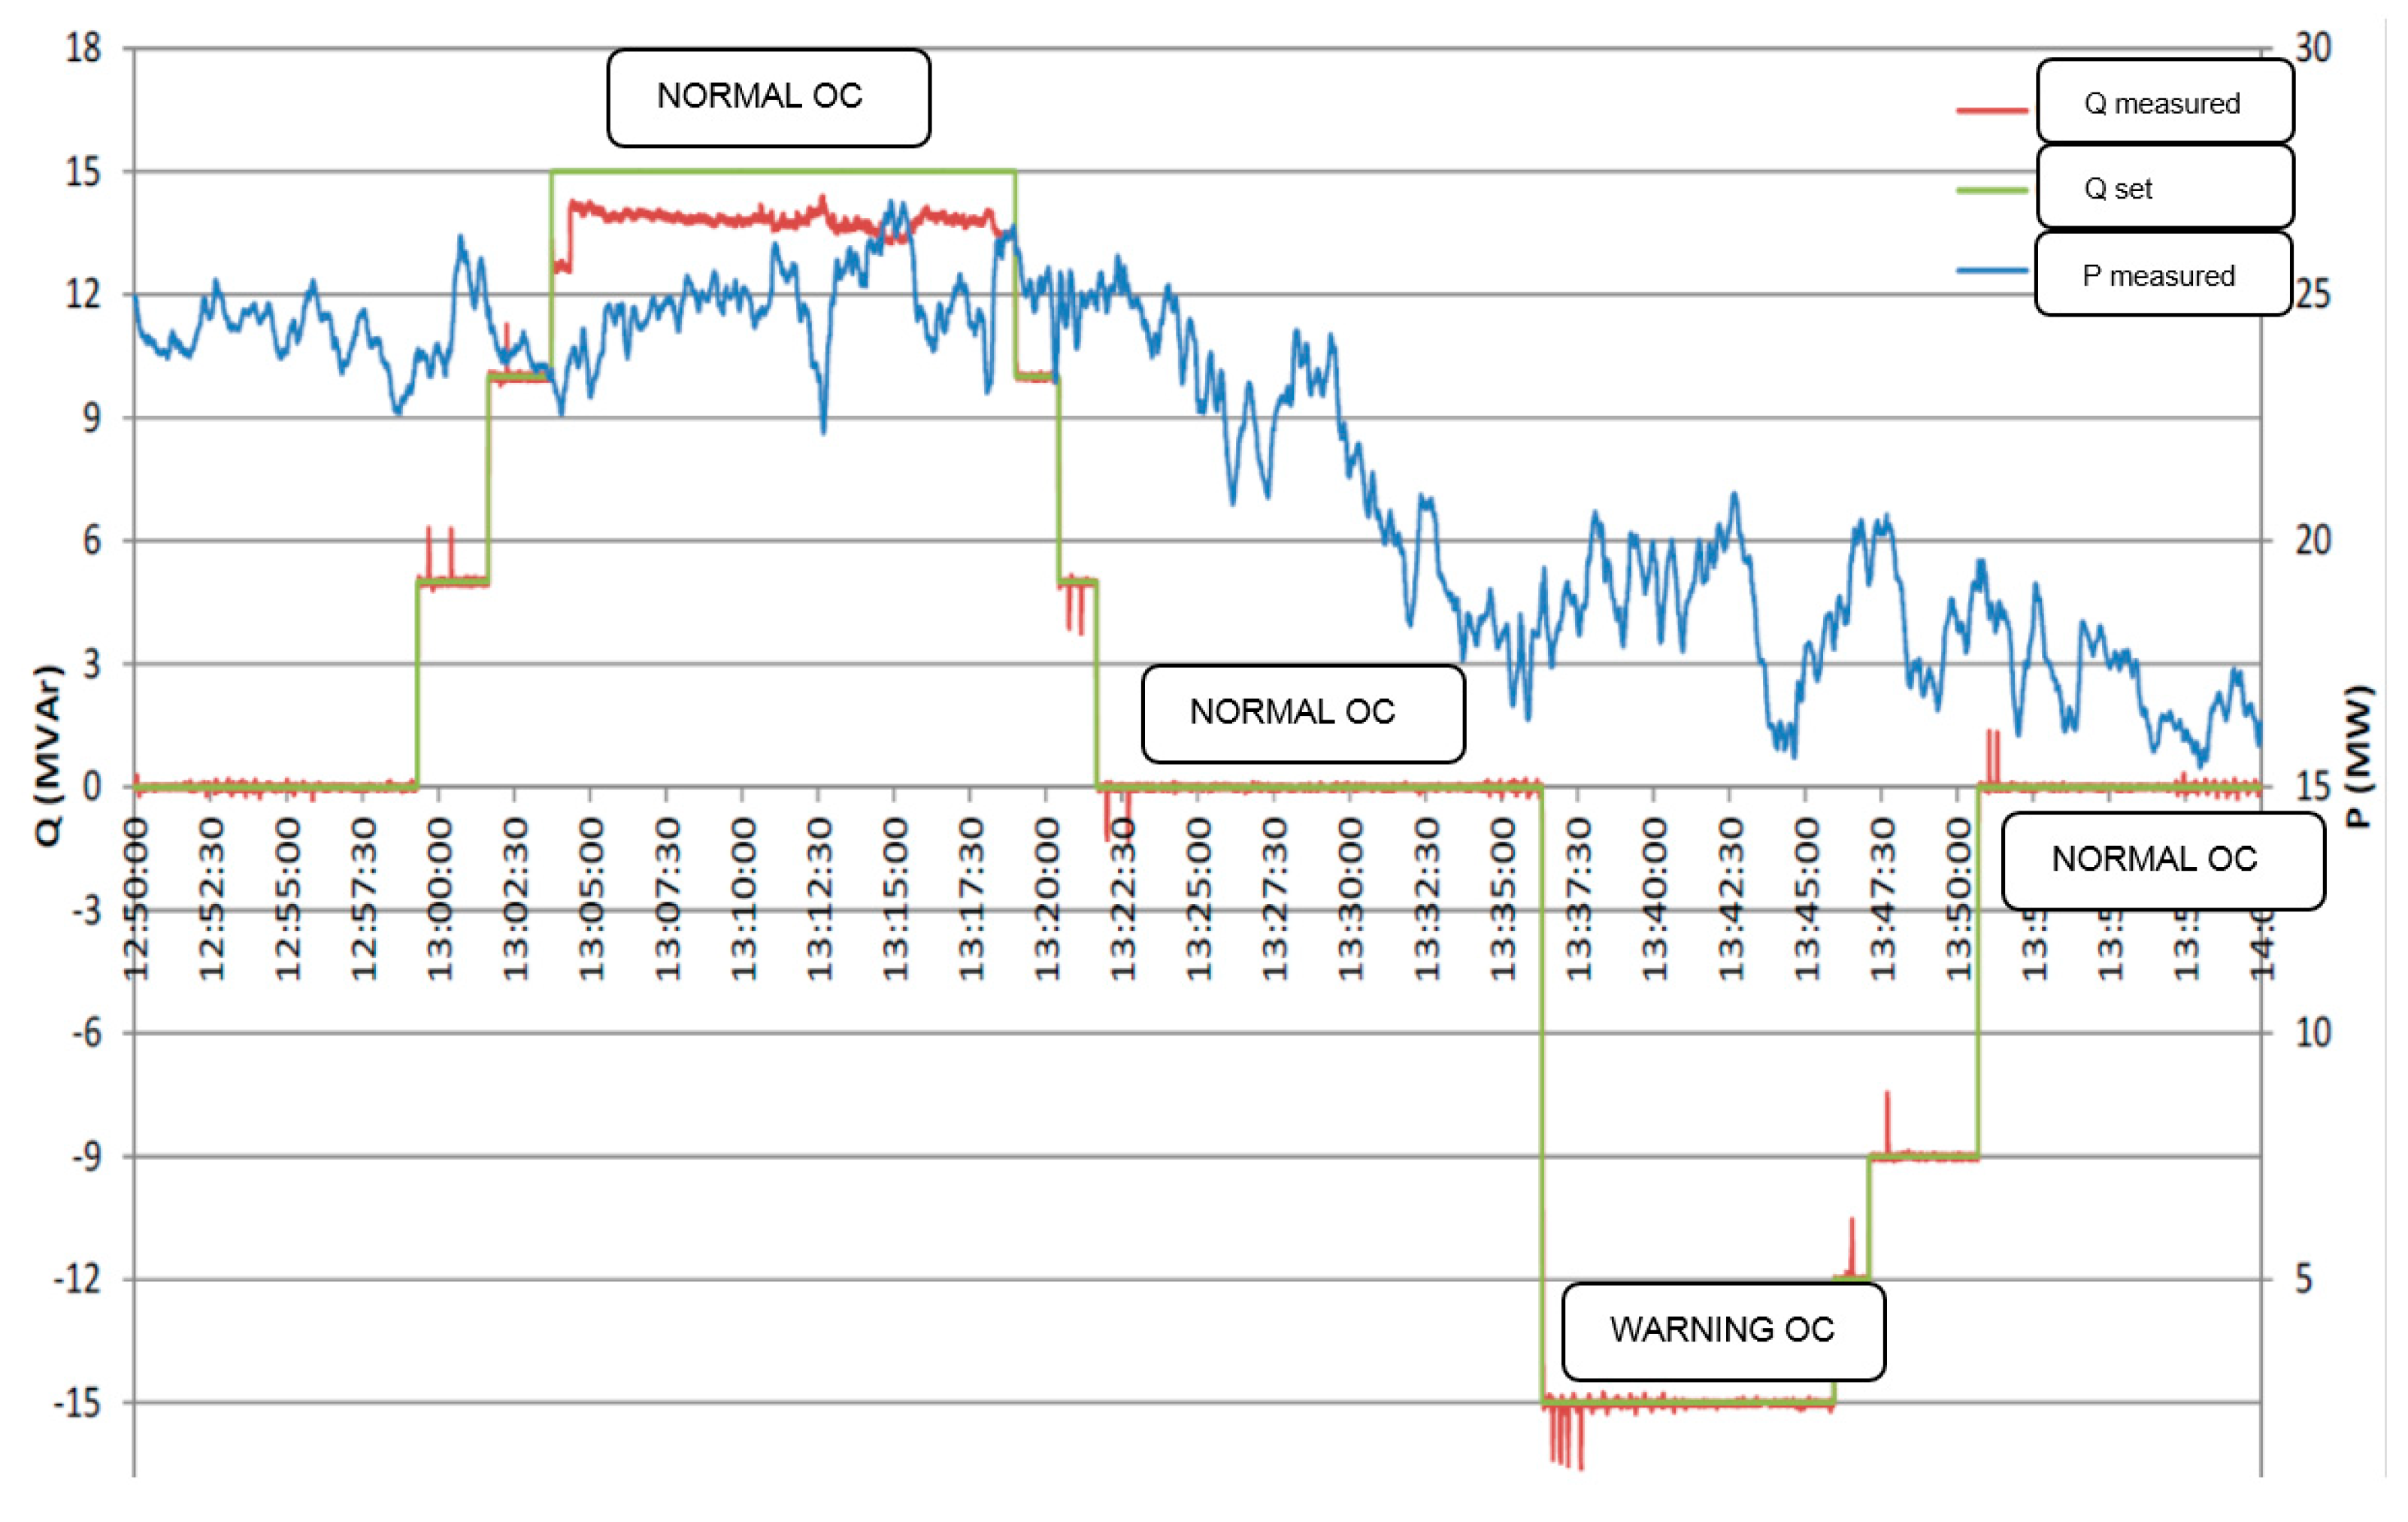
- Change of reactive power regulation regime test.
Results are given in following figures (Figure 20—curtailment test; Figure 21—tripping test; Figure 22—reactive power change test).
During all these curtailment cases, voltages in the network, as well as other parameters from C&RT process were classified as normal operating conditions.
Next, the test of tripping transmission line 110 kV Obrovac—Bruska was measured after circuit breaker (CB) tripping in line bay in substation 110/20 kV Bruska. Subject transmission line was reconnected after several minutes by circuit breaker in the same line bay.
During these line tripping cases, voltages in the network, as well as other parameters from C&RT process were classified as normal and warning operating conditions. Warning EWS is generated right after circuit breaker tripping. This scenario can be expected as there are lines going from WPP towards the rest of the meshed grid. With recognition of such circumstances the message to the operator can be sent to perform corrective actions if other circumstances in the grid worsen. Possible actions include change of the regulation of reactive power regime which was tested and depicted in the following figure (Figure 22). Warning EWS is generated after reactive power was set to constant reactive power −15 Mvar lagging.
It has been shown that following several voltage angles and amplitudes can give clear early warning signal about the situation in the grid and clear classification of the operating conditions can be done. The proposed method interprets and analyzes the measurement data (PMU measurements included) and provides the foundation to determine which measurements are necessary and crucial to avoid need to constantly display large quantities of data which can lead to inefficient recognition of important event.
6. Conclusions
In this paper, one solution for wind power monitoring and control is described through the enhancement of power system infrastructure with various ICT elements. Adaptive and modular (adaptidular) ICT installation were suggested and designed for the subject upgrade of power systems providing the foundations for the smart grid features.
Wind power monitoring and control was done through data mining algorithm using large streams of data coming from various devices. Most important devices used are PMUs measuring phasor values of all electrical variables in the system.
Input data defined for the data mining algorithm comprises of wind power plant active power production, wind power plant reactive power production setting, total system load, voltage amplitudes and voltage angles (phasors) and line, transformer and generator availability. All these data streams create a large database for further usage in control, planning, asset management and operation and maintenance processes.
Developed data mining algorithm for wind power monitoring and control is defined through three main components: the first component is data management and preparation; the second one is data clustering; and the third is data classification.
In the described approach, data management and preparation are used for data formatting and synchronization. Data clustering is done with k-means algorithm in order to define three clusters of data: NORMAL, WARNING and ALARM operating conditions. Thus, defined clusters are used as dependent variables during classification with the usage of C&RT algorithm. Independent variables in the classification algorithm are voltage phasor values (amplitudes and angles), system load, wind power plant active power production and wind power plant reactive power setting. The resulting classification tree can serve as decision tree which has combined decisions and measurements in its leaves. In this way, early warning signal for situational awareness is created with several actions in the decision tree that can serve as preventive measures and influence the system operating condition. The possible necessary decisions are in this model related to wind power plant and its active power production or reactive power setting regime change. The result of such decisions is the transition of the system state trajectory from WARNING and ALARM operating condition towards NORMAL system operating condition.
From the resulting C&RT tree as well as from the importance plot, most important variables can be detected. From these observations, the optimization of PMU infrastructure can be made by installing only devices necessary for the measurements of variables present in decision tree and/or importance plot, to provide the possibility for this algorithm to enable automated decision making.
Improvements of the proposed algorithm can be done with the definition of additional operating conditions either through recorded real system states measurement or through synthetized data from various kinds of simulations. Although mathematical techniques accurately simulate the synthetic data, they usually fail to handle the irregularities that exist in real data. It can also be concluded that in the future, more data will be generated from various measurement devices and efficient algorithms, such as one proposed here, will be needed to deal with such big data structures.
Author Contributions
M.K. and I.K. conceived and designed the experiments; M.K. performed the experiments; M.K. and I.K. analyzed the data; N.H. contributed to analysis tools design; M.K., I.K. and N.H. wrote the paper.
Acknowledgments
The work of the authors is a part of the H2020 project CROSSBOW—CROSS Border management of variable renewable energies and storage units enabling a transnational Wholesale market (Grant No. 773430). This document has been produced with the financial assistance of the European Union. The contents of this document are the sole responsibility of authors and can under no circumstances be regarded as reflecting the position of the European Union. This work has been supported in part by the Croatian Science Foundation under the project WINDLIPS—Wind Energy integration in Low Inertia Power System (Grant No. PAR-02-2017-03).
Conflicts of Interest
The authors declare no conflict of interest.
References
- Marinakis, A.; Larsson, M. Survey of Measurement and Intelligence-based Applications in Power Systems. In Proceedings of the IEEE PowerTech Conference 2013, Grenoble, France, 16–20 June 2011; pp. 1–6. [Google Scholar]
- Ranganathan, P.; Nygard, K. Smart Grid Data Analytics for Decision Support. In Proceedings of the IEEE Electrical Power and Energy Conference (EPEC) 2011, Winnipeg, MB, Canada, 3–5 October 2011; pp. 315–321. [Google Scholar]
- Panciatici, P.; Bareux, G.; Wehenkel, L. Operating in the fog. IEEE Power Energy Mag. 2012, 10, 40–49. [Google Scholar] [CrossRef]
- Kamwa, I.; Samantaray, S.R.; Joos, G. Development of Rule based Classifiers for Rapid Stability Assesment of Wide Area Post-Disturbance Records. IEEE Trans. Power Syst. 2009, 24, 258–270. [Google Scholar] [CrossRef]
- He, M.; Zhang, J.; Vittal, V. Robust Online Dynamic Security Assessment Using Adaptive Ensemble Decision-Tree Learning. IEEE Trans. Power Syst. 2009, 28, 4089–4098. [Google Scholar] [CrossRef]
- Kezunovic, M.; Xie, L.; Grijalva, S. The role of big data in improving power system operation and protection. In Proceedings of the 2013 IREP Symposium, Bulk Power System Dynamics and Control—IX Optimization, Security and Control of the Emerging Power Grid (IREP), Rethymno, Greece, 25–30 August 2013; pp. 1–9. [Google Scholar]
- Cleveland, F. Use of Wireless Data Communications in Power System Operations. In Proceedings of the 2006 Power System Conference and Exposition, Atlanta, GA, USA, 29 October–2 November 2006; pp. 631–640. [Google Scholar]
- Yorozu, Y.; Hirano, M.; Oka, K.; Tagawa, Y. Low Throughput Networks for the IoT: Lessons learned from industrial implementations. In Proceedings of the 2015 IEEE 2nd World Forum on Internet of Things (WF-IoT), Milan, Italy, 14–16 December 2015; pp. 181–186. [Google Scholar]
- Ivanković, I.; Kuzle, I.; Holjevac, N. Wide Area Information-Based Transmission System Centralized Out-of-Step Protection Scheme. Energies 2017, 10, 633. [Google Scholar] [CrossRef]
- Ivanković, I.; Rubeša, R.; Kuzle, I. Modeling 400 kV Transmission Grid with System Protection and Disturbance Analysis. In Proceedings of the IEEE International Energy Conference, Leuven, Belgium, 4–8 April 2016; pp. 1–7. [Google Scholar]
- Ilak, P.; Krajcar, S.; Rajšl, I.; Delimar, M. Pricing Energy and Ancillary Services in a Day-Ahead Market for a Price-Taker Hydro Generating Company Using a Risk-Constrained Approach. Energies 2014, 7, 2317–2342. [Google Scholar] [CrossRef] [Green Version]
- Ivanković, I.; Kuzle, I.; Holjevac, N. Algorithm for Fast and Efficient Detection and Reaction to Angle Instability Conditions Using Phasor Measurement Unit Data. Energies 2018, 11, 681. [Google Scholar] [CrossRef]
- CISCO. PMU Networking with IP Multicast. Document ID 1458164583372983. Available online: www.cisco.com (accessed on 17 March 2014).
- Li, Z.; Wu, W. Phasor Measurement Aided Decision Trees for Power System Security Assessment. In Proceedings of the 2nd International Conference on Information and Computing Science 2009, Manchester, UK, 21–22 May 2009; pp. 358–361. [Google Scholar]
- Wydra, M. Performance and Accuracy Investigation of the Two-Step Algorithm for Power System State and Line Temperature Estimation. Energies 2018, 11, 1005. [Google Scholar] [CrossRef]
- Pérez-Chacón, A.R.; Luna-Romera, J.M.; Troncoso, A.; Martínez-Álvarez, F.; Riquelme, J.C. Big Data Analytics for Discovering Electricity Consumption Patterns in Smart Cities. Energies 2018, 11, 683. [Google Scholar] [CrossRef]
- Cotilla-Sanchez, E.; Hines, P.; Danforth, C. Predicting critical transitions from time series synchrophasor data. In Proceedings of the 2013 IEEE Power and Energy Society General Meeting, Vancouver, BC, Canada, 21–25 July 2013. [Google Scholar]
- Kazerooni, M.; Zhu, H.; Overbye, T. Literature review on the applications of data mining in power systems. In Proceedings of the Power and Energy Conference, Chicago, IL, USA, 14–17 April 2014. [Google Scholar]
- Power System Software & Engineering. Available online: https://www.digsilent.de/en/ (accessed on 15 October 2018).
- TIBCO Statistica is Now Part of TIBCO Data Science. Available online: https://www.tibco.com/products/tibco-statistica (accessed on 15 October 2018).
- Breiman, L.; Friedman, J.H.; Olshen, R.A.; Stone, C.J. Classification and Regression Trees; Wadsworth Inc.: Pacific Grave, CA, USA, 1984. [Google Scholar]
- Han, J.; Kamber, M.; Pei, J. Data Mining Concepts and Techniques, 3rd ed.; Morgan Kaufmann: San Francisco, CA, USA, 2012. [Google Scholar]
- Zhou, D.; Blaajberg, F. Reactive Power Impact on Lifetime Prediction of Two-level Wind Power Converter. In Proceedings of the PCIM Europe 2013, Nuremberg, Germany, 14–16 May 2013; pp. 564–571. [Google Scholar]
- Ivanković, I.; Kuzle, I.; Holjevac, N. Multifunctional WAMPAC system concept for out-of-step protection based on synchrophasor measurements. Int. J. Electr. Power Energy Syst. 2017, 87, 77–88. [Google Scholar] [CrossRef]
- Abdelkaber, S. Online Tracking of Thévenin Equivalent Parameters Using PMU Measurements. IEEE Trans. Power Syst. 2012, 27, 975–983. [Google Scholar] [CrossRef]
Figure 1.
Fundamental smart grid system framework components.

Figure 2.
Basic system architecture of IP/MPLS (Multiprotocol Label Switching) techniques.

Figure 3.
Adaptive and modular hardware and software infrastructure characteristics.

Figure 4.
Early warning signal (EWS) concept as a first line of defense inducing preventive and corrective actions after system state change.
Figure 4.
Early warning signal (EWS) concept as a first line of defense inducing preventive and corrective actions after system state change.

Figure 5.
Basic workflow diagram.

Figure 6.
IEEE 14 bus test system with addition of a win power plant on bus 8.

Figure 7.
Voltage profiles for bus 8 of the IEEE 14 test system for different load conditions and wind power production with reactive power mode cos φ = 1.
Figure 7.
Voltage profiles for bus 8 of the IEEE 14 test system for different load conditions and wind power production with reactive power mode cos φ = 1.

Figure 8.
EWS clusters based on Thevenin equivalent at bus 8.

Figure 9.
EWS clusters based on Jacobi matrix eigenvalues with least square method fitting.

Figure 10.
Early warning signal (EWS) cost sequence for different classification and regression trees.
Figure 10.
Early warning signal (EWS) cost sequence for different classification and regression trees.

Figure 11.
EWS importance plot for different dependent variables.

Figure 12.
Wind power plant VE ZD 6 connected to radial 35 kV line.

Figure 13.
Early warning signal (EWS) clusters based on Thevenin equivalent at wind power plant VE ZD 6.
Figure 13.
Early warning signal (EWS) clusters based on Thevenin equivalent at wind power plant VE ZD 6.

Figure 14.
Resulting C&RT for a complete set of all possible parameter variations (VE ZD 6).

Figure 15.
Resulting C&RT for reduced set of possible parameter variations (VE ZD 6).

Figure 16.
Wind power plant VE ZD 2 & ZD 3 connected to a meshed 110 kV grid.

Figure 17.
EWS clusters based on Thevenin equivalent at WPP VE ZD 2&ZD 3.

Figure 18.
Resulting C&RT for a complete set of all possible parameter variations—WPP VE ZD 2 & ZD 3.
Figure 18.
Resulting C&RT for a complete set of all possible parameter variations—WPP VE ZD 2 & ZD 3.

Figure 19.
Resulting C&RT for reduced set of possible parameters—WPP VE ZD 2 & ZD 3 model.

Figure 20.
Validation of resulting C&RT—WPP VE ZD 2 & ZD 3 power measurements—wind curtailment test.
Figure 20.
Validation of resulting C&RT—WPP VE ZD 2 & ZD 3 power measurements—wind curtailment test.

Figure 21.
Validation of resulting C&RT—WPP VE ZD 2 & ZD 3 power and voltage measurements—110 kV transmission line Obrovac—Bruska tripping case.
Figure 21.
Validation of resulting C&RT—WPP VE ZD 2 & ZD 3 power and voltage measurements—110 kV transmission line Obrovac—Bruska tripping case.

Figure 22.
Validation of resulting C&RT—WPP VE ZD 2 & ZD 3 active and reactive power measurements—reactive power production regime change test.
Figure 22.
Validation of resulting C&RT—WPP VE ZD 2 & ZD 3 active and reactive power measurements—reactive power production regime change test.


Table 1.
Misclassification costs defined for data classification.
| EWS | NORMAL | WARNING | ALARM |
|---|---|---|---|
| NORMAL | 0 | 1 | 5 |
| WARNING | 1 | 0 | 3 |
| ALARM | 1 | 1 | 0 |
Table 2.
Centroids of Thevenin equivalent for the k-means clustering—IEEE 14 bus test model.
| EWS | Zth abs | Zth arg | No. of Cases |
|---|---|---|---|
| NORMAL | 0.438743 | 87.91876 | 295 |
| WARNING | 0.554339 | 80.64339 | 85 |
| ALARM | 2.179344 | 69.31481 | 16 |
Table 3.
Centroids of Thevenin equivalent in PCC for k-means clustering—WPP VE ZD 6 model.
| EWS | Zth abs | Zth arg | No. of Cases |
|---|---|---|---|
| NORMAL | 4.090202 | 74.98206 | 41 |
| WARNING | 3.781597 | 78.12948 | 71 |
| ALARM | 3.228652 | 80.60002 | 23 |
Table 4.
Centroids of Thevenin equivalent in PCC for k-means clustering—WPP VE ZD 2&ZD 3.
| EWS | Zth abs | Zth arg | No. of Cases |
|---|---|---|---|
| NORMAL | 11.98351 | 83.80223 | 130 |
| WARNING | 10.42744 | 81.64916 | 14 |
| ALARM | 7.33635 | 71.44346 | 6 |
© 2018 by the authors. Licensee MDPI, Basel, Switzerland. This article is an open access article distributed under the terms and conditions of the Creative Commons Attribution (CC BY) license (http://creativecommons.org/licenses/by/4.0/).
Share and Cite
MDPI and ACS Style
Klarić, M.; Kuzle, I.; Holjevac, N. Wind Power Monitoring and Control Based on Synchrophasor Measurement Data Mining. Energies 2018, 11, 3525. https://doi.org/10.3390/en11123525
AMA Style
Klarić M, Kuzle I, Holjevac N. Wind Power Monitoring and Control Based on Synchrophasor Measurement Data Mining. Energies. 2018; 11(12):3525. https://doi.org/10.3390/en11123525
Chicago/Turabian StyleKlarić, Mario, Igor Kuzle, and Ninoslav Holjevac. 2018. "Wind Power Monitoring and Control Based on Synchrophasor Measurement Data Mining" Energies 11, no. 12: 3525. https://doi.org/10.3390/en11123525
Note that from the first issue of 2016, this journal uses article numbers instead of page numbers. See further details here.