Evaluating Partnerships in Sustainability-Oriented Food Supply Chain: A Five-Stage Performance Measurement Model


1
School of Management Studies, Punjabi University, Patiala 147002, India
2
Department of Industrial Engineering, University of Naples Federico II, P.le Tecchio 80, 80125 Naples, Italy
3
Department of Engineering, Centro Direzionale di Napoli, Isola C4, 80143 Naples, Italy
*
Author to whom correspondence should be addressed.
Energies 2018, 11(12), 3473; https://doi.org/10.3390/en11123473
Submission received: 4 October 2018
/
Revised: 9 December 2018
/
Accepted: 10 December 2018
/
Published: 13 December 2018
(This article belongs to the Section A: Sustainable Energy)
Abstract
:This study aims to investigate how overall food supply chain performance (FSCP) often depends on the performance of partners in a sustainable and energy-efficient supply chain. Initially, the study classifies the FSCP and further examines the partner relationships in sustainability-oriented food supply chain (FSC). To do so, the study proposes and formally tests a five-stage performance measurement model. The present research mainly focuses on the Indian food industry. Results highlight significant direct and indirect positive performance relationships between the different FSC stages. The structural equation modeling analysis highlights that producer’s performance positively impacts supplier’s performance, processor’s performance, and distributor’s performance. Moreover, supplier’s performance positively impacts processor’s performance, distributor’s performance, and retailer’s performance, and also processor’s performance positively impacts both distributor’s performance and retailer’s performance. Lastly, distributor’s performance positively impacts retailer’s performance. The study suggests that regular performance improvement at each FSC stage would improve the performance of the next stage players. Most importantly, the direct impact of each partner’s performance is comparatively high on its immediate next partner’s performance. Furthermore, this study will assist practitioners to understand various FSCP measurement issues and make significant improvements in their sustainable and energy-efficient supply chain practices.
1. Introduction
Over the last decade, food supply chain (FSC) has taken good heed among practitioners, academicians and scholars due to substantial market changes affecting sustainable and energy-efficient supply chains [1,2,3,4,5]. However, from a management perspective, FSC requires advance handling systems to deal with product perishability, unexpected supply chain variations, and food safety attributes that affect environmental sustainability, consumer health and loyalty, and supply chain (SC) profitability [6]. Furthermore, FSC comprises various autonomous and heterogeneous partners such as producers, suppliers, packaging firms, industrial processors, cold logistic service providers, certification agencies, distributors, and retailers that decrease transparency. Meanwhile, a number of complications persist when coordinating SC partners which make FSC more challenging [7].
Generally, perishable FSC can be classified into two categories: fresh unprocessed food products (e.g., vegetables, fruits, and milk) and processed food products (e.g., convenience foods and soft drinks). Indeed, partners’ performances affect overall food supply chain performance (FSCP) [8]. For example mad cow disease, BSE, and dioxin food scandals are major global food scandals in which companies blamed their partners’ for supplying low quality and contaminated raw food products [9,10].
However, many companies throughout the world have experienced that working alone will not be sufficient to attain paramount supply chain performance [11,12]. Therefore, the food sector is continuously demanding collaboration among partners to pursue sustainable and energy-efficient food production, processing, distribution, and consumption. According to Aramyan et al. [13], nowadays regular performance measurement is not a matter of choice for food firms, but of necessity. In this context, scholars argued that the measurement and improvement of a firm’s own performance are not enough to survive and thrive in today’s intensely competitive marketplace. Aramyan et al. [14] highlighted the importance of key performance indicators for measuring FSCP. The firms need also to motivate and guide their partners to regularly track and trace their efficient and inefficient performances areas and thereafter make significant improvements in their performance [15,16]. This can lead the FSC to attain competitiveness in term of reduced SC costs, lead-time, food waste [16,17], as well as improved product quality, energy efficiency, responsiveness, and customer satisfaction [18,19,20].
There are several contributions in the literature addressing FSCP measurement [1,2,3,4,5,6,7,8,9,10,11,12,13,14,15,16,17,18,19,20]. Shukla and Jharkharia [20] affirmed that the available literature on the agri-food SC primarily focused on two specific issues: production planning and inventory management, and ignored the broader perspectives of performance measurement. More recently, Shashi et al. [16] tested the value addition relationship according to each stage of the FSC and stated that measuring the performance relationships among FSC partners is still an open question for the investigation. Given these premises, this study aims to analyze the interlocking links of the performance by classifying the FSCP according to each stage, and thereafter, measure the performance relationship between food producer, supplier, industrial processor, distributor, and retailer.
The investigation of Indian FSC offers interesting insights for the following reasons, (1) at present, India represents almost 18% of the world’s population and covers only 2.4% of the global surface area. Though China is the world’s largest populated country, by 2040, India’s population is forecasted to surpass China’s population [21]; this is building massive pressure on Indian FSC to feed billions of people. (2) Another motivation emanates from the fact that presently, India is facing food inflation [22,23]. India scored 31.4 and was placed in the high end of the “serious” category when ranked at the 100th position among 119 countries on the Global Hunger Index. India’s neighboring countries such as Nepal (72), Myanmar (77), Bangladesh (88), Sri Lanka (84) and China (29) are far better in Global Hunger Index [24]. This shows serious inefficiency and ineffectiveness issues of the Indian FSC; (3) additionally, India’s horticulture output reached 300.64 million tons in 2016/2017 and is anticipated to reach 305.43 million tons in 2017/2018. However, 25 to 40% of total production gets wasted annually [25], which costs an estimated INR one lakh crore [26]; (4) the export rate of India’s perishable products has been steadily declining due to stringent quality norms of importing countries [27]; (5) the rate of food processing is less than 10% of the total production [28,29]. This rate is above 20 and 60% in China and USA, respectively [30]. This shows that the Indian food industry is less able to harness the benefits of high production; and (6) the government has recently announced food processing as the main industry to boost the food industry and convert raw food products into more value-added products [31].
The preceding arguments abundantly indicate that dramatic increase in India’s population aligns with the problem that all people need to be nourished. That is why the FSC of yesterday can no longer effectively fulfill the demand, and therefore needs to be restructured. All earlier-discussed problems need prompt and reliable solutions otherwise, in the future, it may be impossible for India to balance its demand and supply.
The remainder of this study is organized as follows. In Section 2, we discuss previous studies on FSCs. In Section 3, we propose a conceptual model and study hypotheses. The research methodology is elaborated in Section 4. Then, the results are highlighted in Section 5. Section 6 addresses the discussion and managerial implications. Finally, Section 7 reports conclusions and future research directions.
2. Literature Review
In this section, literature has been taken into consideration to describe sustainable and energy-efficient FSCP measurement and to justify the need of this work by highlighting the gaps between existing theory and practices, thereafter, to develop a performance relationship-based conceptual performance model from farms to retail.
Agri-food SC has extended beyond the national boundaries and, thus, food firms are seeking unprecedented ideas to secure global market competitiveness [32,33,34]. In this context, the FSCP measurement has emerged as inevitable subject and strategic intent which allows the firm to track and trace the efficacy and inefficiency of SC and leads to better chain design’s decision making [14,15,16,17]. In addition, Bigliardi and Bottani [35] demonstrated it as “feedback on operations which are geared towards customer satisfaction, strategic decisions, and objectives.” From the above definition, it can be concluded that the FSCP measurement shows a gap between actual performance and desired performance. The FSC literature argued that “if there is no measurement, no chance of improvement” [16]. However, the traditional performance measurement approach just focused on measuring the few aspects of FSC, but competition in today’s global food market has compelled food firms to not to miss a single chance of improvement [36,37,38].
Nevertheless, FSCP measurement is highly difficult due to various characteristics (i.e., seasonable production, high perishability and waste rate, taste, color, temperature monitoring, demand & price variation, lead-time, etc.) that distinguish FSCP measurement from other SCs [39]. The recent FSC literature has extensively been highlighting the importance of sustainable and energy efficient partners performance on overall FSCP [16,17]. Unfortunately, the FSCs are failing in various important performance areas such as reduction in cost, lead-time, inventory, wastage and improvement in product quality, energy efficiency, variety, distribution, and availability [40,41].
Globalization in the food sector has introduced the world as a single market in which firms are fighting for buyers. Food firms have tremendous pressure to meet national and international food standards and manage products, value addition, and distribution accordingly [42]. Food firms need to look outside of their standalone boundaries and efforts should be made to improve overall FSCP to tackle this pressure [19]. Herein, the FSC partner selection is a critical exercise because if the chain partners are incapable to supply and distribute products with superior quality, taste, and certifications with the minimum possible cost and lead-time, then the whole SC will be at high risk of failure [43]. On the other hand, effective partners’ selection strategies mitigate the effect of supply and distribution failure [44]. Literature suggests prefixing some performance standards for partners’ selection [5]. Nonetheless, lack of trust, commitment, training, and irregular performance measurement are some major challenges deteriorating food firm performance [15].
Inevitably, sustainability in FSC has drawn significant attention due to food sustainability exposure, energy efficiency issues, and the regular outbreaks of foodborne illness after contaminated food consumption [16,17,18]. The irregular performance measurement at each FSC stage can be a possible reason behind such poor performance [15,16]. Customers are now evaluating each and every aspects of the offered products [42,43]. Subsequently, many national and international FSC authorities, as well as the World Health Organization have regularly been coercing to food companies to deliver sustainable and energy-efficient foodstuffs [19].
According to Aung and Chang [17], “getting the right goods at the right time and place” has high importance to reduce costs and win customer confidence. In this line, Aramyan et al. [14] designed a FSCP measurement conceptual model taking the literature into consideration, which includes the characteristics of FSC as well as other financial and nonfinancial measures. Furthermore, Aramyan et al. [13] grouped FSCP measurement metrics into four categories: (i) efficiency, (ii) flexibility, (iii) responsiveness, and (iv) food quality. Hence, one of the major goals of tactical FSC planning is to enhance customer’s satisfaction by improving delivery efficiency, accuracy, and services. Even so, without tight integration between procurement, production, and distribution processes these improvements seem impossible [45].
Similarly, Bourlakis et al. [36] proposed a balanced scorecard model for FSCP measurement and classified performance into four perspectives: financial, internal process, customers and learning, and growth perspectives. Nyamah et al. [46] galvanized that buyer–supplier relationship-based coordination is significantly positively associated with firm performance. Literature highlighted the significant negative correlation between FSC risks and FSCP [47]. Whilst, Roth et al. [7] experienced three key trends, namely (i) trade foodstuffs as undifferentiated commodities, (ii) trading in large quantities, and (iii) sourcing from different global locations to lessen cost. Furthermore, Van der Vorst [48] argued that to achieve superior FSCP, each partner should be capable to organize their own actions.
However, the previous articles have provided a significant contribution to the body of knowledge but failed to empirically test the performance relationship between sustainable and energy-efficient FSC partners. In this paper, emphasize is paid to identify the different types of performance according to each FSC stages and thereafter test the performance relationship among the FSC to shed light that how the performance of one player impacts the performance of other players within same FSC. This research hypothesized that the FSCP depends upon the partners’ performance. Our research interest focuses on what kind of relationship exists among FSC partners’ performance. The perspective of this research is new and original in this regard.
3. Conceptual Model
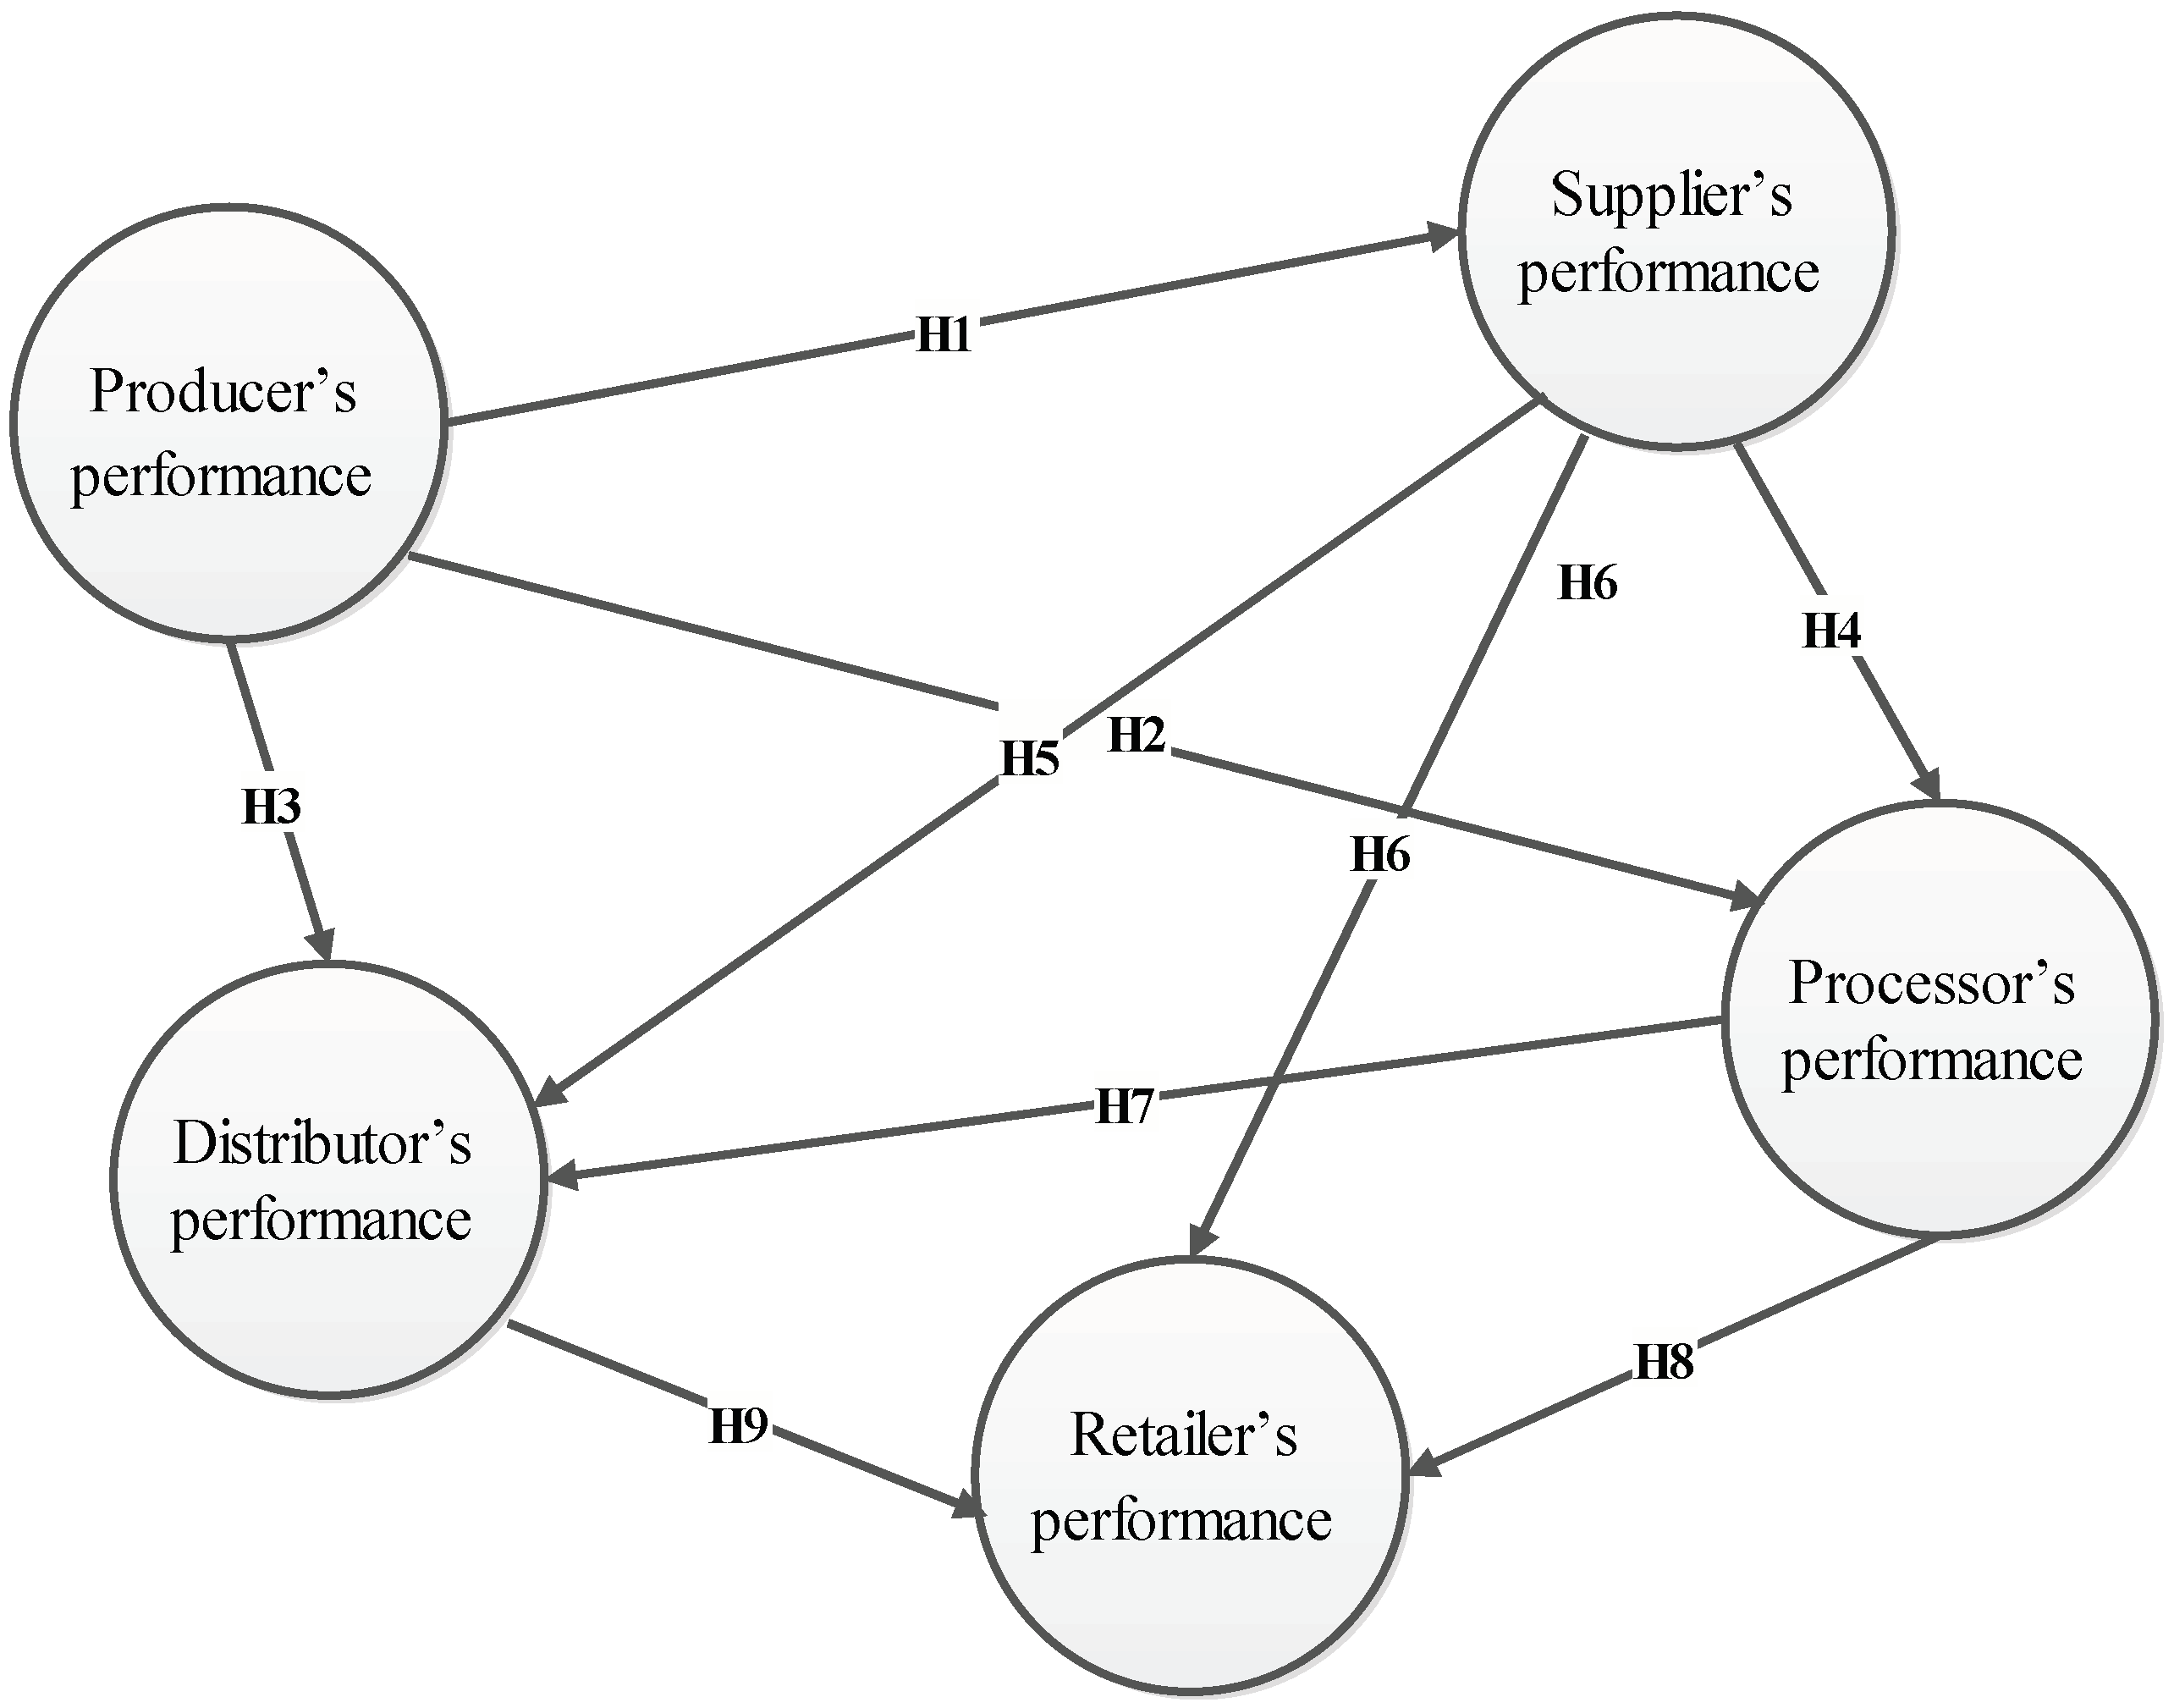
Based on a thorough literature review in the previous section, here, efforts have been made to develop a conceptual model. Figure 1 reports to the conceptual model which is based on five constructs:
- (1)
- Producer’s performance
- (2)
- Supplier’s performance
- (3)
- Processor’s performance
- (4)
- Distributor’s performance
- (5)
- Retailer’s performance
3.1. Producer’s Performance
From a FSC perspective, the producer’s performance has immense importance as it impacts the other FSC partners’ performance [16]. Consumers put new demands on different foodstuff attributes, namely, quality, integrity, safety, and diversity [49]. Therefore, the use of modern equipment can enable producers to increase energy efficiency and product quality (freshness, nutritional values, and flavor) properly which can further assist suppliers, industrial processors, and distributors to deliver high-quality oriented food products to their buyers [50]. The use of pesticides/chemicals has a negative effect on the consumer’s health [51]; therefore, the minimum possible use of pesticides at producer end can label the SC as healthy FSC. For example, an adulterated milk case related to the Sanlu Group in 2008, in which the company’s dairy products were detected with a high level of melamine, and the Sanlu Group blamed their milk producers for supplying contaminated milk [9]. According to Shashi et al. [4], the use of cold chain facilities and effective packaging at the producer stage increases the shelf life of perishable products further maximizing the selling time of the next stage players (suppliers, industrial processors, distributors and retailers). In addition, a reduction in postharvest losses at the producer stages enables meeting end customer demand and thus maximizes FSC profitability [13,14]. The literature also highlighted the positive relationship between the distance between producer and FSC members and FSC cost [52]. Few scholars claimed that cost-cutting through technology adoption and proper management by producers can control the product price which can attract more customers and increase market competitiveness at various FSC stages [53]. The study findings of a past paper [54] confirmed that the market orientation performance of food producers directly and positively impacts the FSC performance in term of sales growth, market share, and profitability. Likewise, Spoolder et al. [38] inferred that adoption of quality certificates at the producer end has a positive influence on downstream partners’ performance. Sarkar and Mohapatra [55] analyzed the role of higher coordination between producer and downstream FSC partners. The preceding arguments led us to develop the following hypotheses.
Hypothesis 1.
Producer’s performance positively impacts supplier’s performance
Hypothesis 2.
Producer’s performance positively impacts processor’s performance
Hypothesis 3.
Producer’s performance positively impacts distributor’s performance
3.2. Supplier’s Performance
According to Agarwal and Vijayvargy [56], supplier capability means that the supplier’s potential can be leveraged to the buyer’s advantage in the long run and supplier performance refers to the supplier’s demonstrated ability to fulfil the customer’s demand. Thus, the suppliers can be the both the biggest assets and the biggest liabilities for food firms [57]. Literature highlighted the impact of supplier’s product quality, cost, delivery, efficiency, and flexibility on chain competitiveness [13,14,15]. Moreover, Shashi et al. [16] found the positive impact of food supplier’s value addition performance on food processor’s value addition performance and distributor’s value addition performance. Spoolder et al. [37] argued that organized retailers support collaboration processes with reliable and energy-efficient suppliers to rationalize their supply for SC economies and partnership gains. Meanwhile, Katsikeas et al. [58] studied the impact of alliance types between supplier, manufacturer, and retailer, and reported its impact on their profits. Chaudhuri et al. [59] claimed that distributors and retailers can only attain higher performance if they experienced higher supplier’s performance in the context of price, delivery flexibility, efficiency, reliability, services, etc. Likewise, better coordination between buyer and supplier minimizes the costs and promotes the better plan formulation [48]. Few scholars linked suppliers’ performance with supply uncertainty [60,61]. This is because uncertainties about the availability of raw materials and the high lead-time of the supplier stops the processor’s production processes [62]. On other hand, Shah and Ganji [15] stressed that the nearness of suppliers and low cost of the supplier’s offered products led to a cost advantage. In the light of the above discussion, we have proposed the following hypotheses.
Hypothesis 4.
Supplier’s performance positively impacts processor’s performance
Hypothesis 5.
Supplier’s performance positively impacts distributor’s performance
Hypothesis 6.
Supplier’s performance positively impacts retailer’s performance
3.3. Processor’s Performance
The processor stage is an important link in the FSC and affects the success of distribution and retail practices [63]. A processor focuses on process innovation that improves product quality and thus products can be priced higher if they meet customers’ expectations. In the same vein, it can minimize the food processing cost which further affects the final product price [64]. Likewise, Bourlakis et al. [36] asserted the positive impact of the processor’s products variety on meeting end customers demand. Hoefkens et al. [65] claimed that product orientation strategies not only meet customers’ needs and expectations but also increase the profits of firm and firm’s partners. The high processor’s lead-time increases the handling costs and food wastage and thus arise dissatisfaction [16]. According to Verghese et al. [12], the use of quality packaging material at the food processor stage significantly reduces the food waste during distribution and retail practices. Shashi et al. [16] suggested that processor’s efforts on nutrition value, taste, and product appearance facilitate retailers in satisfying customers need and retaining them for a long period of time. Here, we assumed that regular improvement in industrial processors’ performance results in improvement in distributor’s performance and retailers’ performance. Thereby, we have proposed:
Hypothesis 7.
Processor’s performance positively impacts distributor’s performance
Hypothesis 8.
Processor’s performance positively impacts retailer’s performance
3.4. Impact of Distributor’s Performance
Food product distributor delivers products at the retail store to make them available to consumers. Shashi et al. [16] revealed that distributor’s performance has the impact on retail performance as they influence consumer buying experience. A competitive distributor achieves many SC objectives, which starts from reducing the cost and ends with increasing customers’ responsiveness [6]. The product availability and variety at retail stores depend upon the distributor’s delivery efficiency and reliability [9], which is positively related to retail performance (customer satisfaction, retention, profitability, retail market share, and goodwill) [16]. Chen et al. [9] stated that if even a few items do not meet the order specification supplied by the distributor to the retailer then it can impact profitability. More importantly, the high lead-time to deliver perishable products at retail stores minimizes the product’s shelf-life and retailer’s selling time [13]. We have, therefore, hypothesized the following.
Hypothesis 9.
Distributor’s performance positively impacts retailer’s performance.
4. Research Methodology
The five key constructs of this study are the producer, supplier, industrial processor, distributor, and retailer. To test the research hypotheses, a survey study was carried out in Northern India. Thorough literature revisions and FSC practitioners and experts opinions were taken into consideration during questionnaire development.
Initially, a pre-pilot study was done to ensure the relevance of the questionnaire’s items and later on a pilot study of FSC practitioners was conducted. After a satisfactory pilot study, a large-scale survey was done. For measurement items, we adopted a 7-point Likert scale which ranges from 1 (‘most unimportant’) to 7 (‘most important’). Respondents were asked to indicate the importance of performance areas according to each FSC stage.
The questionnaire was originally written in English and thereafter it was translated into Hindi and Punjabi languages. The final questionnaire was divided according to FSC stages. In the cover letter, respondents were notified that all feedback was anonymous. Thus, there is no right or wrong answer. According to Podsakoff et al. [66], this method assists in controlling response bias. Shashi et al. [16] argued that to study the FSC, it is worthwhile to include FSC practitioners as survey respondents. Therefore, the questionnaire was distributed to FSC practitioners engaged in the supply of processed and unprocessed (fruits and vegetables and poultry and dairy products) food.
In addition, the snowball sampling method was used to contact survey respondents. This is the nonprobability method of sample selection commonly considered to identify one or more respondents in hidden populations [67]. Initially, 734 questionnaires were distributed, but only 445 were returned. Out of these responses, only 434 were tabulated into a SPSS spreadsheet as 11 responses were incomplete. Thus, this study has a 59.12% valid survey response rate. Some authors suggest 20% as the minimum acceptable response rate in the empirical operations management research context [68]. Thus, a response rate of 59.12% in the present study can be considered sufficient for statistical analysis and inference.
The survey findings infer that out of the 434 valid responses, 83 (19.12%) represent producers, 85 (19.58%) represent suppliers, 62 (14.28%) represent industrial processors, 108 (24.88%) represent distributors, and the remaining 96 (22.11%) represent retail managers.
The nonresponse bias was evaluated through considerable differences between the early return and late return survey responses [69]. According to Armstrong and Overton [70], the late return survey responses represent the opinion of nonrespondents and recommended to divide the returned sample responses into two sets; early responses and late responses, and that a comparison be made between them. Herein, to assess the nonresponse bias, this study made a comparison between early returned and late returned responses to all variables employing a t-test. The results reported no statistically significant differences. Hence, nonresponse bias is not treated as an issue with the collected data.
Subsequently, Harman’s one-factor test was taken into consideration to deal with common method bias [71]. The results of the factor analysis revealed ten distinctive factors with eigenvalues above 1.0, demonstrating 71.321% cumulative variance. The first extracted factor demonstrated 36.143% of the variance, which was not the majority of the cumulative variance. Consequently, in order to validate Harman’s one-factor test results, we applied the latent factor method as recommended previously [66]. To do so, two models were developed: the model without common latent factor and model with the common latent factor. Thereafter, model regression weights were subject to comparison and found no statistically significant difference among regression weights. Therefore, issues related to common method bias were not treated as significant.
Measures
A questionnaire was designed from the extensive literature revision and deep discussion with food SC practitioner, academicians and researchers. This survey included the following measures.
Producer’s performance measures should reflect the ultimate productivity of the food producer that has been adapted from the extensive literature revision and deep discussion with food SC practitioners, academicians, and researchers. Specifically, we designed the questionnaire to suit the Indian farming context. Eight performance measures were selected as appropriate items for the measuring Indian food producers’ performance, namely animal/field/tree productivity rate, product quality, labor and machine cost, animal/seed/plan cost, care cost, labor productivity, postharvest rate, and transportation cost.
Supplier’s performance measures should capture how efficiently and effectively the supplier is achieving SC objectives. Seven performance measures were found appropriate for evaluating Indian food suppliers’ performance such as collection cost, cooling cost, supplier product quality, delivery flexibility, delivery reliability, supplier lead-time, and distribution cost.
Process’s performance measures should indicate the processor output in areas of production, operations, cost, customer, and employee productivity, etc. Twenty performance measures were found appropriate for measuring processor’s performance, namely, stakeholder value, order fill rate, material cost, employee performance evaluation, employee turnover, processing flexibility, processing cost, processor lead-time, customer query time, value added cost, waste evaluation, customer retention rate, customer complaint rate, cooling cost, return on investment, processing errors, training cost, information sharing cost, value of the unaccounted stock, and recycling rate.
Distributor’s performance measures should reflect the distributor’s ability to distribute order without taking high lead-time and minimum cost. Six performance measures were selected as appropriate items for the measuring distributor’s performance, such as distributor product quality, order returned rate, distributor lead-time, distribution cost, perfect order fulfillment rate, and product variety. Eleven performance measures were found suitable for measuring Retailer’s performance. These measures are customer entrance, available product variety, product quality, average purchased value, lost-sale opportunities, incremental sale, sale per square meter, waste and theft rate, billing accuracy, customers’ satisfaction rate, and sale growth rate.
5. Empirical Analysis
In this section, survey data were converted into valuable information by using statistical measures. Initially, descriptive statistic and exploratory factor analysis (EFA) was employed to ensure the unidimensionality of scale. Hair et al. [72] suggested that a sample size above 200 is a sound base for applying the structural equation modeling (SEM) approach. Thus, later, SEM was used to test the proposed hypotheses.
5.1. Measurement Validation
To test the reliability of the scale, initially, item Commonality and Alpha-if-item deleted measures were used [73,74]. For this, the recommendations formulated by Hair et al. [72] were taken into considerations. In this phase, two metrics from the processor construct—P14 (value of the unaccounted stock) and P20 (recycling rate)—as well as one metric—R8 (waste and theft rate)—from the retail construct were omitted from the final analysis due to their low commonality values. Further, the Kaiser–Meyer–Olkin (KMO) test was used to check the normality and outliers. Kaiser [74] suggested that the KMO value should be above 0.50 to conduct factor analysis. Table 1, Table 2, Table 3, Table 4 and Table 5 show that KMO values ranging from 0.850 to 0.953, which is good. Meanwhile, Cronbach’s alpha is a widely accepted reliability measure. Hair et al.’s [75] recommended criterion for Cronbach’s alpha is 0.50, with 0.70 indicating high reliability. The Cronbach alpha of all five constructs lie within 0.863 to 0.949 and indicates higher reliability (Table 1, Table 2, Table 3, Table 4 and Table 5) [75,76]. On the behalf of above-obtained results, the survey data were found suitable for EFA.
5.2. Exploratory Factor Analysis
In this subsection, EFA with Varimax rotation method was performed to verify the structure that the number of items loaded within each factor in each proposed construct. Herein, principal component analysis with VARIMAX rotation was used. The extraction criteria of an eigenvalue above 1 was only considered and proposed to exclude all measurement items with factor loadings below 0.50 [77]. Five separate EFA tests were performed to classify the variables of five different constructs.
5.2.1. Producer’s Performance
For the producer’s performance, EFA extracted single factor with eight items. Due to the extraction of a single factor, the component matrix was used for item loadings [72] and the factor was named as a producer. The analysis obtained a KMO of 0.942 and eigenvalue of 4.195. The extracted factor explained 61.43% of the variance, and items’ factor loadings were greater than 0.5 and thus, statistically significant [78] (Table 1).
5.2.2. Supplier’s Performance
As items of supplier’s performance were factor analyzed, we obtained KMO value of 0.907 and extracted single factor. Thus, the component matrix was used for factor loadings. The factor included seven items and explained 63.242% of the cumulative variance with eigenvalue of 4.427. Here, all item loadings were greater than 0.5 and thus the items are acceptable [79] (Table 2).
5.2.3. Processor’s Performance
For this stage, EFA classified all 18 items into three factors. After meticulous revision of the items, factors were named as value, cost, and processing. The analysis obtained KMO value of 0.953 and extracted factors explained 74.29% of the cumulative variance. Here, the rotated matrix was used as the EFA extracted more than one factors [72]. The first and the most important factor (value) includes seven items with significant loadings between 0.880 and 0.769. In addition, factor obtained an Alpha value of 0.934 and individually explained 47.032% of the variance with a significant eigenvalue of 9.726 (Table 3).
Cost factor also includes seven items and its items’ loadings were ranging from 0.752 to 0.701. Factor individually explained 19.137% of the variance and obtained significant the alpha and eigenvalue of 0.949 and 2.185, respectively. Moreover, third extracted factor (processing) comprises four items and individually explained 8.129% of the variance. Similarly, factor obtained the alpha value of 0.863 and eigenvalue of 1.352. Here, items’ loadings were above 0.5 and thus statistically acceptable [78] (Table 3).
5.2.4. Distributor’s performance
Results of the EFA process for distributor construct are portrayed in Table 4. As the six items of distributor’s performance were factor analyzed, EFA extracted a single factor and further named as the distributor. The analysis obtained KMO of 0.850. In addition, factor explained 66.74% of the cumulative variance with eigenvalue of 4.05 and the alpha value of 0.900. Meanwhile, all related items’ loadings were greater than 0.5 (Table 4).
5.2.5. Retailer’s Performance
For the retailer’s performance, EFA extracted two different factors which together explained 73.91% of the variance. Moreover, analysis obtained KMO value of 0.931 which is above the minimum threshold of 0.50 as suggested by [74]. After analyzing the items, extracted factors were named as sale and satisfaction. The first and most important factor (sale) consists of six items and individually explained 59.64% of the variance with the alpha value of 0.926 and eigenvalue of 5.965. In addition, factor loadings were ranging between 0.716 and 0.867 (Table 5). The second extracted factor (satisfaction) includes four items with significant factor loadings greater than 0.5. This factor had an alpha value of 4.195 and eigenvalue of 1.427 as well as individually explained 14.26% of the variance (Table 5).
5.3. Test of Hypotheses
The measurement of the proposed model was made by considering the outputs of SEM. According to Ding et al. [79], in order to apply the maximum likelihood estimate method, the minimum sample should be between 100 and 150. Herein, we have the sample size of 434, thus satisfying the condition of minimum sample size. Initially, the research framework was evaluated for nomological validity taking the overall model fit indices into the account, and subsequently, the potencies of the impacts were measured through the SEM standardized path coefficients (β).
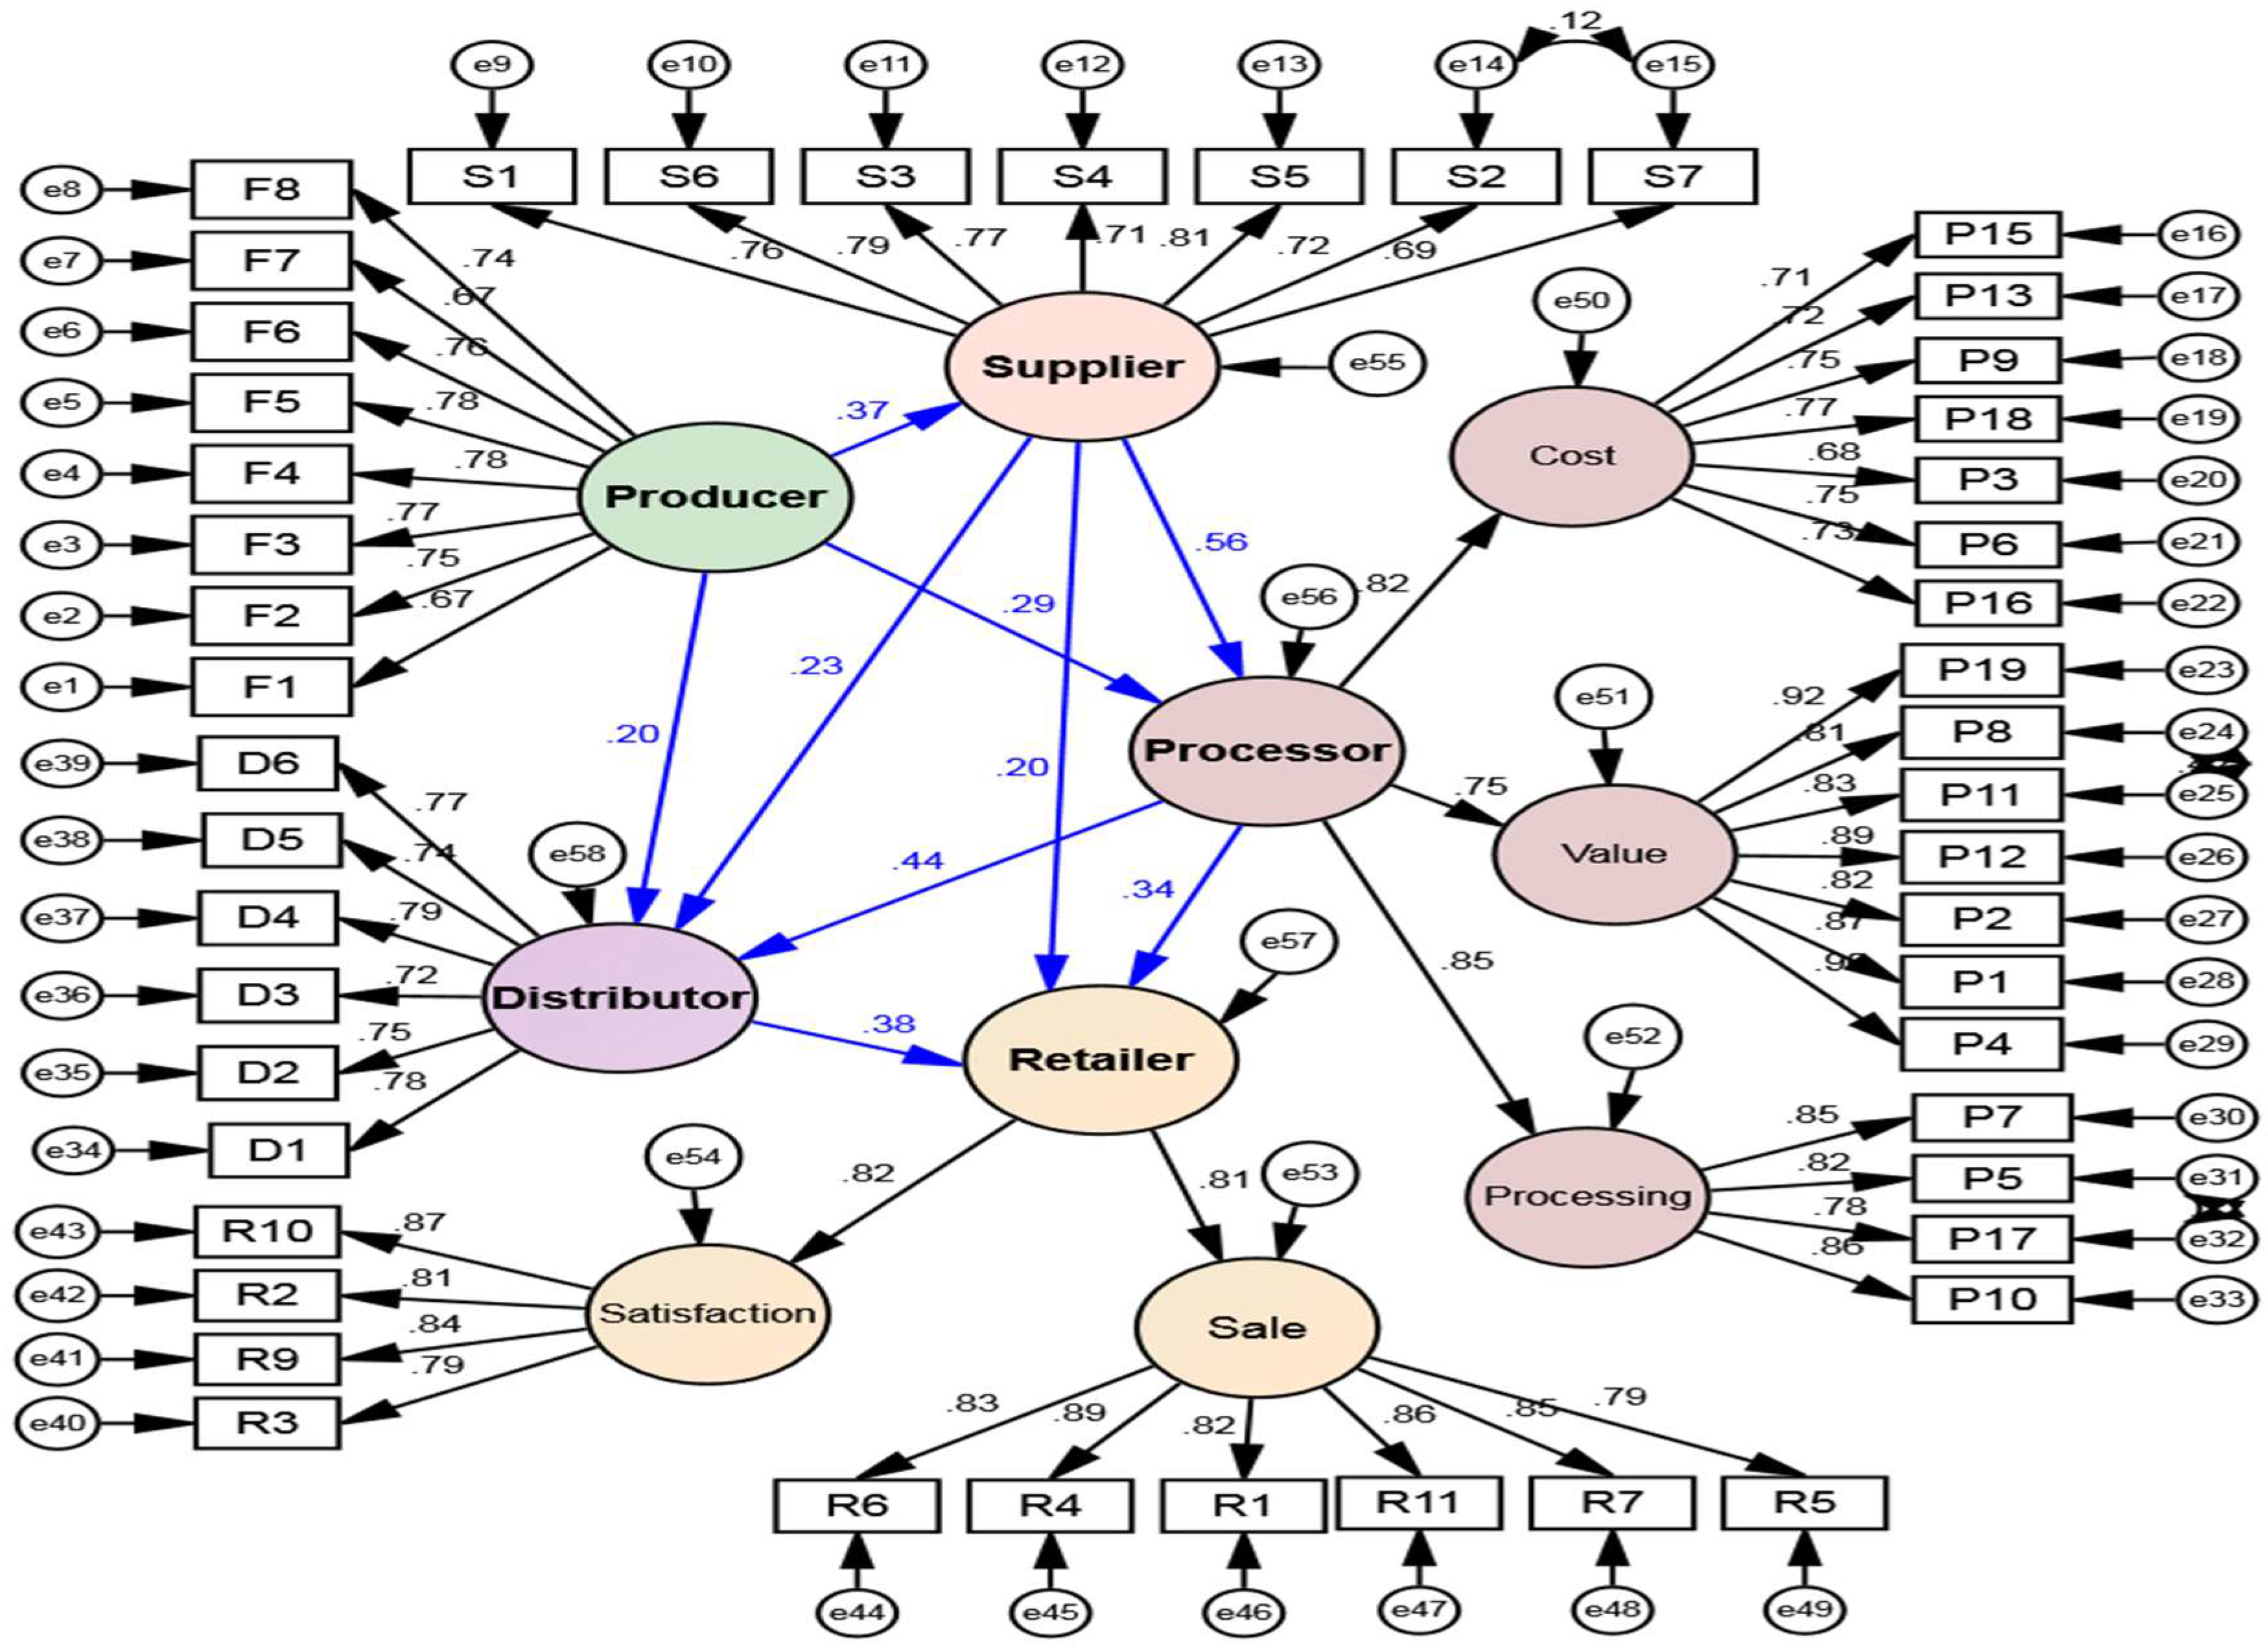
We evaluated the statistical fit of measurement model as CMIN/DF = 1.327, GFI = 0.912, NFI = 0.922, CFI = 0.975, and RMSEA = 0.029. Considering the aforementioned fit indices, it was concluded that there is significant alignment between the model and the experimental data, and thus the model is suitable for hypothesis testing [80]. After that, the research model was evaluated. Herein, Figure 2 shows the testing of the proposed hypotheses. The β and critical t-value for each casual path are presented in Table 6.
Analysis results supported Hypothesis 1, which asserted that producer’s performance positively impacts supplier’s performance (total β = 0.37, t = 6.62, p < 0.001) (Table 6). Hypothesis 2, which stated that producer’s performance positively impacts processor’s performance, was supported (total β = 0.50, t = 5.53, p < 0.001). Hypothesis 3, which posited that producer’s performance positively impacts distributor’s performance, was also supported (total β = 0.51, t = 4.04, p < 0.001) (Table 6).
In the same vein, Hypothesis 4, which claimed that supplier’s performance positively impacts processor’s performance, was confirmed (total β = 0.56, t = 9.17, p < 0.001). The results give strong support to Hypothesis 5, which stated that supplier’s performance positively impacts distributor’s performance (total β = 0.48, t = 3.68, p < 0.001). Hypothesis 6 was also strongly confirmed (total β = 0.57, t = 3.04, p < 0.004), which posited that the supplier’s performance positively impacts retailer’s performance (Table 6).
Hypothesis 7, which inferred that processor’s performance positively impacts distributor’s performance, was supported (total β = 0.44, t = 5.79, p < 0.001). Also, analysis affirmed Hypothesis 8, which claimed that the processor’s performance positively impacts retailer’s performance (total β = 0.51, t = 4.09, p < 0.001). Lastly, Hypothesis 9, which theorized that distributor performance positively impacts retailer’s performance, was also confirmed (total β = 0.38, t = 5.30, p < 0.001) (Table 6).
The results showed the following positive direct relationships. (1) Producer’s performance to process supplier’s performance (0.37), processor’s performance (0.29), and distributor’s performance (0.20); (2) supplier’s performance to processor’s performance (0.56), distributor’s performance (0.23), and retailer’s performance (0.20); (3) processor’s performance to distributor’s performance (0.44) and retailer’s performance (0.34); and (4) distributor’s performance to retailer’s performance (0.38) (Table 6).
As indirect effects are concerned, the indirect effect of producer’s performance on processor’s performance was 0.21, and 0.31 on distributor’s performance. The indirect effect of supplier’s performance on distributor’s performance was 0.25. The indirect effect of supplier’s performance on retailer’s performance was 0.37, which is the highest among all indirect effects. Finally, the indirect effect of processor’s performance on retailer’s performance was 0.17 (Table 6).
6. Discussion and Managerial Implications
The architecture of this article offers an in-depth understanding of the major assumptions of the performance relationship among FSC partners. The previous studies published on FSC have not empirically tested the association between the aforementioned partners’ performance constructs. To the best of the authors’ knowledge, this is the first study that simultaneously classifies and tests the performance relationship. This study proposes a five construct nine agreement performance model and offers a more in-depth contemporary understanding that how the performance improvement at one stage can improve the performance of other stages. This will help identify which partners have a high or low direct, indirect, and total impact on sustainable and energy-efficient FSC partners.
One of the major bottlenecks of the Indian food industry is lack of coordination among FSC members [18]. Even the FSC partners are not fully aware of the impact of their partners’ performance on their own performance [4]. Therefore, the study findings can assist the Indian food industry to maintain the performance standard at each FSC stage. Most importantly, this paper provides generalizable answers to three questions: (1) which performance areas need to be measured and improved at each FSC stage; (2) how do significant improvements in performance at one stage positively improve the performance of other stages; (3) which major performance criteria need to be underlined during the partner selection process.
The empirical evidence of positive association between the processor’s performance, supplier’s performance, processor’s performance, distributor’s performance, and retailer’s performance will encourage firms to “track and trace” the own as well as their partners’ performance which can further assist in reducing errors, satisfying customer, enhancing brand value and improving profitability. This would not only enhance FSCP but also build trust and responsiveness towards chain partners, which will further assist them in harnessing the benefits of collaborative sustainable SC. Our results convey that performance measurement at each FSC will be a win-win situation for the focal firm and SC members and will place the whole FSC in the better competitive position.
The previous studies on FSC only explored the impact of suppliers’ performance on the focal firm. Our study findings convey that however, the suppliers’ performances are highly important but are not enough to tackle the globalized market competition and to attain sustainable FSC performance. Hence, the Indian food industry needs to integrate the performance of all FSC partners to survive and to increase efficiency and meet the raised food demands.
The study shows that producer’s performance directly impacts the supplier’s performance, processor’s performance, and the distributor’s performance. However, the impact of producer’s performance on supplier’s performance is comparatively higher than that of processor’s performance on distributor’s performance. Further, the supplier’s performance directly impacts the processor’s performance, distributor’s performance, and retailer’s performance, and the impact of supplier’s performance on processor’s performance is comparatively higher than that of distributor’s and retailer’s performance. Meanwhile, processor’s performance directly impacts distributor’s performance and retailer’s performance, but the impact of processor’s performance is higher on distributor’s performance as compared to retailer’s performance. Lastly, the distributor’s performance directly impacts the retailer’s performance. Thus, it can be concluded that the direct impact of each partner’s performance is comparatively high on its immediate next partner’s performance of the FSC.
Our results also convey that supplier’s performance has the highest direct impact on processor’s performance in FSC which is further followed by the direct impact of processor’s performance on distributor’s performance, and distributor’s performance on retailer’s performance. Meanwhile, as indirect performance impact is concerned, the supplier’s performance has the highest indirect impact on retailer’s performance which is further followed by the impact of processor’s performance on distributor’s performance. If we talk about total performance impact, supplier’s performance has also the highest total impact on retailer’s performance.
On the other hand, the expansion of product lines at the processor stage can increase product variety at distributor and retail points. The food products should be offered in hygienic and good packaging at lower incremental cost. This will help in winning the consumers’ confidence. Besides, the use of good quality of packaging material can facilitate better order handling, reduce wastage and maintain product quality, quantity, and taste. This will increase market share and growth rate. In conclusion, by implementing this performance measurement structure, companies along with their partners can improve market competitiveness and help India to become the “world’s food basket”.
Though this study represents to FSCP of fruits & vegetables, poultry, and dairy food products in the Indian context, this can also assist in improving the performance of other agricultural sectors. Moreover, the study could also serve to China, as China is also looking for novel ways to improve their FSCP as China is also facing the same problems, namely, high demand for quality food products, a high waste rate, and huge population [81]. Therefore, since the last few years, China has been relying on large-scale perishable products imports from the international market to fulfill the raised food demand [82]. Therefore, the improvement in FSC performance at each stage can also enable China to improve its production, food safety, and quality as well as decrease the import rate.
Although this study provides significant contributions in both theory and practice, one limitation also exists which should be overcome in the future researchers. The proposed model represents both unprocessed and processed FSC, thus, the development and measurement of separate performance models for unprocessed and processed farm foodstuffs can be more remunerative. Additionally, in the future, it would be interesting to examine the impact of food value addition practices on sustainable and energy-efficient FSCP.
7. Conclusions
Paramount FSC performance in highly populated countries has immense importance to meet the increased demand for food products in sustainable manners. Our study tests FSC performance relationship among partners to provide a deep understanding of the performance of upstream partners for the downstream actors of FSC. This study fills a gap in the body of knowledge considering the scarcity of relevant contributions in the field of FSC. It also reports the key different areas of performance improvement for each FSC stage, thus, it extends the existing literature which claims about similar performance improvement areas for all stage players. Our study claims that to survive and thrive in the globalized food marketplace, all FSC partners need to work as an unit, and make regular efforts to trace and improve their own performance as well as guide their partners about their weak performance areas Our study concluded that regular performance improvement at each FSC stage would improve the partners’ performance of next stages. Moreover, it is interesting to note that the direct impact of each partner’s performance is comparatively high on its immediate next partner’s performance. The findings of this research allow FSC practitioners to take into consideration the differences between the direct, indirect and total effects of each stage performance that can be adopted to pursue performance improvement.
Although this study provides significant contributions in both theory and practice, few limitations exist and should be overcome in the future researches. One limitation of this study is that we tested the performance relationship from upward to downward. This research offers an additional building block in the process of developing new competitive models in the FSC performance area. Therefore, in this line, it would be interesting to test the performance relationship from downward to upward. Secondly, the proposed model represents both unprocessed and processed FSC, thus, the development and measurement of separate performance models for unprocessed and processed farm foodstuffs can be more remunerative. Additionally, in the future, it would be interesting to examine the impact of food value addition practices on sustainable and energy-efficient FSCP.
Author Contributions
The authors contributed equally to this work. Conceptualization, P.C., R.C., S.; Data Curation and Validation, S. and R.S.
Funding
This research received no external funding.
Conflicts of Interest
The authors declare no conflict of interest.
References
- Aggestam, V.; Fleib, E.; Posch, A. Scaling-up short food supply chains? A survey study on the drivers behind the intention of food producers. J. Rural Stud. 2017, 51, 64–72. [Google Scholar] [CrossRef]
- Kirwan, J.; Maye, D.; Brunori, G. Acknowledging complexity in food supply chains when assessing their performance and sustainability. J. Rural Stud. 2017, 52, 21–32. [Google Scholar] [CrossRef]
- Pigini, D.; Conti, M. NFC-based traceability in food chain. Sustainability 2017, 9, 1910. [Google Scholar] [CrossRef]
- Shashi; Cerchione, R.; Singh, R.; Centobelli, P.; Shabani, A. Food cold chain management: From a structured literature review to a conceptual framework and research agenda. Int. J. Logist. Manag. 2018, 29, 792–821. [Google Scholar]
- Shi, H.; Quan, M.-Y.; Liu, H.-C.; Duan, C.-Y. A novel integrated approach for green supplier selection with interval-valued intuitionistic uncertain linguistic information: A case study in the agri-food industry. Sustainability 2018, 10, 733. [Google Scholar] [CrossRef]
- Verdouw, C.N.; Wolfert, J.; Beulens, A.J.M.; Rialland, A. Virtualization of food supply chains with the internet of things. J. Food Eng. 2016, 176, 128–136. [Google Scholar] [CrossRef] [Green Version]
- Roth, A.V.; Tsay, A.A.; Pullman, M.E.; Gray, J.V. Unraveling the food supply chain: Strategic insights from China and the 2007 recalls. J. Supply Chain Manag. 2008, 44, 22–39. [Google Scholar] [CrossRef]
- León-Bravo, V.; Caniato, F.; Caridi, M.; Johnsen, T. Collaboration for sustainability in the food supply chain: A multi-stage study in Italy. Sustainability 2017, 9, 1253. [Google Scholar] [CrossRef]
- Chen, C.; Zhang, J.; Delaurentis, T. Quality control in food supply chain management: An analytical model and case study of the adulterated milk incident in China. Int. J. Prod. Econ. 2014, 152, 188–199. [Google Scholar] [CrossRef]
- Esposito, E.; Passaro, R. Evolution of the supply chain in the Italian railway industry. Supply Chain Manag. 2009, 14, 303–313. [Google Scholar] [CrossRef]
- Dania, W.A.P.; Xing, K.; Amer, Y. Collaboration behavioural factors for sustainable agri-food supply chains: A systematic review. J. Clean. Prod. 2018, 186, 851–864. [Google Scholar] [CrossRef]
- Verghese, K.; Lewis, H.; Lockrey, S.; Williams, H. Packaging’s role in minimizing food loss and waste across the supply chain. Packag. Technol. Sci. 2015, 28, 603–620. [Google Scholar] [CrossRef]
- Aramyan, L.H.; Lansink, A.G.O.; Van Der Vorst, J.G.; Van Kooten, O. Performance measurement in agri-food supply chains: A case study. Supply Chain Manag. Int. J. 2007, 12, 304–315. [Google Scholar] [CrossRef]
- Aramyan, L.; Ondersteijn, C.; van Kooten, O.; Oude Lansink, A. Performance indicators in agri-food production chains. In Quantifying the Agri-Food Supply Chain; Ondersteijn, C.J., Wijnands, J.H., Huirne, R.B., van Kooten, O., Eds.; Springer: Dordrecht, The Netherlands, 2006; pp. 47–64. [Google Scholar]
- Shah, S.R.; Ganji, E.N. Lean production and supply chain innovation in baked foods supplier to improve performance. Br. Food J. 2017, 119, 2421–2447. [Google Scholar] [CrossRef] [Green Version]
- Shashi; Singh, R.; Shabani, A. Value-adding practices in food supply chain: Evidence from Indian food industry. Agribusiness 2017, 33, 116–130. [Google Scholar] [CrossRef]
- Aung, M.M.; Chang, Y.S. Traceability in a food supply chain: Safety and quality perspectives. Food Control 2014, 39, 172–184. [Google Scholar] [CrossRef]
- Balaji, M.; Arshinder, K. Modeling the causes of food wastage in Indian perishable food supply chain. Resour. Conserv. Recycl. 2016, 114, 153–167. [Google Scholar]
- Beske, P.; Land, L.; Seuring, S. Sustainable supply chain management practices and dynamic capabilities in the food industry: A critical analysis of the literature. Int. J. Prod. Econ. 2014, 152, 131–143. [Google Scholar] [CrossRef]
- Shukla, M.; Jharkharia, S. Agri-fresh produce supply chain management: A state of the art literature review. Int. J. Oper. Prod. Manag. 2013, 33, 114–158. [Google Scholar] [CrossRef]
- USDA. With Adequate Productivity Growth, Global Agriculture Is Resilient to Future Population and Economic Growth. 2014. Available online: http://www.ers.usda.gov/amber-waves/2014-december/with-adequate-productivity-growth,-global-agriculture-is-resilient-to-future-population-and-economic-growth.aspx#.VpdxuPl97IU (accessed on 11 December 2018).
- Bhattacharya, R.; Gupta, A.S. Drivers and impact of food inflation in India. Macroecon. Financ. Emerg. Mark. Econ. 2017, in press. [Google Scholar] [CrossRef]
- Devi, C.U. Trade performance of Indian processed foods in the international market. Procedia Soc. Behav. Sci. 2014, 133, 84–92. [Google Scholar] [CrossRef]
- GHI. Global Hunger Indexes the Inequalities of Hunger. 2017. Available online: http://www.globalhungerindex.org/pdf/en/2017.pdf (accessed on 11 December 2018).
- Andoju, S. Food Wastage Costs India: 1 Lakh Crore Every Year. Here’s how You Can Stop It. 2017. Available online: https://www.youthkiawaaz.com/2017/03/what-you-can-do-about-food-wastage-in-india/ (accessed on 11 December 2018).
- Business Standard. Why India’s Exports of Fruit and Vegetables Have Dipped. 2017. Available online: http://www.rediff.com/money/report/why-indias-exports-of-fruit-and-vegetables-have-dipped/20171227.htm (accessed on 11 December 2018).
- Business Today. Reducing Food Waste Top Priority for India: Badal. 2017. Available online: https://www.businesstoday.in/sectors/agriculture/reducing-food-waste-top-priority-for-india-badal/story/261242.html (accessed on 11 December 2018).
- Indian Briefing. The Food Processing Industry in India: Investment Prospects. 2017. Available online: https://www.india-briefing.com/news/the-food-processing-industry-in-india-investment-prospects-14169.html/ (accessed on 11 December 2018).
- Mrunal. Introduction, Scope, Significance, Awesomeness (Hardly), Obstacles (Truckload of) for GS Mains. 2013. Available online: http://mrunal.org/2013/08/food-processing-introduction-scope-significance-awesomeness-hardly-obstacles-truckload-of-for-gs-mains.html#381 (accessed on 11 December 2018).
- The Economic Times. Food Processing Will Be Main Industry in Future: Jaitley. 2017. Available online: https://economictimes.indiatimes.com/industry/cons-products/food/food-processing-will-be-main-industry-in-future-jaitley/articleshow/61485828.cms (accessed on 11 December 2018).
- Akhtar, P.; Tse, Y.K.; Khan, Z.; Rao-Nicholson, R. Data-driven and adaptive leadership contributing to sustainability: Global agri-food supply chains connected with emerging markets. Int. J. Prod. Econ. 2016, 181, 392–401. [Google Scholar] [CrossRef]
- Koufteros, X.; Guanyi, Lu. Food supply chain safety and security: A concern of global importance. J. Mark. Channels 2017, 24, 111–114. [Google Scholar] [CrossRef]
- Ringsberg, H.A. Implementation of global traceability standards: Incentives and opportunities. Br. Food J. 2015, 117, 1826–1842. [Google Scholar] [CrossRef]
- Bhagwat, R.; Sharma, M.K. Performance measurement of supply chain management: A balanced scorecard approach. J. Comput. Ind. Eng. 2007, 53, 43–62. [Google Scholar] [CrossRef]
- Bigliardi, B.; Bottani, E. Performance measurement in the food supply chain: A balanced scorecard approach. Facilities 2010, 28, 249–260. [Google Scholar] [CrossRef]
- Bourlakis, M.; Maglaras, G.; Aktas, E.; Gallear, D.; Fotopoulos, C. Firm size and sustainable performance in food supply chains: Insights from Greek SMEs. Int. J. Prod. Econ. 2014, 152, 112–130. [Google Scholar] [CrossRef]
- Spoolder, H.A.M.; Burbidge, J.A.; Edwards, S.A.; Lawrence, A.B.; Simmins, P.H. Effects of food level on performance and behaviour of sows in a dynamic group-housing system with electronic feeding. Anim. Sci. 1997, 65, 473–482. [Google Scholar] [CrossRef]
- Spoolder, H.A.M.; Burbidge, J.A.; Edwards, S.A.; Simmins, P.H.; Lawrence, A.B. Effects of food level and straw bedding during pregnancy on sow performance and responses to an ACTH challenge. Livest. Prod. Sci. 1996, 47, 51–57. [Google Scholar] [CrossRef]
- Osorio, A.E.; Corradini, M.G.; Dewi, G. In-store cold chain failures: Food safety considerations. J. Mark. Channels 2017, 24, 153–170. [Google Scholar] [CrossRef]
- Shabani, A.; Torabipour, S.M.R.; Saen, R.F. A new super-efficiency Dual-Role FDH procedure: An application in dairy cold chain for vehicle selection. Int. J. Shipp. Transp. Logist. 2015, 71, 426–456. [Google Scholar] [CrossRef]
- Azoury, K.S.; Miyoka, J. Managing production and distribution for supply chains in the processed food industry. Prod. Oper. Manag. 2013, 22, 1250–1268. [Google Scholar] [CrossRef]
- Van der Vorst, J.G.A.J.; Tromp, S.-O.; van der Zee, D.-J. Simulation modelling for food supply chain redesign; integrated decision making on product quality, sustainability and logistics. Int. J. Prod. Res. 2009, 47, 6611–6631. [Google Scholar] [CrossRef] [Green Version]
- Ryu, I.; So, S.; Koo, C. The role of partnership in supply chain performance. Ind. Manag. Data Syst. 2009, 109, 496–514. [Google Scholar] [CrossRef]
- Okongwu, U.; Lauras, M.; François, J.; Deschamps, J. Impact of the integration of tactical supply chain planning determinants on performance. J. Manuf. Syst. 2016, 38, 181–194. [Google Scholar] [CrossRef]
- Han, J.; Lu, H.; Trienekens, J.H.; Omta, S.W.F. The impact of supply chain integration on firm performance in the pork processing industry in China. Chin. Manag. Stud. 2013, 7, 230–252. [Google Scholar] [CrossRef]
- Nyamah, E.Y.; Jiang, Y.; Feng, Y.; Enchill, E. Agri-food supply chain performance: An empirical impact of risk. Manag. Decis. 2017, 55, 872–891. [Google Scholar] [CrossRef]
- Handayati, Y.; Simatupang, T.M.; Perdana, T. Agri-food supply chain coordination: The state-of-the-art and recent developments. Logist. Res. 2015, 8, 2–15. [Google Scholar] [CrossRef]
- Van der Vorst, J.G.A.J. Performance measurement in agri-food supply chain networks. An overview. In Quantifying the Agri-food Supply Chain; Ondersteijn, C.J., Wijnands, J.H., Huirne, R.B., van Kooten, O., Eds.; Springer: Dordrecht, The Netherlands, 2005; pp. 13–24. [Google Scholar]
- Trienekens, J.; Zuurbier, P. Quality and safety standards in the food industry, developments and challenges. Int. J. Prod. Econ. 2008, 113, 107–122. [Google Scholar] [CrossRef]
- Van der Spiegel, M. Measuring Effectiveness of Food Quality Management. Ph.D. Thesis, Wageningen University, Wageningen, The Netherlands, 2004. [Google Scholar]
- Berti, G.; Mulligan, C. Competitiveness of small farms and innovative food supply chains: The role of food hubs in creating sustainable regional and local food systems. Sustainability 2016, 8, 616. [Google Scholar] [CrossRef]
- Rezitis, A.N.; Kalantzi, M.A. Investigating technical efficiency and its determinants by data envelopment analysis: An application in the Greek food and beverages manufacturing industry. Agribusiness 2016, 32, 254–271. [Google Scholar] [CrossRef]
- Vehapi, S.; Milanovic, M. The effect of market orientation on business performance of Serbian organic producers. Econ. Agric. 2017, 4, 1651–1668. [Google Scholar] [CrossRef]
- Uddin, N. Inter-organizational relational mechanism on firm performance: The case of Australian agri-food industry supply chain. Ind. Manag. Data Syst. 2017, 117, 1934–1953. [Google Scholar] [CrossRef]
- Sarkar, A.; Mohapatra, P.K.J. Evaluation of supplier capability and performance: A method for supply base reduction. J. Purch. Supply Manag. 2006, 12, 148–163. [Google Scholar] [CrossRef]
- Agarwal, G.; Vijayvargy, L. An application of supplier selection in supply chain for modeling of intangibles: A case study of multinational food coffee industry. Afr. J. Bus. Manag. 2011, 5, 11505–11520. [Google Scholar] [CrossRef]
- Lee, J.H.; Moon, I.K. Coordinated inventory models with compensation policy in a three level supply chain. In Computational Science and its Applicationsiccsa; Springer: Berlin, Germany, 2006; pp. 600–609. [Google Scholar]
- Katsikeas, C.S.; Paparoidamis, N.G.; Katsikea, E. Supply source selection criteria: The impact of supplier performance on distributor performance. Ind. Mark. Manag. 2004, 33, 755–764. [Google Scholar] [CrossRef]
- Chaudhuri, A.; Dukovska-Popovska, I.; Damgaard, C.M.; Hvolby, H.-H. Supply uncertainty in food processing supply chain: Sources and coping strategies. In Proceedings of the APMS 2014, Ajaccio, France, 20–24 September 2014. [Google Scholar]
- Shukla, S.; Shankar, R.; Singh, S.P. Food safety regulatory model in India. Food Control 2014, 37, 401–413. [Google Scholar] [CrossRef]
- Amorima, P.; Curcioa, E.; Almada-Loboa, B.; Barbosa-Póvoa, A.P.F.D.; Grossmann, I.E. Supplier selection in the processed food industry under uncertainty. Eur. J. Oper. Res. 2016, 252, 801–814. [Google Scholar] [CrossRef]
- Dani, S. Food Supply Chain Management and Logistics: From Farm to Fork. 2015. Available online: https://www.koganpage.com/media/project_kp/document/food-supply-chain-management-and-logistics-sample-chapter.pdf (accessed on 11 December 2018).
- Sellahewa, J.N.; Martindale, W. The impact of food processing on the sustainability of the food supply chain. Aspects Appl. Biol. 2010, 102, 91–98. [Google Scholar]
- Ruteri, J.M.; Xu, Q. Supply chain management and challenges facing the food industry sector in Tanzania. Int. J. Bus. Manag. 2009, 4, 70–80. [Google Scholar] [CrossRef]
- Hoefkens, C.; Camp, J.V.; Verbeke, W.; Aertsens, J.; Mondelaers, K. The nutritional and toxicological value of organic vegetables: Consumer perception versus scientific evidence. Br. Food J. 2009, 111, 1062–1077. [Google Scholar] [CrossRef]
- Podsakoff, P.M.; MacKenzie, S.B.; Lee, J.-Y.; Podsakoff, N.P. Common method biases in behavioral research: A critical review of the literature and recommended remedies. J. Appl. Psychol. 2003, 88, 879–903. [Google Scholar] [CrossRef] [PubMed]
- Johnson, T.P. Snowball Sampling: Introduction; Wiley & Sons: Chichester, UK, 2014. [Google Scholar]
- Malhotra, M.K.; Grover, V. An assessment of survey research in POM: From constructs to theory. J. Oper. Manag. 1998, 16, 407–425. [Google Scholar] [CrossRef]
- Prahinski, C.; Benton, W. Supplier evaluations: Communication strategies to improve supplier performance. J. Oper. Manag. 2004, 22, 39–62. [Google Scholar] [CrossRef]
- Armstrong, J.S.; Overton, T.S. Estimating non-response bias in mail surveys. J. Mark. Res. 1977, 4, 396–402. [Google Scholar] [CrossRef]
- Herman, H.H. Modern Factor Analysis; The University of Chicago Press: Chicago, IL, USA, 1976. [Google Scholar]
- Hair, J.F.; Black, W.C.; Babin, B.J.; Anderson, R.E. Multivariate Data Analysis; Prentice Hall: Upper Saddle River, NJ, USA, 2010. [Google Scholar]
- Yong, A.G.; Pearce, S. A beginner’s guide to factor analysis: Focusing on exploratory factor analysis. Tutor. Quant. Methods Psychol. 2013, 9, 79–94. [Google Scholar] [CrossRef]
- Kaiser, H.F. A second generation little jiffy. Psychometrika 1970, 35, 401–415. [Google Scholar] [CrossRef]
- Hair, J.F.; Black, W.C.; Babin, B.J.; Anderson, R.E.; Tatham, R.L. Multivariate Data Analysis; Pearson Education, Inc.: Delhi, Delhi, 2009. [Google Scholar]
- Nunnally, J.C. Psychometric Theory, 2nd ed.; McGraw-Hill: New York, NY, USA, 1978. [Google Scholar]
- Comrey, A.L.; Lee, H.B. A First Course in Factor Analysis; Erlbaum: Hillsdale, NJ, USA, 1992. [Google Scholar]
- Fornell, C.; Larcker, D.F. Evaluating structural equation models with unobservable variables and measurement error. J. Mark. Res. 1981, 18, 29–50. [Google Scholar] [CrossRef]
- Ding, L.; Velicer, W.; Harlow, L. Effect of estimation methods, number of indicators perfactor and improper solutions on structural equation modeling fit indices. Struct. Equ. Model. 1995, 2, 119–143. [Google Scholar] [CrossRef]
- Kline, R.B. Principles and Practice of Structural Equation Modeling; The Guilford Press: New York, NY, USA, 2011. [Google Scholar]
- Ghose, B. Food security and food self- sufficiency in China: From past to 2050. Food Energy Secur. 2017, 3, 86–95. [Google Scholar] [CrossRef]
- M. Z. Marketing Communications. Exporting Fresh Fruit and Vegetables to China a Market Overview and Guide for Foreign Suppliers; PMA China Market Development Representative: Shanghai, China, 2016. [Google Scholar]
Figure 1.
Conceptual model.

Figure 2.
Structural equation model.


Table 1.
Exploratory factor analysis (EFA) for producer’s performance.
| No. | Items | Producer (F1) |
|---|---|---|
| F2 | Product quality | 0.825 |
| F4 | Animal/seeds/plant cost | 0.820 |
| F3 | Labor and machinery cost | 0.816 |
| F8 | Transportation cost | 0.803 |
| F6 | Labor productivity | 0.798 |
| F5 | Care cost | 0.796 |
| F1 | Animal/field/tree productivity rate | 0.717 |
| F7 | Postharvest rate | 0.703 |
| Eigenvalue | 4.915 | |
| Cronbach’s Alpha | 0.910 | |
| Percentage of variance (61.436%) | 61.436 | |
| KMO = 0.942, Barlett’s test of Sphericity = 1848.16 | ||
Table 2.
EFA for supplier’s performance.
| No. | Items | Supplier (F1) |
|---|---|---|
| S5 | Delivery reliability | 0.833 |
| S1 | Collection cost | 0.820 |
| S6 | Supplier lead-time | 0.815 |
| S3 | Supplier product quality | 0.801 |
| S4 | Delivery flexibility | 0.791 |
| S2 | Cooling cost | 0.758 |
| S7 | Distribution cost | 0.744 |
| Eigenvalue | 4.427 | |
| Cronbach’s Alpha | 0.903 | |
| Percentage of variance (63.242%) | 63.242 | |
| KMO = 0.907, Barlett’s test of Sphericity = 1590.014 | ||
Table 3.
EFA for processor’s performance.
| No. | Items | Value (F1) | Cost (F2) | Processing (F3) |
|---|---|---|---|---|
| P19 | Employee turnover | 0.880 | - | - |
| P1 | Stakeholder value | 0.868 | - | - |
| P2 | Order fill rate | 0.865 | - | - |
| P4 | Employee performance evaluation | 0.862 | - | - |
| P12 | Customer complaint rate | 0.856 | - | - |
| P11 | Customer retention rate | 0.774 | - | - |
| P8 | Customer query time | 0.769 | - | - |
| P18 | Information sharing cost | - | 0.752 | - |
| P9 | Value added cost | - | 0.741 | - |
| P6 | Processing cost | - | 0.737 | - |
| P16 | Training cost | - | 0.729 | - |
| P13 | Cooling cost | - | 0.712 | - |
| P15 | Return on investment | - | 0.704 | - |
| P3 | Material cost | - | 0.701 | - |
| P5 | Processing flexibility | - | - | 0.847 |
| P10 | Processing errors | - | - | 0.820 |
| P7 | Processor lead-time | - | - | 0.741 |
| P17 | Waste evaluation | - | - | 0.718 |
| Alpha value | 0.934 | 0.949 | 0.863 | |
| Eigenvalue | 9.726 | 2.185 | 1.352 | |
| Percentage of Variance (74.29%) | 47.032 | 19.137 | 8.129 | |
| KMO = 0.953, Bartlett’s Test of Sphericity = 6591.0778 | ||||
Table 4.
EFA for distributor’s performance.
| No. | Items | Distributor (F1) |
|---|---|---|
| D6 | Product variety | 0.892 |
| D1 | Distributor product quality | 0.836 |
| D3 | Distributor lead-time | 0.803 |
| D4 | Distribution cost | 0.795 |
| D5 | Perfect order fulfillment rate | 0.788 |
| D2 | Order returned rate | 0.783 |
| Alpha value | 4.005 | |
| Eigenvalue | 0.900 | |
| Percentage of Variance (66.80%) | 66.74 | |
| KMO = 0.850, Bartlett’s Test of Sphericity = 1598.54 | ||
Table 5.
EFA for retailer’s performance.
| No. | Items | Sale (F1) | Satisfaction (F2) |
|---|---|---|---|
| R4 | Average purchased value | 0.867 | - |
| R11 | Sale growth rate | 0.849 | - |
| R7 | Sale per square meter | 0.842 | - |
| R6 | Incremental sale | 0.833 | - |
| R1 | Customer entrance | 0.803 | - |
| R5 | Lost-sale opportunities | 0.716 | - |
| R10 | Customers satisfaction rate | - | 0.843 |
| R9 | Billing accuracy | - | 0.833 |
| R2 | Available product variety | - | 0.820 |
| R3 | Product quality | - | 0.777 |
| Alpha value | 0.926 | 0.885 | |
| Eigenvalue | 5.965 | 1.427 | |
| Percentage of Variance (73.91%) | 59.64 | 14.26 | |
| KMO = 0.931, Bartlett’s Test of Sphericity = 3055.8979 | |||
Table 6.
Results of hypotheses testing.
| No. | Hypotheses | Direct Effect (β) | Indirect Effect (β) | Total Effect (β) | t-value | p-value | Remarks |
|---|---|---|---|---|---|---|---|
| H1 | Producer’s performance → supplier’s performance | 0.37 | 0.00 | 0.37 | 6.62 | p < 0.001 | Supported |
| H2 | Producer’s performance → processor’s performance | 0.29 | 0.21 | 0.50 | 5.53 | p < 0.001 | Supported |
| H3 | Producer’s performance → distributor’s performance | 0.20 | 0.31 | 0.51 | 4.04 | p < 0.001 | Supported |
| H4 | Supplier’s performance → processor’s performance | 0.56 | 0.00 | 0.56 | 9.17 | p < 0.001 | Supported |
| H5 | Supplier’s performance → distributor’s performance | 0.23 | 0.25 | 0.48 | 3.68 | p < 0.001 | Supported |
| H6 | Supplier’s performance → retailer’s performance | 0.20 | 0.37 | 0.57 | 3.04 | p < 0.004 | Supported |
| H7 | Processor’s performance → distributor’s performance | 0.44 | 0.00 | 0.44 | 5.79 | p < 0.001 | Supported |
| H8 | Processor’s performance → retailer’s performance | 0.34 | 0.17 | 0.51 | 4.09 | p < 0.001 | Supported |
| H9 | Distributor’s performance → retailer’s performance | 0.38 | 0.00 | 0.38 | 5.30 | p < 0.001 | Supported |
© 2018 by the authors. Licensee MDPI, Basel, Switzerland. This article is an open access article distributed under the terms and conditions of the Creative Commons Attribution (CC BY) license (http://creativecommons.org/licenses/by/4.0/).
Share and Cite
MDPI and ACS Style
Shashi; Singh, R.; Centobelli, P.; Cerchione, R. Evaluating Partnerships in Sustainability-Oriented Food Supply Chain: A Five-Stage Performance Measurement Model. Energies 2018, 11, 3473. https://doi.org/10.3390/en11123473
AMA Style
Shashi, Singh R, Centobelli P, Cerchione R. Evaluating Partnerships in Sustainability-Oriented Food Supply Chain: A Five-Stage Performance Measurement Model. Energies. 2018; 11(12):3473. https://doi.org/10.3390/en11123473
Chicago/Turabian StyleShashi, Rajwinder Singh, Piera Centobelli, and Roberto Cerchione. 2018. "Evaluating Partnerships in Sustainability-Oriented Food Supply Chain: A Five-Stage Performance Measurement Model" Energies 11, no. 12: 3473. https://doi.org/10.3390/en11123473
Note that from the first issue of 2016, this journal uses article numbers instead of page numbers. See further details here.