Towards Fast Response, Reduced Processing and Balanced Load in Fog-Based Data-Driven Smart Grid
by
 ,
,
Rasool Bukhsh
1, 
Nadeem Javaid
1,
Zahoor Ali Khan
2,
Farruh Ishmanov
3,*,
Muhammad Khalil Afzal
4 and
Zahid Wadud
5 1
Department of Computer Science, COMSATS University Islamabad, Islamabad 44000, Pakistan
2
CIS, Higher Colleges of Technology, Fujairah 4114, UAE
3
Department of Electronics and Communication Engineering, Kwangwoon University, Seoul 01897, Korea
4
Department of Computer Science, COMSATS University Islamabad, Wah Campus, Wah Cantonment 47040, Pakistan
5
Faculty of Computer Systems Engineering, University of Engineering and Technology Peshawar, Peshawar 25000, Pakistan
*
Author to whom correspondence should be addressed.
Energies 2018, 11(12), 3345; https://doi.org/10.3390/en11123345
Submission received: 3 November 2018
/
Revised: 22 November 2018
/
Accepted: 26 November 2018
/
Published: 30 November 2018
(This article belongs to the Special Issue Energy Efficiency and Data-Driven Control)
Abstract
:The integration of the smart grid with the cloud computing environment promises to develop an improved energy-management system for utility and consumers. New applications and services are being developed which generate huge requests to be processed in the cloud. As smart grids can dynamically be operated according to consumer requests (data), so, they can be called Data-Driven Smart Grids. Fog computing as an extension of cloud computing helps to mitigate the load on cloud data centers. This paper presents a cloud–fog-based system model to reduce Response Time (RT) and Processing Time (PT). The load of requests from end devices is processed in fog data centers. The selection of potential data centers and efficient allocation of requests on Virtual Machines (VMs) optimize the RT and PT. A New Service Broker Policy (NSBP) is proposed for the selection of a potential data center. The load-balancing algorithm, a hybrid of Particle Swarm Optimization and Simulated Annealing (PSO-SA), is proposed for the efficient allocation of requests on VMs in the potential data center. In the proposed system model, Micro-Grids (MGs) are placed near the fogs for uninterrupted and cheap power supply to clusters of residential buildings. The simulation results show the supremacy of NSBP and PSO-SA over their counterparts.
1. Introduction
With the increasing population, the introduction of new electrical and electronic gadgets in daily lives has increased the demand for electricity. Global warming and the emission of carbon dioxide are challenges for power production. Unfortunately, more than 65% of electricity is wasted during production, transmission, and distribution [1]. The power wastage is controlled by bidirectional communication between the supply or production side and consumer or demand side. The Smart Grid (SG) is a modernized electric grid that uses advanced Information and Communication Technologies (ICTs) on demand and supply sides. The consumers are educated to optimize their energy demands according to electricity tariff. Moreover, the load demand is reduced on the supply side by introducing Micro-Grids (MGs) with cheap electricity production and storage. Many new concepts which include Electric Vehicle (EV) charging and discharging, Advanced Metering Infrastructure (AMI), elastic load management and smart appliances [2] have been proposed by the researchers for efficient use of electricity. The home with smart appliances is called Smart Home (SH).
Variety of load optimization techniques are used on the demand side to minimize energy-consumption cost. Electricity prices are high during peak hours due to high production cost. The load of appliances is shifted from peak to off-peak hours to shave the peak load on the supply side and reduce the cost on the demand side. However, load-shifting compromises consumer satisfaction. Cheap, uninterrupted, and self-sufficient power-producing MGs are introduced on the demand side to resolve the user-satisfaction issue. However, MGs with Renewable Energy Sources (RESs) have an intermittent nature and are complex to maintain. Energy storage companies have been developing scenario-based flexible, reliable, and cheap energy demand solutions [3].
When a SH is connected with the utility then it has to optimize its load demand according to utility tariff. Demand response is a program in which the consumer changes the behavior of power consumption according to the utility tariff [4]. These programs play an important role in maintaining the sustainability of the SG. The consumers are also informed when and how to use electricity. For efficient and on-time energy management on the demand side, the utility provides predicted electricity market pricing [5]. Similarly, varying the demand of electricity causes fluctuation in pricing. Therefore, behavioral- and time-varying electricity prices are calculated and informed to consumers [6]. A huge number of requests from the demand side is received on supply side. The development of the Internet of Things (IoT) technology has enabled consumers to share information of energy consumption with the supply side autonomously. Similarly, the supply side also shares the tariff details with the demand side. The home energy-management program optimizes the load of appliances to reduce the load on supply side. The huge requests from the demand side need to be processed, which requires a huge computing system. The huge requests from the demand side are processed on a cloud-based system [7]. The energy supply and consumption is optimized with IoT-based devices and cloud-based energy management.
Autonomous and intelligent energy management, with distributed energy sources for the demand side to mitigate the load on the supply side, is the requirement of modern SG. The reliable and efficient communication network with computing infrastructure for efficient and robust power management in SG is necessary. A huge number of requests from the demand side is generated every day and computing needs for these requests can be met with cloud computing [8]. However, cloud computing suffers from delay, load request congestion, huge data computation and communication cost. The physical distance of the cloud platform from the end devices is the main cause of latency.
Fog computing extends the computing services on the edge to mitigate cloud load. The challenges of cloud computing are resolved with fog computing. Fogs are placed near the end devices which provide near-real-time response. Fog computing has characteristics of low latency, locality, geographic distribution, the mobility of end devices, high processing, wired and wireless connectivity, and heterogeneity [9]. The SG requests from the demand side are executed and responded back on the fog in near real time. However, in this paper, the cloud-fog-based system model is proposed for distributed clusters of residential buildings in different regions to process their requests. The performances of the fogs are enhanced with a proposed New Service Broker Policy (NSBP) and a load request balancer. MGs are placed near each fog, which controls maintenance or recurring cost. The sum of Virtual Machines (VMs) cost, Data Transfer (DT) cost and recurring cost of MG comprise the system cost, which is added in the consumer bill.
1.1. Motivation
The MGs with RESs and storage systems on the demand side provide cheap and uninterrupted power supply. Multiple small MGs are joined, or a large-size MG is developed to meet the multiple SHs and communal energy demands. The cost of energy consumption is also optimized to use the cheap energy of MGs during peak hours [10,11,12,13]. In the proposed system model, RES and energy storage-based MGs are placed for each cluster of residential buildings. Similarly, the huge requests generated from residential buildings need to be processed. The cloud provides ideal computing resources for such a huge number of requests. However, network latency, data computation, and communication cost is challenging [8]. Fog computing provides cost-efficient and near-real-time services. It offloads the cloud computing services; however, it does not replace the cloud. Fog computing has limited resources as compared to cloud computing [14]. This is suitable for real-time applications with low traffic congestion, minimum bandwidth, and low energy consumption. The characteristics of cloud and fog encourage the proposed cloud-fog-based system model. Moreover, efficient resource use enhances computational performance. The load of requests on the VMs is balanced with Particle Swarm Optimization (PSO) in [15] for efficient resource use to enhance the performance of the fog. In PSO, in local solution, the particles are not fully connected; rather, each particle is connected to their neighboring particles. In a global solution, the particles are fully connected, and the swarm is controlled by the best particle. This makes the PSO inefficient for a global solution; however, local search time is reduced by increasing the inertia weight [16]. On the other hand, Simulated Annealing (SA) is inspired from the natural process of annealing in metallurgy in which after a long cooling period the system always converges to global optima [17]. Hence, PSO suffers from the instability of particles during global convergence and SA jumps to the convergence of global optima. The challenge is to join the local optima of PSO and global optima of SA for efficient load balancing on VMs of fog data centers.
1.2. Problem Statement
In SG, Demand-Side Management (DSM) reduces the consumption cost on the demand side and reduces production loads on the supply side. Researchers have proposed many DSM models, infrastructures, and platforms to optimize power demands. In distributed demand response, the supply side broadcasts the information e.g., current load, tariff. Individual consumers optimize energy consumption [18]. However, error messages on the communication network and locally solving the optimization are challenges for efficient power management. The authors of [19] propose a cloud-based centralized DSM. To overcome the delay issues of the cloud, the authors introduced a two-tier cloud-based model: edge cloud, near the end users, and centralized cloud, for all edge clouds. Inefficient resource use of cloud computing exacerbates the delay issue. The authors in [20] propose he efficient resource allocation algorithms to enhance the performance of cloud computing for DSM. Load traffic on cloud-based DSM and network delay are the challenge for DSM in SG [19,21,22]. To overcome the delay issues, the authors of [23] propose a fog-based architecture for DSM. The fog has limited resources compared to the cloud; however, the fog is close to the end devices. A bottleneck is created for fog computing due to a huge load of requests that compromise the performance of fog computing. Routing of the demand-side request traffic at the appropriate data center and allocation of requests on fog-computing resources for enhanced performance are challenging.
1.3. Contributions
In this paper, cloud-fog-based SG is proposed for enhancing services. Six regions with six clusters of residential buildings are considered. The clusters share the requests with the fogs to process and respond back in near real time. The fogs are connected to the cloud to permanently store their data. The cloud is connected to the utility and it also broadcasts the utility tariff to the fogs. The MGs are placed near the fogs to provide cheap and undisrupted power supply to the buildings. The MGs have fixed capital and maintenance or recurring cost [24]. The cost depends on the size and types of energy sources. In this paper, RESs and energy storage system-based MGs are proposed. The sizes of MGs are defined according to demands from the clusters. The maintenance cost of an MG is also called a recurring cost, which is proportional to the size of it. This paper is an extension of [25] and the contributions of this research are as follows:
- A three-layered model—core or cloud, fog or middle-ware, and end-user layers—is proposed.
- Hybrid of PSO and SA: PSO-SA is proposed for efficient load request allocation to VMs in the fog data center.
- A service broker policy, hybrid of Optimized Response Time (ORT) and Service Proximity (SP) is proposed for the selection of potential data center. The requests traffic is routed on the selected data center.
- Fog layer is introduced between cloud and end users for near-real-time processing and respond back to the end user.
- The recurring cost of MGs and computational cost on fog form the system cost. The system cost is a recurring cost which is added to the consumer bill.
- The proposed PSO-SA and the new service broker policy outperforms the state-of-the-art service broker policies and load-balancing algorithms.
1.4. Organization
2. Literature Review
The end users in SG are educated to optimize their load consumption; however, for the last few years, insightful researchers have proposed autonomous DSM programs [26]. The purpose of the DSM is to autonomously optimize the load consumption on the demand side. In [27], authors propose a cloud-based EV charging and discharging system for SG. A priority assignment algorithm optimizes and reduces the waiting time for EVs on public supply stations. The proposed system manages SG operations and maintains the communication between the cloud and the SG. The simulation results validate the usefulness of the proposed approach for the charging of EV even during peak hours, which improves the SG stability.
Moghaddam et al. [28] propose the stochastic model for consumers to schedule the energy load of appliances using the cloud-based DSM for SG. The model creates small energy hubs for users and shifts the load from peak to off-peak hours using the Monte Carlo method. The proposed model reduces the peak to average ratio and the cost. However, authors of [19] analyze the Distributed Demand Response (DDR) and Cloud-based Demand Response (CDR). The comparative analysis of simulation results shows that CDR performs better than DDR with scalability, reliability of power and a stable communication network. Unlike CDR, the DDR has unreliable channels which are prone to lose messages. Hence, CDR has improved performance with cost efficiency. The simulation results show that proposed CDR reduces more cost and PAR compare to DDR.
Home appliances are categorized to form subsystems by connecting with the controllers. The controllers and remaining appliances are connected to the Smart Meter (SM). The SM communicates with the fog for controlling and scheduling the load of appliances. The authors of [23] propose hardware and software architectures for fog computing. The fog provides services for energy management for SHs. The fog-based energy-management service reduces the cost, RT and PT compared to the cloud. Similarly, in [29], cloud-based Cyber-Physical System (CPS) for energy efficiency in smartphones is proposed. An energy-aware dynamic task scheduling algorithm is proposed to aggressively reduce the energy consumption in smart phones. However, latency issues of the cloud compromise the performance, which is difficult to resolve.
A cloud-based cost-oriented model for Direct Current (DC) nano-grid for next-generation smart cities is proposed in [30]. Low-voltage smart appliances are controlled for energy and cost efficiency using cloud-based energy management. The model is proposed with the uninterrupted power supply to reduce maximum cost. For experimental analysis, a group of buildings from the smart city is taken, which are controlled by generating alerts from the data centers on high power consumption. These data centers are connected with a centralized cloud infrastructure to control the energy consumption of smart city buildings. The simulation results show that the proposed scheme has high satisfaction ratio, cured delay and reduced demand supply gap.
Energy management on the fog for SHs is a novel approach to optimize energy consumption with direct or indirect autonomous control. In [31], energy management as a service over a fog-computing platform is proposed. Home appliances are categorized into subgroups. Software and hardware architecture for SH energy control and fog-computing resources are proposed. Fog computing provides flexibility, data privacy, interoperability, and real-time energy management. Two prototypes are implemented to validate the reduction of implementation cost and time to market.
The authors in [20] propose the analysis for new trends in next-generation cloud computing. The cloud infrastructure is modified into multi-tier architecture and applications are also modified accordingly. Multiple infrastructure providers and distributed computing have resulted in new cloud infrastructure. The authors analyze that emerging cloud architecture will improve the connection between people and devices. It will provide a self-learned cloud-based system.
The authors in [32], propose a model of bi-level optimization to schedule power consumption of local appliances and amount of power production. Adequate constraints on optimization vectors reduce the cost of power generation in the local grid. Using cloud computing, it is possible to design and implement an optimized DSM program for utilities and consumers. In [33], authors propose an efficient energy-management scheme for SG based on CPS. Smart devices are located on the physical plane and the controller on the cyber plane. The Nash equilibrium approach is used to analyze the performance of the proposed coalition. The proposed scheme provides cost-efficient energy management solutions during peak hours.
The authors in [34] propose energy-aware fog-based load balancing on equipment in a smart factory. An improved PSO algorithm is proposed for an efficient energy-consumption model. The distributed scheduling of manufacturing clusters is resolved with a proposed multi-agent system. Similarly, to improve the performance of cloud and fog computing, a variety of heuristic and meta-heuristic techniques are implemented and have been proposed. In [35,36,37], heuristic-based load-balancing schemes are proposed for fog-computing resources. Fogs are preferred for real-time applications and their efficient performances are important to consider. Hence, maximum use of resources improves the performance as well as reduces the computing cost.
The aforementioned literature advocates the importance and benefits of cloud- and fog-based SG. However, issues such as latency of the cloud-based system are incurable. However, fog computing offers a wide horizon to ensure scalability, security, and low latency in energy-management strategies. In this paper, three scenarios for efficient fog computing with proposed PSO-SA for load balancing of requests on VMs and hybrid service broker policy are implemented.
3. System Model
In this paper, a three-layer system model is proposed as shown in Figure 1. The clusters of residential buildings exist at the end-user layer. The cluster generates several requests for their energy consumption. Each cluster is attached with a fog in the middle-ware layer. The fog receives the requests from the cluster for processing. MG with RESs and storage system is placed near each fog. The service broker policy routes the traffic of requests in the potential fog server or data center. The load-balancing algorithm efficiently allocates the requests on VMs in the data center. The recurring cost of MGs and computational cost of the fogs form the system cost and is added in consumer energy-consumption bills. The fogs are connected with the core or cloud layer, where necessary data from the fogs are sent for permanent storage. The cloud also broadcasts the utility tariff to the fogs.
In the system model, each region has a N number of clusters of residential buildings. Each cluster has n buildings, } and each building has m SHs, . It is assumed that the production and current status of MGs are shared with the fog. The fogs have utility tariff and information of MGs to process energy demand requests. In this paper, Photovoltaic (PV), Wind Turbine (WT) and Fuel Cell (FC) are assumed for energy-producing sources and battery storage systems are used to store the energy in MGs. It is assumed that fog servers or data centers are placed near end users to reduce the end-to-end latency. Moreover, when huge request congestion is created on fogs then the requests are routed on the cloud for processing. The communication between end devices and the fogs take place using wireless communication media such as Wi-Fi, Z-Wave or ZigBee.
The end devices (for instance SMs) generate requests and send to the fogs for processing. Each request contains information of previous load consumption, current load demand, the source of energy (utility or MG), cost and time (for request generation which is sent to the fog and receive back). The request can have other information such as number of appliances, power ratings of appliances, the current cost for consumed energy, etc. depending on the consumer services and facilities from the fogs. Every cluster generates a huge number of requests and sends to the fog for processing. Optimization of resource use is performed on the fog. Two necessary and effective steps are: (i) selection of efficient server or data center where traffic of requests is routed for processing; and (ii) balanced load request allocation of routed requests on the VMs in the server. The necessary information of these requests is sent to the cloud and for usage in permanent storage for future statistics and projects. The fogs also contain the information of MGs (production, capacity, the rate of energy flow out, etc.). When a MG has insufficient power to fulfill the demand then fog requests the cloud to facilitate energy consumer.
In the end user layer, the SMs of SHs in residential buildings have information of smart appliances. The set of smart appliances, in a SH are connected with the SM. The SMs share the request with the fog and the request carries the information of and ownership of SH. Hence, information of each appliance and biodata of the consumer are sensitive and called private data of the SH. However, it is assumed that the total power consumption of a SH is shareable and called public data. The SMs categorize the energy data of each SH into private and public.
- Private data is usually never shared; however, the companies use this information for their statistics and analysis for future or for upgrading the existing system. Such sensitive data can be compromised in the cloud-based system. In the fog-based system, the information is local, and it is less likely to be compromised.
- Public data refers to total energy consumption from a building, power generation of each MG and utility tariff. This information does not contain sensitive data and there is no harm in sharing.
The fog in the fog layer receives requests for energy demand from the cluster of residential buildings and the current status of the MG. On the basis of this information, the fog decides whether energy is supplied from the MG or the utility. The cluster does not directly communicate with the MG and utility. Similarly, in the case of utility, the fog requests the cloud which facilitates the energy demand request from the utility.
3.1. Problem Formulation
Effective task scheduling can be done in such a way that the upcoming requests from end users get minimum execution time. Let ‘x’ be the number of requests received by task handler with task length . The set of independent tasks is represented by . Every independent task is assigned to a VM with processor speed , bandwidth , memory and the number of CPU . Let, is the set of y VMs in the fog. The VMs execute the x tasks in parallel. Each VM runs on its own resources and processes the tasks independently.
The maximum completion time required for a task is the makespan of the task. The objective of load requests balancing is to mitigate the makespan and RT. The makespan of r task on is denoted by . The makespan for r on is elaborated using the following Equation (1):
where and . Mapping of the task to y VMs affects performance parameters. Now, the total tasks assigned to each VM are dependent on the set of end user requests and in the performance of the load-balancing algorithm. The PT and RT of tasks are formulated using linear programming. The PT of the allocated task to s VM is and status of the task is . Total of x tasks allocate to y VMs and statuses :
The objective is to minimize PT,
where,
Now, RT is the total time taken from sender to data center, PT on data center (by VMs) and time to receive back from data center. It is computed with the help of an Equation (5),
where is used to represent the total RT of the VMs in the system and is the completion time of the tasks.
VM is installed on a physical machine in a data center, acquiring resources to process the tasks. There are two costs, fixed and recurring cost. The cost of the physical machine, maintenance, and installation is fixed cost. Recurring cost is associated with the use of resources of physical machine to meet user requirements. Optimized use of resources reduces the recurring cost. The concept of VM is madde to use physical resources with optimization. The fixed cost of a VM can be calculated with Equation (6) when y number of VMs are installed on a physical machine,
where and are physical machine cost and maintenance cost. The recurring cost in this paper is calculated on the basis of number of requests arriving at the VM and the number of instruction executions per second by the VM. Length of a task elaborates the number of instructions ,
Cost of a VM is calculated by the number of instructions executed in a given time. Cost for a VM is defined by execution of a Million of Instructions Per Second (MIPS). Cost of VM for given task of length is,
where, is a cost c of VM for a task T of length L, is the cost of MIPS. The total cost of VM for all x tasks,
MG available next to fog in middle layer having power generations; from WT, , from PV, and from FC, with the costs of , and , respectively. Price per unit energy is defined according to all power generations and their respective costs. WT and PV are dependent upon the weather hence their power production is used with predictive nature of production. FC is used for backup to keep MG alive. The capacity of power generation of MG is,
Total cost of energy produced by MG is,
Cost of DT is the composite of interconnection and transit costs. Interconnection is a fixed cost used for connectivity with Internet Service Provider (ISP) cross-linking. Transit cost is a variable depending upon bits per second or bytes per second sent. Cost of DT is computed by transit rates or bandwidth.
The total cost of the system is calculated by accumulating VM cost, MG cost and DT cost. Therefore, the total cost of the system is given by Equation (12):
where , , and represents the total system cost, VM cost, MG cost and DT cost. The objective is to minimize , and .
3.2. Load-Balancing Algorithms
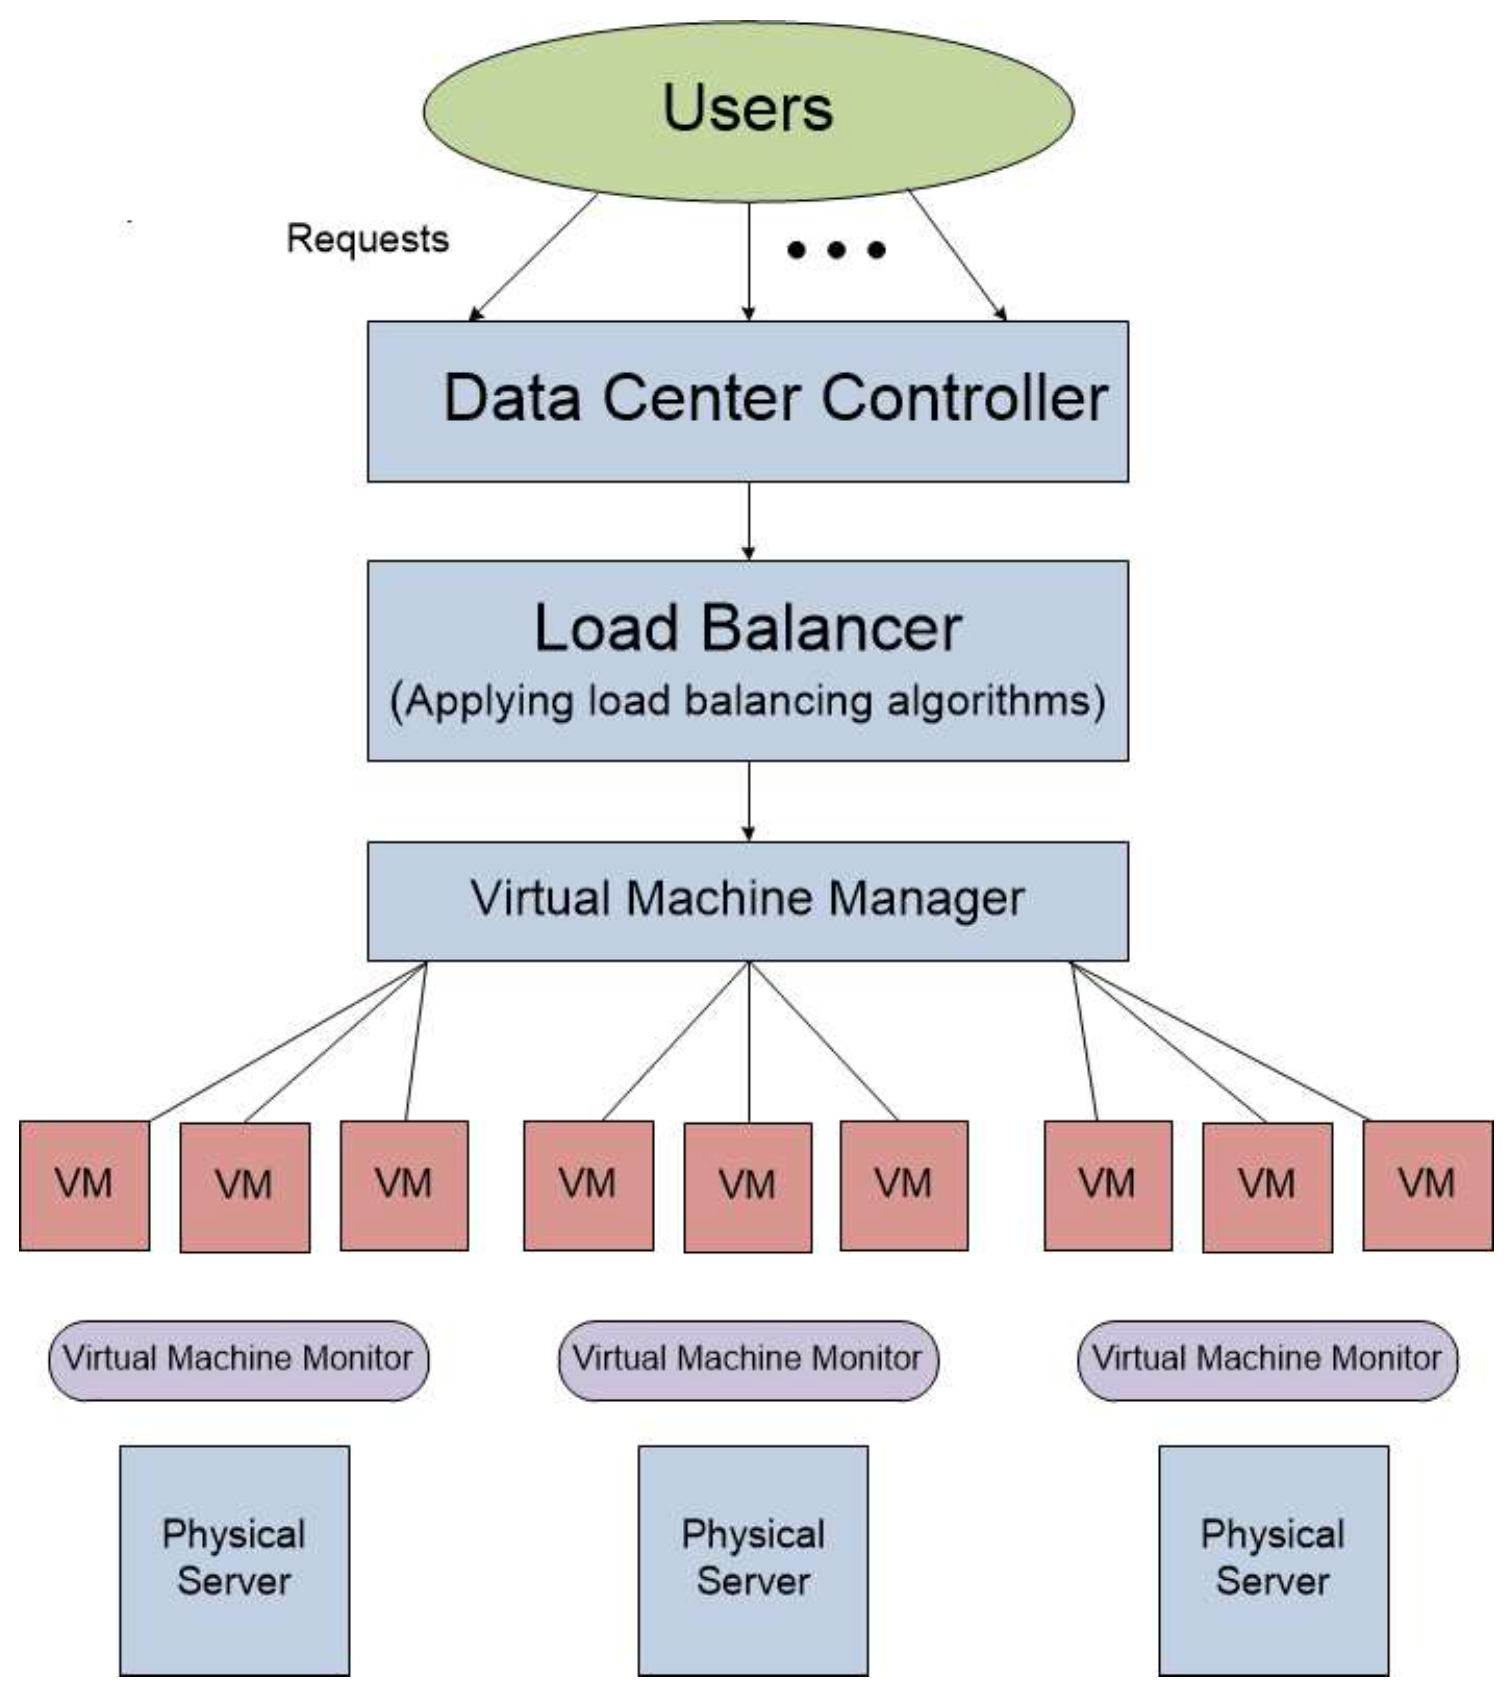
Efficient resource use enhances the performance of computing resource. The cloud and fog have huge resources to execute a huge number of requests. The resources are shared to enhance the performance. In this paper, resources of fog are shared by creating VMs. The requests are executed according to the performance of VMs; however, execution of the overall load of requests is optimized by the efficient allocation of the requests to the VMs. The performance of a data center is compromised when some VMs have overloaded requests and some have very few or sitting idle. To resolve this issue, load-balancing algorithms are used to allocate balanced load of requests on the VMs. The mechanism of load balancing is illustrated in Figure 2. From top to bottom, the end users generate requests which are sent to the fog data centers. The data center controller routes the requests on the potential server where the load balancer (load-balancing algorithm) efficiently allocates the load of requests on VMs. The VM manager furnishes the VMs for the load of requests to execute. The VMs are created on physical resources which are maintained by the VM monitor. However, collective performance of these VMs depends on the load of requests assigned to them. The PT, RT and the execution cost with proposed load-balancing algorithm PSO-SA are analyzed by comparing them to Round Robin (RR), throttled and PSO algorithms.
3.2.1. RR Algorithm
RR algorithm is based on equal time slicing. In this paper, the RR algorithm is used to allocate resources to each host by equal time slicing for utilization of resources. This algorithm is used to balance the load of requests on the VMs by assigning equal time slice. The basic steps are described in Algorithm 1.
| Algorithm 1 RR-based resource allocation. |
|
3.2.2. Throttled Algorithm
In the throttled algorithm, “throttledVMLoad” balancer maintains the table by indexing the all VMs which are available at the beginning and the load of requests. Data center controller receives new requests from end users. The requests query the controller where to be assigned. The algorithm assigns the requests to the VMs by identifying the tags assigned by the data center controller. If identical tags are found, then requests are considered for the next allocation after amending the tag information. The table is also updated according to the amendments. If there is no next request then balancing function returns “”. The basic steps of the Algorithm are explained in Algorithm 2.
| Algorithm 2 Throttled-based resource allocation. |
|
3.2.3. PSO Algorithm
PSO is inspired from the motion behavior of birds or fish to improve the candidate solution. The individual particle (animal) is not intelligent enough to solve a complex problem. The swarm intelligence (all the animals in search space) provides the efficient solution. Each particle is influenced by its neighbors and each particle updates itself with respect to its neighbor which make the whole swarm update. This leads the whole swarm to the best solution. The PSO algorithm uses the following steps to find the best solution.
- The particles (swarm) move in the search space according to some calculations or formulae.
- The movement is made with two constraints: locally best position and best position in whole swarm.
- Any update in a position will update the whole particle swarm, which makes the PSO inefficient for its global search.
The basic steps of the algorithm are given in Algorithm 3.
| Algorithm 3 PSO-based resource allocation. |
|
3.2.4. PSO-SA Algorithm
In the proposed algorithm, PSO is used to find local best position () and global best position () is found with SA. In PSO, the best solution is found by a sequential flow of information. The best solution sends information to nearby particles. In local search, partials are compared to their neighbors and provide efficient solution. However, in global search, all particles are compared with a single best solution which compromises the performance of PSO. On the other hand, the SA algorithm is inspired by the natural process of metallurgy. SA converges to global best search after a long cooling process. Hence, during heating and a long cooling process, the performance of suffers. The hybridization of of PSO and of SA provides efficient solutions. The basic steps of the proposed hybrid PSO-SA are illustrated in Algorithm 4.
3.3. Proposed Service Broker Policy
The service broker policy selects the data center where requests are routed for processing. The requests from the end-user layer are sent to the fog where service broker policy selects efficient data center (according to the policy algorithm) [38]. The requests query the service broker for the destination. In this paper, a hybrid of ORT and SP is proposed for selection of an efficient data center. In both service broker policies index tables are maintained for available data centers. In the table of SP, the table is indexed according to the nearest data centers. The regions are ordered in the list by the sender region and region queried. The remaining are order in lowest latency first. The earliest data center (lowest latency) is picked from the list. If there are more than one data centers, then a random data center is selected. However, the table of ORT is indexed according to RT from the data centers using the Internet characteristics. The requests query the closest destination (according to latency) and at selected using the service broker algorithm. The best RT is found by iterating through each data center due to:
- Last performed task using Internet characteristics.
- If time is recorded before the threshold time, then PT is appended . It defines the idle state of the data center.
- If closest data center does not have estimated smallest RT then on 50:50 chance either of them is selected.
In proposed hybrid service broker policy, following points followed:
- A table is maintained with index of all available data centers.
- The requests query the data center controller about the destination.
- The sender region and queries for the regions are enlisted using SP broker.
- The network delay from the regions are enlisted from the Internet characteristics and by querying the last recorded PT (using ORT step).
- The network delay for other regions from the given region also enlisted (using SP step).
- The CDC with minimum RT is selected; otherwise, data center with least RT is selected (using ORT and SP steps).
| Algorithm 4 PSO-SA-based resource allocation. |
|
4. Simulation Results and Discussion
In this paper, extensive simulations are performed for the NSBP and load-balancing algorithm. Three scenarios are implemented to analyze the performance of proposed techniques. The RT, PT and cost are analyzed using CDC, ORT and proposed NSBP to route the requests on the potential data center. The requests in data centers are allocated on VMs using RR, PSO and proposed PSO-SA. The simulations are performed for 24 h (a day) using the tool. The load and size of requests from the consumers, number, and size of VMs, hardware and virtual specifications of fog computing are initialized according to [39,40].
4.1. Scenario 1: 25 VMs and Residential Buildings
In this scenario, three residential buildings from three clusters in three regions are considered. Each building has 100 SHs which generate requests every hour to process on the fog in the region. Each cluster is also connected with MGs for uninterrupted and cheap power supply. The requests are routed on potential data center using ORT. The balanced load of requests is allocated to VMs using RR, throttled, PSO and proposed PSO-SA. Simulations are performed with each algorithm separately to analyze the performances of RT, PT, and the cost. Each fog data center in the region has 25 VMs. The data for users for peak and off-peak hours is taken from [41]. The simulation results for RT are discussed in the following subsection.
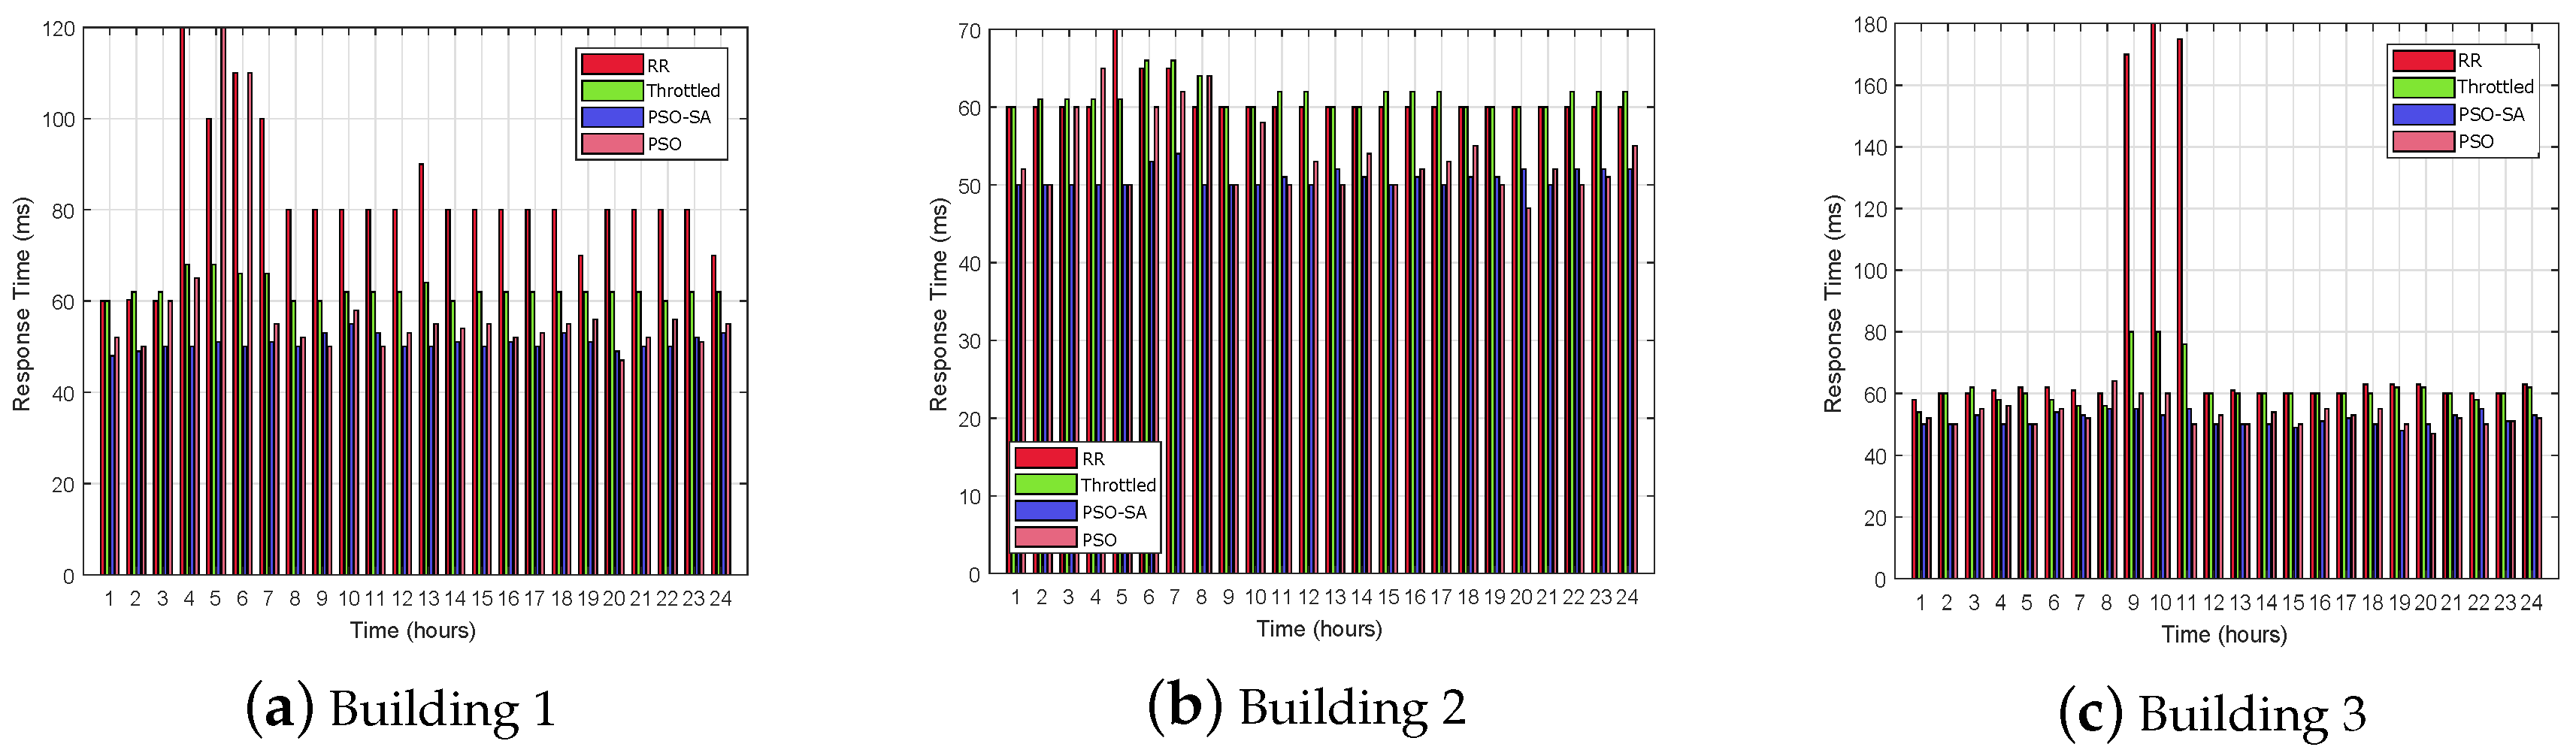
4.1.1. RT for Residential Buildings
The buildings generate different number of requests which are sent to the fog. The request traffic is routed on the data centers using ORT. ORT reduces the RT and increases the system performance for end users (SHs in the buildings). Four scheduling algorithms; RR, throttled, PSO and PSO-SA are used to allocate load of requests on the VMs in the data centers. Efficient allocation enhances the performance for PT. Therefore, SBP and load-balancing algorithm enhance the system performance and reduce the computational cost. The fog has limited resources and its performance is compromised due to traffic congestion and load of requests. The RT is compromised during peak hours when end users generate huge numbers of requests for the fogs to process. The Figure 3 illustrates the RT for three buildings in three regions for a day. Every building belongs to a different region and residents of each region have different power consumption behavior. Hence, each building generates a different number of requests which are processed on the fog. The least number of requests are generated by -2 and the most requests are generated by -1. In -1 and -3, the RR has the highest RT. The proposed PSO-SA has the least RT. Meanwhile, throttled has higher RT than PSO. In -3 during hours 2, 12, 14, 15, 16, 17 and 21, the RT using RR and throttled are almost same and the number of requests during this time are few. Similarly, in -2, the number of requests is less than -1 and -3. RT using RR is smaller or equivalent to throttled. Similarly, PSO-SA also performs better with fewer number of requests. The simulations validate the inefficiency of RR, throttled and PSO with high load of requests while proposed PSO-SA is the efficient. The PSO-SA has the least average RT and RR has the highest RT. The PSO has 64.04 ms, throttled has 75.11 ms, RR has 83.00 ms and PSO-SA has 60.77 ms average RT as given in Table 1.
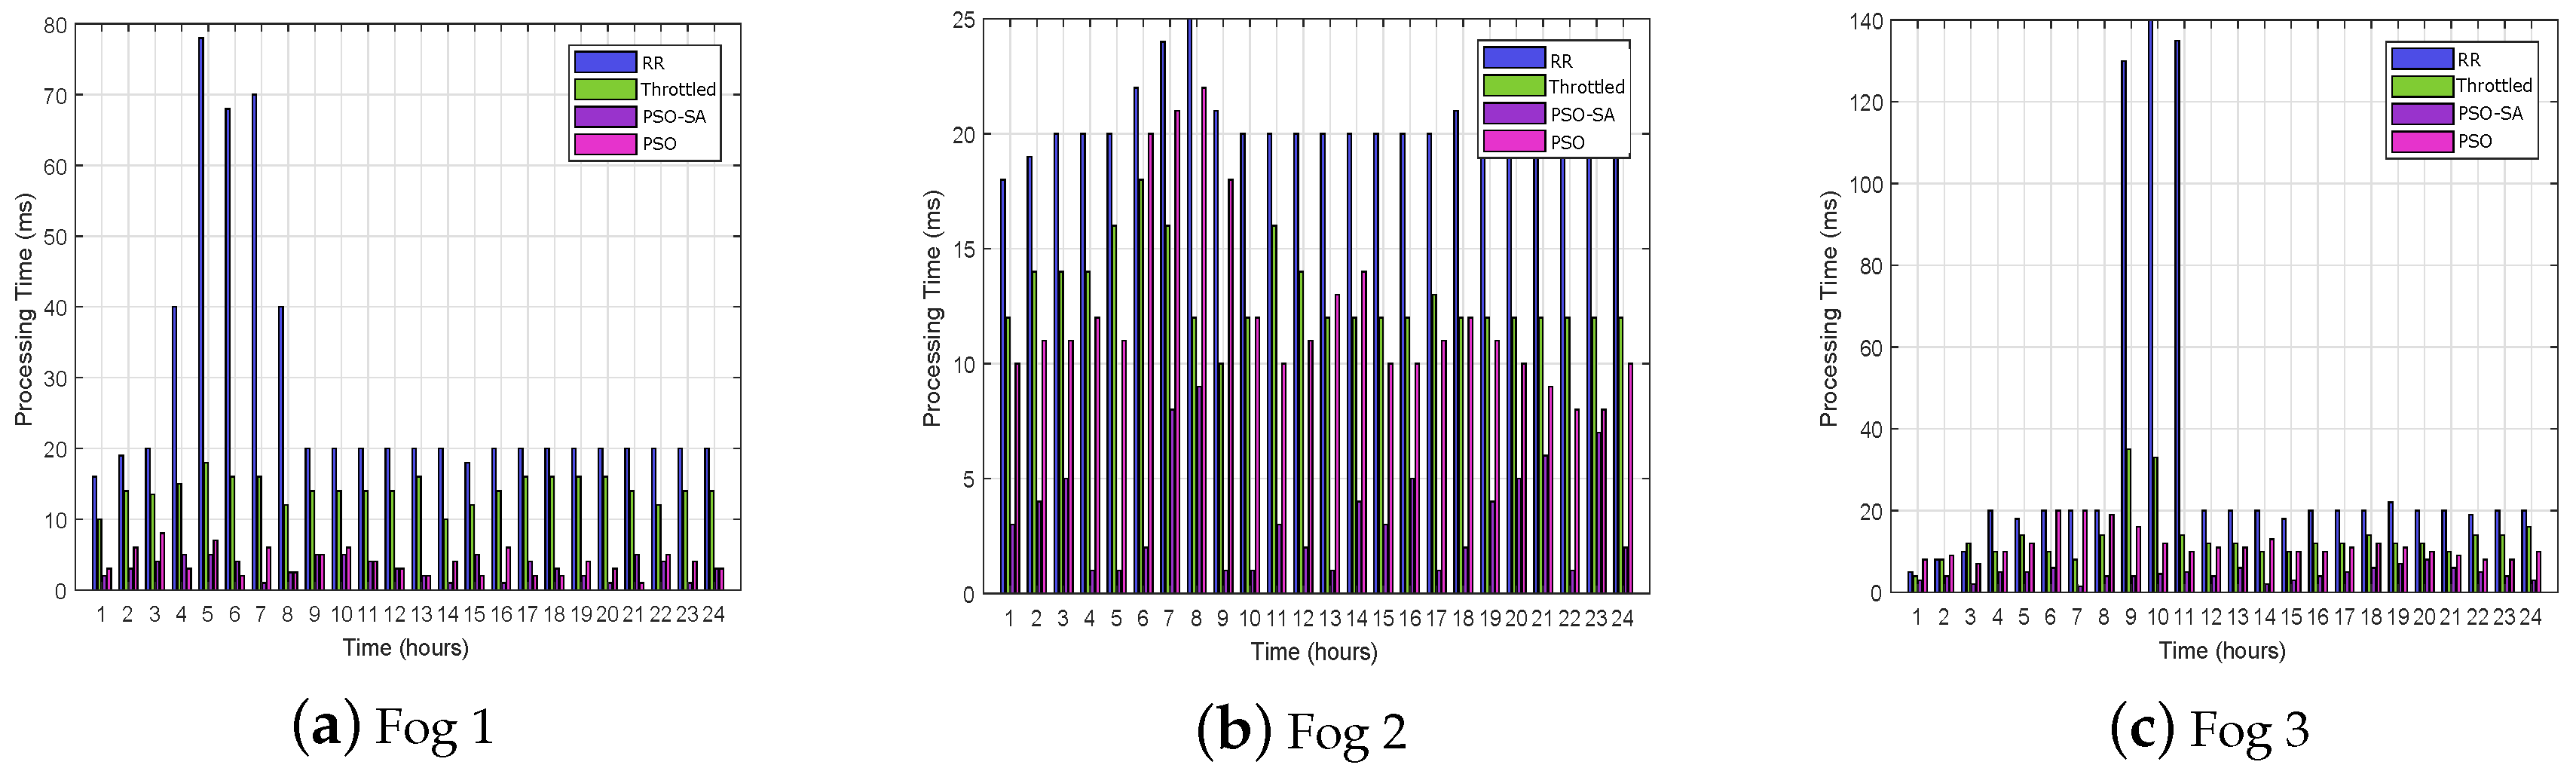
4.1.2. PT of Requests
The RT is affected by network latency and the PT. If the average PT of PSO-SA is efficient then RR, PSO are throttled; however, PSO-SA is the most efficient as given in Table 2. The requests from all (three) buildings in respective regions are sent to the fogs for processing. As discussed earlier, the most requests are generated by -1 and -3 and sent to -1 and -3, respectively. In the Figure 4, the PT efficiency on the fogs with RR, throttled and PSO are compromised; however, PSO and PSO-SA have lesser PT. In -2 there is a lesser number of requests as compared to -1 and -2 to process. The PT of PSO is more compromising than PSO-SA in -2. These hourly performances for PT in -2 show that proposed PSO-SA is most efficient. The performance of RR is compromised when sizes and number of requests are big. Because, partially executed requests sit in wait for their next turn. However, PSO-SA performs efficiently for any number of requests due to efficient local and global solutions.
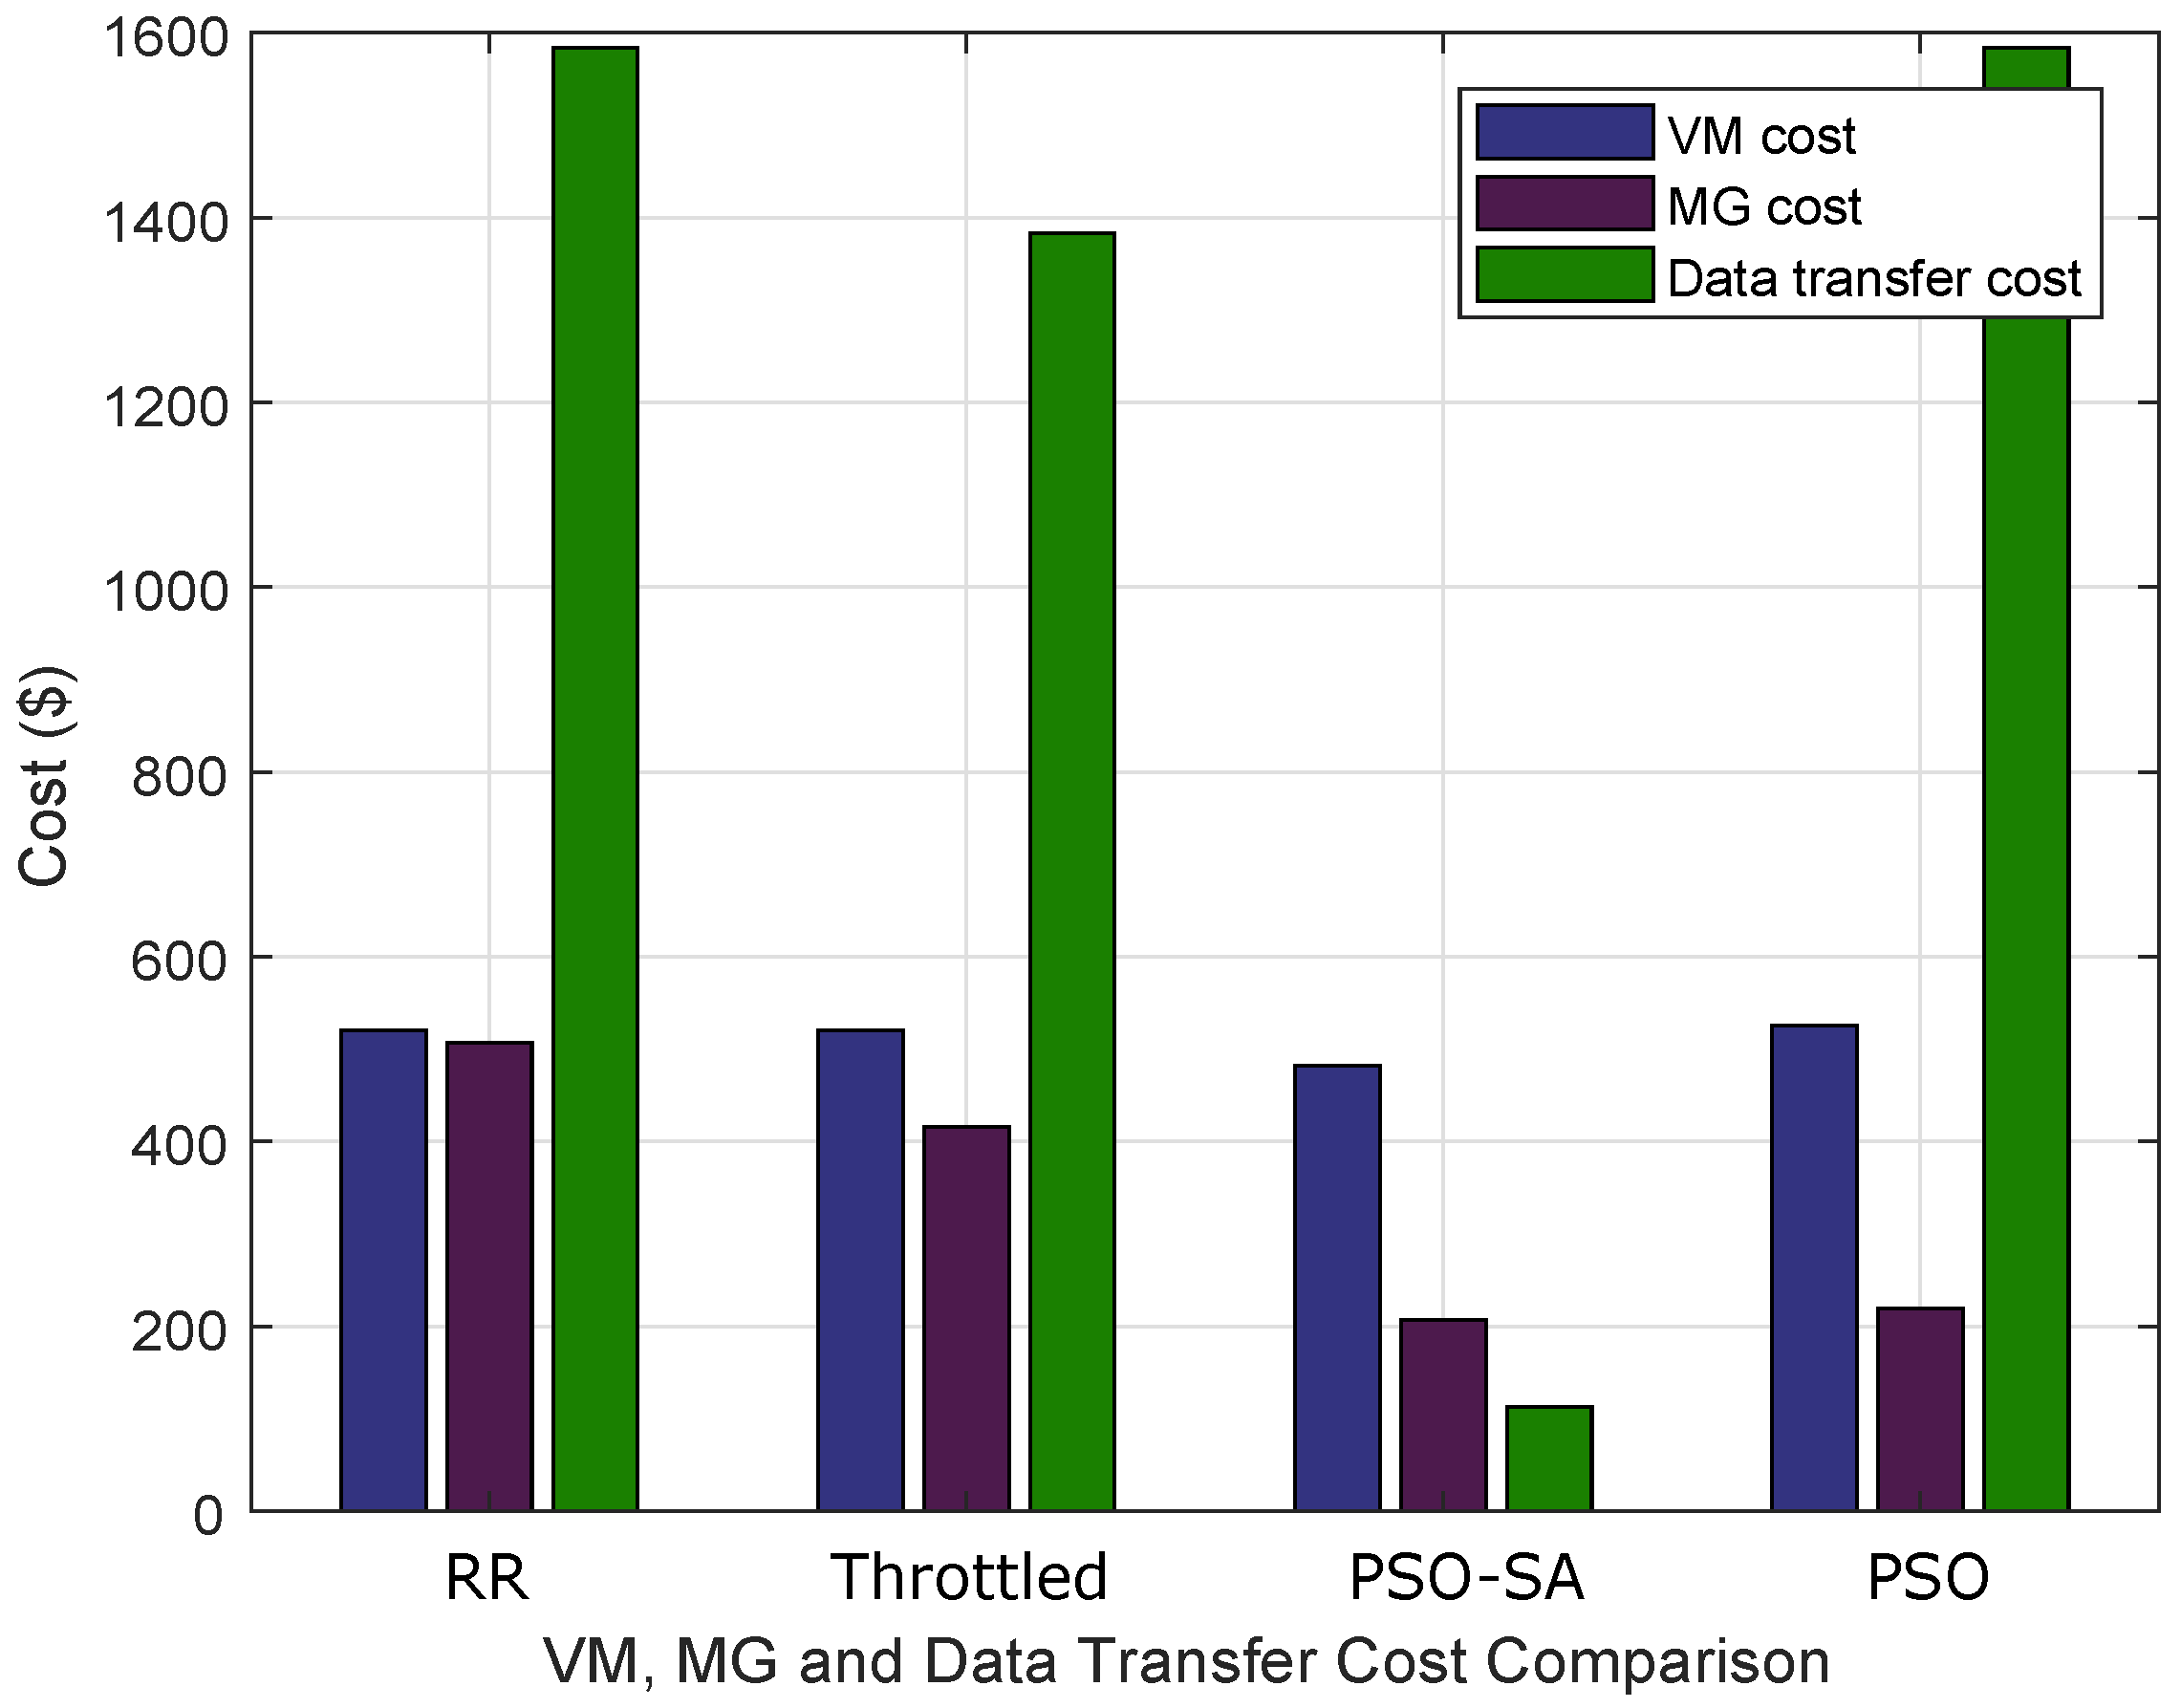
4.1.3. The Cost Analysis
The cost of DT, VM and recurring of MG make the system cost. The recurring cost of MG depends on the load of demand requests which are generated from the clusters of residential buildings. The efficient RT and PT also affect the MG cost. The system or total cost using ORT as SBP with load-balancing algorithms; RR, throttled, PSO and PSO-SA are shown in Figure 5. The total DT cost with PSO and RR is the highest due to waiting of most of the partially executed requests in VM where the probabilistic behavior of PSO is. The DT cost for throttled is more efficient than PSO and RR; however, it is less efficient than PSO-SA. Throttled depends on fixed hardware and VMs specification. It follows fixed rules without performing too much evaluation. This increases the throttled-based DT cost. The PSO-SA has the efficient cost for DT due to the efficiency of local and global solution. The MGs cost has very small variations among the load-balancing algorithms. The recurring cost of MGs depends on number of requests generated from the residential buildings; however, delayed responses from the fog affect the cost. In the Figure 5, PSO-SA has the least MG cost. The load requests are balanced on VMs in the data center. The PSO-SA balances the load requests most efficiently and has the most optimized VM cost.
4.2. Scenario 2: 50 VMs and Cluster of Buildings
In this scenario, five regions with clusters of residential buildings are considered. Each cluster is connected with the regional fog. There are five buildings in each cluster and each building has 100 SHs. The requests are generated from the clusters and are sent to the fog for processing. Each fog data center has 50 VMs. Three SBP; CDC, ORT, and proposed hybrid NSBP are implemented with RR, throttled, PSO and PSO-SA load-balancing algorithms.
4.2.1. Average RT of Requests
The clusters of residential buildings generate requests which are sent to the fogs every hour. The huge number of requests are processed efficiently and respond back to the clusters. The RT is the sum of network delay and PT. The RT is affected by the efficiency of PT. The selection of potential data center and balanced load allocation on VMs enhance the PT efficiency. In this scenario, three SBPs; CDC, ORT and NSBP are used to route the requests traffic on the potential data center. The routed requests in the data center are allocated to VMs for efficient processing. The load requests are balanced on available VMs such that no VM is overloaded or under-loaded. Four load-balancing algorithms are implemented along each SBP. In Table 3, the is the column for SBPs. The column shows the load-balancing techniques used in this scenario and rest of the columns illustrate the RT (in millisecond (ms)) for five clusters ().
In CDC, the closest data center is selected to route the requests traffic on it. In this policy, data centers are enlisted in ascending order. The network delays (from the Internet characteristics) of all data centers are compared with the closest one and enlisted. The requests are routed by selecting the data center from the top (with least network delay) in the list. However, ORT maintains the list according to RT by sending ping messages from user-layer to data center. The Internet characteristics are used for the list. The NSBP use the ORT and SP for efficient and potential data center selection. The SP uses network latency, bandwidth, request size and starts enlisting the CDC first. The ORT and SP select the potential data center for optimized processing and the response.
In the Table 3, the average RT using ORT with RR is efficient as compared to CDC for all residential clusters of buildings. However, CDC with throttled is more efficient than ORT. Hence, this advocate the efficiency of load-balancing algorithm along with the SBP. The average RT with PSO has the highest value using CDC, ORT and proposed NSBP. The evaluation complexity of PSO is higher than mentioned algorithms. The efficiency of average RT using ORT with PSO is better than CDC. The selection of efficient data center and efficient load requests allocation on VMs optimize the RT. The performance of RR is compromised when incomplete processed requests sit to wait for next execution. The throttled is efficient as compared to RR due to fixed number of VMs. However, the performance of throttled is compromised if load balancer finds no VMs and requests are kept in queue for waiting. The performance of PSO is compromised due to the time complexity of global problem solution. The space and time complexity of PSO is higher than RR and throttled. However, the global searching part of PSO is altered with the global solution portion of SA. The efficiency of PSO with SA is enhanced and it optimizes the average RT.
4.2.2. Average PT of Requests
The processing efficiency of a computing machine depends on factors such as load of requests, hardware and software specifications, communication among the components and optimized resource use. In the fog, the load of requests on data centers are routed by the SBP. The high load of requests on the system compromise the performance.
Hence, the potential data center selection for the appropriate load requests along with efficient resource use enhance the PT. In the Table 4, CDC, ORT and NDSP route the requests on data centers where RR, throttled, PSO and PSO-SA allocate the requests to VMs for efficient processing. Each load-balancing algorithm is implemented with each SBP independently. The PT with RR using CDC and ORT is almost same due to same number of VMs on the hardware with similar specifications and similar load of requests. The throttled also has similar processing behavior; however, average PT with throttled using CDC for is more efficient than using ORT. The ORT routes more requests on the data center than CDC which compromise the PT using throttled on . The PT for PSO is the highest among mentioned algorithms; however, PT with PSO using ORT is efficient as compared to using CDC. The performances of PT for RR, throttled, PSO and proposed PSO-SA are more efficient using proposed NSBP than CDC and ORT. However, PSO-SA has optimized PT as compared to RR, throttled and PSO when they are implemented using CDC, ORT and NSBP, individually.
4.2.3. The Cost Analysis
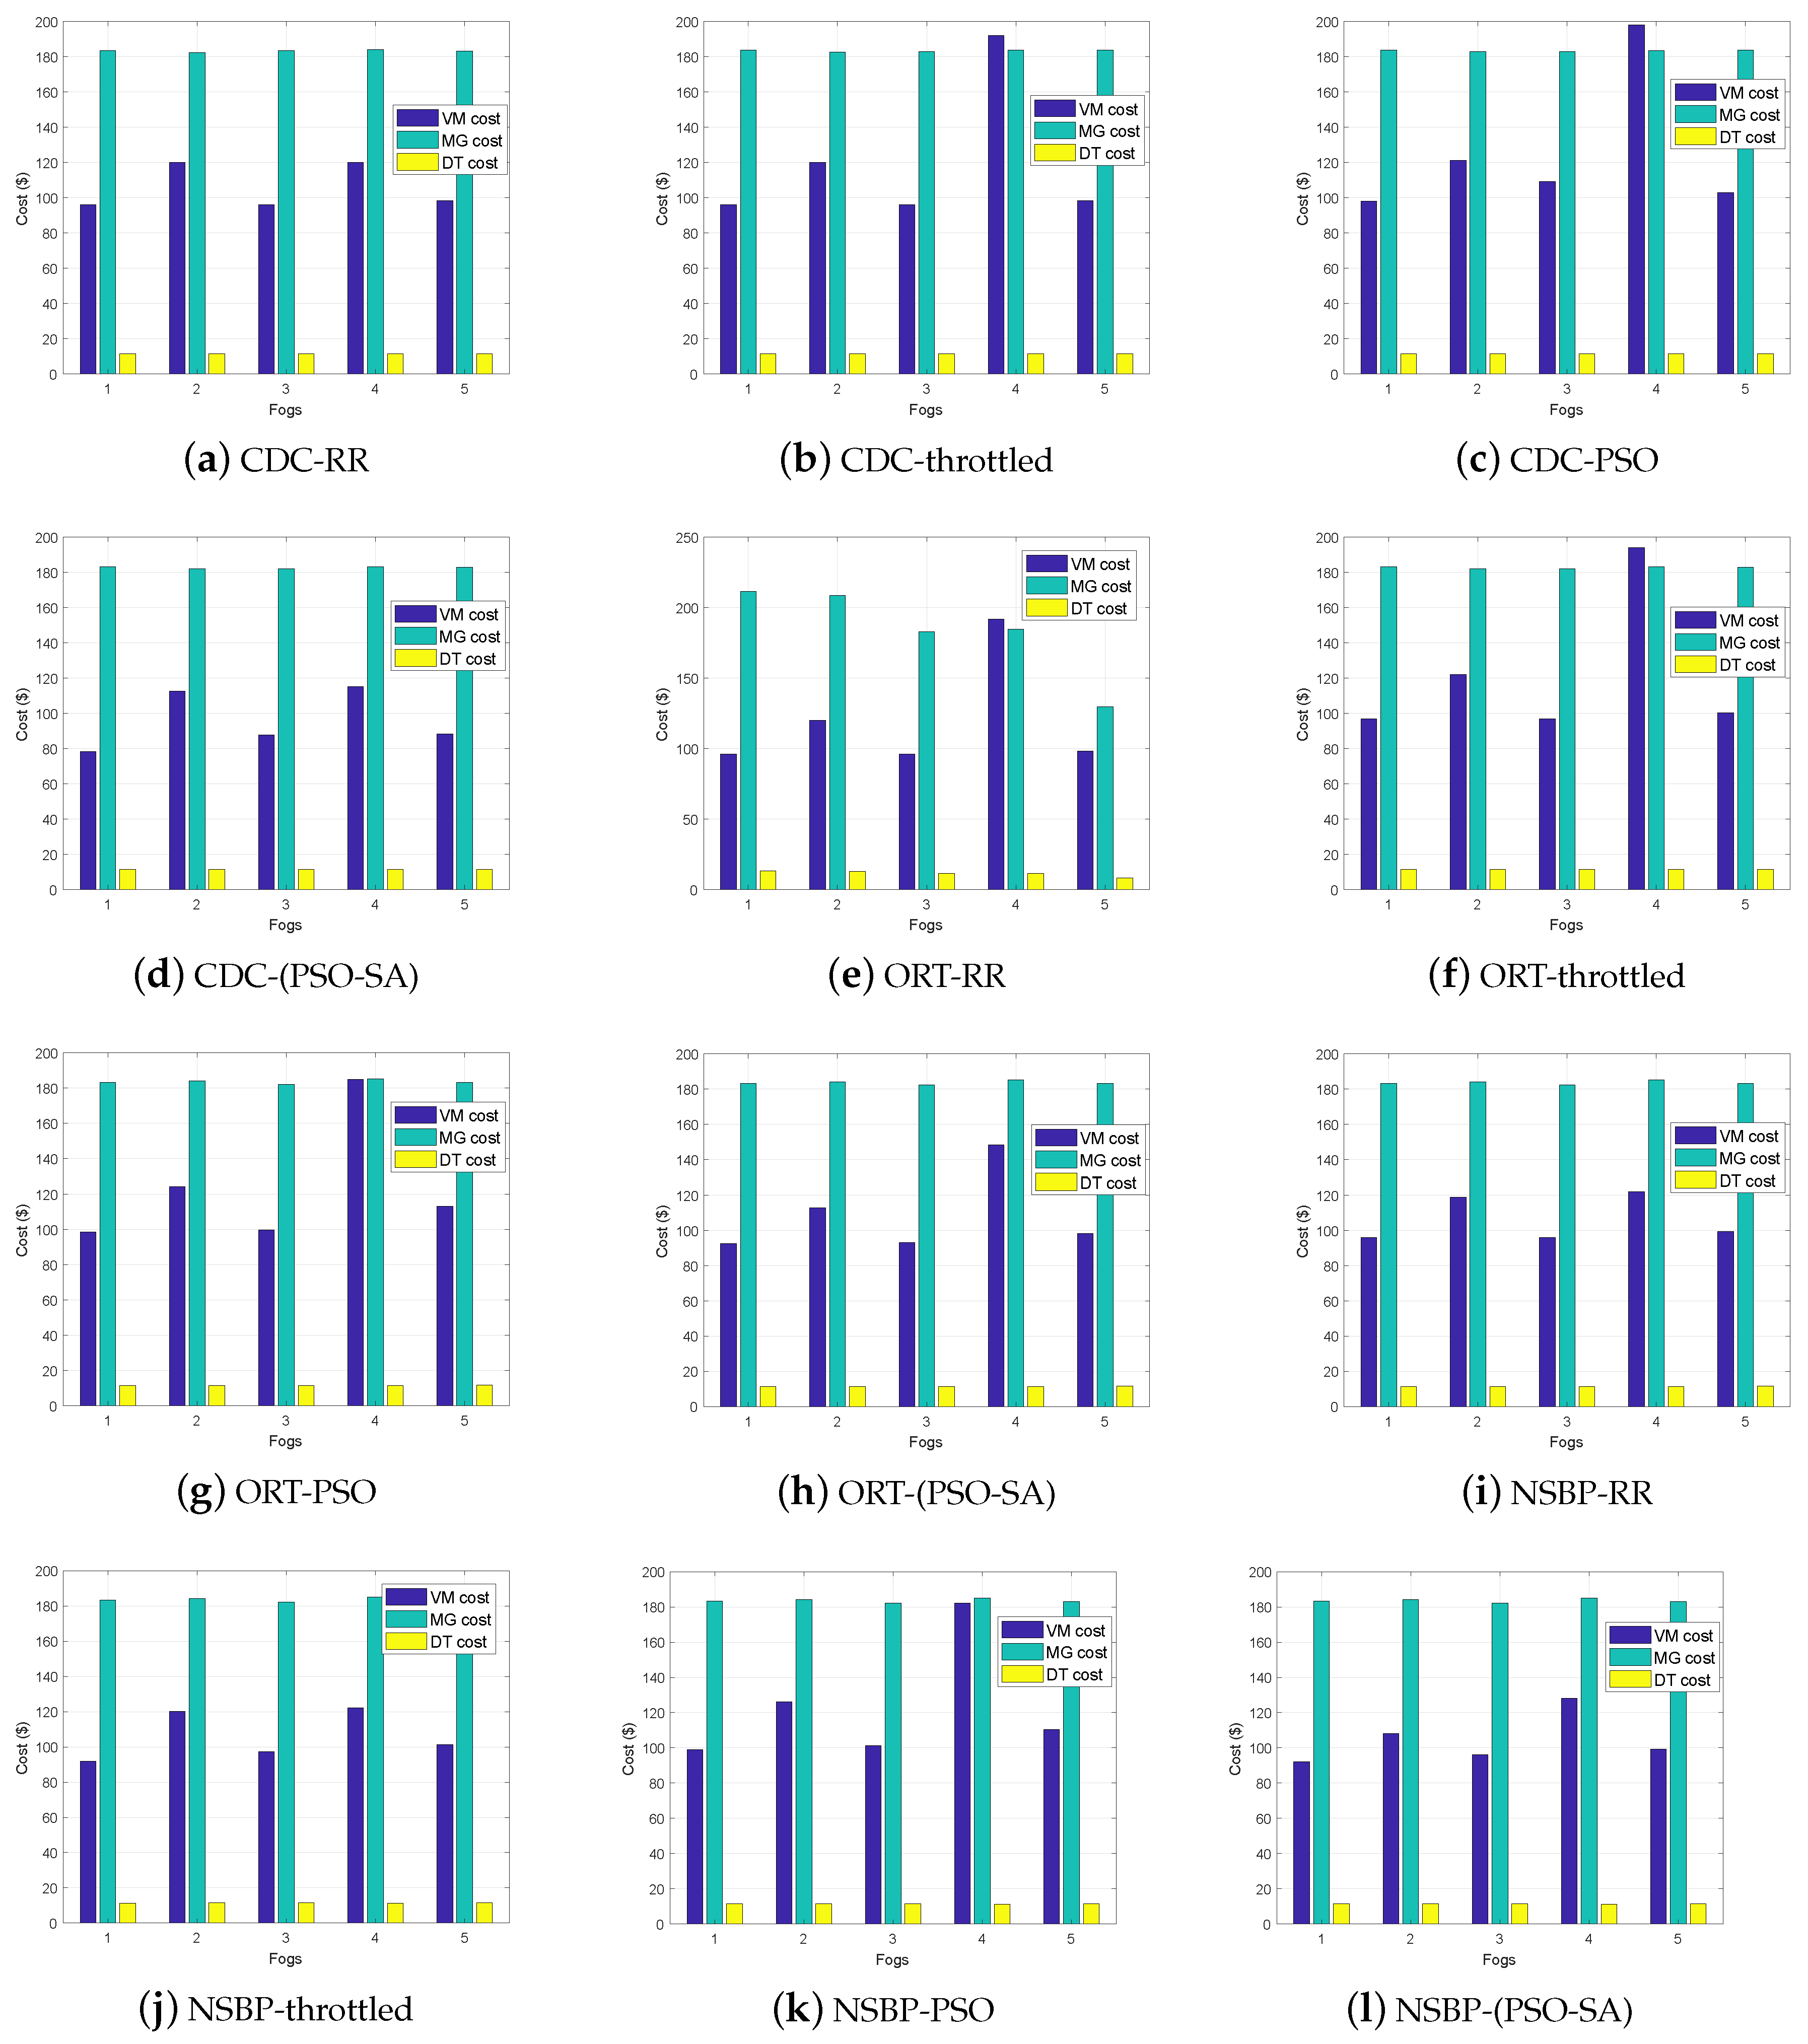
The performance of the load-balancing algorithm and SBP affects the cost. The cost of a VM depends on load requests, size of requests, size of VM and time to engage the resources. Longer occupancy of a resource compromises the system performance and increase the computational cost. Similarly, huge load requests compromise the performance and cost. The load-balancing algorithms optimize the resource allocation to enhance the performance and to reduce the cost. In Figure 6, cost for VMs, MGs and DT is shown. The recurring cost of a MG depends on the load of requests. In this paper, the number of SHs in cluster of residential buildings are same; hence, generate same load of requests. This makes the MG recurring cost almost same for the given regions. Similarly, DT cost is also almost same due to equal number of requests are generated. However, VMs cost for each fog is different from other due to the efficiency of load-balancing algorithms. In Figure 6a, the MG and DT cost are similar for all the fogs; however, VM cost is different. The VM cost for fog-1, fog-3 and fog-5 are close. The physical resources for the fogs are same; however, there are eight processors in fog-1 as compared to six, in fog-3 and fog-5. In the fog-3 data center, second physical unit has ten times more bandwidth compared to fog-1; however, there are half number of processors in first physical unit as compared to fog-1. These trade-offs of the resources make the VMs cost equivalent in fog-1 and fog-2. In fog-5 the second physical unit has hundred times lesser bandwidth as compared to fog-1 and fog-3. The lesser bandwidth creates bottleneck for load of requests. Hence, resources are occupied longer, and load requests sit in wait for longer. Hence, the VMs cost for fog-5 is higher as compared to fog-1 and fog-3. The cost for fog-2 and fog-4 are close due to same number of physical (three) units. However, third unit has double the storage and memory capacity as compared to rest of the units in both fogs. This increases the VM cost for fog-4. The more load requests on fog-4 can drastically increase the cost.
In fog-4, the throttled and PSO using CDC and ORT, respectively allocate more load of requests on VMs of third physical unit which aggressively increase the VM cost as shown in Figure 6b,c,f,g. The load requests are more uniformly routed on the potential data centers. The requests are allocated to VMs using CDC with RR and PSO-SA as well as using ORT with PSO-SA which keep the cost of fog-4 more optimized. The NSBP with RR, throttled, PSO and PSO-SA route the requests to the potential data center as well as efficiently allocate the load requests to the VMs. The cost of VMs are more optimized with NSBP than CDC and ORT. The VMs cost with PSO using CDC, ORT and NSBP are higher than RR, throttled and PSO-SA algorithm due to high time and space complexities. The performance of PSO is also more compromising then RR, throttled and PSO-SA as given in Table 3 and Table 4. The overall performance of a proposed load-balancing algorithm with NSBP is most efficient as shown in Table 3 and Table 4. This performance efficiency is also observed in the cost.
The VM cost in the sub-figures of Figure 6 show that fog-1, fog-3 and fog-5 have close cost using CDC, ORT and NSBP using RR, throttled, PSO and PSO-SA. The physical units for these fogs are same. However, VM cost for fog-5 is higher than fog-1 and fog-3 due to the hundred-fold lesser bandwidth in second hardware unit compared to first hardware unit of its own. The first hardware unit of fog-3 and both units of fog-1 have a thousand-fold lesser bandwidth than second unit of fog-3 which increase the VM cost for fog-3. The fog-4 in all the sub-figures has the highest cost due to large memory and storage size in third physical unit. The proposed NSBP with PSO-SA has the optimized VM cost for all fogs as shown in Figure 6l.
In a nutshell, the results show that RT depends on the PT. The PT depends on the efficiency of the load balancer, hardware, and virtual resources. The SBP also effects both RT and PT. The computing cost depends on the load of requests (or tasks), hardware and virtual resources. The optimized resources use is performed with SBPs and load balancers which optimize (reduce) the computing cost.
5. Conclusions
In this paper, a cloud-fog-based system model is proposed. Residential buildings form the clusters and each cluster has a fog to compute the energy requests generated from the buildings. MGs are placed with each fog for uninterrupted and cheap power supply to the clusters. MGs have RESs with storage systems. A MG has maintenance or recurring cost which depends on the size, types of sources and number of demand requests from the clusters. When a MG has insufficient energy to meet the demand then it requests the cloud to entertain the demand by requesting the utility. In this paper, requests from the clusters are sent to the fogs for processing. The RT and PT are optimized by SBP and request load balancing. A hybrid of SP and ORT SBP is proposed for selection of potential data center in the fog. A hybrid of PSO and SA is proposed for balancing load requests on VMs in the data center. Two scenarios are implemented to evaluate the performance of NSBP and the load-balancing algorithm. In -1 the requests from three residential buildings from three regions are sent to the respective fogs to evaluate the performance of PSO-SA. ORT is used to route the request traffic on the potential data center. The simulation results show that the PSO-SA has 26.68%, 19.45% and 5.21% more efficient RT than RR, throttled and PSO, respectively. The PT using PSO-SA is enhanced by 51.9%, 54.32% and 60.9% as compared to RR, throttled and PSO, respectively. The VMs cost also optimized by 7.38%, 5.91% and 4.95% as compared to RR, throttled and PSO, respectively. The simulation results of -2, for PT and RT of five fogs and respective clusters of residential buildings are given in Table 3 and Table 4. The results validate the performance of PSO-SA and proposed NSBP. The Figure 6, validate the VM cost efficiency with PSO-SA using CDC, ORT and NSBP as well as using NSBP with RR, throttled, PSO and PSO-SA. The simulations show the trade-off between VM cost and performance with respect to hardware specifications. In the future, a multi-objective tasks-based resource allocation mechanism shall be proposed. The implementation of the realistic environment is important to validate the feasibility of proposed model in consideration of optimized power consumption and computation cost. However, this will be the scope of our future work.
Author Contributions
All authors equally contributed.
Funding
The present research has been conducted by the Research Grant of Kwangwoon University in 2018.
Conflicts of Interest
The authors declare no conflict of interest.
References
- Aslam, S.; Javaid, N.; Khan, F.A.; Alamri, A.; Almogren, A.; Abdul, W. Towards Efficient Energy Management and Power Trading in a Residential Area via Integrating a Grid-Connected Microgrid. Sustainability 2018, 10, 1245. [Google Scholar] [CrossRef]
- Zhao, J.; Wan, C.; Xu, Z.; Wang, J. Risk-based day-ahead scheduling of electric vehicle aggregator using information gap decision theory. IEEE Trans. Smart Grid 2017, 8, 1609–1618. [Google Scholar] [CrossRef]
- Huang, S.; Tushar, W.; Yuen, C.; Otto, K. Quantifying economic benefits in the ancillary electricity market for smart appliances in Singapore households. Sustain. Energy Grids Netw. 2015, 1, 53–62. [Google Scholar] [CrossRef]
- Albadi, M.H.; El-Saadany, E.F. A summary of demand response in electricity markets. Electr. Power Syst. Res. 2008, 78, 1989–1996. [Google Scholar] [CrossRef]
- Pezzutto, S.; Grilli, G.; Zambotti, S.; Dunjic, S. Forecasting Electricity Market Price for End Users in EU28 until 2020—Main Factors of Influence. Energies 2018, 11, 1460. [Google Scholar] [CrossRef]
- Schneider, I.; Sunstein, C.R. Behavioral considerations for effective time-varying electricity prices. Behav. Public Policy 2017, 1, 219–251. [Google Scholar] [CrossRef] [Green Version]
- Yaghmaee, M.H.; Moghaddassian, M.; Leon-Garcia, A. Autonomous two-tier cloud-based demand side management approach with microgrid. IEEE Trans. Ind. Inf. 2017, 13, 1109–1120. [Google Scholar] [CrossRef]
- Stergiou, C.; Psannis, K.E.; Kim, B.; Gupta, B. Secure integration of IoT and cloud computing. Future Gener. Comput. Syst. 2018, 78, 964–975. [Google Scholar] [CrossRef]
- Shi, C.; Ren, Z.; Yang, K.; Chen, C.; Zhang, H.; Xiao, Y.; Hou, X. Ultra-low latency cloud-fog computing for industrial Internet of Things. In Proceedings of the 2018 IEEE Wireless Communications and Networking Conference (WCNC), Barcelona, Spain, 15–18 April 2018; pp. 1–6. [Google Scholar]
- Utkarsh, K.; Srinivasan, D.; Trivedi, A.; Zhang, W.; Reindl, T. Distributed Model-predictive Real-time Optimal Operation of a Network of Smart Microgrids. IEEE Trans. Smart Grid 2018. [Google Scholar] [CrossRef]
- Parhizi, S.; Khodaei, A.; Shahidehpour, M. Market-Based Versus Price-Based Microgrid Optimal Scheduling. IEEE Trans. Smart Grid 2018, 9, 615–623. [Google Scholar] [CrossRef] [Green Version]
- Samet, H.; Azhdari, E.; Ghanbari, T. Comprehensive study on different possible operations of multiple grid connected microgrids. IEEE Trans. Smart Grid 2018, 9, 1434–1441. [Google Scholar] [CrossRef]
- Samuel, O.; Javaid, N.; Ashraf, M.; Ishmanov, F.; Afzal, M.; Khan, Z. Jaya based Optimization Method with High Dispatchable Distributed Generation for Residential Microgrid. Energies 2018, 11, 1513. [Google Scholar] [CrossRef]
- Mukherjee, M.; Shu, L.; Wang, D. Survey of fog computing: Fundamental, network applications, and research challenges. IEEE Commun. Surv. Tutor. 2018, 20, 1826–1857. [Google Scholar] [CrossRef]
- Wan, J.; Chen, B.; Wang, S.; Xia, M.; Li, D.; Liu, C. Fog Computing for Energy-aware Load Balancing and Scheduling in Smart Factory. IEEE Trans. Ind. Inf. 2018, 14, 4548–4556. [Google Scholar] [CrossRef]
- Gbenga, D.E.; Ramlan, E.I. Understanding the limitations of particle swarm algorithm for dynamic optimization tasks: A survey towards the singularity of PSO for swarm robotic applications. ACM Comput. Surv. 2016, 49, 8. [Google Scholar] [CrossRef]
- Zhao, R.; Shi, Y. Indoor localization algorithm based on hybrid annealing particle swarm optimization. In Proceedings of the 2018 Tenth International Conference on Advanced Computational Intelligence (ICACI), Xiamen, China, 29–31 March 2018; pp. 330–335. [Google Scholar]
- Chakraborty, N.; Mondal, A.; Mondal, S. Efficient Scheduling of Nonpreemptive Appliances for Peak Load Optimization in Smart Grid. IEEE Trans. Ind. Inf. 2018, 14, 3447–3458. [Google Scholar] [CrossRef]
- Cao, Z.; Lin, J.; Wan, C.; Song, Y.; Zhang, Y.; Wang, X. Optimal cloud computing resource allocation for demand side management in smart grid. IEEE Trans. Smart Grid 2017, 8, 1943–1955. [Google Scholar]
- Varghese, B.; Buyya, R. Next generation cloud computing: New trends and research directions. Future Gener. Comput. Syst. 2018, 79, 849–861. [Google Scholar] [CrossRef] [Green Version]
- Feng, H.; Llorca, J.; Tulino, A.M.; Molisch, A.F. Optimal dynamic cloud network control. IEEE/ACM Trans. Netw. 2018, 99, 1–14. [Google Scholar] [CrossRef]
- Baharlouei, Z.; Narimani, H.; Hashemi, M. On the convergence properties of autonomous demand side management algorithms. IEEE Trans. Smart Grid 2018, 9, 6713–6720. [Google Scholar] [CrossRef]
- Al Faruque, M.A.; Vatanparvar, K. Energy management-as-a-service over fog computing platform. IEEE Internet Things J. 2016, 3, 161–169. [Google Scholar] [CrossRef]
- Husein, M.; Chung, I. Optimal design and financial feasibility of a university campus microgrid considering renewable energy incentives. Appl. Energy 2018, 225, 273–289. [Google Scholar] [CrossRef]
- Yasmeen, A.; Javaid, N.; Rehman, O.U.; Iftikhar, H.; Malik, M.F.; Muhammad, F.J. Efficient resource provisioning for smart buildings utilizing fog and cloud based environment. In Proceedings of the 2018 14th International Wireless Communications & Mobile Computing Conference (IWCMC), Limassol, Cyprus, 25–29 June 2018; pp. 811–816. [Google Scholar]
- Javaid, N.; Hafeez, G.; Iqbal, S.; Alrajeh, N.; Alabed, M.S.; Guizani, M. Energy Efficient Integration of Renewable Energy Sources in the Smart Grid for Demand Side Management. IEEE Access 2018. [Google Scholar] [CrossRef]
- Chekired, D.A.; Khoukhi, L. Smart Grid Solution for Charging and Discharging Services Based on Cloud Computing Scheduling. IEEE Trans. Ind. Inf. 2017, 13, 3312–3321. [Google Scholar] [CrossRef]
- Moghaddam, M.H.Y.; Leon-Garcia, A.; Moghaddassian, M. On the performance of distributed and cloud-based demand response in smart grid. IEEE Trans. Smart Grid 2017, 9, 5403–5417. [Google Scholar]
- Okay, F.Y.; Ozdemir, S. A fog computing based smart grid model. In Proceedings of the 2016 International Symposium on Networks, Computers and Communications (ISNCC), Yasmine Hammamet, Tunisia, 11–13 May 2016; pp. 1–6. [Google Scholar]
- Kumar, N.; Vasilakos, A.V.; Rodrigues, J.J.P.C. A multi-tenant cloud-based DC nano grid for self-sustained smart buildings in smart cities. IEEE Commun. Mag. 2017, 55, 14–21. [Google Scholar] [CrossRef]
- Reka, S.S.; Ramesh, V. Demand side management scheme in smart grid with cloud computing approach using stochastic dynamic programming. Perspect. Sci. 2016, 8, 169–171. [Google Scholar] [CrossRef]
- Yaghmaee, M.; Hossein, M.; Moghaddassian, M.; Leon-Garcia, A. Power Consumption Scheduling for Future Connected Smart Homes Using Bi-Level Cost-Wise Optimization Approach. Lect. Notes Inst. Comput. Sci. Soc.-Inf. Telecommun. Eng. 2016, 166, 326–338. [Google Scholar]
- Kumar, N.; Zeadally, S.; Misra, S.C. Mobile cloud networking for efficient energy management in smart grid cyber-physical systems. IEEE Wirel. Commun. 2016, 23, 100–108. [Google Scholar] [CrossRef]
- Lopes, R.F.; Costa, F.F.; Oliveira, A.; de C. Lima, A.C. Algorithm based on particle swarm applied to electrical load scheduling in an industrial setting. Energy 2018, 147, 1007–1015. [Google Scholar] [CrossRef]
- Fan, Q.; Ansari, N. Towards Workload Balancing in Fog Computing Empowered IoT. IEEE Trans. Netw. Sci. Eng. 2018. [Google Scholar] [CrossRef]
- Bitam, S.; Zeadally, S.; Mellouk, A. Fog computing job scheduling optimization based on bees swarm. Enterp. Inf. Syst. 2018, 12, 373–397. [Google Scholar] [CrossRef]
- Adhikari, M.; Amgoth, T. Heuristic-based load-balancing algorithm for IaaS cloud. Future Gener. Comput. Syst. 2018, 81, 156–165. [Google Scholar] [CrossRef]
- Patel, H.; Patel, R. Cloud Analyst: An Insight of Service Broker Policy. Int. J. Adv. Res. Comput. Commun. Eng. 2015, 4, 122–127. [Google Scholar] [CrossRef]
- Bakhsh, R.; Javaid, N.; Fatima, I.; Khan, M.; Almejalli, K. Towards efficient resource utilization exploiting collaboration between HPF and 5G enabled energy management controllers in smart homes. Sustainability 2018, 10, 3592. [Google Scholar] [CrossRef]
- Zahoor, S.; Javaid, S.; Javaid, N.; Ashraf, M.; Ishmanov, F.; Afzal, M. Cloud–Fog–Based Smart Grid Model for Efficient Resource Management. Sustainability 2018, 10, 2079. [Google Scholar] [CrossRef]
- Wickremasinghe, B.; Buyya, R. CloudAnalyst: A CloudSim-based tool for modelling and analysis of large scale cloud computing environments. MEDC Proj. Rep. 2009, 22, 433–659. [Google Scholar]
Figure 1.
Pictorial View of Proposed System Model.

Figure 2.
Load-Balancing Mechanism in Data Centers.

Figure 3.
RT of Buildings During 24 h in Scenario 1.

Figure 4.
PT of Buildings During 24 h in Scenario 1.

Figure 5.
Overall Cost Comparison in Scenario 1.

Figure 6.
Cost for Scenario-2.


Table 1.
RT in Scenario 1.
| Algorithm | Average RT (ms) | Minimum RT (ms) | Maximum RT (ms) |
|---|---|---|---|
| RR | 83.00 | 42.78 | 99.74 |
| Throttled | 75.11 | 40.26 | 96.53 |
| PSO | 64.04 | 39.53 | 90.28 |
| PSO-SA | 60.77 | 37.98 | 290.86 |
Table 2.
PT in Scenario 1.
| Algorithm | Average PT (ms) | Minimum PT (ms) | Maximum PT (ms) |
|---|---|---|---|
| RR | 2.37 | 0.21 | 3.99 |
| Throttled | 2.49 | 0.25 | 4.47 |
| PSO | 2.91 | 0.26 | 4.96 |
| PSO-SA | 1.14 | 0.17 | 2.30 |
Table 3.
Average RT (ms) of Scenario 2.
| SBP | Algorithm | C1 | C2 | C3 | C4 | C5 |
|---|---|---|---|---|---|---|
| CDC | RR | 51.15 | 51.12 | 51.14 | 51.19 | 51.16 |
| CDC | throttled | 50.70 | 50.67 | 50.66 | 50.78 | 50.74 |
| CDC | PSO | 55.27 | 55.66 | 55.76 | 54.83 | 55.70 |
| CDC | PSO-SA | 48.90 | 49.38 | 49.27 | 48.80 | 49.51 |
| ORT | RR | 51.15 | 51.12 | 51.08 | 51.16 | 51.14 |
| ORT | throttled | 50.73 | 50.69 | 50.63 | 50.79 | 50.73 |
| ORT | PSO | 55.22 | 56.76 | 54.47 | 54.52 | 54.13 |
| ORT | PSO-SA | 50.12 | 51.02 | 49.99 | 50.88 | 51.00 |
| NSBP | RR | 51.12 | 51.07 | 51.02 | 51.14 | 51.24 |
| NSBP | throttled | 50.26 | 50.45 | 50.55 | 50.71 | 50.73 |
| NSBP | PSO | 54.85 | 55.10 | 54.09 | 55.01 | 55.11 |
| NSBP | PSO-SA | 50.10 | 50.44 | 49.13 | 50.62 | 50.30 |
Table 4.
Average PT (ms) of Scenario 2.
| SBP | Algorithm | Fog1 | Fog2 | Fog3 | Fog4 | Fog5 |
|---|---|---|---|---|---|---|
| CDC | RR | 1.04 | 1.07 | 1.40 | 1.09 | 1.88 |
| CDC | throttled | 1.04 | 0.96 | 1.12 | 1.22 | 1.40 |
| CDC | PSO | 2.02 | 2.76 | 2.53 | 2.08 | 2.55 |
| CDC | PSO-SA | 1.00 | 1.21 | 1.01 | 0.99 | 1.18 |
| ORT | RR | 1.04 | 1.07 | 1.40 | 1.51 | 1.88 |
| ORT | throttled | 1.04 | 1.97 | 1.12 | 1.22 | 1.02 |
| ORT | PSO | 1.47 | 1.87 | 1.59 | 2.01 | 1.62 |
| ORT | PSO-SA | 1.00 | 1.06 | 1.23 | 1.10 | 0.99 |
| NSBP | RR | 1.04 | 1.07 | 1.40 | 1.51 | 1.86 |
| NSBP | throttled | 1.04 | 1.97 | 1.12 | 1.22 | 1.99 |
| NSBP | PSO | 1.63 | 1.37 | 1.21 | 1.12 | 1.97 |
| NSBP | PSO-SA | 1.0 | 1.12 | 1.18 | 1.127 | 1.31 |
© 2018 by the authors. Licensee MDPI, Basel, Switzerland. This article is an open access article distributed under the terms and conditions of the Creative Commons Attribution (CC BY) license (http://creativecommons.org/licenses/by/4.0/).
Share and Cite
MDPI and ACS Style
Bukhsh, R.; Javaid, N.; Ali Khan, Z.; Ishmanov, F.; Afzal, M.K.; Wadud, Z. Towards Fast Response, Reduced Processing and Balanced Load in Fog-Based Data-Driven Smart Grid. Energies 2018, 11, 3345. https://doi.org/10.3390/en11123345
AMA Style
Bukhsh R, Javaid N, Ali Khan Z, Ishmanov F, Afzal MK, Wadud Z. Towards Fast Response, Reduced Processing and Balanced Load in Fog-Based Data-Driven Smart Grid. Energies. 2018; 11(12):3345. https://doi.org/10.3390/en11123345
Chicago/Turabian StyleBukhsh, Rasool, Nadeem Javaid, Zahoor Ali Khan, Farruh Ishmanov, Muhammad Khalil Afzal, and Zahid Wadud. 2018. "Towards Fast Response, Reduced Processing and Balanced Load in Fog-Based Data-Driven Smart Grid" Energies 11, no. 12: 3345. https://doi.org/10.3390/en11123345
Note that from the first issue of 2016, this journal uses article numbers instead of page numbers. See further details here.