Utilization of Biodegradable Wastes as a Clean Energy Source in the Developing Countries: A Case Study in Myanmar


1
Department of Power Engineering, VŠB-Technical University of Ostrava, 17. listopadu 15, 70833 Ostrava-Poruba, Czech Republic
2
Department of Energy Engineering, Czech Technical University, Zikova 1903/4, 166 36 Prague, Czech Republic
3
Centre ENET, VŠB-Technical University of Ostrava, 17. listopadu 15, 70833 Ostrava-Poruba, Czech Republic
*
Authors to whom correspondence should be addressed.
Energies 2018, 11(11), 3183; https://doi.org/10.3390/en11113183
Submission received: 12 October 2018
/
Revised: 7 November 2018
/
Accepted: 12 November 2018
/
Published: 16 November 2018
Abstract
:Nowadays, waste-to-energy has become a type of renewable energy utilization that can provide environmental and economic benefits in the world. In this paper, we evaluated the quality of twelve biodegradable waste samples from Myanmar by binder laboratory heating and drying oven at 105 °C. The calculation methods of the Intergovernmental Panel on Climate Change (IPCC) and Institute for Global Environmental Strategies (IGES) were used for the greenhouse gas emission estimation from waste disposal at the open dumpsites, anaerobic digestion, and waste transportation in the current situation of Myanmar. Greenhouse gas (GHG) emission and fossil fuel consumption of the improved biodegrade waste utilization system were estimated and both were found to be reduced. As a result, volume and weight of the biodegradable wastes with 100% moisture reduction were estimated at approximately 5 million cubic meters per year and 2600 kilotonnes per year, respectively, in 2021. The total GHG emissions in the current situation amounted to approximately 1500 and 1800 Gigagrams of CO2-eq per year in 2019 and 2021, respectively, while the total GHG emission avoidance from a sustainable approach amounted to 3500 and 4000 Gigagrams of CO2-eq per year, respectively. The study aimed at highlighting the utilization of biodegradable wastes as a clean energy source in developing countries.
1. Introduction
Nowadays, waste has become a local and global issue related to society, wild species, and the environment. Waste generation in developing countries has been increasing along with the growing population, increasing per capita waste generation and economic growth. Without an effective and efficient solid waste management program, the waste generated from various human activities, both industrial and domestic, can result in health hazards and have a negative impact on the environment [1].
The urban population in most Asian developing countries in 2012 might be increased by around 50% in 2025 [2]. Since waste generation rates are closely related to the population and per capita waste generation of a country, the Asian developing countries might have significantly increased waste generation rates during 2012–2025 (Figure 1).
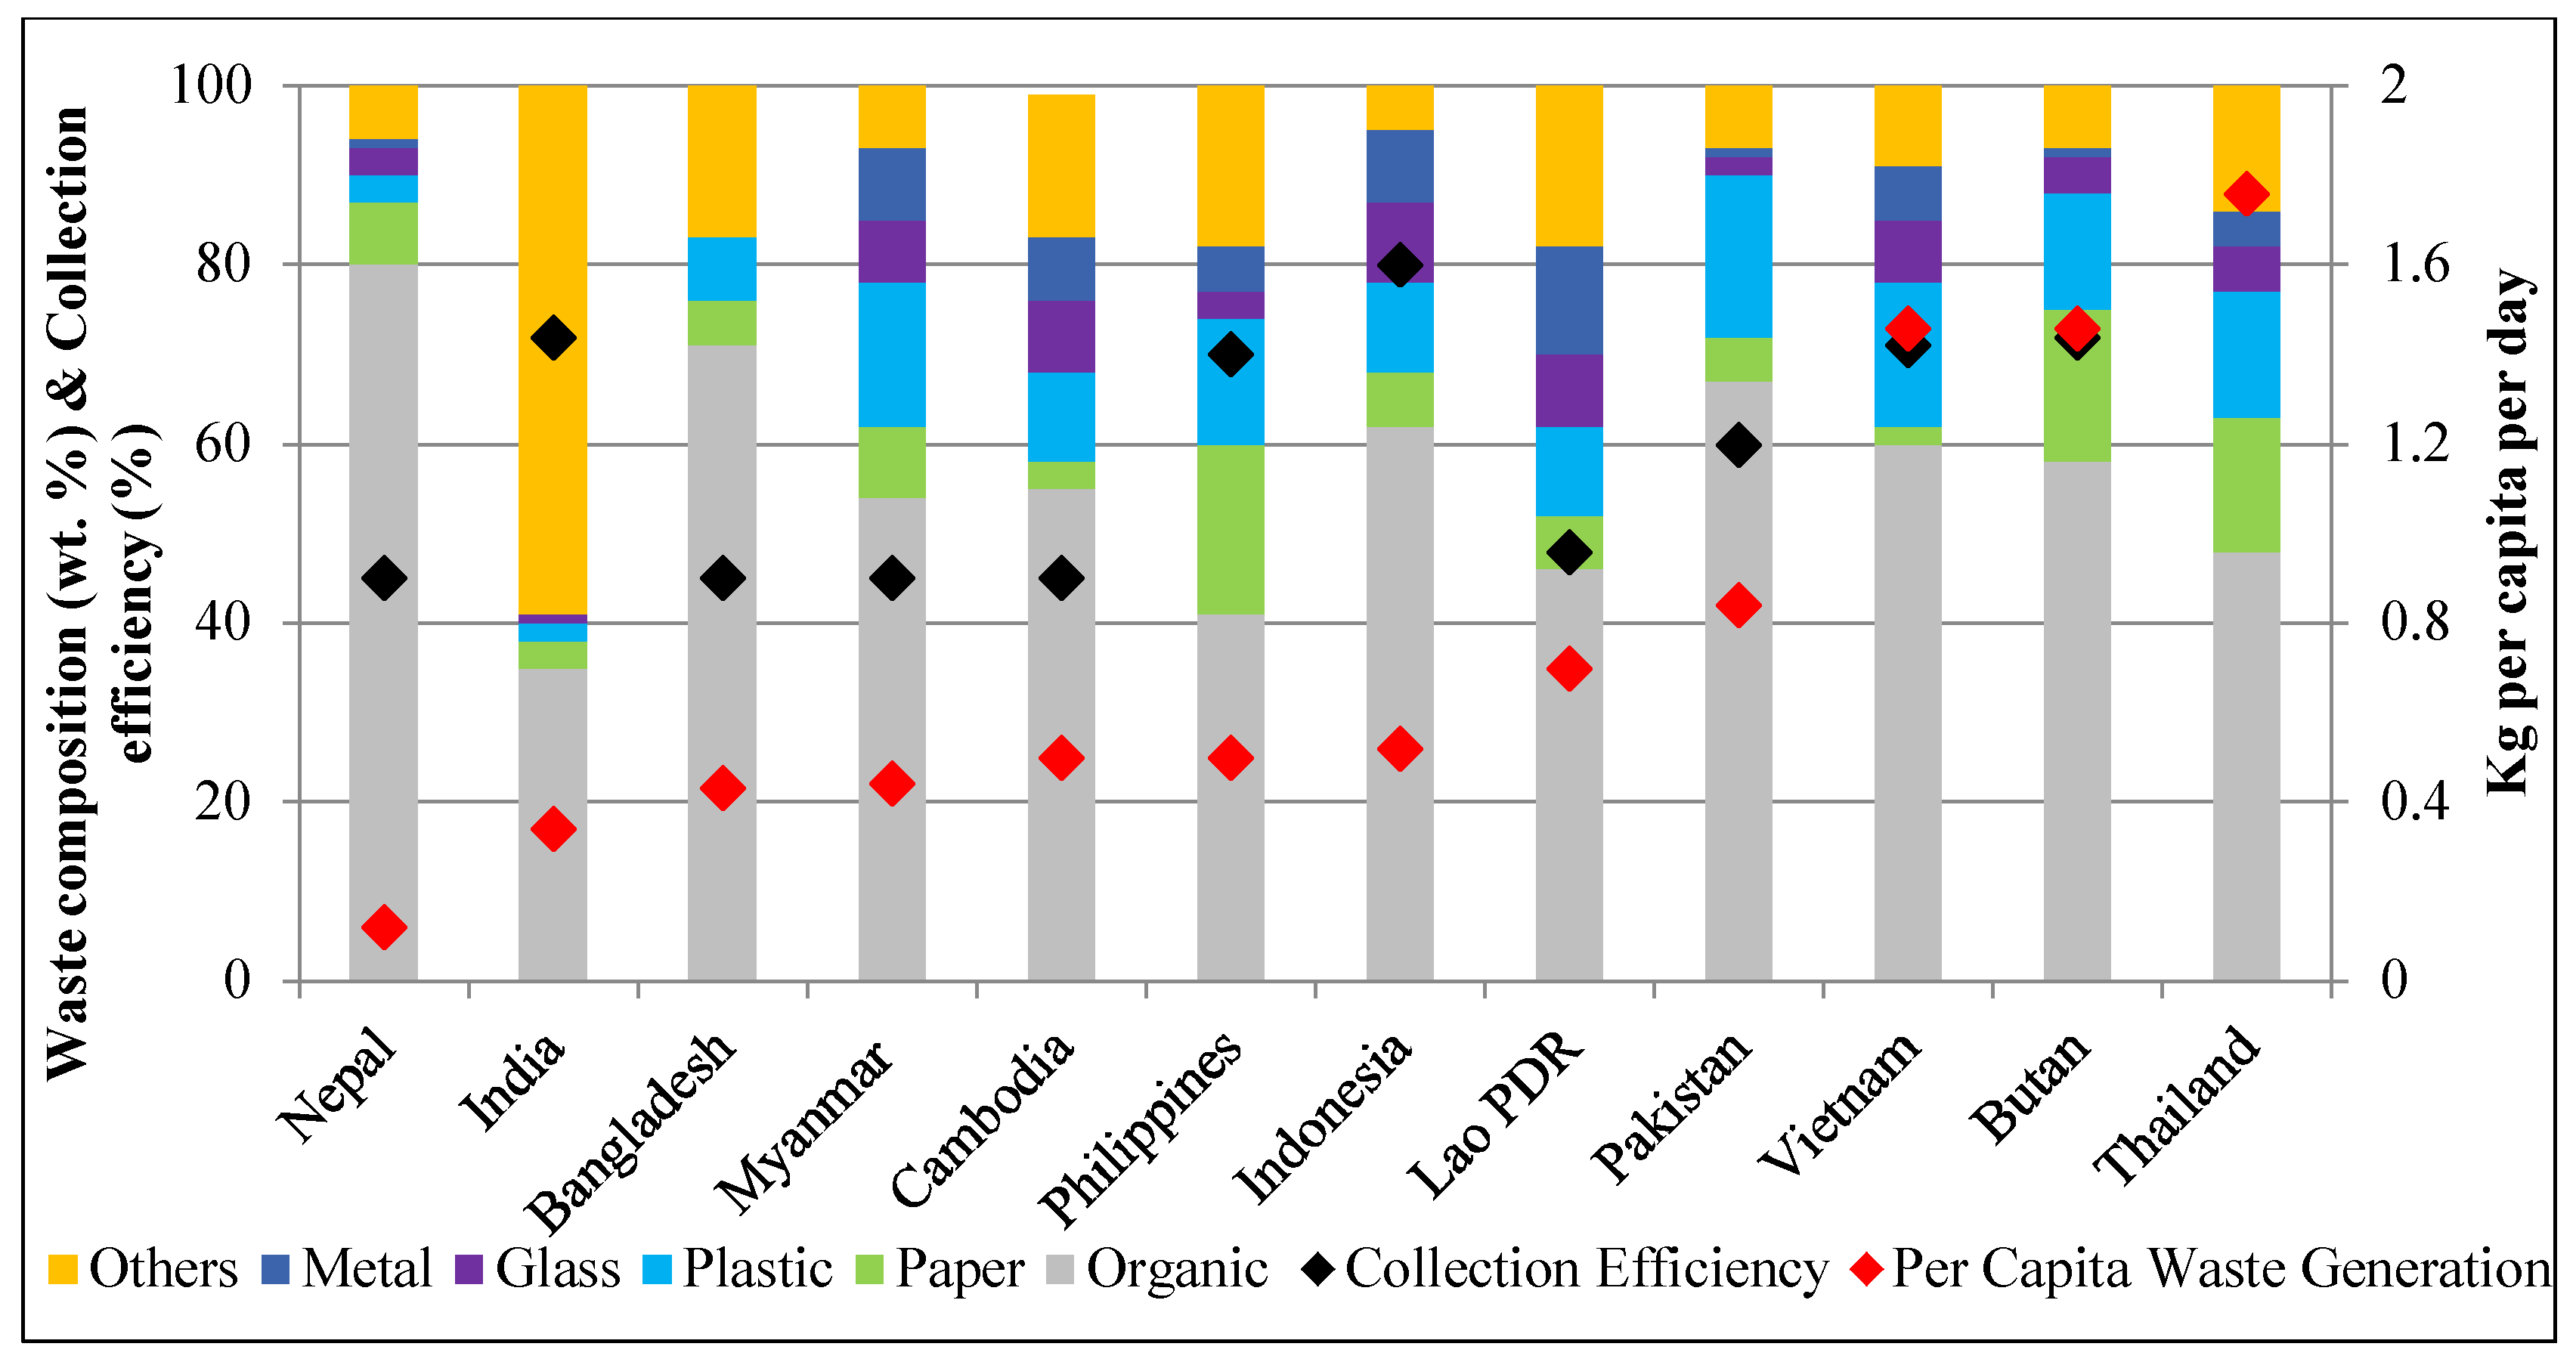
According to the World Bank 2012 Report [2], the amount of municipal solid wastes (MSW) of the cities around the world might reach 2.2 billion tonnes per year by 2025 and waste generation rates might double over the next two decades in developing countries. The country-specific waste composition is mainly influenced by consumption patterns, educational and living standards, household income, and economic development. Generally, compared to the developed countries, most developing countries have greater organic fractions of their MSW composition, being over 50% of the total. Figure 2 shows the comparison of waste composition, collection efficiency and per capita waste generation in Asian developing countries as per the World Bank 2012 Report [2] and the scholars [4] It is observed that the MSW in most of the Asian developing countries is mainly composed of organic waste, with around 55%, followed by other (16%), paper (17%), plastic (11%), and glass and metal (1%) on average. The collection efficiency and per capita waste generation of these developing countries are lower than 70% and 1.5 kg per capita per day, respectively.
Due to the higher organic fraction and higher moisture content of the MSW, thermal waste treatment is not suitable for energy recovery without additional fuel supply in the developing countries [5,6]. In addition, due to the high investment costs of waste-to-energy technologies, the developing countries commonly use open dumping and landfilling as their principal waste disposal methods [2,7]. However, the negative impacts of waste disposal at open dumpsites and landfills significantly affect the environment [8,9] and public health due to the environmental pollution from the greenhouse gas emissions generated from anaerobic digestion of biodegradable wastes to the atmosphere [10] and landfill leachate impact on the groundwater [11], hygienic issues for waste service workers and the residents residing near the landfilling areas, and the likelihoods of spreading the diseases carried by insects and bacteria to the residents [12]. Further, accelerating waste generation rates in most developing countries could potentially encounter the limited land area for waste disposal at open dumpsites and landfills [13,14,15].
Nowadays, there is a growing interest in the utilization of renewable energy sources, including biomass, due to the environmental concerns of fossil fuel energy consumption [16]. Currently, the biofuel production from renewable sources is a major challenge in research [17]. Methods of hydrogen generation from waste products have been developed [16]. MSW incineration plants have been advantageous to developed countries for energy recovery and reduction of the mass and volume of initial bulk wastes, despite their drawbacks [13,18]. When incinerated, waste is reduced by 80–85% by weight and by 95–96% by volume [19]. However, waste fuel for energy recovery should ideally have a high heating value and low content of moisture and ash. Therefore, the aim of MSW drying is the modification of the waste’s characteristics to increase its low heating value and allow easier removal of glass, metals, and other inert materials [20]. Hence, energy-oriented conversion technologies for the improvement of the waste quality by drying might have the potential to increase the heating values of raw waste materials [20,21] as well as to reduce the bulk volume of the wastes [22] and waste odour [23] and to facilitate a storage [22] and transportation [24]. In addition, the dried waste materials could offer other significant benefits such as reduced dependency on fossil fuel [23], reduced environmental impacts from the landfills [25], and mitigation of global warming [26]. Therefore, a drying process could probably become a future potential waste pre-treatment option with environmental and economic benefits in developing countries which have higher solar radiation and availability of reliable energy sources from industries, such as waste heat. Among the Asian developing countries, Myanmar was chosen to be a representative country to highlight the utilization of biodegradable wastes as a clean energy source by improving their quality. This was because most cities of Myanmar generally practice the separation of waste into two categories—bio-solid wastes (dry wastes) and biodegradable wastes (wet wastes). The separation of the biodegradable wastes from the generated wastes could easily enable the quality of the biodegradable wastes to be separately improved by drying for use as a future potential energy source.
2. Background of the Study
Myanmar is one of the developing countries in South East Asia. It is composed of seven states and seven divisions. It covers approximately an area of 677,000 square kilometres. Myanmar has a total population of over 53 million residents in 2018. The population of Myanmar might be trending around 56.32 million in 2020 [27]. Around 35% of the population resides in an urban area in 2018. The per capita gross domestic product of Myanmar is approximately 1400 US dollars.
In Myanmar, the provision of waste collection services, management activities, and initiation of 3Rs (Reduce, Reuse, and Recycle) practices are extensively undertaken by responsible organizations independently [28]. Regarding the research studies [29,30,31], waste collection methods in Myanmar include door to door waste collection, bell ringing block collection to the household, collection of waste from kerbside bins, collection at street dump yards, collection at a temporary storage system, and sweeping waste from the road. The collection efficiency of the major cities like Yangon and Mandalay was higher than 80% in 2017 [31]. However, the overall collection efficiency of the country is comparatively lower than that of the major cities, at around 45% [2]. The total waste generation rate of Myanmar accounted for approximately 11,500 tonnes per day, with 6230 tonnes of the biodegradable wastes per day in 2017 (Figure 3). This rate will reach more than 15,000 tonnes per day, with around 9000 tonnes of the biodegradable wastes per day by 2021, according to the World Bank 2012 Report [2].
Due to the higher organic fraction in the MSW composition, higher moisture content of the organic wastes, high capital cost of waste-to-energy technologies, and insufficient budget for MSW management, Myanmar simply uses open dumping or uncontrolled landfilling as the principal waste disposal method, like the similar situations of other developing countries (Figure 4). However, despite the landfills instrumented with the proper liner and leachate collection systems, it may not eliminate the rainwater percolation that impacts on leachate production quality and quantity [32]. Leachate treatment represents one of the most relevant problems in the field of waste treatment [33]. Currently, landfilling accounts for approximately 85% of the total waste disposal in Myanmar (approximately 9800 tonnes per day out of 11,500 tonnes per day in 2017). One incineration plant with a capacity of 60 tonnes of wastes per day has been built for waste-to-energy in Yangon [34]. The plant generates 700 kilowatts of electrical power daily. In addition, an anaerobic digester has been built for power generation from 30 tonnes of waste per day in Mandalay [31]. 3-Rs activities have been widely practiced in Yangon and Mandalay, but the recycling sector is still in the development stage. About 5% (86 tonnes) of the total collected wastes in Yangon could be recycled daily [31,35], but it accounts for only 2%, compared to the total waste generation of the entire country. Since there is still a lack of sufficient data about the current waste disposal methods of the entire country, the data were approximately derived from the research data [7,31]. The contribution of waste disposal methods in Myanmar is presented in Figure 4. “Others” refers to reuse activities, animal feedings, illegal dumping, open burning, etc.
Currently, along with economic development, population growth, and rapid urbanization and industrialization, the most immediate environmental issues related to MSW have accelerated the need for sustainable waste management in the major cities of Myanmar [36]. Exploring the possibilities of waste fuel as a clean energy source becomes a potential means to gain environmental and economic benefits from the waste management in the developing countries. In Myanmar, the major fraction of MSW composition is constituted by organic or biodegradable waste. Hence, if the biodegradable waste could be utilized as an energy source, the environmental pollution from the waste disposal at open dumpsites and fossil fuel consumption could be avoided. The pre-treatment of biodegradable wastes by drying could play a key role in reducing their moisture content and improving their quality for combustion. Therefore, the objectives of the study were to estimate the biodegradable waste quality by drying as a way of pre-treatment, to estimate the amount of GHG emissions and avoidance from the waste disposal at landfills and utilization of biodegradable wastes, and to propose a sustainable approach to the waste management for a sustainable energy system in Myanmar. The presented results could also be used for the assessment of biodegradable waste management in other developing countries.
3. Materials and Methods
3.1. Collection of the Samples
The data related to waste generation and waste composition were collected from the World Bank 2012 Reports [2], published research papers [7,31,35], and report papers [34]. The average composition of the MSW in Myanmar accounted for 54% organic waste, 16% plastic waste, 8% paper, 7% glass, 8% metal, and 7% others [2]. In Myanmar, wet wastes and dry wastes are collected separately, mostly in Yangon [28,29]. The wet wastes in Yangon account for organic wastes, composed of food wastes and green leaves, while the dry wastes include plastics, papers, glass, metals, and others [35]. Of these, wet wastes (mostly food waste and green leaves) were considered for drying for optimization of the biodegradable waste quality in this study. Twelve samples were prepared to estimate the quality improvement of the biodegradable wastes by drying. These samples amounted to 500 g. The composition ratio of the biodegradable waste samples (food wastes: green leaves/garden leaves) were considered to be 80:20, based on the research studies about the waste composition in Yangon [37,38] in order to cover the variations of the biodegradable waste composition in most cities of Myanmar. Table 1 presents the biodegradable waste samples of Myanmar for evaluating their quality by drying.
3.2. Methods
3.2.1. Assessment of the Moisture Contents of the Samples
The moisture contents of the samples were assessed by Mettler Toledo HG63 Halogen Moisture Analyzer (Type: HG63). Standard drying was used to dry the samples, with the switch off criterion of one milligram per 50 s and drying temperature of 105 °C.
3.2.2. Assessment of the Moisture Reduction, Weight Reduction, Volume Reduction, and Heating Value Increase of the Samples
The samples were dried by binder laboratory hating and drying oven (BINDER: FED 400; Capacity: 1000 mm width × 800 mm height × 500 mm depth) at a drying temperature of 105 °C for 5 h with an air fan speed of 80%. The drying temperature of 105 °C was chosen together with five hours of drying time to efficiently evaluate the changes in the quality of the different samples during the drying process. The moisture reduction, weight reduction, and volume reduction of the samples were recorded at different times.
The initial lower heating values and final lower heating values of the samples were approximately estimated based on the following Equations (1) and (2) [39]:
where
- LHVinitial and LHVfinal are the initial lower heating values and final lower heating values of the samples (megajoules per kilogram (MJ per kg)), respectively.
- Davg is the average dry mass of the biodegradable wastes in mass (kg) (assumed as 0.2 kg, based on the fact that the total weight and the moisture content of the biodegradable wastes are 1 kg and 80%, respectively).
- Wi is the initial weight of a waste component i in the total initial weight of the waste composition (kg).
- Wj is the final weight of a waste component j in the total final weight of the waste composition (kg).
- MCi and MCj are the initial and final moisture content of the waste component i and j (%).
- Ei is the energy content of a waste component i (MJ per kg).
- n is the total number of the waste types in the total waste composition.
The energy contents of food wastes and green leaves are in the range of 3489–6979 MJ per kg and 2326–18,608 MJ per kg, respectively [40]. The average energy content and moisture content of the biodegradable waste samples were approximately considered as 3.5 MJ per kg and 80% [40], respectively, for ease of estimation.
3.2.3. GHG Emissions and Avoidance from Anaerobic Digestion of the Biodegradable Wastes
Based on the IGES GHG calculation methods [41], the GHG emissions and avoidance from anaerobic digestion were estimated as described in the Equation (3).
where
- NGHGAD is the net GHG emission/avoidance from anaerobic digestion (kg CO2 per tonne of organic waste).
- ADemission is the GHG emissions from the treatment of anaerobic digestion (kg CO2 per tonne of organic waste).
- ADavoidance is the GHG avoidance due to the energy recovery from anaerobic digestion and due to avoidance of landfilling of the equivalent amount of organic wastes used for anaerobic digestion (kg CO2 per tonne of organic waste).
- ECH4 is the emissions of CH4 due to leakages (kg of CH4 per kg of dry matter) (assumed as 2 kg of CH4 per tonne of dry organic wastes).
- DM is the dry matter percentage in the influent (%) (assumed as 20%).
- is the conversion factor to calculate dry matter content per tonne of organic waste.
- GWPCH4 is the global warming potential of CH4 (21 kg CO2 per kg of CH4).
- CBiogas is the collected amount of biogas (m3 per ton of organic waste) (assumed as 592 m3 per tonne of dry mass).
- PCH4 is the percentage of CH4 in biogas (%) (assumed as 60%).
- ECCH4 is the energy content of CH4 (MJ per m3) (assumed as 37 MJ per m3).
- EFCO2 is the emission factor of CO2 by combustion of liquid petroleum gas (LPG) (kg of CO2 per MJ) (assumed as 0.063 kg of CO2 per MJ). Despite having two possible substitutions from biogas into thermal energy or from biogas into electricity, it was assumed that LPG consumption was substituted by using biogas as the thermal energy source.
- GHGLFavoidance is the GHG avoidance from landfilling of the equivalent amount of organic wastes calculated as per the Equation (4) below. The considerations for the GHG emissions from fossil fuel consumption for operation activities during anaerobic digestion were not included for ease of estimation.
3.2.4. GHG Emission from Waste Disposal of Biodegradable Wastes at Open Dumpsites
The Intergovernmental Panel on Climate Change (IPPC) calculation method was used for estimation of GHG emissions to the atmosphere from biodegradable waste disposal at open dumpsites or landfills. The IPCC default method is considered more suitable to be applied in this study because the method is simple, and calculations only require an input of a limited set of parameters, for which specific quantities and data of a country are not available [42]. By the IPCC default method, the methane emissions from open dumpsites and landfills can be calculated as follows [35,42]:
where
- CH4 Emission is methane emission from landfill in gigagrams per year.
- MSWT is the total solid waste generation (Gg per year).
- MSWF is the fraction of solid waste disposed of, on the wet weight bis.
- MCF is the methane correction factor (0.6 as a recommended value of IPCC for uncategorized landfill).
- DOC is the degradable organic carbon in MSW (0.1042, derived from IPCC default DOC values).
- DOCF is the fraction of DOC that can decompose (fraction) (0.5 as a default value of IPPC).
- F is a fraction of CH4 in generated landfill gas (0.5 as a default value of IPPC).
- R is the recovered methane (Gg per year) which is zero for open dumpsites with no gas collection system.
- 16/12 is the molecular weight ratio of methane to carbon, and OX is the oxidation factor, which is zero for open dumpsites as a recommended value of IPCC.
3.2.5. GHG Emission from Transportation
The GHG emissions from fossil fuel based-transportation of wastes to final disposal sites can be estimated as follows [35,41]:
where
- GHGT is GHG emissions from transportation (kg CO2 per tonne of transported waste).
- F is the total amount of fossil fuel consumption per month, (Diesel in litres and Natural gas in kg).
- W is the total amount of waste transported per month (tonnes per month).
- E is the energy content of fossil fuel (36.42 MJ per litre for diesel and 37.92 MJ per kg for natural gas).
- EF is the CO2 emission factor of the fuel (0.074 kg CO2 per MJ for diesel and 0.056 kg CO2 per MJ for natural gas).
The fuel consumption for waste transportation towards the open dumping and landfills in all the cities of Myanmar was approximately derived from the waste transportation data of Yangon city. In Yangon city, 128,704 L of diesel and 900 L of gasoline were used for transporting 46,500 tonnes of the collected wastes per month in 2012 [29].
3.2.6. Fossil Fuel Savings and GHG Emissions/Avoidance from Fossil Fuel Consumption and Utilization of the Biodegradable Wastes
The amount of fossil fuel that could be saved by the utilization of the biodegradable wastes was estimated by the following equation:
where
- FFS is the amount of fossil fuel that could be saved by utilization of the biodegradable wastes (kilotonnes per year).
- Wb is the amount of the biodegradable wastes (kilotonnes per year).
- Eb is the energy content of the biodegradable wastes (MJ per kg) (assumed as 3.5 MJ per kg of the biodegradable waste).
- Eff is the energy content of the fossil fuel (MJ per kg) (assumed as 30 MJ per kg of black coal).
The GHG emissions from fossil fuel consumption were estimated based on the Equation (7):
where
- GHGF is the total estimated amount of greenhouse emissions from fossil fuel consumption (Gg of CO2-eq per year).
- EF is the total estimated quantity of the energy content of fossil fuel (GJ per year).
- EMF is the total estimated amount of CO2 emission from fossil fuel consumption (kg of CO2 per GJ).
For ease of estimation, black coal was considered as a fossil fuel, and its CO2 emission from fossil fuel consumption was considered as 92.4 kg of CO2 per GJ [43]. The energy content of fossil fuel was approximately considered to be the equivalent quantity of the energy content of the biodegradable wastes. Biodegradable wastes were considered to be the biomass without the GHG emissions from its consumption [43].
3.2.7. GHG Emission Avoidance from Avoiding Waste Disposal at Open Dumpsites
The GHG emission avoidance from the biodegradable waste disposal at open dumpsites could occur when all the biodegradable wastes are assumed to be theoretically used as a clean energy source without any disposal at open dumpsites. Thus, the GHG emission avoidance from avoiding the biodegradable waste disposal at open dumpsites is approximately estimated to equal the amount of GHG emissions from landfilling the equivalent amount of waste.
3.2.8. GHG Emission Avoidance from the Utilization of Biodegradable Wastes
The GHG emission avoidance from the utilization of biodegradable wastes could occur when the equivalent amount of fossil fuel energy could be avoided by utilizing the equivalent amount of energy from the improved biodegradable wastes. Thus, the amount of GHG emission avoidance from the utilization of biodegradable wastes is approximately estimated to equal the amount of the GHG emissions from the equivalent amount of fossil fuel consumption.
4. Results and Discussion
4.1. Properties of Biodegradable Waste Samples before and after Drying
Table 2 presents the results of the initial and final values of mass, volume, moisture, and heating values of the improved biodegradable waste samples at 105 °C in 5 h. It was observed that the initial and final moisture contents of the biodegradable wastes were in the range of approximately 80 ± 4% and 15 ± 8%, respectively. Meanwhile, the initial and final lower heating values of the biodegradable wastes were in the range of approximately 4 ± 1 MJ per kg and 15 ± 1 MJ per kg.
4.2. The Effect of Moisture Reduction on Weight Reduction, Volume Reduction, and Heating Value of the Biodegradable Wastes of Myanmar
Statistical data analysis was performed on the variables related to the moisture reduction of the biodegradable waste samples. To examine the strength and direction of the linear relationship between the variables, Pearson correlation was calculated for each pair of the variables (Table 3). Pearson correlation coefficient can range in value from −1 to 1 (absolute value of −1 or 1 indicates a perfect linear relationship, while the values close to 0 indicates no linear relationship between the variables). The significance of the correlation coefficient was determined by comparison of the p-value to the significance level of 0.05. The correlation was significant (p-value was below the significance level of 0.05) in the following pairs of variables: the moisture reduction and weight reduction; the moisture reduction and volume reduction; and the moisture reduction and heating value increase.
The effect of moisture reduction on weight reduction, volume reduction, and heating value increase of the biodegradable waste samples is shown in Figure 5a–c, respectively. It was observed that the moisture reduction significantly affected the weight reduction, volume reduction, and heating value increase of the biodegradable waste samples as stated by [39]. Likewise, about 50% moisture reduction from the biodegradable wastes might provide approximately 40% weight reduction from the initial weight of the wastes, 25% volume reduction from the initial volume of the wastes, and 210% heating value increase from the initial heating value of the wastes, respectively. As a result, regarding the achievable percentages of the moisture reduction, the biodegradable waste quality might be increased. The moisture reduction of the wastes could also save a reasonable amount of the GHG emissions from the waste transportation to the open dumpsites due to the reduced volume and weight of the wastes.
4.3. GHG Emission/Avoidance from Biodegradable Waste Disposal and Biodegradable Waste Utilization
Figure 6 shows the total estimated weight of the biodegradable wastes before and after their moisture reduction. The total estimated biodegradable waste generation in Myanmar amounted to approximately 2200 kilotonnes per year in 2017, projecting towards 3200 kilotonnes per year in 2021. In Figure 6, three scenarios were considered: 50%, 80%, and 100% moisture reduction for the reduction of the weight of biodegradable wastes. It was observed that regarding 50%, 80%, and 100% of the moisture reduction, the total estimated amount of the reduced weight of the biodegradable wastes in Myanmar might account for 900, 1500, and 1800 kilotonnes per year, respectively, in 2017, trending around 1300, 2100, and 2600 kilotonnes per year, respectively, in 2021. Likewise, regarding 50%, 80%, and 100% moisture reduction, the total estimated quantity of the reduced volume amounted to approximately 2, 3, and 4 million cubic meters per year, respectively, in 2017 and 3, 4, and 5 million cubic meters per year, respectively, in 2021, compared to the estimated initial volume of the biodegradable wastes (Figure 7).
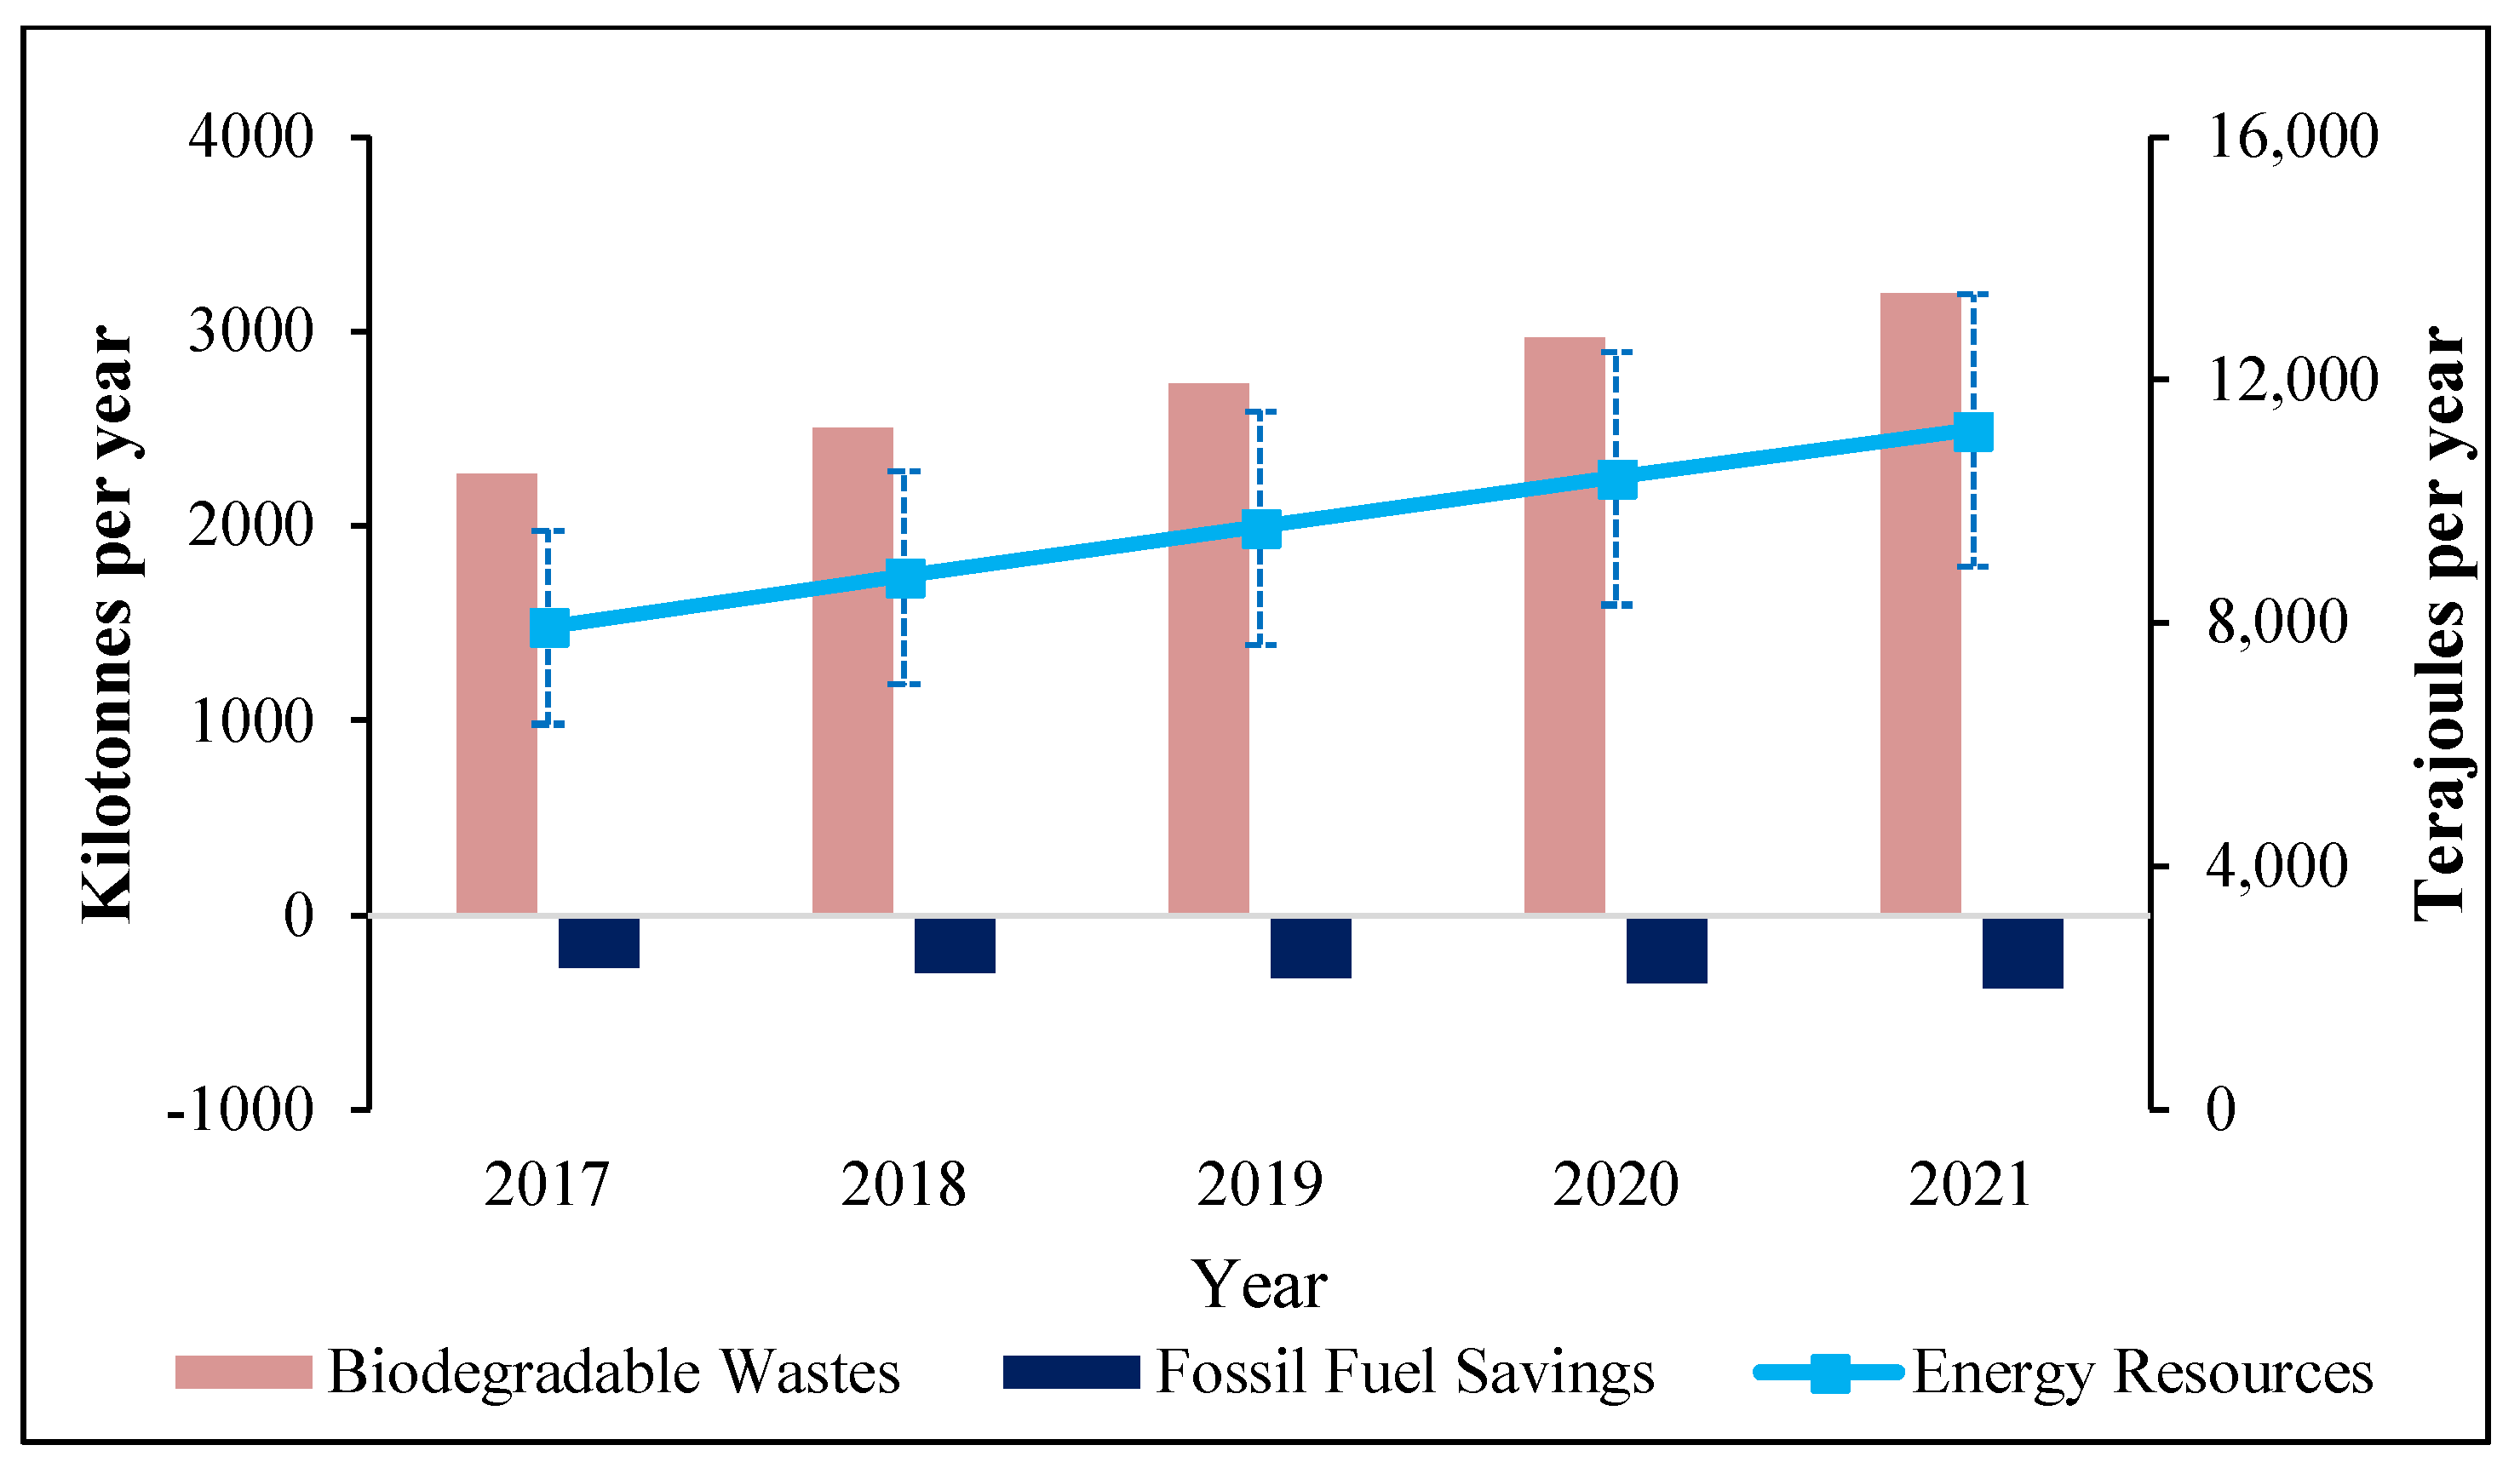
The total amount of biodegradable wastes in 2017 accounted for approximately 2300 kilotonnes per year, providing around 8000 Terajoules of energy resources per year (Figure 8). In 2021, the quantity of the energy resources from the biodegradable wastes was estimated at approximately 11,000 Terajoules per year. As a result, it could save 400 kilotonnes of fossil fuel if the biodegradable wastes could be efficiently utilized.
As shown in Figure 9, the GHG emissions from the biodegradable wastes were estimated based on the biodegradable waste disposal at open dumpsites, anaerobic digestion, and waste transportation from the collection points to the open dumpsites. It was observed that the total net amount of GHG emissions from open dumping, anaerobic digestion, and waste transportation was estimated at approximately 1200 Gg of CO2-eq per year in 2017. The total net amount of GHG emissions would probably increase by 40% in 2021, regarding the current situation. However, if a sustainable approach could be taken by pre-treating the biodegradable wastes by drying methods and utilizing them, there would be several major benefits, such as the avoidance of biodegradable waste disposal at open dumpsites, the energy sources from the biodegradable wastes, the avoidance of fossil fuel consumption, and reduced waste transportation cost due to the reduced weight and volume of the initial bulk biodegradable wastes. The comparison of GHG emission/avoidance between the current situation and a sustainable approach to the waste management of Myanmar is presented in Figure 10. It can be seen that the total net estimated GHG emission avoidance from biodegradable wastes would amount to around 3500 Gg of CO2-eq per year in 2019 and 4000 Gg of CO2-eq per year in 2021, respectively (Figure 10).
5. Recommendations
Growing population, economic development, rapid urbanization, and increasing per capita waste generation are boosting the waste generating rates in developing countries. Meanwhile, biodegradable waste accounts for a significant part of their MSW and has become the major problem for the MSW management. Figure 11 shows the projected biodegradable waste generation trends and available solar energy resources in the selected Asian developing countries. The projected biodegradable waste generation trends in these developing countries were derived from the World Bank 2012 Report [2] regarding waste composition and total solid waste generation. It was seen that Pakistan, Indonesia, and Vietnam would be the most significant contribution of the biodegradable wastes among the countries, ranging from around 30–55 kilotonnes per day in 2012 to 35–75 kilotonnes per day in 2020. The solar energy resource depends on the locations and areas of the country since the country with a larger area of land could generally have a higher solar energy resource. Therefore, Myanmar, with an approximate area of 677,000 square kilometres, accounts for approximately 2000 Terawatt-hour per year.
Nowadays, there are already several ways to handle biodegradable waste, such as composting, anaerobic digestion, and landfills with gas recovery systems. However, modern waste disposal methods, such as biodrying and biostabilization, are still in development. Therefore, a comparison of the major waste disposal methods for biodegradable waste is presented in Table 4.
In Myanmar, the majority of the cities are currently practicing a waste separation system involving two categories—bio-solid waste and biodegradable waste. Currently, 30 tonnes of organic waste are being treated by anaerobic digestion process in Mandalay, and 60 tonnes of mixed waste are being incinerated in Yangon city. However, the majority of the generated waste from the cities of Myanmar are disposed of at open dumpsites, making up approximately 85% of the total. There is also a reasonable amount of waste being illegally dumped, such as waste disposal at nearby streets, illegal dumpsites, open burning, streams, rivers, etc. As a result, there have been GHG emissions and leachate production that negatively affect the environment annually. Environmental issues are also closely related to public health issues, not only from the hygienic perspective, but also from the other important perspectives, such as spreading of diseases, water pollution, soil pollution, air pollution, etc. Therefore, the consequences of doing little or even nothing to address waste management could be very costly to society and the economy overall [47].
Figure 12 illustrates a sustainable approach to waste management in Myanmar. As a sustainable approach, biodegradable waste needs to be managed very well and considered as a significant issue of municipal solid waste management. Anaerobic digestion for the treatment of biodegradable wastes is significantly advantageous to biogas production. Similarly, the composting process, which is less costly and easy to operate locally, is also well-suited to the pre-treatment of biodegradable wastes and the production of compost for agriculture use. Moreover, as a pre-treatment option of the biodegradable wastes for a clean energy source, drying of biodegradable waste is also a possibility for reducing the moisture content of bulky waste and increasing the heating values of waste for incineration. The energy source for drying could be derived from solar energy or the waste heat disposed from the industries. If the quality of biodegradable waste could be improved, the improved raw materials could be efficiently utilized for waste-to-energy (combustion and biogas production) conversion, refuse-derived fuel, sanitization of wastes, and transport of the waste without any negative impacts on the health of the waste collectors. Since Myanmar has average solar radiation of approximately 18 Megajoules per square meter per day [48], it is reasonably suitable for drying of the biodegradable waste. In addition, waste heat could be applied for the drying process during the night or during the seasons with low solar radiation, such as the raining season. The amount of the biodegradable waste for the potential small drying units accounts for approximately 200 kg of biodegradable waste. The energy required for drying depends on the moisture content of the biomass, the available heat source, the sizes of the biomass materials, the types of dryer (such as direct, indirect, or combined), and the energy recovery option. The energy required to dry one kilogram of biodegradable waste is in the range of approximately 2000–5000 kilojoules per kilogram, assuming it to be similar to drying biomass with 50–60% moisture content [49].
However, there might be some drawbacks of using dryers, such as the costly design of the solar dryer, land use and storage for drying, and people’s perception of the odour coming from the drying process if it takes place near or inside the city. These drawbacks could be overcome if the local governments would conduct several surveys about land availability and people’s perceptions and cooperate with the local technological universities and research institutions for sustainable waste management solutions. Technological universities and research institutions could create locally available green technologies from laboratory and pilot scale to industrial scale. In addition, more research on the costs and benefits of drying for a waste fuel source should be conducted, regarding the available heat sources, different seasonal profiles, locally accessible technologies, different drying methods, and seasonal waste composition and properties, etc.
As the overall benefits, the drying process for the improvement of biodegradable waste quality by using solar radiation or waste heat could bring no “additional” cost of energy sources for drying and could reduce dependency on fossil fuels in developing countries. Besides, such a process could solve several issues related to the sanitization of biodegradable waste and the health risks of the waste workers or waste collectors, reduction of the transportation cost, and reduction of greenhouse gas emissions from the waste transportation sector, as well as the business-as-usual fossil fuel consumption.
6. Conclusions
Nowadays, the majority of waste disposal in Myanmar is by landfilling. Recycling and waste-to-energy technologies are in the development stage. To be able to utilize energy from waste, the study estimated the improvement of biodegradable waste quality by drying. The quantity of the reduced volume and weight of the biodegradable wastes with 100% moisture reduction were estimated at 5 million cubic meters per year and 2600 kilotonnes per year, respectively, in 2021. The greenhouse gas emissions in the current situation amounted to approximately 1500 and 1800 Gigagrams of CO2-eq per year in 2019 and 2021, respectively, while the greenhouse gas emission avoidance from a sustainable approach amounted to 3500 and 4000 Gigagrams of CO2-eq per year, respectively. Although waste-to-energy has become a type of renewable energy utilization, a quick transition from open dumping to costly waste-to-energy technologies might be hard in a developing country like Myanmar. However, a locally accessible sustainable approach to waste management, such as drying for optimization of biodegradable waste quality and utilizing improved waste for energy, could probably become a future method of creating a clean energy source from waste in the future of Myanmar and other developing countries.
Author Contributions
Conceptualization, D.J., M.M.T., H.R. and V.S.; Methodology, M.M.T., D.J., H.R. and V.S.; Resources, M.M.T.; Formal Analysis, M.M.T. and D.J.; Investigation, M.M.T., D.J. and H.R.; Supervision, D.J. and H.R.; Writing Original Draft Preparation, M.M.T.; Writing review & editing, M.M.T., D.J., H.R. and V.S.
Funding
The research was funded by the Ministry of Education, Youth and Sports of the Czech Republic and the project: CZ.02.1.01/0.0/0.0/ 16_019/0000753.
Acknowledgments
The author would like to express his special sincere gratitude to Ministry of Education, Youth and Sports of the Czech Republic and Ministry of Education of Myanmar for giving him an opportunity to study in the Czech Republic.
Conflicts of Interest
The authors declare no conflict of interest.
References
- Hwa, T.J. Overview of Solid-Waste Management in Asian Countries. Solid Waste Management, Issues and Challenges in Asia; Asian Productivity Organisation: Tokyo, Japan, 2007; pp. 3–7. ISBN 92-833-7058-9. [Google Scholar]
- Hoornweg, D.; Bhada-Tata, P. What a Waste: A Global Review of Solid Waste Management; Urban Development Series Knowledge Papers; The World Bank Group: Washington, DC, USA, 2012; pp. 1–98. [Google Scholar]
- Population 2012 Country Ranks, by Rank. March 2012. Available online: https://photius.com/rankings/population/population_2012_0.html (accessed on 11 October 2018).
- Tun, M.M.; Juchelková, D. Problems with Biodegradable Wastes—Potential in Myanmar and Other Asian Countries for Combination of Drying and Waste Incineration. In Proceedings of the IRRC Waste to Energy Conference, Vienna, Austria, 1–2 October 2018. [Google Scholar]
- Whiteman, A.; Gupta, S.K.; Briciu, C.; Bates, S. Collaborative Working Group: Solid Waste Management in Low- and Middle-Income Countries. Waste to Energy Rapid Assessment Tool. 2016, pp. 1–30. Available online: http://www.seas.columbia.edu/earth/wtert/sofos/CWG.PDF (accessed on 11 October 2018).
- Yuan, J.; Zhang, D.; Li, Y.; Chadwick, D.; Li, G.; Li, Y.; Du, L. Effects of adding bulking agents on biostabilization and drying of municipal solid waste. Waste Manag. 2017, 62, 52–60. [Google Scholar] [CrossRef] [PubMed]
- Ngoc, U.N.; Schnitzer, H. Sustainable solutions for solid waste management in Southeast Asian countries. Waste Manag. 2009, 29, 1982–1995. [Google Scholar] [CrossRef] [PubMed]
- El-Fadel, M.; Findikakis, A.N.; Leckie, J.O. Environmental impacts of solid waste landfilling. J. Environ. Manag. 1997, 50, 1–25. [Google Scholar] [CrossRef]
- Suat-Eam Tan, J. State of Waste Management in South East Asia; United Nations Environment Programme (UNEP): Nairobi, Kenya, 2004; pp. 1–53. ISBN 92-807-2272-7. [Google Scholar]
- Clean Development Mechanism (CDM). Feasibility Study, 2012. Final Report: Landfill Gas (LFG) Recovery and Utilization for Electric Power Generation; Mitsubishi UFJ Morgan Stanley Securities Co., Ltd.: Tokyo, Japan, 2012. [Google Scholar]
- El-Salam, M.M.A.; Abu-Zuid, G.I. Impact of landfill leachate on the groundwater quality: A case study in Egypt. J. Adv. Res. 2015, 6, 579–586. [Google Scholar] [CrossRef] [PubMed]
- Africa, P.S. Solid Waste Management in the World’s Cities. Solid Waste Management in the World’s Cities: Water and Sanitation in the World’s Cities; UN-Habitat: Nairobi, Kenya, 2010; ISBN 978-92-1-132218-7. [Google Scholar]
- Ferreira, A.G.; Gonçalves, L.M.; Maia, C.B. Solar drying of a solid waste from steel wire industry. Appl. Therm. Eng. 2014, 73, 104–110. [Google Scholar] [CrossRef]
- Lupa, C.J.; Ricketts, L.J.; Sweetman, A.; Herbert, B.M. The use of commercial and industrial waste in energy recovery systems—A UK preliminary study. Waste Manag. 2011, 31, 1759–1764. [Google Scholar] [CrossRef] [PubMed]
- El Haggar, S. Sustainable Industrial Design and Waste Management. Cradle-to-Cradle for Sustainable Development Hardbound; Academic Press: Cambridge, MA, USA, 2007; p. 424. [Google Scholar]
- Łukajtis, R.; Hołowacz, I.; Kucharska, K.; Glinka, M.; Rybarczyk, P.; Przyjazny, A.; Kamiński, M. Hydrogen production from biomass using dark fermentation. Renew. Sustain. Energy Rev. 2018, 91, 665–694. [Google Scholar] [CrossRef]
- Molino, A.; Larocca, V.; Chianese, S.; Musmarra, D. Biofuels production by biomass gasification: A review. Energies 2018, 11, 811. [Google Scholar] [CrossRef]
- Quina, M.J.; Bordado, J.M.; Quinta-Ferreira, R.M. Recycling of air pollution control residues from municipal solid waste incineration into lightweight aggregates. Waste Manag. 2014, 34, 430–438. [Google Scholar] [CrossRef] [PubMed]
- SAM, R. The Most Efficient Waste Management System in Europe: Waste-to-Energy in Denmark; RenoSam: Copenhagen, Demark, 2016. [Google Scholar]
- Ragazzi, M.; Rada, E.C.; Panaitescu, V.; Apostol, T. Municipal solid waste pre-treatment: A comparison between two dewatering options. WIT Trans. Ecol. Environ. 2007, 102. [Google Scholar] [CrossRef]
- Velis, C.A.; Longhurst, P.J.; Drew, G.H.; Smith, R.; Pollard, S.J. Biodrying for mechanical–biological treatment of wastes: A review of process science and engineering. Bioresour. Technol. 2009, 100, 2747–2761. [Google Scholar] [CrossRef] [PubMed] [Green Version]
- Tom, A.P.; Haridas, A.; Pawels, R. Biodrying process efficiency: Significance of reactor matrix height. Procedia Technol. 2016, 25, 130–137. [Google Scholar] [CrossRef]
- Mohammed, M.; Ozbay, I.; Karademir, A.; Isleyen, M. Pre-treatment and utilization of food waste as energy source by bio-drying process. Energy Procedia 2017, 128, 100–107. [Google Scholar] [CrossRef]
- Hii, C.L.; Jangam, S.V.; Ong, S.P.; Mujumdar, A.S. Solar Drying: Fundamentals, Applications and Innovations; TPR Group Publication: Singapore, 2012. [Google Scholar]
- Elnaas, A.; Belherazem, A.; Müller, W.; Nassour, A.; Nelles, M. Biodrying for mechanical biological treatment of mixed municipal solid waste and potential for RDF production. In Proceedings of the 3RD International Conference on Sustainable Solid Waste Management, Tinos, Greece, 2–4 July 2015. [Google Scholar]
- Verma, M.; Loha, C.; Sinha, A.N.; Chatterjee, P.K. Drying of biomass for utilising in co-firing with coal and its impact on environment—A review. Renew. Sustain. Energy Rev. 2017, 71, 732–741. [Google Scholar] [CrossRef]
- Trading Economics. Myanmar Population Forecast 2016–2020. Trading Economics. Myanmar Population Forecast 2016–2020; Trading Economics. 2017. Available online: https://tradingeconomics.com/myanmar/population/forecast (accessed on 3 October 2017).
- Mann, U.; Myint, O. Myanmar Participants. Community-Based 3 Rs Practices in Myanmar. Presentation Paper, Myanmar Day-1, Section 1. IGES. Available online: http://www.iges.or.jp/en/archive/wmr/pdf/.../6_Myanmar_Day1_Session2.pdf (accessed on 31 March 2017).
- Institute for Global Environmental Strategies (IGES). Commission Report: Supporting Low-Carbon Yangon city through Joint Crediting Mechanism (JCM) Project Formulation; IGES: Kamiyamaguchi, Japan, 2014. [Google Scholar]
- Menikpura, N.; Sustainable Consumption and Production (SCP) Group Institute for Global Environmental Strategies (IGES). Integrated Solid Waste Management: Towards low-carbon waste management in Yangon—Myanmar. In Proceedings of the International Workshop on Sustainable Waste Management, Yangon, Myanmar, 20 December 2013. [Google Scholar]
- Premakumara, D.G.J.; Hengesbaugh, M. Quick study on waste management in Myanmar: Current situation and key challenges. In Proceedings of the 1st National/City Workshops for Developing National/City Waste Management Strategies in Myanmar, Nay Pyi Taw & Mandalay, Myanmar, 13–17 June 2016. [Google Scholar]
- Mandal, P.; Dubey, B.K.; Gupta, A.K. Review on landfill leachate treatment by electrochemical oxidation: Drawbacks, challenges and future scope. Waste Manag. 2017, 69, 250–273. [Google Scholar] [CrossRef] [PubMed]
- Molino, A.; Migliori, M.; Blasi, A.; Davoli, M.; Marino, T.; Chianese, S.; Catizzone, E.; Giordano, G. Municipal waste leachate conversion via catalytic supercritical water gasification process. Fuel 2017, 206, 155–161. [Google Scholar] [CrossRef]
- Messenger, B. JFE Engineering to Build First Waste to Energy Plant Myanmar; JFE Holdings, Inc.: Tokyo, Japan, 2015. [Google Scholar]
- Tun, M.M.; Juchelková, D. Assessment of solid waste generation and greenhouse gas emission potential in Yangon city, Myanmar. J. Mater. Cycles Waste Manag. 2018, 20, 1397–1408. [Google Scholar] [CrossRef]
- Tun, M.M.; Juchelková, D. Towards Sustainable Waste Management in Myanmar through Experiences of Other Asian Countries: A Review; Myanmar: Environmental, Political and Social Issues; Nova Science Publishers, Inc.: New York, NY, USA, 2018; in press. [Google Scholar]
- Thein, M. Member of GHG inventory and Mitigation group, Initial National Communication Project for UNFCCC, Myanmar: GHG emissions from waste sector of INC of Myanmar. In Proceedings of the 8th Workshop on GHG Inventories in Asia (WGIA8), Vientiane, Laos, 13–16 July 2010. [Google Scholar]
- Tun, M.M. Estimation of solid waste quality for thermal waste treatment in Yangon. Waste Manag. 2018, 72, 1–3. [Google Scholar]
- Tun, M.M.; Juchelková, D. Evaluation of biodegradable waste quality by drying for exploring the possibilities of a potential renewable energy source in Yangon city, Myanmar. Int. J. Renew. Energy Res. 2018, in press. [Google Scholar]
- Kreith, F. Waste to Energy Combustion. In Handbook of Solid Waste Management, 2nd ed.; Tchobanoglous, G., Kreith, F., Eds.; McGraw-Hill: New York, NY, USA, 2002; pp. 1–176. [Google Scholar]
- Menikpura, N.; Sang-Arun, J. User Manual: Estimation Tool for Greenhouse Gas (GHG) Emissions from Municipal Solid Waste (MSW) Management in a Life Cycle Perspective; Institute for Global Environmental Strategies: Kamiyamaguchi, Japan, 2013. [Google Scholar]
- IPCC. Good Practice Guidance and Uncertainty Management in National Greenhouse Gas Inventories. CH4 Emission from Solid Waste Disposal. Available online: http://www.ipcc-nggip.iges.or.jp/public/gp/bgp/5_1_CH4_Solid_Waste.pdf (accessed on 27 March 2017).
- Ministry of Industry and Commerce of the Czech Republic. Decree on Energy Audits and Energy Review; Ministry of Industry and Commerce of the Czech Republic: Prague, Czech Republic, 2016. [Google Scholar]
- Department of Energy, National Renewable Energy Laboratory. Solar Resources by Class and Country; Department of Energy, National Renewable Energy Laboratory: Washington, DC, USA, 2017.
- Zafar, S. Comparison of Different Waste-to-Energy Processes. Connecting Energy with Environment, Clean Energy Solutions. September 2011. Available online: https://cleantechsolutions.wordpress.com/2011/09/24/comparison-of-different-waste-to-energy-processes/ (accessed on 3 October 2018).
- Environmental Protection Agency. East Bay Municipal Utility District. United States, Final Report; Environmental Protection Agency: Washington, DC, USA, 2008.
- Wilson, D.C.; Carpintero, A. Waste Management as a Political Priority. In Global Waste Management Outlook; UNEP: Nairobi, Kenya, 2015; pp. 1–16. ISBN 978-92-807-3479-9. [Google Scholar]
- Tun, M.M. An overview of renewable energy sources and their energy potential for sustainable development in Myanmar. Eur. J. Sustain. Dev. 2018. [Google Scholar] [CrossRef]
- Fagernäs, L.; Brammer, J.; Wilén, C.; Lauer, M.; Verhoeff, F. Drying of biomass for second generation synfuel production. Biomass Bioenergy 2010, 34, 1267–1277. [Google Scholar] [CrossRef]
Figure 1.
Total population and solid waste generation in the selected developing Asian countries during 2012–2025 [2,3].

Figure 2.
Comparison of waste composition, collection efficiency and per capita waste generation in Asian developing countries [2,4].

Figure 3.
The contribution of biodegradable wastes in the total solid waste generation in Myanmar. Note: The contribution of biodegradable wastes in the total solid waste generation was estimated based on the World Bank 2012 Report, regarding the waste composition and the total solid waste generation of Myanmar. The data were considered only until 2021, since waste composition may change with the development of the economy and living standards of people in Myanmar.

Figure 4.
Comparison of waste disposal methods by percentage of daily treated municipal solid waste (MSW) by weight in Myanmar [7,31].

Figure 5.
Effect of moisture reduction on (a) weight reduction, (b) volume reduction, and (c) heating value increase of the biodegradable waste samples.
Figure 5.
Effect of moisture reduction on (a) weight reduction, (b) volume reduction, and (c) heating value increase of the biodegradable waste samples.


Figure 6.
The total estimated weight of the biodegradable wastes before and after moisture reduction.
Figure 6.
The total estimated weight of the biodegradable wastes before and after moisture reduction.

Figure 7.
The total estimated volume of biodegradable wastes before and after moisture reduction. Standard deviation for the volume of the biodegradable wastes is ±18%; MCR: Moisture reduction.
Figure 7.
The total estimated volume of biodegradable wastes before and after moisture reduction. Standard deviation for the volume of the biodegradable wastes is ±18%; MCR: Moisture reduction.

Figure 8.
Estimated energy resources from the biodegradable wastes and fossil fuel savings. Standard deviation of the energy resources from the biodegradable wastes is ±20%.
Figure 8.
Estimated energy resources from the biodegradable wastes and fossil fuel savings. Standard deviation of the energy resources from the biodegradable wastes is ±20%.

Figure 9.
Total estimated greenhouse gas (GHG) emissions from biodegradable waste disposal in the current situation of Myanmar.
Figure 9.
Total estimated greenhouse gas (GHG) emissions from biodegradable waste disposal in the current situation of Myanmar.

Figure 10.
Comparison of GHG emission/avoidance from the waste disposal of biodegradable waste between the current situation and a sustainable approach to waste management in Myanmar.
Figure 10.
Comparison of GHG emission/avoidance from the waste disposal of biodegradable waste between the current situation and a sustainable approach to waste management in Myanmar.

Figure 11.
Projected biodegradable waste generation and solar energy resources in Asian developing countries [2,44].

Figure 12.
A sustainable approach to waste management for a sustainable energy system in Myanmar: (new) refers to the proposed pretreatment/waste disposal methods.
Figure 12.
A sustainable approach to waste management for a sustainable energy system in Myanmar: (new) refers to the proposed pretreatment/waste disposal methods.


Table 1.
The properties of the biodegradable waste samples of Myanmar.
| Description | Quantity |
|---|---|
| Number of samples | 12 |
| Total amount of each sample (g) | 500 |
| Composition ratio (Food wastes: Green leaves/Garden wastes) | 80:20 |
| Density (kg/m3) | 274 ± 50 |
| Moisture content (%) | 80 ± 4 |
| LHV (MJ/kg) | 4 ± 1 |
LHV: lower heating value.
Table 2.
Properties of the biodegradable waste samples of Myanmar before and after drying at 105 °C for 5 h.
Table 2.
Properties of the biodegradable waste samples of Myanmar before and after drying at 105 °C for 5 h.
| Sample No. | Biodegradable Waste Properties | ||||||||
|---|---|---|---|---|---|---|---|---|---|
| Initial Mass (g) | Final Mass (g) | Mass Reduction (%) | Initial Volume (10−6 m3) | Final Volume (10−6 m3) | Initial Moisture (%) | Final Moisture (%) | Initial LHV (MJ/kg) | Final LHV (MJ/kg) | |
| 1 | 500 | 110 | 78 | 1100 | 500 | 82.00 | 4.00 | 3.15 | 16.80 |
| 2 | 500 | 166 | 67 | 1800 | 1300 | 79.11 | 15.20 | 3.66 | 14.84 |
| 3 | 500 | 145 | 71 | 1850 | 1050 | 83.15 | 11.00 | 2.95 | 15.58 |
| 4 | 500 | 144 | 71 | 1550 | 1100 | 71.20 | 10.80 | 5.04 | 15.61 |
| 5 | 500 | 182 | 64 | 1700 | 1300 | 77.42 | 18.40 | 3.95 | 14.28 |
| 6 | 500 | 224 | 55 | 1300 | 900 | 84.73 | 26.80 | 2.67 | 12.81 |
| 7 | 500 | 250 | 50 | 2000 | 1800 | 81.96 | 32.00 | 3.16 | 11.90 |
| 8 | 500 | 157 | 69 | 1800 | 900 | 79.11 | 13.40 | 3.66 | 15.16 |
| 9 | 500 | 206 | 59 | 2350 | 1300 | 80.00 | 21.20 | 3.50 | 13.79 |
| 10 | 500 | 180 | 64 | 1675 | 900 | 73.73 | 9.63 | 4.60 | 15.81 |
| 11 | 500 | 129 | 74 | 2500 | 1500 | 85.44 | 11.24 | 2.55 | 15.53 |
| 12 | 500 | 131 | 74 | 2288 | 1375 | 79.44 | 5.58 | 3.60 | 16.52 |
| 500 ± 0 | 169 ± 42 | 66 ± 8 | 1826 ± 8 | 1160 ± 342 | 80 ± 4 | 15 ± 8 | 4 ± 1 | 15 ± 1 | |
LHV: lower heating value.
Table 3.
The values of correlation, sample size, and p values of different variables related to moisture reduction.
Table 3.
The values of correlation, sample size, and p values of different variables related to moisture reduction.
| Description | Weight Reduction | Volume Reduction | Heating Value Increase | |
|---|---|---|---|---|
| Moisture Reduction | Correlation Coefficient | 0.99 | 0.87 | 0.94 |
| Sample Size | 12 | 12 | 12 | |
| p value | 0.00000 | 0.00021 | 0.00000 |
| Waste Disposal Methods | Types of Wastes Treated | Separation Work | Waste Disposal Cost (USD per tonne) | Energy Potential (kWh per tonne) | Possibility of Resource Recovery | Working Skills and Technologies | Economic Benefits (Viewed from Benefits of the Environment and Public Health) | GHG Emissions/Leachate Production | GHG Avoidance | Environmental Impact |
|---|---|---|---|---|---|---|---|---|---|---|
| Incineration | Mixed MSW (Biodegradable Wastes + Other Combustible Wastes) | Needed | 40–200 [2] | 585 | Yes | Highly needed | High |
|
| Comparatively lower |
| Anaerobic Digestion | Food wastes/Green leaves (Biodegradable Wastes) | Highly needed | 20–150 [2] | 730–1300 (for dry ton of food waste) | Yes | Highly needed | High |
|
| Comparatively lower |
| Composting | Food wastes/Green leaves (Biodegradable Wastes) | Highly needed | 5–90 [2] | - | Yes | Needed | High |
|
| Comparatively lower |
| Landfilling | Mixed MSW (Biodegradable Wastes + Others) | No needed | 10–100 [2] | 105 | No | Needed | High |
|
| High |
| Open Dumping | Mixed MSW (Biodegradable Wastes + Others) | No needed | 2–10 [2] | - | No | No needed | Low |
| - | Very high |
Note: Waste disposal cost might vary with the country groups: developing countries and developed countries. The values in the table were collected from two groups of these countries.
© 2018 by the authors. Licensee MDPI, Basel, Switzerland. This article is an open access article distributed under the terms and conditions of the Creative Commons Attribution (CC BY) license (http://creativecommons.org/licenses/by/4.0/).
Share and Cite
MDPI and ACS Style
Tun, M.M.; Juchelková, D.; Raclavská, H.; Sassmanová, V. Utilization of Biodegradable Wastes as a Clean Energy Source in the Developing Countries: A Case Study in Myanmar. Energies 2018, 11, 3183. https://doi.org/10.3390/en11113183
AMA Style
Tun MM, Juchelková D, Raclavská H, Sassmanová V. Utilization of Biodegradable Wastes as a Clean Energy Source in the Developing Countries: A Case Study in Myanmar. Energies. 2018; 11(11):3183. https://doi.org/10.3390/en11113183
Chicago/Turabian StyleTun, Maw Maw, Dagmar Juchelková, Helena Raclavská, and Veronika Sassmanová. 2018. "Utilization of Biodegradable Wastes as a Clean Energy Source in the Developing Countries: A Case Study in Myanmar" Energies 11, no. 11: 3183. https://doi.org/10.3390/en11113183
Note that from the first issue of 2016, this journal uses article numbers instead of page numbers. See further details here.