A Feasibility Study on Power Generation from Solar Thermal Wind Tower: Inclusive Impact Assessment Concerning Environmental and Economic Costs


Department of Systems Design for Ocean-Space, Graduate School of Engineering Science, Yokohama National University, 79-5 Tokiwadai, Hodogaya, Yokohama, Kanagawa 240-8501, Japan
*
Authors to whom correspondence should be addressed.
Energies 2018, 11(11), 3181; https://doi.org/10.3390/en11113181
Submission received: 30 September 2018
/
Revised: 31 October 2018
/
Accepted: 14 November 2018
/
Published: 16 November 2018
(This article belongs to the Special Issue Latest Renewable Energy Research Output 2018—Select papers from International Conference on Renewable Energy —ICREN 2018)
Abstract
:A solar thermal wind tower (STWT) is a low-temperature power generation plant that mimics the wind cycle in nature, comprising a flat plate solar air collector and central updraft tower to produce thermal wind that drives turbines to generate electricity. The development of power generation systems toward a sustainable future needs to be made taking into account the balance between environmental impact and economic feasibility. We examine the sustainability of STWT power generation technology using the inclusive impact index light (Triple I-light), which estimates whether it is good to do the project, including both the negative environmental impact and the economic aspect. Environmental disadvantages are discussed by performing a CO2 inventory analysis for the life-cycle of the STWT power plant. Evaluation of the economic feasibility is done by calculating the levelized electricity cost (LEC), which is the cost per unit of electricity generated. From the calculations, it is found that overall system efficiency is increased by enlarging the capacity, the negative environmental impact by the STWT plant comes mainly from manufacturing stage (more than 60%), and the levelized electricity cost is dramatically decreased by enlarging the capacity of the system (about 50% reduction). A negative value of Triple I (meaning it is sustainable) can be achieved for high power generation capacity (above 100 MW). Moreover, this paper discusses the implementation and the potential of constructing offshore STWTs.
1. Introduction
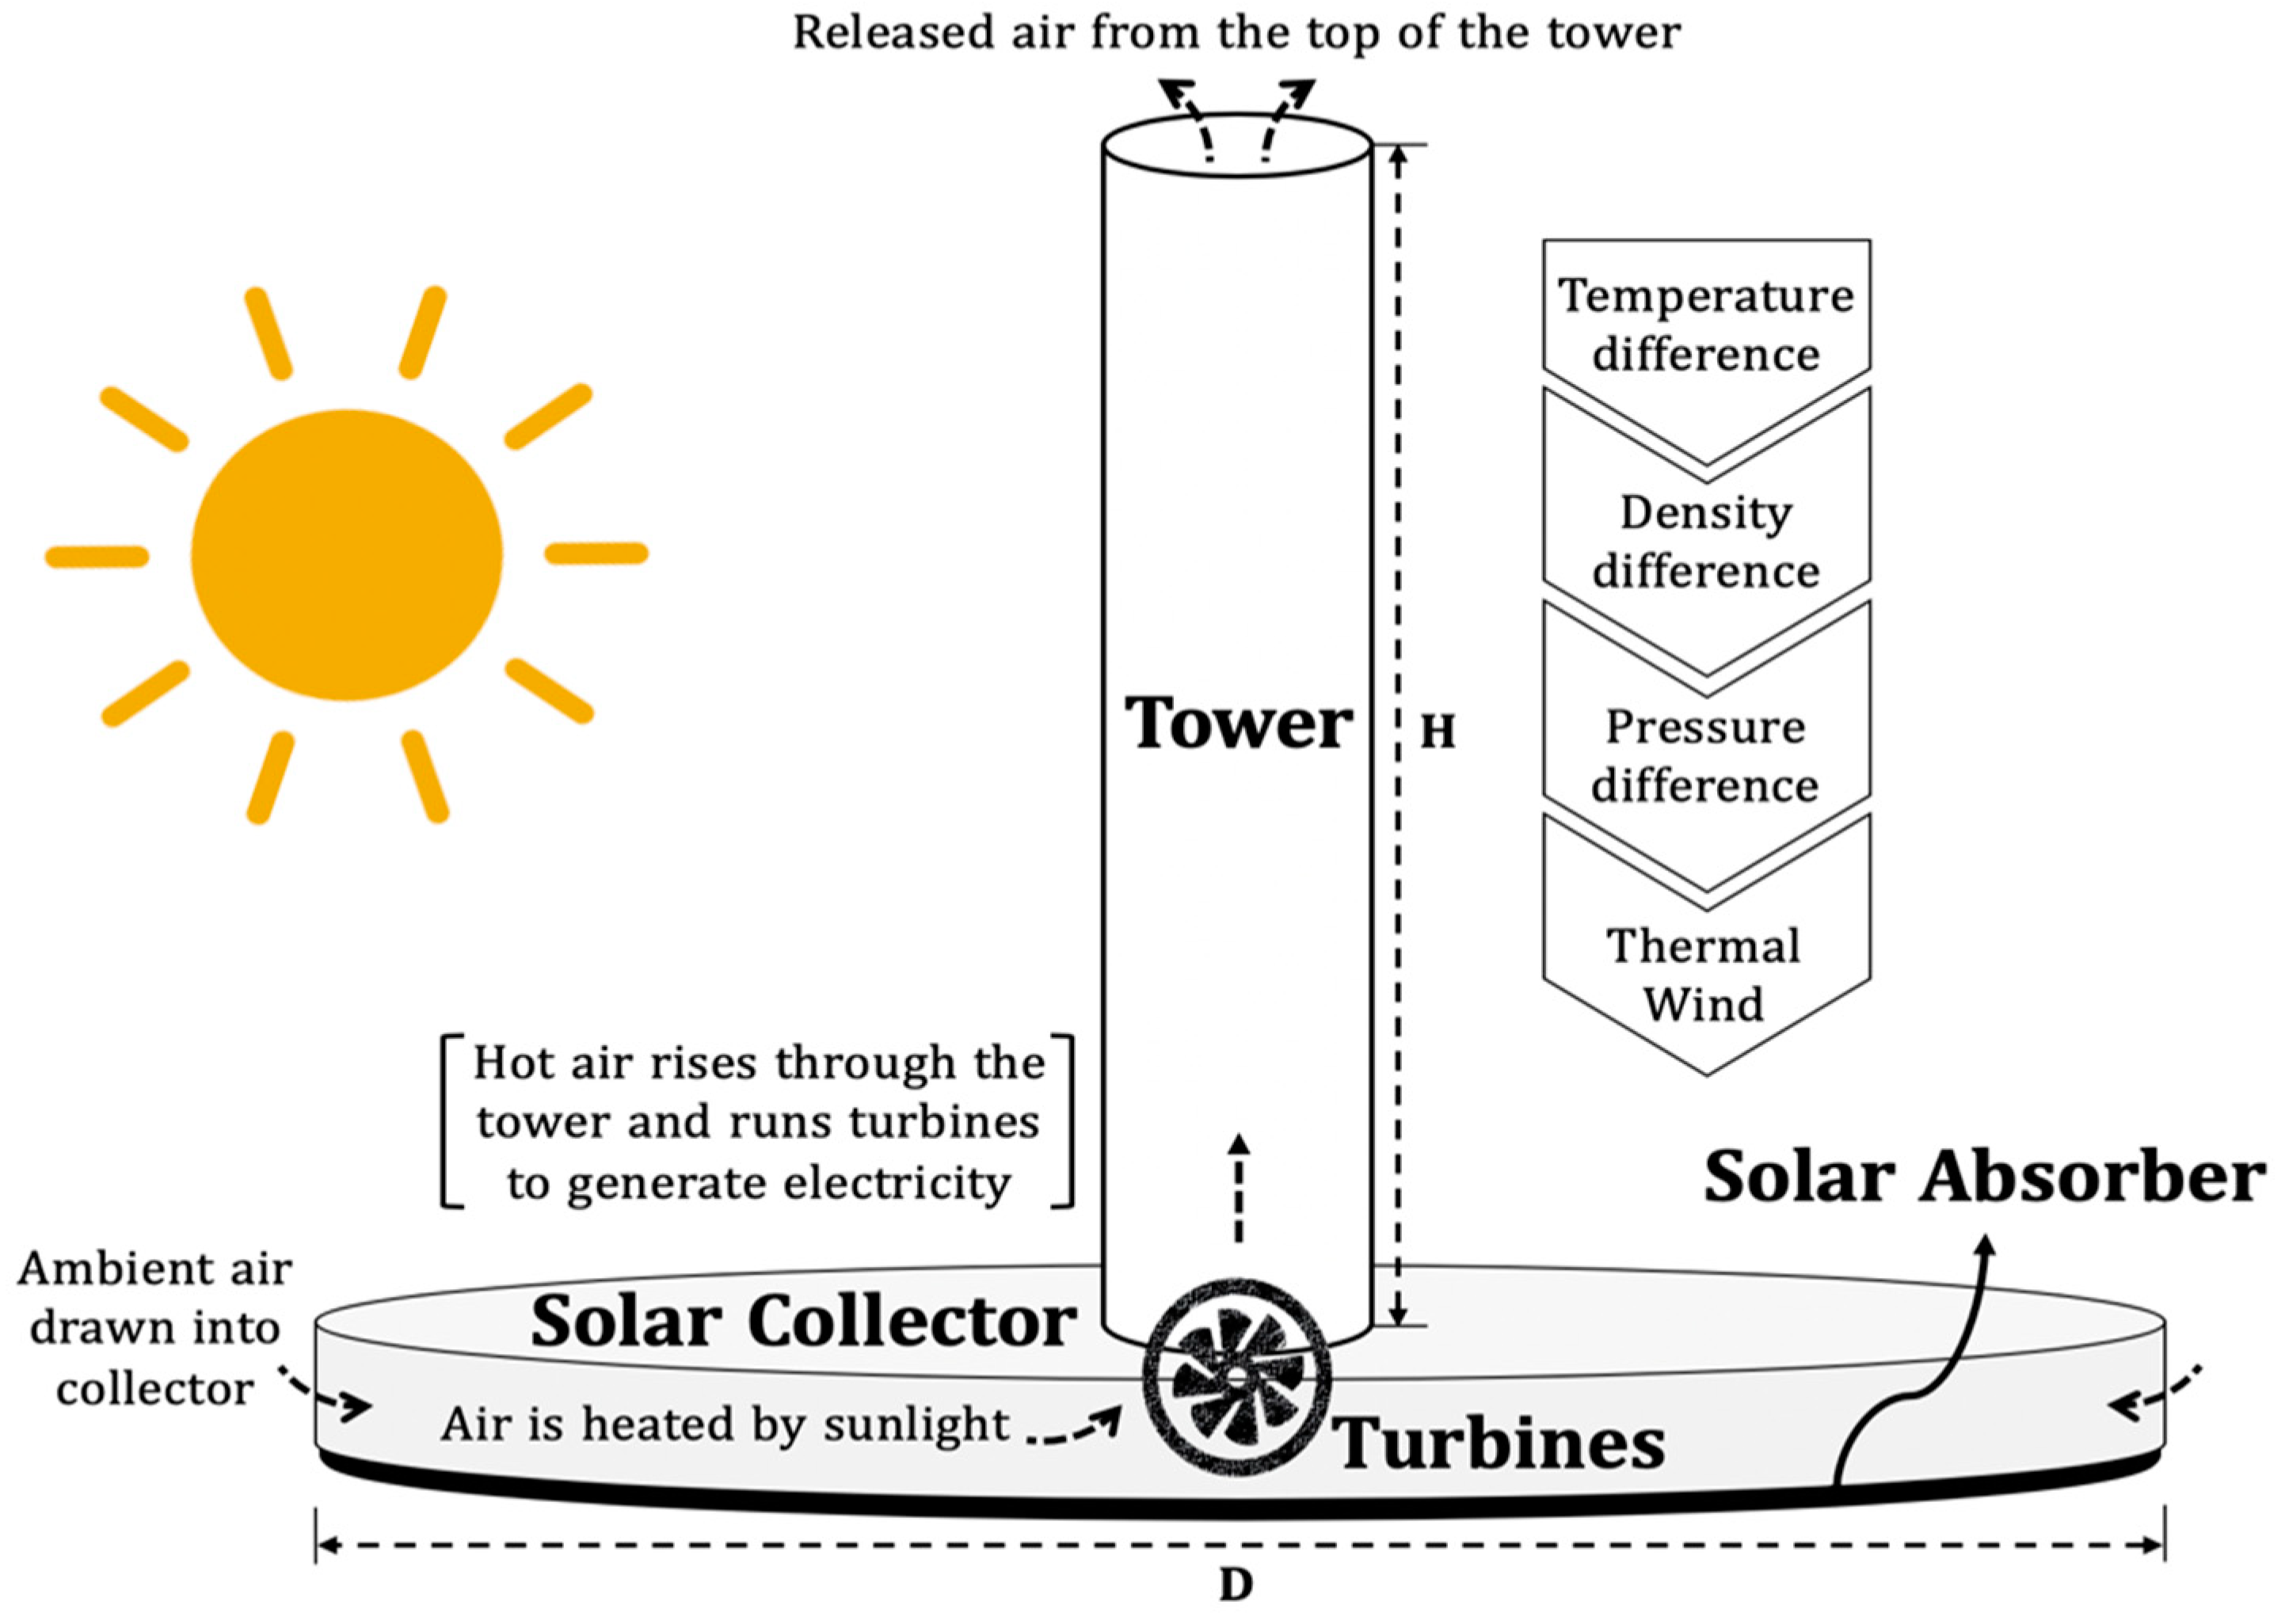
The utilization of renewable and sustainable energy is nowadays attracting more attention due to the serious energy crisis together with the global appeal for a sustainable future. With this intension, this study addresses one of the promising technologies for acquiring renewable energy, which is the solar thermal wind tower (STWT, also commonly known as a solar updraft tower or solar chimney). It generates power available for our consumption, using the sun as the main source of energy and the air as the working fluid. Many areas worldwide suffer from severe water shortage and, therefore, it is not feasible to construct large-scale power systems using water as a working fluid and/or water as a cooling fluid. Recently, plenty of information has become available about this technology (Figure 1); it is considered to be low temperature solar energy technology, using only air as working fluid, and thus can be driven without phase change. No water demand, no working mediums, and no cooling equipment device are needed in the operation process, and power can be generated round the clock with low cost, providing this technology with an added advantage over other renewable energy technologies [1,2,3,4,5]. The EnviroMission project is now under construction in Australia for producing the required energy for about 150,000 typical American households, enabling us to offset one million tons of greenhouse gases per year, and to save up to one billion gallons of cooling water associated with traditional power and solar thermal generation plants [6].
In addition, STWT system materials are very convenient based on environmentally sound production from renewable or recyclable materials. This technology has fewer running components, resulting in more convenient maintenance and lower maintenance expenses, meaning that this technology is accessible to many places, even the technologically less-developed countries [3].
On the other hand, it is the fact that the overall energy conversion efficiency of the STWT plant is so low that the plant has to demand a very wide space for producing a sufficient amount of energy [1,2,3,4,5]. The size of the plant for large scale STWT power generation system (height of the tower and the diameter of the collector) becomes really considerable; the capital cost of the power plant cannot be underestimated, and an investment for this technology might be risky for investors.
This study evaluates the power-generating capacity of the STWT power plants from the environmental and economic viewpoints and compares them with other kinds of power generation technologies. It is true that although the STWT is considered to be one of the cleanest energy power plant technologies, the construction of it may affect the environment through the CO2 emissions [7,8,9,10]. On the other side, it is of importance for investors and companies to measure the cost and profit of the energy production in order to figure out whether their economic operation is sustainable.
The development of any power generation technology towards a sustainable future depends on the balance between environmental impact and economic feasibility. This study examines the sustainability of STWT power generation technology using the inclusive impact index light (Triple I-light) [11,12]. It estimates whether the STWT project is good from the environmental and economic viewpoints. In the evaluation of environmental influence, a CO2 inventory analysis for the life-cycle is made for the STWT power plant. In the evaluation of the cost, a levelized electricity cost (LEC), which is the cost per unit of electricity generated [1,13], is calculated. Different types of power generation plants can be compared in terms of LEC.
The simplicity of the geometry of STWT is attracting this study to go forward and discuss the implementation of constructing offshore an STWT system. The ocean counts for 71% of the earth’s surface, and more than 40% of world’s population lives within 100 km of coast; therefore, the potential out of the success of such offshore platform is giving us no limit of growth in different ways.
2. Methodology
The approach of this study is divided into four consecutive steps. The first step is the calculations of the output power and the overall system efficiency for four different generating capacities. Using the output data from the first step, the environmental disadvantages aspect and evaluation of economic feasibility are discussed in the second and third steps, respectively. In the fourth step, the inclusive impact index light (Triple I-light) for each generating capacity of the selected STWT systems is calculated, thereby judging the sustainability for the different generating capacities.
2.1. STWT Design Principles and Output Power
In nature, the updraft effect causes wind and hurricanes. The ocean gets warmer because of sunlight radiation and warms up the air above it. Henceforth, air that is down near the ground is usually warmer than air further up in the sky. The hot air floats up through the cold air, and once the hot air gets high up, it cools down and sinks back down to the ground again. This cycle is what we call the updraft effect. STWT mimics nature’s wind cycle using the sun as the main source of energy and the air as the working fluid, utilizing a combination of a flat plate and a central tower to produce thermal winds that drives turbines to generate electricity. Air is heated by the greenhouse effect in the solar collector. The hot air produced is lighter than ambient cold air at the top of the tower, thus, the hot air rises up the tower. In other words, the density difference of the air caused by the temperature rise in the collector is converted to a pressure difference, generating a fluid flow (thermal wind).
2.1.1. Physical Model of STWT
A simplified analytical model for the thermodynamics of the STWT was proposed [2,5]. Following the previous model, the electrical power output and overall system performance are assumed in this study to be directly proportional to the collector area and the tower height, together with the respective efficiencies of collector, tower, and turbines. Figure 2 depicts air flow at several points within a STWT.
● Collector
Inputted solar energy to the collector () and efficiency of the collector () to convert the solar energy into available energy for driving air flow inside the collector, are written as Equations (1) and (2), respectively:
where I is the solar radiation, is collector area (), is the useful heat gain to the air flow with a mass flow rate , is specific heat of air at constant pressure, and denotes the resulting temperature rise inside the collector between ambient and collector outlet.
● Tower
The density difference between the hot air at the base of the tower (collector outlet) and the ambient cold air at the top of the tower over the height of the tower yields the pressure difference as:
where is the gravity, H is the tower height, and and are the densities of the ambient air and the air inside the tower, respectively. Equation (4) states that the total pressure difference is composed of static and dynamic components.
The tower converts the collected thermal energy into potential energy and kinetic energy of the air. The kinetic energy drops at turbines for power generation, and the potential energy is required for airflow to lift in the tower. The total power () contained in the airflow can be calculated as the total pressure difference produced multiplied by the volume flow rate of air, as follows:
Without turbines, the whole pressure difference could be used to accelerate the air and a maximum airflow speed () could be achieved, meaning that whole pressure difference is converted into kinetic energy. The maximum airflow speed can be expressed using Equation (6):
Accordingly, the efficiency of the tower can be expressed as follows:
where is ambient temperature. The above equation neglects the loss of energy in the tower, which is a reasonable assumption for a tower of diameter greater than 1/20 of its height [5].
● Turbines and Output Power
The produced airflow turns the turbines to generate the electricity. The electrical power output () depends on the available solar power, geometry of the STWT system (dimensions of collector and tower), efficiency of collector, and efficiency of the turbines, which can be calculated as follows:
2.1.2. Parameters
Parameters of each generating capacity of the STWT are quoted from References [1,2]. The other parameters used in this study, I and , are set to be 1540 kWh/(m2·year) and 296.6 K, respectively, which are typical in Japan. and are assumed to be 70% and 64%, respectively [5]. and Cp are taken as 9.81 m/s2 and 1000 J/(kg·K), respectively. The number of the typical households that can be powered by the output energy from each generating capacity, is estimated assuming a 15 kWh daily consumption for a household of five residents [13].
2.2. Environmental Impact: Life-Cycle Assessment
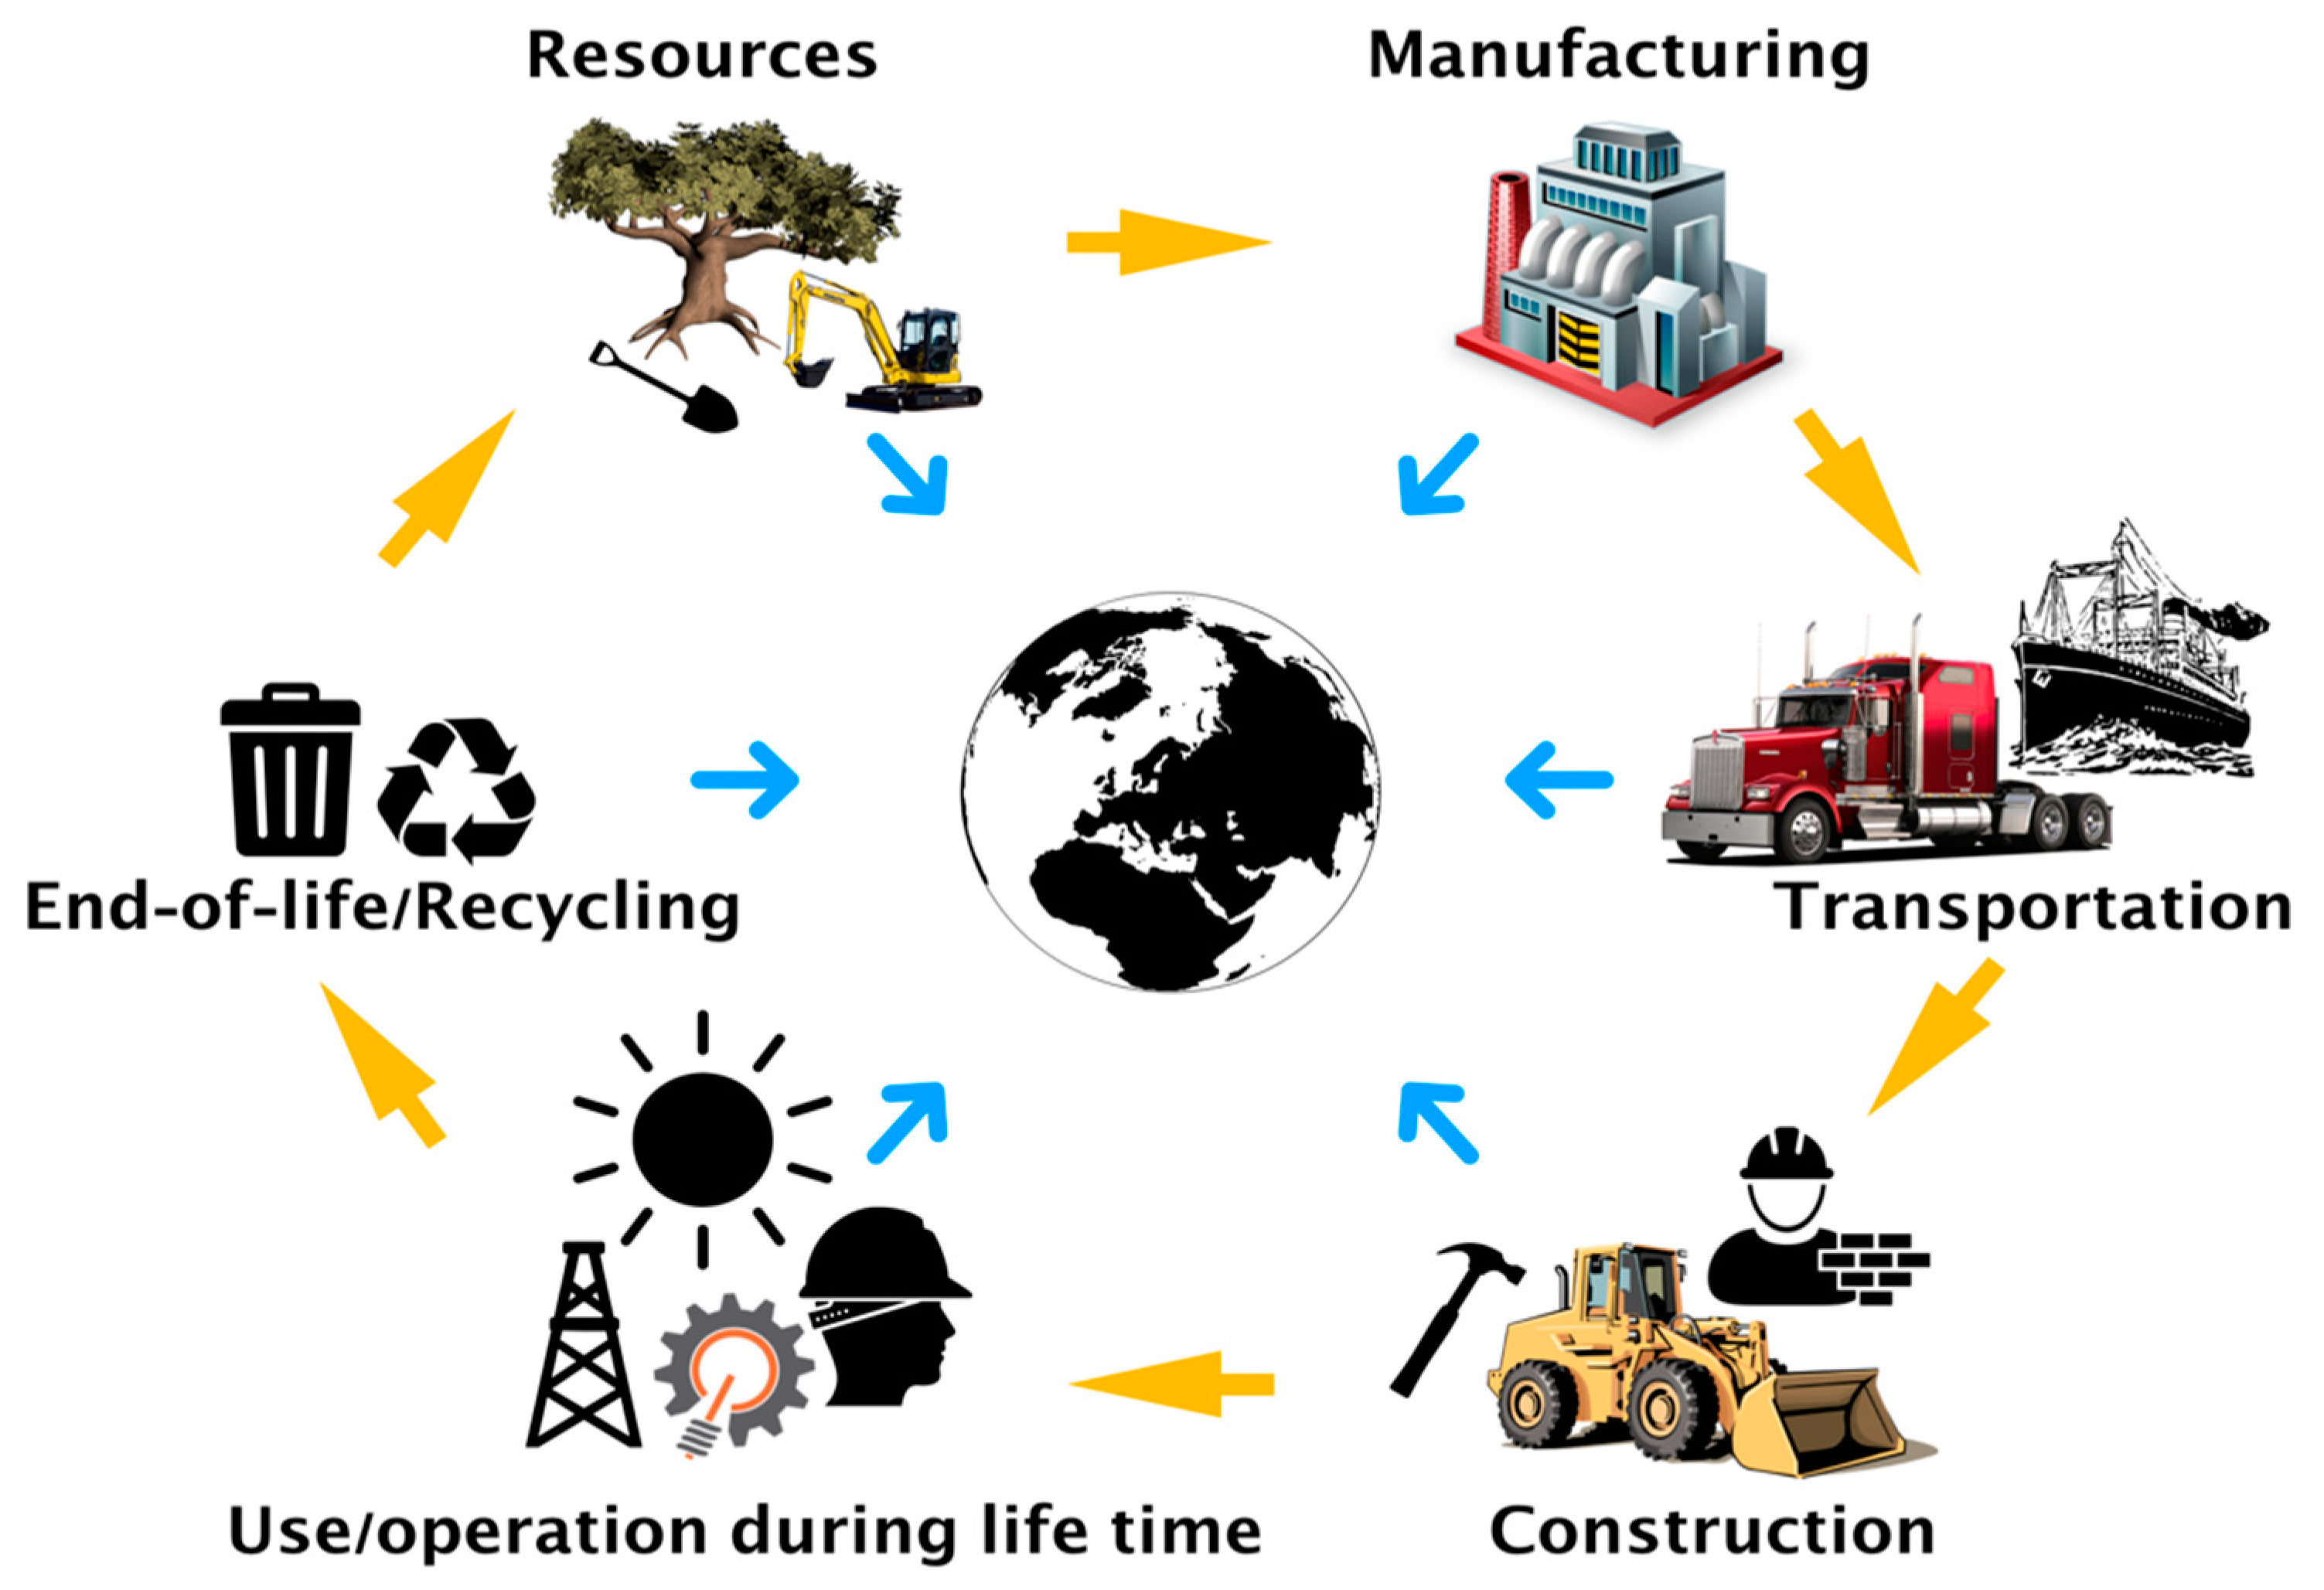
This study considers environmental disadvantages through performing a CO2 inventory analysis for the life-cycle of STWT power plant. In the analysis, we divide the life-cycle into manufacturing, transportation, construction, and operation, and maintenance stages (Figure 3). At each stage, we calculate the amount of CO2 emissions from a variety of processes in each stage, such as the use of materials and energy, the use of land and water, and so on.
2.2.1. Materials and Weight Distribution
We consider the proportions of materials and the weight distributions of each part of the selected STWT power plants in the following manner.
● Tower
The shell wall of the tower was made of high-performance reinforced concrete C50/60 or C70/85 [7,14]. The thickness of the wall increased by one millimeter per one cubic meter increase in tower height [13]. The total weight of the tower was calculated using the volume of the tower and the unit weight of the reinforced concrete (RC) (24 kN/m3, [15]).
● Collector
The material of the collector was glass. The total weight of it was calculated using the area of the collector, the thickness of glass (4 mm), and the density of the glass (2580 kg/m3).
● Turbines
Sixteen horizontal axis turbines are placed at the periphery of the transitional area between collector canopy and tower [7,14]. The diameter of each turbine was assumed to be 29 m (blade 14.5 m); the weight distributions and the proportions of the material of each turbine were assumed to be same as those of the wind turbine with the same size [11] (Appendix A).
The weight distributions of each part of the selected solar chimney systems are listed in Table 1.
2.2.2. Carbon Footprint
● Tower Manufacturing Stage
The material of the tower was reinforcing concrete (RC), which is used in the building industry. CO2 emissions arose mainly from cement production, which accounts for 2–3% of human-generated CO2 emission, and for 0.5% of total energy consumption [16]. The carbon footprint of RC can be measured in terms of embodied carbon (EC), which is defined as the amount of CO2 produced over a defined part of the life-cycle of the product. The EC in RC varies over a wide range (0.07–0.52 kgCO2/kg) depending on the mix design, compressive strength grade, structural form, and load capacity. Although it is thus difficult to specify a single value of EC [8], the EC of reinforced concrete was assumed in this study to be 0.3 kgCO2/kg (Table 2).
● Collector Manufacturing Stage
The material of the collector is glass. In this stage, CO2 emissions take place due to the energy consumption during the acquisition of the raw material of the glass, manufacturing process, and transportation, and due to non-energy-consuming processes in the manufacturing. When a material is recycled, it is used in place of virgin inputs in manufacturing process, rather than being disposed of and managed as waste. The emission factors are thus affected by the mix of virgin and recycled inputs used for the glass manufacturing process [10]. The CO2 emission factor for glass was considered in this study to be 0.53 (tCO2/ton) based on the current mix of inputs for glass manufacturing, together with total weight of the collector. The calculated total CO2 emissions in the manufacturing stage are listed Table 2.
● Turbine Manufacturing Stage
The CO2 emissions in the manufacturing stage of turbines were calculated using Equation (10) [11]. The CO2 emission factor of materials and the ratio of the material weights are shown in the Appendix A. The calculated total CO2 emissions in the manufacturing stage of turbines are listed in Table 2.
● Transportation Stage
Transportation of raw materials and bulk components also emits CO2. Table 3 shows the transportation of 1 kg of material over 1 km of distance [9]. The transportation distance was assumed to be 1300 km, which is equivalent to the distance between Nagasaki and Tokyo, together with the factor of 100 × 10−6 [kgCO2/(kg·km)] (assuming the use of a lorry). The calculated total CO2 emissions in the transportation stage are listed in Table 4.
● Construction Stage
CO2 emissions by the construction stage is in proportion to the dimensions of each parts of the structure. Referring to Reference [11], the CO2 emissions by the construction stage of STWT system was assumed to be 6% of the total amount of CO2 emissions by the manufacturing stage (Table 4).
● Operation and Maintenance Stage During Lifetime
Works for the operation and maintenance during the lifetime of STWT systems are required mainly for the turbines because they are the only one moving part in the system. Therefore, STWT systems use the same manner of operation and maintenance as the wind turbine power generations. CO2 emissions for one year in this stage was assumed to be 2% of the emissions in the manufacturing and transportation stages [11]. The intended design service life of commercial STWT power plant ranges from 80 to 120 years [13]; the lifetime of the STWT was assumed to be 40 years (Table 4).
2.3. Economic Aspect: Levelized Electricity Cost
The cost for the power generation includes initial capital costs, fuel costs, and operation and maintenance (O&M) costs. Different types of power generation plants can be compared in terms of the levelized electricity cost (LEC), which is the cost per unit of electricity generated.
2.3.1. Investment Cost
Investment for building the STWT system incurs an initial capital cost as well as annual operation and maintenance costs. In this study, an approximated cost model for building the STWT power generation system was applied [13].
● Initial Capital Cost
The initial capital cost of the STWT system is divided into three main elements; tower cost (), collector cost (), and turbine cost (), which are expressed, respectively, as follows:
where, and denote the tower diameter and height, respectively. represents the specific capital cost for material and construction. is the collector diameter. Equation (12) presumes that the base cost of the collector per unit area corresponds to percent of plus an additional percent for every one-meter height of the collector inlet. Equation (13) presumes that the cost of turbines equals percent of the capital cost of the tower and collector.
● Operation and Maintenance Cost
The annual operation and maintenance cost, (), is percent of the total capital costs of tower, collector and turbine, is expressed in Equation (14):
In the present calculations, costs of energy storage, land, and electricity transmission to consumers are not considered.
2.3.2. Levelized Electricity Cost
The LEC of STWT power generation systems are calculated using Equation (15) [17]:
where is the total capital cost (), R is the capital recovery factor, is the operation and maintenance cost, and AEP is the STWT annual energy production.
The capital recovery factor, R, is calculated as,
where, r is the annual interest rate, n is the number of years in which investment in the system to be recovered (or the lifetime of the system). The annual interest rate (r) was assumed to be 6% [11].
2.3.3. Parameters
The parameter was assumed to be 250 €/m3 including the costs of materials (cement, aggregate, sand, and steel reinforcement), labor, water, transportation, and miscellaneous. , , and were assumed to be 8%, 8%, and 10%, respectively. The height of the collector inlet was assumed to be 6 m. The percentage of the annual operation and maintenance cost is assumed to be 0.5% of the total capital cost. Life time of the system n was assumed to be 40 years Those assumptions are based on Reference [13].
2.4. Inclusive Impact: Triple I and Ecological Footprint
Through ecological footprint (EF) analysis [18], we can estimate the capacity of the earth to produce the resources consumed by the human activity and to absorb the wastes. EFs for each generating capacity of STWT system are computed by considering plant manufacture, transportation, the use of the plant, and the land area of the plant.
The development of power generation systems towards a sustainable society will be determined by the balance between environmental impact and economic feasibility. The sustainability of STWT power generation technology is evaluated using Inclusive Impact Index (Triple I) [11,12]. “Triple I” incorporates EF as an environmental impact index, with monetary value as an economic index (LEC in this study), into a single parameter. By computing “Triple I,” whether is good to do the project or not to do can be judged, taking into account both negative environmental impact and economic aspect. A negative value of the index means that this project is sustainable.
2.4.1. Ecological Footprint
Biocapacity means the existing biologically productive area capable of regenerating the natural resources consumed by human and of absorbing the wastes generated. Biologically productive area means the land and water area where natural resources can be produced in the form of food, fiber and timber [19]. EF measures how much bioproductive area is appropriated for human use. It is given in units of global hectares (gha): one gha represents one hectare of biologically productive area on the earth with world average productivity in a given year (hectare = 104 m2). In 2012, the earth’s total biocapacity was 12.2 billion gha, while humanity’s ecological footprint was 20.1 billion gha. The latter exceeds the former, meaning that the contiuation of this overshoot situation will bring global ecosystems at serious risk of degradation or collapse [19].
The ecological footprint accounts are spread across six categories of use—cropland footprint, grazing land footprint, fishing grounds footprint, forest product footprint, built-up land footprint, and carbon footprint—while forest land satisfies two demand categories: forest products and carbon absorption [19].
The ecological footprint is estimated using the total amount of consumed resources and/or generated wastes, yield factors of land types produce that resources or absorbs that wastes, and the appropriate equivalence factor to express the total demand in global hectares; accordingly, biocapacity is included in the EF.
● EF by CO2 emissions
The CO2 emissions during life-cycle of STWT system is converted to the forest area required to absorb these emissions. The yield factor of the amount of CO2 absorbed in the forest is 5.2 tCO2/(ha·year) [11].
● EF concerning use of Land
The EF required for accommodating infrastructure of the system is calculated by converting the total area of the STWT power generation plant (which is mainly the area of the collector) to hectares. The land use of the system is then converted to gha by using the equivalent factor of built-up area.
2.4.2. Inclusive Impact Assessment Index (Triple I-light)
This study adopts the “Inclusive Impact Index-light” [12]. The “Triple I-light” denoted by IIIlight is formulated as follows:
where EF denotes ecological footprint, and C and B denote the cost and benefit, respectively. GDP is the gross domestic product, and “∑EF/∑GDP” is the coefficient for converting the unit from the currency to the ecological footprint for a target country. The transaction prices of Japan in 2003 were 0.085–0.155 US$/kWh [11]. The sales price was assumed to be 0.15 US$/kWh in this study. As for the ∑EF/∑GDP coefficient, the value of Japan in 2005 was 1.25 × 10⁻⁴ gha/US$ [11].
A small value of means that the system has a small damage on the environment, and a negative value indicates the technology is sustainable. Therefore, it is possible to evaluate comprehensively environmental and economic aspects.
3. Results and Discussion
3.1. Calculations of Output Power and System Efficiency
As shown in Table 5, the output power and overall efficiency were calculated for four power-generating capacities.
3.2. Carbon Footprint
The total amounts of the CO2 emissions for the life-cycles of the four capacities were calculated (Figure 4). Most of the CO2 was emitted in the manufacturing stage. If the CO2 emissions in the manufacturing stage can be lessened, the negative environmental impact of the STWT plant can be mitigated. Most of CO2 emissions in the manufacturing stage arose from manufacturing the tower and collector (Table 2). The CO2 emissions by the plant operation and by the maintenance of the plant for its lifetime was caused chiefly by the presence of the turbines. The employment of durable turbines will efficiently decrease CO2 emissions in the operation and maintenance stage.
3.3. Levelized Electricity Cost
Calculated LEC of the selected STWT power generation systems are listed in Table 6.
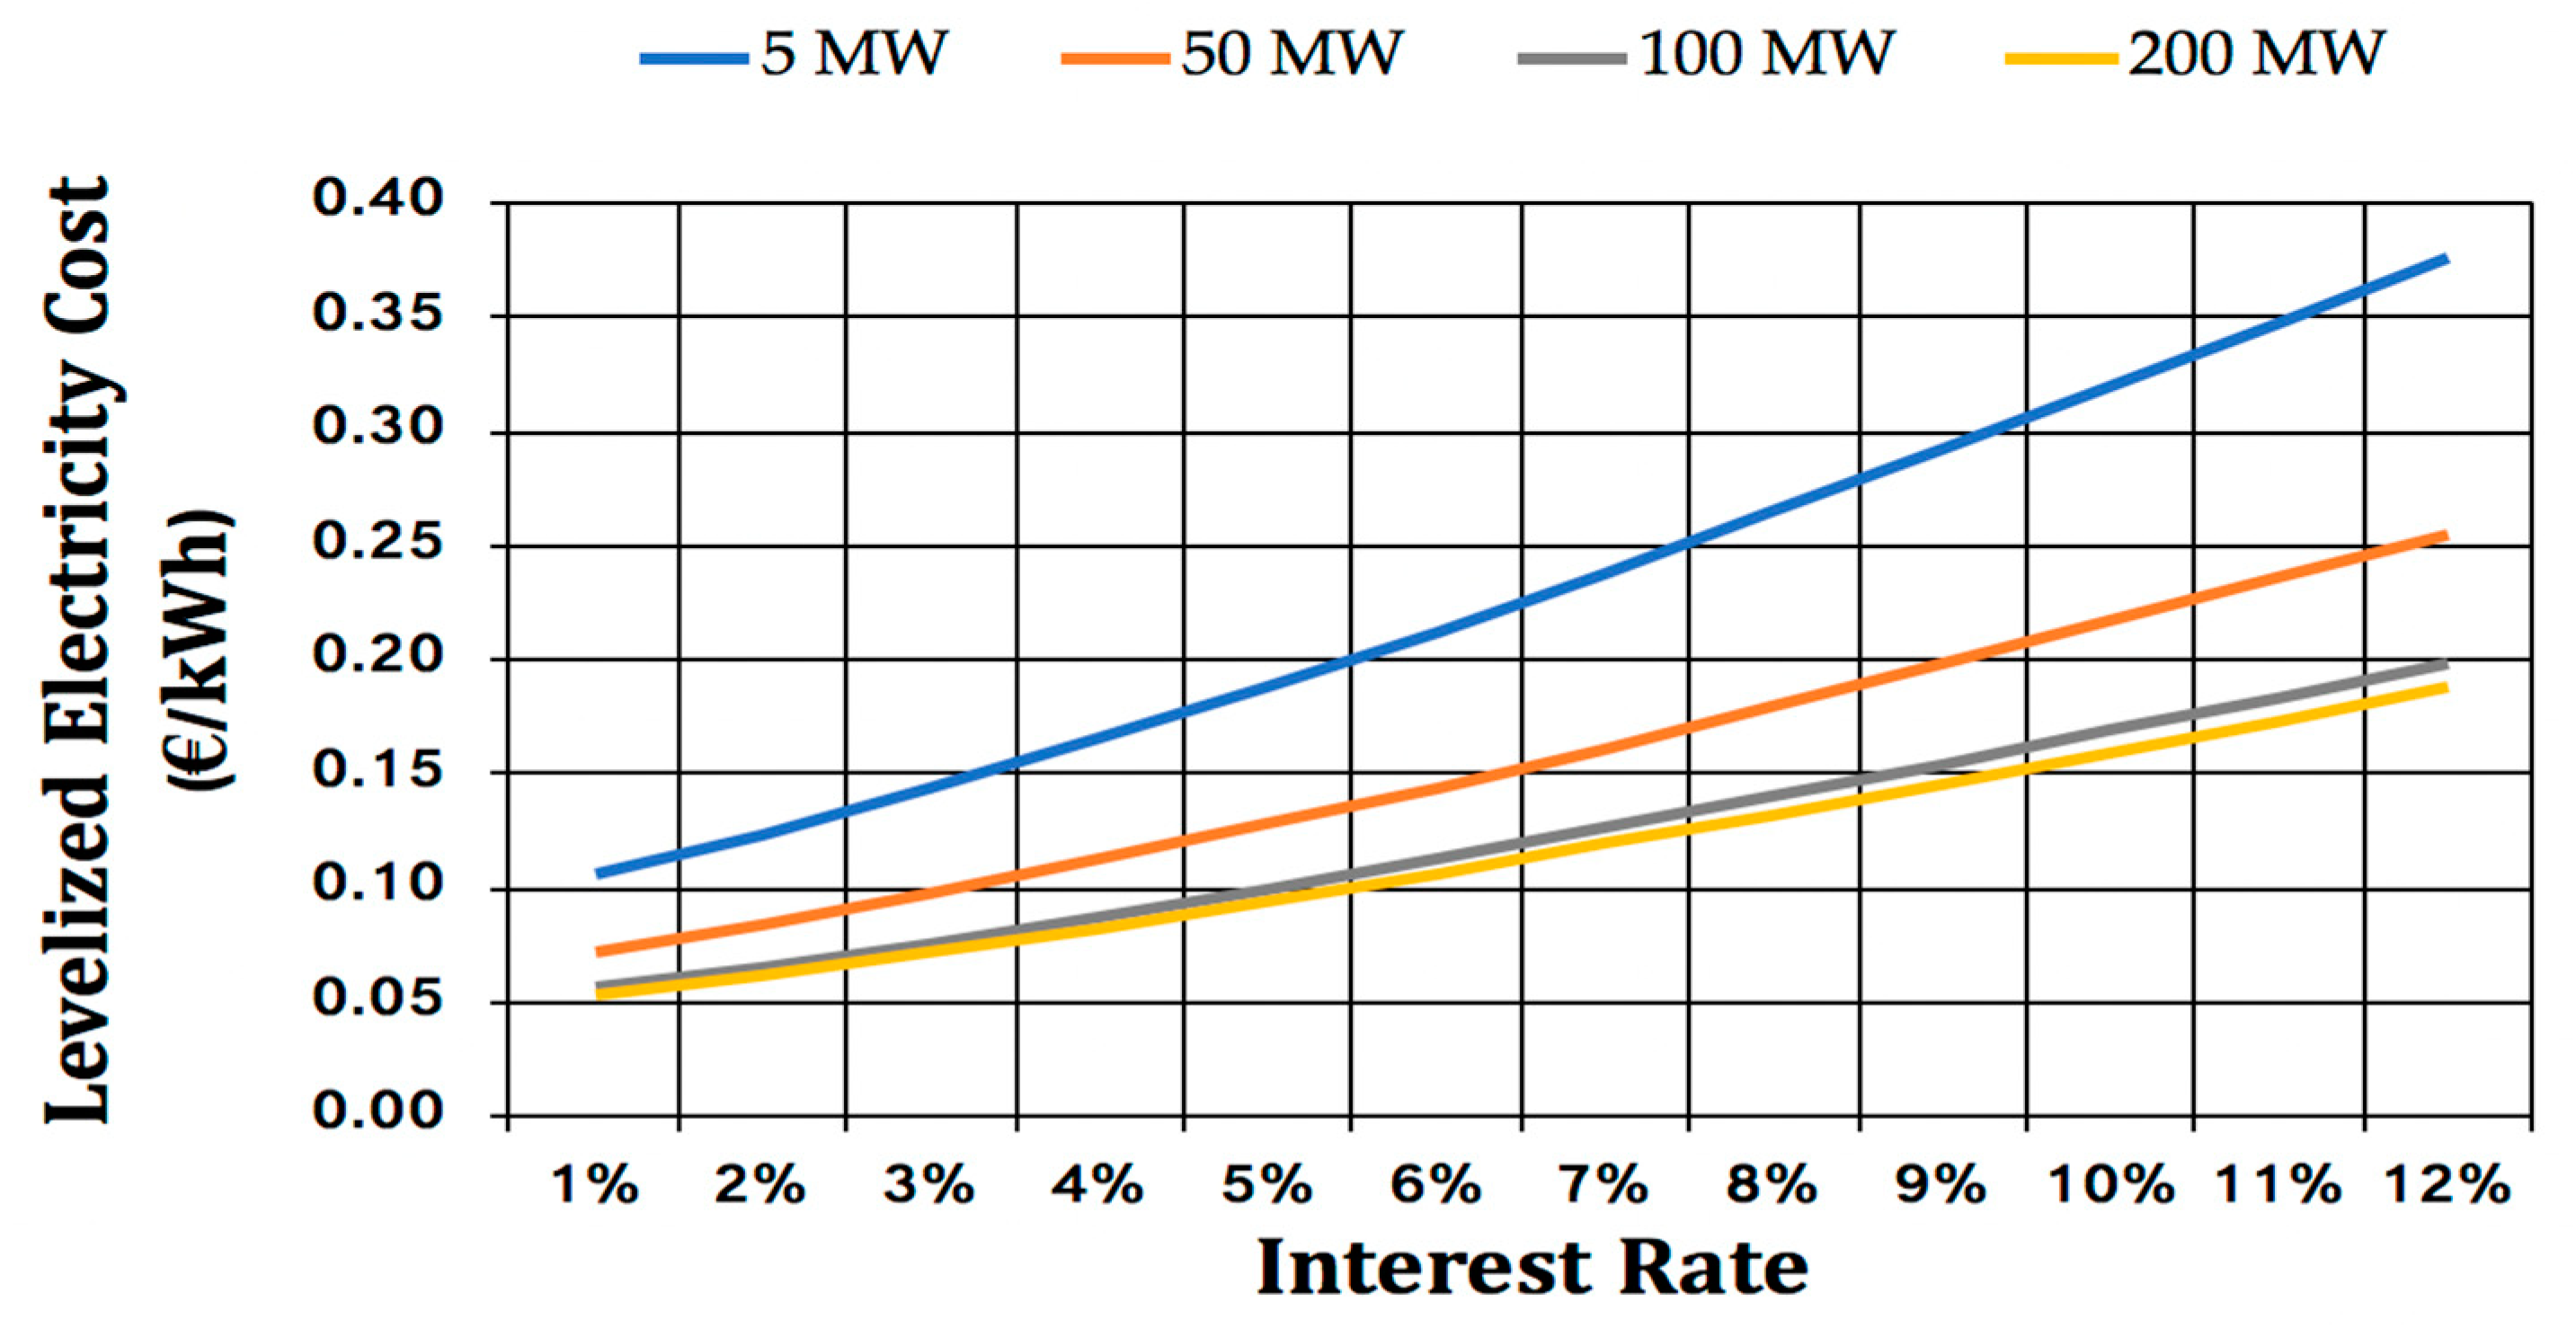
LEC against different annual interest rates are plotted in Figure 5.
The collector had a major impact on the total capital cost of the STWT systems, accordingly having the major impact on the cost of the output energy generated (LEC). For a 200 MW STWT plant, the total capital cost accounts for 93% of the LEC, while the cost for the collector accounts for 87% of the total capital cost, which corresponds to 80% of the LEC.
3.4. Ecological Footprint and Triple I Indexes
3.4.1. Total EF in the Life Cycle of the STWT System
After the total amount of CO2 emissions during the life-cycle, and the land use of STWT system are converted to gha, the total EFs of each generating capacity of STWT were calculated (Figure 6).
3.4.2. Triple I Index
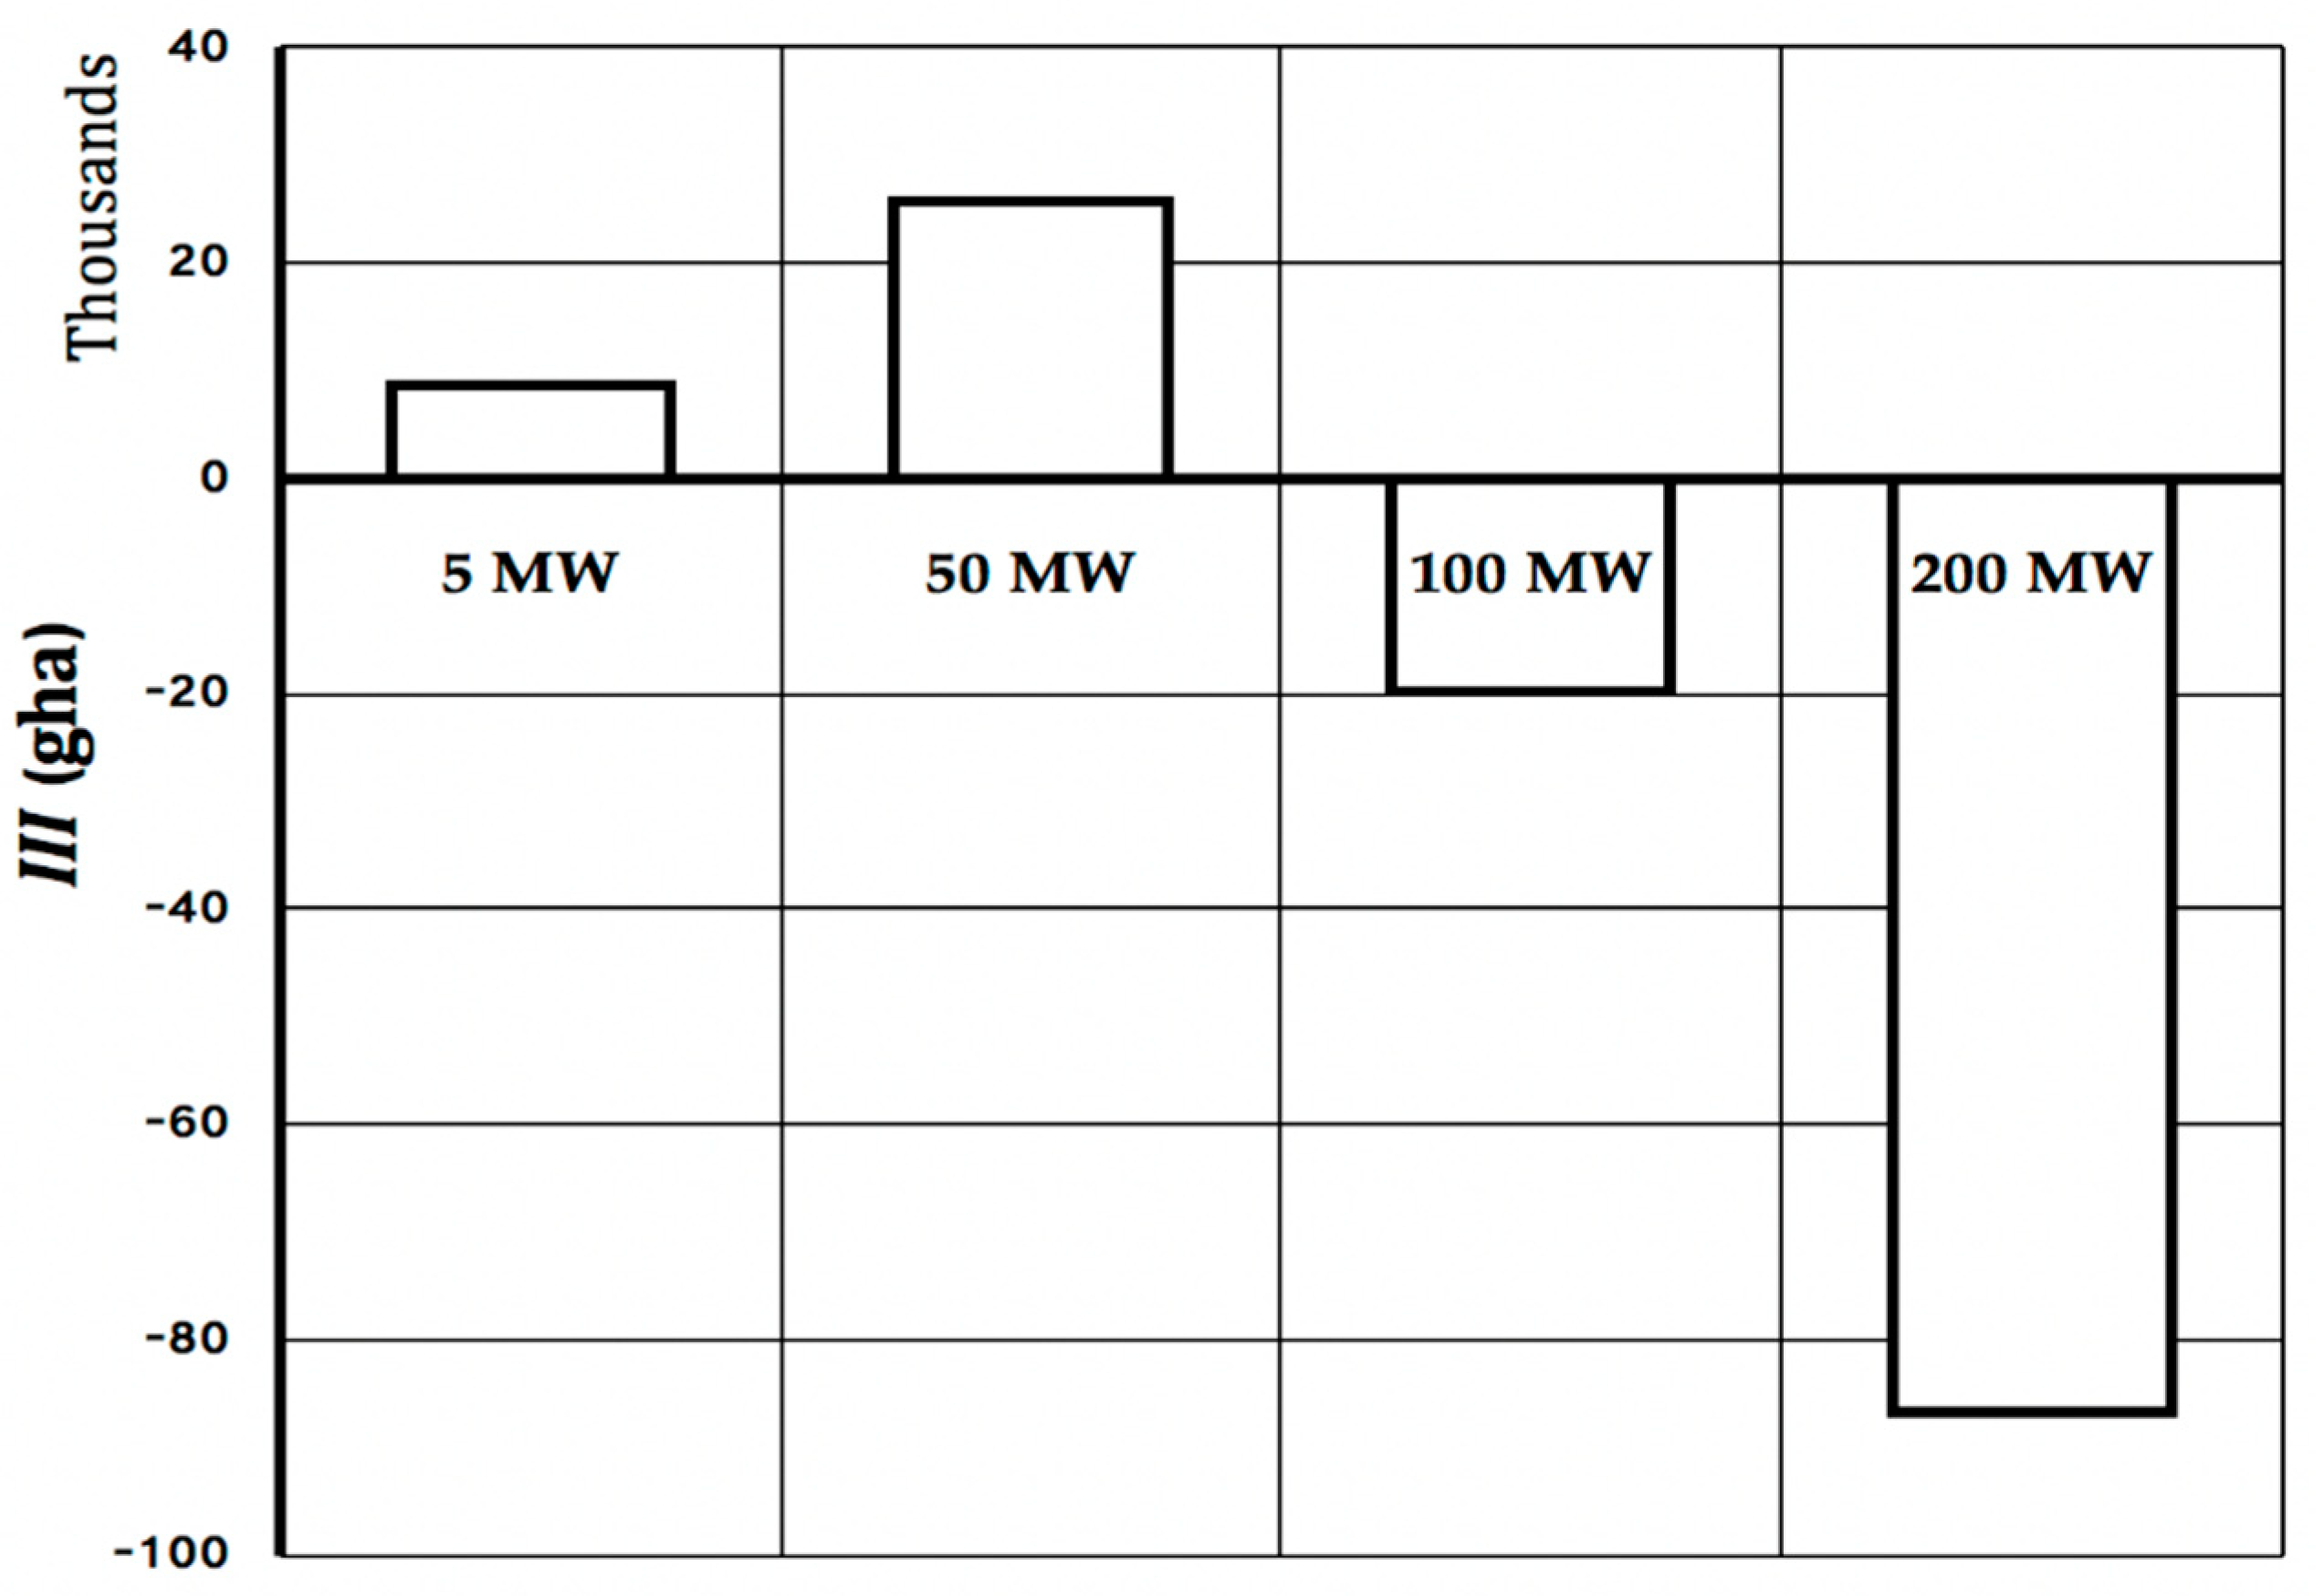
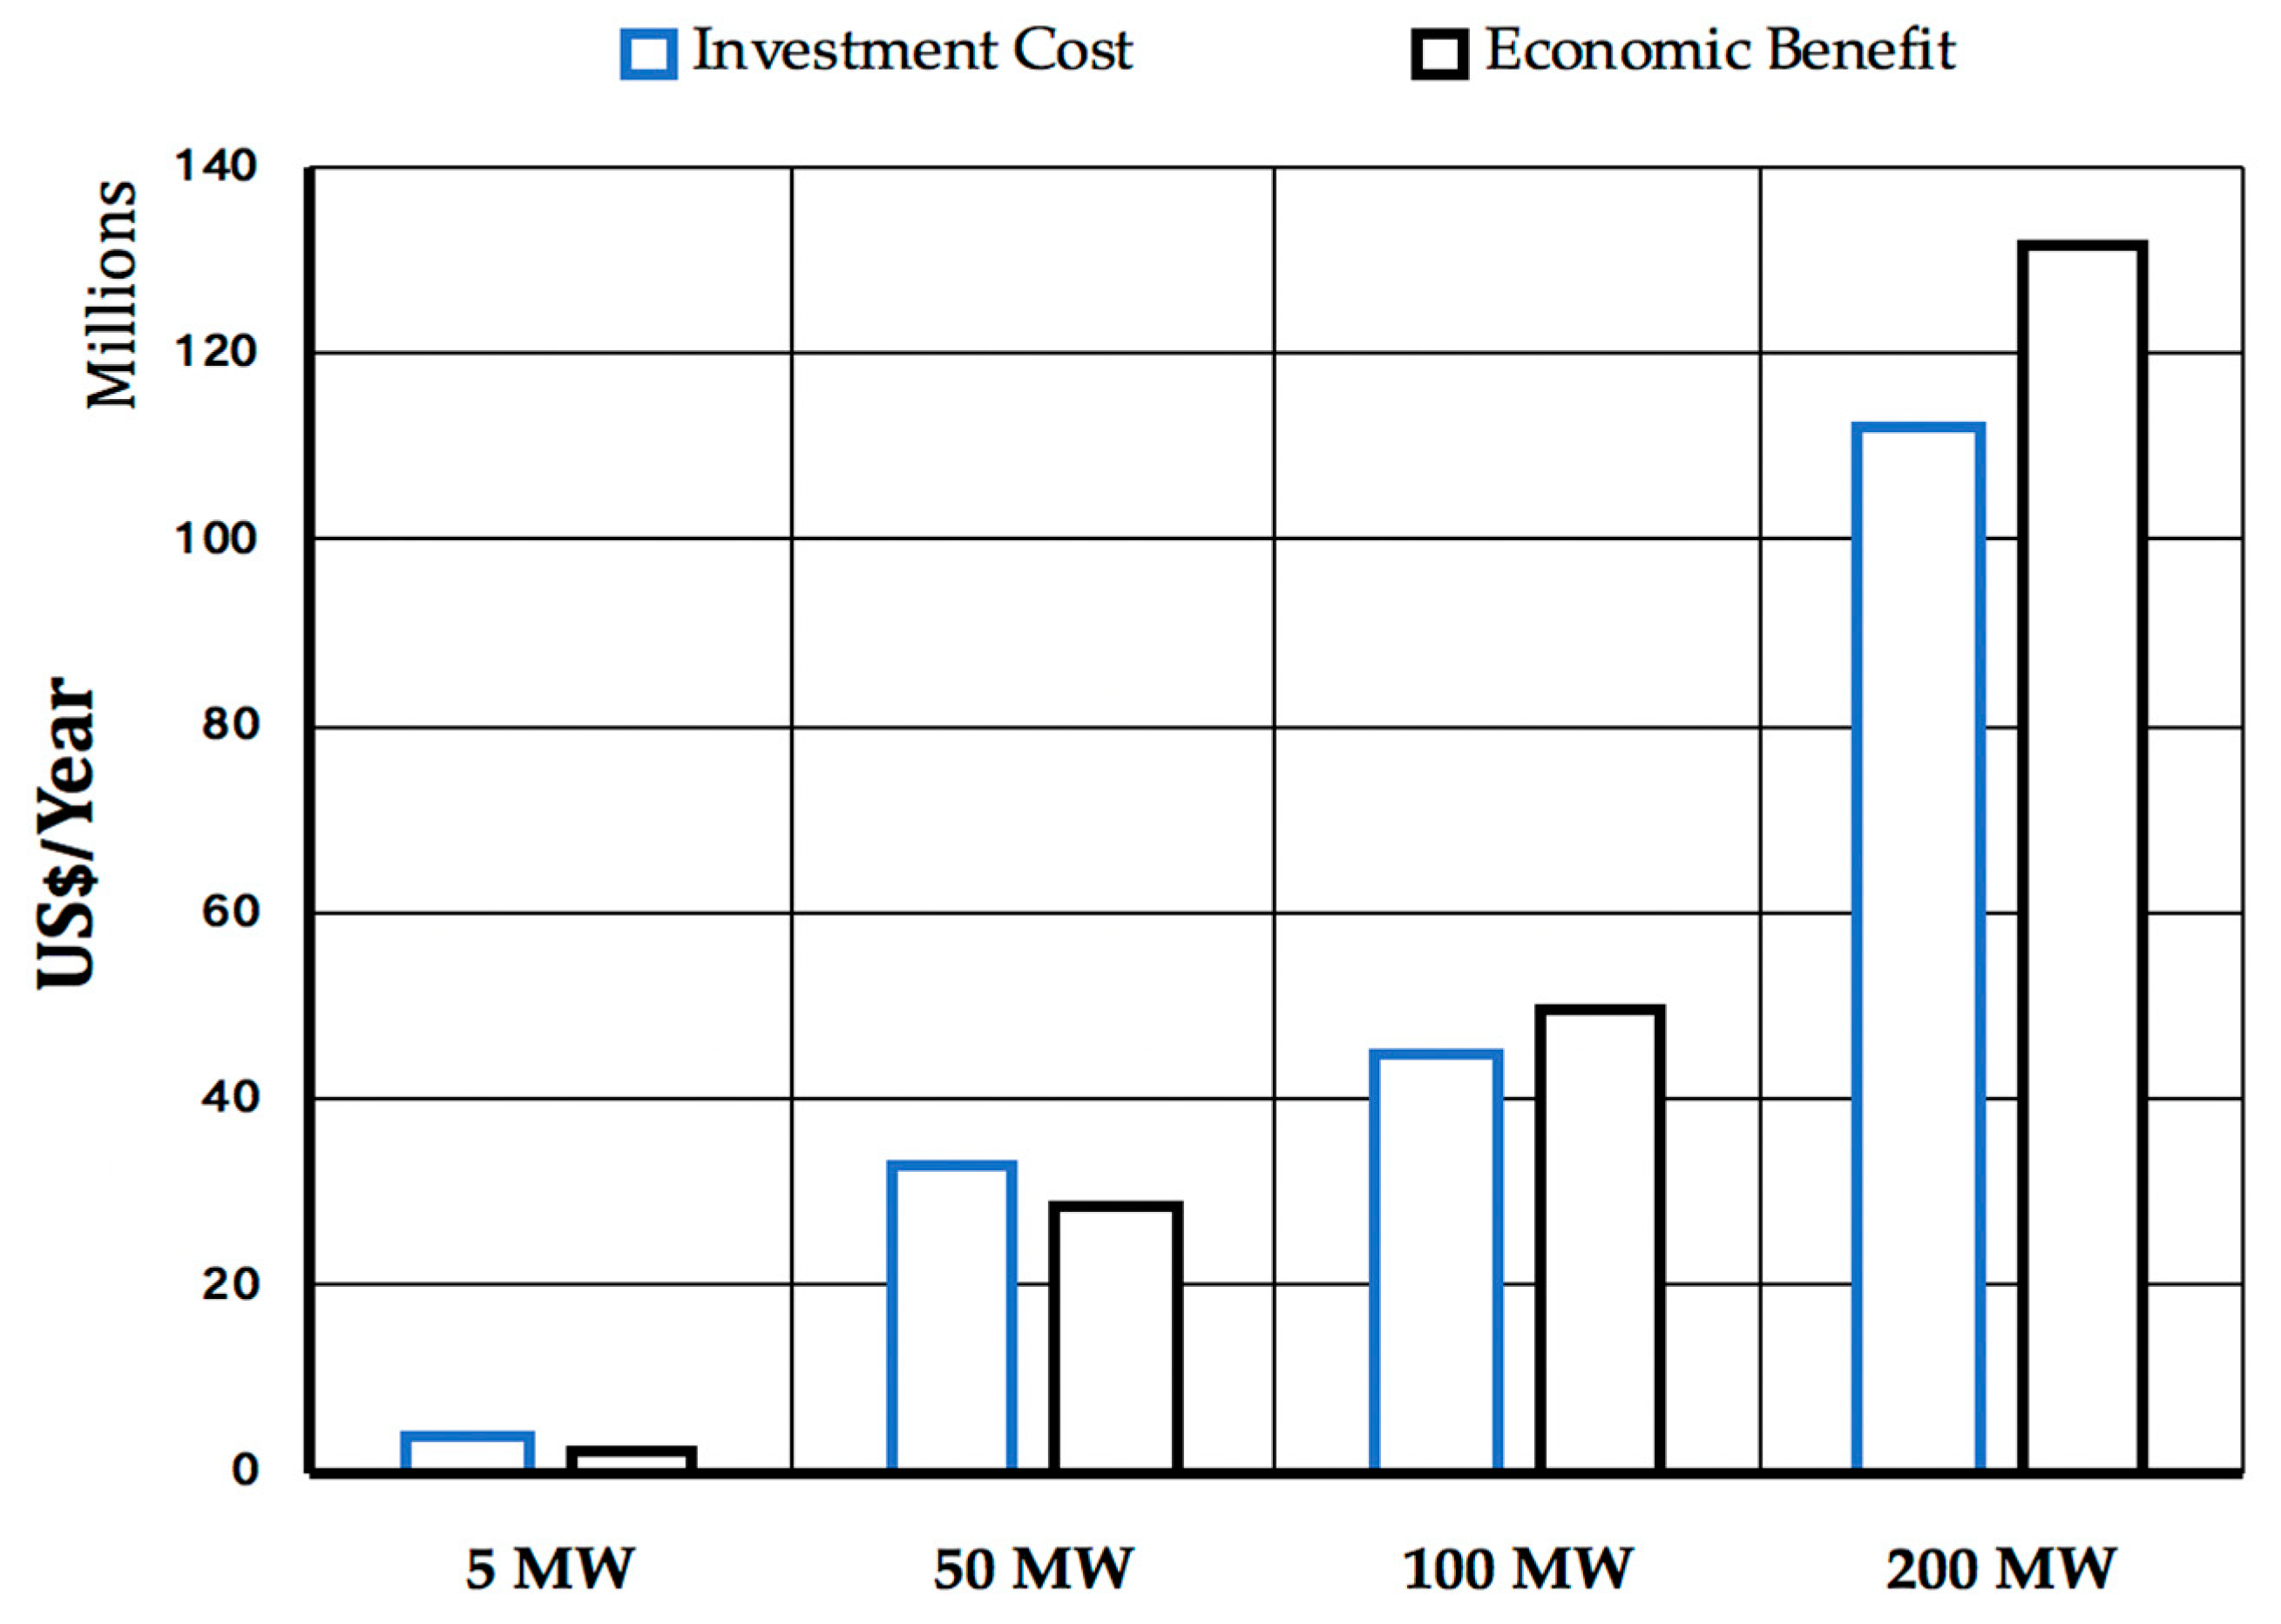
“Triple I-light” for the four generation capacities is shown in Figure 7. The Triple I indices were negative for 100 MW and 200 MW STWT systems. The cost and benefits per year are compared in Figure 8.
The STWT plants is thus considered to be sustainable if power generation capacity is 100 MW or more. By analyzing the parameters of the Triple I index, we found that the EF grew as the size of the plant increased. The negative values for 100 and 200 MW capacities stemmed from the economic benefits from the plants that are higher than the investment cost. We can say that efforts for economic aspects can effectively provide the realization of a sustainable plant.
3.5. Comparison with Other Kinds of Power Generation Plants
The total amount of CO2 emissions per kWh were compared among a variety of kinds of power generation plants (Figure 9). The CO2 emissions from the plants other than the STWT system are quoted from Reference [11].
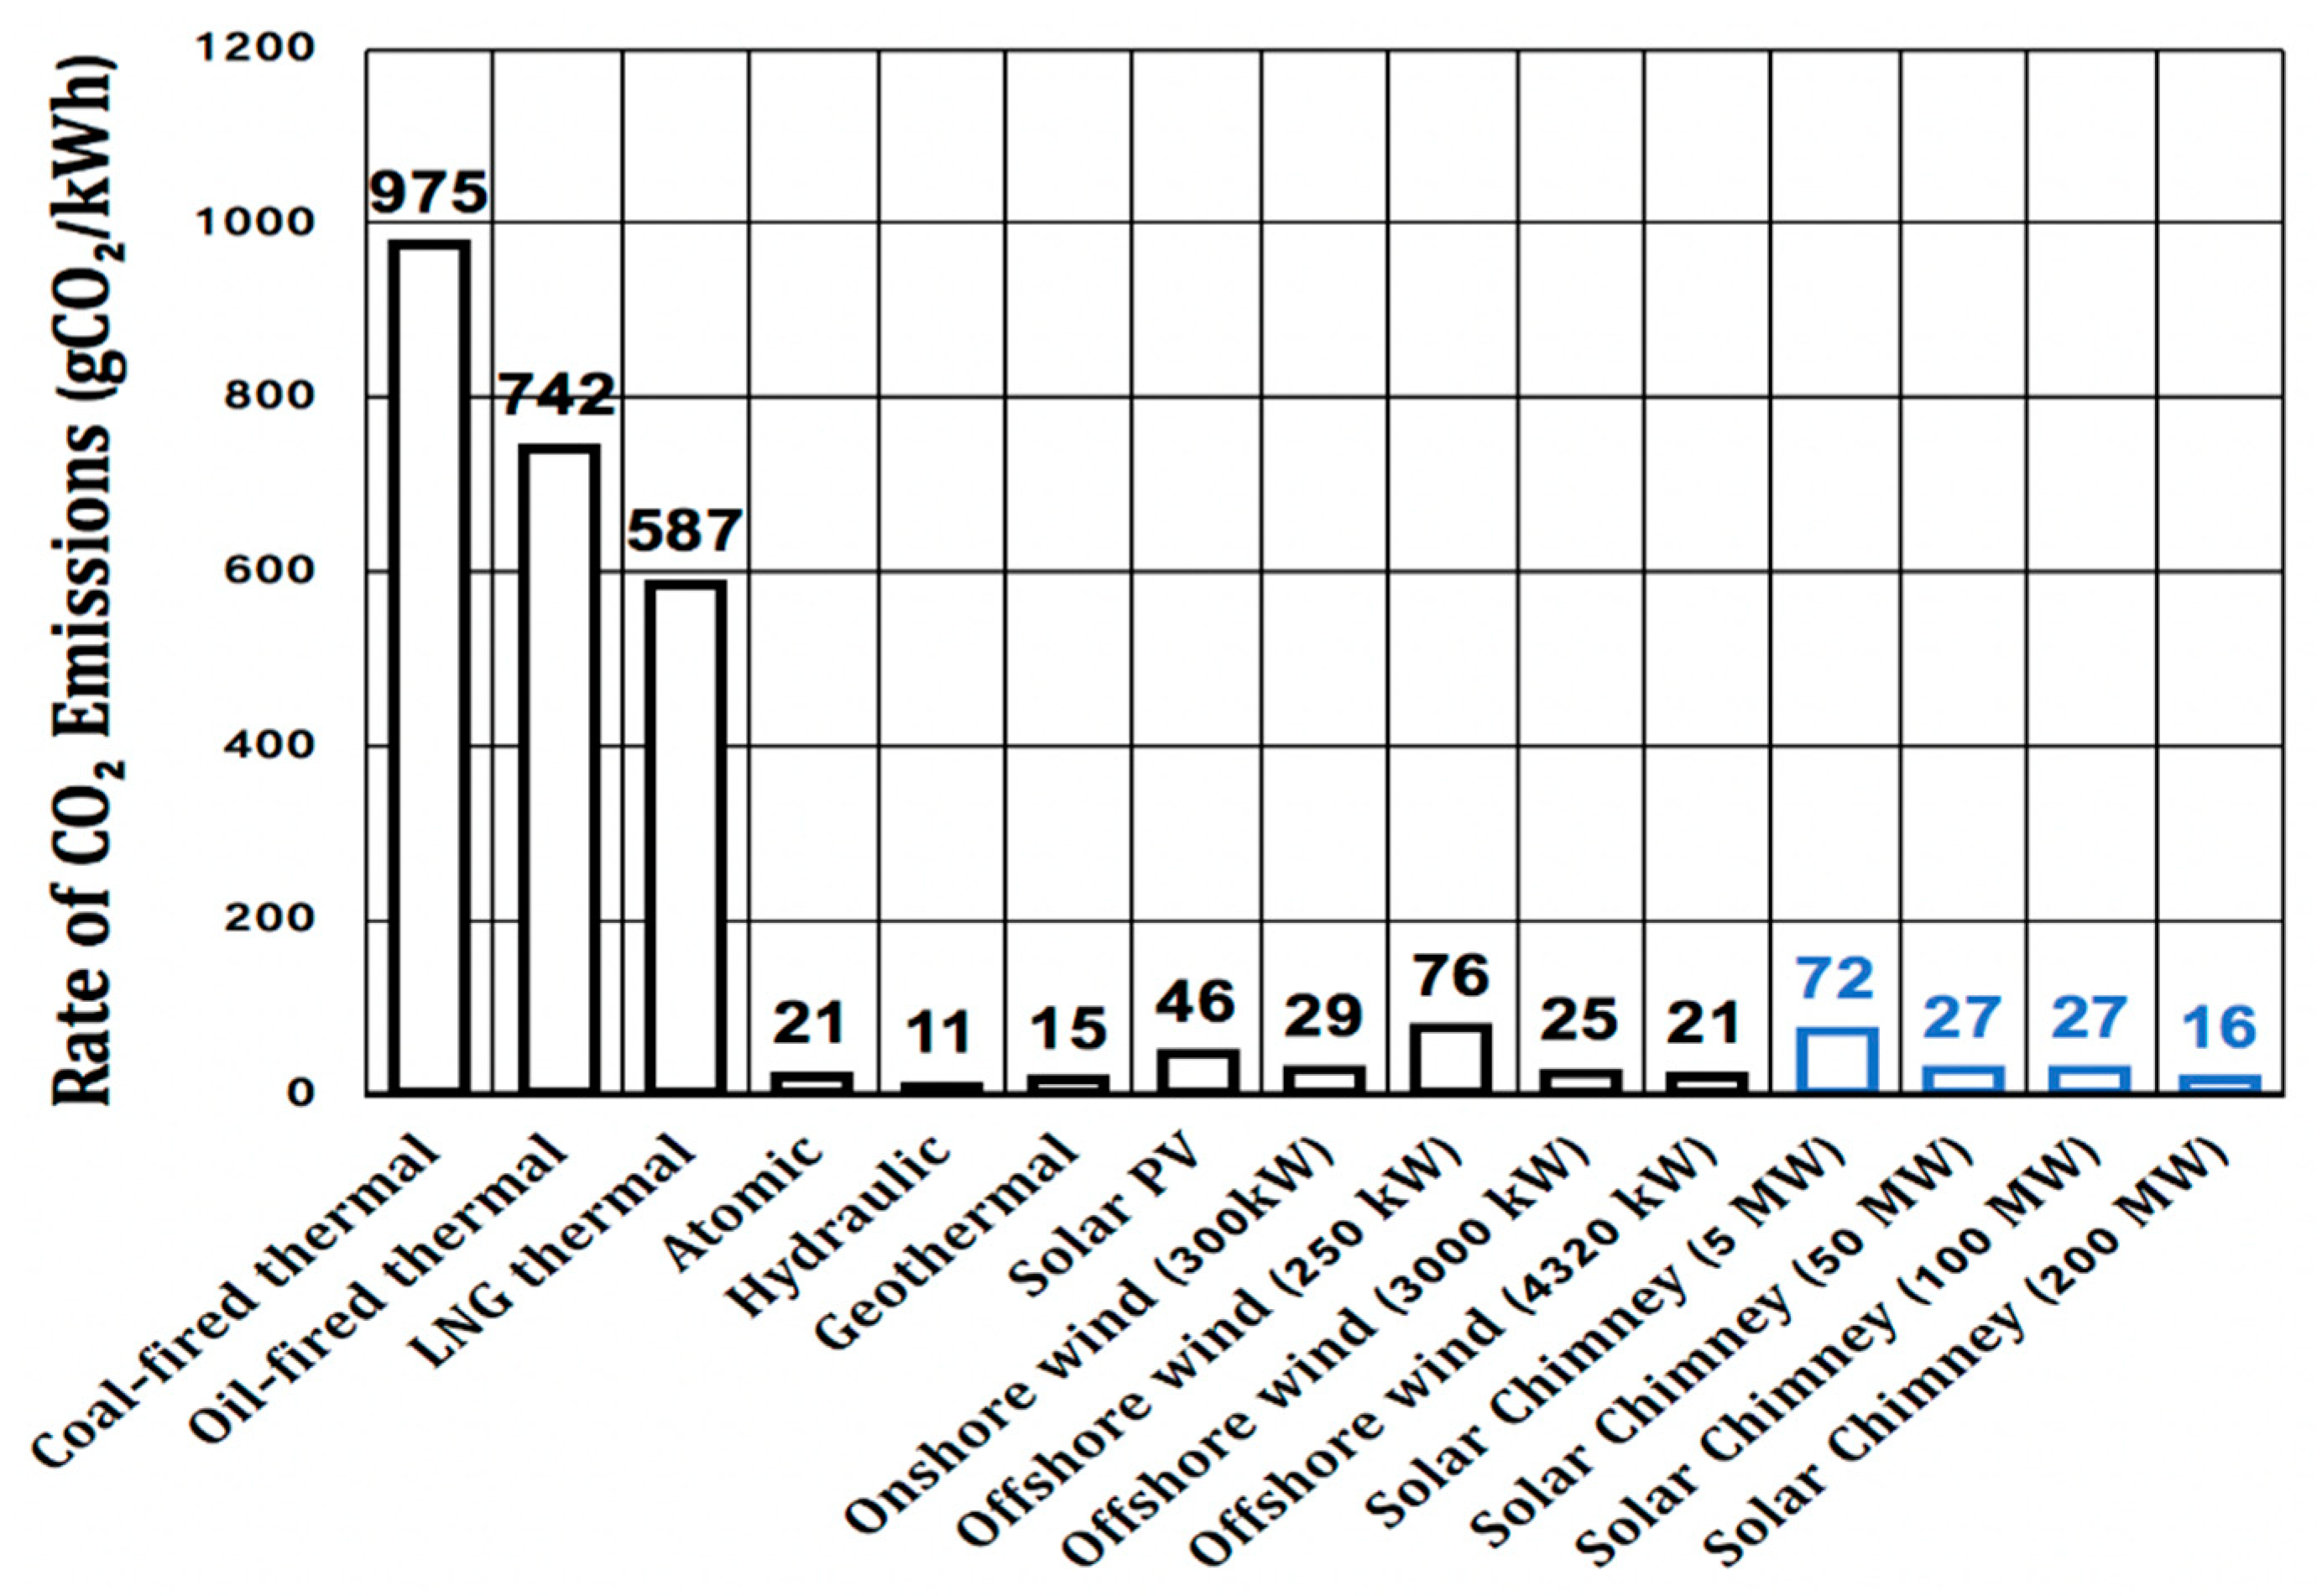
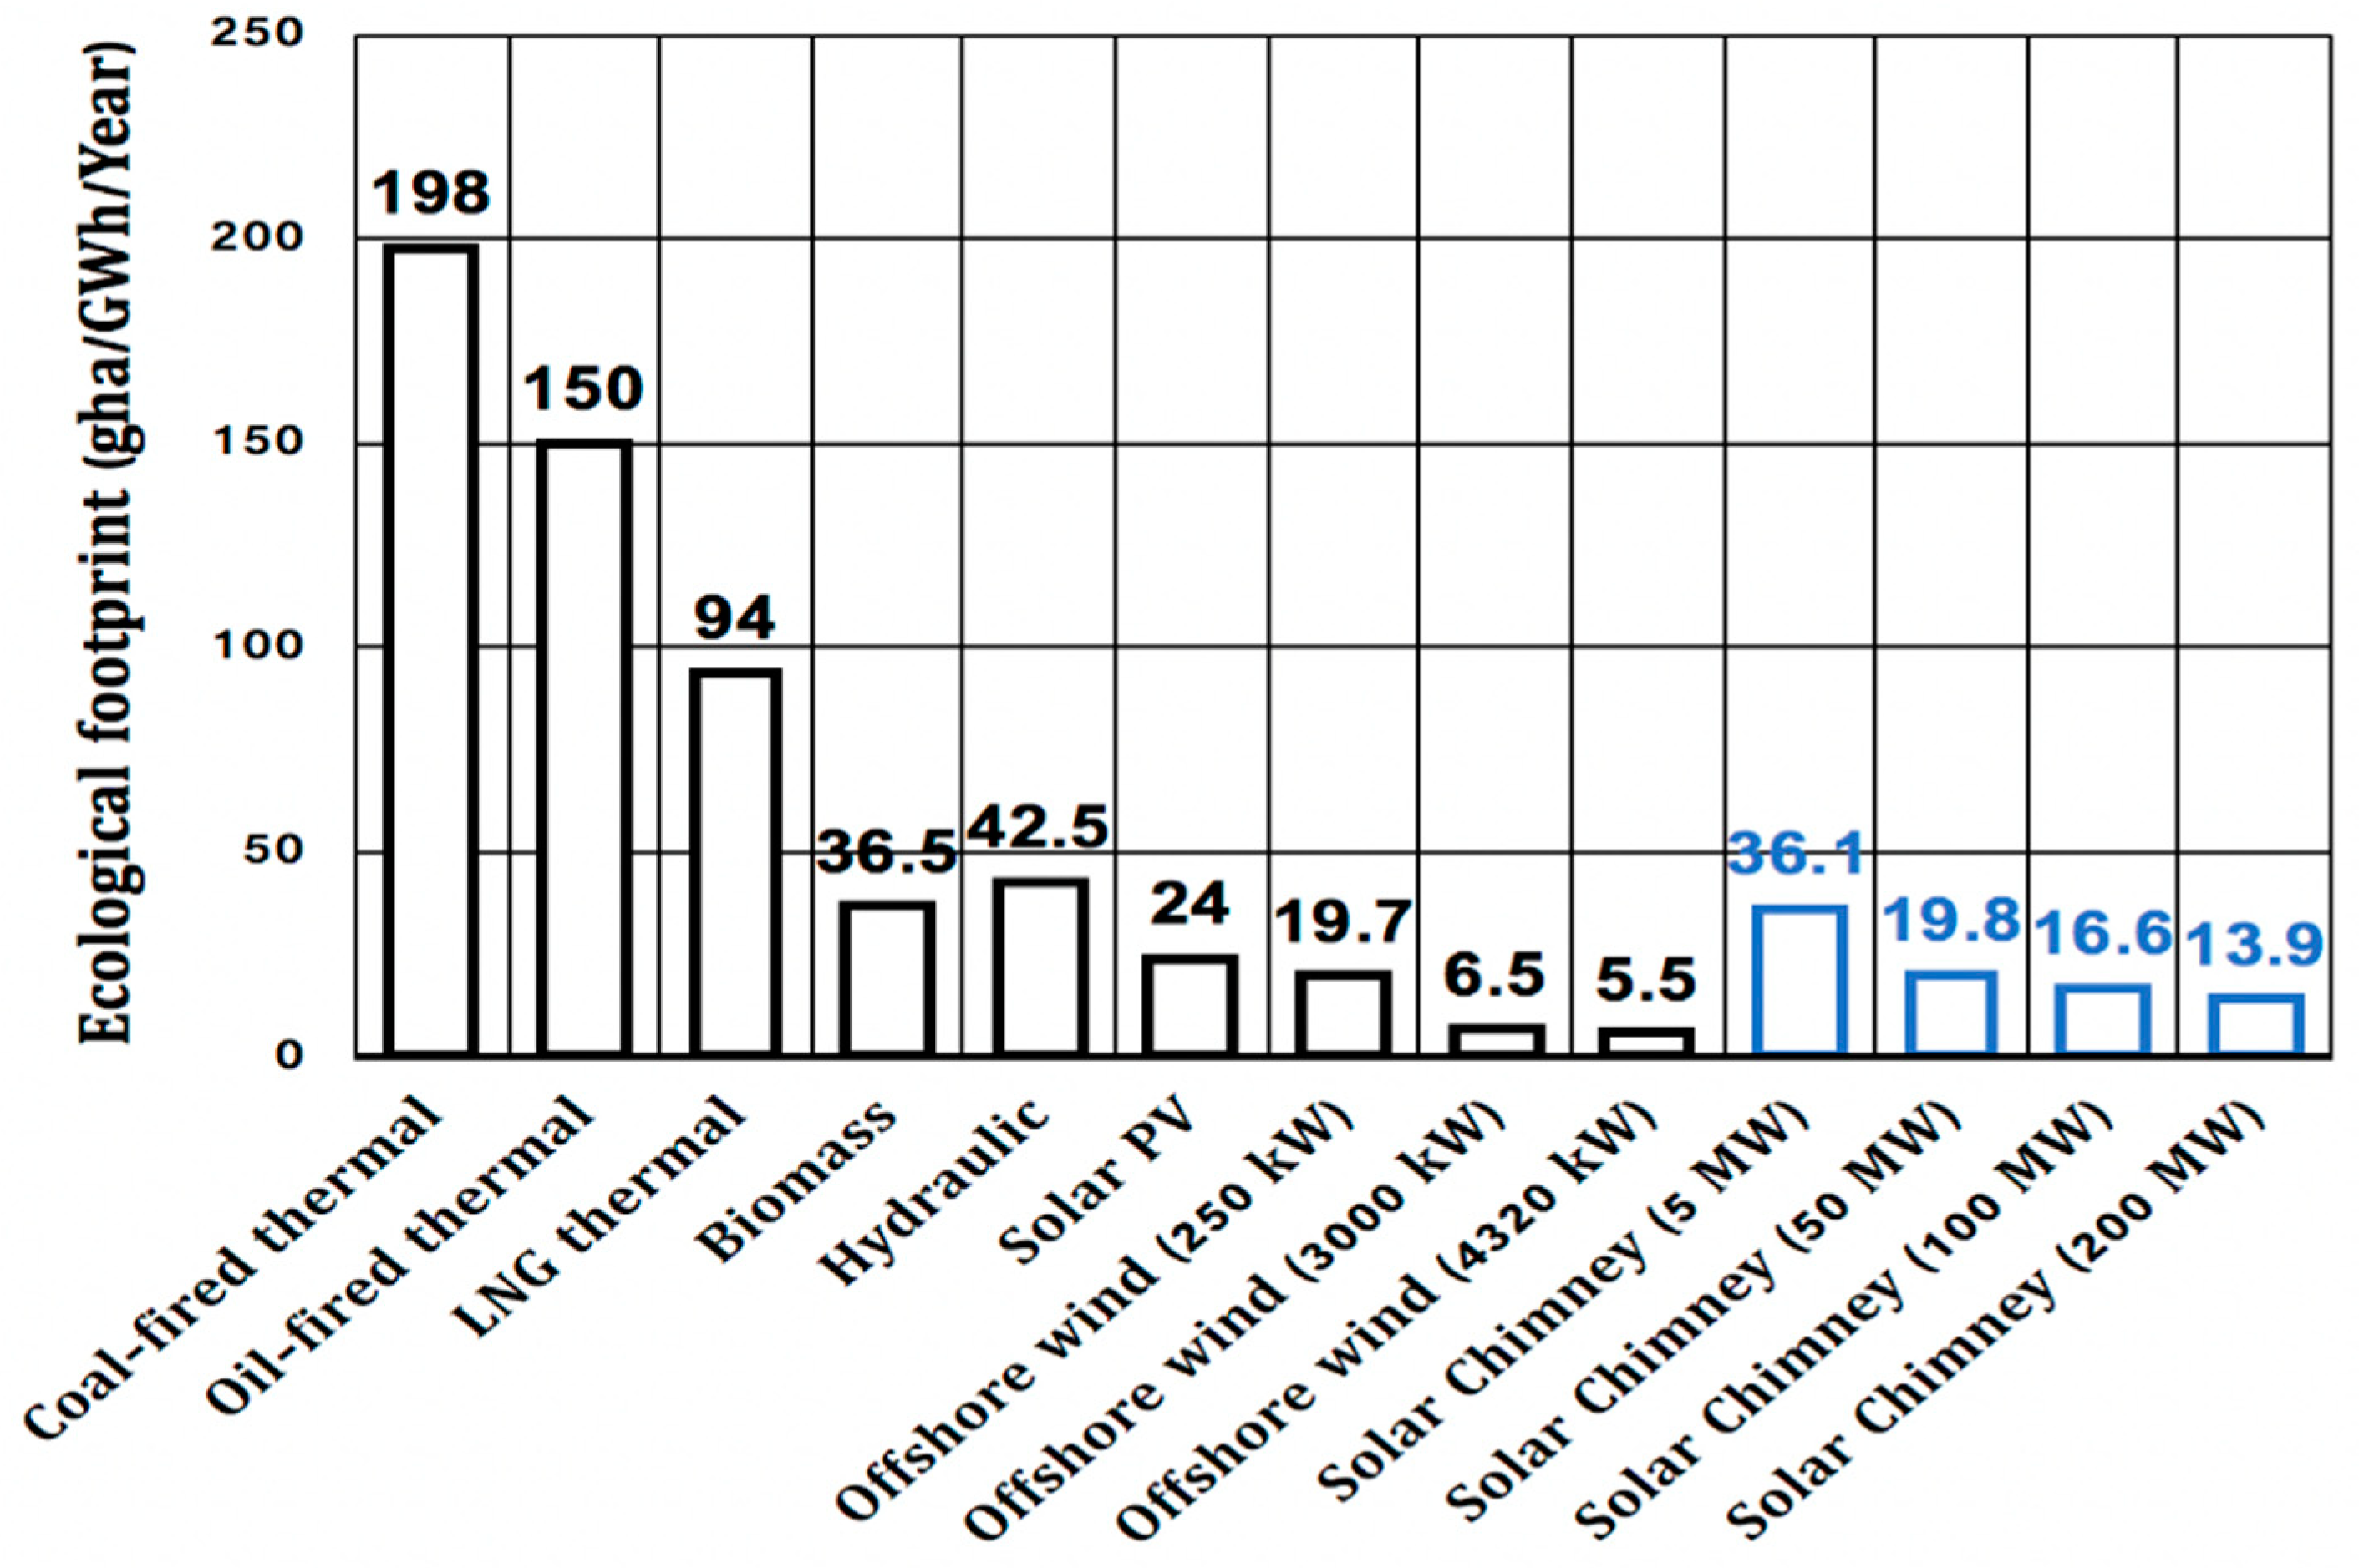
The relative amount of total CO2 emissions per kWh for a 5 MW STWT system is a bit high and higher than those for greater capacity; thus, the environmental influence can be mitigated through enlarging the capacity of the STWT. Therefore, this technology is not recommended for small-scale applications. Among the four power generation capacities, the 200 MW STWT plant had the smallest amount of CO2 emissions, which was lower than the other kinds of renewable energy technologies (wind and photovoltaic power); the STWT system was sufficiently competitive with the wind and photovoltaic systems in terms of the extent of environmental influence.
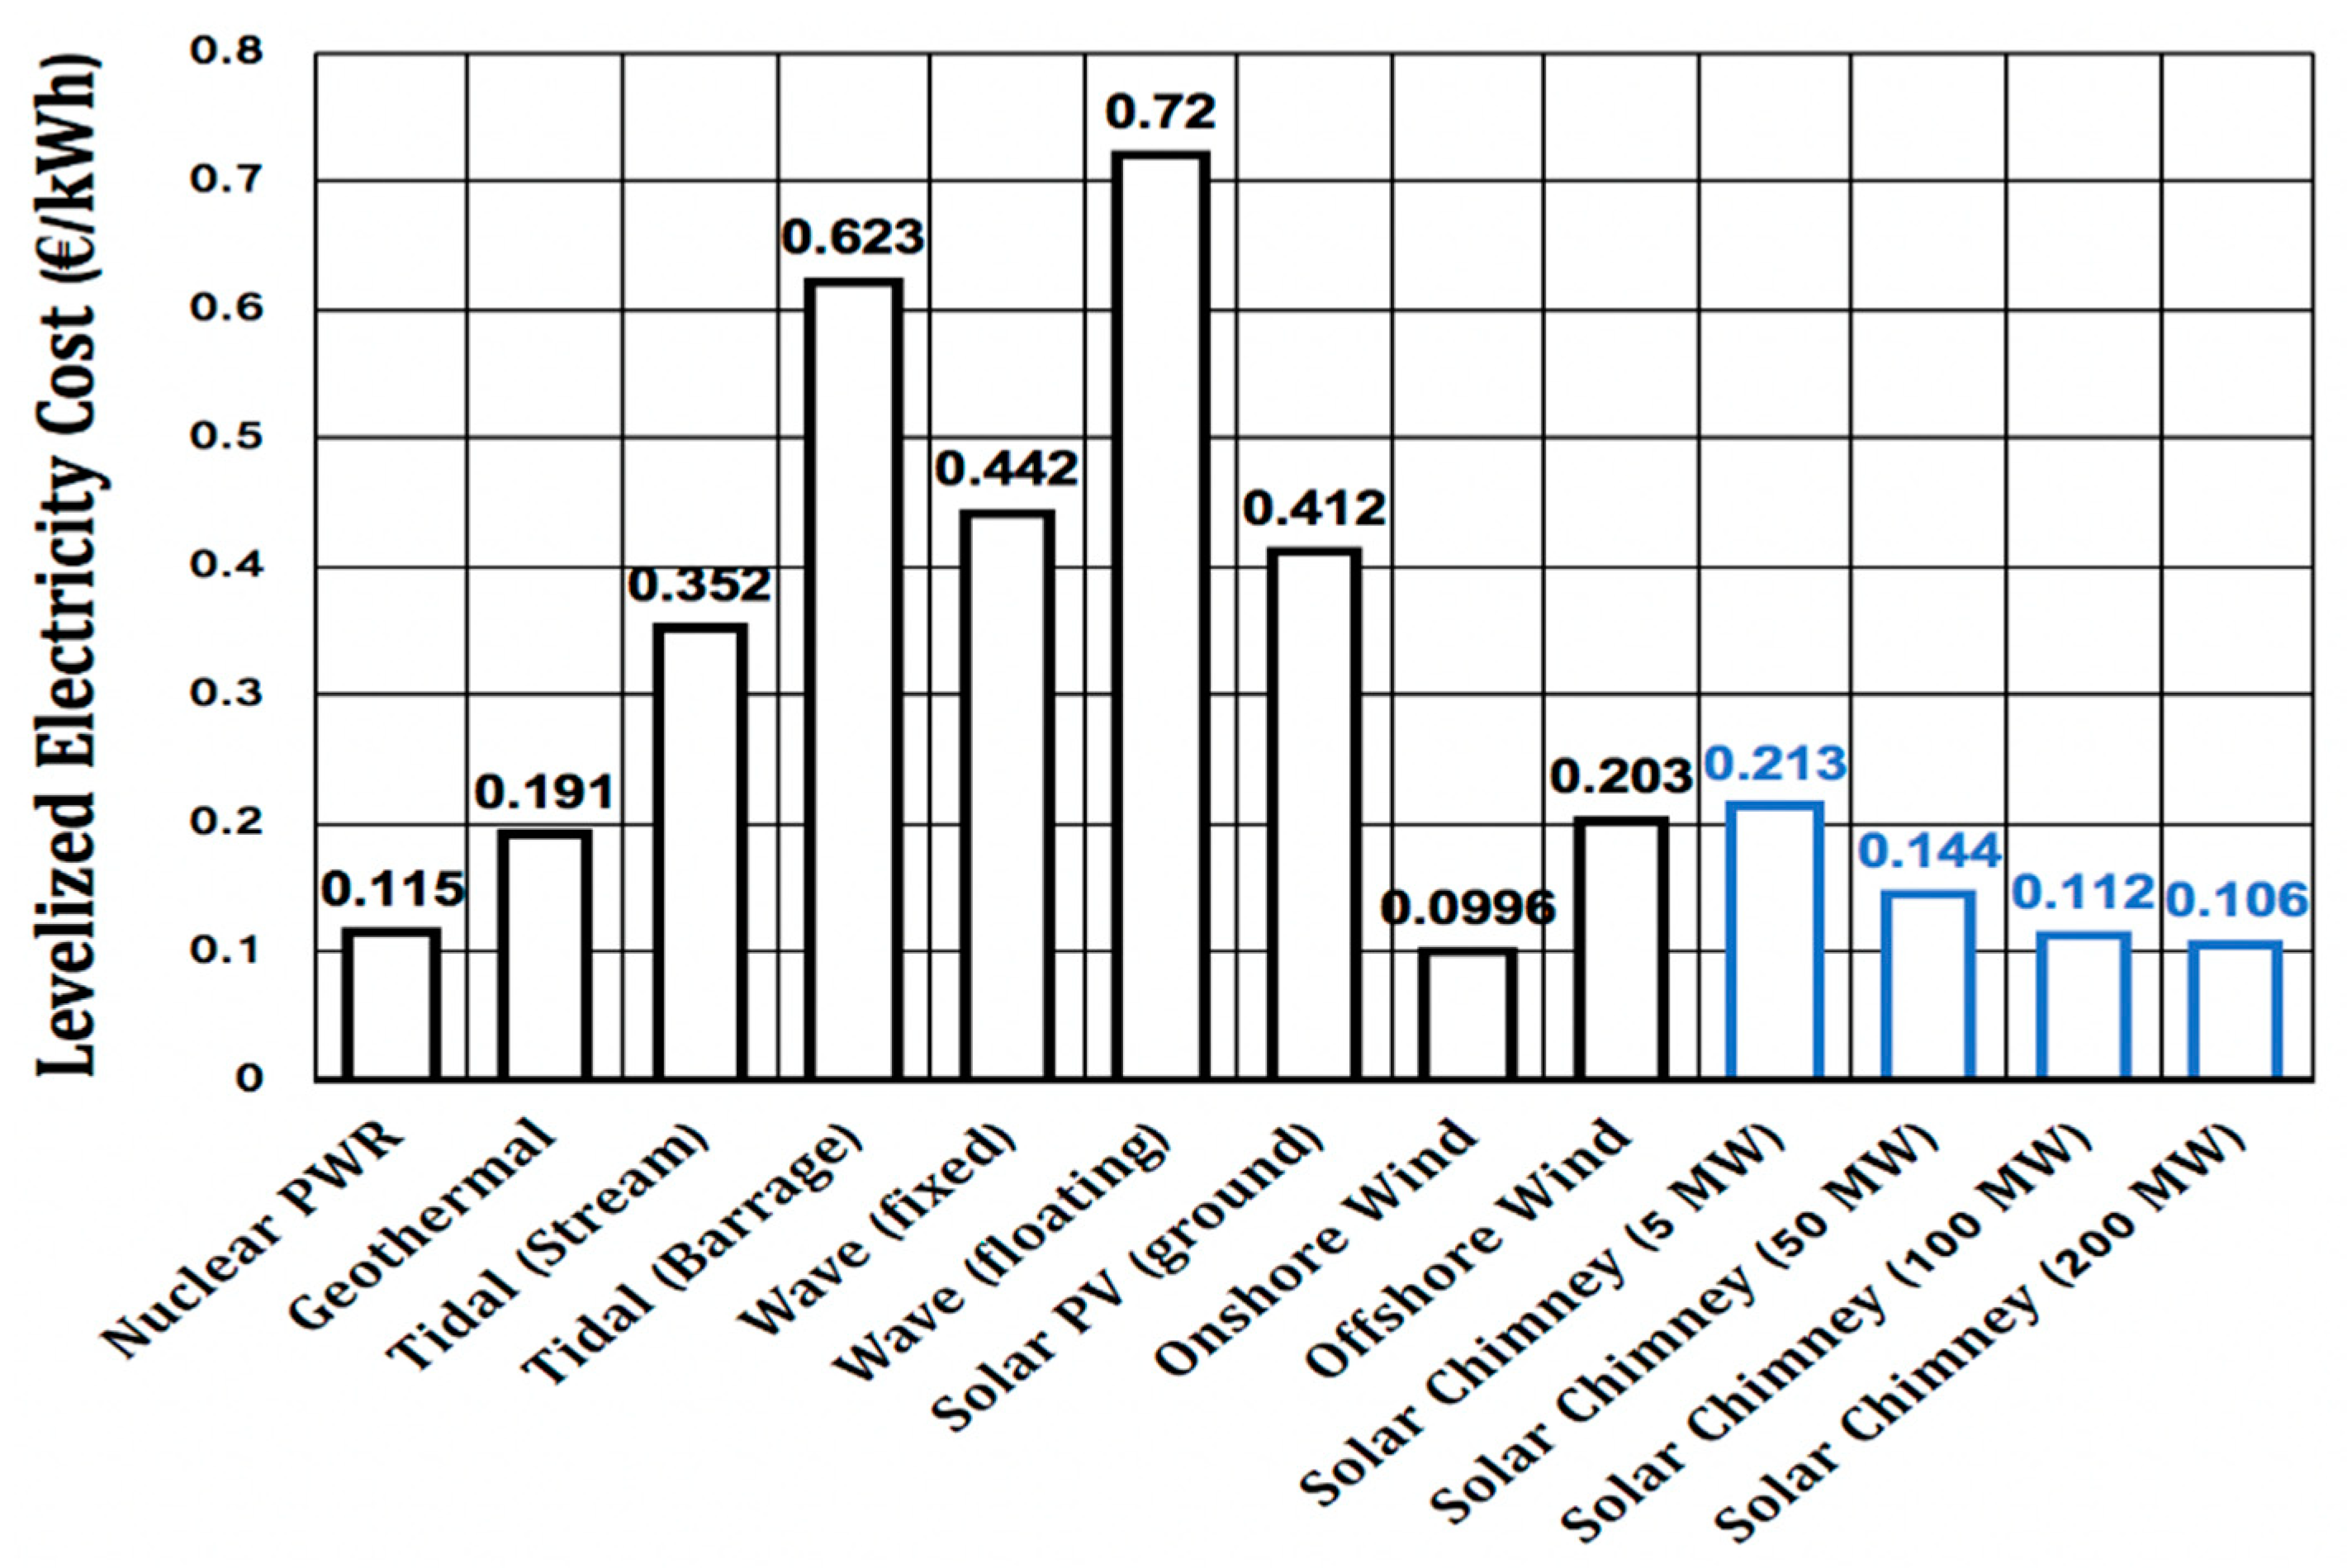
The comparisons were made for the LEC (Figure 10). The values of the LEC other than the STWT system are quoted from Reference [20].
Within the STWT system, the LEC per kWh decreased with the increase in the power generation capacity. The large capacity of the STWT system can offer economically sustainable power generation. It should be noted that it was competitive with other low-carbon power generation technologies on the energy marketplace.
The calculated ecological foot prints (EFs) were compared (Figure 11). The values of the EF other than the STWT systems are quoted from Reference [11].
Although the environmental impacts increased as the capacity of STWT was enlarged, the EFs per unit of produced kWh decreased. This came from the massive increase in the output power by enlarging the capacity. It should be noted that EFs per unit of produced kWh for 100 and 200 MW STWT was still lower than many other kinds of renewable energy technologies (offshore wind and photovoltaic power). This gives STWT a competitivity on the energy marketplace.
4. Potential of Offshore STWT Technology
Although a solar thermal wind tower meets all the conditions that attract investors, it also has features that make it less suitable for some sites, namely, they require a large area. The ocean covers around 71% of the earth’s surface, receiving massive amounts of solar energy. An offshore platform to harness the solar energy may offer a solution for the problem of energy. In addition, more than 40% of world’s population lives within 100 km of a coast [21]. Investment in offshore structures for power generation to provide energy required by such a huge demand is a wise deal. The offshore STWT plant not only makes full use of the potential area of the ocean, reducing the demand for land, but it also offers two technical advantages. First, the water surface can work as a heat absorber since the heat capacity of seawater is about five times higher that of soil. It thus enables the system to operate round the clock and to need less of an artificial energy storage subsystem. Second, unlimited sea water is available for producing fresh water as recently a few researchers examined solar thermal wind towers integrated with sea water desalination [22,23]. Other researchers investigated the performance of floating offshore solar power plants in the Mediterranean Sea [24]. A development of a floating PV solar farm with a capacity of 40 MW was reported by the Chinese government [25].
The negative environmental impact of offshore system by losing productive ocean area is estimated in this section. The increase in ecological footprint of the offshore STWT system as is calculated as follows,
where the additional component of EF of the lost productive sea area can be calculated as the equivalent factor for productive sea area [18] multiplied by the lost area of the sea. The lost area of the sea was considered to be 1.5 times the collector area of the system, taking into account the fact that several kilometers around the offshore STWT power plant would not be available for fishing. EFs for on-land and offshore STWT systems for each generating capacity are compared in Figure 12.
The environmental impact increased for the offshore technology by 20% on average because the productive sea area was lost by constructing the STWT on the surface of the ocean. The development of STWT should be made such that the benefits out of it mentioned above can cover the negative impacts.
5. Conclusions
The output power and the system efficiency of STWT plant were calculated for four power generation capacities. The results demonstrate that the total system efficiency increased by enlarging the capacity, thanks to the massive increase in the output power by enlarging the capacity of the system. In the STWT system, most of CO2 emissions were emitted in the manufacturing stage, and most of the emissions arose from manufacturing the tower and collector. If the CO2 emissions in the manufacturing stage can be lessened, the negative environmental impact of the STWT plant can be mitigated. The environmental damage tended to be reduced by enlarging the capacity of the STWT power generation plant. Among the four power generation capacities, the 200 MW STWT plant had the smallest amount of CO2 emissions, which was lower than the other kinds of renewable energy technologies, such as wind and photovoltaic power, leading the STWT to be competitive in terms of negative environmental influence. The cost per unit of electricity generated from the STWT (LEC) decreased with the increase in the power generation capacity; following that, by enlarging the capacity of the system, it is possible to make the system economically feasible. The collector gave a major impact on the total capital cost of the STWT systems; accordingly, controlling and decreasing collector cost tended to decrease the cost of the output energy generated (LEC). By comparing the LEC per kWh produced, it should be noted that the large capacity of the STWT system can offer economically sustainable power generation technology that is competitive with other low-carbon power generation technologies on the energy marketplace. The “Triple I-light” index was used as a tool to judge the sustainability of the STWT system, while a negative value of the index means that the system is sustainable. The index can be negative by enlarging the capacity over 100 MW because the economic benefits exceed the investment cost for the plant. We can say that efforts towards the economic aspects can effectively provide the realization of a sustainable plant. Therefore, the finalists are the STWT plants with greater power generation capacity, as it is very competitive with the other renewable energy technologies.
Author Contributions
Conceptualization, I.E.; Methodology, I.E. and Y.N.; Analysis I.E.; Investigation, I.E.; Writing-Original Draft Preparation, I.E.; Writing-Review & Editing, Y.N.; Visualization, I.E.; Supervision, Y.N.; Funding Acquisition, Y.N.
Funding
This work was supported by Grant-in-Aid for Scientific Research (B) (No. 18H01636) from Japan Society for the Promotion of Science.
Acknowledgments
The first author (E. Islam) are indebted for Japanese Ministry of Education, Culture, Sports, Science and Technology (MEXT) for financial supports. The authors are grateful to M. Murai for his helpful comments.
Conflicts of Interest
The authors declare no conflict of interest.
Abbreviations
| Area of collector | |
| Annual energy production | |
| Benefit | |
| Cost | |
| Total capital cost | |
| Collector cost | |
| Tower cost | |
| Turbine cost | |
| Specific capital cost for material and construction | |
| Annual operation and maintenance cost | |
| Specific heat capacity of air at constant pressure | |
| Diameter of collector | |
| Diameter of tower | |
| Embodied carbon | |
| Ecological footprint | |
| Gross domestic product | |
| Gravity | |
| Height of tower | |
| Height of collector inlet | |
| Solar radiation | |
| Inclusive impact index – light | |
| Levelized electricity cost | |
| Mass flow rate of air | |
| Number of years (lifetime) | |
| Total power | |
| Electrical power output | |
| Cost percentage for the collector per unit area. | |
| Cost percentage for every one-meter height of collector inlet. | |
| Cost percentage for the turbines. | |
| Cost percentage for operation and maintenance | |
| Useful heat gain to the air flow | |
| Inputted solar energy | |
| Capital recovery factor | |
| Reinforced concrete | |
| Annual interest rate | |
| Solar thermal wind tower | |
| Ambient air temperature | |
| Maximum airflow speed | |
| Total pressure difference of air | |
| Temperature rise | |
| Efficiency of the collector | |
| Efficiency of the tower | |
| Efficiency of the turbines | |
| Density of the ambient air | |
| Density of air inside the tower |
Appendix A
The parameters of the proportions of materials of the turbines (Table A1), and CO2 emission factors of materials (Table A2) are quoted from Reference [11].

Table A1.
Proportions of materials of each part of the STWT system turbines [11].
Table A1.
Proportions of materials of each part of the STWT system turbines [11].
| Component | Material | Percentage | |
|---|---|---|---|
| Turbines | Blade | Steel | 14% |
| Epoxy | 29% | ||
| Fibrous glass | 57% | ||
| Nacelle | Steel | 93% | |
| Stainless steel | 1% | ||
| Cast steel | 7% | ||
| Grease | 0% | ||
| Generator | Steel | 66% | |
| Silicon Steel plate | 8% | ||
| Aluminum | 3% | ||
| Copper | 6% | ||
| Heat-hardening resin | 12% | ||
| Grease | 6% | ||
Table A2.
CO2 emission factors of materials [11].
Table A2.
CO2 emission factors of materials [11].
| Material | (kgCO2/kg) | Material | (kgCO2/kg) |
|---|---|---|---|
| Steel | 1.366 | Fibrous Glass | 2.138 |
| Stainless steel | 2.744 | Insulator | 2.911 |
| Cast steel | 3.718 | Grease | 0.255 |
| Silicon steel plate | 1.366 | Heat-hardening resin | 5.035 |
| Aluminum | 5.442 | Concrete | 0.114 |
| Copper | 2.508 | Cement | 0.808 |
| Epoxy | 6.886 | Stone material | 0.008 |
References
- Richter, C.; Lincot, D.; Gueymard, C.A. Solar Updraft Towers. In Solar Energy; Meyers, R.A., Ed.; Springer: New York, NY, USA, 2012; pp. 658–687. [Google Scholar]
- Schlaich, J.; Bergermann, R.; Schiel, W.; Weinrebe, G. Design of Commercial Solar Updraft Tower Systems: Utilization of Solar Induced Convective Flows for Power Generation. J. Sol. Energy Eng. 2005, 127, 117–124. [Google Scholar] [CrossRef]
- Ming, T. Solar Chimney Power Plant Generating Technology; Elsevier: Amsterdam, The Netherlands, 2016; pp. 1–69. [Google Scholar]
- Al-Kayiem, H.H.; Aja, O.C. Historic and recent progress in solar chimney power plant enhancing technologies. Renew. Sustain. Energy Rev. 2016, 58, 1269–1292. [Google Scholar] [CrossRef]
- Mullett, L.B. The solar chimney—Overall efficiency, design and performance. Int. J. Ambient Energy 2011, 8, 35–40. [Google Scholar] [CrossRef]
- EnviroMission Company, Australia. Available online: www.enviromission.com.au (accessed on 30 September 2018).
- Krätzi Wilfried, B.; Harte, R.; Montag, U. From large natural draft cooling tower shells to chimneys of solar upwind power plants, Giga-Shells for Energy Generation: Natural Draft Cooling Towers and Solar Updraft Chimneys. In Proceedings of the 6th International Symposium on Cooling Towers, Cologne, Germany, 20–23 June 2012. [Google Scholar]
- Purnell, P. The carbon footprint of reinforced concrete. Adv. Cem. Res. 2013, 25, 362–368. [Google Scholar] [CrossRef] [Green Version]
- Vestergaard Nielsen, C. Carbon Footprint of Concrete Buildings seen in the Life Cycle Perspective. In Proceedings of the NRMCA 2008 Concrete Technology Forum, Denver, CO, USA, 20–22 May 2008. [Google Scholar]
- Documentation for Greenhouse Gas Emission and Energy Factors Used in the Waste Reduction Model, U.S. Environmental Protection Agency. Available online: www.epa.gov/warm (accessed on 30 September 2018).
- Murai, M.; Aono, T. Inclusive Environmental Assessment for Offshore Wind Power Stations. In Proceedings of the Nineteenth International Offshore and Polar Engineering Conference, Osaka, Japan, 21–26 June 2009; ISBN 978-1-880653-53-1. [Google Scholar]
- Takahashi, T.; Sato, T. Inclusive environmental impact assessment indices with consideration of public acceptance: Application to power generation technologies in Japan. Appl. Energy 2015, 144, 64–72. [Google Scholar] [CrossRef]
- Okoye, C.O.; Solyalı, O.; Taylan, O. A new economic feasibility approach for solar chimney power plant design. Energy Convers. Manag. 2016, 126, 1013–1027. [Google Scholar] [CrossRef]
- Harte, R.; Graffmann, R. Optimization of Solar Updraft Chimneys by Nonlinear Response Analysis. Appl. Mech. Mater. 2013, 283, 25–34. [Google Scholar] [CrossRef]
- BuildRight Toolbox, Australia. Available online: https://emedia.rmit.edu.au/dlsweb/Toolbox/buildright/ (accessed on 30 September 2018).
- Ir. Stephen Leung, Arup Materials Technology, Technical seminar on Carbon Dioxide (CO2) Emissions of Concrete, SCCT 2009, Hong Kong. 2009. Available online: http://www.hkengineer.org.hk/program/home/idamain.php?cat=ida&volid=112&dept=mat (accessed on 30 September 2018).
- Boyle, G. Renewable Energy: Power for a Sustainable Future, 3rd ed.; Oxford University Press: Oxford, UK, 2012. [Google Scholar]
- Wackerbagel, M.; Rees, W. Our Ecological Footprint, Godo-Shuppan; New Society: Gabriola Island, BC, Cananda, 2004. [Google Scholar]
- Living Planet Report 2016. Available online: http://wwf.panda.org (accessed on 30 September 2018).
- MacDonald, M. Costs of Low-Carbon Generation Technologies, Committee on Climate Change. 2011. Available online: https://www.mottmac.com (accessed on 30 September 2018).
- Crossland, C.; Baird, D.; Ducrotoy, J.-P.; Lindeboom, H.; W.Buddemeier, R.; Dennison, W.; Maxwell, B.; Smith, S.; Swaney, D. The Coastal Zone—A Domain of Global Interactions. In Coastal Fluxes in the Anthropocene: The Land-Ocean Interactions in the Coastal Zone Project of the International Geosphere-Biosphere Programme; Springer: Berlin, Germany, 2005; pp. 1–37. [Google Scholar] [CrossRef]
- Zuo, L.; Zheng, Y.; Li, Z.; Sha, Y. Solar chimneys integrated with sea water desalination. Desalination 2011, 276, 207–213. [Google Scholar] [CrossRef]
- Niroomand, N.; Amidpour, M. New combination of solar chimney for power generation and seawater desalination. Desalin. Water Treat. 2013, 51, 7401–7411. [Google Scholar] [CrossRef] [Green Version]
- Diendorfer, C.; Haider, M.; Lauermann, M. Performance Analysis of Offshore Solar Power Plants. Energy Procedia 2014, 49, 2462–2471. [Google Scholar] [CrossRef]
- The World Economic Forum. Available online: https://www.weforum.org (accessed on 30 September 2018).
Figure 1.
System layout of a solar thermal wind tower (STWT).

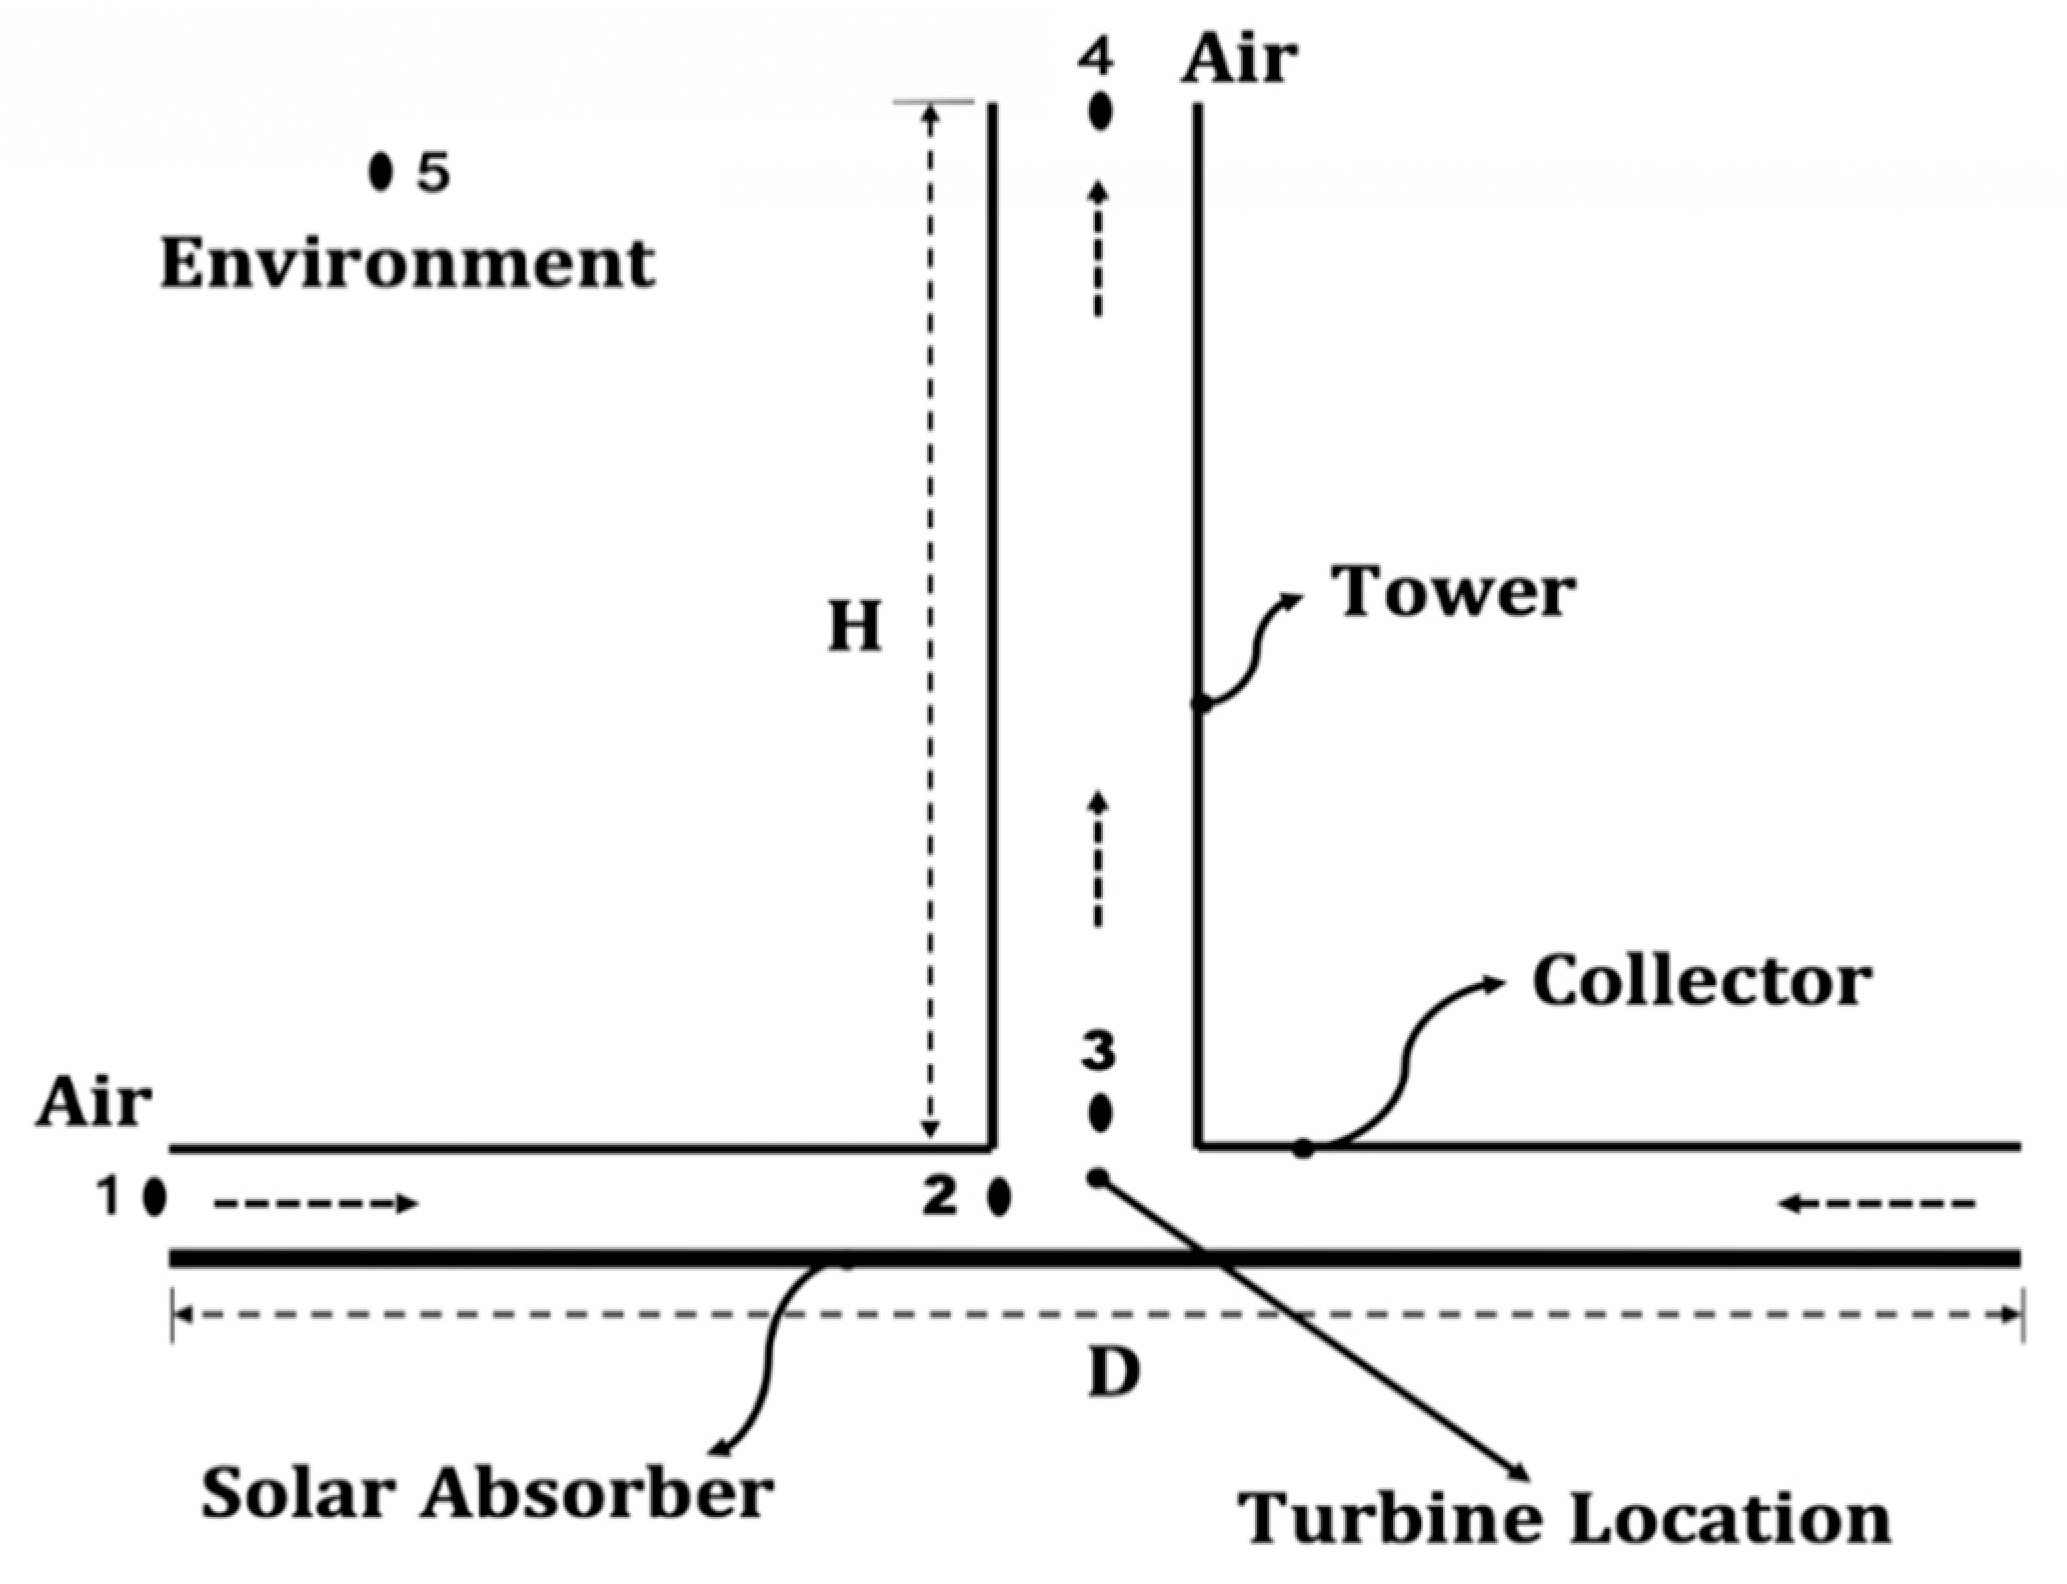
Figure 2.
Air flow at some points inside a STWT: (1) collector inlet; (2) collector outlet, which is also the state of the turbine inlet; (3) tower inlet, which is also the state of the turbine outlet; (4) tower outlet; (5) and the state of the environment at the same height as the tower outlet.
Figure 2.
Air flow at some points inside a STWT: (1) collector inlet; (2) collector outlet, which is also the state of the turbine inlet; (3) tower inlet, which is also the state of the turbine outlet; (4) tower outlet; (5) and the state of the environment at the same height as the tower outlet.

Figure 3.
Stages of the life-cycle of any power generation plant.

Figure 4.
Total CO2 emissions by each selected STWT power generation system in the life-cycle.
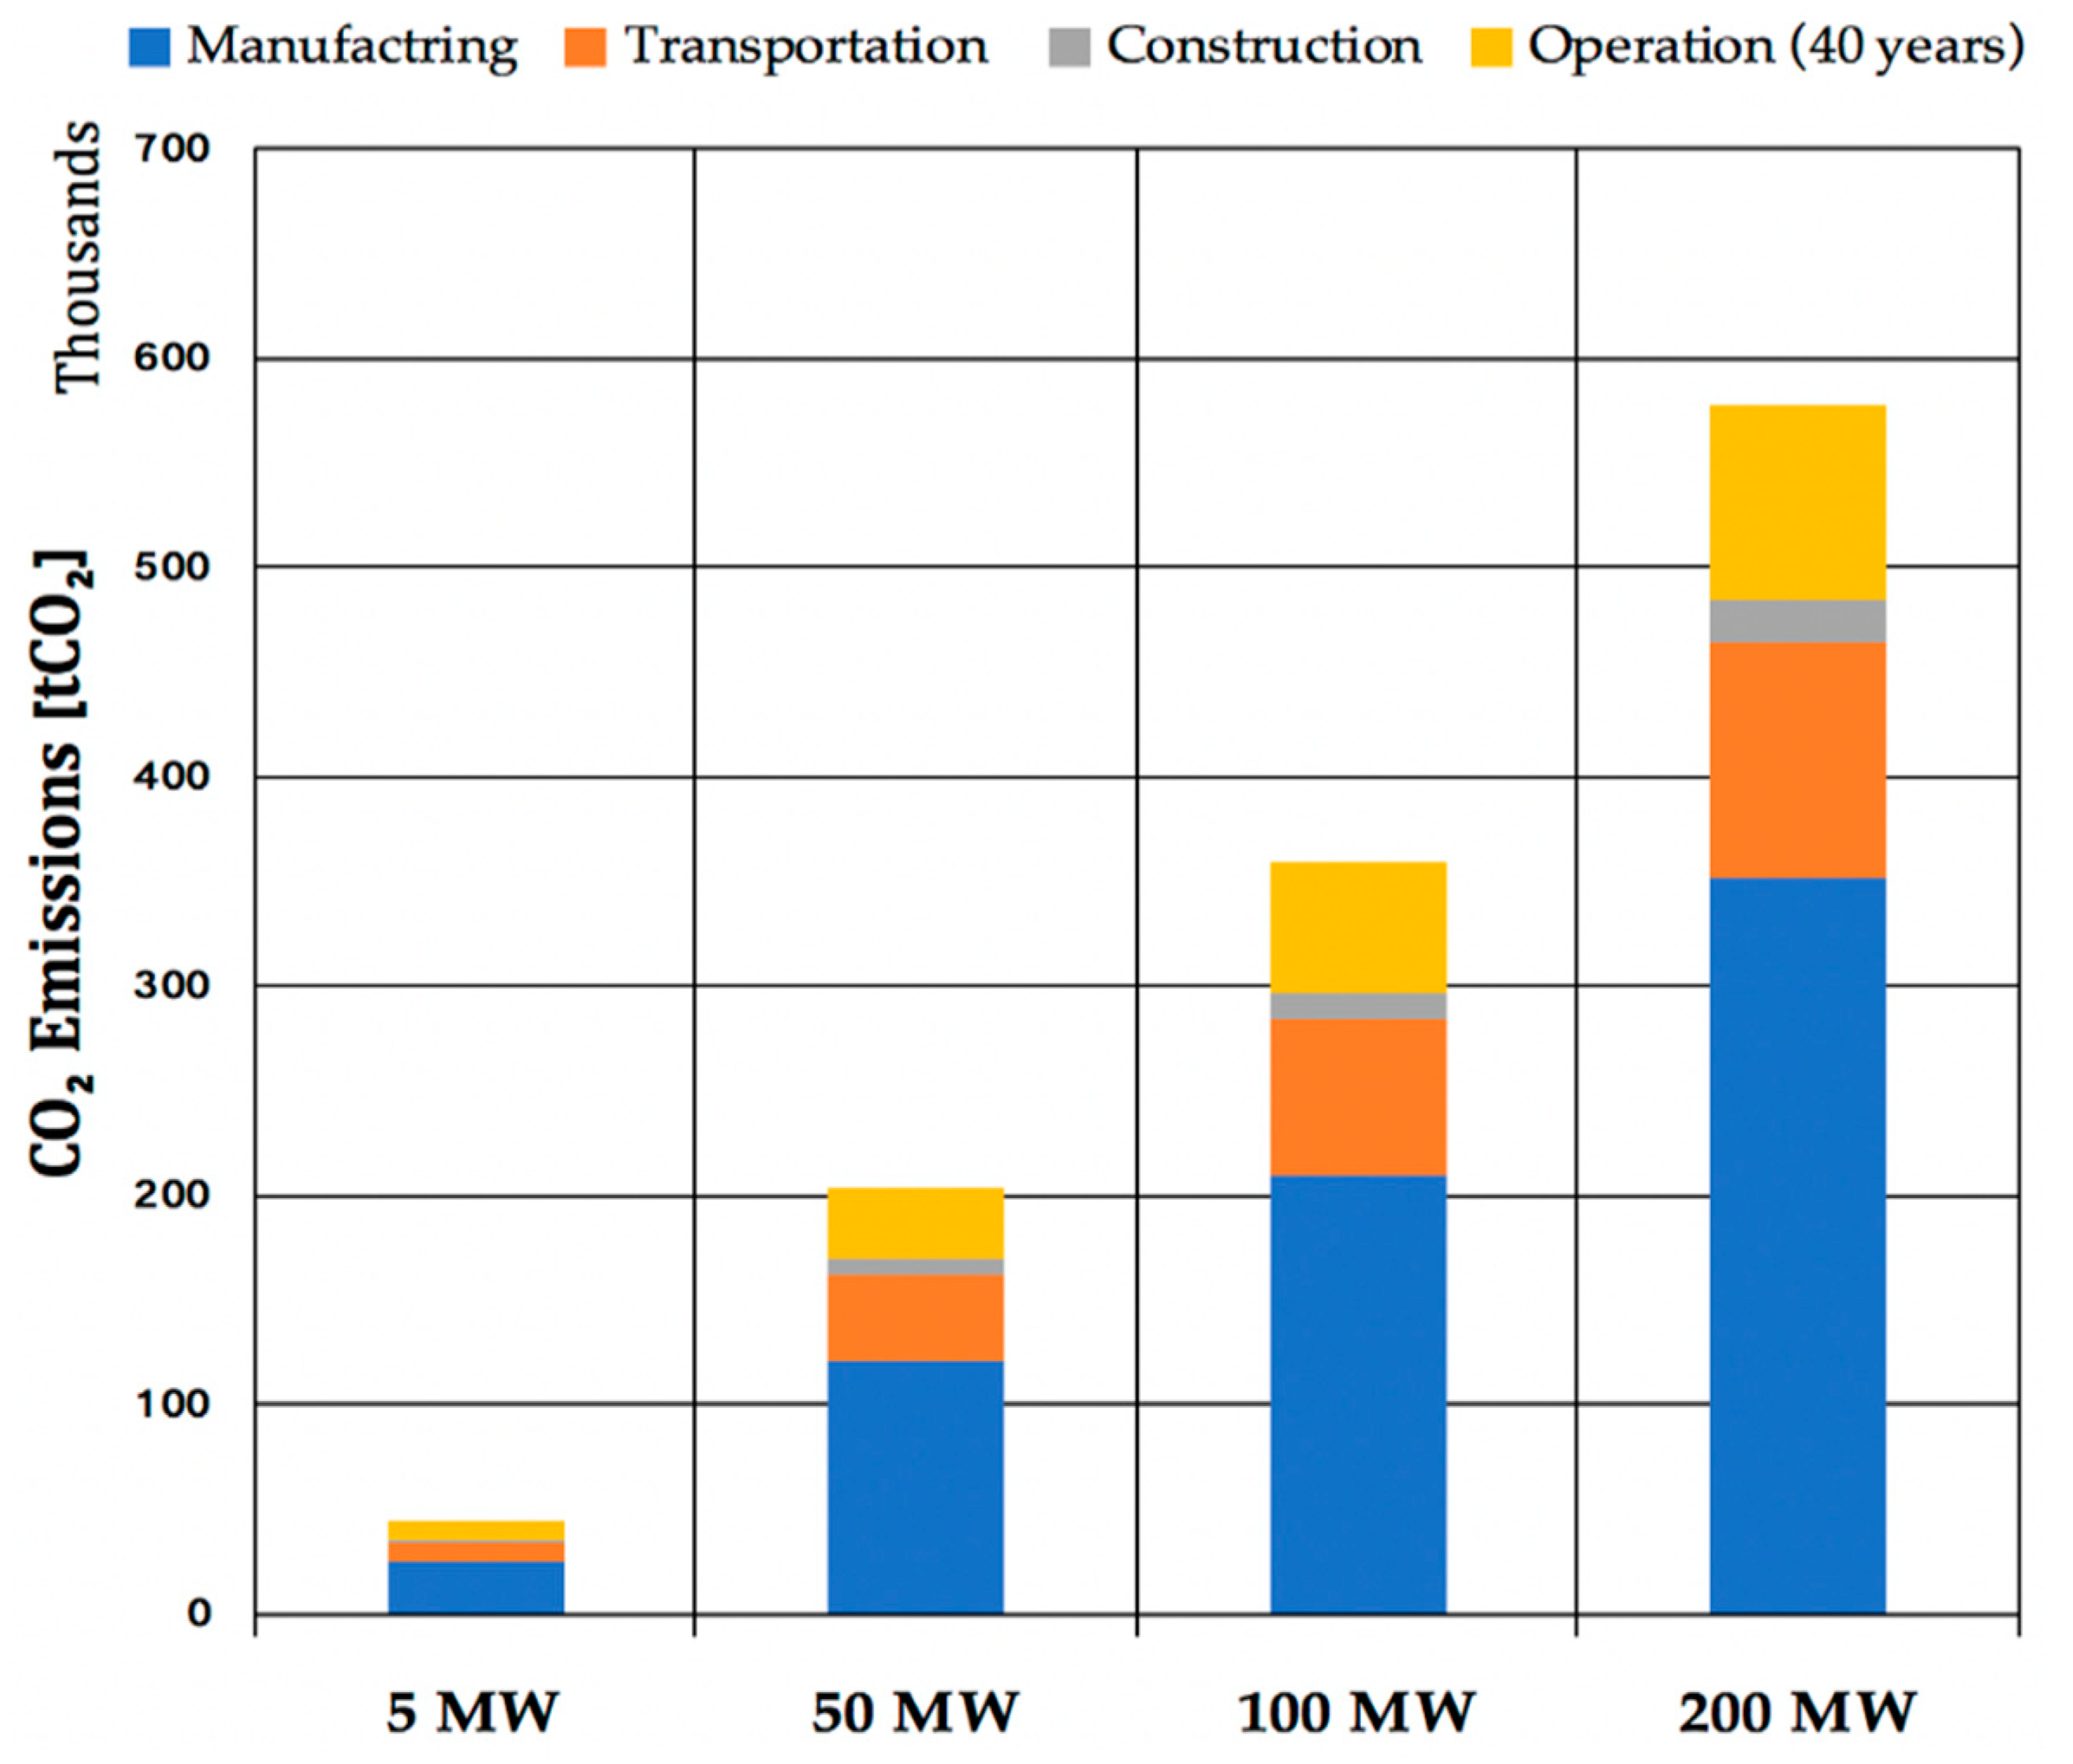
Figure 5.
Levelized electricity cost vs interest rate for selected STWT power generation systems.

Figure 6.
Ecological footprint in gha by each STWT power generation system in the life-cycle.
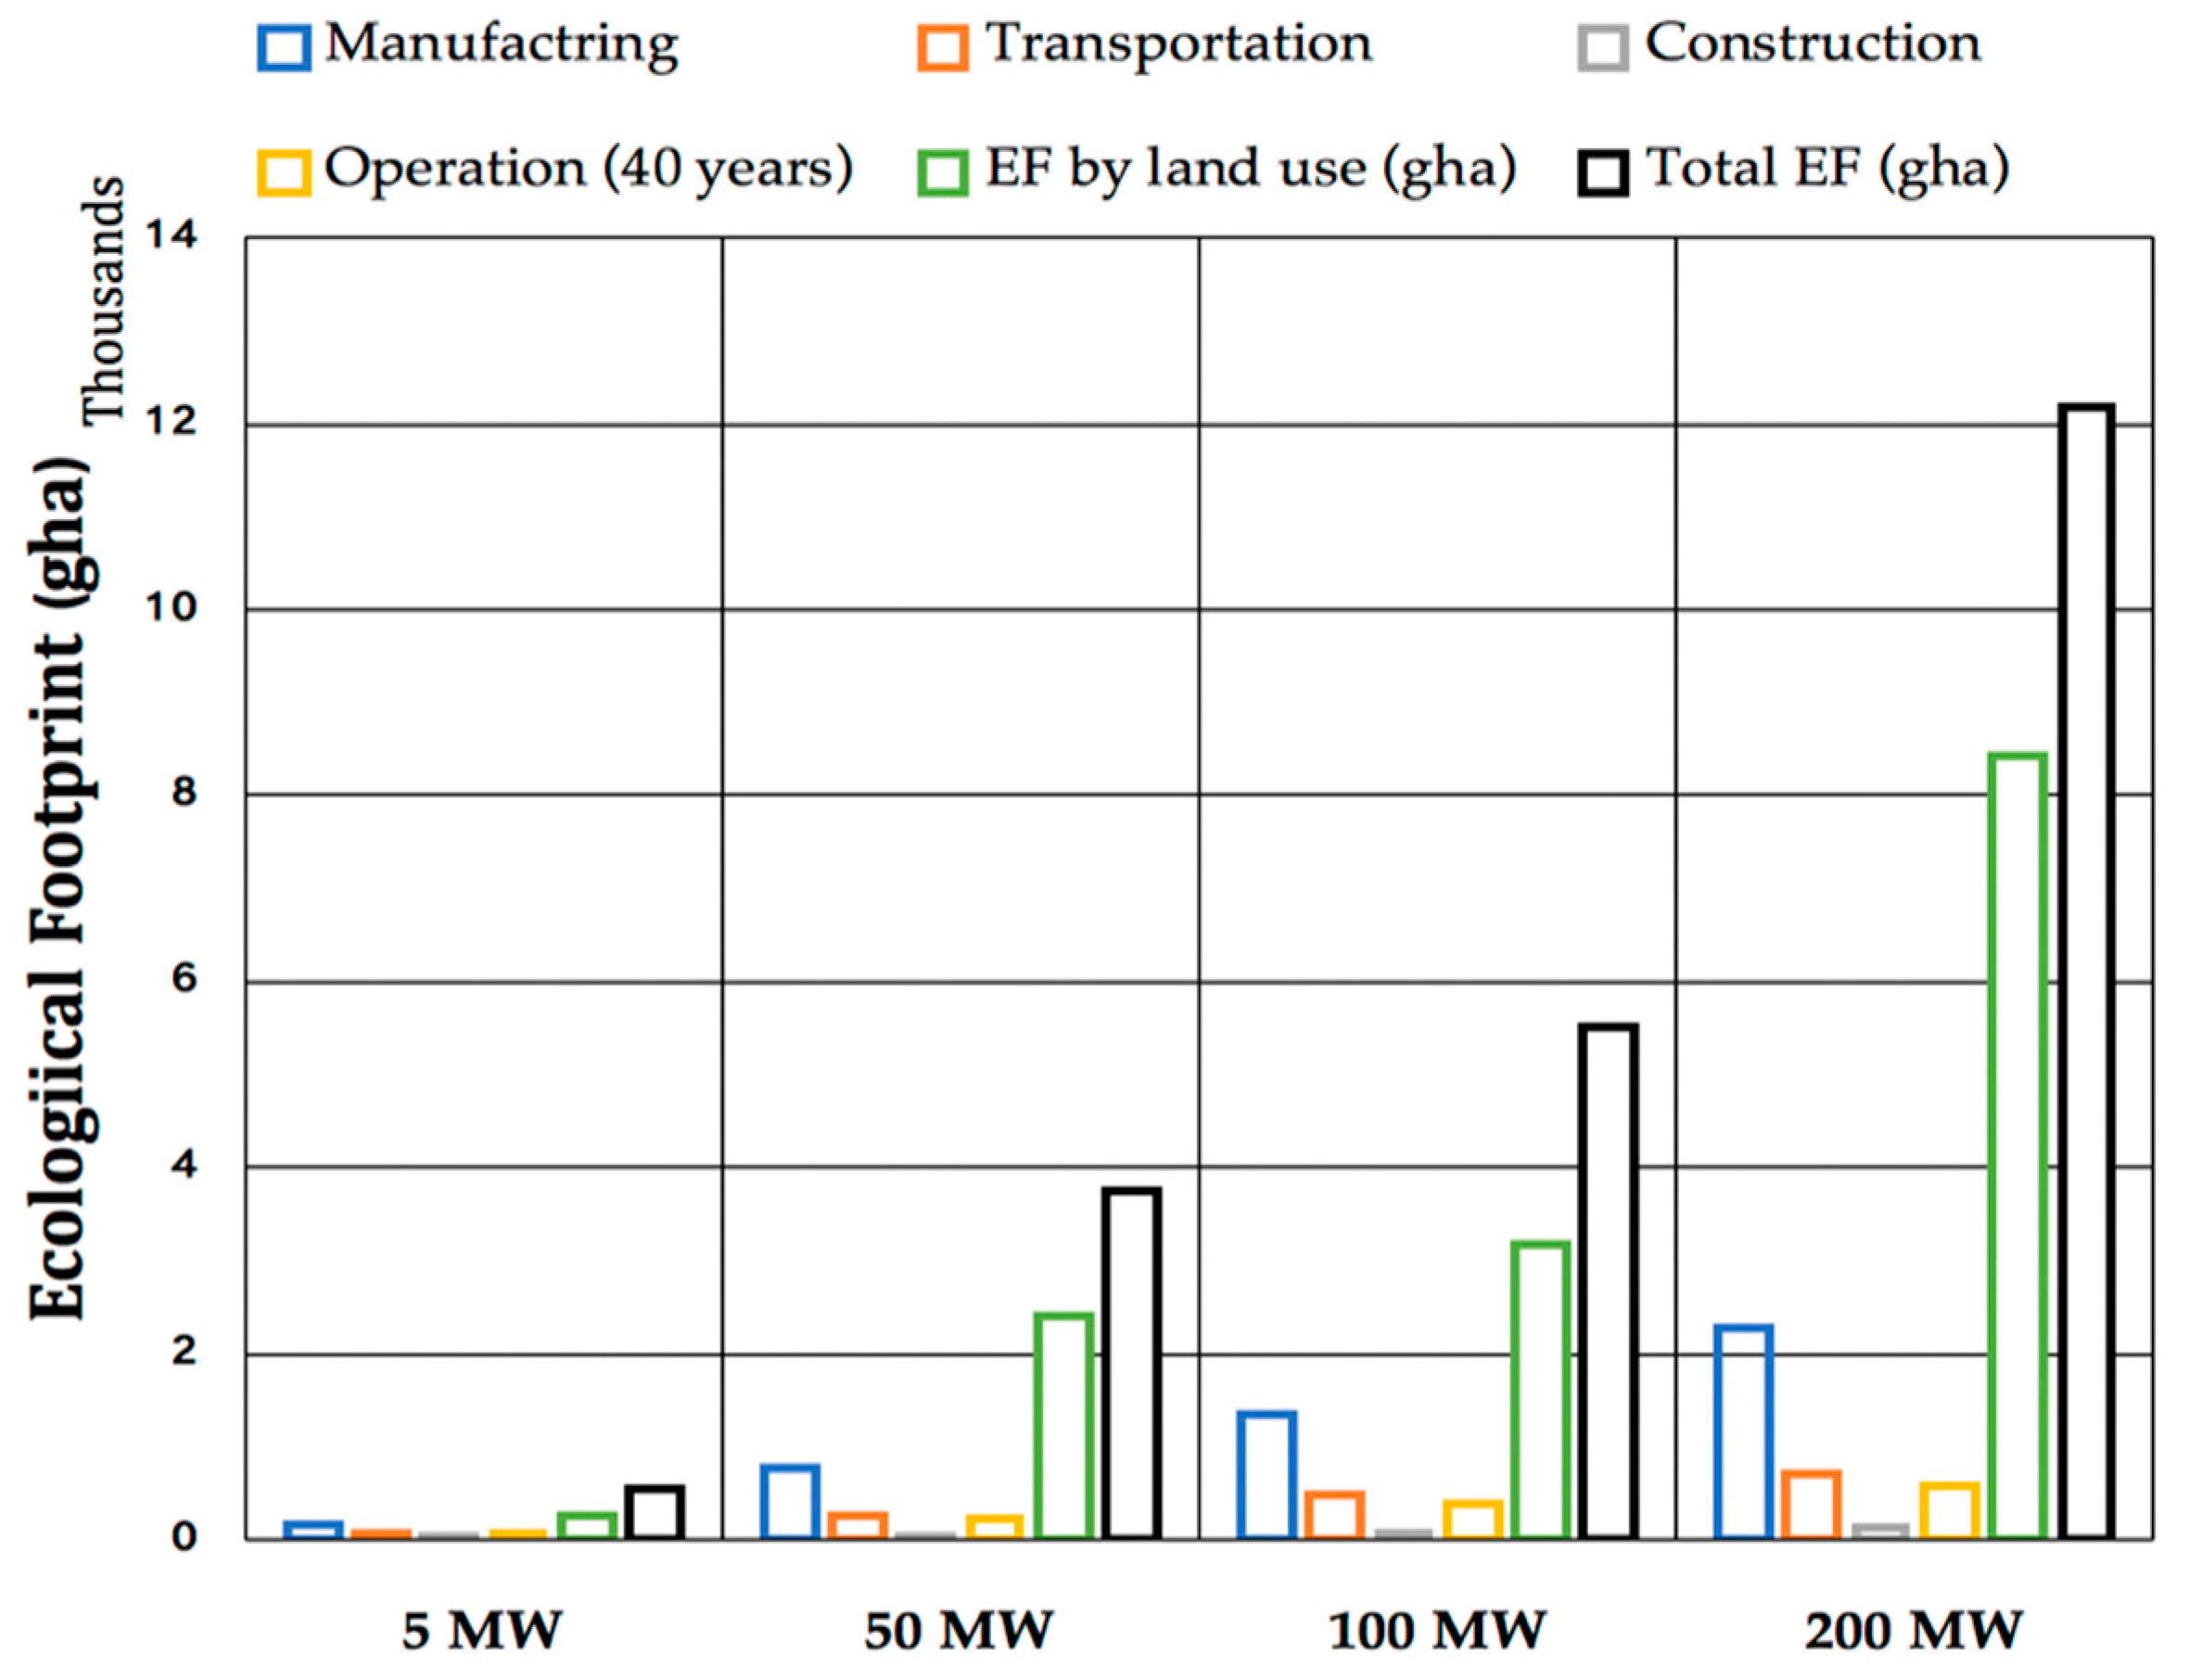
Figure 7.
IIIlight by each generating capacity of STWT system.

Figure 8.
Costs and benefits per year for each generating capacity of STWT system.

Figure 9.
Rate of CO2 emissions by each power generation technology. Where, LNG and PV denote liquefied natural gas and photovoltaic, respectively.
Figure 9.
Rate of CO2 emissions by each power generation technology. Where, LNG and PV denote liquefied natural gas and photovoltaic, respectively.

Figure 10.
Levelized Electricity Costs of different low-carbon power generation technologies. Where, PWR denote pressurized water reactor.
Figure 10.
Levelized Electricity Costs of different low-carbon power generation technologies. Where, PWR denote pressurized water reactor.

Figure 11.
Ecological footprints per GWh/year for each power generation technology.

Figure 12.
Total ecological footprint by on-land and offshore STWT systems.
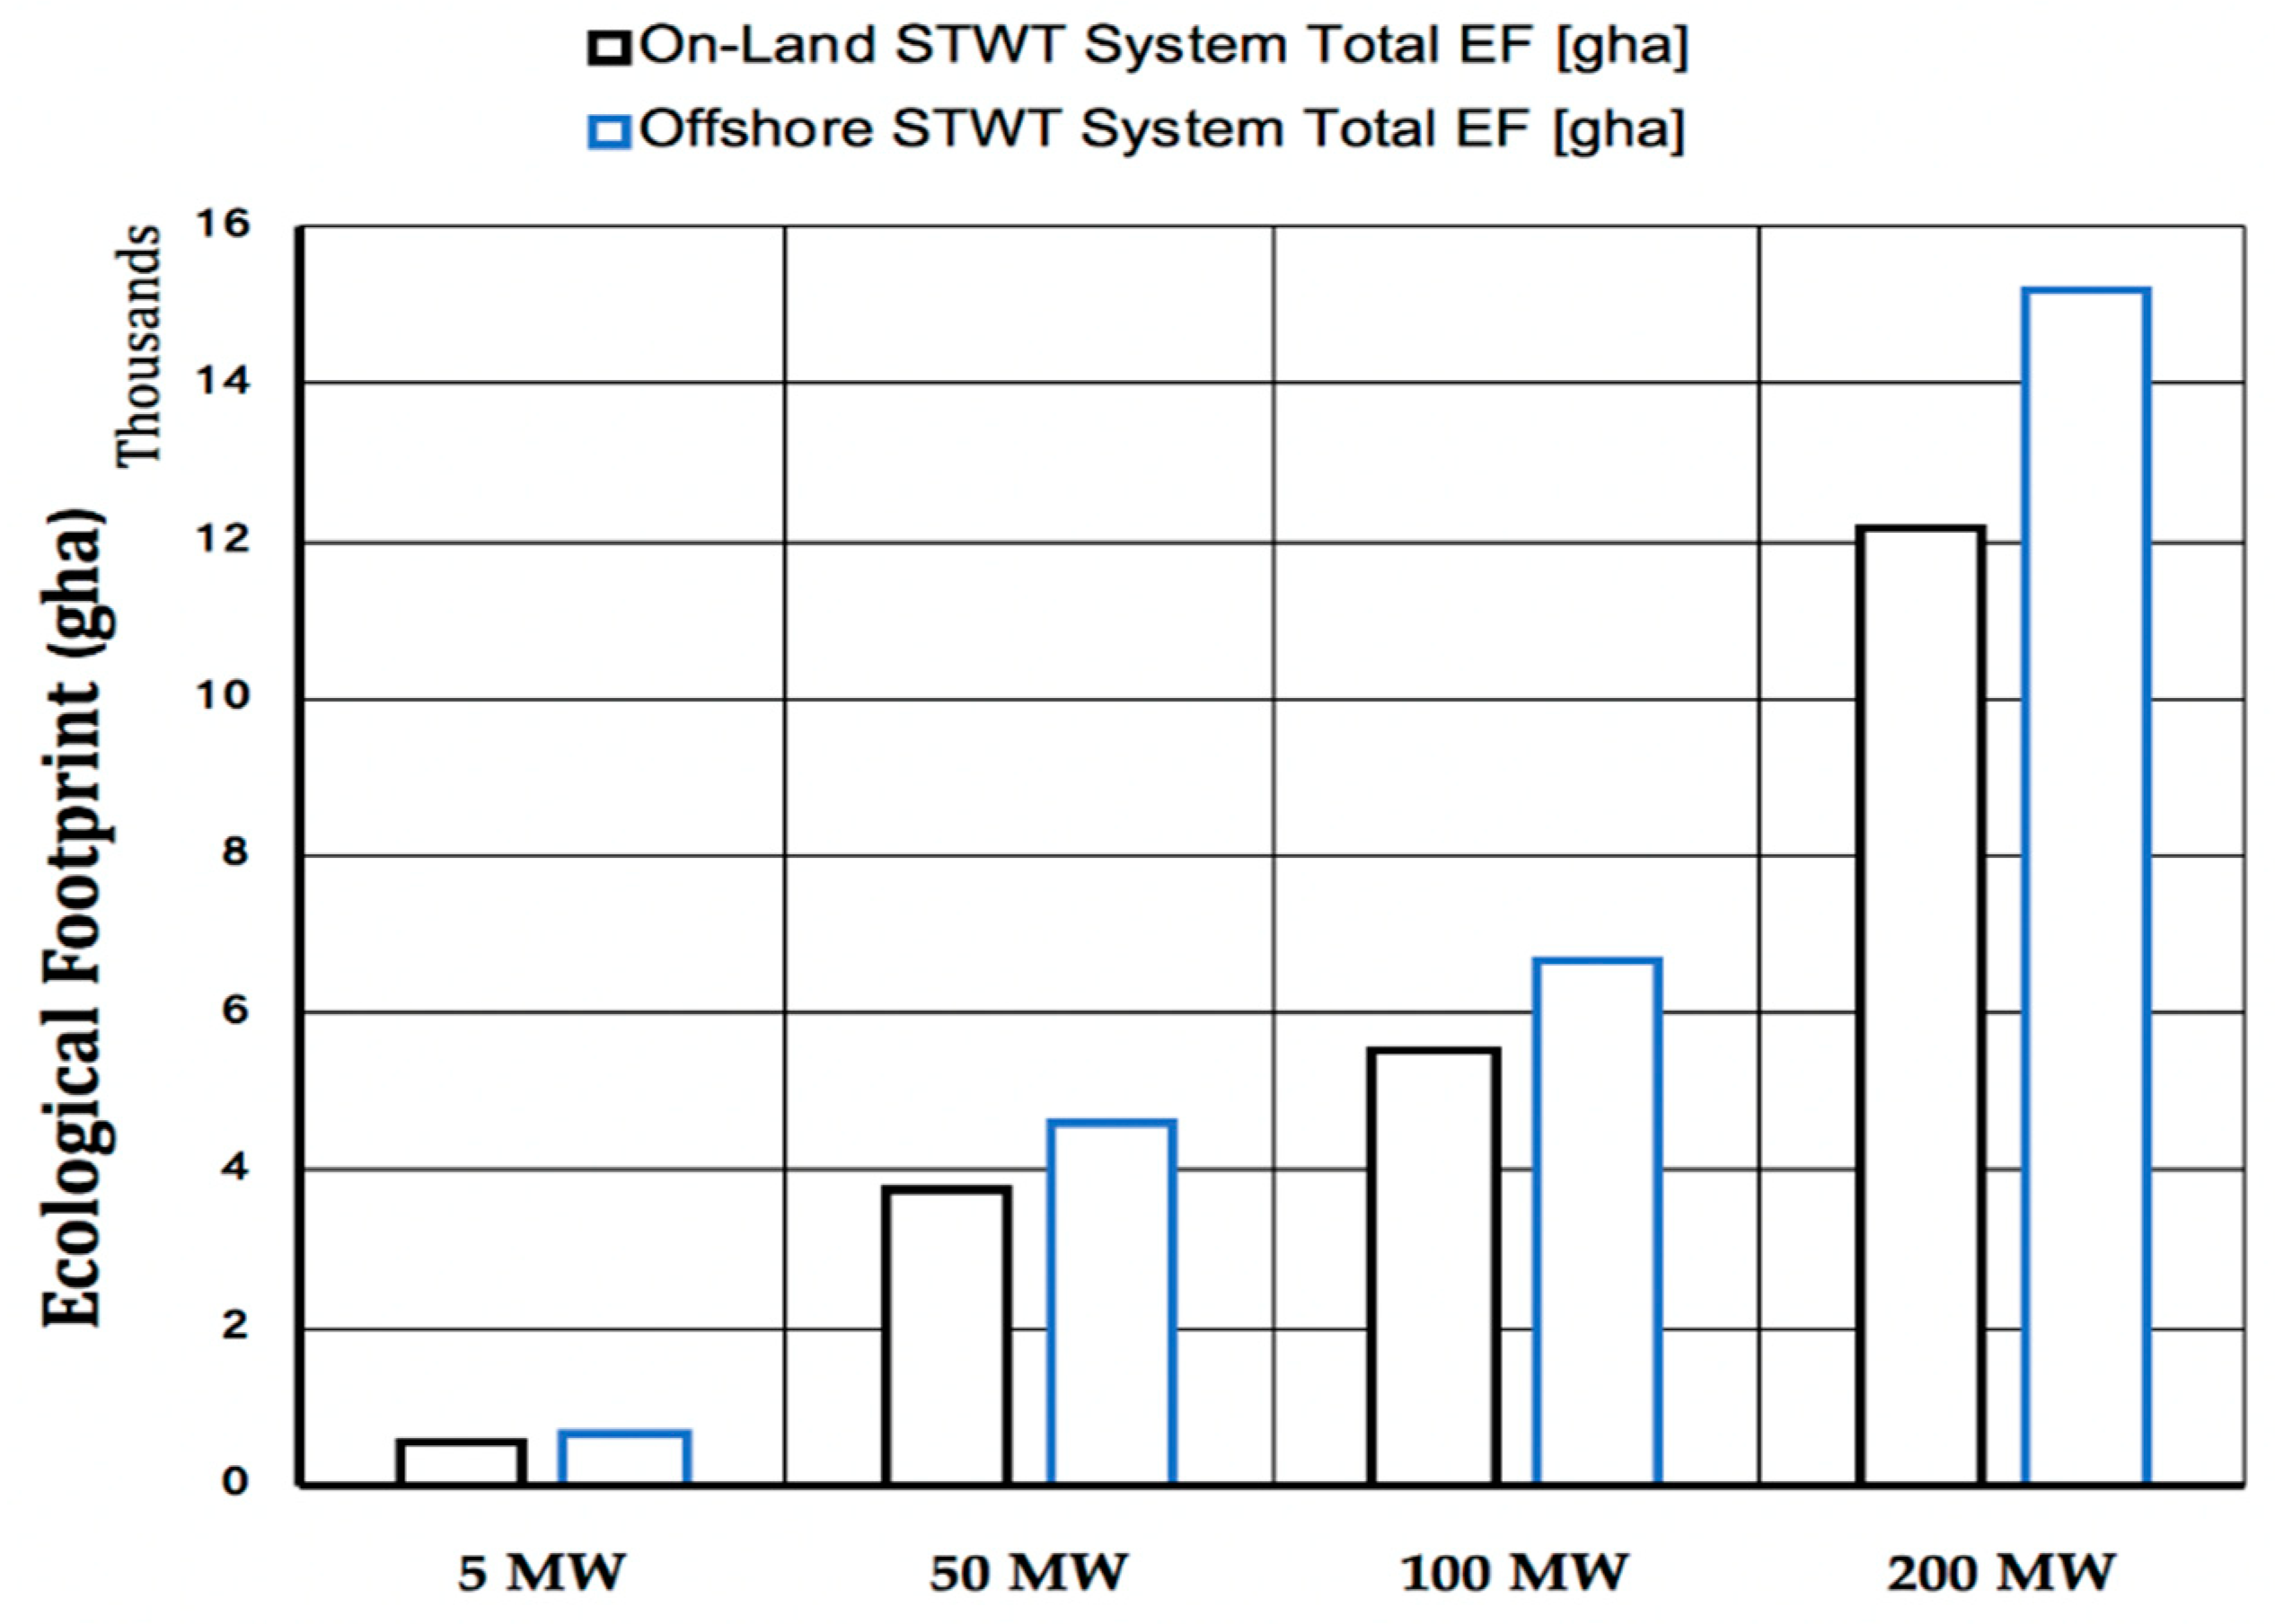
Table 1.
Weight distributions of each part of the selected STWT systems.
| Component | Weight (ton) | ||||
|---|---|---|---|---|---|
| 5 MW | 50 MW | 100 MW | 200 MW | ||
| Tower | 52,685.23 | 195,558.13 | 425,076.72 | 463,545.20 | |
| Collector | 12,664.55 | 113,980.91 | 149,867.16 | 397,160.14 | |
| Turbines | Blade | 201.60 | 201.60 | 201.60 | 201.6 |
| Nacelle | 331.20 | 331.20 | 331.20 | 331.2 | |
| Generator | 737.60 | 737.60 | 737.60 | 737.6 | |
| Total | 66,620.18 | 310,809.44 | 576,214.28 | 861,975.75 | |
Table 2.
CO2 emissions by the manufacturing stage of each part of the selected STWT power plants.
| Component | CO2 Emissions (tCO2) | ||||
|---|---|---|---|---|---|
| 5 MW | 50 MW | 100 MW | 200 MW | ||
| Tower | 15,805.57 | 58,667.44 | 127,523.02 | 139,063.56 | |
| Collector | 6712.21 | 60,409.88 | 79,429.60 | 210,494.88 | |
| Turbines | Total | 2601.58 | 2601.58 | 2601.58 | 2601.580 |
| Blade | 684.94 | 684.94 | 684.94 | 684.940 | |
| Nacelle | 506.89 | 506.89 | 506.89 | 506.893 | |
| Generator | 1409.75 | 1409.75 | 1409.75 | 1409.746 | |
| Total | 25,119.36 | 121,678.90 | 209,554.19 | 352,160.02 | |
Table 3.
Transportation related CO2 emissions including empty returns.
| Transportation System | Railway | Ship | Truck/Lorry |
|---|---|---|---|
| CO2 emissions (kg/(kg·km)) | ≈30 | 10–100 | 75–220 |
Table 4.
CO2 emissions by the transportation, construction stages, and operation and maintenance of the selected STWT power plants.
Table 4.
CO2 emissions by the transportation, construction stages, and operation and maintenance of the selected STWT power plants.
| Process | CO2 Emissions (tCO2) | |||
|---|---|---|---|---|
| 5 MW | 50 MW | 100 MW | 200 MW | |
| Transportation Stage | 8660.62 | 40,405.23 | 74,907.86 | 112,056.85 |
| Construction Stage | 1507.16 | 7300.73 | 12,573.25 | 21,129.60 |
| Operation and Maintenance | 9009.76 | 34,405.45 | 62,007.55 | 91,726.74 |
Table 5.
Typical dimensions and performance output data of selected STWT power plants.
| Capacity | 5 MW | 50 MW | 100 MW | 200 MW |
|---|---|---|---|---|
| Tower Height (m) | 550 | 750 | 1000 | 1000 |
| Tower Diameter (m) | 45 | 90 | 110 | 120 |
| Collector Diameter (m) | 1250 | 3750 | 4300 | 7000 |
| Collector Area (km2) | 1.22 | 11.04 | 14.52 | 38.48 |
| Electricity Output (GWh/Year) | 15 | 189 | 331 | 878 |
| No. of typical households | 2813 | 34,524 | 60,526 | 160,398 |
| Overall system efficiency (%) | 0.815 | 1.111 | 1.482 | 1.482 |
Table 6.
Investment costs and levelized electricity costs of selected STWT power plants.
| Capacity | 5 MW | 50 MW | 100 MW | 200 MW |
|---|---|---|---|---|
| Chimney cost [M€] | 5.4 | 20.0 | 43.4 | 47.3 |
| Collector cost [M€] | 36.3 | 326.9 | 429.9 | 1139.1 |
| Turbines cost [M€] | 4.2 | 34.7 | 47.3 | 118.6 |
| Total capital cost [M€] | 45.9 | 381.6 | 520.6 | 1305.1 |
| O&M cost [M€/year] | 0.2 | 1.9 | 2.6 | 6.5 |
| AEP [kWh] | 1.54 × 10⁷ | 1.89 × 10⁸ | 3.31 × 10⁸ | 8.78 × 10⁸ |
| LEC [€/kWh] | 0.2128 | 0.1443 | 0.1123 | 0.1062 |
© 2018 by the authors. Licensee MDPI, Basel, Switzerland. This article is an open access article distributed under the terms and conditions of the Creative Commons Attribution (CC BY) license (http://creativecommons.org/licenses/by/4.0/).
Share and Cite
MDPI and ACS Style
Elsayed, I.; Nishi, Y. A Feasibility Study on Power Generation from Solar Thermal Wind Tower: Inclusive Impact Assessment Concerning Environmental and Economic Costs. Energies 2018, 11, 3181. https://doi.org/10.3390/en11113181
AMA Style
Elsayed I, Nishi Y. A Feasibility Study on Power Generation from Solar Thermal Wind Tower: Inclusive Impact Assessment Concerning Environmental and Economic Costs. Energies. 2018; 11(11):3181. https://doi.org/10.3390/en11113181
Chicago/Turabian StyleElsayed, Islam, and Yoshiki Nishi. 2018. "A Feasibility Study on Power Generation from Solar Thermal Wind Tower: Inclusive Impact Assessment Concerning Environmental and Economic Costs" Energies 11, no. 11: 3181. https://doi.org/10.3390/en11113181
Note that from the first issue of 2016, this journal uses article numbers instead of page numbers. See further details here.