Use of Hydrogen in Off-Grid Locations, a Techno-Economic Assessment


1
Aragon Hydrogen Foundation, Parque Tecnológico Walqa, Ctra N330, km 566, 22197 Huesca, Spain
2
CEA Liten, Univ. Grenoble Alpes, DTBH, F-38054 Grenoble, France
*
Author to whom correspondence should be addressed.
Energies 2018, 11(11), 3141; https://doi.org/10.3390/en11113141
Submission received: 4 October 2018
/
Revised: 5 November 2018
/
Accepted: 8 November 2018
/
Published: 13 November 2018
(This article belongs to the Special Issue Sustainable Hydrogen Production, Storage and Utilization)
Abstract
:Diesel generators are currently used as an off-grid solution for backup power, but this causes CO2 and GHG emissions, noise emissions, and the negative effects of the volatile diesel market influencing operating costs. Green hydrogen production, by means of water electrolysis, has been proposed as a feasible solution to fill the gaps between demand and production, the main handicaps of using exclusively renewable energy in isolated applications. This manuscript presents a business case of an off-grid hydrogen production by electrolysis applied to the electrification of isolated sites. This study is part of the European Ely4off project (n° 700359). Under certain techno-economic hypothesis, four different system configurations supplied exclusively by photovoltaic are compared to find the optimal Levelized Cost of Electricity (LCoE): photovoltaic-batteries, photovoltaic-hydrogen-batteries, photovoltaic-diesel generator, and diesel generator; the influence of the location and the impact of different consumptions profiles is explored. Several simulations developed through specific modeling software are carried out and discussed. The main finding is that diesel-based systems still allow lower costs than any other solution, although hydrogen-based solutions can compete with other technologies under certain conditions.
1. Introduction
Population density and urbanization rates are key parameters to planning electricity grid extension. If certain thresholds are not reached, it is not cost-effective to provide access to the electricity grid for a large part of the population. Most of the incremental electrification over the period of 1990–2010 was in urban areas; even with this significant expansion, electrification only just kept pace with rapid urbanization in the same period [1]. On the other hand, both in developed and developing countries, renewable energies are growing. However, in developing countries, it is estimated that 1.16 billion people do not have access to electricity [2].
Another factor to take into account is that the addition of renewable power is limited in locations where there is no grid, weak grids, or grids that are already saturated with renewables due to the unpredictable or unsteady character of RES generation.
The world needs more RES generation. The Paris Agreement aims to strengthen the global response to the threat of climate change by keeping global temperature rise in this century well below 2 °C above pre-industrial levels and to pursue efforts to limit the temperature increase even further to 1.5 °C. To achieve this objective, the share of renewable energies must be 65% in 2050 [3], which will also have an important impact on the quality life of thousands of people across the globe [4].
For these reasons, a global market increase is expected and therefore set to make renewable energies more cost-competitive.
The objective of the EU and many other countries to achieve a low-emission energy system by 2050 [5] is expected to be one of the main drivers in the use of renewable energies in off-grid locations.
In the accomplishment of these environmental goals, technologies based on hydrogen could play a key role in the energetic transition. Hydrogen, as an energy carrier, can be produced by several energy sources. Going ahead to a decarbonized future, hydrogen can accomplish three great achievements: helping mobility, industrial applications and gas grid to greater decarbonization; taking advantage of the renewable production variability by using the excess of production and storing it for re-electrification; and carrying the energy to locations far from the source [6]. The use of power-to-hydrogen can be an attractive downstream market for renewable sources, reinforcing each other [7].
Within the use of hydrogen, the re-electrification pathway (by using a fuel cell) is a promising long-term option for seasonal renewable production and storage, rather than short-term situations (several hours) where batteries are more suitable, as shown by recent studies [8]. In contrast to batteries, hydrogen storage and fuel cell have a longer lifetime, higher temperature tolerance, and no self-discharge [9]. However, the most used solution for off-grid backup is undoubtedly diesel generators. In comparison with them, hydrogen requires less maintenance, produce less noise and less odor. All of these advantages support that the use of green hydrogen (obtained through RES) can be more interesting for isolated locations than the other technologies more commonly used (such as batteries, diesel generators and direct renewable sources) [6], and previous studies confirm its viability [10]. The main barrier to implementation of hydrogen-based technology is the high cost of the system, and the scarce availability of commercially competitive off-grid electrolysers, especially incorporating designs that work under variable renewable inputs.
The work presented in this paper is part of the project “PEM ElectroLYsers FOR operation with OFFgrid renewable installation (Ely4off)”, FCH JU contract n° 700359. The strategic goal of Ely4off is the design and engineering of a robust, flexible, highly efficient and cost-competitive PEMWE (Proton Exchange Membrane Water Electrolyzer) to be supplied by renewable sources and demonstrated at the facilities of the Aragon Hydrogen Foundation. This is a novel configuration, whose main advantages are capability of producing hydrogen with zero carbon emissions, possibility of re-electrification or use of hydrogen directly, self-sufficient operation, capability to endure low temperatures, and efficient operation under highly dynamic conditions. The demonstration site will be adapted to achieve the project outcomes of solar-powered hydrogen generation and complete isolation of the grid.
Thereby, the main objective of this paper is to evaluate the techno-economic feasibility of the system proposed within ELY4OFF, by comparing its technical and economic characteristics in different scenarios and under different conditions, aiming at promoting the use of hydrogen in off-grid sites. The main competitors are diesel generators, which currently occupy a large niche of the market and are expected to be sequentially replaced in the following years [4]. The specific cases to be assessed are defined by the following boundaries:
- Only electrical application
- Two locations with different amount of solar resource: Tenerife (Spain) with high potential and Edinburgh (Scotland) with low potential.
Recent studies mention the scarcity and limitation of data sources [13] to compare off-grid renewable energy systems based on hydrogen to the other more common technologies mentioned before. This fact stresses that green hydrogen should still be subject to further techno-economic analysis in order to obtain valuable data. This paper uses literature from different sources, including first-hand information from the partners of the project, aiming to create original and valuable information regarding the use of hydrogen in off-grid environments and contributing to the scarce current literature, being a relevant input for further studies. The results show different scenarios in which a wide range of energy systems can provide electrical loads in an off-grid environment from a techno-economic point of view, obtained through several simulations with a specialized modeling software. This software permits greater detailing in modeling several equipment, as well as offering strategies and big data, obtaining very accurate and realistic solutions.
The interpretation of the results not only identifies scenarios that can be profitable with the use of an Ely4off-based system, but also offers an economic comparison with other competitors. The specialized software, the approach used, and the modeling of a novel system based on green hydrogen produced by PEM technology provide valuable information and will boost the integration of an off-grid and renewable hydrogen cycle technology in the European market.
2. Materials and Methods
By using a specialized software recently created by one of the project partners, a simulated microgrid was modeled, which represented an isolated energy installation. Both economic and technical data are well provided in the literature or by project partners, who have a broad experience in the manufacturing and working of the model. Figure 1 shows the methodology followed to perform the assessment.
2.1. Simulation Tool
The simulation tool used in this work is ODYSSEY (Optimization and Design of hYbrid Storage Systems for rEnewable energY), a CEA-LITEN proprietary tool. It is an optimization platform developed to perform comprehensive techno-economic assessments of energy systems comprising renewable energy sources and energy storage units. The use of this tool makes the approach completely new, as the tool has only been used by CEA in other studies completely different from the present one.
The software has been entirely developed in C++ with an object-oriented approach and allows the following actions:
- The possibility to integrate different degrees of technical modeling of the different system components (production units, storage units, power converters, auxiliary components).
- The possibility to represent ageing of a given component through different approaches.
- A high level of modularity to represent different architectures of electrical and fluidic systems (choice of AC or DC buses, location of power converters).
- The ability to run simulations on small time steps in order to fully consider the impacts of intermittency and limited predictability of renewable energy sources on the economic results. Typical time steps range between 1 s and 1 h.
- The possibility to systematically optimize both the system sizing and the power control strategy.
Once the architecture is defined, the user configures each element (production units, storage units, converters, etc.). To do so, a techno-economic model and model parameters must be chosen for each component. The user then defines the power control strategies in charge of operating the whole system. This methodology is well explained in previous papers developed by CEA [14,15].
2.2. Case Study Presentation
2.2.1. Business Case Boundaries
The analysis is focused on the following case study: “Electrical powering of an isolated site load”. This scenario refers to locations where a connection to the grid is not possible, either because it is too expensive or because the location is too remote. In this situation, hotels or mountain huts in remote locations are very common examples, as well as small isolated villages in locations where the grid quality is very weak. Telecommunication systems, solar water pumps, refrigeration, street lighting or traffic signs are other common examples [4].
Two specific locations with different and representative solar profiles were chosen to be considered: Tenerife (Spain) with a great amount of solar radiation through the year, and Edinburgh (Scotland) with a lower and very seasonal solar radiation.
In this study, four different customer electrical loads are created and introduced into ODYSSEY software using a 10-min time step series:
- 1 kW steady load: representing a fixed load over the whole year illustrating power demand from a telecom antenna. This load, representing a total of 8.76 MWh over the year, is evaluated both in Tenerife and Edinburgh.
- 4 kW steady load: representing a fixed load over the whole year, illustrating power demand from a telecom antenna. This load, representing a total of 35.04 MWh over the year, is evaluated both in Tenerife and Edinburgh.
- Home load in Tenerife including lights, home equipment, air conditioning, and heating is not included.
- Home load in Edinburgh with the same scope as in Tenerife.
Heating is not considered due to the time restrictions and lack of representative data, but it would be interesting to use the residual heat that comes from the fuel cell for this purpose.
2.2.2. Ely4off Configuration
Ely4off consists on an off-grid autonomous system to be connected to photovoltaic (PV) panels. The energy produced by the renewable source is used to produce hydrogen with the electrolyser through specially designed DC-DC converts (Direct Current to Direct Current). This eases the operation of the electrolyzer under the variability of renewable sources and improves efficiency.
For correct operation of the system, it is mandatory to supply the so-called essential load continuously. This load includes communication and control devices (safety sensors) and also a heater to prevent damage due to the low temperatures. When no radiation is available, a Hybrid Storage System composed of Lead-Acid batteries and a fuel cell is in charge of the essential load supply. This redundant Hybrid Storage System allows a self-sufficient operation of the Ely4off for several days without solar radiation.
Once the hydrogen is produced at a high purity, it is stored in a low-pressure buffer at 20 bars directly from the electrolyzer. The hydrogen can be used for any purpose (in the project, the main purpose is mobility), but also to supply the fuel cell and replenish the essential load. The overall configuration is shown in Figure 2.
One of the characteristics of solar photovoltaics is the intermittency of the availability of power (due to cloud, fog or any other climate event). The PEMWE developed within Ely4off is capable of changing the H2 production from 0% to 100% in less than 30 s if the system is warm (typical condition if a cloud passes). If the climate event lasts longer and the system is cold, the nominal production of H2 is reached in less than 300 s, which is quite a good value, considering that the system performs safety checks to assure no leaks during turning on.
2.2.3. Power Systems in Competition
Three different systems are considered as potential competitors for an Ely4off system based on hydrogen production by PEM electrolysis:
- Photovoltaic (PV)–battery (BAT): two different technologies of batteries are considered—Lead-Acid (Pb-a) and Li-Ion.
- PV-Diesel generator: the diesel generator is used as a back-up when PV power is not sufficient.
- Diesel generator only.
These configurations (and similar variants) are nowadays the most commonly used in off-grid locations, being therefore the most mature solutions [18].
In order to simulate the Ely4off system and its competitors, Figure 3 shows the conceptual configurations to be modeled by the software.
2.2.4. Techno-Economic Hypothesis
Technical and economic hypothesis used for the development of simulations with ODYSSEY are presented in this section. The general set of hypothesis is represented in Table 1 and describes the simulation timeframe as well as time steps of the radiation profile and the electrical loads.
The reason for choosing 1 June is based on a timeframe scheduled in the project for the demo period, which will take eight months of operation. The simulation time step is 10 min, which is considered enough for the kind of system simulated.
Additional technical and economic hypothesis for each component within the systems are also necessary for system simulations. Economic hypothesis, such as investment, operation and maintenance (O&M), and replacement costs are presented in Table 2. As mentioned before, the data used is from previous studies using ODYSSEY [14,15,19] and from project partners’ knowledge.
The technical hypothesis for each of the element to be simulated is presented in Table 3. The data used in this table has been collected from recent studies developed by Ely4off partners, which includes hydrogen injection to the gas grid (to be published in 2019) and benchmarking of energy storage technologies [20]. Solar profiles are obtained from public databases developed by NREL [21].
2.2.5. Optimization Criteria and Methodology
ODYSSEY software allows for optimization of system components size in order to minimize user-defined indicators. Two criteria are used for the optimization of the system:
- Technical criterion: unsatisfied electrical load. The results presented in this paper are all considering 100% satisfaction of the load, because the load must be supplied 24/7. The equation is based on the difference between the provided load and the total required.
- Economic criterion: levelized cost of energy (LCOE). It can be defined as the total cost required to install, operate, and maintain a power-generating asset over its lifetime, divided by the total energy output of the asset over that lifetime. Equation is defined in [22].where n—life of the system, d—discount rate, y—year
Both criteria must be minimized in order to achieve the best results. To obtain them, the parameters mentioned in Table 3 as “to be optimized by ODYSSEY” are shown in Table 4.
In order to achieve the lowest criteria of LCOE and unsatisfied load, simulations are performed for each interval value among the range. The results presented in Section 3 show the optimized component value for which the system obtains the lowest LCOE and 0% of the unsatisfied load.
A multi-criterion, multi-parameter optimization algorithm is integrated into ODYSSEY. This genetic algorithm is used in this study to rapidly approach the optimal solution.
2.3. Sensitivity Analysis
In addition to the optimization criteria, a sensitivity analysis is carried out through additional simulations to obtain a wider outlook of the results. The parameters to which this analysis is applied are shown in Table 5.
3. Simulation Results
Results
The results illustrate conditions wherein off-grid hydrogen production may present a techno-economic interest for isolated site electrification.
Results are presented for six different scenarios, considering the two different locations and the defined electrical loads.
- Steady load 1 kW in Tenerife
- Steady load 4 kW in Tenerife
- Variable load (home) in Tenerife
- Steady load 1 kW in Edinburgh
- Steady load 4 kW in Edinburgh
- Variable load (home) in Edinburgh
Firstly, the results show that the available photovoltaic surface is a very important parameter to consider when comparing scenarios. The required photovoltaic peak power to be installed in Edinburgh is between two-three times greater than in Tenerife, depending on the final application as shown in Figure 4.
The photovoltaic power installed is clearly different for every location, being very large in Edinburgh in order to supply 100% of the load. As a consequence, technical issues such as available space to install the PV panels should be considered in real scenarios.
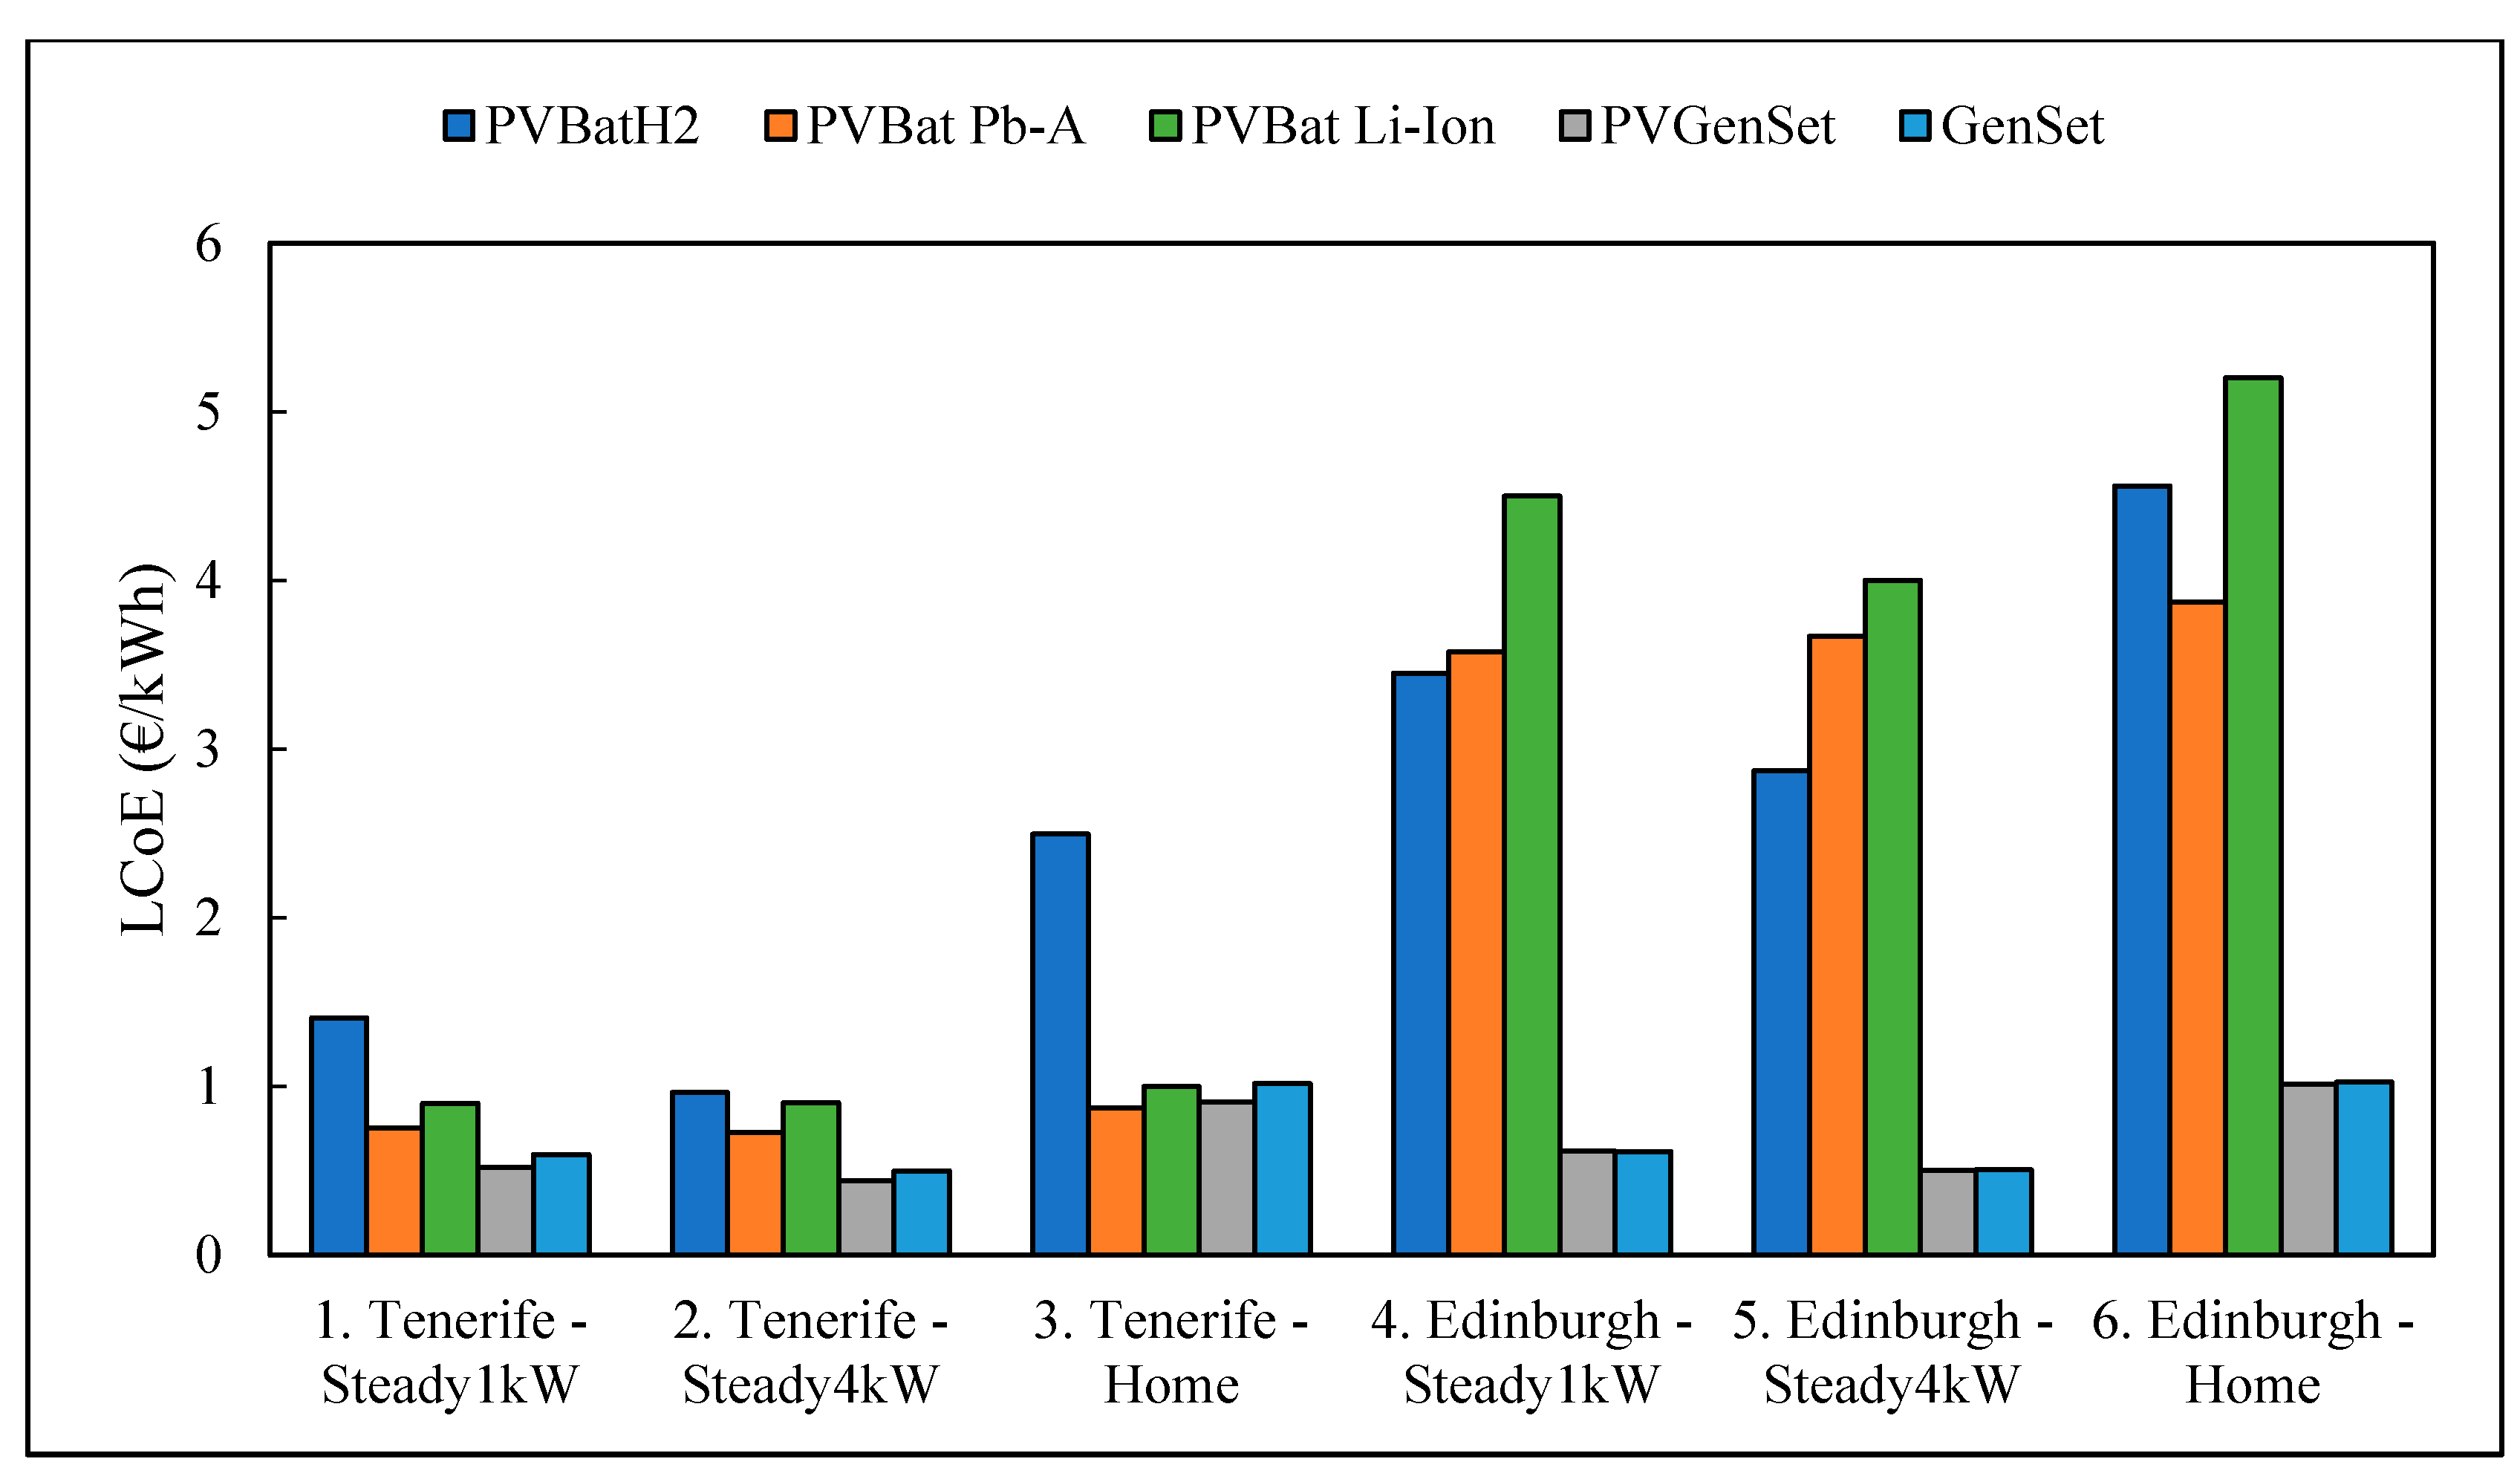
Figure 5 shows the optimal values observed for each simulated case, categorized by the location, type of load, and system in competition.
These results show that LCOE is three to four times higher in Edinburgh compared to Tenerife, when power solution is based on PV and storage means (no diesel generator). For the same load to satisfy, PV surface required in Edinburgh is about twice larger than in Tenerife and the required storage capacity to compensate for intermittency and variability is bigger, which explains the increased LCOE.
In Tenerife, for whichever type of load considered, PV-Bat-H2 is always the highest cost solution. This tends to show that hydrogen is not appropriate compared to a PV-battery solution in locations with high solar radiation.
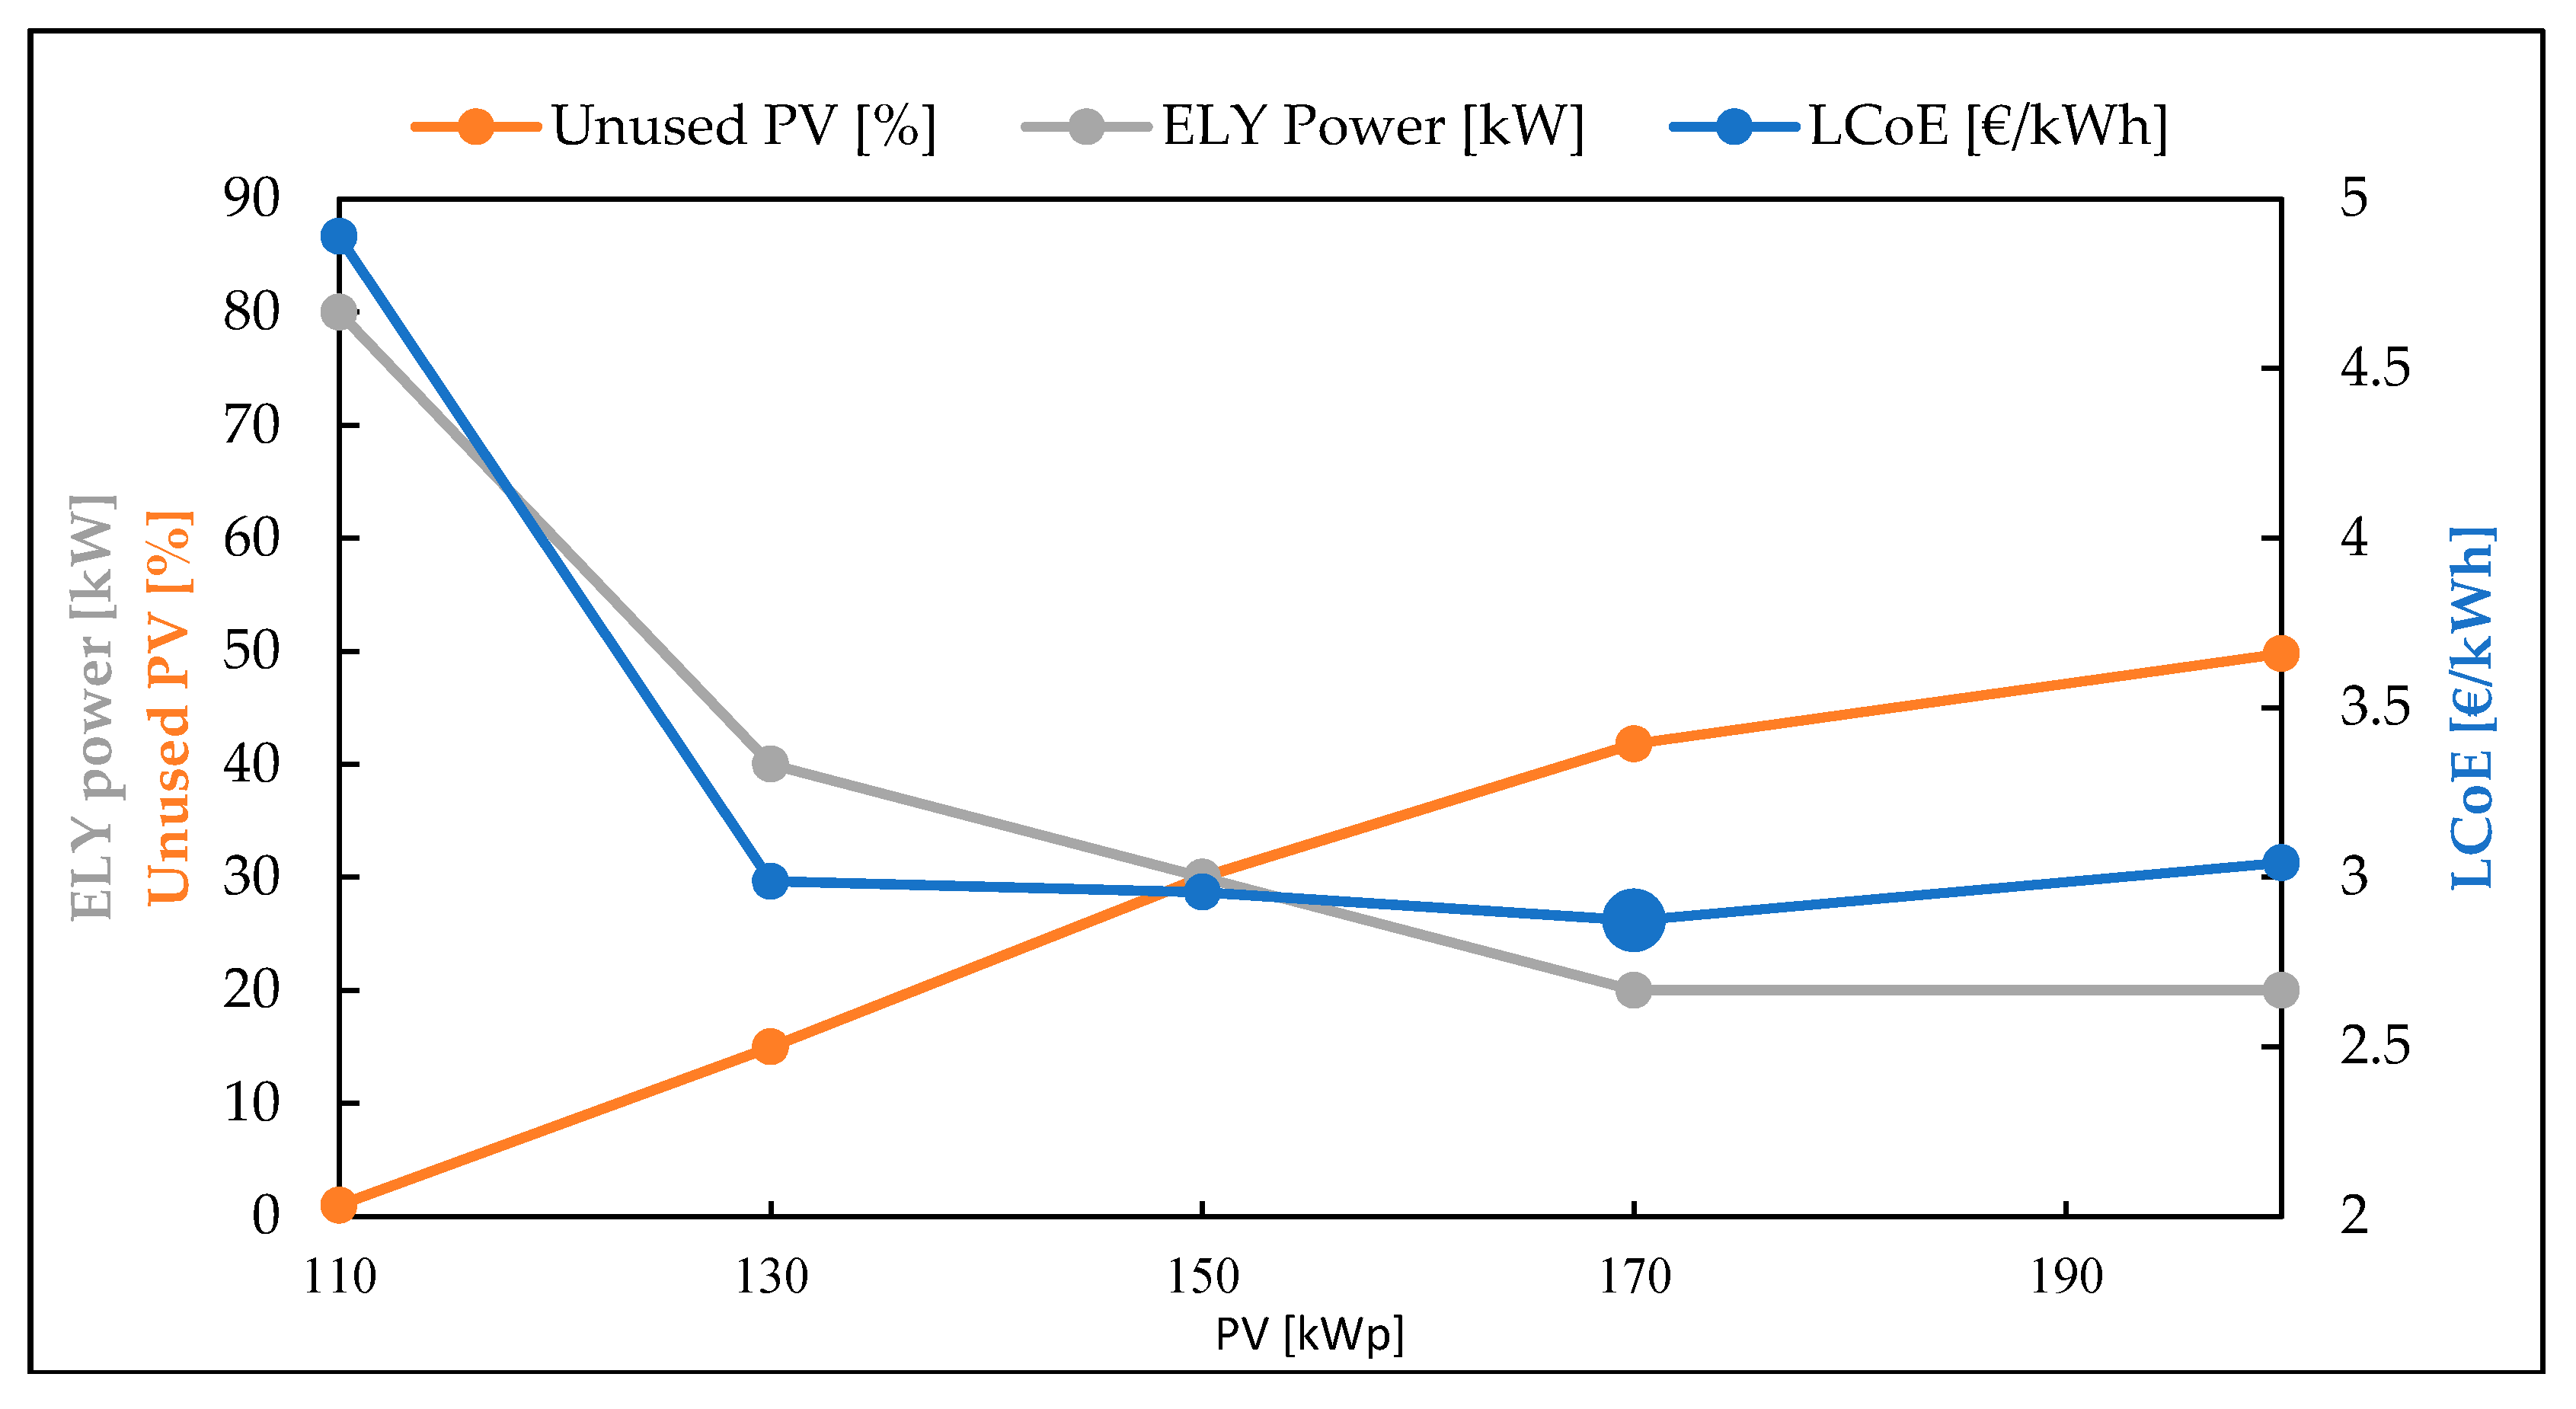
In Edinburgh, for 1 kW and 4 kW steady loads, the hydrogen-based solution seems preferable to a battery solution, when coupled with PV, but LCOE remains much higher than the diesel-based solution. Scenarios 4 and 5 are the most promising cases for Ely4off-based solutions. Thereby, in order to discuss them in more detail, further results of Scenario 5 are presented in Figure 6. It shows in the same axis the unused PV (percentage of energy produced and not used) and the power consumed by the electrolyzer. The LCOE is shown in the other axis. The figure shows the ODYSSEY internal calculations done during the optimization process of Scenario 5.
As the electrolyzer power decreases, the total LCoE also does, even if the PV power installed is increased. The figure shows a point in which the LCoE increases because the PV power also does, but the electrolyzer power cannot be lower in order to supply the electrical loads defined in the boundaries case. This allows stating a point in which the parameters are optimized to find the lowest LCoE (2.873 €/kWh) and 0% of unsatisfied load, with 41.8% of unused PV (oversized). This point is the one represented in the previous Figure 5 for Scenario 5.
In order to understand the cost structure of the solution based on Ely4off (lesser known than the competitors), Figure 7 shows the cost breakdown for 20 years of operation of both the overall system and specifically the elements directly related to hydrogen technology (electrolyzer, fuel cell, compressor and storage). A major part of the cost is for the photovoltaic source and the conversion device for coupling to the electrolyzer; the hydrogen chain accounts for the second greatest cost, followed by the batteries. Within the hydrogen chain, the greatest cost is for hydrogen storage, followed by the electrolyzer, and the fuel cell. The compressor is the lowest cost because of its low power size.
Li-ion battery results are 10% to 20% higher than lead-acid ones, probably caused by the replacement cost hypothesis. The same cost of replacement after 10 years of operation has been taken for both, although a fall in the cost of Li-ion can be expected in the next years.
In Figure 6, the concept of unused PV was presented for Scenario 5, showing values of around 40%. Similar results are obtained for the remaining technologies (for example, values as high as 30% to 40% of unused PV are obtained for Tenerife or Edinburgh. This outcome shows show that the low cost of PV installation favors oversizing, when compared to other elements of the system. However, it is very difficult to find a situation where 50% of the PV is unused (due to surface availability, for example), although it appears to be more economically interesting.
Within the frame of the Ely4off project, the nominal power envisioned for the electrolysis system is 50 kW. None of the optimized scenarios from this work led to a suggested size of electrolysis of 50 kW. Only the 4 kW steady load scenario in Edinburgh showed results close to it. It is worth pointing out the characteristics of this scenario in Table 6, which shows the values of the most competitive scenario based on Ely4off, compared against its competitors.
It should be highlighted that these values are obtained based on a certain set of boundaries and other parameters, and should be merely considered as indications, on conditions allowing for a 50-kW electrolysis used in isolated site electrification, and as economically competitive compared to PV-Bat solutions.
On the other hand, the hydrogen stored in Tenerife and Edinburgh for Scenario 5 clearly shows a seasonal tendency (see Figure 8). Energy is stored as H2 during summer and consumed by the fuel cell during winter in both locations.
The left-hand section shows the H2 storage profile in Tenerife, indicating that H2 is produced and stored during summer and used in winter, with slights variations during the weeks. The right one shows the same situation in Edinburgh, where the seasonality of the H2 storage is more evident.
The effect of diesel price has been also assessed (see Table 5). In the results presented until now, a value of 2 €/L has been used, and the effect up to 3 €/L is assessed. It is observed (Figure 9) that LCOE values offer very slight variations (roughly 0.2 €/kWh per €/L) when price of diesel varies from 1 €/L to 3 €/L in Scenario 5. These variations do not change the comparison of technologies discussed throughout the manuscript.
4. Discussion
The main lessons that can be learned based on the work performed is:
- LCOE for PV-Bat and PV-Bat-H2 observed in Tenerife are three times lower than those observed in Edinburgh. This is not surprising, but the results offer a quantitative tool worthy for assessing the implementation of these technologies in locations with different solar resources.
- The elements that appear to be giving hydrogen an advantage are:
- ⚬
- A high seasonality for PV production requiring a large quantity of energy stored in summer to be reused in winter, as is shown for Edinburgh in Figure 8. In all of the scenarios assessed for Tenerife, the most expensive technology is PV-Bat-H2, while in Edinburgh, PV-Bat-H2 is the third-best technology in two scenarios.
- ⚬
- It powers a demanding profile requiring daily energy shift from day to night.
- ⚬
- A constrained PV production due to limited available surface.
It is interesting to notice that minimizing PV is not an optimal configuration from an economic point of view, as it requires a larger storage capacity, which has a strong impact on LCoE. It is always more economically interesting to oversize a PV plant, if possible, even though a potentially large part of the PV production is unused.
Additional results of the sensitivity analysis defined before lead to the following conclusions:
- For PV-Bat-H2, in scenarios where hydrogen seems to have a potential interest compared with the rest of the competitors (steady loads in Edinburgh), a conclusion is that when a PV surface available is limited, increasing the electrolysis size may present a techno-economic interest.
- Diesel-based systems still allow lower costs than any other solution, even if we consider 3 €/L fuel cost, after the sensitivity analysis performed for different values of fuel cost as defined in the economic hypothesis.
Comparison with Other Studies
Other studies on the use of hydrogen as a power do not consider the same approach as the present study. Relevant differences on the methodology and the data used are described below:
- To begin with, it is common to use the software HOMER to obtain LCOE values in these off-grid scenarios; however, this software has an important limitation of editable parameters when hydrogen is part of the system [10,23]. The use of ODYSSEY allows the modeling and programming of an infinite number of flows of mass, energy, etc. Elements such as the electrolyzer are modeled to include complex parameters, such as stoichiometry, pressure, operation temperature, and polynomial efficiency. This is reflected in the results and strategies to follow.
- Some economic and technical data from Table 2 and Table 3 are part of the current knowledge of the different project partners. Some values come from a specialized company in the manufacturing of integrated hydrogen energy systems (ITM Power) and from an innovative converter manufacturing company (Epic Power). Their business experience and market knowledge has a great impact over the main assumptions.
- The Ely4off object of this assessment is a novel system, which allows total independence of the grid, even in very cold locations where anti-freezing action is needed. It also guarantees that the essential load is covered and allows direct coupling of the photovoltaic source to the PEM electrolyzer, avoiding losses. Other assessments based on renewable hydrogen for re-electrification do not consider a 100% of renewable penetration [24].
- This paper presents the use of hydrogen-based power to power systems and is compared against their main competitors that are common current solutions. This allows a wide outlook of the current status in off-grid scenarios, not only the ones based on hydrogen, but also on batteries and diesel generators.
- Other approaches consider alkaline technologies and larger systems (>1 MW) [25]. The values obtained here are for different purposes and the use of PEM technology is more suitable to the variability of the renewable sources than alkaline, thanks to its dynamic operation, as shown in previous studies [26].
Based on these results, further research and simulations can be performed with different renewable sources, such as on-shore wind, off-shore wind or hydroelectric, in order to look for lower LCOE of the Ely4off system in off-grid locations for electrification case studies. It will also be included in different case studies: green mobility, power to hydrogen for gas grid injection and industrial applications.
5. Conclusions
The use of an energy system based on the Ely4off system is feasible but only profitable in some of the different scenarios discussed. The re-electrification of hydrogen is still very expensive, when compared to its competitors, which makes the installation of batteries and diesel generators more suitable. However, when seasonality is important, room for installing PV is limited, and electrical load is high during nights, the use of hydrogen can be profitable.
Thereby, it is encouraging and worth to point out that the system analyzed based on PEM technologies and able to operate in a self-sufficient way with 0% grid penetration has given economic values that can compete with other technologies under certain conditions. This is achieved thanks to the high dynamism of the PEM electrolyzer, the capability of hydrogen to be stored for long periods, its great energy density, and the high efficiencies achieved in the Ely4off system.
Author Contributions
Conceptualization, C.B., A.C. and L.G.; methodology, C.B.; software, C.B.; validation, P.C. and C.B.; formal analysis, A.C.; investigation, A.C. and L.G.; data curation, A.C. and L.G.; writing—original draft preparation, L.G.; writing—review and editing, L.G.; visualization, L.G.; supervision, P.C.; project administration, P.C.
Funding
This research is part of the project Ely4off, which was funded by the Fuel Cells and Hydrogen 2 Joint Undertaking under grant agreement No. 700359.
Acknowledgments
We thank the technicians from ITM Power for their valuable information in the modeling of the electrolyzer.
Conflicts of Interest
The authors declare no conflict of interest. The funders had no role in the design of the study; in the collection, analyses, or interpretation of data; in the writing of the manuscript, or in the decision to publish the results.
References
- Shonali, P.; Abeeku, B.-H.; Douglas, F.B.; Daniel, H.B.; Stephen, G. Chapter 19: Energy Access for Development. In Global Energy Assessment—Toward a Sustainable Future; Cambridge University Press: Cambridge, UK, 2012; ISBN 978-1-107-00519-8. [Google Scholar]
- Ferroikhi, R.; Lucas, H.; Renner, M.; Lehr, U.; Breitschopf, B.; Lallement, D. IRENA. Renewable Energy and Jobs; International Renewable Energy Agency: Abu Dhabi, Vereinigte Arabische Emirate, 2013; p. 144. [Google Scholar]
- Gielen, D.; Gorini, R.; Wagner, N.; Leme, R.; Gutierrez, L.; Prakash, G. Global Energy Transformation: A Roadmap to 2050; International Renewable Energy Agency: Abu Dhabi, Vereinigte Arabische Emirate, 2018; p. 76. [Google Scholar]
- Kempener, R.; Lavagne d’Ortigue, O.; Saygin, D.; Skeer, J.; Vinci, S.; Gielen, D. Off-grid renewable energy systems: Status and methodological issues. Int. Renew. Energy Agency Abu Dhabi 2015, 36. [Google Scholar]
- Commission, E. A Roadmap for moving to a competitive low carbon economy in 2050. COM 2011, 112, 16. [Google Scholar]
- IRENA Hydrogen from renewable power: Technology outlook for the energy transition. Int. Renew. Energy Agency Abu Dabhi 2018, 52.
- Chardonnet, C.; Giordano, V.; De Vos, L.; Bart, F.; De Lacroix, T. Study on Early Business Cases For H2 in Energy Storage and More Broadly Power to H2 Applications; FCH-JU: Brussels, Belgium, 2017; p. 228. [Google Scholar]
- Bielmann, M.; Vogt, U.F.; Zimmermann, M.; Züttel, A. Seasonal energy storage system based on hydrogen for self sufficient living. J. Power Sourc. 2011, 196, 4054–4060. [Google Scholar] [CrossRef]
- Scamman, D.; Newborough, M.; Bustamante, H. Hybrid hydrogen-battery systems for renewable off-grid telecom power. Int. J. Hydrog. Energy 2015, 40. [Google Scholar] [CrossRef]
- Singh, A.; Baredar, P.; Gupta, B. Techno-economic feasibility analysis of hydrogen fuel cell and solar photovoltaic hybrid renewable energy system for academic research building. Energy Convers. Manag. 2017, 145, 398–414. [Google Scholar] [CrossRef]
- Bruni, G.; Cordiner, S.; Mulone, V.; Giordani, A.; Savino, M.; Tomarchio, G.; Malkow, T.; Tsotridis, G.; Bodker, S.; Jensen, J.; et al. Fuel cell based power systems to supply power to Telecom Stations. Int. J. Hydrog. Energy 2014, 39, 21767–21777. [Google Scholar] [CrossRef]
- Margaret Amutha, W.; Rajini, V. Techno-economic evaluation of various hybrid power systems for rural telecom. Renew. Sustain. Energy Rev. 2015, 43, 553–561. [Google Scholar] [CrossRef]
- Ma, Z.; Eichman, J.; Kurtz, J. Fuel Cell Backup Power Unit Configuration and Electricity Market Participation: A Feasibility Study; National Renewable Energy Laboratory: Lakewood, CO, USA, 2017.
- Guinot, B.; Bultel, Y.; Montignac, F.; Riu, D.; Pinton, E.; Noirot-Le Borgne, I. Economic impact of performances degradation on the competitiveness of energy storage technologies—Part 1: Introduction to the simulation-optimization platform ODYSSEY and elements of validation on a PV-hydrogen hybrid system. Int. J. Hydrog. Energy 2013, 38, 15219–15232. [Google Scholar] [CrossRef]
- Guinot, B.; Montignac, F.; Champel, B.; Vannucci, D. Profitability of an electrolysis based hydrogen production plant providing grid balancing services. Int. J. Hydrog. Energy 2015, 40, 8778–8787. [Google Scholar] [CrossRef]
- ITER—The Way to New Energy. Available online: http://www.iter.org (accessed on 4 September 2018).
- Centre for Renewable Energy Systems Technology (CREST)|CREST|Loughborough University. Available online: http://www.lboro.ac.uk/research/crest/ (accessed on 28 August 2018).
- Schmidt, F.; Schonheit, D.; Kober, M. Energy Solutions for Off-grid Applications; Deustche Energie-Agentur GmbH (dena): Berlin, Germany, 2017; p. 43. [Google Scholar]
- Parks, G.; Boyd, R.; Cornish, J.; Remick, R. Hydrogen Station Compression, Storage, and Dispensing Technical Status and Costs: Systems Integration; National Renewable Energy Laboratory: Lakewood, CO, USA, 2014.
- Gracia, L.; CHabert, A.; Casero, P. Benchmarking of Energy Storage Technologies for RES Off-Grid Installations; ELY4OFF: Huesca, Spain, 2017. [Google Scholar]
- NREL PVWatts Calculator. Available online: https://pvwatts.nrel.gov/pvwatts.php (accessed on 17 October 2018).
- FCH JU; ALSTOM; Abengoa. Commercialistaiton of Energy Storage in Europe; McKinsey & Company: New York, NY, USA, 2015; p. 96. [Google Scholar]
- Barsoum, N.; Petrus, P.D. Cost Optimization of Hybrid Solar, Micro-Hydro and Hydrogen Fuel Cell Using Homer Software. Energy Power Eng. 2015, 07, 337–347. [Google Scholar] [CrossRef]
- Eichman, J.; Flores-Espino, F. California Power-to-Gas and Power-to-Hydrogen Near-Term Business Case Evaluation; National Renewable Energy Laboratory: Alexandria, KY, USA, 2016.
- Ferrero, D.; Gamba, M.; Lanzini, A.; Santarelli, M. Power-to-Gas Hydrogen: Techno-economic Assessment of Processes towards a Multi-purpose Energy Carrier. Energy Procedia 2016, 101, 50–57. [Google Scholar] [CrossRef]
- Pascuzzi, S.; Anifantis, A.S.; Blanco, I.; Mugnozza, G.S. Electrolyzer Performance Analysis of an Integrated Hydrogen Power System for Greenhouse Heating. A Case Study. Sustainability 2016, 8, 629. [Google Scholar] [CrossRef]
Figure 1.
Flowchart of the approach followed.

Figure 2.
Ely4off configuration.

Figure 3.
Systems in competition with Ely4off (diesel generator is not represented due to its simplicity).
Figure 3.
Systems in competition with Ely4off (diesel generator is not represented due to its simplicity).

Figure 4.
Minimum PV required based on lead-acid batteries.

Figure 5.
Economic results for systems in competition with Ely4off for each one of the six scenarios.
Figure 5.
Economic results for systems in competition with Ely4off for each one of the six scenarios.

Figure 6.
PV-Bat-H2 system in Edinburgh with a 4 kW steady load.

Figure 7.
(a) Cost structure for 20 years of operation of the overall system; (b) cost structure of the hydrogen chain.
Figure 7.
(a) Cost structure for 20 years of operation of the overall system; (b) cost structure of the hydrogen chain.

Figure 8.
Evolution of H2 state of charge in Tenerife and Edinburgh.

Figure 9.
PVGenSet system depending on PV and diesel price.


Table 1.
General hypothesis.
| Hypothesis | Value | Unit |
|---|---|---|
| Beginning of simulation | 1 June, year 0 | / |
| End of simulation | 31 May, year 1 | / |
| Simulation time step | 10 | Minutes |
| Economic evaluation | 20 | Years |
| Discount rate | 8 | % |
| Component replacement | Based on absolute time | Hours |
Table 2.
Economic hypothesis.
| Element | Investment | Replacement Cost | O&M (%) 1 |
|---|---|---|---|
| PV | 1670 €/kWp | 1330 €/kWp | 3 |
| DC DC converters | 0.9 €/W | 0.9 €/W | 3 |
| DC AC converter | 0.4 €/W | 0.4 €/W | 3 |
| Lead Acid batteries | 175 €/kWh | 175 €/kWh | 3 |
| Li-ion batteries | 550 €/kWh | 550 €/kWh | 0 |
| Electrolyzer | 5 €/W | 5 €/W | 3 |
| Compressor | 31 k€/kW | 31 k€/kW | 3 |
| Hydrogen storage | 353 €/kg | 353 €/kg | 3 |
| Fuel cell | 5.5 €/W | 5.5 €/W | 3 |
| Diesel generator | 420 €/kW | 420 €/kW | 0.4 €/h + 2 €/L |
1 Operation and maintenance cost: percentage of the investment cost.
Table 3.
Technical hypothesis.
| Hypothesis | Value | |
|---|---|---|
| Photovoltaic panels | Panel peak power | To be optimized with ODYSSEY (kW) |
| Solar profile locations | Tenerife/Edinburgh | |
| Azimuth | 180° (south) | |
| Tilt angle | Tenerife: 25° (optimized) Edinburgh: 41° (optimized) | |
| Module type | Standard (15% efficiency) | |
| Plant type | Fixed | |
| System losses | 14% (including dirt, reflection, conversion, thermal, wiring and orientation) | |
| Replacement time | 175,200 h (20 years) | |
| Lead-Acid Batteries | Initial SOC 1 | 0.5 |
| Minimum SOC | 0.2 (below this value, batteries cannot be discharged in order to prevent failures) | |
| Maximum SOC | 1 | |
| Storage capacity | To be optimized with ODYSSEY (kWh) | |
| Charge efficiency | 0.85 | |
| Discharge efficiency | 0.85 | |
| Min charge power | 0 W | |
| Max charge power | 1 × 10⁶ W | |
| Min discharge power | 0 W | |
| Max discharge power | 1 × 10⁶ W | |
| Self-discharge | 0.25%/day | |
| Replacement time | 87,600 h (10 years) | |
| Li-Ion batteries | Initial SOC | 0.5 |
| Minimum SOC | 0.2 | |
| Maximum SOC | 1 | |
| Storage capacity | To be optimized with ODYSSEY (kWh) | |
| Charge efficiency | 0.92 | |
| Discharge efficiency | 0.92 | |
| Min charge power | 0 W | |
| Max charge power | 1 × 10⁶ W | |
| Min discharge power | 0 W | |
| Max discharge power | 1 × 10⁶ W | |
| Self-discharge | 5%/month | |
| Replacement time | 87,600 h (10 years) | |
| Electrolyzer | Maximum operation pressure | 20 bars |
| Outlet hydrogen temperature | 40 °C | |
| Stack minimal power | 1 kW (below this value, the stack doesn’t start operation mode) | |
| Stack maximal power | To be optimized with ODYSSEY (kW) | |
| Efficiency (model polynomial efficiency) | Confidential | |
| H2O stoichiometry | 1.05 | |
| Replacement time | 175,200 h (20 years) | |
| Hydrogen Storage | Number of tanks | 1 |
| Ambient temperature | 20 °C | |
| Minimum pressure | 20 bars | |
| Initial pressure | 20 bars | |
| Maximum pressure | 350 bars | |
| Volume | To be optimized with ODYSSEY (m3) | |
| Max mass flow rate in charge | 100 kg/h | |
| Max mass flow rate in discharge | 100 kg/h | |
| Replacement time | 175,200 h (20 years) | |
| Fuel Cell | Cooling efficiency | 0.6 |
| Cooling output temperature | 20 °C | |
| Stack min power | 0.2*Max_power W | |
| Stack max power | To be optimized with ODYSSEY (W) | |
| Constant Efficiency | 48% | |
| H2 stoichiometry | 1 | |
| O2 stoichiometry | 1 | |
| Replacement time | 43,800 h (5 years) | |
| Diesel generator | Power min | 250 W |
| Power max | To be optimized with ODYSSEY (W) | |
| Constant efficiency | 28% | |
| Polynomial efficiency | Confidential | |
| Life time | 10,000 h | |
| DC DC converter | Conversion efficiency | 93% |
| Replacement time | 291,144 h (33 years) | |
| DC AC converters | Conversion efficiency | 93% |
| Replacement time | 104,700 h (12 years) | |
| Compressor 2 | Isentropic efficiency | 72% |
| Electric motor efficiency | 95% | |
| Replacement time | 87,600 h (10 years) |
1 SOC: State of Charge of the batteries. 2 Only needed when more than 20 bar are required in the hydrogen storage.
Table 4.
Values to optimize.
| Component | Value | Range | Interval |
|---|---|---|---|
| PV panels | Peak power | [5:200] kW | 1 kW |
| Electrolyzer | Stack max power (kW) | [10:50] kW | 10 kW |
| Fuel Cell | Stack max power (kW) | [1.6:4.6] kW | 0.5 kW |
| Battery | Capacity (kWh) | [10:50] kW | 2 kW |
| Hydrogen Storage | Volume (m3) | [0.1:1] kW | 0.1 kW |
Table 5.
Sensitive parameters.
| Parameters | Boundaries |
|---|---|
| Battery technologies | Li-Ion and Lead-Acid |
| Diesel price | 1, 2 and 3 €/L |
| Customer load | 1, 4 kW loads or home load (previously defined) |
| Location | Tenerife and Edinburgh |
Table 6.
Values of the most competitive scenario.
| Element | Value |
|---|---|
| PV installed | 130 kWp |
| Energy to provide | 35 MWh/year |
| Electrolyzer power | 50 kW |
| Capacity of the batteries | 376 kWh |
| H2 Storage | 14 m3 |
© 2018 by the authors. Licensee MDPI, Basel, Switzerland. This article is an open access article distributed under the terms and conditions of the Creative Commons Attribution (CC BY) license (http://creativecommons.org/licenses/by/4.0/).
Share and Cite
MDPI and ACS Style
Gracia, L.; Casero, P.; Bourasseau, C.; Chabert, A. Use of Hydrogen in Off-Grid Locations, a Techno-Economic Assessment. Energies 2018, 11, 3141. https://doi.org/10.3390/en11113141
AMA Style
Gracia L, Casero P, Bourasseau C, Chabert A. Use of Hydrogen in Off-Grid Locations, a Techno-Economic Assessment. Energies. 2018; 11(11):3141. https://doi.org/10.3390/en11113141
Chicago/Turabian StyleGracia, Lorién, Pedro Casero, Cyril Bourasseau, and Alexandre Chabert. 2018. "Use of Hydrogen in Off-Grid Locations, a Techno-Economic Assessment" Energies 11, no. 11: 3141. https://doi.org/10.3390/en11113141
Note that from the first issue of 2016, this journal uses article numbers instead of page numbers. See further details here.