Article

Biochemical Conversion and Microbial Community in Response to Ternary pH Buffer System during Anaerobic Digestion of Swine Manure

1
School of Chemical & Environmental Engineering, China University of Mining & Technology (Beijing), Beijing 100083, China
2
State Key Joint Laboratory of Environment Simulation and Pollution Control, Research Center for Eco-Environmental Sciences, Chinese Academy of Sciences, Beijing 100085, China
3
Department of Water Pollution Control Technology, Research Center for Eco-Environmental Sciences, Chinese Academy of Sciences, Beijing 100085, China
4
College of Resources and Environment, University of Chinese Academy of Sciences, Beijing 100049, China
*
Authors to whom correspondence should be addressed.
Energies 2018, 11(11), 2991; https://doi.org/10.3390/en11112991
Submission received: 25 September 2018 / Revised: 20 October 2018 / Accepted: 27 October 2018 / Published: 1 November 2018
(This article belongs to the Section A: Sustainable Energy)

Abstract

:
The ternary pH buffer system with ammonia-carbonates-volatile fatty acids (VFAs) is essential to anaerobes for bioenergy recovery via anaerobic digestion (AD). However, ammonia and VFAs are recognized as potential inhibitors that depress methanogenesis. In this study, biochemical conversion and the microbial community in batch AD at total solid (TS) from 4% to 14% were investigated to reveal their response to the ternary pH buffer system. The rapid ammonia release, probably promoted by Anaerosphaera and Eubacterium inferred from the concurrent peak of their relative abundance, triggered total ammonia (TAN) inhibition with the accumulation of VFAs in the start-up stage of high solid AD (HSAD, TS ≥ 8%). Along with evolution of the microbial community to resist high TAN and VFAs, methanogenesis recovered with improved degradation of VFAs and reduction of COD. When exposed to 3500 mg·N·L−1 TAN at 8% TS, aceticlastic Methanosarcina became dominant first and then together with hydrogenotrophic Methanoculleus, achieved the optimal biochemical conversion. While in HSAD at 11–14% TS, the main pathway of methanogenesis appeared to have shifted from the aceticlastic pathway to the hydrogenotrophic pathway, as inferred by changes in the relative abundance of methanogens, and this could have been induced by the increasing concentration of high free ammonia (FAN, ≥588 mg·N·L−1). Although the anaerobes had acclimatized to high TAN, the propionate-oxidizing bacteria and acetate-oxidizing bacteria might have again been inhibited by high FAN, frustrating the H2 supply for FAN-tolerant Methanoculleus and causing an 8.2–11.3% depression of COD reduction (mainly propionate residual).

Graphical Abstract

1. Introduction

Anaerobic digestion (AD) is highly recommended to convert livestock waste into biogas as fuel and the effluent as fertilizer, for comprehensive utilization of resources [1]. According to the current state of the art, high solid anaerobic digestion (HSAD) at total solid (TS) ≥8% [2] has been considered as an emerging and effective technology to minimize the generation of biogas slurry, and promote the saving of reactor volume and energy demand, when compared with conventional AD at TS ≤ 5%. As an upgraded system, HSAD not only remedies the weaknesses and limitations of conventional AD, but also improves the buffer capacity of the anaerobic system by increasing the amount of weak acid and weak base compounds [3,4]. During hydrolysis and acidogenesis, the newly generated ammonia and volatile fatty acids (VFAs) buffer each other to establish the initial stage of the pH buffer system. Thereafter, more CO2 in biogas is retained as carbonates during methanogenesis to remedy the consumed VFAs for buffering free ammonia (FAN) from an excessive pH increase [5].
A ternary pH buffer system with ammonia-carbonates-volatile fatty acids (VFAs) is essential to anaerobes for bioenergy recovery via AD. The ternary pH buffer system with its evolutive composition maintains the pH fluctuation in a suitable range for stabilizing the performance of HSAD. Besides, the regulation of the ternary pH buffer system was recently revealed as an innovative way for in-situ biogas upgrading [4]. However, ammonia and VFAs, except carbonates, in the ternary buffer system are both recognized as potential inhibitors on anaerobes [6], and their potential to depress methanogenesis is more prominent than sulfides, humic acids and long chain fatty acids that have been reported [7]. Furthermore, the increased VFA concentration, associated with steady but depressed methane production from nitrogen-rich substrates, is considered to be the result of ammonia inhibition [8], because methanogenesis is much more sensitive to ammonia than hydrolysis and acidogenesis [9]. Too many VFAs in the HSAD system may also result in low pH and thus the failure of HSAD [10]. For example, a HSAD using chicken manure as substrate at 8.9% TS suffered from total ammonia (TAN), with sharp biogas reduction from 0.32 L/g-VS (Volatile solid) to 0.13 L/g-VS when TAN increased from 3000 mg·N·L−1 to 6000 mg·N·L−1 [11]. The deteriorative endogenous inhibition induced by higher TS seems to be a challenge for HSAD, and how to tackle the inhibitors for enhancing bioenergy recovery is of great concern, particularly during the disposal of ammonia-rich wastes via HSAD.
Chemical addition is frequently used to cope with the accumulation of VFAs. However, some studies have indicated that this kind of pH adjustment strategy does not fully reverse the imbalance of acidogenesis and methanogenesis but only delays the process failure [10]. Furthermore, the chemicals used for pH adjustment account for 15–40% of the operational cost of AD in Europe [12]. With regard to ammonia, the approaches to mitigate inhibition always rely on dilution, co-digestion with C-rich substrates and stripping, or membrane extraction of ammonia from the fermenter. However, these measures usually compromise the process efficiency or increase the capital investment and operational costs [13]. The AD process turns out to be very complex and comprises four main steps: hydrolysis, acidogenesis, acetogenesis and methanogenesis, with a variety of microbiota to mediate each step [14]. Among the microbiota, methanogens are the most sensitive to ammonia. In addition, a study about isotopic fractionation of biogas also demonstrated that aceticlastic methanogens (AM) were prevalent in reactors operated at TAN below 3.0 g·N·L−1 while hydrogenotrophic methanogens (HM) were predominant at TAN above 6.0 g·N·L−1 [15]. The frail AM that were easily affected by TAN raises a further challenge of achieving the desired efficiency of methanogenesis via HSAD, because AM are generally responsible for as much as 70% of the methane production in an AD reactor [16]. Therefore, the key driver of process recovery from endogenous inhibition is primarily based on consolidation of the microbial community with tolerance to inhibitors that can be realized via bioaugmentation or acclimation. Bioaugmentation with the hydrogenotrophic methanogens (Methanoculleus bourgensis MS2T) to a fermenter with 5 g·N·L−1 TAN demonstrated a 31.3% increase in methane production and 5-fold increase in relative abundance of Methanoculleus spp. [12]. The stepwise ammonia acclimation strategy promoted the enrichment of Clostridium ultunense belonging to acetate oxidizing bacteria (SAOB) along with Methanoculleus species at extreme ammonia levels (>7 g·N·L−1) [14]. Nevertheless, cultivation and isolation of specified microbial consortia for bioaugmentation are complex and costly processes, leading to limited applicability. Similarly, ammonia acclimation is extremely time-consuming and needs to be further investigated and improved. Therefore, there is still a demand for more insightful and detailed understanding about the microbial community in response to anaerobic process parameters for further optimization and stabilization of HSAD reactors confronting a high concentration of potential inhibitors, especially VFAs and ammonia.
The objective of this study was therefore to investigate the biochemical conversion and the microbial community in the AD system to reveal their response to elevated concentrations of endogenous ammonia and VFAs belonging to the ternary pH buffer system. The conversion of soluble chemical oxygen demand (CODcr), total CODcr as well as VFAs was determined in detail. A comprehensive understanding of AD performance, the environmental parameters and the microbial community might be helpful to optimize the control strategy for endogenous inhibition in HSAD.

2. Materials and Methods

2.1. Substrate and Inocula

The swine manure and inocula used in this study were collected from a swine farm in suburban areas of Beijing, China. The inocula were overflowed from a stable mesophilic up flow solid reactor (USR, 700 m3) and sieved with 18 mesh sieves when collected. The TS and VS were 26.89 ± 0.23% and 21.95 ± 0.17% for the manure, 4.81 ± 0.01% and 2.80 ± 0.02% for the inocula, respectively. Both the manure and the inocula were stored at 4 °C before use.

2.2. Experimental Setup

Batch experiments of anaerobic digestion (AD) were carried out in mesophilic conditions (37 ± 0.5 °C). Increasing the TS of feedstock was investigated in triplicate; the control group was carried out at 4% TS while the experimental groups were carried out at 8%, 11% and 14% TS, respectively. The corresponding group names were set as B, C, D and E, respectively. Based on the suggestion in a previous study [17], the ratio of substrate to inoculum was also fixed at 4:1 (based on TS) for all groups in this study. The working volume was 350 mL for all bioreactors (fermenters). Detailed procedures of the starting operation for BMP (biochemical methane potential) tests can be found in previous work [18].

2.3. DNA Extraction

Samples for bacterial and archaeal community analysis were collected based on the methanogenesis tendency. A suspended sample with a volume of 0.5 mL was centrifuged at 10,000 rpm for 10 min, the pellet was used for DNA extraction using the FASTDNA Spin Kit for Soil (MP Biomedicals, Santa Ana, CA, USA) according to manufacturer’s instructions, and the resulting extracts were composited to average out bias in sampling and extraction. Quality and concentration of the extracted DNA were determined through 1% agarose gel electrophoresis and NanoDrop ND-1000 (Thermo Scientific, Waltham, MA, USA), respectively.

2.4. Analytical Method

2.4.1. Physicochemical Analyses

Total solids (TS), volatile solids (VS), pH value and total ammonia (TAN) were measured using standard methods [19]. The concentration of FAN was calculated based on the equation: CFAN = CTAN × (1 + 10pH/10−(0.09018+2729.92/T)−1, where T indicated the temperature (K) of the reactor [20]. Process samples were periodically taken from the AD reactors according to the methanogenesis tendency. The samples were named with the group name and the date of sampling. The obtained sample was centrifuged at 5438× g (No. 12141, Sigma 2-16KL, Osterode am Harz, Germany) for 10 min and the supernatant was filtrated through a membrane (0.45 μm; Savillex, Eden Prairie, MN, USA) for the measurement of ammonia, soluble chemical oxygen demand (COD) and VFAs. The Nessler’s reagent for ammonia measurement was purchased from HACH Inc., Loveland, CO, USA. Total COD (TCOD) and soluble COD (SCOD) were assayed using the HACH USEPA reactor digestion method (HACH 2125915). The concentrations of acetic acid (HAc), propionic acid (HPr), iso-butyric acid (i-HBu), butyric acid (n-HBu), iso-valeric acid (i-HVa), and valeric acid (n-HVa) were determined using a gas chromatograph (Shimadzu GC-2014C, Shimadzu Suzhou Instruments Manufacturing Co.,Ltd, Suzhou, China) equipped with a flame ionization detector and stabilwax-DA column (0.32 mm × 25 m × 0.25 μm). The injector temperature was set as 220 °C and the detector temperature was set as 250 °C. The program of oven temperatures was: 70 °C (1 min), 20 °C·min−1 to 180 °C (3 min), 20 °C·min−1 to 210 °C (3 min).

2.4.2. Microbial Community Analyses

The primers 515F and 806R [18] targeting the bacteria 16S rRNA V4 region were selected for bacterial community analysis using the Illumina high-throughput sequencing method. Since the abundance of archaea was much lower in comparison with that of the bacterial community, the microbial community was further analyzed using a nested Polymerase Chain Reaction (PCR) for the identification of the archaeal community in detail. Arch340F and Arch1000R were used for the first round of PCR amplification, and then the PCR product was used as a template in the second PCR, using the PCR primers of 349F and 806Ras described by Zhang [18]. The amplicons were then sent to Sangon Co., Ltd. in Shanghai for small-fragment library construction and pair-end sequencing using the Illumina MiSeq sequencing system (Illumina, San Diego, CA, USA).
Sequencing reads from the original DNA fragments were merged using FLASH and then filtered by QIIME quality filters [21]. PCR chimeras were filtered out using UCHIME, so then the reads were ‘‘clean reads”. Taxonomic classification of the sequences of each sample was carried out individually using Ribosomal Database Project (RDP) Classifier. A bootstrap cutoff of 50% suggested by RDP Classifier was applied to assign the sequences to different taxonomy levels [18].

2.5. Calculations and Statistical Analyses

2.5.1. Extent of Solubilization and Acidification

With the AD proceeding, the extent of solubilization in each digester was calculated by using the ratio of total soluble products (methane production, VFA residues and other soluble compounds) in the initial mixture with reference to Maspolim [22], and is expressed as:
Extent   of   solubilization % = COD CH 4 + SCOD day ( x ) TCOD × 100 %
where CODCH4 is accumulated methane production up to day(x) as gram COD based on 0.350 L-CH4·g·COD−1 at 273 K (temperature is the standard temperature due to the normalization of methane volume by AMPTS II instrument); SCOD is soluble COD including the COD related to VFAs in sample obtained on day x; TCOD is the total COD of the initial feedstock.
Similarly, the extent of acidification was calculated [23] as follows:
Extent   of   acidification % = COD CH 4 + COD VFAs TCOD × 100 %
where CODCH4 and TCOD are respectively the same as above-mentioned; CODVFAs is total VFAs as gram COD in sample which was obtained on certain day, basing on the stoichiometric coefficient of transferring acetic acid, propionic acid, butyric acid, and valeric acid into CO2 and H2O, respectively. The coefficient can be found in detail in the previous report [2]. Beyond the above, it was postulated that the methane produced originally came from the conversion of soluble COD (VFAs) only.

2.5.2. Efficiency of Biochemical Conversion Data Analysis

Statistical calculations and data analysis were performed using OriginPro 2015 (Origin Lab Corporation, Northampton, MA, USA). A heat map of the top 10 bacterial genera in each sample (34 genera in total) was built using HemI (The CUCKOO Workgroup, Wuhan, China) (http://hemi.biocuckoo.org/). According to the relative content of archaeal genus, principal component analysis (PCA) was performed with Canoco 5.0 (Microcomputer Power, Ithaca, NY, USA).

3. Results and Discussion

3.1. Overall Performance of AD Reactors

3.1.1. Efficiency of Biochemical Conversion

The increase of initial TS content would positively enhance the concentration of ammonia and VFAs that may influence the efficiency of biochemical conversion, including TS and VS removal, methane production and COD reduction. As listed in Table 1, the amounts of VS and TS were dramatically biodegraded after AD treatment, but their removal rates both decreased with the increasing of initial TS in the HSAD (TS ≥ 8%). Due to the close relationship with VS conversion, the methane potential showed a similar tendency along with TS increase. As shown in Figure S1 and verified in a previous study [5], the different tendencies of methane production between the conventional AD and the HSAD in this study were mainly due to the dominant concentration of TAN in the HSAD exceeding 3000 mg·N·L−1 (Table 2), namely, the threshold value of TAN inhibition on methanogens [14]. The efficiency of biochemical conversion was depressed with the TAN increasing in the HSAD. T80 is the time required to produce 80% of total methane or biogas production, which may be a reference for solid retention time (SRT) in the full-scale reactor [24]. The maximum methane potential of VS obtained at 8% TS was used as the total methane production for all groups in this study. Based on this, T80 was about 56 d, 104 d and 118 d at 4%, 8% and 11% TS, respectively, while that at 14% failed to achieve 80% of methane potential. Unexpectedly, HSAD at 8% TS took much more digestion time than AD at 4% TS (Table 1). However, providing that the methane production stagnation at start-up phase can be considered as the TAN acclimation period, namely inoculated with TAN-tolerant inocula, T80* at 8% TS with optimal methane potential could be shortened to 59 days which was comparable to that at 4% TS.
As shown in Figure 1, the biodegradation of total COD (TCOD) in the HSAD was insignificant in the beginning because of the poor methane emission from reactors, while the concurrent soluble COD (SCOD) increased rapidly in all digesters and kept rising until methanogenesis recovered. From the reverse trend above, it could be inferred that the hydrolysis and acidogenesis exhibited more tolerance to ammonia than the methanogenesis. It is generally reported that the hydrolytic and acidogenic microbiota seem to be hardly affected within the TAN concentrations ranging from 4051 to 5734 mg·N·L−1 [25]. However, in this study, the extent of solubilization and acidification, as shown Table 2, indicate that all the hydrolytic and acidogenic process at TS ≥ 8% seemed to be influenced by the increasing inhibitors until the system recovered from inhibition. A detailed figure about this is in the supplementary data (Figure S2). Along with the acclimation to inhibitors, the methanogenesis promoted the removal of TCOD and SCOD, where the VFAs part contributed to the most (Figure 1). With regard to the whole AD process, the removal efficiencies of TCOD were about 74.2%, 76.7%, 68.5% and 65.4% at the increasing TS, respectively (Table 1). It is notable that the removal efficiency of TCOD was slightly promoted at 8% TS and this might be due to the consolidation of microbiota and the prolonged digestion time, while removal efficiency at 11% and 14% TS were suboptimal, mainly due to VFA residuals in the digesters.

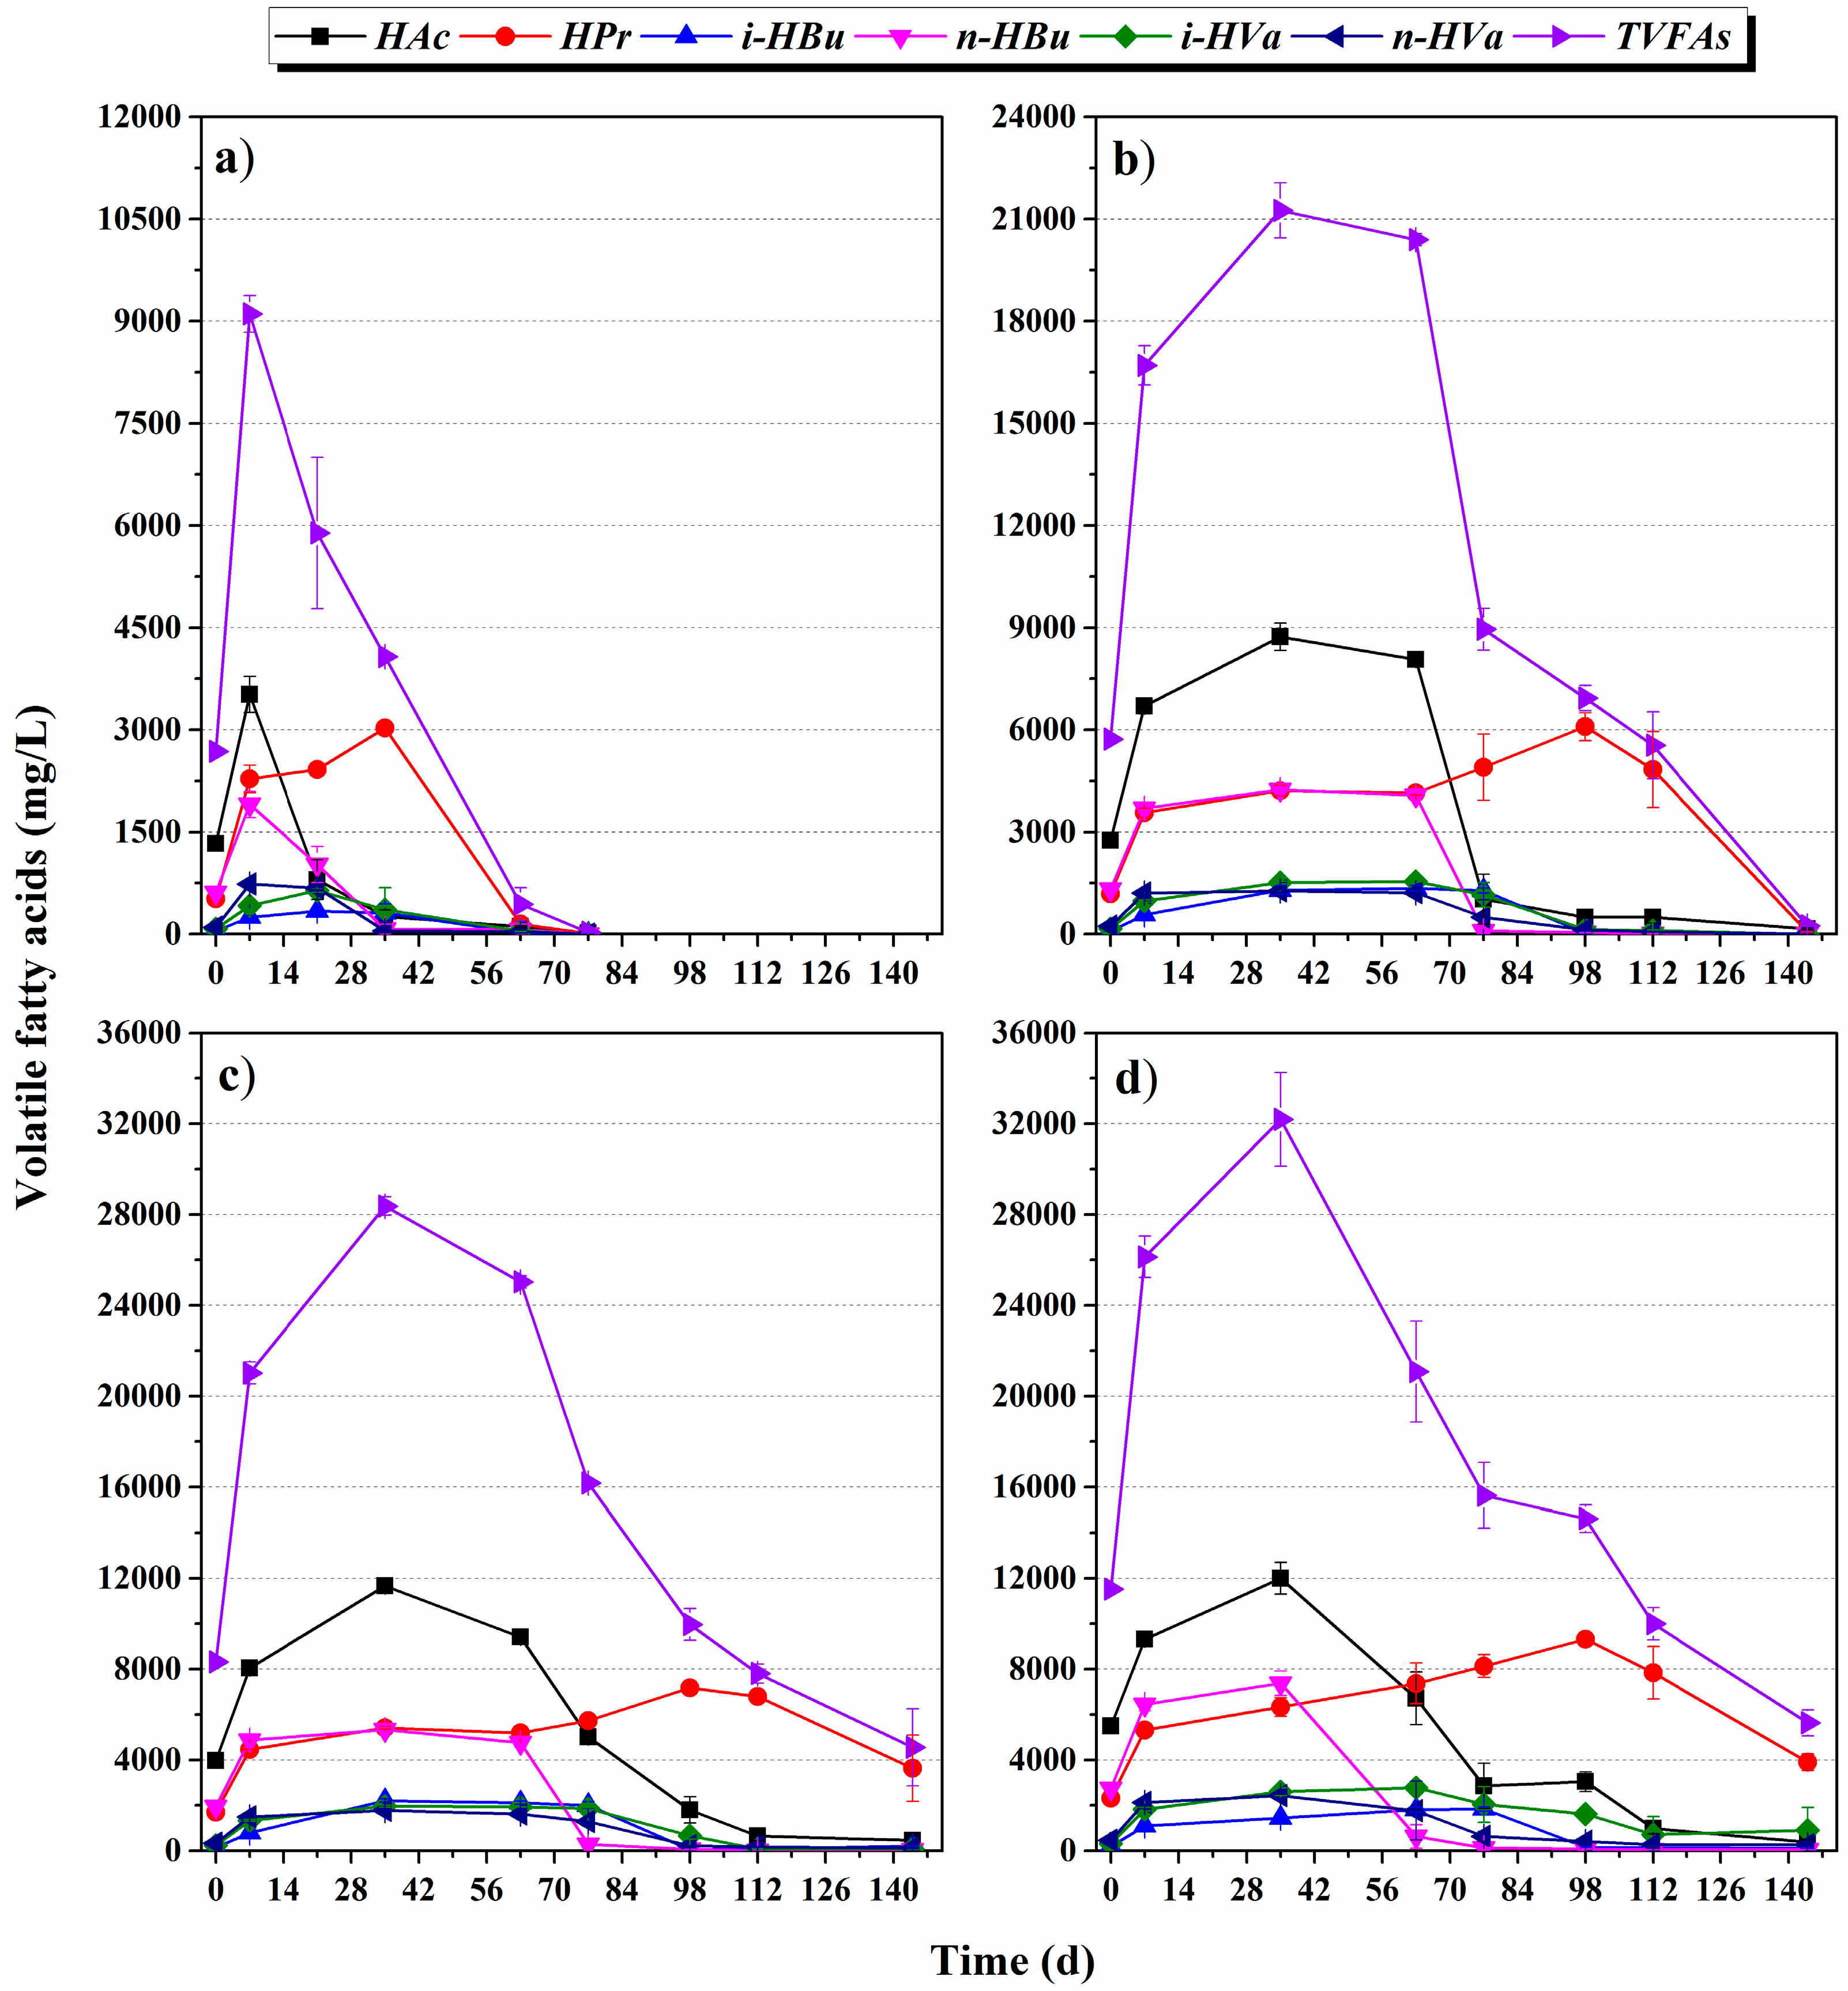
3.1.2. Evolution of VFA Composition

VFAs are indispensable profiles of the pH buffer system and, in turn, the pH value may reflect the concentration of total VFAs (TVFAs) co-regulating the proper acid-base environment for microbes [5]. As shown in Figure 2, all kinds of VFAs accumulated first before day 7, and the biodegradation of VFAs was further inspired in conventional AD, while the VFAs in the HSAD further accumulated due to high TAN. It is important to highlight that the molar ratio among VFAs was hardly influenced by the increasing TAN concentration when comparing their peak values on day 7 and day 35. A more visual expression can be found in the supplementary data (Figure S3). This indicated that the corresponding acid producers were probably equipped with similar resistance to the increasing TAN concentration. So far, the abundant TAN and VFAs buffered each other and established the initial stage of the pH buffer system but imposed a heavy burden on microbes.
Along with the methanogenic community rebuilt with TAN and VFAs tolerance in the HSAD, the amount of VFAs decreased gradually in all digesters, weakening the effect of VFAs on methanogenesis. Meanwhile, the VFA component changed significantly. Taking fermenter 8% TS for example, HAc was the first one to be biodegraded for methane production (Figure 2b), and then n-HBu showed the similar pattern from day 63, as the first one decreased to not detected. Soon after that, i-HBu, n-HVa and i-HVa began to decrease in succession, because straight-chain VFAs are easier to biodegrade than branched chain VFAs during AD [26]. However, HPr displayed a reverse tendency compared with the other acids from day 63 to 98. It increased from 4144 ± 54 to 6091 ± 404 mg·L−1 mainly due to the concurrent dissociation of n-HVa and i-HVa. The biodegradation of propionate was thermodynamically unfavorable via AD. Furthermore, the increase of propionate was unbeneficial for methanogenesis as reported in many studies [9,27]. Nevertheless, all of the propionate in reactor at 8% TS was gradually converted to biogas finally (Figure 2b), resulting in the largest methane potential among all groups (Table 1). While in digesters at 11% and 14% TS, the FAN concentration increased to 588 ± 12 and 734 ± 54 mg·N·L−1 due to the buffer VFAs being greatly consumed. The much higher FAN concentration than that at 8% TS would also inhibit the propionate degrading acetogenic bacteria [9], further increasing the difficulty of propionate degradation. The residual propionates in the digester at 11% and 14% TS can respectively yield about 594 and 637 NmL methane by referring to the empirical equation as reported [28]. The residual of propionates in incubations became another main reason of the depressed methane potential, besides suboptimal solubilization and acidification, when the HSAD was at 11% and 14% TS, respectively.

3.2. Microbial Community Dynamics

To investigate the microbial community in response to the increasing concentration of ammonia and VFAs belonging to the ternary pH buffer system, samples with a number of 27 in this study were obtained on days 7, 35, 63, 77, 98, 112 and 144, respectively, according to the tendency of cumulative methane production. After the chimera analysis, the average sequencing depth was ca. 35,000 clean reads (Table S1).

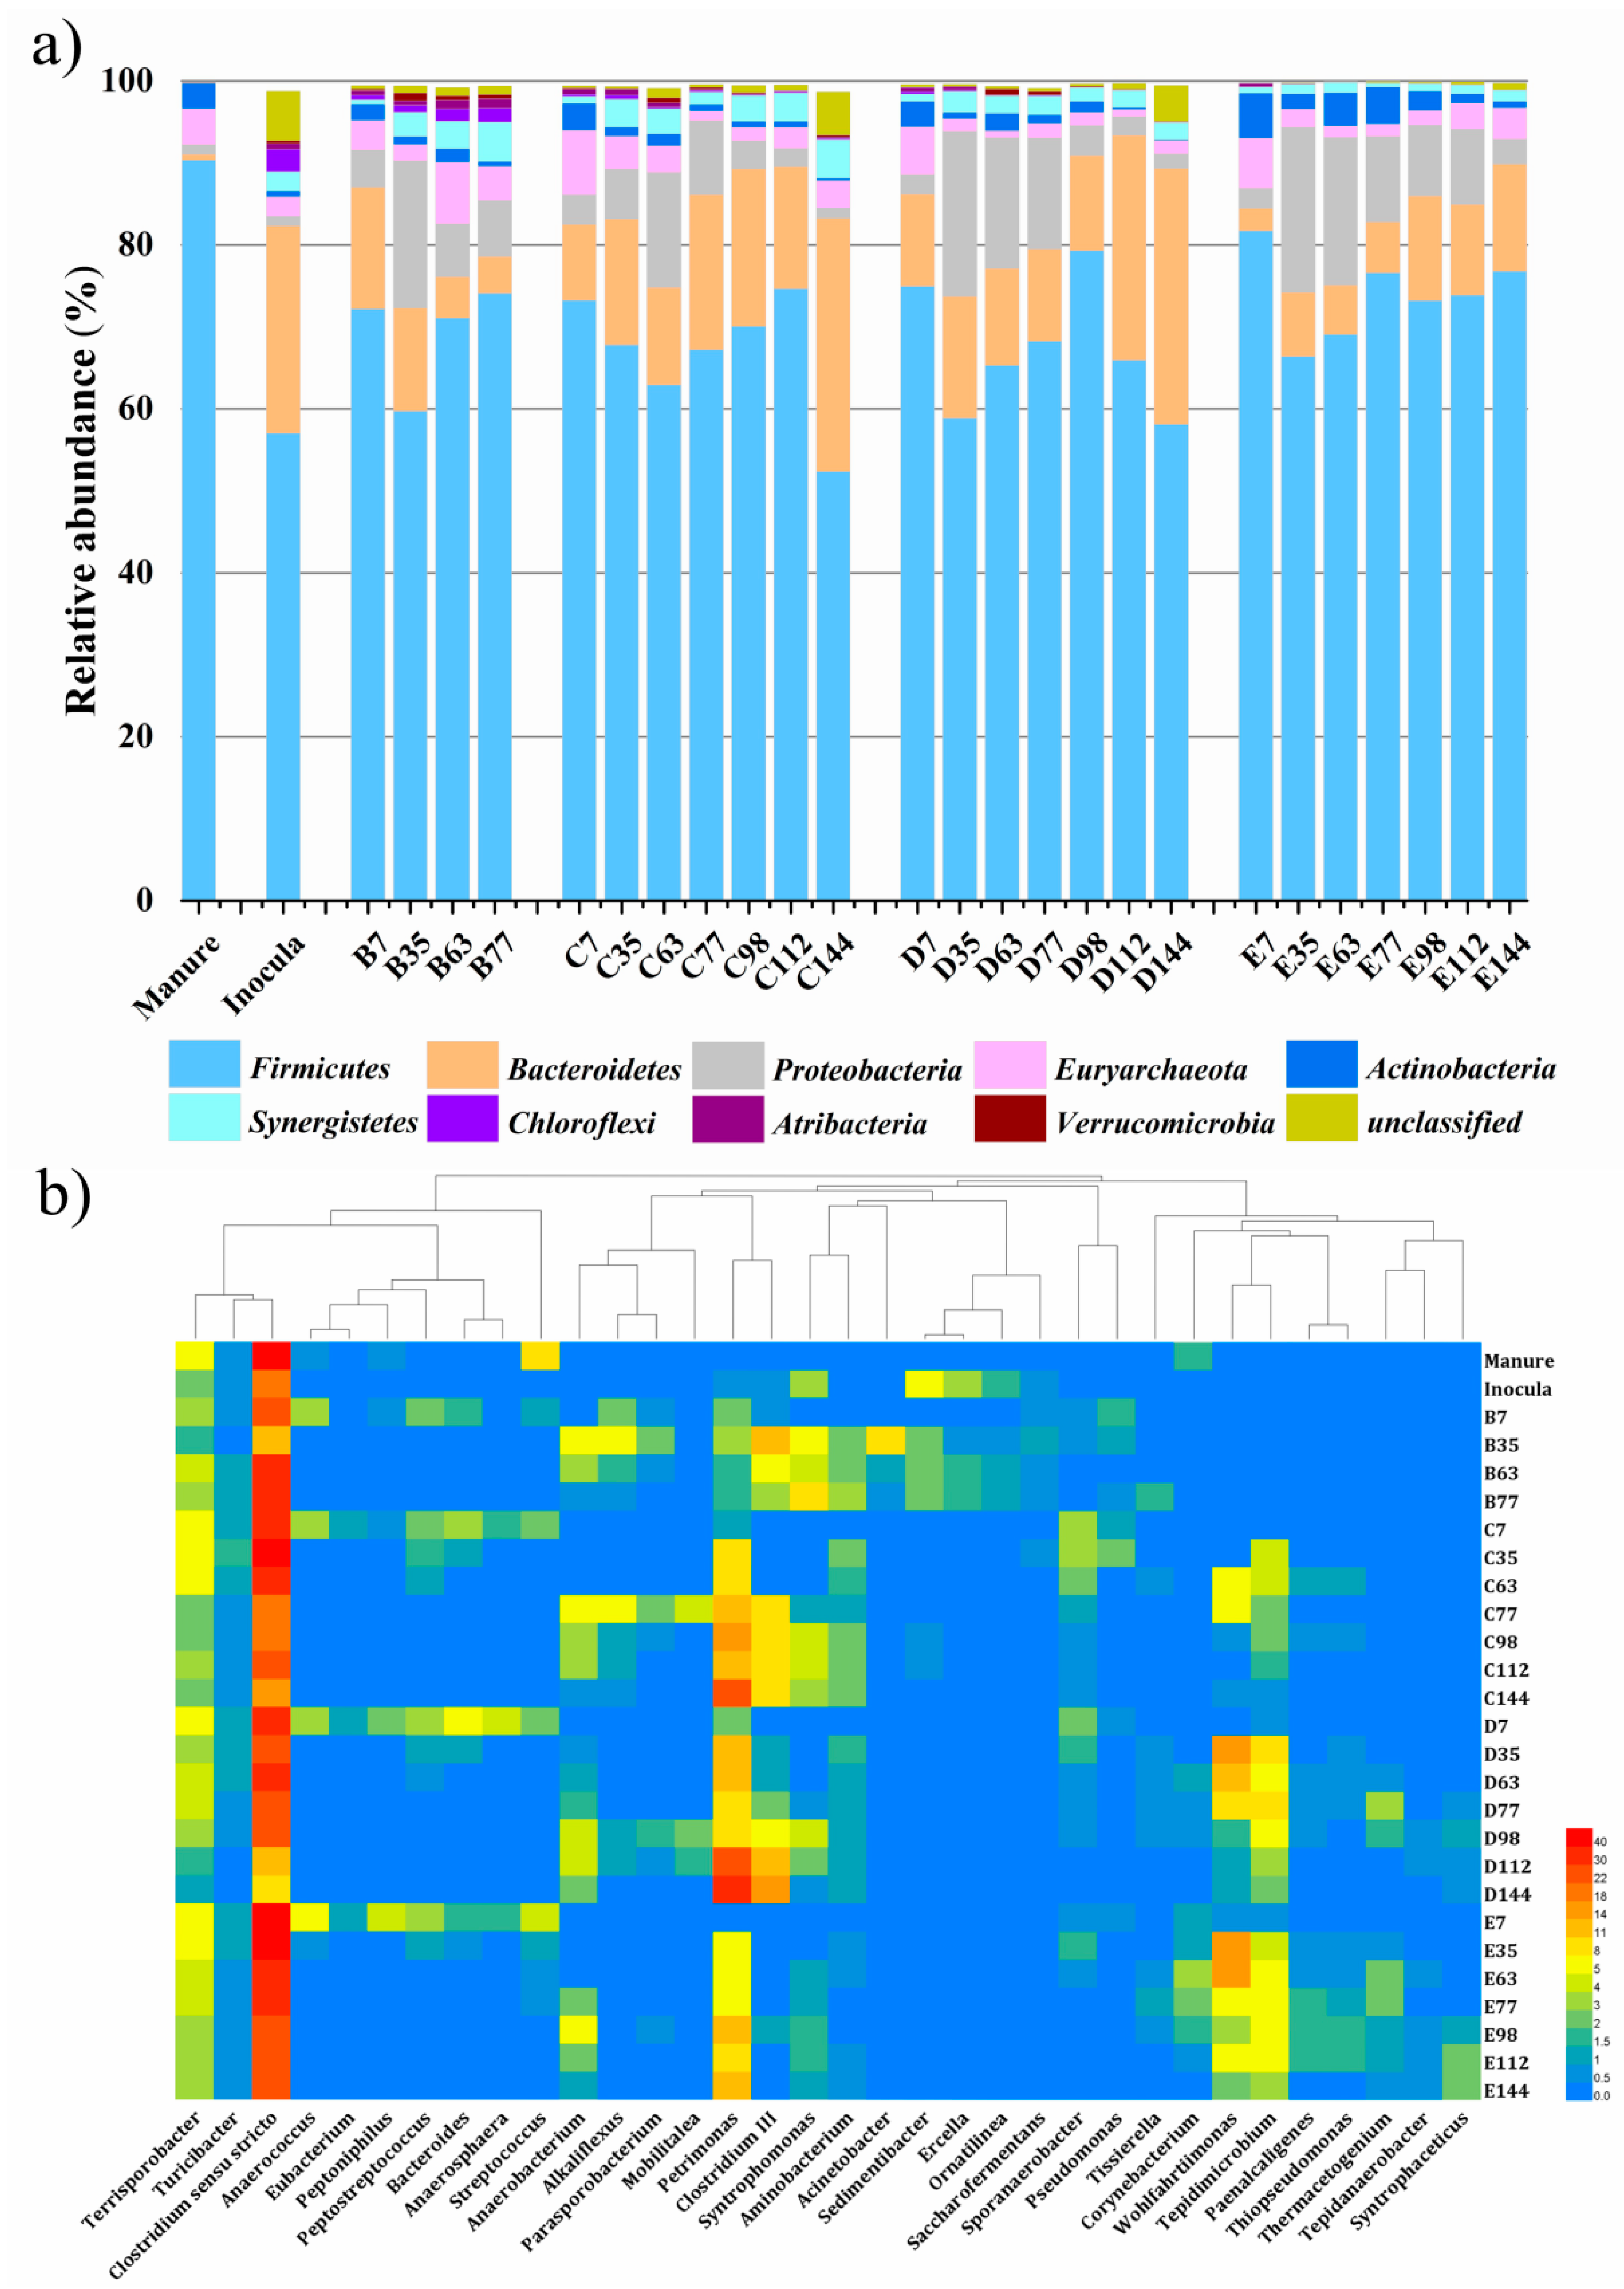
3.2.1. Bacterial Community

The diversity of the bacterial community decreased but was still rich after the AD treatment (Table S1). As shown in Figure 3a, the Firmicutes (52.4–81.7%), Bacteroidetes (2.7–31.3%) and Proteobacteria (1.2–20.2%) were the dominant phyla throughout the AD process and they were widely observed to contain acid-forming bacteria that have been reported to degrade cellulose and protein [29]. Their relative abundance changed with the different stages of AD as well as the evolution of the ternary pH buffer system. Firmicutes was observed to decrease at first, followed by a later increase, while Proteobacteria showed the inverse tendency, in all groups, as shown in Figure 4a. For Bacteroidetes, they decreased with the AD process at 4% TS but increased at TS ≥ 8%, displaying the difference between the conventional AD and the HSAD.
AD was carried out by various groups of microbiota mainly involved in four steps: hydrolysis, acidogenesis, acetogenesis and methanogenesis, that were unified rather than independent. The composition of the bacterial community was further analyzed at the genus level, intending to reveal their contribution, as well as response to, the ternary pH buffer system. Clostridium sensu stricto was the most dominant genus throughout the AD process, with the relative abundance of 11.97–31.85%, 14.47–40.76%, 8.37–37.57% and 22.18–43.03% at the increasing TS from 4% to 14%, respectively (Figure 4b). Clostridium sensu stricto is the main genus of Clostridium cluster I that belongs to the Firmicutes with the function of hydrolysis and acidogenesis [30], indicating that the hydrolysis and acidogenesis proceeded throughout AD. With the AD proceeding, many of the initial dominant genera decreased to extremely low relative abundance, including Eubacterium, Anaerococcus, Peptoniphilus, Peptostreptococcus, Anaerosphaera, Bacteroides, Pseudomonas and Streptococcus. Among these genera, Peptoniphilus (0.56–4.68%) has been described as a protein utilizing bacterium [11], and Anaerosphaera (0.31–4.65%) belongs to the amino-acid-utilizing bacteria that can degrade amino-acids and produce acetate, propionate and ammonia, etc. as the end products [9]. Besides, Eubacterium (0.31–4.65%) was reported to produce high concentrations of ammonium [31]. Proper ammonia concentration would provide necessary nutrition and sufficient buffer capacity for the AD system, while too much would cause endogenous inhibition. Most of the decaying bacteria, Acinetobacter, Sedimentibacter, Ercella, Ornatilinea, and Saccharofermentans at TS ≥ 8% have been identified as the degraders of complex organic compounds [32]. The phenomena mentioned above support the results of the decreased abundance of Firmicutes (Figure 4a) as well as the suboptimal solubilization and acidification mainly due to the high TAN concentration, elevated in the start-up phase of the HSAD (Table 2).
With the anaerobes gradually retrieved from TAN pressure with VFAs consumption for methanogenesis, the Anaerobacterium and Clostridium III cluster grew and may have enhanced the collapse of the poorly biodegradable organics in swine manure. Clostridium III has the similar metabolic potentials as Clostridium sensu stricto in similar environments [30]. The abundance of Clostridium III in the digester at 8% TS increased tremendously from 0.21% to 9.32% from day 63 to day 77 and remained at this abundance to the end (Figure 4b). Meanwhile, the Petrimonas became dominant only in the HSAD which increased from about 10% to 30% from day 98 at both 8% and 11% TS. The whole genome sequence of a Porphyromonadaceae (the family Petrimonas belonged to) belongs to the Bacteroidetes phylum suggesting that this bacterium was involved in the degradation of complex carbohydrates, proteins and peptides for the production of VFAs [29]. The promotion of hydrolysis and acidogenesis, corresponding to increased abundance of Clostridium III and Petrimonas, was in accordance with the improved extent of solubilization and acidification from day 77 in the HSAD (Table 2). The products of hydrolysis and acidogenesis, including acetic acid, H2 and CO2 etc., could be directly used by methanogens for biogas production, while other VFAs like propionate, butyrate, and valerate need further degradation by syntrophic bacteria. Syntrophomonas are syntrophic fatty-acid-oxidizing bacteria that produce acetic acid for methanogenesis [33]. In this study, Syntrophomonas, in the class Clostridia, became dominant (3.82% to 4.79% during days 98 and 144) to degrade these organic acids since acetate was exhausted at 8% TS, maintaining a similar increase pattern as at 4% TS (4.09% to 9.81%) during the degradation of propionic acid. This explained the complete utilization of propionate in the digester at 8% TS, achieving a harvest in methane production. However, the low relative abundance of Syntrophomonas at 11% TS (maximum 2.1% on day 98 and then decreased to <1%) and 14% TS (around 1% constantly) became the main factor in the poor degradation of propionate and potential for methane production.

3.2.2. Archaeal Community

As shown in Figure 5a, the archaeal community was dominated by Methanosphaera, Methanoculleus, Methanosarcina and Methanosaeta throughout the AD process. The relative abundance of Methanosphaera originating from raw manure [34] decreased from 80.3% to less than 62.5% after seven days of fermentation, and further decreased to less than 1% after AD. However, Methanoculleus persistently increased from less than 1% to 22.2–97.2% after AD, with increasing TS. In addition, Methanosarcina increased to be dominant on day 77 with relative abundance of 44.4% at 4% TS and 46.0% at 8% TS, respectively. In the digester at 4% TS Methanosaeta decreased at first and then increased, while displaying an inverse evolution at ≥8% TS.
Due to the different sensitivity to the identified toxicant, the methanogens shifted their communities in response to the increasing TAN and VFAs belonging to the ternary pH buffer system. Principal component analysis (PCA) based on the relative abundance was used to visualize a clear microbial dynamic change throughout the whole AD process with increasing TS, as shown in Figure 5b. During the acclimation period in the HSAD, the archaeal community on day 7 and 35 was similar in all incubators, despite TAN increasing from about 3500 to 6100 mg·N·L−1. With the evolution of methanogens to counter the increasing TAN concentration, obvious differences appeared as three independent clusters. Taking the evolution of methanogens at 8% TS for example, Methanosaeta and Methanosarcina acclimated to TAN were the main contributors in succession to produce methane in the aceticlastic pathway before approximately day 77, inferred from their dominant abundance associated with a low abundance of syntrophic acetate oxidizing bacteria (SAOB, only Syntrophaceticus, Thermacetogenium and Tepidanaerobacter were observed in this study). Besides, the abundance of Methanosarcina from day 77 outpaced Methanosaeta to be the most dominant methanogen for methane production under high ammonia pressure, especially FAN promoted by VFAs degradation. The literature reported that the coccus shaped Methanosarcina species were more resistant to elevated FAN concentrations (e.g., 100 mg·N·L−1) than the rod-shaped Methanosaeta cells because of their high volume to surface ratio and formation of large clusters [25]. In this study, the FAN concentration at 8% TS greatly increased from 13 ± 1 to 223 ± 10 mg·N·L−1 during days 63 and 77, which accelerated the increase of relative abundance for Methanosarcina with the ability to perform aceticlastic, hydrogenotrophic, and methylotrophic methanogenesis [35]. With this, the daily methane production mainly from acetate peaked on day 73 at 8% TS. Thereafter, another genus, Methanoculleus, replaced the strictly aceticlastic Methanosaeta. This may be due to the increased hydrogen source from the degradation of VFAs (C3 to C5) by syntrophic acetogens that induced the increase of hydrogenotrophic Methanoculleus. Besides, Methanoculleus is much more tolerant to high FAN pressure than Methanosaeta [35]. Since the total relative abundance of the detected SAOB only ranged from 0.66% to 0.87%, it can be deduced that acetate and hydrogen from the syntrophic degradation of propionate were efficiently consumed by Methanosarcina in the aceticlastic pathway and Methanoculleus in the hydrogenotrophic pathway, respectively. Thus, both the syntrophic propionate-oxidizing bacteria and methanogens played key roles in the utilization of propionate. The highly effective cooperation among bacteria and archaea at 8% TS was a successful response to high TAN concentration as well as the subsequent accumulation of VFAs and FAN increase.
However, the Methanosarcina failed dominate under the multiple pressures with even higher concentrations of FAN and propionate from day 77 at both 11% and 14% TS where the concurrent Methanoculleus occupied more than 89% abundance of the archaea. The low relative abundance of aceticlastic Methanosaeta and Methanosarcina indicated their replacement by SAOB to be the main acetate consumers to produce hydrogen for hydrogenotrophic methanogens. The methanogenesis began to primarily rely on the hydrogenotrophic pathway. Although the total abundance of SAOB, including Thermacetogenium, Syntrophaceticus and Tepidanaerobacter, in the digester at 11% and 14% TS increased once by about 5-fold that at 8% TS (Figure S3), the low efficiency of propionate degradation by syntrophic bacteria restricted the supply of acetate for SAOB and hydrogen for methanogens, depressing the methane yield rate and methane potential.

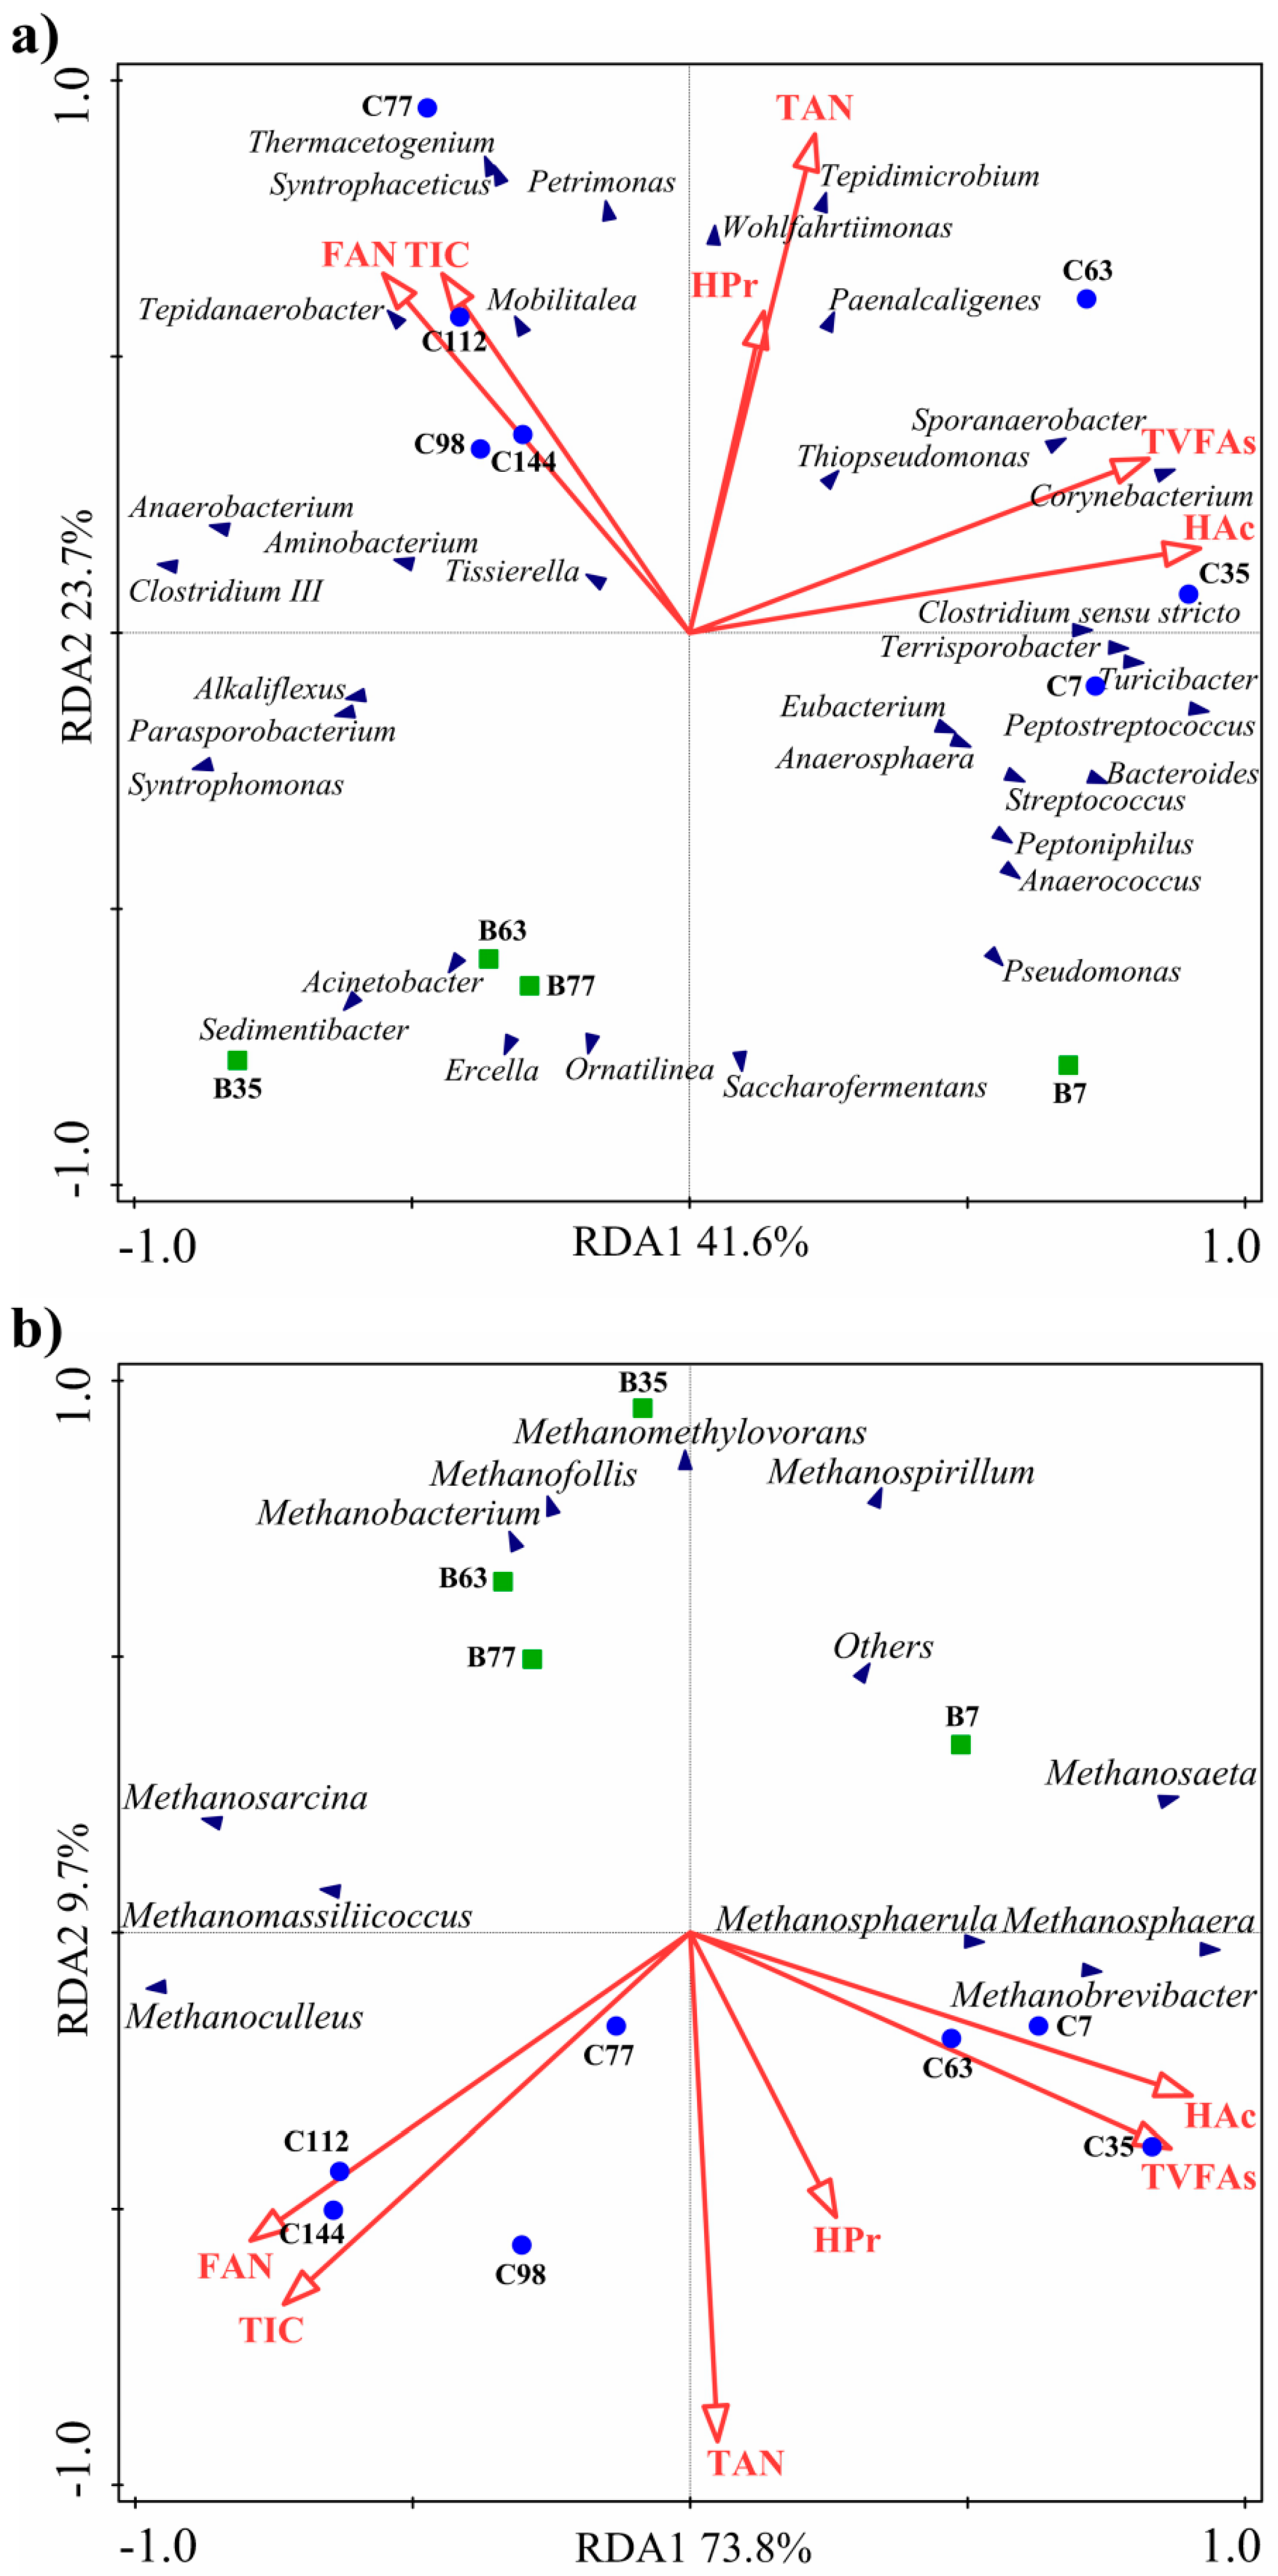
3.3. Relationship with Ternary pH Buffer System

The optimal performance of biochemical conversion and bioenergy recovery was achieved in the HSAD at 8% TS, where microbes played key roles. Different microbes mediate the hydrolysis, acidogenesis, acetogenesis and methanogenesis which are not separated steps but unified processes. These bioreactions bring about the intermediate or end products, including NH3/NH4+, VFAs (mainly HAc and HPr) and carbonates, and establish the main profiles of the ternary pH buffer system. In return, the notable concentration of these products may also influence the performance of the microbes involved with the above steps. Peptoniphilus, Anaerosphaera and Eubacterium were deemed to contribute to the rapid ammonia release and TAN increase. All of their relative abundance approached peak levels on day 7 and decreased to low levels until the concentration of TAN was stable (Figure 3b), showing their negative correlations with TAN revealed by redundancy analysis (RDA) (Figure 5a). Meanwhile, the positive correlations between total amount of VFAs (TVFAs) and the bacteria (Clostridium sensu stricto, Terrisporobacter and Sporanaerobacter) belonging to Firmicutes indicated the high activity of the VFAs generator, although confronted with high TAN pressure. It was assumed that the VFAs begun accumulating due to the limited methanogenesis and fast acidification. The acidic VFAs greatly neutralized the basic ammonia during the start-up phase of AD at 8% TS, which ensured a suitable acid-base condition for methanogens to acclimate to high concentrations of TAN and VFAs [5].
Although positive correlations between Methanosaeta and HAc as well as TVFAs are shown in Figure 5b, the poor accumulation of methane production before day 63 at 8% TS demonstrated that the dominant Methanosaeta was possibly inhibited, and so was the hydrogenotrophic Methanosphaera. In the meantime, the TAN-tolerant Methanosarcina bloomed to promote methanogenesis from day 63, especially after day 98. Methanosarcina took greater responsibility for VFA utilization to produce methane, displaying its negative correlation with the amount of TVFAs and HAc in batch AD experiments (Figure 5b). With the methanogenesis proceeding, large amounts of VFAs were consumed, resulting in the pH increase and thus the increased concentration of FAN (Table 2). FAN turned out to be more of a toxicant than other potential inhibitors. As shown in Figure 3b and Figure 5a, Anaerococcus, Turicibacter and Streptococcus, belonging to Firmicutes were depressed when confronting the increased concentration of FAN and exhibited a negative correlation with FAN. Besides, Sedimentibacter, Saccharofermentans and Ercella belonging to Firmicutes showed a negative correlation with both TAN and FAN when compared their relative abundance during the AD process at 4% and 8% TS, respectively. However, Anaerobacterium, Tissierella and Clostridium III belonging to Firmicutes exhibited extreme tolerance to FAN and their relative abundance increased rapidly only when FAN bloomed in the AD system, as shown the positive correlation (Figure 5a). The above FAN-tolerant bacterium devoted to the degradation of poorly biodegradable organics promoted the solubilization and acidification after an acclimation phase. Similarly, the amino acid-degrading Aminobacterium belonging to Synergistetes [36] and the complex carbohydrate-degrading Petrimonas belonging to Bacteroidetes, also showed tolerance to FAN and supplied VFAs for methanogens to produce methane. Apart from bacteria, the concurrent Methanoculleus belonging to archaea became dominant and replaced Methanosaeta and part of Methanosarcina, confirming its tolerance to FAN once again, according to the positive correlation (Figure 5b). The evolution of the bacterial and archaeal community was a response to the high concentrations of TAN, VFAs and FAN belonging to the ternary pH buffer system, promoting their efficient cooperation to achieve a harvest of methane production from the HSAD at 8% TS.
For HSAD at 11% and 14% TS, the bacteria appeared to have a similar correlation with the even higher concentrations of TAN, VFAs and subsequent FAN (Figure S5a,b). However, the archaeal community at TS ≥ 11% showed some differences from that at 8% TS, after day 77 in particular. The relative abundance of Methanosarcina increased slightly, since the methane production recovered on day 63 and day 42 at 11% and 14%, respectively. This indicated its correlation with FAN gradually changed from positive at 4–8% TS (Figure 5b) to negative at 11–14% TS (Figure S5c,d). Meanwhile, the Methanoculleus still showed a significant positive correlation with FAN. However, Syntrophomonas and SAOB exhibited negative correlations with FAN and propionate, especially at 14% TS (Figure S5d). The lack of an H2 source for Methanoculleus induced the depression of methane production after day 112 when compared with that at 8% TS. FAN-induced inhibition frustrated the cooperation between syntrophic bacteria and methanogenic archaea, although the microbes had previously acclimated to a high TAN concentration. Hence, the primary inhibitor in the ternary pH buffer system responsible for bioenergy loss is FAN, rather than TAN or VFAs, during HSAD treatment of nitrogen-rich wastes. In this condition, the control of FAN concentration via pH regulation should be performed, and the regulation strategy needs to be based on the internal capacity of the ternary pH buffer system.

4. Conclusions

The biochemical conversion tendency and microbial community evolution displayed distinctive differences between conventional AD and HSAD due to the different amounts of TAN and VFAs. The increased amount of TAN suspended the methanogenesis during the start-up period, leading to the accumulation of VFAs and a heavy burden on the microbes. In response, the microbial community, especially for archaea, evolved continually to resist abundant TAN and VFAs belonging to the ternary pH buffer system. Equipped with TAN-tolerant microbial consortia, HSAD at 8% achieved the optimal AD performance, while the depressed performance at 11% and 14% TS was caused by FAN (over 588 mg·N·L−1) which might be responsible for the imperfection in the microbial community.

Supplementary Materials

The following are available online at https://www.mdpi.com/1996-1073/11/11/2991/s1.

Author Contributions

The paper was a collaborative effort from the authors and all authors approved the final manuscript. Investigation: X.M. and Q.S.; methodology: X.M., Q.S., J.Z. and R.W.; writing-original draft: X.M.; project administration: Y.Z.; Y.W. (Yawei Wang); supervision: Y.Z.; Y.W. (Yuansong Wei); funding acquisition: D.Y.; Y.W. (Yawei Wang); writing-review & editing: Y.W. (Yuansong Wei).

Funding

This work is financially supported by the National Key R&D Plan of China (No. 2016YFD0501405), the National Major Science & Technology Projects for Water Pollution Control and Management of China (No. 2017ZX07402001, 2015ZX07203007,), the Fundamental Research Funds for the Central Universities of China University of Mining and Technology (Beijing) (No. 2010YH05) and the National Natural Science Foundation of China (No. 21677161).

Acknowledgments

The authors also acknowledge the experimental support from Bioprocess Control AB and DNA analysis by Sangon Biotech (Shanghai) Co., Ltd.

Conflicts of Interest

The authors declare no conflicts of interest.

References

  1. Vaneeckhaute, C.; Styles, D.; Prade, T.; Adams, P.; Thelin, G.; Rodhe, L.; Gunnarsson, I.; D’Hertefeldt, T. Closing nutrient loops through decentralized anaerobic digestion of organic residues in agricultural regions: A multi-dimensional sustainability assessment. Resour. Conserv. Recycl. 2018, 136, 110–117. [Google Scholar] [CrossRef]
  2. Wu, J.; Hu, Y.Y.; Wang, S.F.; Cao, Z.P.; Li, H.Z.; Fu, X.M.; Wang, K.J.; Zuo, J.E. Effects of thermal treatment on high solid anaerobic digestion of swine manure: Enhancement assessment and kinetic analysis. Waste Manag. 2017, 62, 69–75. [Google Scholar] [CrossRef] [PubMed]
  3. Yu, D.; Liu, J.; Sui, Q.; Wei, Y. Biogas-pH automation control strategy for optimizing organic loading rate of anaerobic membrane bioreactor treating high COD wastewater. Bioresour. Technol. 2016, 203, 62–70. [Google Scholar] [CrossRef] [PubMed] [Green Version]
  4. Yu, D.; Meng, X.; Liu, J.; Dian, L.; Sui, Q.; Zhang, J.; Zhong, H.; Wei, Y. Formation and characteristics of a ternary pH buffer system for in-situ biogas upgrading in two-phase anaerobic membrane bioreactor treating starch wastewater. Bioresour. Technol. 2018, 269, 57–66. [Google Scholar] [CrossRef] [PubMed]
  5. Meng, X.; Yu, D.; Wei, Y.; Zhang, Y.; Zhang, Q.; Wang, Z.; Liu, J.; Wang, Y. Endogenous ternary pH buffer system with ammonia-carbonates-VFAs in high solid anaerobic digestion of swine manure: An alternative for alleviating ammonia inhibition? Process Biochem. 2018, 69, 144–152. [Google Scholar] [CrossRef]
  6. Duan, N.; Ran, X.; Li, R.; Kougias, P.; Zhang, Y.; Lin, C.; Liu, H. Performance evaluation of mesophilic anaerobic digestion of chicken manure with algal digestate. Energies 2018, 11, 1829. [Google Scholar] [CrossRef]
  7. Keucken, A.; Habagil, M.; Batstone, D.; Jeppsson, U.; Arnell, M. Anaerobic co-digestion of sludge and organic food waste—Performance, inhibition, and impact on the microbial community. Energies 2018, 11, 2325. [Google Scholar] [CrossRef]
  8. Shi, X.; Lin, J.; Zuo, J.; Li, P.; Li, X.; Guo, X. Effects of free ammonia on volatile fatty acid accumulation and process performance in the anaerobic digestion of two typical bio-wastes. J. Environ. Sci. China 2017, 55, 49–57. [Google Scholar] [CrossRef] [PubMed]
  9. Rajagopal, R.; Masse, D.I.; Singh, G. A critical review on inhibition of anaerobic digestion process by excess ammonia. Bioresour. Technol. 2013, 143, 632–641. [Google Scholar] [CrossRef] [PubMed]
  10. Zhang, W.; Xing, W.; Li, R. Real-time recovery strategies for volatile fatty acid-inhibited anaerobic digestion of food waste for methane production. Bioresour. Technol. 2018, 265, 82–92. [Google Scholar] [CrossRef] [PubMed]
  11. Niu, Q.; Qiao, W.; Qiang, H.; Li, Y.Y. Microbial community shifts and biogas conversion computation during steady, inhibited and recovered stages of thermophilic methane fermentation on chicken manure with a wide variation of ammonia. Bioresour. Technol. 2013, 146, 223–233. [Google Scholar] [CrossRef] [PubMed]
  12. Fotidis, I.A.; Wang, H.; Fiedel, N.R.; Luo, G.; Karakashev, D.B.; Angelidaki, I. Bioaugmentation as a solution to increase methane production from an ammonia-rich substrate. Environ. Sci. Technol. 2014, 48, 7669–7676. [Google Scholar] [CrossRef] [PubMed]
  13. Fuchs, W.; Wang, X.; Gabauer, W.; Ortner, M.; Li, Z. Tackling ammonia inhibition for efficient biogas production from chicken manure: Status and technical trends in Europe and China. Renew. Sustain. Energy Rev. 2018, 97, 186–199. [Google Scholar] [CrossRef]
  14. Tian, H.; Fotidis, I.A.; Mancini, E.; Treu, L.; Mahdy, A.; Ballesteros, M.; Gonzalez-Fernandez, C.; Angelidaki, I. Acclimation to extremely high ammonia levels in continuous biomethanation process and the associated microbial community dynamics. Bioresour. Technol. 2018, 247, 616–623. [Google Scholar] [CrossRef] [PubMed]
  15. Ruiz-Sanchez, J.; Campanaro, S.; Guivernau, M.; Fernandez, B.; Prenafeta-Boldu, F.X. Effect of ammonia on the active microbiome and metagenome from stable full-scale digesters. Bioresour. Technol. 2017, 250, 513–522. [Google Scholar] [CrossRef] [PubMed]
  16. Whiticar, M.J.; Faber, E.; Schoell, M. Biogenic methane formation in marine and freshwater environments: CO2 reduction vs. acetate fermentation—Isotope evidence. Geochim. Cosmochim. Acta 1986, 50, 693–709. [Google Scholar] [CrossRef]
  17. Wang, D.; Ai, J.; Shen, F.; Yang, G.; Zhang, Y.; Deng, S.; Zhang, J.; Zeng, Y.; Song, C. Improving anaerobic digestion of easy-acidification substrates by promoting buffering capacity using biochar derived from vermicompost. Bioresour. Technol. 2017, 227, 286–296. [Google Scholar] [CrossRef] [PubMed]
  18. Zhang, J.; Lv, C.; Tong, J.; Liu, J.; Liu, J.; Yu, D.; Wang, Y.; Chen, M.; Wei, Y. Optimization and microbial community analysis of anaerobic co-digestion of food waste and sewage sludge based on microwave pretreatment. Bioresour. Technol. 2016, 200, 253–261. [Google Scholar] [CrossRef] [PubMed] [Green Version]
  19. APHA. Standard Methods for the Examination of Water and Wastewater; American Public Health Association: Washington, DC, USA, 2012. [Google Scholar]
  20. Sui, Q.; Meng, X.; Wang, R.; Zhang, J.; Yu, D.; Chen, M.; Wang, Y.; Wei, Y. Effects of endogenous inhibitors on the evolution of antibiotic resistance genes during high solid anaerobic digestion of swine manure. Bioresour. Technol. 2018, 270, 328–336. [Google Scholar] [CrossRef] [PubMed]
  21. Caporaso, J.G.; Lauber, C.L.; Walters, W.A.; Berg-Lyons, D.; Lozupone, C.A.; Turnbaugh, P.J.; Fierer, N.; Knight, R. Global patterns of 16S rRNA diversity at a depth of millions of sequences per sample. Proc. Natl. Acad. Sci. USA 2011, 108 (Suppl. 1), 4516–4522. [Google Scholar] [CrossRef] [PubMed]
  22. Maspolim, Y.; Guo, C.; Xiao, K.; Zhou, Y.; Ng, W.J. Performance and microbial community analysis in alkaline two-stage enhanced anaerobic sludge digestion system. Biochem. Eng. J. 2016, 105, 296–305. [Google Scholar] [CrossRef]
  23. Xiao, B.; Qin, Y.; Wu, J.; Chen, H.; Yu, P.; Liu, J.; Li, Y.-Y. Comparison of single-stage and two-stage thermophilic anaerobic digestion of food waste: Performance, energy balance and reaction process. Energy Convers. Manag. 2018, 156, 215–223. [Google Scholar] [CrossRef]
  24. Kafle, G.K.; Chen, L. Comparison on batch anaerobic digestion of five different livestock manures and prediction of biochemical methane potential (BMP) using different statistical models. Waste Manag. 2016, 48, 492–502. [Google Scholar] [CrossRef] [PubMed]
  25. Yenigün, O.; Demirel, B. Ammonia inhibition in anaerobic digestion: A review. Process Biochem. 2013, 48, 901–911. [Google Scholar] [CrossRef]
  26. Zhang, W.; Lang, Q.; Pan, Z.; Jiang, Y.; Liebetrau, J.; Nelles, M.; Dong, H.; Dong, R. Performance evaluation of a novel anaerobic digestion operation process for treating high-solids content chicken manure: Effect of reduction of the hydraulic retention time at a constant organic loading rate. Waste Manag. 2017, 64, 340–347. [Google Scholar] [CrossRef] [PubMed]
  27. Yuan, H.; Zhu, N. Progress in inhibition mechanisms and process control of intermediates and by-products in sewage sludge anaerobic digestion. Renew. Sustain. Energy Rev. 2016, 58, 429–438. [Google Scholar] [CrossRef]
  28. Angelidaki, I.; Ellegaard, L.; Ahring, B.K. A comprehensive model of anaerobic bioconversion of complex substrates to biogas. Biotechnol. Bioeng. 1999, 63, 363–372. [Google Scholar] [CrossRef]
  29. Ciccoli, R.; Sperandei, M.; Petrazzuolo, F.; Broglia, M.; Chiarini, L.; Correnti, A.; Farneti, A.; Pignatelli, V.; Tabacchioni, S. Anaerobic digestion of the above ground biomass of Jerusalem Artichoke in a pilot plant: Impact of the preservation method on the biogas yield and microbial community. Biomass Bioenergy 2018, 108, 190–197. [Google Scholar] [CrossRef]
  30. Dohrmann, A.B.; Walz, M.; Lowen, A.; Tebbe, C.C. Clostridium cluster I and their pathogenic members in a full-scale operating biogas plant. Appl. Microbiol. Biotechnol. 2015, 99, 3585–3598. [Google Scholar] [CrossRef] [PubMed]
  31. Lin, L.; Wan, C.; Liu, X.; Lee, D.-J.; Lei, Z.; Zhang, Y.; Tay, J.H. Effect of initial pH on mesophilic hydrolysis and acidification of swine manure. Bioresour. Technol. 2013, 136, 302–308. [Google Scholar] [CrossRef] [PubMed] [Green Version]
  32. Ros, M.; de Souza Oliveira Filho, J.; Perez Murcia, M.D.; Bustamante, M.A.; Moral, R.; Coll, M.D.; Lopez Santisima-Trinidad, A.B.; Pascual, J.A. Mesophilic anaerobic digestion of pig slurry and fruit and vegetable waste: Dissection of the microbial community structure. J. Clean. Prod. 2017, 156, 757–765. [Google Scholar] [CrossRef]
  33. Li, Y.; Zhang, Y.; Kong, X.; Li, L.; Yuan, Z.; Dong, R.; Sun, Y. Effects of ammonia on propionate degradation and microbial community in digesters using propionate as a sole carbon source. J. Chem. Technol. Biotechnol. 2017, 92, 2538–2545. [Google Scholar] [CrossRef] [Green Version]
  34. Zhang, J.; Wang, Z.; Wang, Y.; Zhong, H.; Sui, Q.; Zhang, C.; Wei, Y. Effects of graphene oxide on the performance, microbial community dynamics and antibiotic resistance genes reduction during anaerobic digestion of swine manure. Bioresour. Technol. 2017, 245, 850–859. [Google Scholar] [CrossRef] [PubMed]
  35. Wang, M.; Zhang, X.; Zhou, J.; Yuan, Y.; Dai, Y.; Li, D.; Li, Z.; Liu, X.; Yan, Z. The dynamic changes and interactional networks of prokaryotic community between co-digestion and mono-digestions of corn stalk and pig manure. Bioresour. Technol. 2017, 225, 23–33. [Google Scholar] [CrossRef] [PubMed]
  36. Hamdi, O.; Ben Hania, W.; Postec, A.; Bouallagui, H.; Hamdi, M.; Bonin, P.; Ollivier, B.; Fardeau, M.-L. Aminobacterium thunnarium sp. nov. a mesophilic, amino acid-degrading bacterium isolated from an anaerobic sludge digester, pertaining to the phylum Synergistetes. Int. J. Syst. Evol. Microbiol. 2015, 65, 609–614. [Google Scholar] [CrossRef] [PubMed]
Figure 1. Variations of total chemical oxygen demand (TCOD), total soluble chemical oxygen demand (SCOD) and SCOD of volatile fatty acids (VFAs) during anaerobic digestion at different TS contents: (a) 4%; (b) 8%; (c) 11%; (d) 14%.
Energies 11 02991 g001
Figure 2. Changes in VFA components at different TS contents: (a) 4%; (b) 8%; (c) 11%; (d) 14%.
Energies 11 02991 g002
Figure 3. Relative abundance of bacteria at phylum level (a) and heatmap analysis of top ten bacteria at genera level (b) in digesters at increasing TS contents.
Energies 11 02991 g003
Figure 4. Relative abundance of the archaeal community (a) and their principal component analysis (PCA) (b) at genus level in digesters at increasing TS contents.
Energies 11 02991 g004
Figure 5. Redundancy analysis (RDA) to reveal the effects of profiles in the ternary pH buffer system on the bacterial community (a) and the archaeal community (b) at 4% and 8% TS.
Energies 11 02991 g005
Table 1. Comparison of anaerobic digestion (AD) performance at different total solid (TS) contents.
ParametersUnitsTS-4TS-8TS-11TS-14
VSin%3.00 ± 0.086.11 ± 0.038.32 ± 0.0610.85 ± 0.10
VSout%1.08 ± 0.012.17 ± 0.073.41 ± 0.115.70 ± 0.16
VS removal%75.6 ± 1.276.0 ± 1.469.7 ± 1.955.8 ± 1.3
TS removal%63.0 ± 0.262.9 ± 0.156.7 ± 1.243.9 ± 1.3
Cumulative MethaneNmL2480 ± 95741 ± 3396955 ± 5937287 ± 376
Methane PotentialNmL/g-VS271 ± 1314 ± 19277 ± 24214 ± 11
TCOD reduction%74.2 ± 2.976.7 ± 1.568.5 ± 3.265.4 ± 2.8
T80adays59104118NQ b
T80*cdays565956-
a duration for 80% of methane potential; b not qualified, failed to reach 80% of methane potential; c duration for 80% of methane potential not counting lag phase.
Table 2. Variations of main parameters with AD proceeding.
SamplespH ValueTAN (mg·L−1)TAN Increment bFAN (mg·L−1)FAN Increment cExtent of Acidification (%)Extent of Solubilization (%)
Manure7.08 ± 0.08 a3974 ± 87-----
Inoculum8.02 ± 0.042281 ± 36-280 ± 4---
TS-4B07.21 ± 0.01928 ± 22020 ± 007.35 ± 0.0620.49 ± 0.37
B77.08 ± 0.091392 ± 620.5020 ± 00.0032.52 ± 0.9138.10 ± 0.20
B357.30 ± 0.041570 ± 200.6943 ± 51.1538.39 ± 0.4845.88 ± 0.06
B637.79 ± 0.011608 ± 470.73125 ± 65.2538.72 ± 0.6145.92 ± 0.20
B777.75 ± 0.041659 ± 860.79114 ± 154.7039.59 ± 0.4946.19 ± 1.17
TS-8C06.95 ± 0.011825 ± 44022 ± 007.54 ± 0.0518.71 ± 1.30
C77.00 ± 0.033060 ± 1580.6838 ± 00.7325.45 ± 0.9534.87 ± 0.76
C356.42 ± 0.013569 ± 810.9613 ± 1−0.4131.92 ± 1.2539.01 ± 1.45
C777.73 ± 0.023232 ± 520.77223 ± 109.1432.98 ± 3.2740.18 ± 2.83
C1447.84 ± 0.023364 ± 470.84282 ± 411.8244.10 ± 2.9050.00 ± 1.66
TS-11D06.86 ± 0.002814 ± 33027 ± 007.58 ± 0.0620.08 ± 0.21
D77.21 ± 0.024241 ± 930.5188 ± 22.2621.71 ± 0.7030.98 ± 1.51
D356.51 ± 0.065057 ± 690.8024 ± 1−0.1126.22 ± 1.1334.01 ± 0.77
D777.99 ± 0.034887 ± 1230.74588 ± 1220.7828.78 ± 0.7736.37 ± 1.11
D1447.91 ± 0.124451 ± 1230.58466 ± 9816.2641.10 ± 1.7349.20 ± 0.99
TS-14E06.75 ± 0.023206 ± 95024 ± 007.83 ± 0.0921.88 ± 0.64
E77.09 ± 0.065370 ± 4050.6784 ± 162.5022.57 ± 0.9636.03 ± 1.99
E356.68 ± 0.046134 ± 3990.9141 ± 10.7127.63 ± 1.4938.06 ± 1.60
E778.09 ± 0.125918 ± 700.85734 ± 5429.5831.04 ± 2.4339.51 ± 1.92
E1447.85 ± 0.055778 ± 00.80540 ± 3221.5037.19 ± 2.0646.91 ± 1.88
a Measured via diluted manure with deionized water by 10 times; b Compared with TAN on day 0 in each group; c Compared with FAN on day 0 in each group.

