Research on Battery Energy Storage as Backup Power in the Operation Optimization of a Regional Integrated Energy System

1
School of Economics and Management North China Electric Power University, Changping District, Beijing 102206, China
2
China Electric Power Research Institute, Haidian District, Beijing 100192, China
*
Author to whom correspondence should be addressed.
Energies 2018, 11(11), 2990; https://doi.org/10.3390/en11112990
Submission received: 8 October 2018
/
Revised: 25 October 2018
/
Accepted: 27 October 2018
/
Published: 1 November 2018
Abstract
:Recently, integrated energy systems have become a new type of energy supply model. It is clear that integrated energy systems can improve energy efficiency and reduce costs. However, the use of a battery energy storage system (BESS) as a backup power source will affect the operating costs of a regional integrated energy system (RIES) in different situations. In this paper, a regional integrated energy system including wind turbines, photovoltaics, gas turbines and battery energy storage was introduced. In order to obtain the minimum operation cost, an operation optimization model was built. The schedule plans of each unit were optimized by a moth flame optimization (MFO) algorithm. Finally, three different scenarios were proposed for the simulation optimization. The simulation optimization results show that when the BESS is used as a backup power source, the operating cost of the system and the resulting pollutant emissions are less than the diesel generator (DG) set. Therefore, it is worthwhile to use BESS instead of DG as the backup power source in RIES.
1. Introduction
With the development of intelligent power distribution and energy Internet technologies, the traditional energy supply model faces enormous challenges. In addition to the fact that traditional energy supply systems cannot meet the users’ energy needs [1], environmental pollution problems and the energy crisis are also problems worthy of our attention [2]. Therefore, it is necessary to study the operation optimization and operation cost of a regional integrated energy system (RIES) to promote the efficient development and utilization of energy.
RIES refers to the use of advanced physical information technology and innovative management modes in certain regions. RIES is an integrated system of energy production, supply and consumption, which can realize the coordination and optimization of different energy sources in the process of energy system planning, construction, and operation. In addition, RIES is a new energy supply mode, which transforms solar energy, wind energy, geothermal energy, natural gas (NG), biomass and other resources into cold, heat, electricity and other forms of energy needed by consumers with advanced energy conversion and transmission technologies. The purpose of building an RIES is to effectively improve the efficiency of the comprehensive utilization of energy and improve the flexibility, security, economy and self-healing capacity of the energy supply system [3,4,5,6].
RIES consists primarily of three subsystems: an energy supply system, an energy conversion system, and an energy consumption system. Renewable energy sources such as wind turbines (WT) and photovoltaics (PV) are mainly used in the energy supply system. In addition, NG, as a fossil fuel used in energy supply systems, contributes to the reduction of sustainability in energy systems. Many scholars have contributed a great deal of research in this area. An RIES can effectively utilize the wind energy in a park to make the energy supply cleaner, thus generating extensive discussion and research [7,8]. Simultaneously, renewable energy (such as WT and PV) has become a development direction in the use of power systems in line with energy policy and environmental protection requirements [9,10,11]. Combined heating and power (CHP) is representative of energy conversion systems. CHP systems are widely used and studied in China because of their high energy efficiency and application characteristics [12]. The problem that WT and PV cannot be flexibly scheduled while maintaining a certain level of reliability can be solved through a battery energy storage system (BESS).While the specificity of the BESS due to the participation on both the energy demand side and energy supply side makes it play an important role in an RIES, many relevant studies have pointed out that the BESS could ensure the power balance of the system when the load fluctuates, and the power of energy storage could be dispatched from the technical and economic level in an RIES. That is, it is difficult to supervise renewable energy sources such as wind and photovoltaic power due to their unpredictability, but we can handle the impact of their fluctuations through BESS. The operational costs of storage in an RIES are key factors in economic operations and require in-depth discussion. In recent years, the main focus of the BESS is state of charge (SOC). The SOC, also called the remaining charge, represents the ratio of the remaining capacity of the battery after a period of use or long-term suspension to its fully charged state, expressed as a percentage. When SOC = 0, the battery is fully discharged, and when SOC = 1, the battery is fully charged. In [13], considering the main factors that affect the battery life, such as depth of discharge, discharge rate and charging or discharging time, a cumulative damage model is proposed. Reference [14] considers the economic efficiency perspective to eliminate the corner solution by allowing a combination of storage and renewable reduction, and the authors believe that energy storage does not limit the further development of renewable energy. Reference [15] establishes a regional integrated energy system model to improve energy utilization efficiency by utilizing the economic advantages of electric energy storage and obtains an optimal solution, so that the cogeneration system in the RIES can be effectively activated by energy storage equipment. The ground is separated from the thermoelectric operating constraints. Reference [16] studied the impact of energy storage on annual electricity imports and costs. References [17,18] establish a hybrid energy system optimization model with both renewable energy and BESS and optimize the scheduling of various resources. This model mainly considers the non-negligible frequency offset problem and the overall economic benefits of the system. In [19], on the basis of meeting the power demand, BESS can be used to obtain the residual energy of renewable energy (wind energy, photovoltaic) and store it. In [20,21], the BESS characteristics, which are the main factors that affect the life of a battery, such as discharge depth, discharge rate and charge or discharge times, were analyzed. An accumulated damage model was proposed, where each discharge process could cause irreversible damage to the battery life until the battery is scrapped. In conclusion, the output capability of the BESS will change under different SOCs, which can be reflected in amp hours, and it is critical to consider the calculated lifetime loss of BESS operating costs.
To sum up, energy storage in the RIES can play the role of a backup power source, promote the consumption of renewable energy (wind power and photovoltaic), and also help to cut peaks and fill valleys. In the operation of RIES, operating costs and environmental pollutant emissions have always been an important issue of our concern, and they have also received widespread attention. Therefore, in the operation optimization of RIES, it is necessary to consider the role of BESS to maximize its functions, thereby reducing system operating costs and pollutant emissions. Compared with the existing research on the operation of BESS and RIES, the existing research has made some contributions in these two aspects. In this paper, we focus on the operation of BESS in different situations when it plays the role of standby power in an RIES, and consider the state of charge storage. Based on this, this paper proposes an RIES operation optimization model with WT, PV, BESS and CHP. In the RIES considered in this paper, CHP is the only source of heating load, the power of the gas turbine is determined by the heat load, and an RIES operation optimization model is established. The objective function of the regional integrated energy optimization model is to minimize the operating costs of the system and determine the optimal coordination between the various energy sources. In addition, this text also uses the regional integrated energy demonstration project to verify the impact of BESS as a backup power source on system operating costs in different scenarios.
In the rest of this article, the structure and composition of the RIES and the operational optimization model are first analyzed. Secondly, the modeling process of the RIES operation optimization is elaborated. After this, the model’s simulation process and the results analysis are described in Section 5. Finally, Section 6 summarizes the important conclusions of this study.
2. System Modeling and Strategy
2.1. System Structure
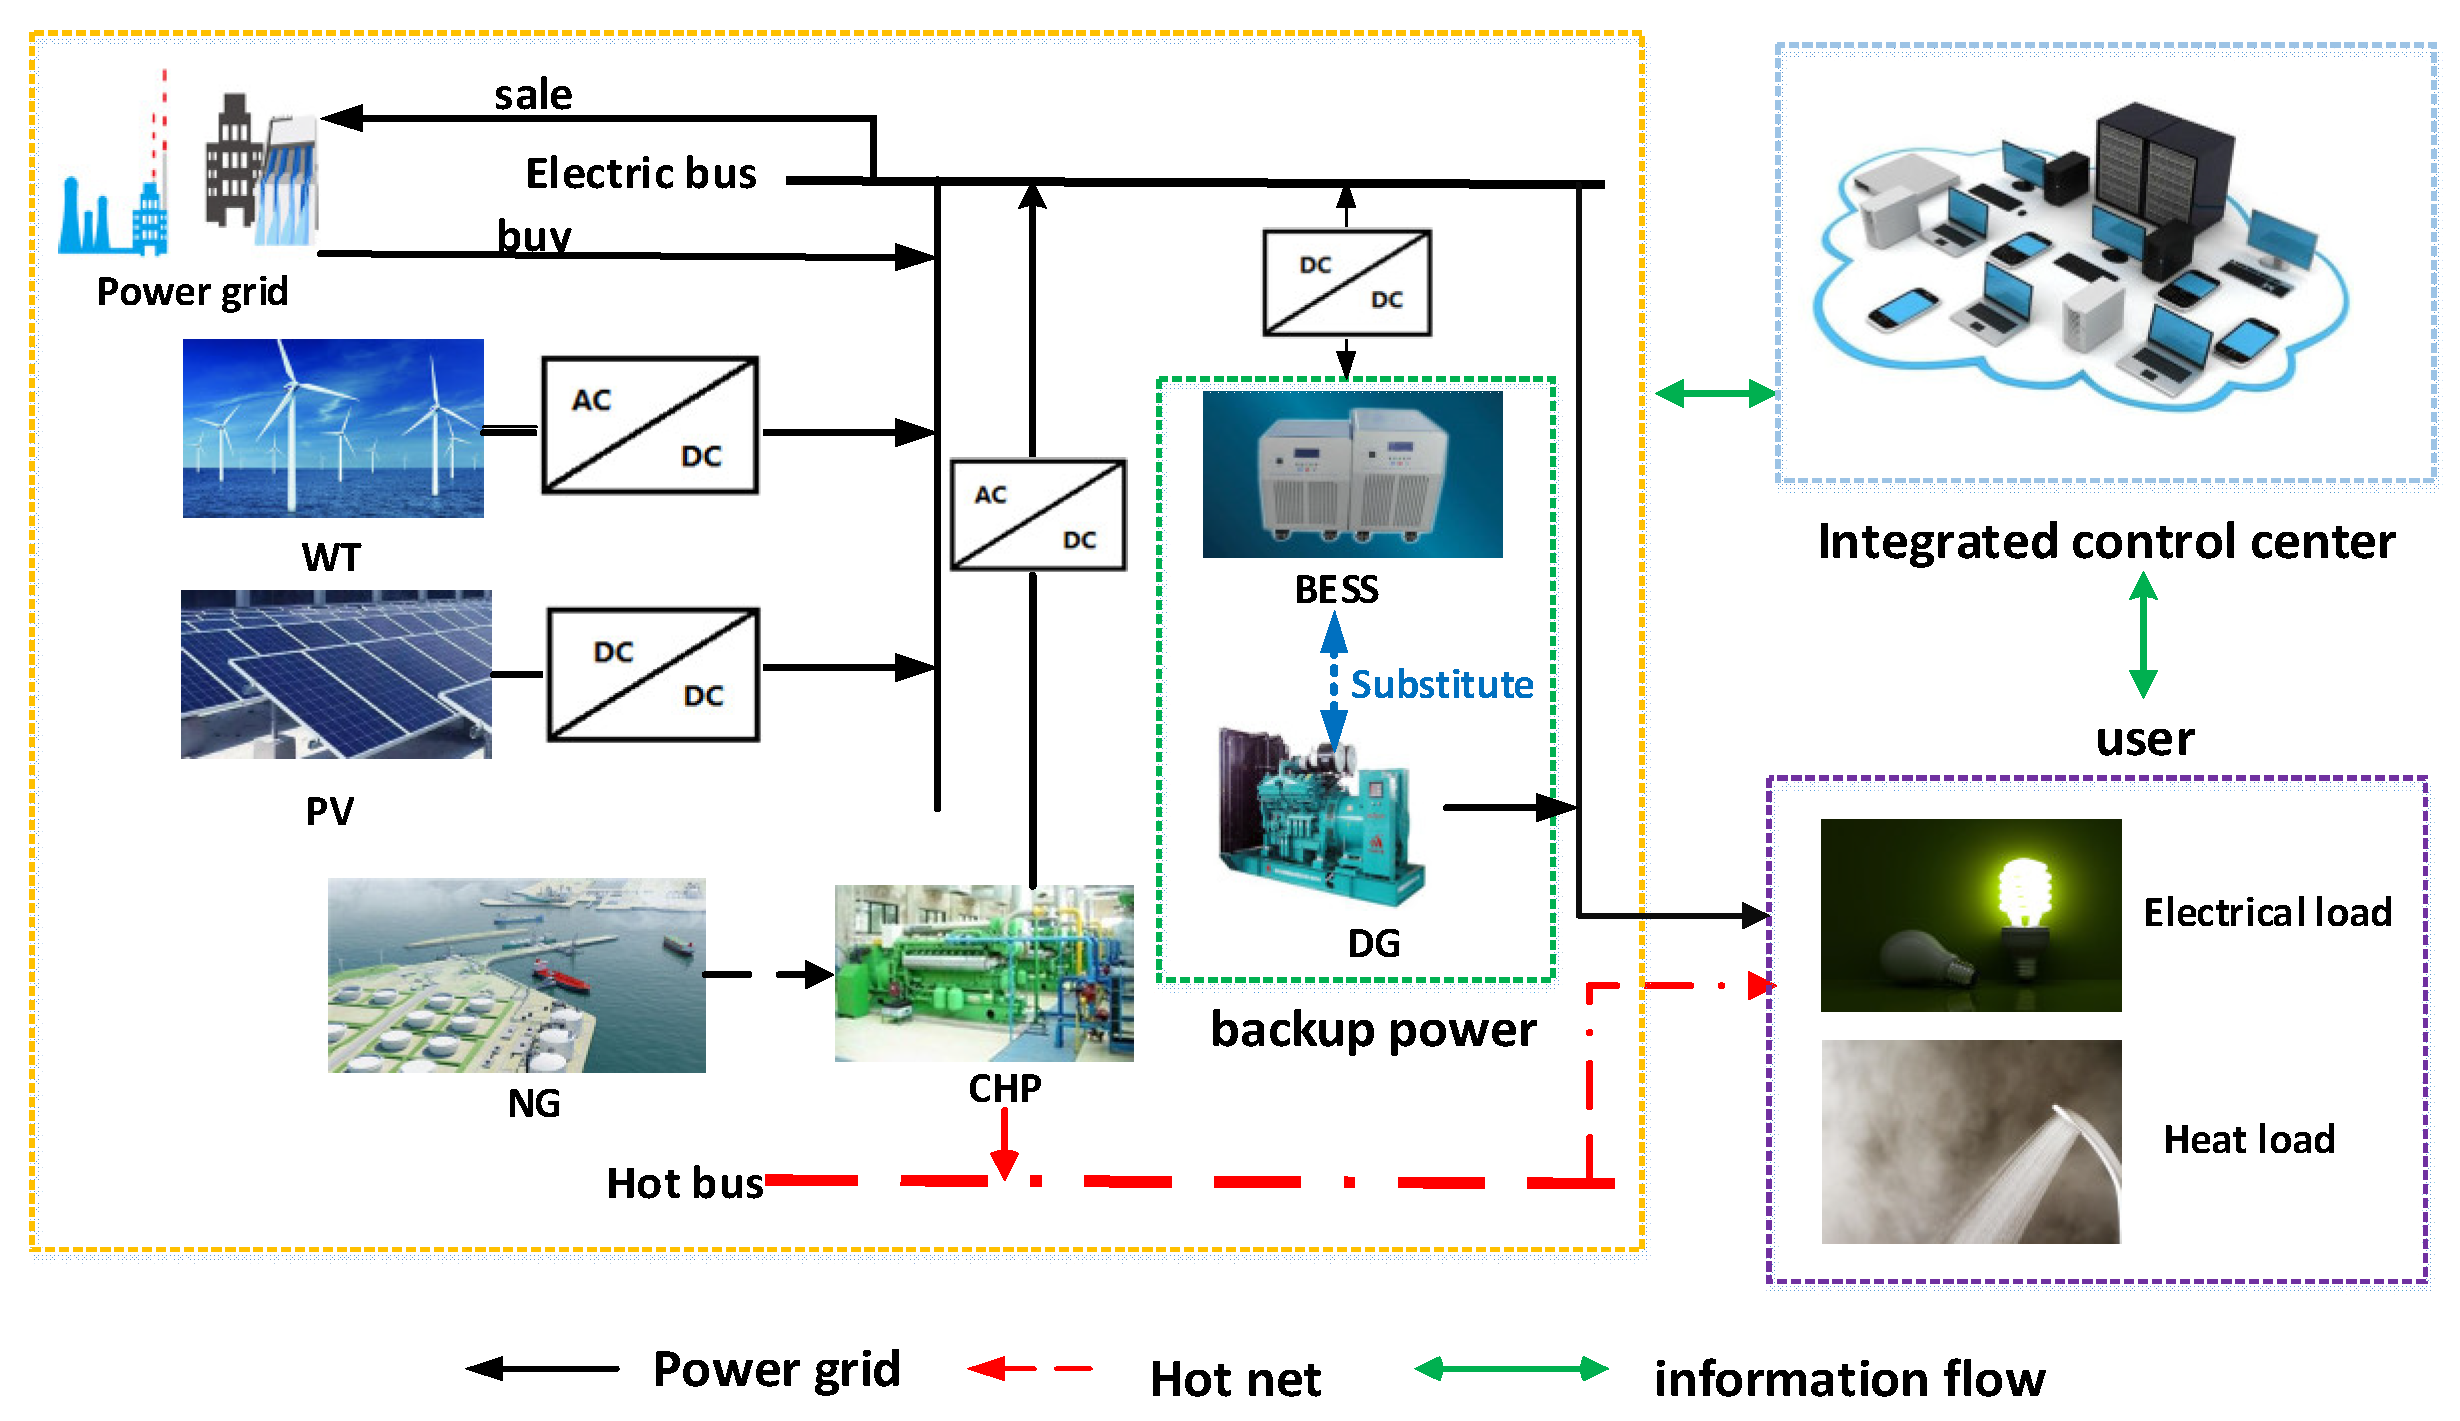
RIES is a new type of energy supply model. It can not only meet the multi-energy needs of users, but can also improve energy efficiency. The RIES considered in this paper can provide electricity and heating, which is made up of WT, PV, BESS and CHP. Figure 1 shows a typical regional integrated energy system structure.
As can be seen from Figure 1, the RIES is not only a superposition of different types of energy, but also an autonomous system that can be independently controlled, protected and managed by an integrated control center. RIES mainly consists of three subsystems: an energy supply system, energy conversion system and energy consumption system. RIES considers the conversion of AC and DC, where PV and BESS are DC distributed power supplies and WT and CHP are AC distributed power supplies. However, in the RIES structure chart, we focus on the energy flow. Diesel generators (DG) can play the role of a backup power source in a regional integrated energy system. In addition to DG, BESS can also be used as a backup power source for RIES, which can replace diesel generators. In this article, we focus on the impact of BESS as a backup power source for the operation of the RIES in different situations.
2.2. System Output Model
The key to achieving optimal operation of an RIES is coordination. The premise of coordination is understanding the output characteristics of distributed power supply and realizing the complementary advantages of various energy sources according to the law of power generation and output.
- (1)
- Model of wind power output:The power of the WT is determined by the wind speed. In this paper, the Weibull wind speed model is obeyed. The probability density of the fan is expressed as Equation (1):where k is the shape parameter and c is the scale parameter of the Weibull distribution.When the wind velocity is less than the cut-in wind velocity () or more than the cut-out wind velocity (), the power of the generator fan is 0. When the wind velocity is more than the cut-in wind velocity and less than the rated wind velocity (), the power output can be expressed as a function of wind velocity as an independent variable. When the wind velocity reaches the specified wind velocity, and it is less than the cut-out wind velocity, the fan runs at rated power. The output power is shown as Equation (2):
- (2)
- Model of photovoltaic output:The PV module temperature and photovoltaic radiation intensity determine the output of the PV system:where is the photovoltaic output energy conversion efficiency and takes 0.9; is the rated power of PV; is the actual radiation intensity of PV; is the rated light intensity; is the power temperature coefficient and takes 0.0047 °C−1 [22]; is the actual temperature of the PV module; and is the rated temperature of PV module.
- (3)
- Model of energy storage output:In this paper, a lithium-ion battery with a two-state reliability mathematical model is used as an energy storage device. is the power of the battery exchanged with the outside at t time.When , the external system lacks power, and the battery is in a discharged state. The battery discharge power is calculated as follows:where is the maximum discharge power constraint of the battery; is the minimum charge state constraint of the battery; is the charge rate of the battery at t − 1 time; is the minimum battery charge rate; is the discharge efficiency of the battery; is the total capacity of the battery; and is a simulation time interval.When , the external system has sufficient power to recharge the battery. The charging power is calculated as follows:where is the maximum charge power constraint of the battery; is the maximum charge state constraint of the battery; is the discharging efficiency of the battery; and is the minimum battery charge rate.
- (4)
- Model of CHP output:The gas turbine (GT) is a rotary impeller type power device which converts the thermal energy generated by combustion gas into mechanical energy. It is mainly comprised of a control system, an air compressor, a turbine, a gas combustion chamber and related auxiliary equipment. In general, the GT determines the type and capacity of these, and many of its parameters are known. Therefore, when the fuel is supplied, the thermoelectric supply also has a certain value. The rated thermoelectric ratio is calculated as follows:where is the rated thermoelectric ratio; and are the heat supply and power generation.The generating efficiency of a gas turbine has a relationship to the output power. The amount of natural gas and the heat generated are calculated as follows:where is the waste heat of the exhaust at time t; is the generator efficiency; is the GT output at time t; is the heat loss coefficient of GT; is the low calorific value of natural gas; and is the natural gas consumption per unit time.The CHP system costs include the initial investment and operating costs. Generally, the initial investment of the system is large and the operating cost is lower. The labor costs in operation are not considered. The operating costs can be expressed as follows:where is the gas price, is the consumption of the total heat; and is the net calorific power of the natural gas.
3. Problem Formulation
In this section, in order to improve the economics of the system and reduce environmental pollution, we have established an objective function aiming at minimizing power generation costs and minimizing environmental costs. At the same time, constraints are given for active power balance, the capacity of equipment and ramp rate operation, energy storage strategy, CHP balance and environmental issues.
3.1. Objective Function
The purpose of RIES operation optimization is to arrange the output plan of each controllable unit rationally by setting the complementary strategy so as to minimize the total system operation cost while meeting the distributed power operational restrictions and grid restrictions. The operating costs of RIES mainly include power generation costs, depreciation costs and environmental costs. The cost of power generation mainly includes the fuel cost of the CHP and the maintenance cost of the generator set. Depreciation cost refers to the cost incurred during the use of the equipment. The environmental costs consist of the cost of pollutants and the cost of fines during power generation.
During RIES operation, the output of non-clean power sources (such as CHP) in the system will be different when the ESS is used as a backup power source in different situations. The difference in output will result in different sales revenues for the system. In order to improve the economics of the system and reduce environmental pollution, this paper establishes an objective function aiming at minimizing power generation costs and minimizing environmental costs. In this section, we optimize the real-time output of each micro-source in RIES with distributed wind power, photovoltaic, CHP and BESS. The T-cycle heat load/electric load is predicted at each T − 1 cycle. Because the response time of the gas turbine is relatively fast, the T period is set at 5 min; next, after 5 min, a micro-source issues a directive, and the output is adjusted at the T − 1 period. The objective function is as follows:
where is the bus tie line exchange power; is the t time purchase/surplus feed-in tariff; is gas prices; is gas consumption per unit of time; t is time and is the cost of BESS; is the cost of WT, and is the cost of PV.; is the environmental cost in yuan; is the environmental value of pollutants in yuan/kg; is the emissions of pollutants in kg; and Z is the penalty costs due to excessive emissions in yuan.
It is worth mentioning that includes operating costs and other costs. Assuming that the cost of each charge and discharge of BESS is the same, the operating cost of BESS is equal to the cost of a single charge and discharge multiplied by the number of charges and discharges. The other costs of BEES involve maintenance costs, labor costs, management fees, the building costs of devices and so on. Considering the complexity of BESS’s other costs, the other costs are expressed by the cost per unit power. Similarly, in order to simplify the calculation, the and are also expressed as unit power cost.
3.2. Constraints
- (1)
- Active power balance constraints:where is the number of generating units that can be dispatched by microgrids; is the dispatching power generation power output at time t; is distributed photovoltaic power output at time t; is the total active load in the system at time t; is distributed wind power output at time t; and is tie line power output at time t.
- (2)
- Capacity of equipment and ramp rate operation constraints:where and are the upper and lower limits of the active output of the adjustable power generation unit; and and are the upper and lower limits of the active output of the unscheduled power generation unit.The schedulable generation units follow (16) and (17) when increasing load and reducing load, respectively.The non-scheduled power generation units follow (18) and (19) when increasing load and reducing load, respectively.
- (3)
- Energy storage strategy constraints:where is state of charge at time t.
- (4)
- CHP balance constraints:
- (1)
- Electrical bus balance constraints:where is the exchange power of RIES and the grid; is the power generation of the gas turbine; is the power output of the photovoltaic; is the power output of the WT; is the discharge power of the storage device; is the electrical load; is the power of the electric refrigerator; is the power of the electric boiler; and is the charging power of the storage device.
- (2)
- Flue gas bus balance constraints:where is the thermal efficiency of the gas turbine; and is the power output of the waste heat boiler.
- (3)
- Steam bus balance constraints:where is the thermal efficiency of the waste heat boiler; is the heat flux of the gas boiler; is the power of the thermal storage device; is the output of heat exchange; and is the exothermic power of the thermal storage device.
- (4)
- Hot water bus balance constraints:where is the efficiency of heat exchange, and is the heat load.
- (5)
- Air bus balance constraints:where is the cooling efficiency of the electric refrigerator; is the cooling power of the electric refrigerator; and is the cold load.
- (6)
- Environmental constraint:where is the maximum allowable emission in accordance with the environmental policy provision.
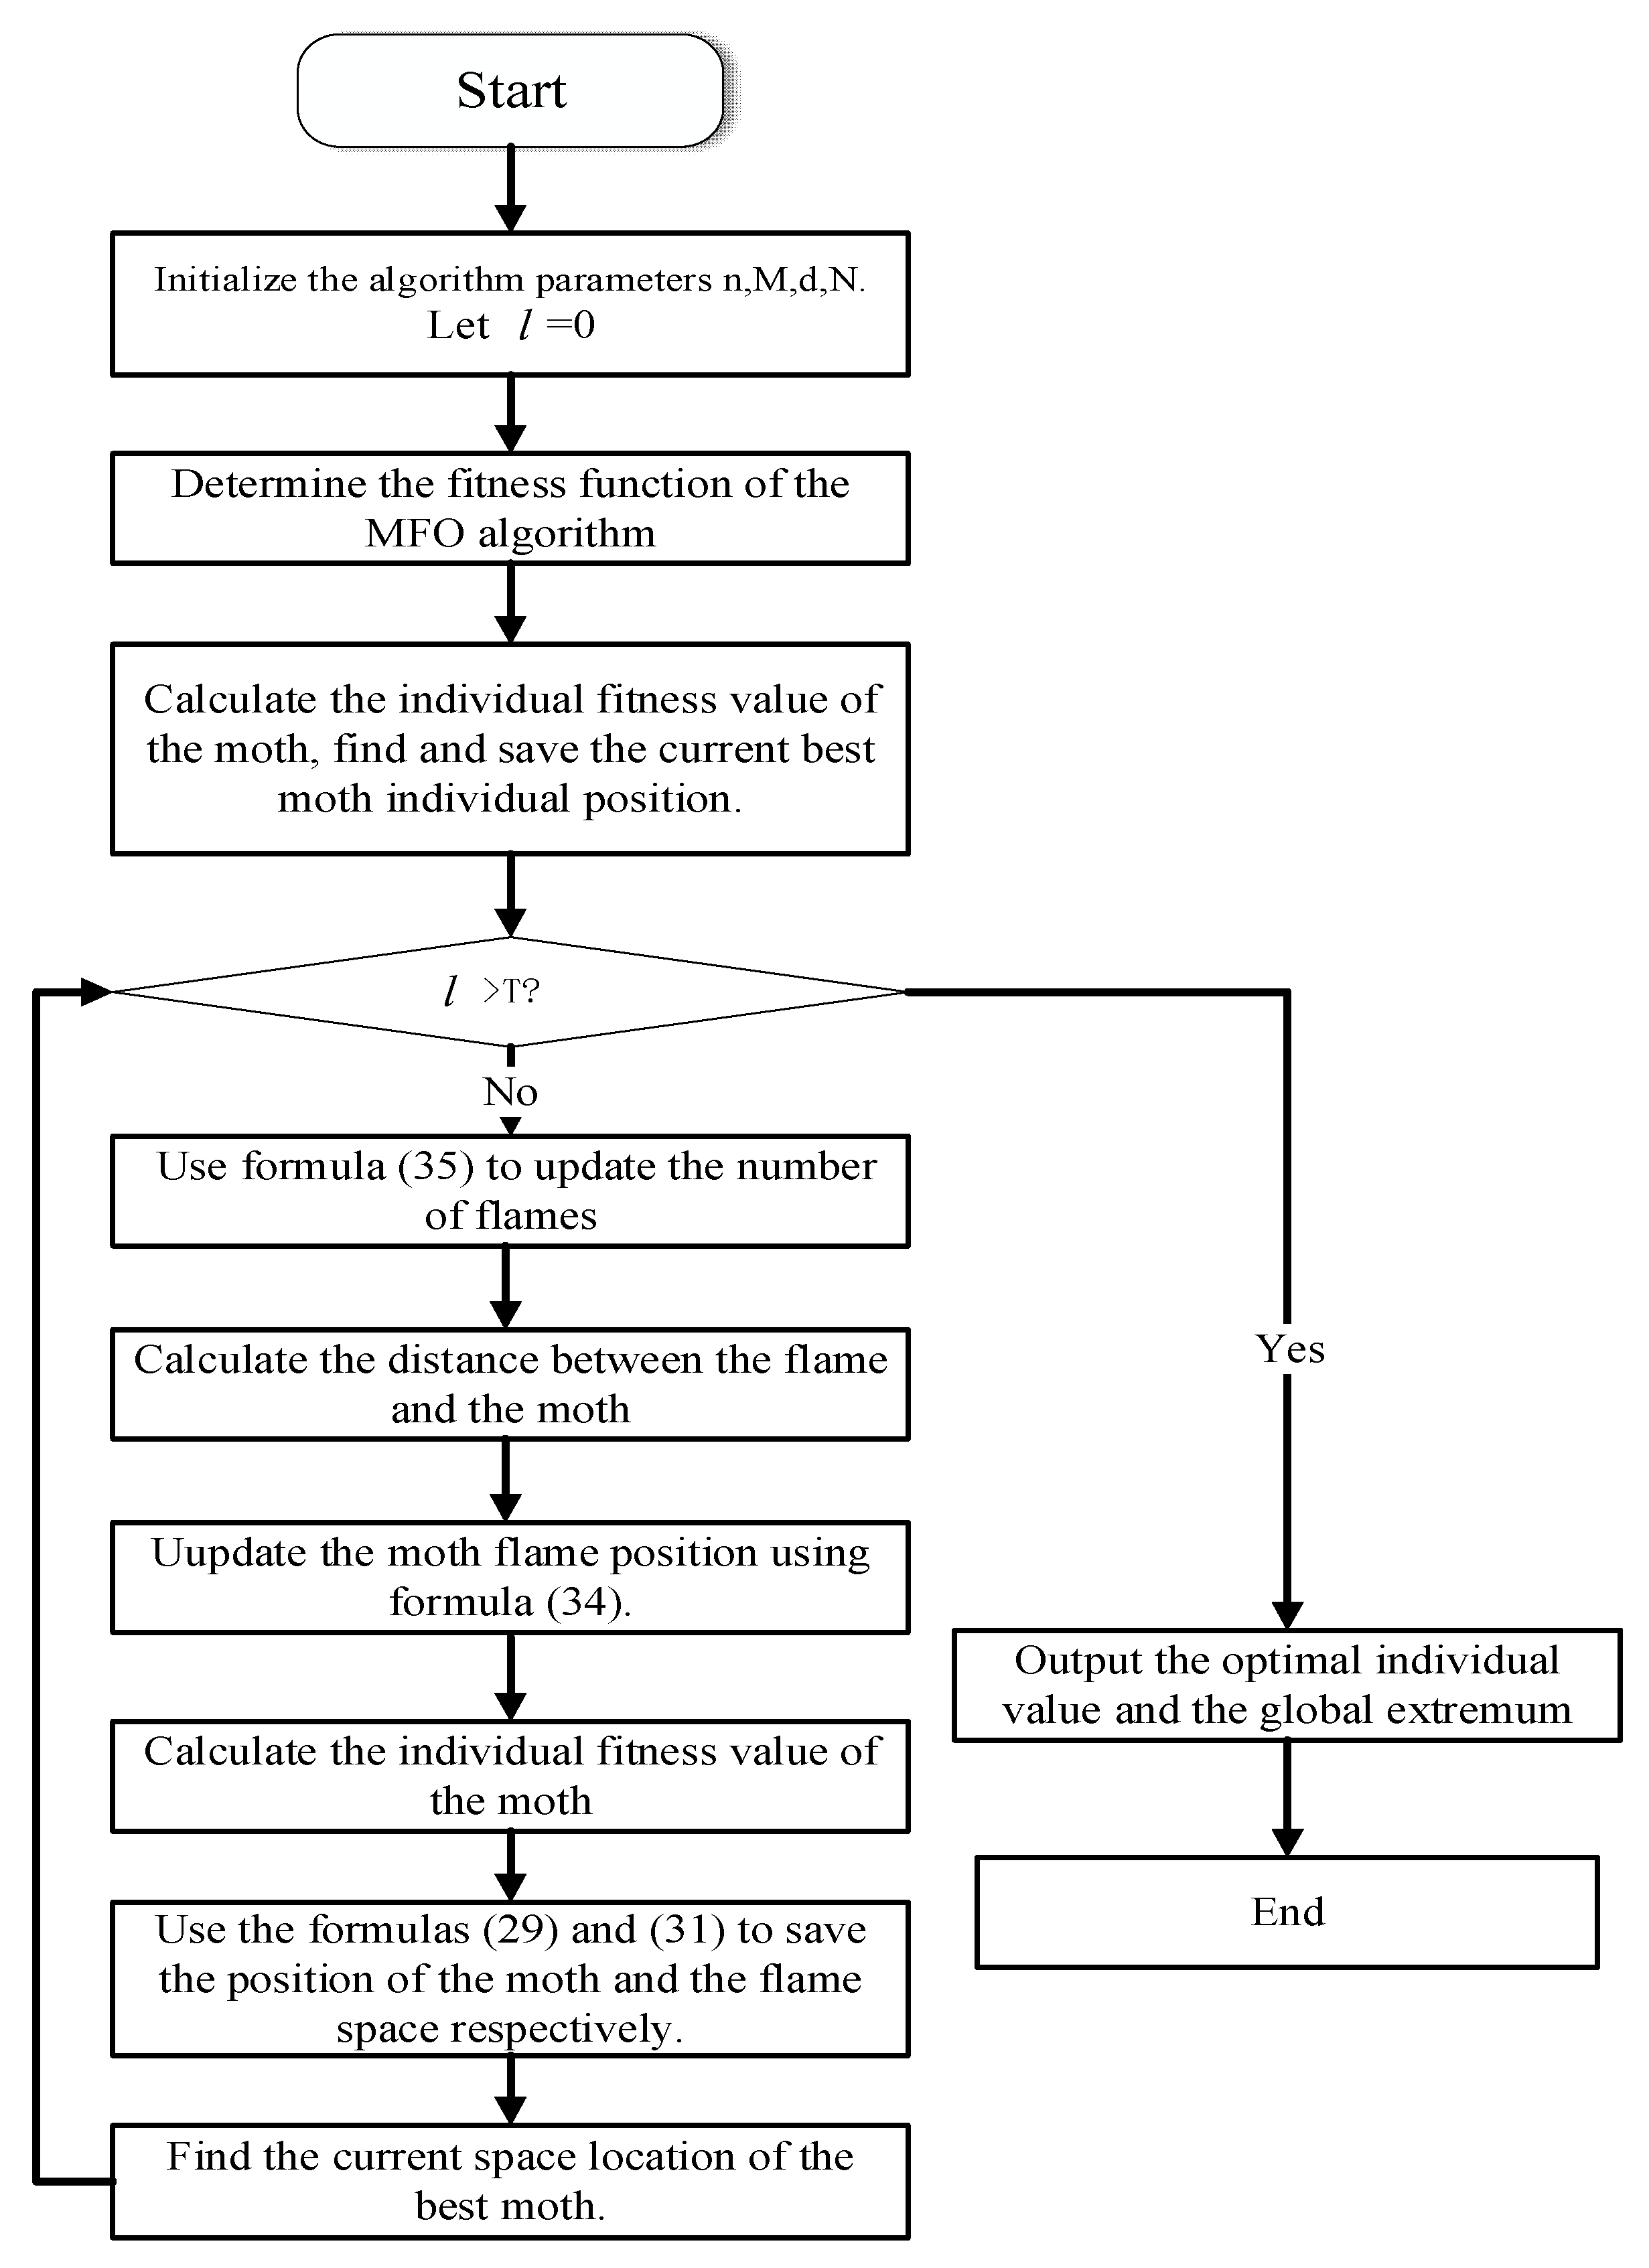
4. Methodology of the Moth Flame Optimization Algorithm
The moth flame optimization algorithm (MFO) is a new biomimetic group intelligent algorithm proposed by Mirjalili et al. in 2015 [22]. Compared with other intelligent optimization algorithms, it has a faster search speed, fewer adjustment parameters, higher convergence precision and better robust performance. Its main advantage is that its characteristics do not easily fall into the local optimum.
The mathematical model of the MFO algorithm is described as follows:
In matrix (28), n is the population size of the moth; and d is the spatial location of the moth in which the problem dimension is optimized. Matrix (29) is a fitness value used to store individual moths.
Another key part of the MFO algorithm is the flame, expressed as follows:
The flame fitness value is stored using the matrix of Equation (31).
Both moths and flames are candidate solutions, and their main difference is that the location is updated differently during evolution. The moth is the search engine that moves around the search space, and the flame is the best position for the current iteration. It should constantly be updated by the position of the flame until the best position is obtained. Therefore, the MFO algorithm can be defined as follows:
where I is the randomly generated moth population size and the corresponding fitness function value; P is a function of the moth moving in the search space, which is the matrix M and position update return value; and K is the discriminant function of whether the termination condition is satisfied.
The mathematical model is used to describe the moth flame position update as follows:
The MFO algorithm expression used to simulate the moth spiral flight path is as follows:
where is the i-th moth; is the j-th flame; S is the spiral function; is the distance from the j-th flame to the i-th moth, expressed as ; b is a spiral shape constant; and t is a random number between [−1, 1].
In order to ensure a faster convergence speed of the MFO algorithm, an adaptive flame quantity update mechanism is proposed, which adaptively reduces the number of flames in the iterative process, and the mathematical description is as follows:
where is the number of adaptive flame reductions; is the current number of iterations; N is the maximum number of flames; and M is the maximum number of iterations.
Combined with the above analysis, the optimization process of microgrid operation based on the MFO algorithm is shown in Figure 2.
5. Case Study
In this section, we first give some data and parameters in the regional integrated energy demonstration project. Then, three different scenarios are proposed for simulation optimization. The software we use for simulation optimization is MATLAB, 2016 version, and the computer configuration for operation is 64 bits for the Windows 10 system. The optimization results show that the operating cost of the gas turbine (GT) accounts for a higher proportion of the total operating cost of the system, and plays an important role in the solution of the RIES operation optimization model. When the BESS is used as a backup power source, the operating cost of the system and the resulting pollutant emissions are less than the diesel generator set. Therefore, it is worthwhile to use BESS instead of DG as the backup power source in RIES.
5.1. Data and Parameters Setting
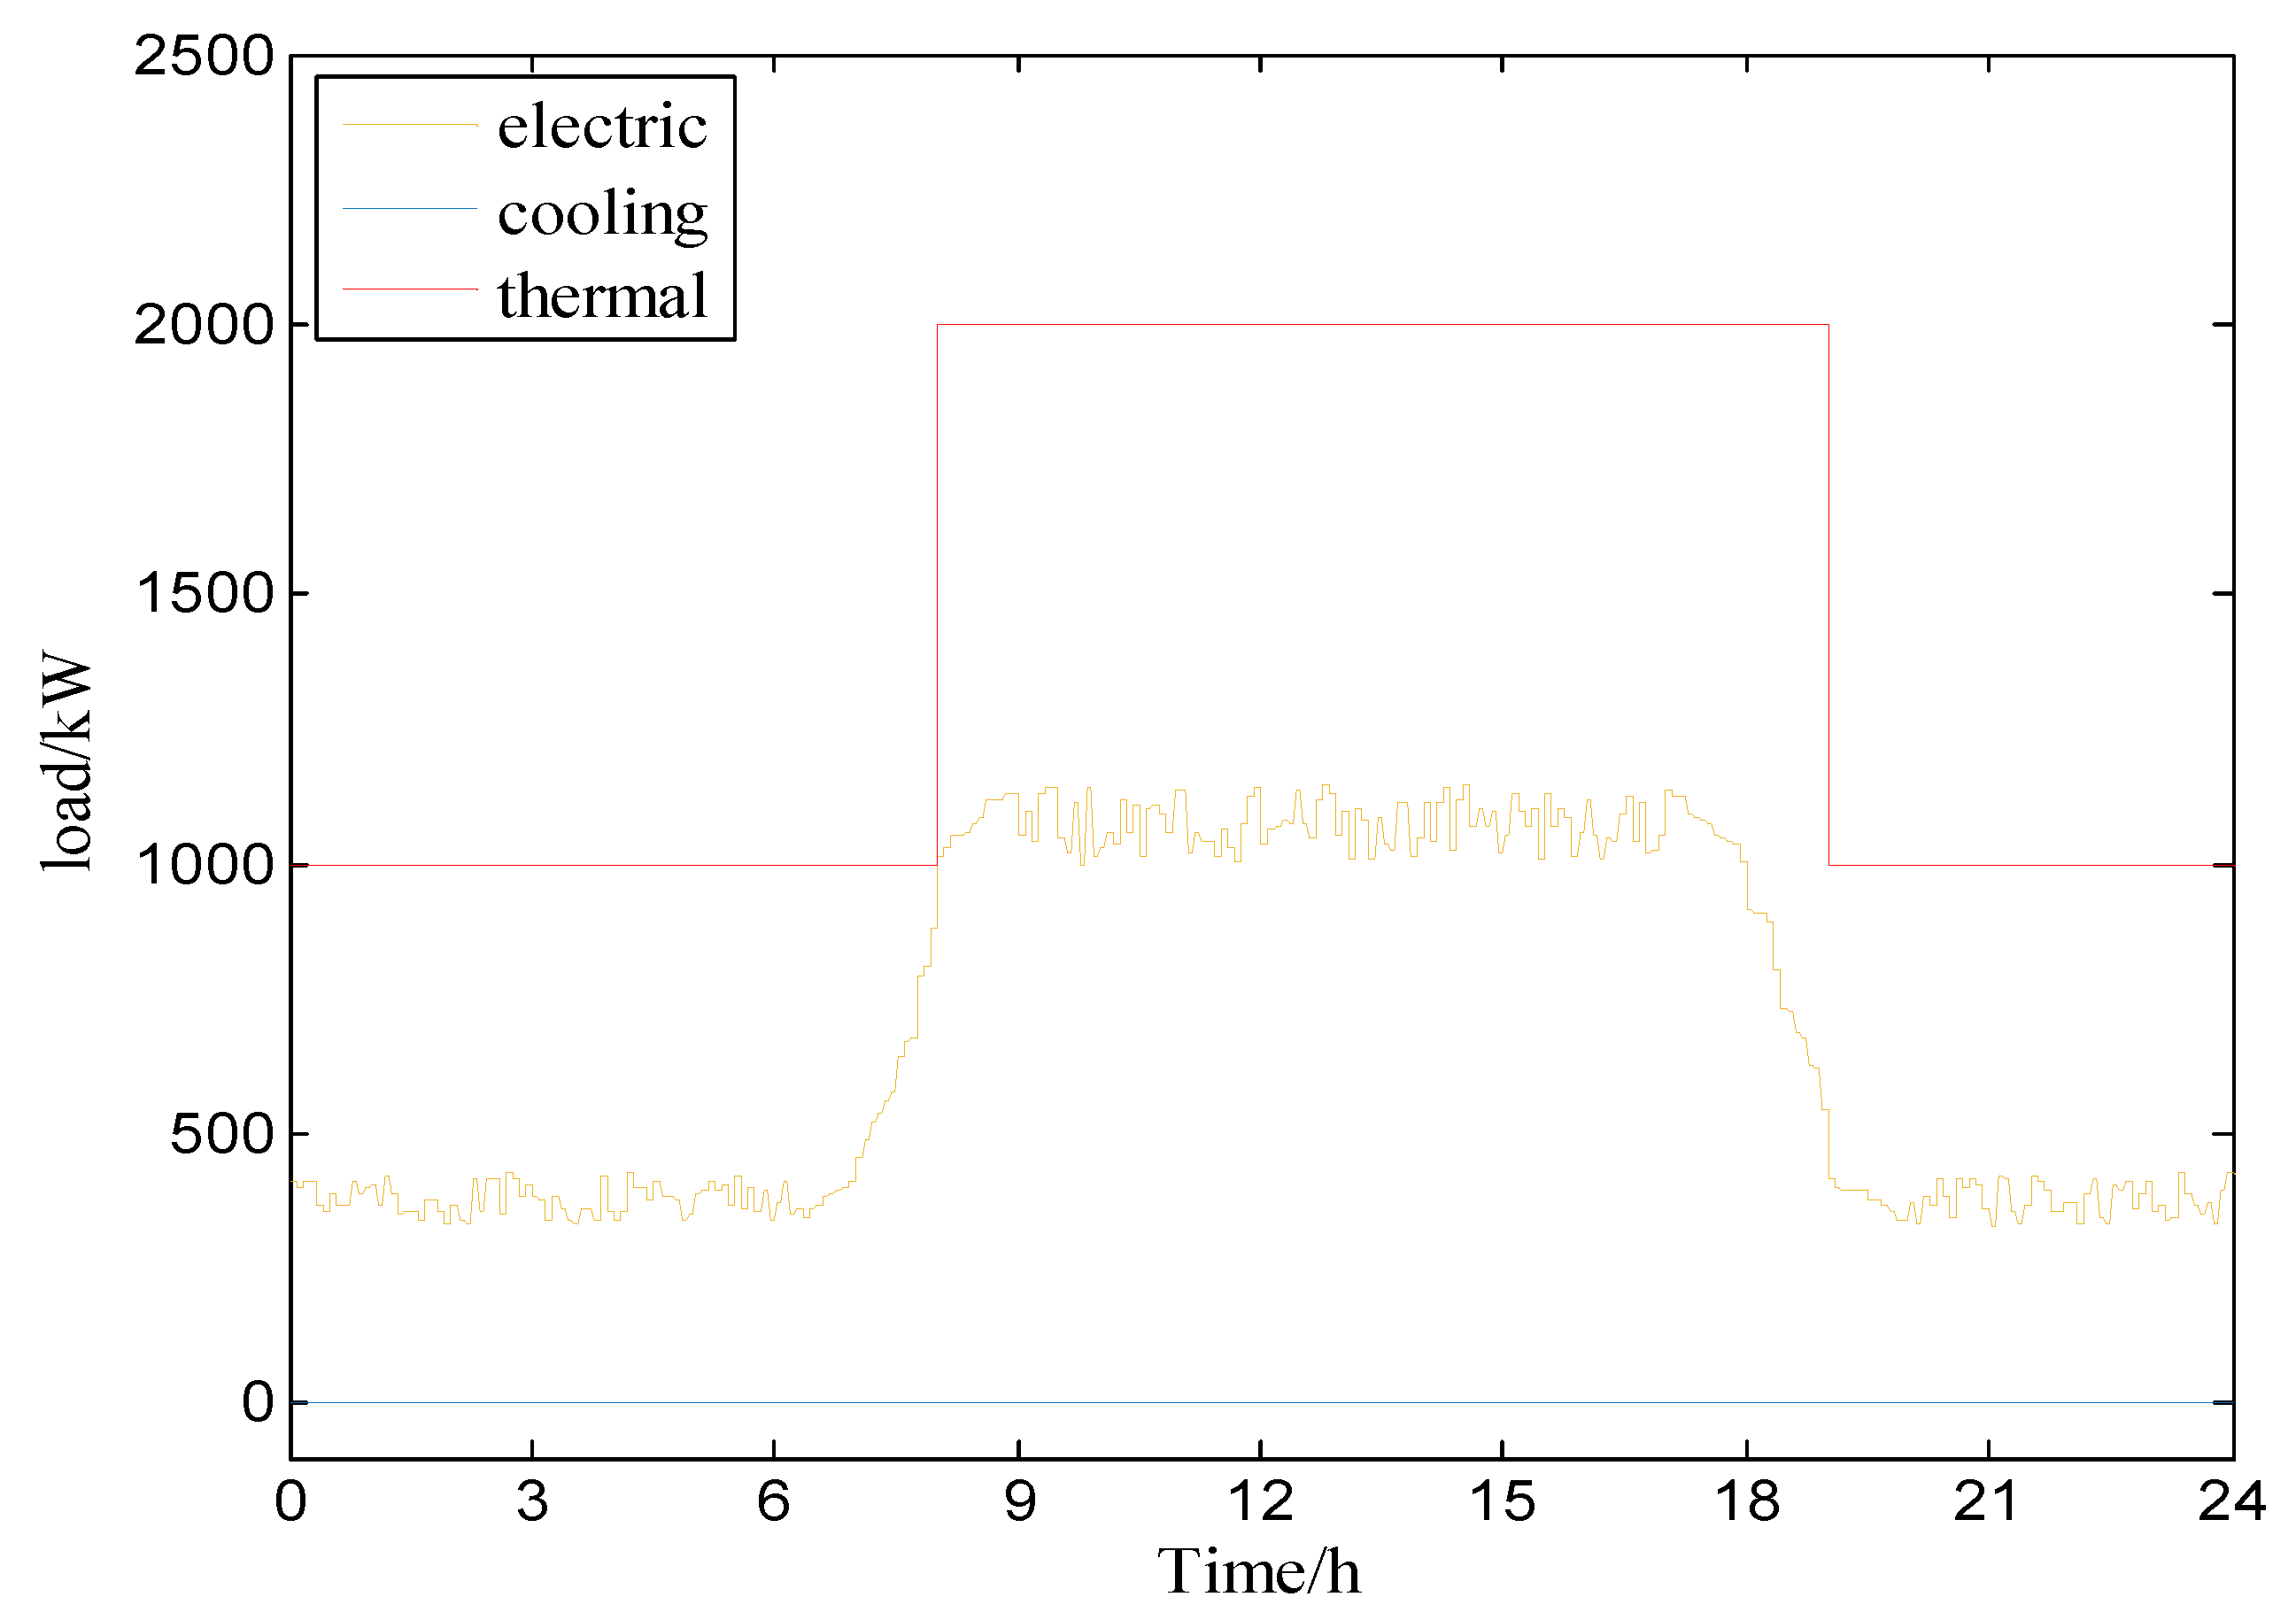
This paper selects 1440 data points from a certain day in the regional integrated energy demonstration project for analysis. According to the actual design data of the project, the heating index is 59 W/m2; the predicted power of the electric/heat load is shown in Figure 3. The regional integrated energy systems include WT, PV, CHP and BESS, and their capacities are shown in Table 1, and the electric-to- thermal ratio of CHP is 1. Other parameters are as follows
Natural gas price and electricity price have a large impact on the operating costs of regional integrated energy systems. In this paper, we set the natural gas price to a fixed price based on actual conditions. The buying electricity price and the selling electricity price are different in the trough period, stationary and peak period. The specific price is shown in Table 2. Since most of the data were expressed in RMB this paper, and figures are based on these data, the conversion relationship with Yuan (i.e., 0.144 USD) is added, which is based on the exchange rate on 22 October 2018.
In addition, in order to ensure the reliability of the system power, BESS is used as a backup power source in this RIES, and its capacity is 300 kwh. The number of batteries in series is 222, so that the voltage range of the transformer can be satisfied, and the number of parallel connection is 3. The main parameters of the lithium battery are shown in Table 3. Among them, DOD is depth of discharge. If the power generation of WT, PV, and CHP is more than the load of the user, the BESS is charged. If the power generation of WT, PV, and CHP is less than the user load, the BESS is discharged.
Under the different operating conditions, the parameters of the GT are shown in Table 4.
The pollutant emissions that generate environmental costs are SO2, NOx, etc., and the environmental costs are shown in Table 5.
5.2. Operation Optimization
5.2.1. Scenario Analysis
In order to study the impact of BESS as a backup power source on the operating costs of RIESs in different scenarios, three scenarios were established in this paper, as described below:
Scenario 1: When the SOC of BESS is 30%, it cannot be discharged and can only be charged. In other words, the remaining electricity of the 30% BESS is used as a backup power source. This 30% of the electricity can meet the fire emergency and user lighting load requirements of the RIES.
Scenario 2: When the SOC of BESS is 50%, it cannot be discharged and can only be charged. In other words, the remaining electricity of the 50% BESS is used as a backup power source. This 50% of the electricity can meet the normal life load requirements of users of the RIES.
Scenario 3: When the SOC of BESS is 70%, it cannot be discharged and can only be charged. In other words, the remaining electricity of the 70% BESS is used as a backup power source. This 70% of the electricity can meet the comfortable life load requirements of users of the RIES.
5.2.2. Algorithm Optimization Result
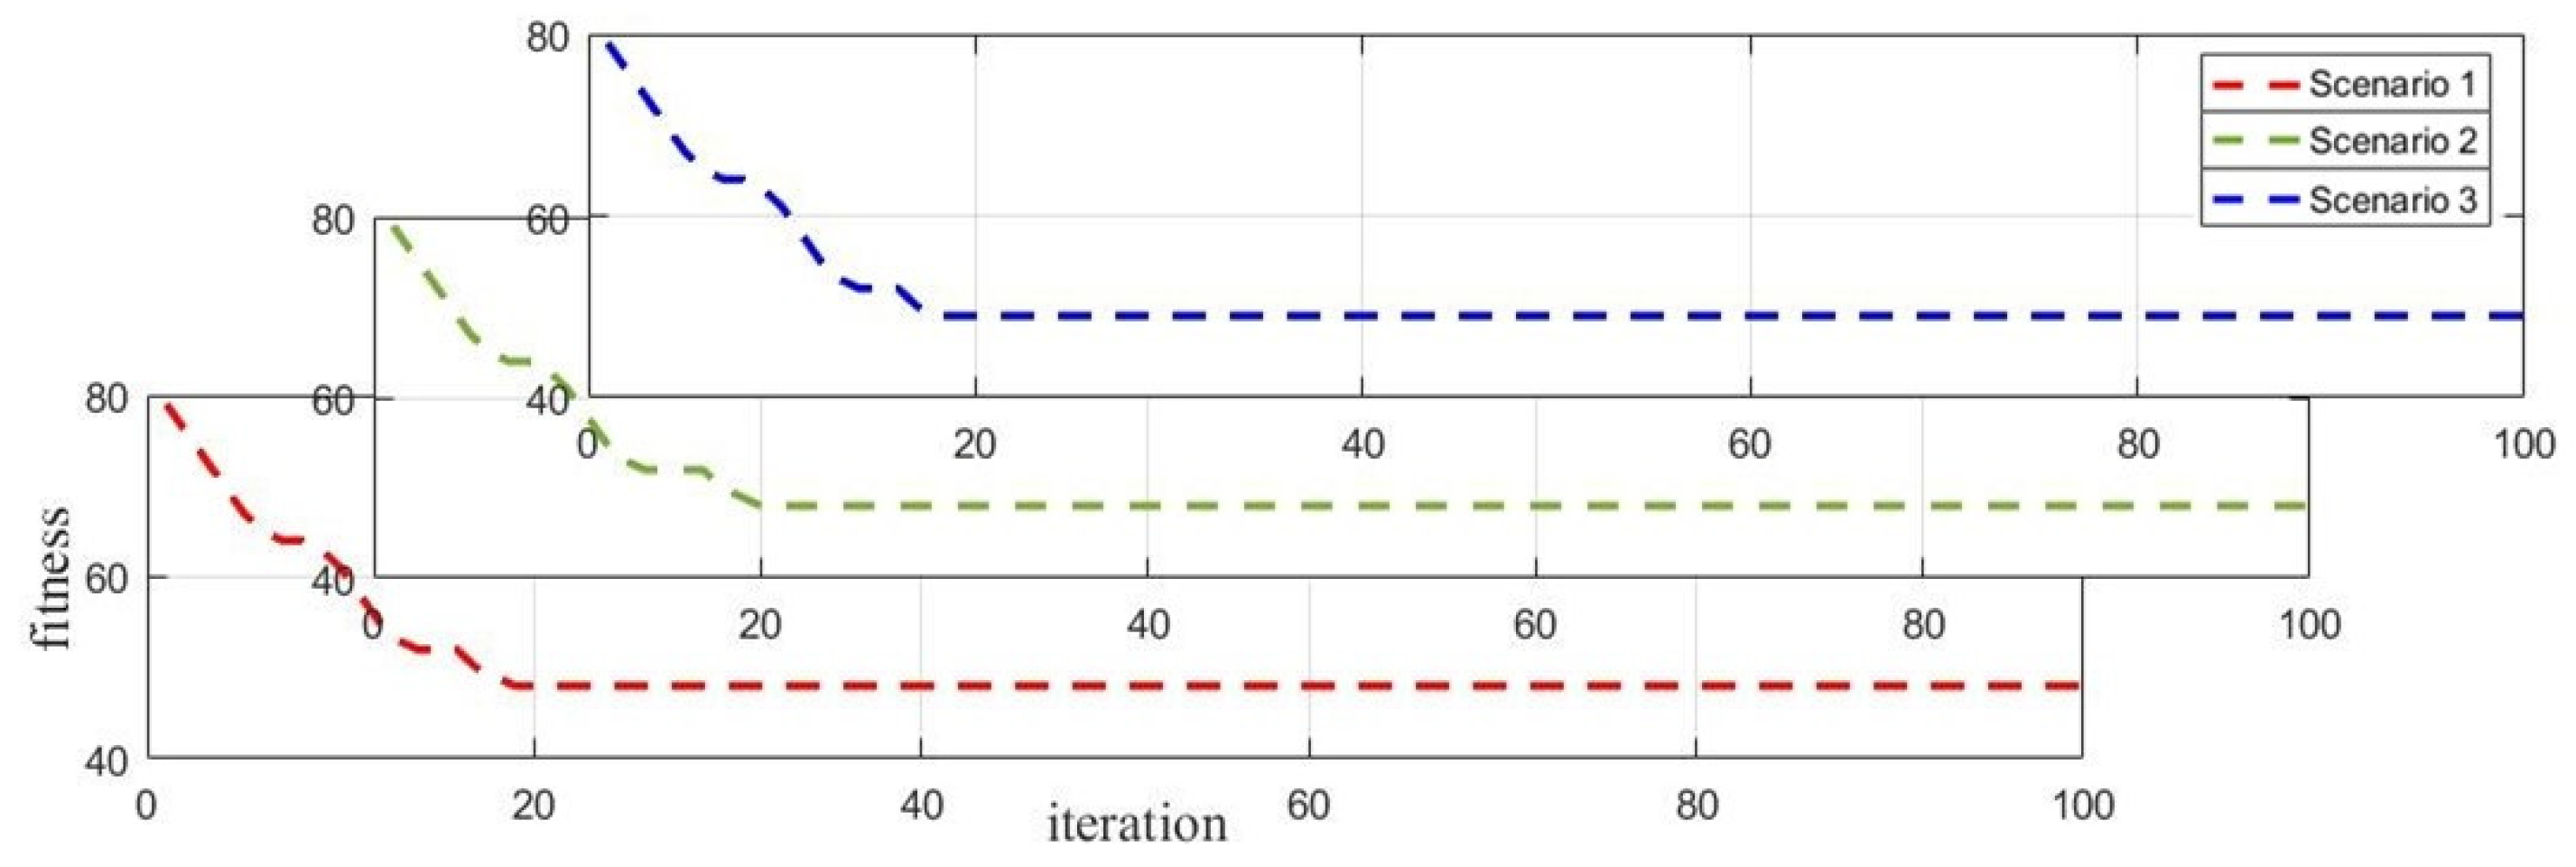
In the RIES we considered, the optimization period is set to 1440 min, and T is 5 min. The maximum number of flames, N, is 200, the size of the moth population, n, is 200, and the maximum number of iterations, M, is 100. We recorded the fitness curve under different conditions, and the result is shown in Figure 4.
From Figure 4, we can observe that when the algorithm runs in Scenario 1, it does not converge until about 20 iterations. The total calculation time is about 12.15 s, and the optimal solution calculation time is 2.94 s. Similar trends can be seen in the other two scenarios.
5.2.3. The Results of Optimization
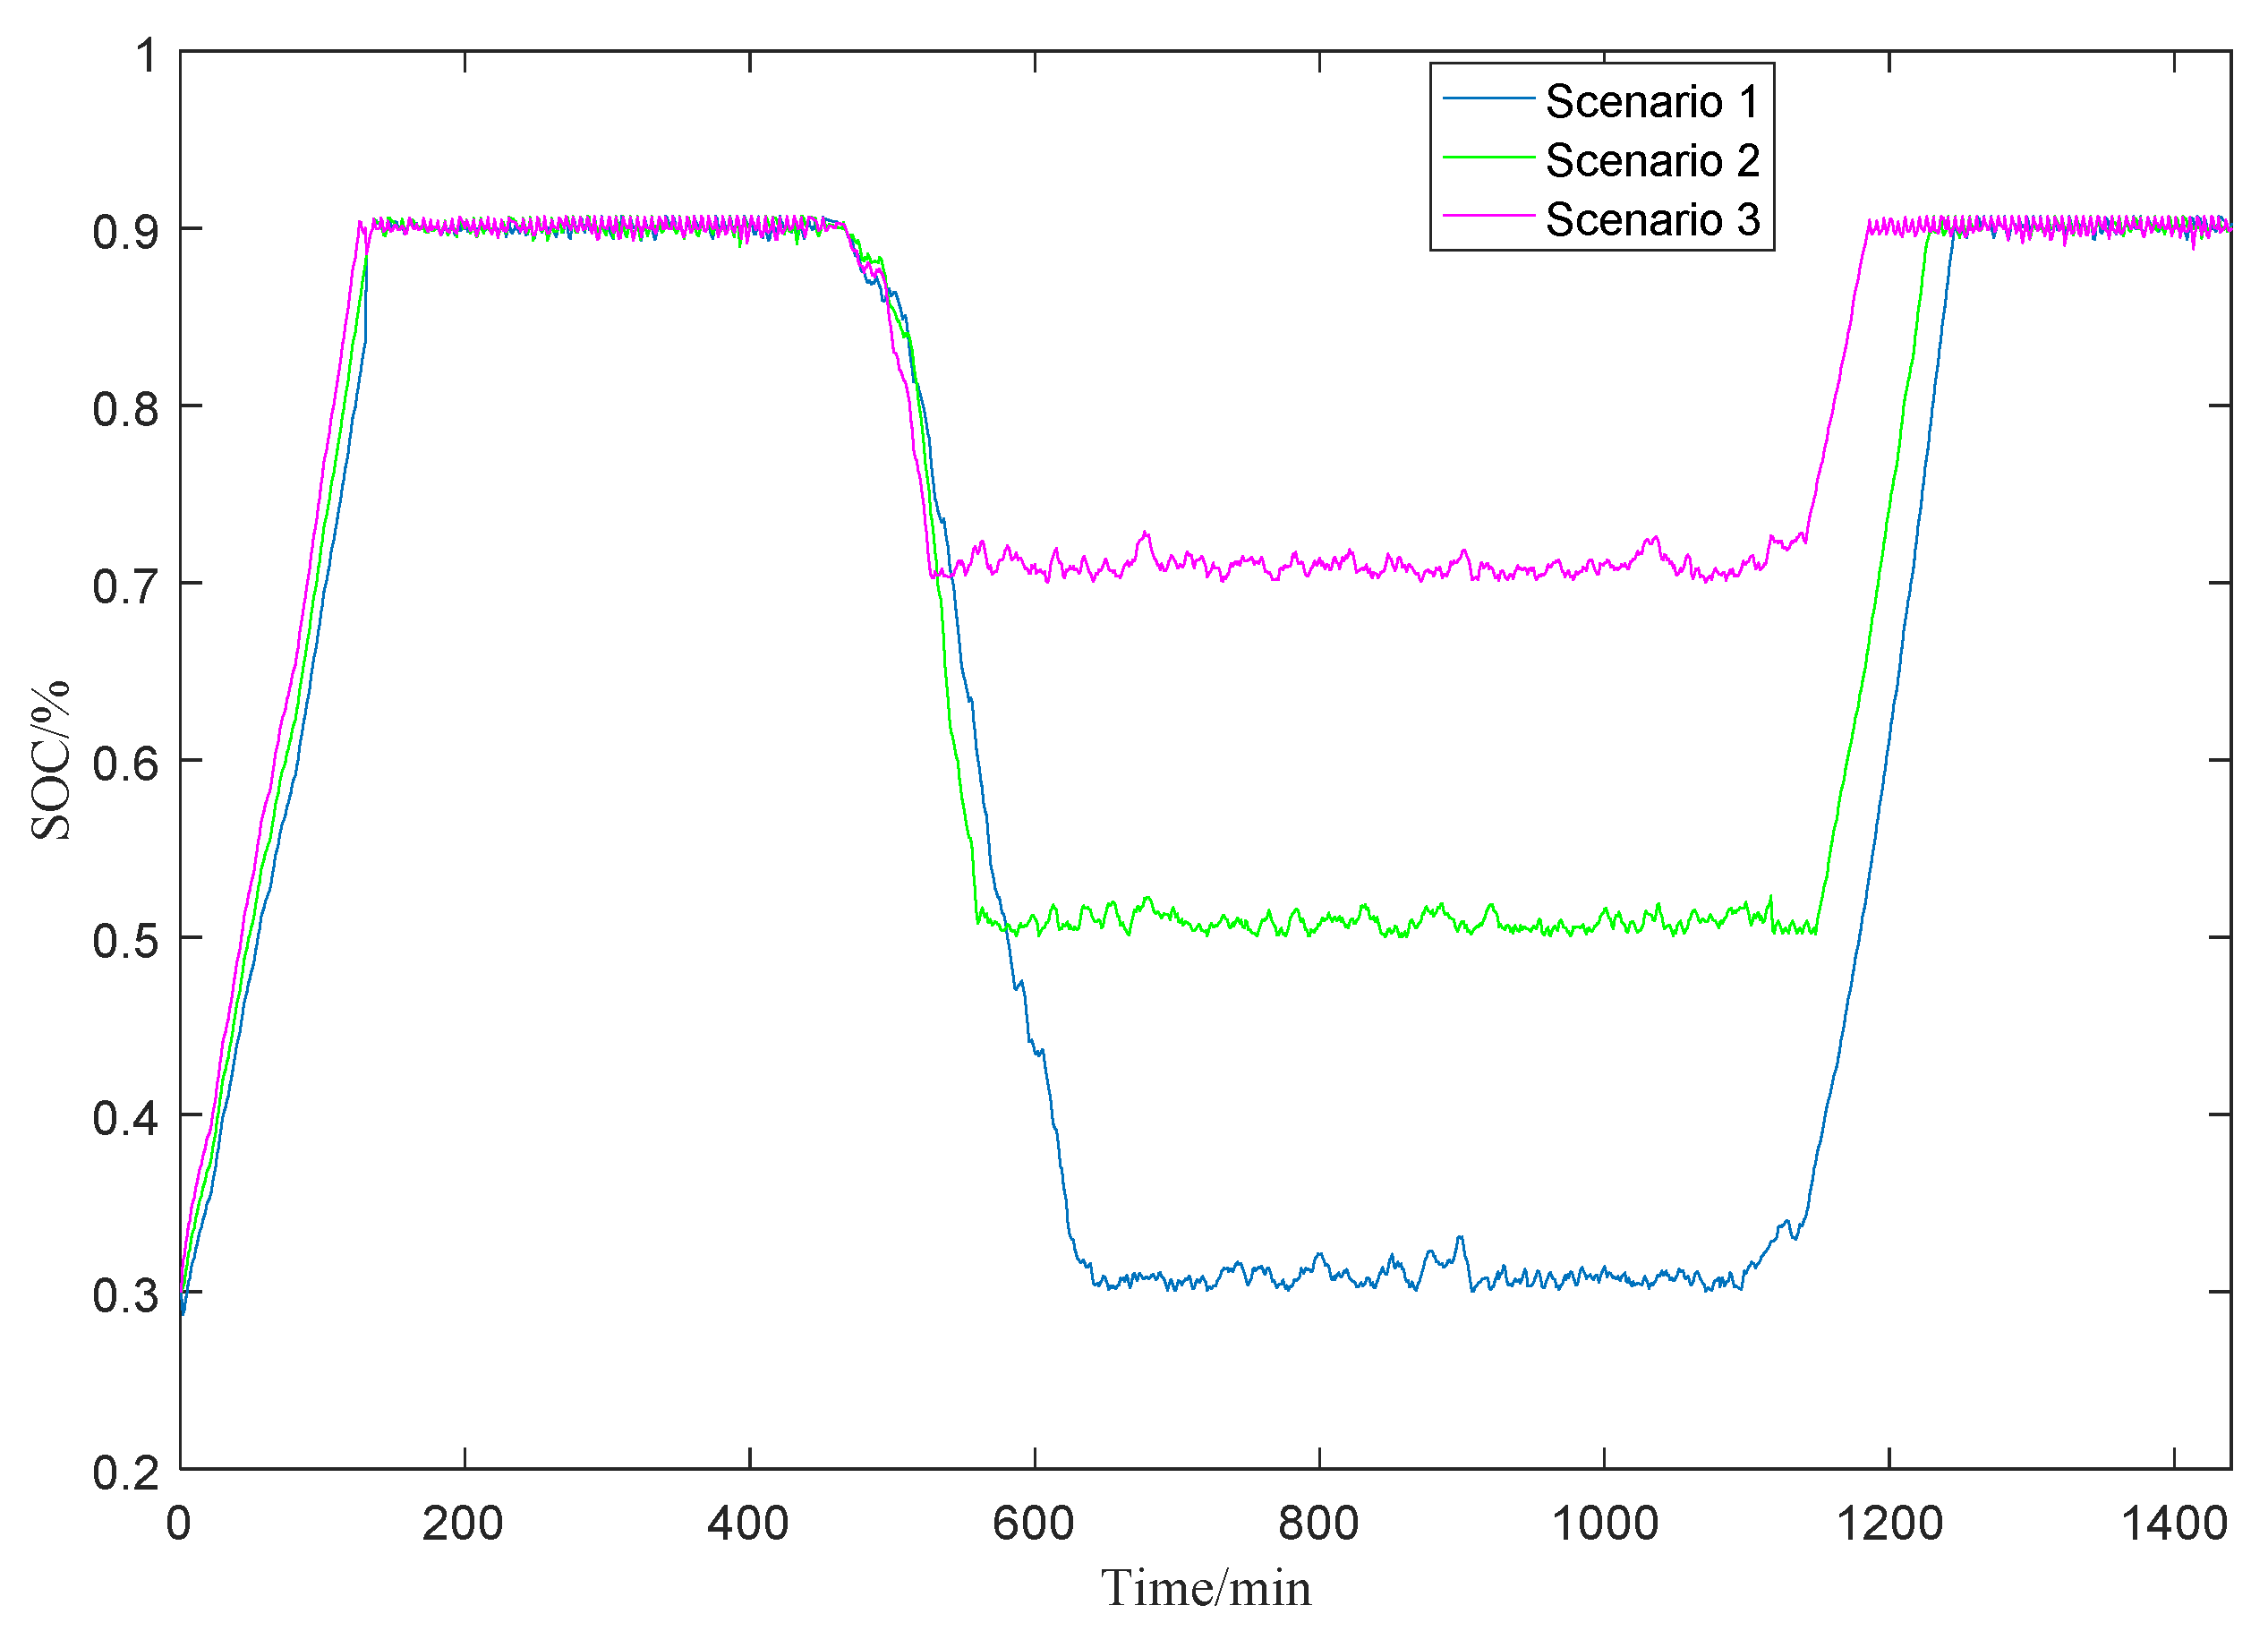
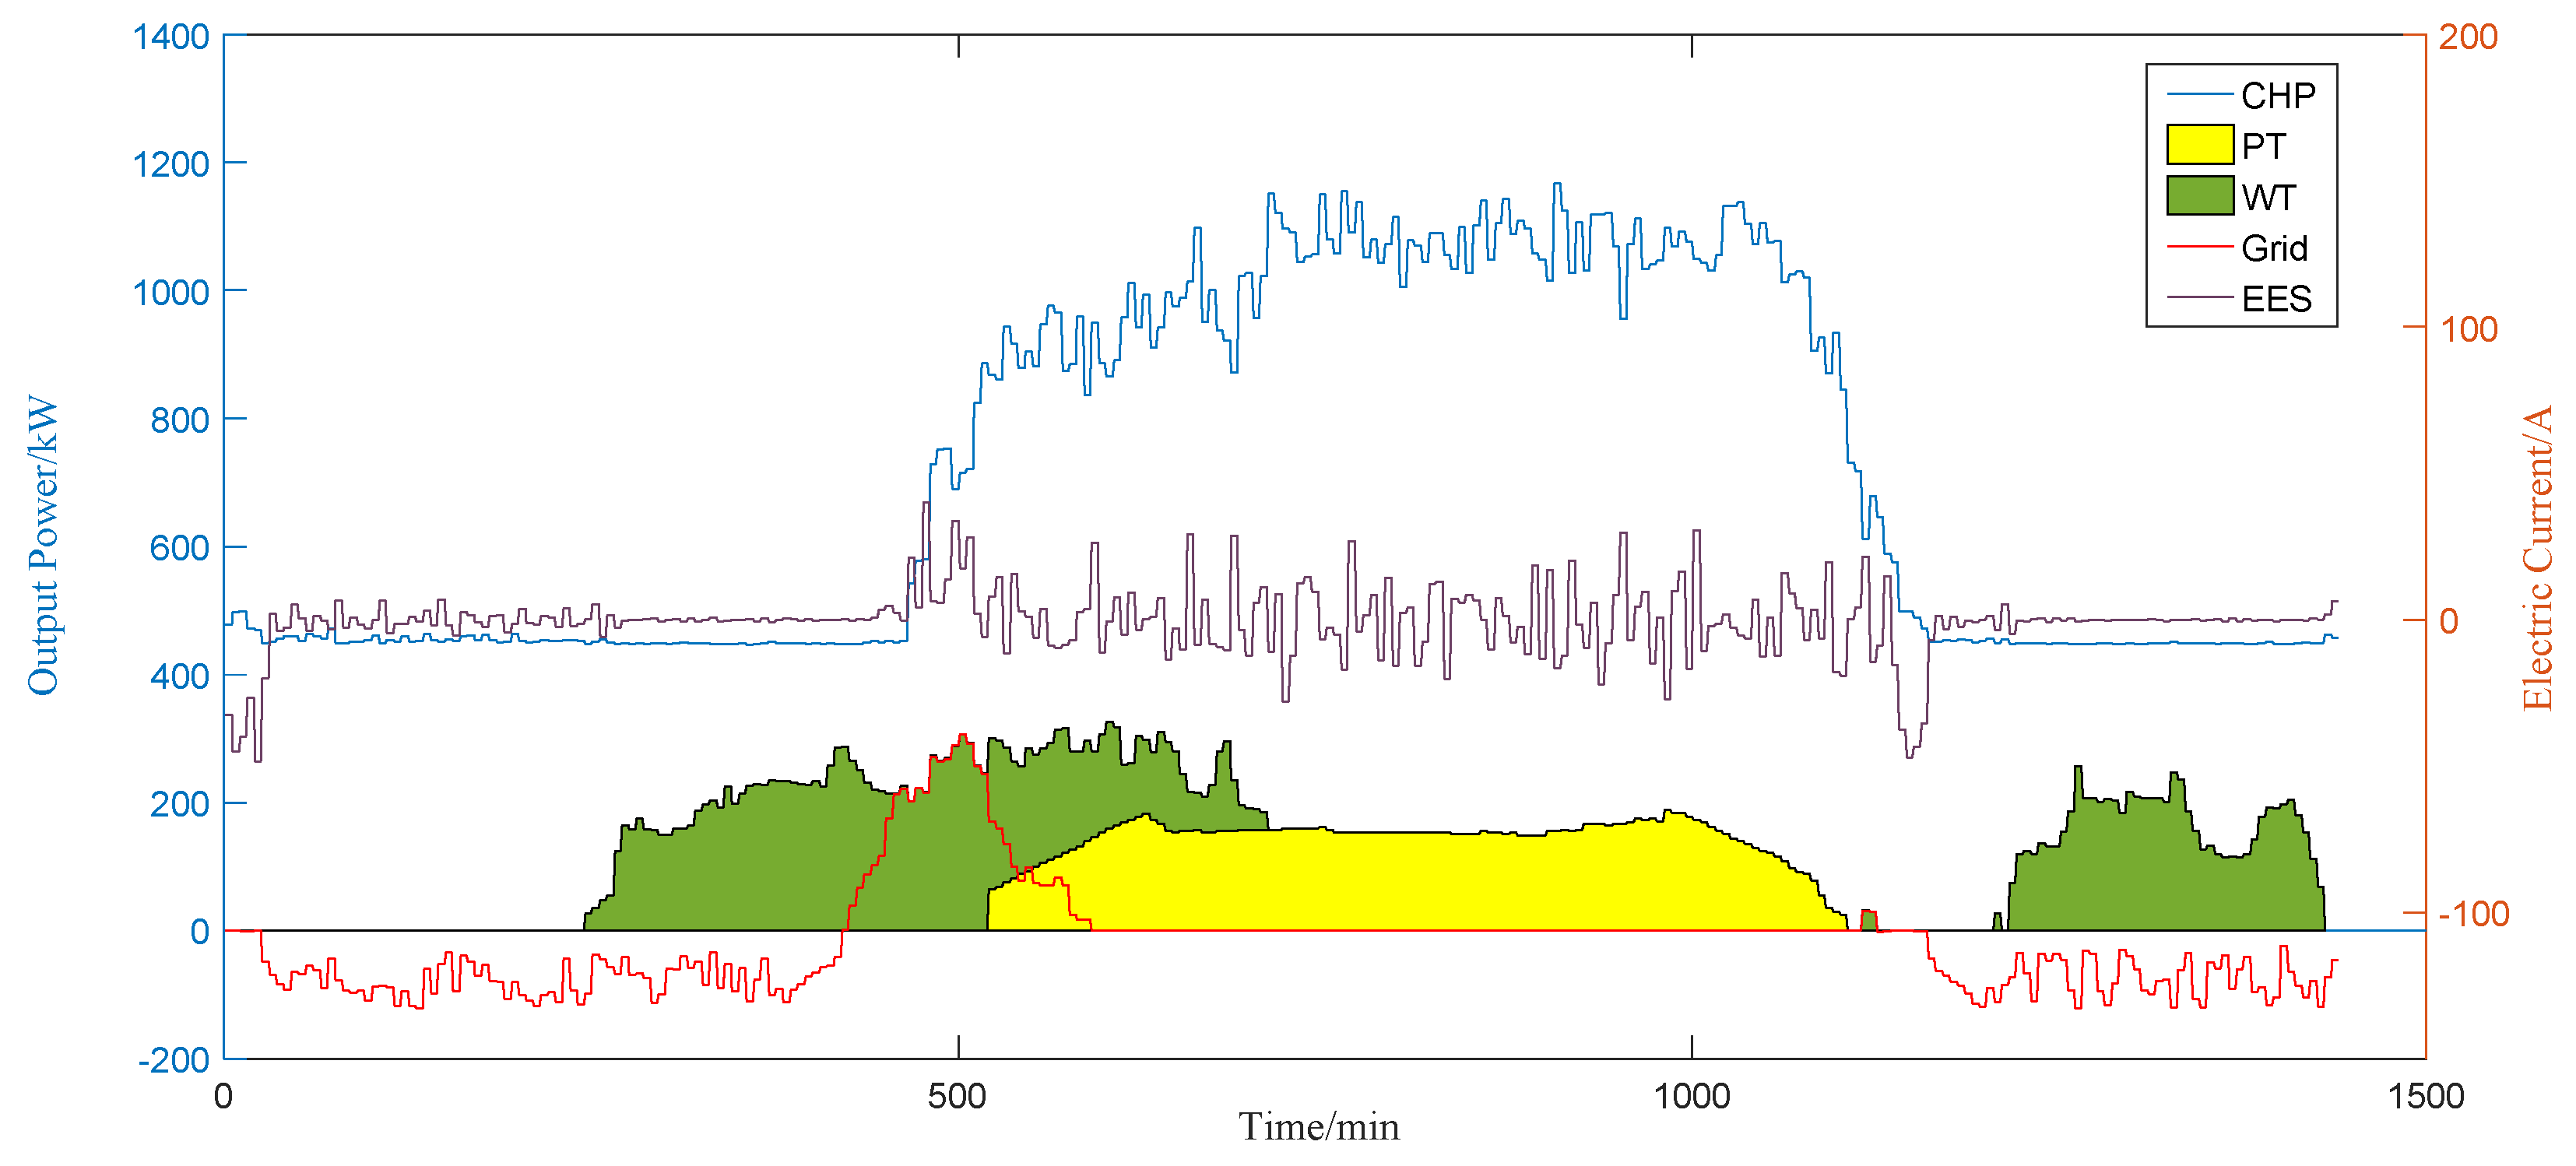
According to the three scenarios set in the previous section, we select the load data of one day in the RIES to optimize, and then analyze the operation of the system under different operating conditions. Figure 5 shows the SOC curve of BESS in three different scenarios, and Figure 6, Figure 7 and Figure 8 show the optimization results in different scenarios.
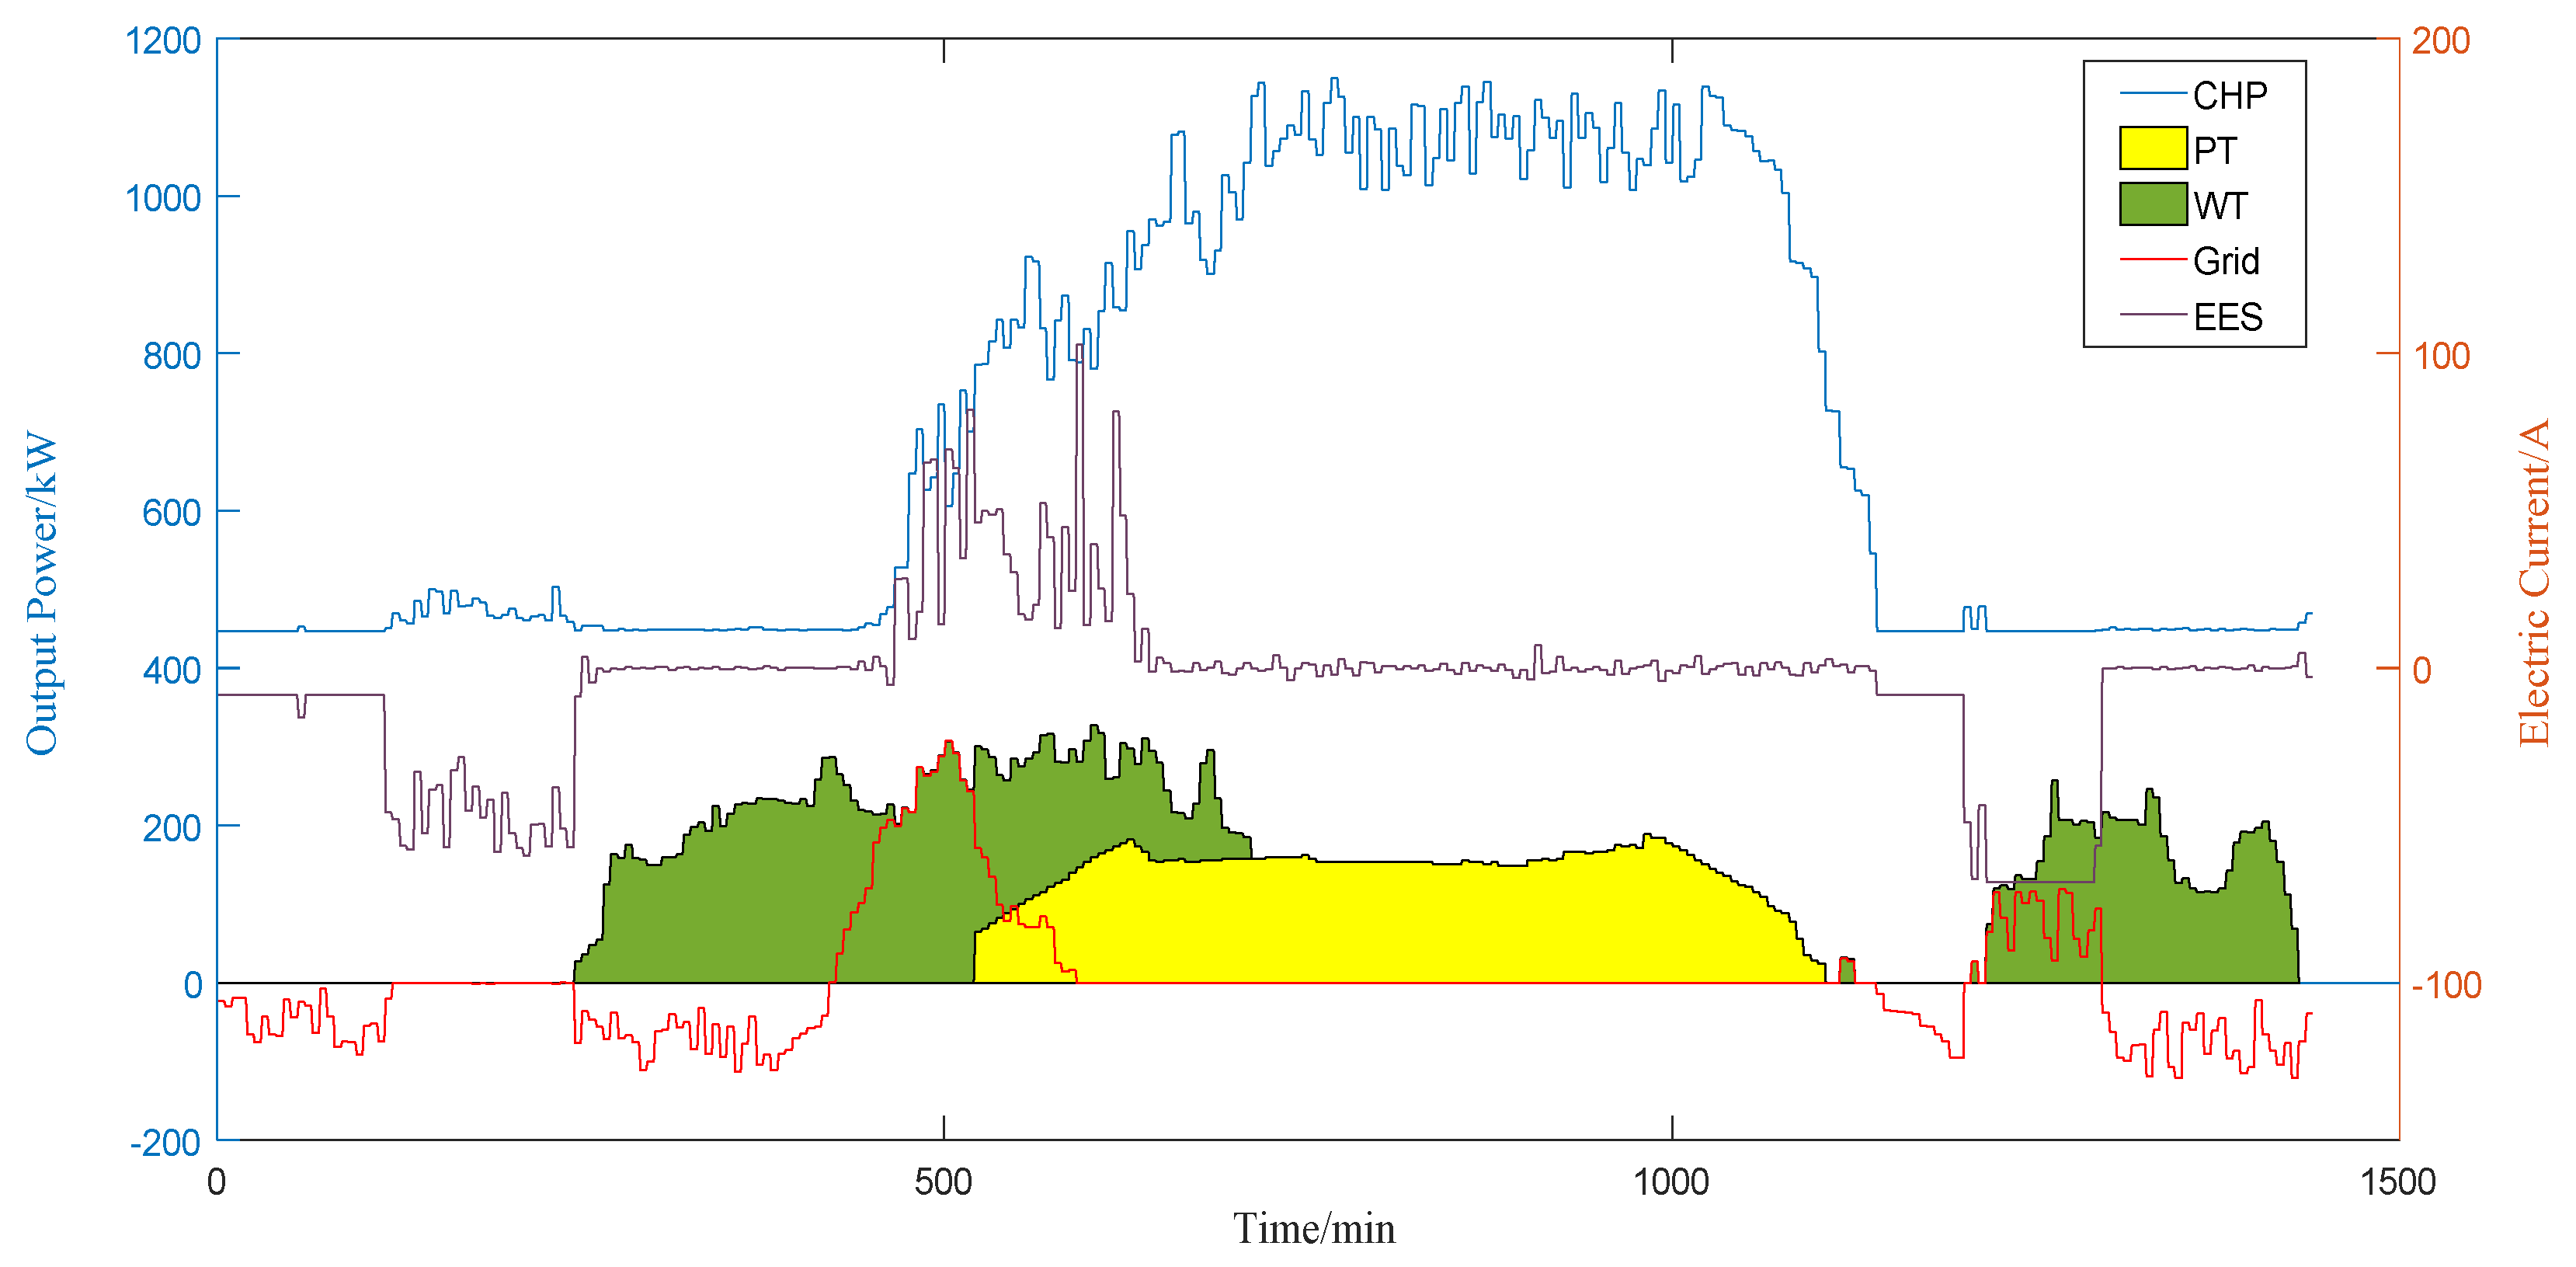
The output results of the different units in Scenario 1 are shown in Figure 6. When the remaining electricity of the 30% BESS is used as a backup power source, the BESS is charged when the system is in a low power-demand period, and is discharged during a high power-demand period. The maximum charging current is 106.73 A. As shown, the power of CHP is determined by heat; thus, it reached the maximum value at noon, and kept low power operation at night. The grid is used to ensure the active power balance of the system. The maximum and minimum power of the grid are 287.84 kW and −166.87 kW. When other micro-source load outputs cannot meet the output load requirement, electricity is purchased from the grid.
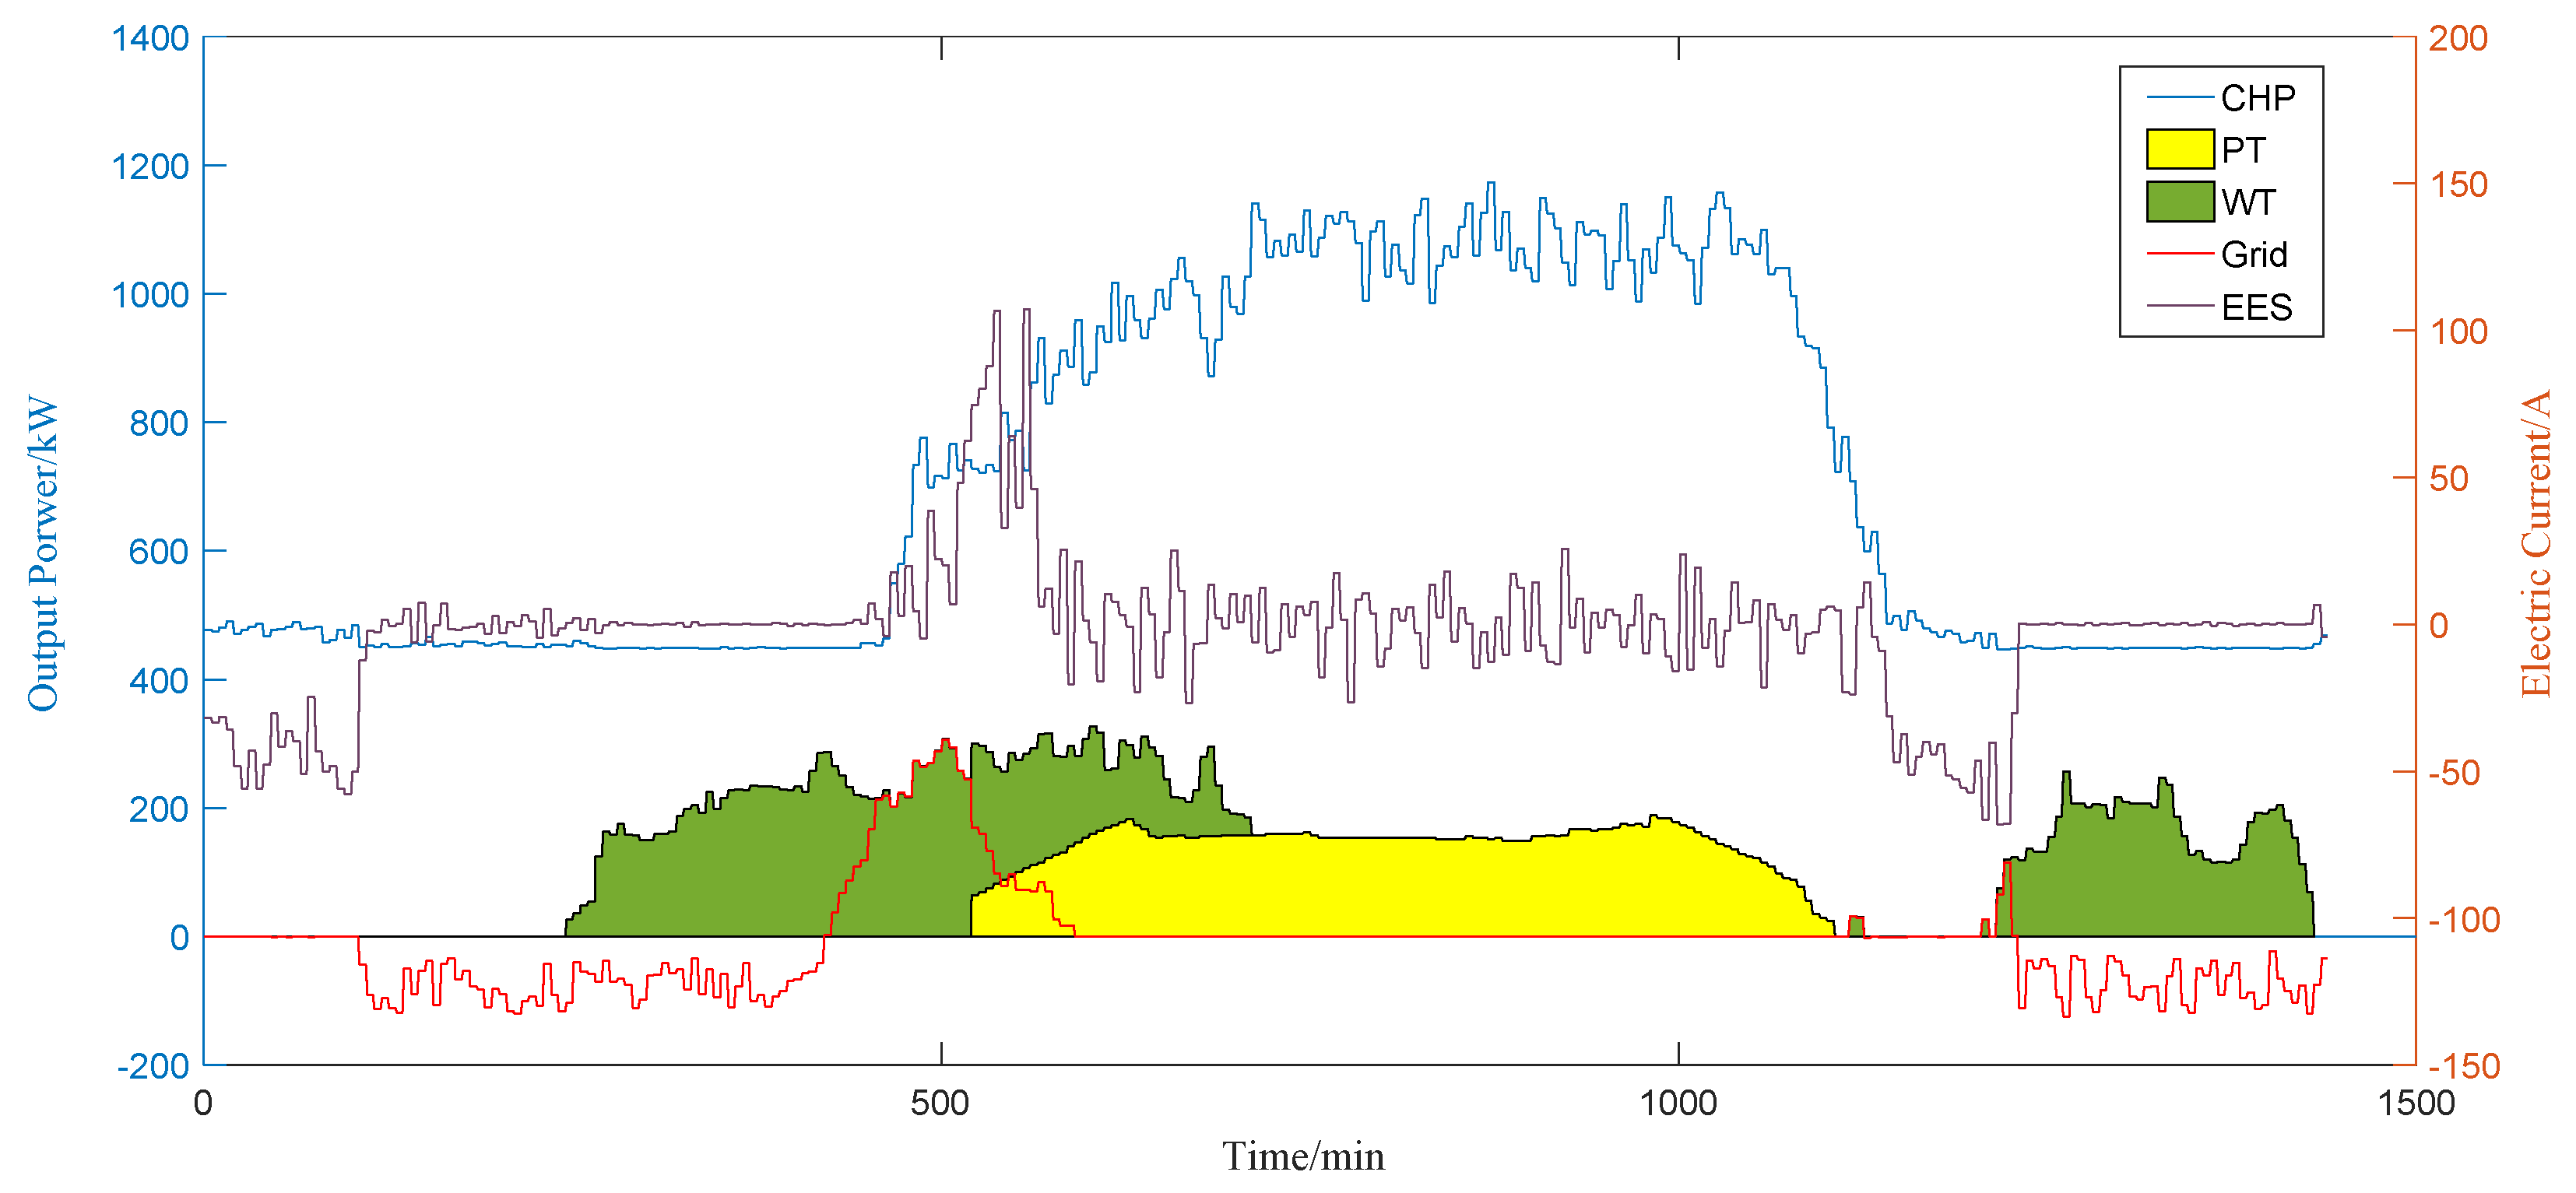
The output results of the different units in Scenario 2 are shown in Figure 7. When the remaining electricity of the 50% BESS is used as a backup power source, the depth of charge and discharge and storage current of the BESS change more significantly than scenario 1. The maximum charging current is 117.52 A. Since the CHP adopts the operation strategy of power determined by heat, the output curve has little difference from Scenario 1, and the maximum power is 1163.77 kW. The photovoltaic power is all output. As in scenario 1, PV and WT power are all output.
The output results of the different units in Scenario 3 are shown in Figure 8. When the remaining electricity of the 70% BESS is used as a backup power source, the depth of charge and discharge and storage current of the BESS are not as obvious as in Scenario 1 and Scenario 2. The maximum charging current is 43.56 A. At this time, CHP, WT and PV as significant power sources supply-side in the RIES must meet the electrical and thermal load requirements. Since the CHP adopts the operation strategy of power determined by heat, the output curve has little difference from Scenario 1 and Scenario 2.
5.2.4. Optimization Result Analysis
Based on the optimization results of the three scenarios and objective functions, we obtain the running cost components of the RIES, which are the power generation costs and environmental costs. The operating and maintenance costs of the generator set and the cost of the fuel constitute the cost of power generation. The environmental costs here are mainly caused by pollutants generated during power generation. Because WT, PV and BESS are all clean power supplies, the pollutant emissions here are mainly produced by NG, which is the fuel of CHP. Table 6 shows the system cost structure under different operating conditions. The RIES operating costs in the three scenarios are shown in Table 6.
According to Table 6 and the optimization result, in Scenario 1, the storage and discharge space of the BESS is larger, which increases the cost of purchasing electricity. However, in addition to CHP, WT, and PV as important power sources, 60% of the BESS that can be charged and discharged also plays the role of a power source, and so the cost of CHP is reduced, and the environmental cost of response is relatively low. In Scenario 3, the BESS charging and discharging space is relatively small. At this time, CHP as an important power source in the system increases the output, the cost increases, and the environmental cost of response increases. In an RIES with WT, PV, BESS and CHP, the operating costs are mainly from the operating and maintenance costs and fuel costs of the system.
In the same three scenarios, when the DG is used as a backup power source, the operating costs in the RIES are shown in Table 7. The capacity of the diesel generator here is 1000 kW, and the environmental cost here is jointly produced by CHP and DG.
The cost of DG includes fuel costs, environmental costs and other costs. The fuel cost of DG is calculated in the fuel cost of the system. Similarly, the environmental cost of DG is included in the environmental cost of the system. The cost of DG, shown in Table 7, only represents the other costs of DG. The other costs of DG involve maintenance costs, labor costs, management fees, the building costs of devices and so on. Considering the complexity of DG’s other costs, the other costs are expressed by the cost per unit power.
It can be seen from Table 7 that, in the three scenarios, when the DG is the backup power source, the operating cost of the RIES is higher than that of the BESS as the backup power source, and the generated pollutant emissions are also large. Figure 9 shows the composition of the system cost when BESS and DG are used as backup power sources in different scenarios.
The three figures in the first row are the system cost components of the three scenarios when the BESS is used as the backup power source, and the three graphs in the second row are the system cost components of the three scenarios when the DG is used as the backup power source. Regardless of whether the BESS is used as a backup power source or the DG is used as a backup power source, the proportions of the components that make up the RIES operating cost in the three scenarios are different. However, in both cases, the operating cost of CHP accounts for more than 80% of the total system cost in all three scenarios, which directly determines the operating effect of the RIES. The direct cause of this result is that NG prices fluctuate greatly with the market, while Chinese industrial NG prices are higher. When BESS is the backup power supply, the environmental cost is 2.80–3.18% of the operating cost of the system. However, when DG is the backup power source, the environmental cost increases significantly, accounting for 3.72–4.26% of the system operating cost. In addition, DG has a larger proportion than BESS. Therefore, the use of BESS instead of DG as a backup power source in the RIES is a worthwhile option.
5.2.5. Sensitivity Analysis of Energy Prices
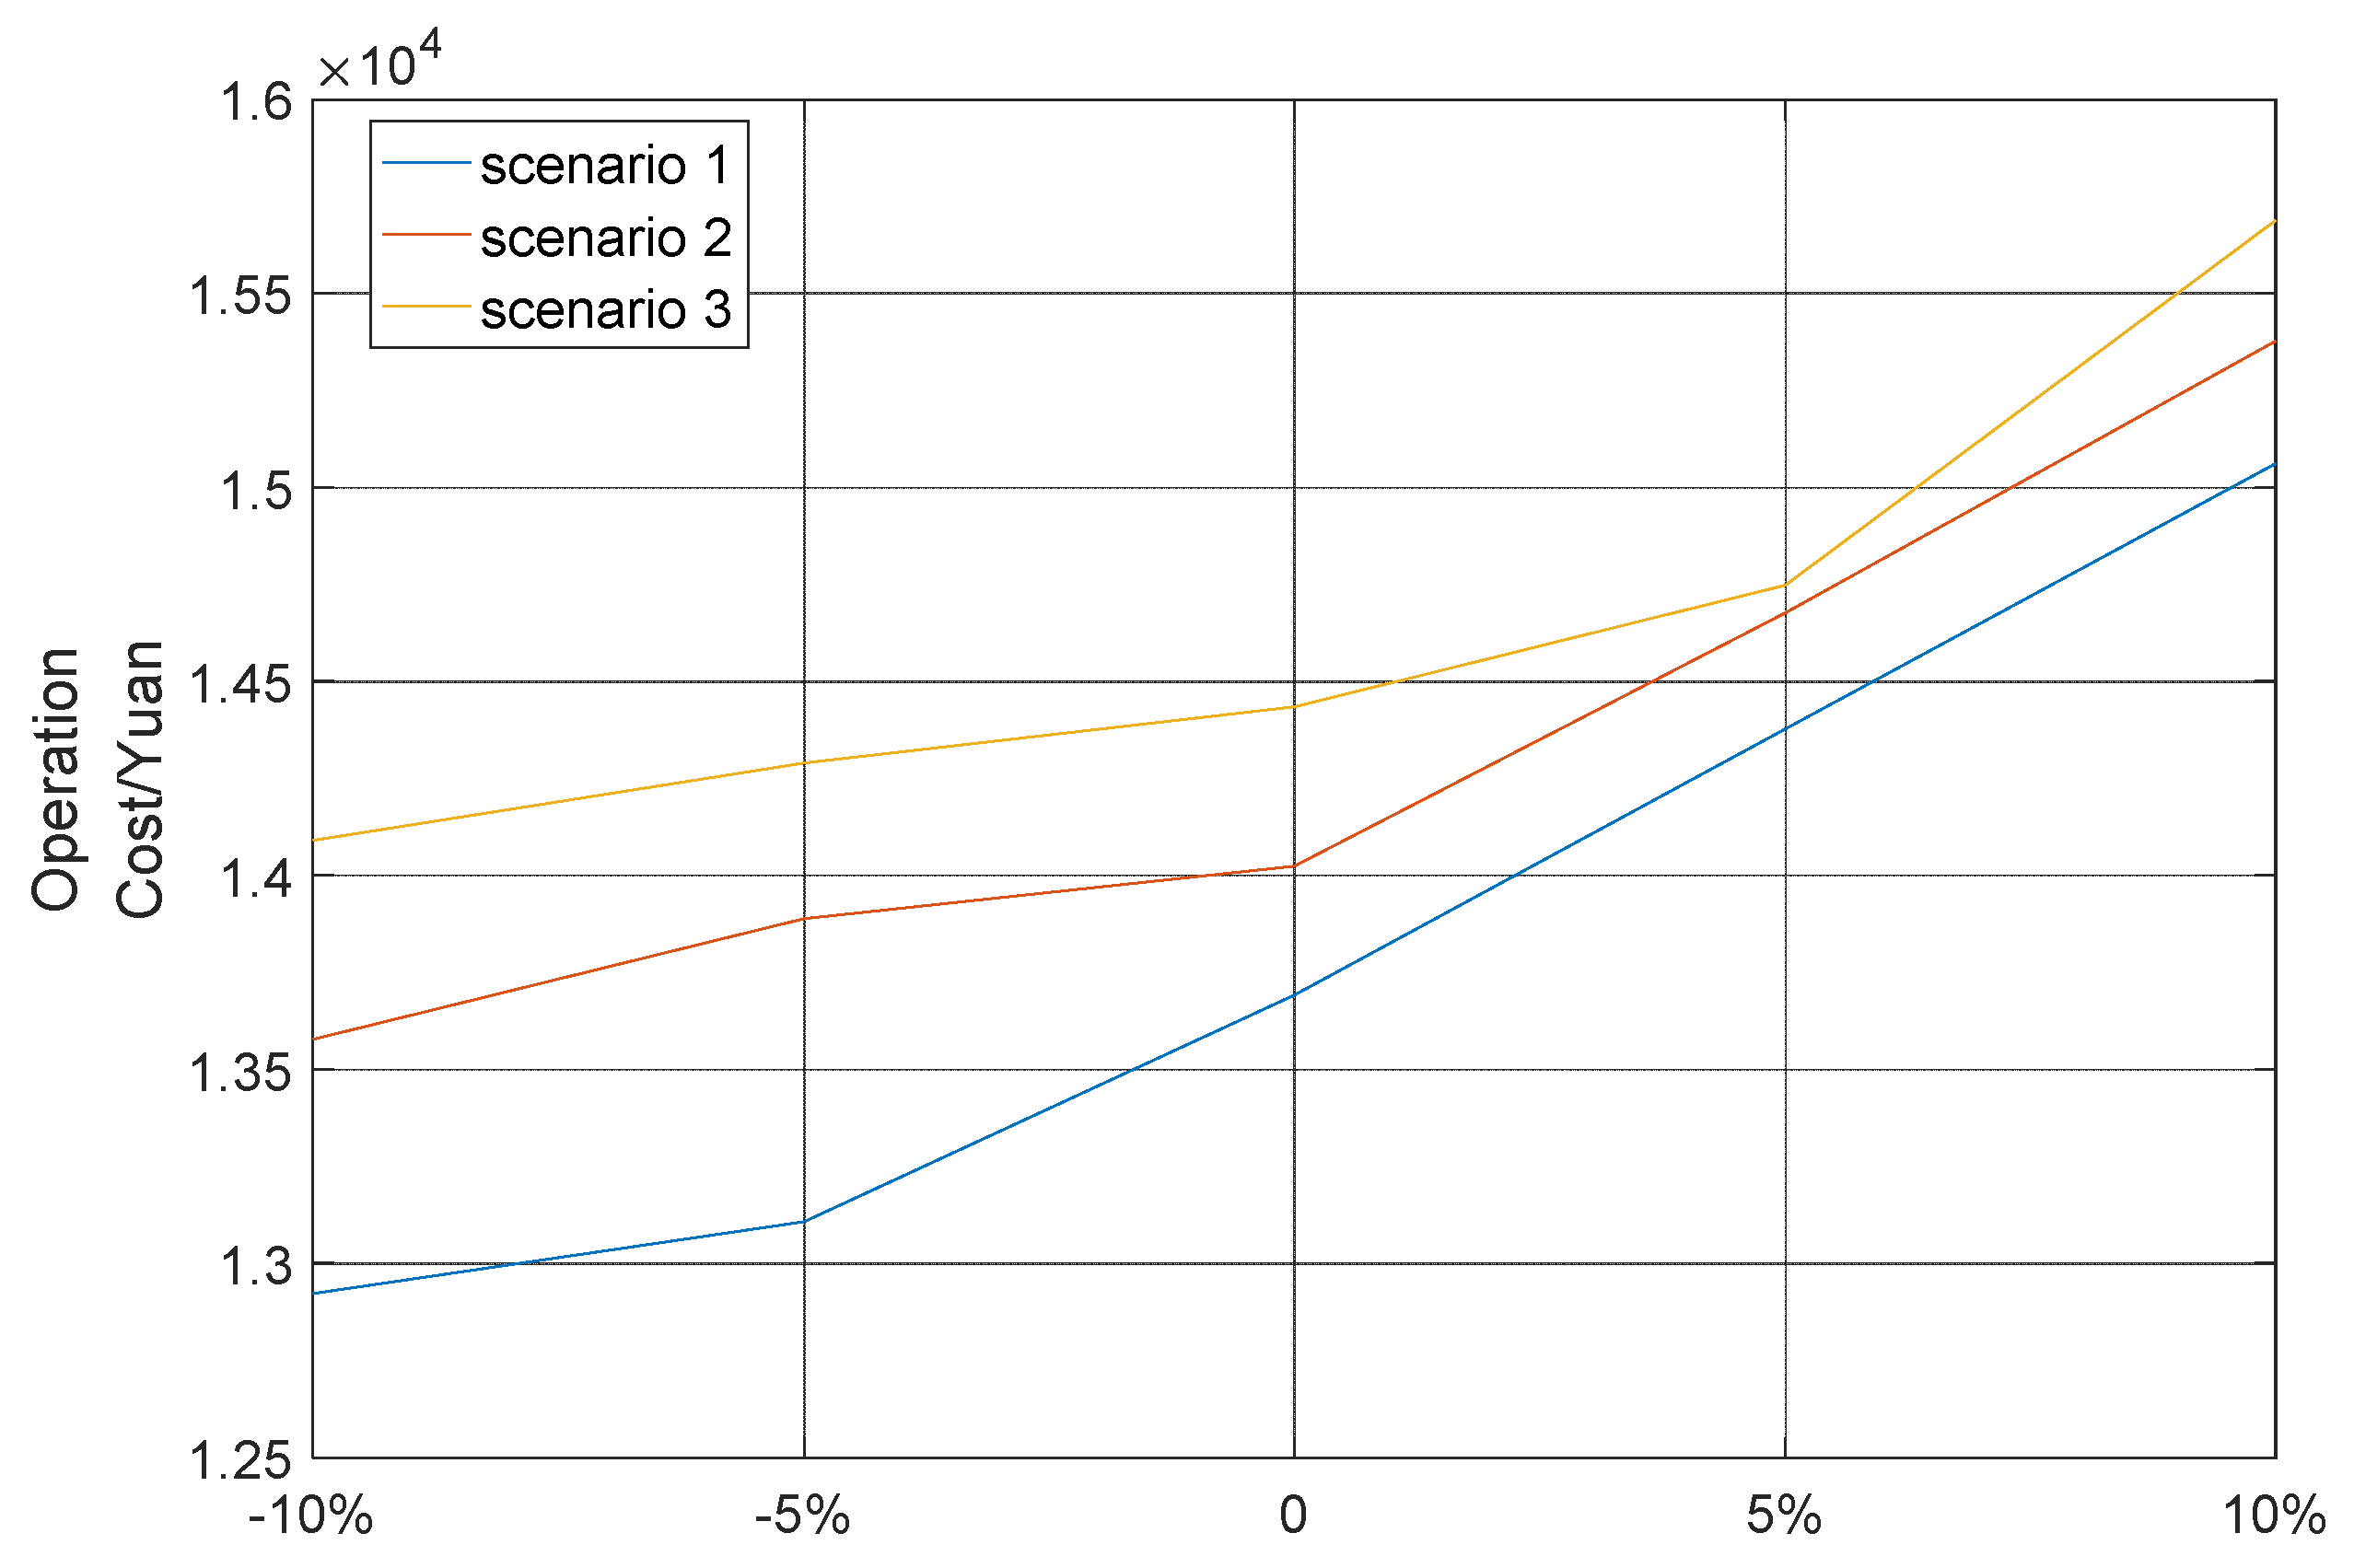
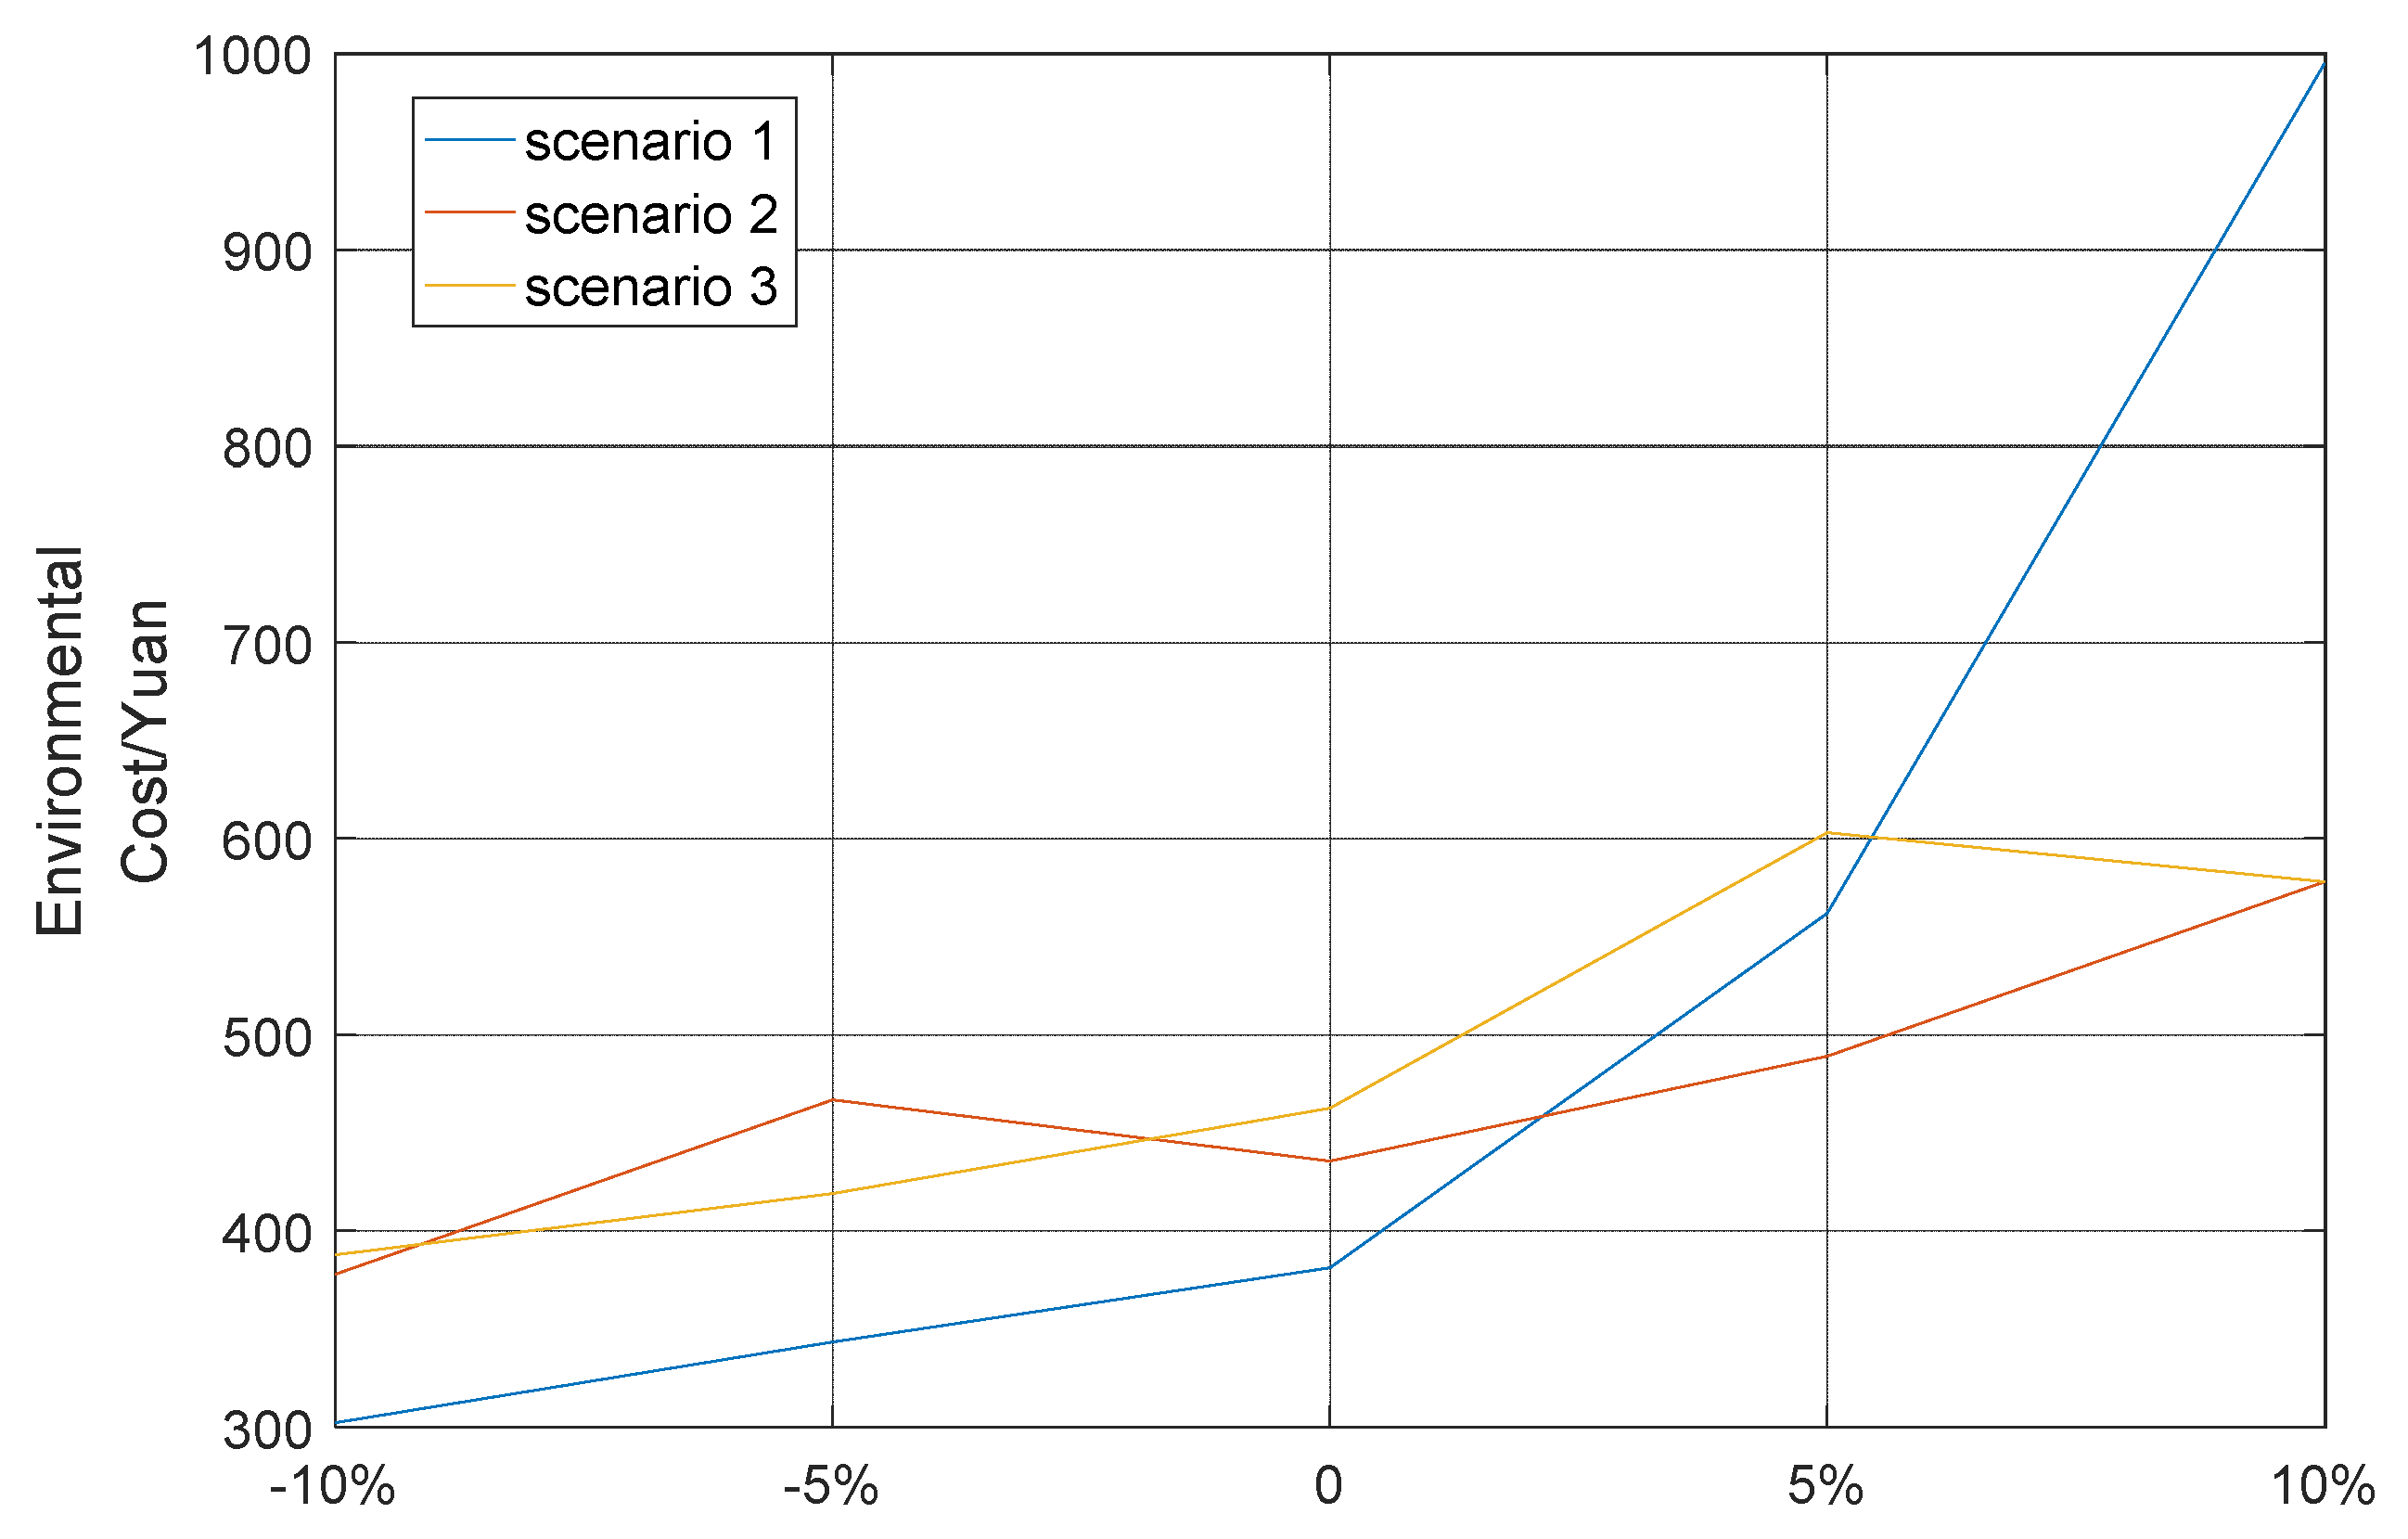
In order to further analyze the influence of parameter changes on the scenarios proposed in this paper, the sensitivity analysis of energy price change ratio is carried out in this section. This section appropriately adjusts the change ratio of electricity price to study the effect of energy price on the operation cost and environmental cost under different scenarios. RIES can adjust the output of the generator set according to the electricity price, adjust the purchase and sale of electricity, and realize the economic operation of the system. The sensitivity of the cost to electricity price is shown in Figure 10 and Figure 11.
Figure 10 shows the impact of electricity prices on the system operating costs in the three scenarios. Figure 11 shows the impact of electricity prices on the system environmental costs in the three scenarios. When the electricity price changes, the operation cost of the system changes slowly, and the change of environmental cost is more obvious. In Scenario 1, the impact of electricity price changes on environmental cost is greater than that of operation cost. The change of electricity price leads to the change of the electricity exchange between the system and the power grid. While reducing the amount of electricity purchased, the system increased the sale profit of electricity by raising the operation efficiency of CCHP as far as possible in the high-price period. This leads to a smaller change in operation cost, while increasing the environmental cost of the system.
6. Conclusions
In this paper, a BESS in an RIES as a backup power source will affect the operating cost of the system in different situations. The MFO algorithm is used to study the operation optimization of the regional integrated energy system, and it is applied to the research of power and thermal demand in the regional integrated energy demonstration project. Two different generation units are optimized—gas turbine and storage generation—and two kinds of renewable energy are utilized—wind power and photovoltaic. The work done in this paper can be summarized as follows:
- (1)
- In order to solve the problem of system optimization scheduling, an RIES including WT, PV, GT and BESS was introduced. In order to obtain the minimum operation cost, an operation optimization model was built. It is proved that the model proposed in this paper has a certain guiding role for the economical dispatch of RIES;
- (2)
- The MFO algorithm used in this paper has the characteristics of fast solution speed and high precision. It can solve the RIES’s run optimization problem and run optimization issues. The optimal solution is obtained for the 19th time after 100 iterations, and the solution speed is fast, realizing the economic distribution of each micro-source output;
- (3)
- For the results analysis, the operation cost of the GT accounts for a high proportion of the total operating cost of the system, and plays an important part in the solution of the RIES operation optimization model. When BESS is used as a backup power source, the operating cost of the system and the amount of pollutant emissions generated are less than those of DG. Therefore, the use of BESS instead of DG as a backup power source in the RIES is a worthwhile option.
Due to the restriction of the model size and the applicability of the algorithm, the model of RIES proposed in this paper has not yet considered such issues as the coupling among heating gases, the cold load and NG supply fluctuations. We will continue to improve these shortcomings in future research.
Author Contributions
J.L. and D.N. conceived and designed the experiments; M.W. and H.D. performed the experiments; F.L. wrote the paper; Y.W. contributed research guidance.
Funding
This paper is supported by “the Fundamental Research Funds for the Central Universities” (2018ZD13), the “111 Project” (B18021) and “the Project of Beijing Social Science Fund” (18GL042).
Conflicts of Interest
The authors declare no conflict of interest.
Parameters
| Output power of wind turbine | kW | |
| f(ν) | Probability density of wind power | -- |
| k | Shape parameter in the Weibull distribution | -- |
| c | Scale parameter in the Weibull distribution | -- |
| Cut-in wind speed of wind turbine | m/s | |
| Cut-out wind speed of wind turbine | m/s | |
| Rated wind speed of wind turbine | m/s | |
| Ppν | Output power of PV system | kW |
| Photovoltaic output energy conversion efficiency | 0.9 | |
| Rated power of PV | kW | |
| Power temperature coefficient of PV | 0.0047 °C−1 | |
| Rated module temperature of PV | °C | |
| Actual temperature of PV | °C | |
| Maximum discharge power constraint of battery | kW | |
| Minimum charge state constraint of battery | kW | |
| Charge rate of battery | % | |
| Discharge efficiency of battery | -- | |
| Total capacity of battery | kW·h | |
| Simulation time interval | 5 min | |
| Maximum charge power constraint of battery | -- | |
| Maximum charge state constraint of battery | -- | |
| Total effective throughput of battery | Ah | |
| Number of cycles of battery | time | |
| Rated discharge depth | % | |
| Rated discharge current capacity | Ah | |
| Actual depth of discharge | % | |
| Ampere hours in equivalent discharge current per unit time | Ah | |
| Actual capacity | Ah | |
| Cbat,dep | Depreciation costs in unit of charging and discharging | ¥/kWh |
| Energy storage initial investment cost | ¥ | |
| Total charge | minute | |
| Residual heat of exhaust at t | kJ | |
| Gas turbine output | kJ | |
| Generator efficiency at t | kW | |
| Heat loss coefficient | -- | |
| Consumption per unit time | -- | |
| Low calorific value | Nm3/h | |
| Operating costs of CCHP system | -- | |
| Consumption of the total heat | ¥ | |
| Net calorific power of the natural gas | kJ | |
| Bus tie line exchange power | kJ/Nm3 | |
| Purchase/surplus feed-in tariff | kW | |
| Gas price | ¥ | |
| Gas consumption at t | ¥/m3 | |
| Energy storage depreciation costs | Nm3/h | |
| Number of power generation units | ¥/kWh | |
| Power output of schedulable power generation unit | time | |
| Photovoltaic output power at t | kW | |
| Distributed wind power output at t | kW | |
| Tie-line output at t | kW | |
| Total active load | kW | |
| State of charge | kW | |
| Heat load | kW | |
| Cold load | kW | |
| Scaling factor | kW | |
| Population adaptive variance | -- | |
| Number of population | -- | |
| Mutation operator | -- | |
| Range of the base vectors | -- | |
| Population variation scaling factor | -- | |
| Maximum variation generations | -- | |
| Rated thermoelectric ratio of gas turbine | % |
References
- Wang, Y. The analysis of the impacts of energy consumption on environment and public health in China. Energy 2010, 35, 4473–4479. [Google Scholar] [CrossRef]
- Yüksel, I. Energy production and sustainable energy policies in Turkey. Renew. Energy 2010, 35, 1469–1476. [Google Scholar] [CrossRef]
- Yu, X.; Xu, X.; Chen, S. A brier review to integrated energy system and energy internet. Trans. China Electrotech. Soc. 2016, 31, 1–13. [Google Scholar]
- Dawoud, S.M.; Lin, X.; Okba, M.I. Optimal placement of different types of RDGs based on maximization of microgrid loadability. J. Clean. Prod. 2017, 168, 63–73. [Google Scholar] [CrossRef]
- Li, G.; Wang, R.; Zhang, T.; Ming, M.; Sciubba, E. Multi-Objective Optimal Design of Renewable Energy Integrated CCHP System Using PICEA-g. Energies 2018, 11, 743. [Google Scholar] [CrossRef]
- Liu, Y.; Gao, S.; Zhao, X.; Zhang, C.; Zhang, N. Coordinated Operation and Control of Combined Electricity and Natural Gas Systems with Thermal Storage. Energies 2017, 10, 917. [Google Scholar] [CrossRef]
- Han, L.; Wang, F.; Tian, C. Economic Evaluation of Actively Consuming Wind Power for an Integrated Energy System Based on Game Theory. Energies 2018, 11, 1476. [Google Scholar] [CrossRef]
- Ahmad, A.; Khan, A.; Javaid, N.; Hussain, H.M.; Abdul, W.; Almogren, A.; Alamri, A.; Niaz, I.A. An Optimized Home Energy Management System with Integrated Renewable Energy and Storage Resources. Energies 2017, 10, 549. [Google Scholar] [CrossRef]
- Green Left Weekly. Turnbull, Carr to Launch 100% Renewables Plan for Australia; Green Left Weekly: Melbourne, VIC, Australia, 2010. [Google Scholar]
- Lynas, M. New IPCC Error: Renewables Report Conclusion Was Dictated by Greenpeace; Mark Lynas: Oxford, UK, 2011. [Google Scholar]
- Jacobson, M.Z.; Delucchi, M.A. A Plan to Power 100 Percent of the Planet with Renewables; Scientific American: New York, NY, USA, 2009. [Google Scholar]
- Mago, P.J.; Fumo, N.; Chamra, L.M. Performance analysis of CCHP and CHP systems operating following the thermal and electric load. Int. J. Energy Res. 2009, 33, 852–864. [Google Scholar] [CrossRef]
- Wang, L.; Li, Q.; Ding, R.; Sun, M.; Wang, G. Integrated scheduling of energy supply and demand in microgrids under uncertainty: A robust multi-objective optimization approach. Energy 2017, 130, 1–14. [Google Scholar] [CrossRef]
- Zerrahn, A.; Schill, W.P.; Kemfert, C. On the economics of electrical storage for variable renewable energy sources. arXiv 2018, arXiv:1802.07885. [Google Scholar] [CrossRef]
- Liu, D.; Ma, H.; Wang, B.; Gao, W.; Wang, J.; Yan, B. Operation Optimization of Regional Integrated Energy System with CCHP and Energy Storage System. Autom. Electr. Power Syst. 2017, 41, 33–40. [Google Scholar]
- Grantham, A.; Pudney, P.; Ward, L.A.; Whaley, D.; Boland, J. The viability of electrical energy storage for low-energy households. Sol. Energy 2017, 155, 1216–1224. [Google Scholar] [CrossRef]
- Hu, Y.; Li, Y.; Xu, M.; Zhou, L.; Cui, M. A Chance-Constrained Economic Dispatch Model in Wind-Thermal-Energy Storage System. Energies 2017, 10, 326. [Google Scholar] [CrossRef]
- Ma, H.; Wang, B.; Gao, W.; Liu, D.; Sun, Y.; Liu, Z. Optimal Scheduling of an Regional Integrated Energy System with Energy Storage Systems for Service Regulation. Energies 2018, 11, 195. [Google Scholar] [CrossRef]
- Denholm, P.; Hand, M. Grid flexibility and storage required to achieve very high penetration of variable renewable electricity. Energy Policy 2011, 39, 1817–1830. [Google Scholar] [CrossRef]
- Choudhury, S.; Bhowmik, P.; Rout, P.K. Economic Load Sharing in a D-STATCOM Integrated Islanded Microgrid based on Fuzzy Logic and Seeker Optimization Approach. Sustain. Cities Soc. 2017, 37, 57–69. [Google Scholar] [CrossRef]
- Lorestani, A.; Ardehali, M.M. Optimization of autonomous combined heat and power system including PVT, WT, storages, and electric heat utilizing novel evolutionary particle swarm optimization algorithm. Renew. Energy 2018, 119, 490–503. [Google Scholar] [CrossRef]
- Mirjalili, S. Moth-Flame Optimization Algorithm: A Novel Nature-inspired Heuristic Paradigm. Knowl.-Based Syst. 2015, 89, 228–249. [Google Scholar] [CrossRef]
Figure 1.
The typical structure of the regional integrated energy system (RIES).

Figure 2.
The flowchart of the moth flame optimization algorithm.

Figure 3.
Loads curve on a typical day.

Figure 4.
Adaptive curve of the moth flame optimization (MFO) algorithm in different scenarios.

Figure 5.
The SOC curve of BESS in three different scenarios.

Figure 6.
The output of RIES in Scenario 1.

Figure 7.
The output of RIES in Scenario 2.

Figure 8.
The output of RIES in Scenario 3.

Figure 9.
Composition of the system cost in different scenarios when BESS/DG is used as a reserve power source.
Figure 9.
Composition of the system cost in different scenarios when BESS/DG is used as a reserve power source.
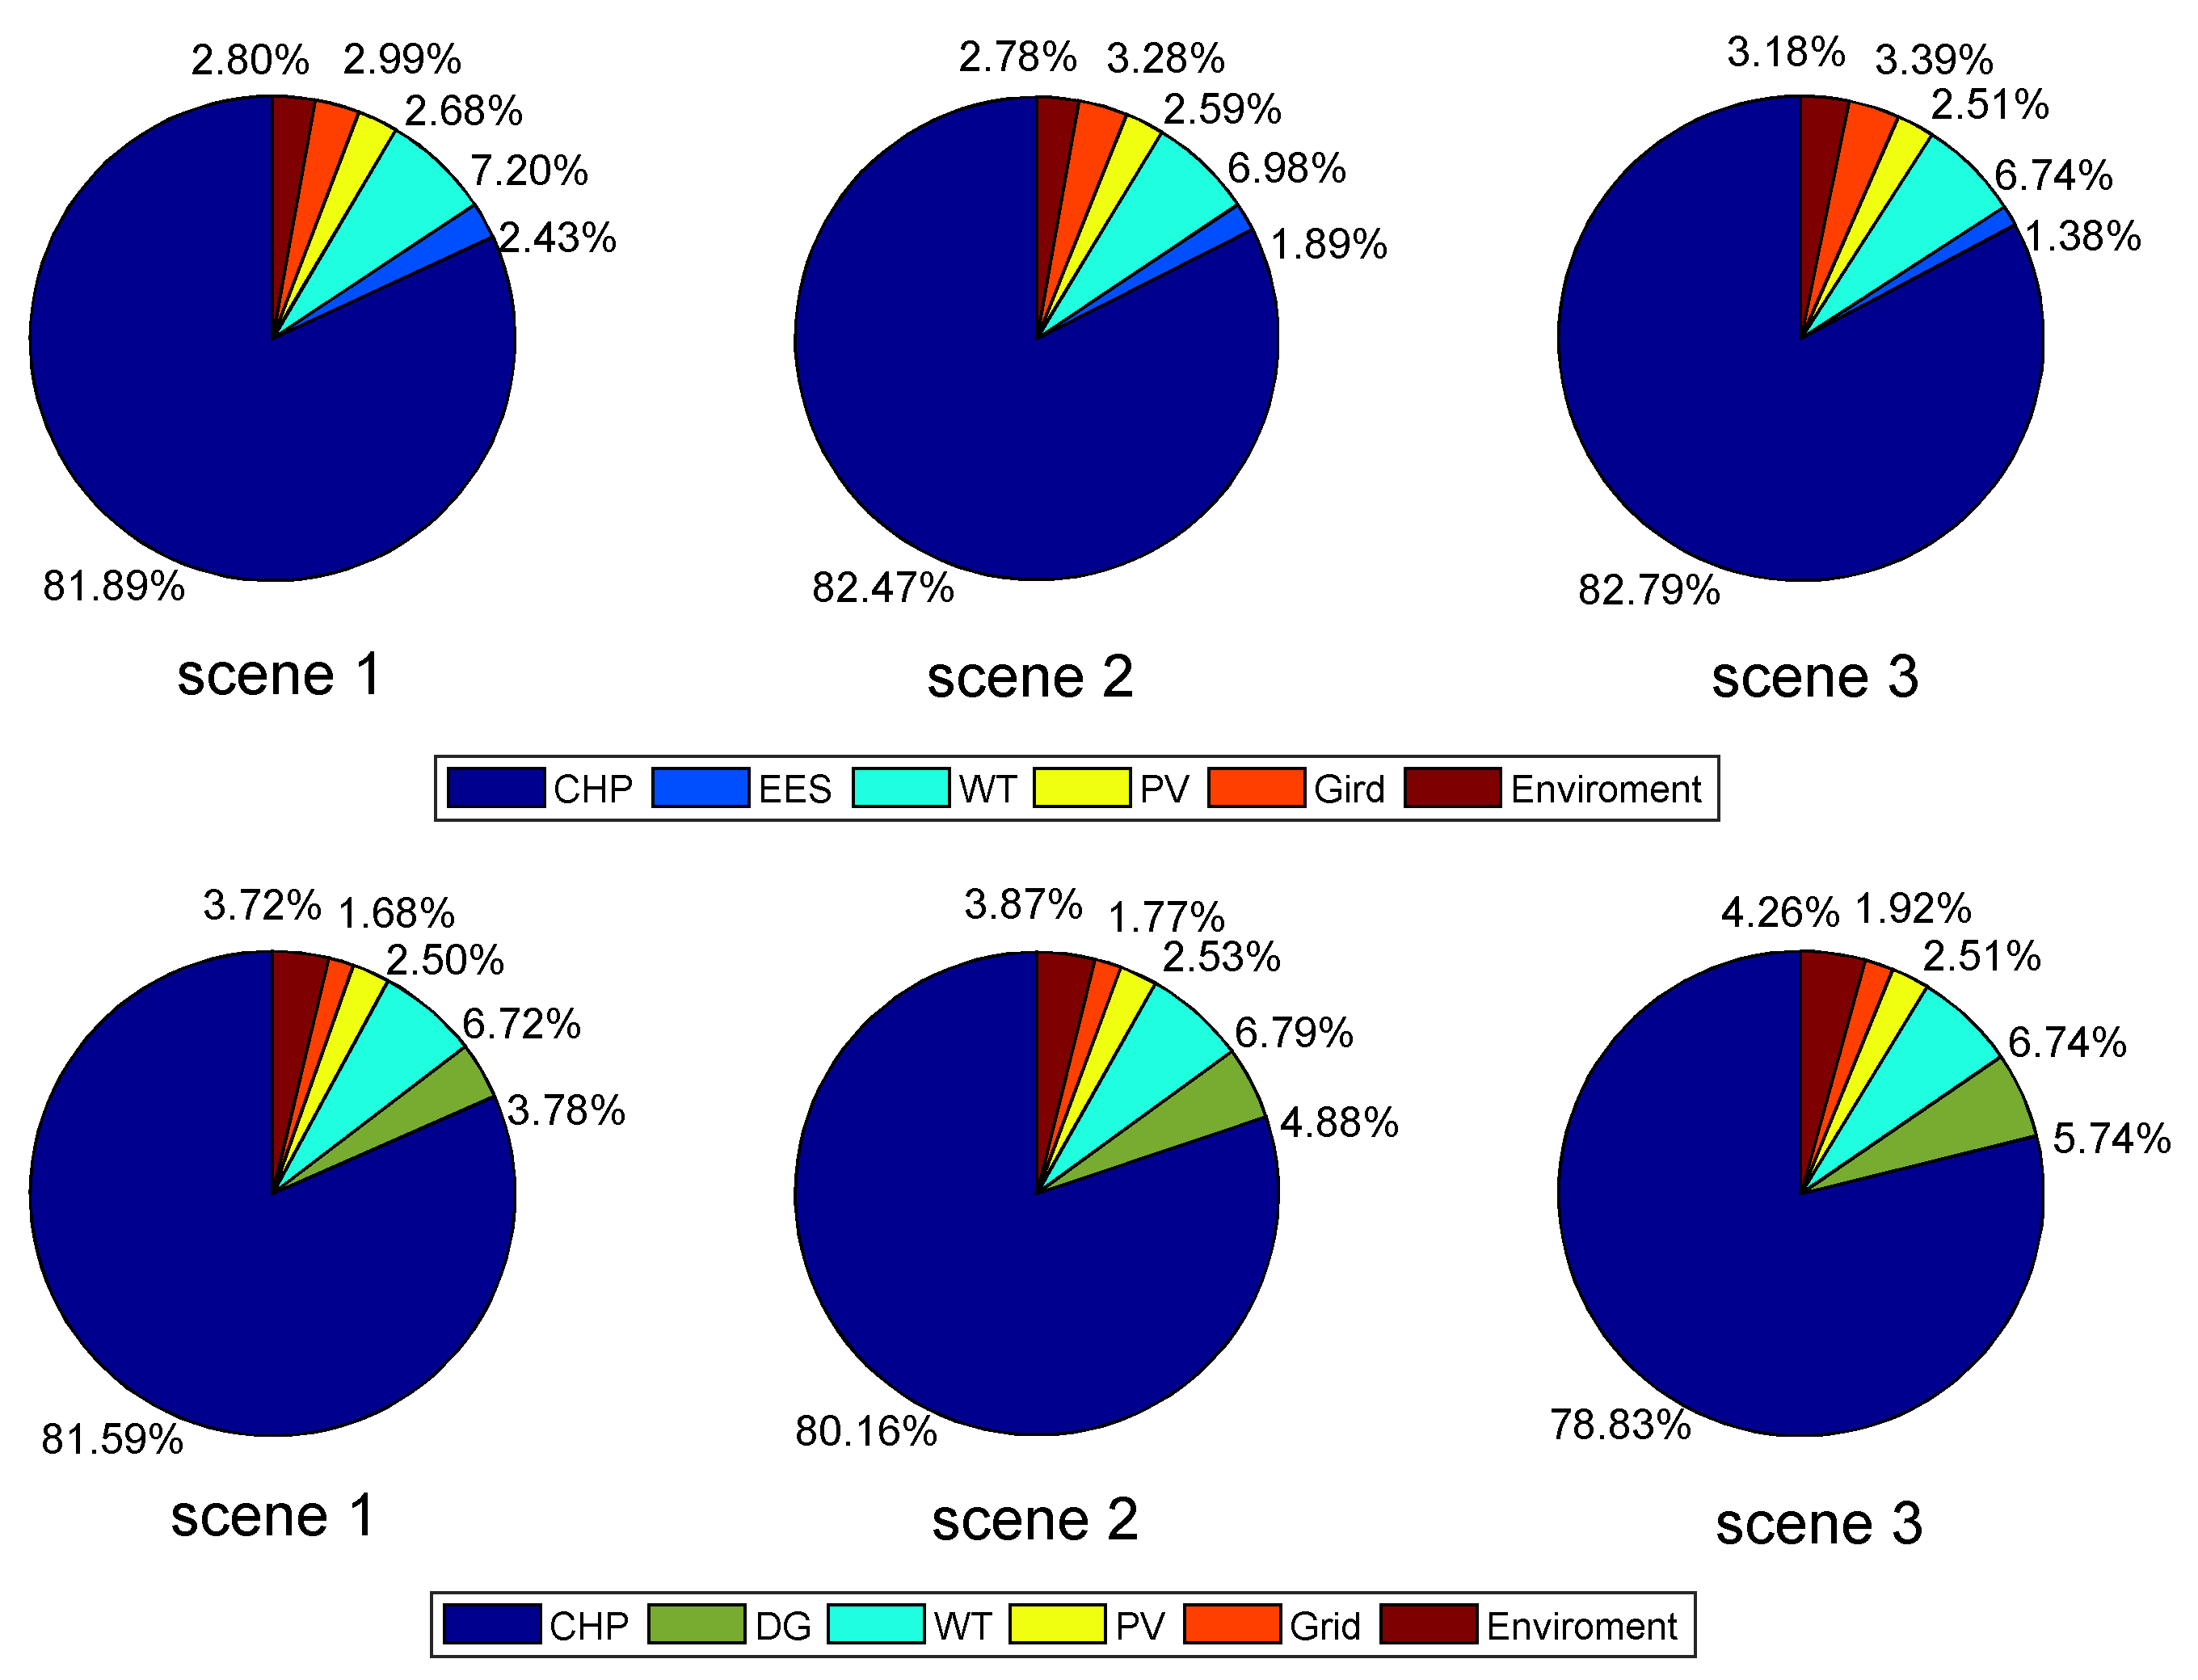
Figure 10.
The impact of electricity prices on system operating costs in the three scenarios.

Figure 11.
The impact of electricity prices on system environmental costs in the three scenarios.


Table 1.
The capacity of wind turbines (WTs), photovoltaics (PV), combined heat and power (CHP), and battery energy support systems (BESSs) and electric load.
Table 1.
The capacity of wind turbines (WTs), photovoltaics (PV), combined heat and power (CHP), and battery energy support systems (BESSs) and electric load.
| WT | PV | CHP | BESS | Electric Load | |
|---|---|---|---|---|---|
| Capacity | 300 kW | 400 kW | 1.5 MW | 300 kWh | 667 kW |
Table 2.
Energy price.
| Type | Price (¥/kWh‚ ¥/m3) | ||
|---|---|---|---|
| Trough Period 0:00~6:00 18:00~24:00 | Stationary 6:00~10:00 15:00~18:00 | Peak Period 10:00~15:00 | |
| Buying electricity price | 0.5522 | 0.8185 | 1.2035 |
| Selling electricity price | 0.65 | 0.65 | 0.65 |
| Buying gas price | 3.16 | ||
Table 3.
The parameters of BESS.
| Parameter | Figure |
|---|---|
| Rated capacity/(kW·h) | 300 |
| Maximum charge discharge power /kW | 65 |
| State of charge (SOC) operating range | 0.25~0.95 |
| SOC overcharge protection threshold | 0.9 |
| Charge discharge conversion efficiency/% | 90% |
| Self-discharge rate/(%·s−1) | 0.001 |
| Lifetime | 5~15 |
| Cycle index | 3000 (90%DOD) |
Table 4.
The gas turbine operating parameters.
| Parameter | Value Under Different Operating Conditions | ||
|---|---|---|---|
| Load factor/% | 100 | 75 | 50 |
| Electric power/kW | 1490 | 1118 | 742 |
| Output power/kW | 1528 | 1146 | 765 |
| Power factor | 1 | 1 | 1 |
| Voltage/V | 400 | 399 | 403 |
| Current/A | 2146 | 1613 | 1064 |
| Frequency/Hz | 50 | 50 | 50 |
Table 5.
Pollutant emissions and their unit environmental costs.
| Pollutants | SO2 | NOx | CO2 | CO | |
|---|---|---|---|---|---|
| Emission | Coal (kg/t) | 18 | 8 | 1731 | 0.26 |
| Gas (kg/106m3) | 11.6 | 0.0062 | 2.01 | 0 | |
| Environmental value (yuan/kg) | 6.00 | 8.00 | 0.023 | 1.00 | |
Table 6.
The RIES operating costs in the three scenarios when BESS is used as a reserve power source.
Table 6.
The RIES operating costs in the three scenarios when BESS is used as a reserve power source.
| Cost/Yuan | Generation Cost/Yuan | Environmental Cost/Yuan | Operation Cost/Yuan | |||||
|---|---|---|---|---|---|---|---|---|
| CHP | ESS | WT | PV | Electricity Exchange | ||||
| Purchase | Sell | |||||||
| Scenario 1 | 12,690.6 | 331.04 | 979.68 | 364.38 | 491.89 | −1546.4 | 381.42 | 13,692.61 |
| Scenario 2 | 12,882 | 264.88 | 979.68 | 364.38 | 459.54 | −1315.8 | 390.09 | 14,024.77 |
| Scenario 3 | 13,037 | 200.75 | 979.68 | 364.38 | 407.48 | −1016.2 | 462.38 | 14,435.47 |
Table 7.
System cost structure under different operating conditions when a diesel generator (DG) is used as a reserve power source.
Table 7.
System cost structure under different operating conditions when a diesel generator (DG) is used as a reserve power source.
| Cost/Yuan | Generation Cost/Yuan | Environmental Cost/Yuan | Operation Cost/Yuan | |||||
|---|---|---|---|---|---|---|---|---|
| CHP | DG | WT | PV | Electricity Exchange | ||||
| Purchase | Sell | |||||||
| Scenario 1 | 12,760 | 550.65 | 979.68 | 364.38 | 245 | −870 | 541.6164 | 14,571.3 |
| Scenario 2 | 12,559 | 704.58 | 979.68 | 364.38 | 256 | −993 | 557.8287 | 14,428.47 |
| Scenario 3 | 12,648 | 834.221 | 979.68 | 364.38 | 279 | −1190 | 619.5892 | 14,534.87 |
© 2018 by the authors. Licensee MDPI, Basel, Switzerland. This article is an open access article distributed under the terms and conditions of the Creative Commons Attribution (CC BY) license (http://creativecommons.org/licenses/by/4.0/).
Share and Cite
MDPI and ACS Style
Li, J.; Niu, D.; Wu, M.; Wang, Y.; Li, F.; Dong, H. Research on Battery Energy Storage as Backup Power in the Operation Optimization of a Regional Integrated Energy System. Energies 2018, 11, 2990. https://doi.org/10.3390/en11112990
AMA Style
Li J, Niu D, Wu M, Wang Y, Li F, Dong H. Research on Battery Energy Storage as Backup Power in the Operation Optimization of a Regional Integrated Energy System. Energies. 2018; 11(11):2990. https://doi.org/10.3390/en11112990
Chicago/Turabian StyleLi, Jianfeng, Dongxiao Niu, Ming Wu, Yongli Wang, Fang Li, and Huanran Dong. 2018. "Research on Battery Energy Storage as Backup Power in the Operation Optimization of a Regional Integrated Energy System" Energies 11, no. 11: 2990. https://doi.org/10.3390/en11112990
Note that from the first issue of 2016, this journal uses article numbers instead of page numbers. See further details here.