Comprehensive Performance Assessment on Various Battery Energy Storage Systems

1
School of Economics and Management, North China Electric Power University, Beijing 102206, China
2
Beijing Key Laboratory of New Energy and Low-Carbon Development, North China Electric Power University, Changping, Beijing 102206, China
*
Author to whom correspondence should be addressed.
Energies 2018, 11(10), 2841; https://doi.org/10.3390/en11102841
Submission received: 20 August 2018
/
Revised: 3 September 2018
/
Accepted: 5 September 2018
/
Published: 20 October 2018
Abstract
:With the increasing development of renewable resources-based electricity generation and the construction of wind-photovoltaic-energy storage combination exemplary projects, the intermittent and fluctuating nature of renewable resources exert great challenges for the power grid to supply electricity reliably and stably. An energy storage system (ESS) is deemed to be the most valid solution to deal with these challenges. Considering the various types of ESSs, it is necessary to develop a comprehensive assessment framework for selecting appropriate energy storage techniques in establishing exemplary projects combining renewable resources-based electricity generation and an ESS. This paper proposes a multi-criteria decision making (MCDM) model combining a fuzzy-Delphi approach to establish the comprehensive assessment indicator system, the entropy weight determination method, and the best-worst method (BWM) to calculate weights of all sub-criteria, and a Vlsekriterijumska Optimizacija I Kompromisno Resenje (VIKOR) comprehensive evaluation model to choose the optimal battery ESS. In accordance with the comprehensive evaluation results, the Li-ion battery is the optimal battery ESS to apply to wind-photovoltaic-energy storage combination exemplary projects. Based on the discussion on the comprehensive evaluation results, policy implications are suggested to improve the applicability of battery ESSs and provide some references for decision makers in related fields.
1. Introduction
With the rapid process of urbanization and speeding-up development of the global economy, the growth of electricity consumption is accelerating and is expected to increase by a third by 2040 [1]. Searching for the solution to satisfy the increasing need for electricity has become an urgent mission in the development of the energy economy all over the world. Simultaneously, the problems of environmental pollution and climate deterioration brought by traditional thermal power generation and the depletion of fossil fuel resources are becoming increasingly serious, which have posed great threats on the sustainable development of human beings [2,3]. Towards the aim of handling the problems mentioned above, all countries are shifting to generate electricity using clean and inexhaustible renewable energy, containing tidal power, wind power, biomass power, solar power, and some others [4]. According to the British Petroleum (BP) World Energy Statistics Yearbook in 2017, by the end of 2016, renewable energy accounted for approximately a quarter of the total electricity generation, and the growth rate of renewable energy generation capacity in 2016 reached 14.1%, half of which originated from wind power generation [5]. Although wind power generation is one of the most technically mature electricity generation patterns [6,7,8], it can be impacted by lots of uncontrollable factors, including humidity, temperature, and wind speed. Therefore, wind power generation can be intermittent and fluctuating. In the process of grid-connected generation and the increasing penetration of renewable resources-based power production, this will put a power grid into high risk, such as reducing the stability of the power grid system, increasing the difficulty of system dispatching, and decreasing the economic benefits of the system operation [9,10]. In order to solve the risks above, great efforts have been made to explore various solutions, such as electrical ESSs, connection external grids, and demand-side management. Among all the potential solutions, an ESS has been deemed as one of the most effective solutions [11].
An energy storage technique indicates the process of transferring energy from one form (primarily electricity) to a storable form and then the storable energy will be transferred back to electricity energy when needed [12]. ESS has various precious functions to the electricity grid system operation and balance load, for instance: (1) it can help satisfy peak load requirements and reduce the import of electricity during a peak period, (2) it can provide time-varying electricity management, (3) it can mitigate the intermittent nature of renewable resources based electricity generation, (4) it can improve the reliability and stability of the power grid, and (5) it can help to realize smart grids. Based on the advantages of ESSs, the National Power Grid Corporation in China proposed to construct the demonstration project, combining wind and photovoltaic power generation, an ESS as well as electricity transmission together, to eliminate the fluctuation and intermittent problems of renewable resources-based electricity generation and reducing the abandoning rate of wind and photovoltaic power generation.
Considering the critical role of an ESS in the power grid, many studies focused on studying the technical features and applications of ESSs. For example, References [13,14,15,16,17,18] investigated and reviewed the technical features of different ESSs. Ibrahim et al. [16] provided features of various ESSs and emphasized the necessities of storing electricity to improve the stability of a power grid. Some literature researched the operational characteristics of energy storage techniques, i.e., physical energy storage including compressed air energy storage [19], pumped hydroelectricity storage [20], flywheel energy storage [21,22], chemical energy storage containing various kinds of batteries [23,24,25], electromagnetic energy storage embodying superconducting magnetic energy storage [26], and supercapacitor energy storage [27]. Additionally, tremendous research has focused on modeling and optimizing ESSs of real or exemplary electricity systems [28,29,30,31,32,33]. However, there are few studies researching the comprehensive evaluation of the application of ESSs. Zhang [34] analyzed the economic profit and investment cost of an ESS participating in the peak load adjustment in accordance with the actual situation of the battery ESS applied to the distribution network. Das et al. [35] proposed a generic bulk energy storage dispatch method for generation cost imitation and evaluated the performance and economic profit of storage under different system scenarios. Ren et al. [36] developed a criteria system for sustainability evaluation of ESSs employing non-linear fuzzy prioritization. The existing studies on the comprehensive evaluation of ESSs are on the basis of the economic benefits of ESSs in a distribution network application, which cannot comprehensively and systematically evaluate the application performance of ESSs [37].
In accordance with the three types of ESSs classified by operational characteristics mentioned above, physical energy storage is limited by water resources and the geographical environment, the application cost of electromagnetic energy storage is relatively high, and hence, the chemical energy storage technique is widely used due to its safe, economic, and environmentally friendly characteristics. Moreover, it contains various kinds of battery energy storage techniques, such as lithium-ion (Li-ion) battery, sodium–sulfur (NaS) battery, nickel–metal hydride (NiMH) battery, as well as vanadium redox-flow (VRF) battery [12]. The selection of an ESS of various battery types is a rigorous issue for decision-makers. Hence, it is necessary to develop a comprehensive assessment system for selecting an appropriate battery energy storage technique in establishing an exemplary project combining renewable resources-based electricity generation and an ESS.
The critical devotion of this investigation is that a comprehensive and systematic evaluation system is established based on multi-criteria decision making (MCDM) model to select an appropriate battery type ESS for constructing demonstration projects combining renewable resources-based electricity generation and an ESS. This research conducts a novel integrated and comprehensive evaluation on battery ESS application. The established comprehensive evaluation system of battery ESS selection contains a relatively complete assessment index system on the basis of a fuzzy-Delphi approach from the perspectives of technological performance, economic costs and benefits, as well as social effects, a set of accurate weights determination method comprehensively considering the opinions of experts employing the best-worst method (BWM) and the actual data of objective sub-criteria utilizing an entropy method, and a mature evaluation model based on Vlsekriterijumska Optimizacija I Kompromisno Resenje (VIKOR) to select the optimal battery ESS. Based on the discussion of comprehensive evaluation results, policy implications will be given to improve the applicability of battery ESSs.
The rest of this research are organized as follows. The basic theory of the integrated comprehensive evaluation framework is elaborated in the next section. Section 3 illustrates the conceptual framework of this research. Section 4 gives a general description on the five selected battery ESSs. Section 5 presents the comprehensive assessment. The comprehensive assessment results and some policy implications are discussed in Section 6. Section 7 draws the conclusions.
2. Basic Theory of the Integrated Comprehensive Evaluation System
The fundamental methodology of the established comprehensive evaluation system consists of three parts: (1) a fuzzy-Delphi model used to choose evaluation sub-criteria; (2) a BWM and entropy weight determination method utilized to compute weights of the sub-criteria; and (3) a VIKOR model applied to select the optimal battery ESS.
2.1. Fuzzy-Delphi Methodology
A Delphi approach, put forward by Dalky and Helmer, was employed to get the most dependable common view among several experts and was diffusely applied to make a strategic decision as well as forecasting [38]. The traditional Delphi method provides a chance for experts to obtain replies and revise their views using four rounds of consultations [39], which is time-consuming and hard to obtain consensus via redundant surveys. Then, a fuzzy-Delphi approach was put forward to alleviate these disadvantages, which integrated the traditional Delphi method with fuzzy theory. For the fuzzy-Delphi method, experts are required to offer three-point estimates employing triangular fuzzy numbers (TFNs) [40]. The functions of membership degree are utilized to indicate the views of experts so that experts do not need to improve their opinions again and again. The membership degree functions can take all opinions into account, which will not lose any useful information. Owing to the superiorities of the fuzzy-Delphi method, various studies have employed it to establish an evaluation index system [41]. The procedure of the fuzzy-Delphi methodology is illustrated as follow.
Step 1: Consulting and determining the upper limit and lower limit of importance scope ranging from 0 to 10 for every sub-criterion according to the opinions of several experts. The larger the value is, the more important the sub-criterion becomes. The upper limit represents the most optimistic value and the lower limit indicates the most conservative value.
Step 2: Calculating the conservative TFN and optimistic TFN of each sub-criterion, where and are the minimum values of the conservative and the optimistic values according to the opinions of experts, and are the geometric mean values of the most conservative and the most optimistic values, and and are the maximum values of the most conservative and optimistic values.
Step 3: Examine the coincidence of experts’ preferences and computing the consistent value of indicator i [41,42].
(1) If , the opinions on sub-criterion i are consistent, and the consistent value can be calculated by
(2) For , if the data of the gray zone is less than , then the consistent value can be calculated by
For , if the value of the gray zone is larger than the value , the opinions of experts are not consistent. The steps 1 and 2 should be conducted again until the opinions are consistent. indicates the degree of consensus achieved by experts with regard to the importance of every sub-criterion. The more the is, the more important the sub-criterion becomes. In order to find a reasonable critical value for examining the importance of every indicator, the geometric average value of the upper and lower limits of all evaluation sub-criteria needs to be calculated, which is taken as the threshold value to select significant sub-criteria.
The procedure of the fuzzy-Delphi methodology is shown in Figure 1.
2.2. Weights Determination Methods
In this research, weights of all indicators are integrated using subjective and objective weights. Subjective weights of indicators are determined by the BWM based on the opinions of experts. Objective weights of indicators are determined by the entropy weighting methodology on the basis of the actual data.
2.2.1. The BWM
The BWM is established based on a comparison that is similar to an analytic hierarchy process (AHP). The difference between BWM and AHP is that AHP obtains the optimal weights based on an inter-comparison between two arbitrary indicators that needs comparisons (n implies the amount of indicators), while BWM established a structural comparison model that first compares the best sub-criterion to others and then compares others to the worst one, which needs 2n − 3 comparisons [43]. The phases of BWM are as follows.
Step 1: Find the best and worst sub-criteria from the decision sub-criteria set to be utilized in the decision procedure. The best sub-criterion should be the most critical, while the worst sub-criterion is the opposite. It should be emphasized that the selection of the best and worst ones only considered the sub-criteria, but not the data of them.
Step 2: Identify the comparing results of the best one to others using the number ranging from 1 to 9. The higher the value is, the more significant the best one over others is. Comparison results can be written as a vector:
where indicates the value of the best one B to sub-criterion i. Obviously, .
Step 3: Identify the comparison value of others to the worst one utilizing the data ranging from 1 to 9. Results can be written as
where indicates the value of sub-criterion i to the worst one W. Obviously, .
Step 4: Calculate the weights . Aiming at obtaining the weights of all indicators, the maximum absolute discrepancies for all sub-criteria ought to be a minimum, which is expressed as [43]:
Equation (5) can be calculated simply through converting it into Equation (6) shown as below [44]:
Then we can calculate the optimal weights .
Step 5: Carry out a consistency examination to test for the comparison consistency. The value of can be obtained after solving Equation (6). Then, we can test for the comparison consistency through calculating the consistency ratio. According to References [43,44], the value of (representing the important degree of the best one to the worst one) ranging from 1 to 9 determines the value of the consistency indicator that needs to be used in calculating the consistency ratio. The values of the consistency indicator determined by the values of are listed in Table 1. The consistency ratio can be calculated using Equation (7).
It is noted that the lower the is, the more coherent the comparisons are.
For lots of MCDM studies, the value of evaluated object j with respect to sub-criterion i may not have actual data, and therefore the BWM can be employed to make comparisons between alternatives to get performance values.
2.2.2. Entropy Weight Determination Method
An entropy weight methodology is usually used to compute the objective weights of sub-criteria [45,46]. The detailed process of this approach is depicted as below.
Step 1: Normalize the performance values. The value of alternative j for sub-criterion i should be normalized, and the projection value should be calculated as:
where m implies the number of evaluated alternatives.
Step 2: The entropy value can be computed as:
Step 3: Compute the divergence degree. The divergence degree of every sub-criterion can be computed as:
The larger the becomes, the more important the sub-criterion is.
Step 4: Obtain weights of each sub-criterion. After obtaining the value of , the objective weights of every sub-criterion are obtained using:
where n implies the amount of the sub-criteria.
The entropy weight determination approach is used as the objective weight determination method to compute the objective weights of all indicators on the basis of the actual data of indicators with regard to alternatives.
2.3. VIKOR Comprehensive Evaluation Model
VIKOR method was designed for the multi-criteria optimization of complicated systems. The VIKOR model can identify the compromise solution and the compromise rankings. It ranks the alternatives in accordance with the special evaluation of “closeness” to the “ideal” solution [47,48]. The evaluation principles of VIKOR can be originated from the Lp-metric employed as an aggregate function, which is described as the following form:
where represents the distance between the ideal solution and alternative j, demonstrates the weight of each sub-criterion, implies the rating of alternative j for sub-criterion i, indicates the optimal values of all alternatives for sub-criterion i, means the worst values of all alternatives for sub-criterion i, and .
Steps of VIKOR employed for comprehensive evaluation are illustrated as:
Step 1: Normalize values of all alternatives of all sub-criteria. Aiming at eliminating the attribute and dimension influences on evaluation, the initial values aij of alternative j for sub-criterion i should be standardized. For maximum type sub-criteria, the normalized value xij is obtained via Equation (13). For minimum type sub-criteria, the normalized value xij is calculated via Equation (14).
Step 2: Search the positive and negative ideal data. Suppose X+ and X− indicate the positive and negative ideal solutions, respectively, and they can be obtained using:
where I1 and I2 are the maximum and minimum attribute sub-criteria set, respectively.
Step 3: Compute the group benefit value Sj and the individual regret value Rj of alternative j utilizing Equations (16) and (17).
Step 4: Calculate the compromise sorting indicator Qj for alternative j. The Qj are the critical indicators for ranking the alternatives precisely and discreetly, which can be calculated using:
where , and v indicates the weight of the maximal group benefit. Normally, v = 0.5, representing that all evaluated objects are measured in a consistent method.
Step 5: Obtaining the optimal alternative via comparing Sj, Rj and Qj. If the below two requirements are met, the one with the least value of Qj is the optimal alternative.
(1)
where and indicates the second and the first alternatives based on the Qj value.
(2) should also be the top alternative based on the values of Sj and Rj.
If the above two requirements are met, is the optimal alternative. If one of the requirements is not met, several compromise solutions are given as below:
- If and only satisfy the first requirement, both of them are the optimal alternatives.
- If the nexus between and others only satisfies the second requirement and it is difficult to satisfy the first one, alternatives that disobey the first one are treated as the compromise solutions.
3. Conceptual Framework
The integrated MCDM methodology is put forward to assess the performance of various battery ESSs. The elaborated evaluation phases are as follows.
Phase 1: Choose critical sub-criteria and construct the performance assessment index system utilizing fuzzy-Delphi. Experts in different fields are selected as the consultation group. According to the characteristics of different types of battery ESSs, 23 sub-criteria are identified. Then the fuzzy-Delphi method is used to choose the critical sub-criteria based on the experts’ views on the important degree of every original sub-criterion. The terminal assessment index system is established from technological, economic, and social aspects.
Phase 2: Identify the values of the subjective sub-criteria of each battery ESS. Considering the existence of qualitative sub-criteria, which are difficult to find the data for, BWM is utilized to identify the performance values of them through conducting pair comparisons between the best battery ESS and others and between others and the worst battery ESS of the qualitative sub-criteria.
Phase 3: Compute the integrated weights of subjective and objective weights. For the purpose of comprehensively considering the opinions of experts and the objective data, the subjective weights are computed by BWM based on experts preferences through comparing the best sub-criterion with others and others with the worst sub-criterion, and the objective weights are obtained via an entropy weight determination approach utilizing the actual value of the quantitative sub-criteria and values of qualitative sub-criteria determined by BWM. The integrated weights are computed via setting equal significance to the objective and subjective weights.
Phase 4: Evaluate the comprehensive performance of various battery ESSs based on the VIKOR model. First, the decision matrix needs to be determined through normalizing the initial data to avoid the influences of sub-criteria types as well as dimensions. Second, the positive and negative ideal values need to be found. Then the VIKOR approach is used to assess and rank the different types of battery ESSs in terms of Sj, Rj and Qj.
The proposed integrated MCDM model for the comprehensive evaluation of various battery ESSs is structured as in Figure 2.
4. Description of the Evaluated Battery Energy Storage Technologies
A battery ESS is the extensively used energy storage technique in the construction of demonstration projects, combining wind power and photovoltaic power generation, as well as ESS. This paper selects a lead-acid battery, NaS battery, Li-ion battery, NiMH battery, and VRF battery as research objects and evaluates the comprehensive performance of these five battery ESSs to provide references for decision-makers of wind-photovoltaic-energy storage combination exemplary projects. The description of these five selected battery ESSs is elaborated as below.
4.1. Lead-Acid Battery
A lead-acid battery is an extensively applied battery ESS [16]. The negative electrode is PbO2, the positive electrode is Pb, and the electrolyte is sulfuric acid. The response time of a lead-acid battery is extremely short, the daily self-discharge rates are small, cycle efficiencies is relatively high, and costs of it are relatively low [49]. A lead-acid battery can act as back-up electricity supply utilized in static devices for telecommunication systems and energy management systems, especially in micro-grids and isolated electricity systems. Additionally, lead-acid batteries also provides power for electric vehicles. However, there also exist some limitations of lead-acid battery, such as low cycling times, particular energy, energy density, and poor performance in low temperatures [17].
4.2. Li-Ion Battery
For Li-ion batteries, the cathode material is the oxide of lithium metal, including lithium cobalate (LiCoO2) and spinel lithium manganese oxide (LiMn2O4), and the anode material is usually graphitic [18]. A Li-ion battery operates based on the reactions between positive lithium ions with the anode and cathode active materials. The cells of the Li-ion battery consist of anode and cathode plates as well as liquid electrolyte material. It can be used for the systems which regard the response time, equipment weights, and small dimension as significant, such as telephones as well as portable electronic equipment. Li-ion batteries also attract interests in material technique fields to make high power equipment for applications, such as electric vehicles and stable energy storage technologies. Additionally, the cycle efficiencies of Li-ion battery are relatively high, which can reach 97% [11]. The primary disadvantages of a Li-ion battery are that the lifetime may be influenced by the depth of discharge, and the operation of the battery pack need to be managed by an on-board computer, which will increase its cost.
4.3. NaS Battery
The electrodes of a NaS battery are molten sodium and sulfur, and beta alumina is utilized as the solid electrolyte. The operation of a NaS battery needs a 574–624 K temperature to guarantee the liquid condition of the electrodes. A NaS battery has high energy densities, extremely high capacity, and nearly zero daily self-discharge [50]. The recyclability of a NaS battery is relatively high owing to the use of cheap and innocuous materials. However, it has some demerits, such as a high operation cost and additional systems to guarantee the operation temperature.
4.4. NiMH Battery
A NiMH battery uses nickel hydroxide and a hydrogen-absorbing alloy (such as LaNi5 and Mg2Ni) to be the two electrodes and aqueous alkali liquor to be the electrolyte. The merits of NiMH battery are high energy density, moderate particular energy, and much more environmental protection compared with a NiCd battery [51]. It can be applied to portable products, electric vehicles, and industrial spare devices. However, the critical demerit of a NiMH battery is the high self-discharge rate ranging from 5% to 20%.
4.5. VRF Battery
A VRF battery stores power through vanadium redox couples ( and ) in two electrolyte slots. It has quick responses and high efficiencies reaching 85% [52]. A VRF battery can be used for improving power quality, increasing load leveling and electricity security, and mitigating the intermittent power generation based on renewable energy. However, the defects of a VRF battery are a low energy density, low electrolyte stability, and high operation cost [53].
5. Empirical Analysis
This section evaluates the performance of the Li-ion battery, lead-acid battery, NaS battery, NiMH battery, and VRF battery employing the established integrated MCDM model, and the evaluation results can provide convincing reference for decision-makers of wind-photovoltaic-energy storage combination exemplary projects. The detailed process of empirical analysis is illustrated below.
5.1. Constructing the Assessment Index System
Towards the aim of comprehensively evaluating the performance of these battery ESSs, establishing the comprehensive assessment index system is of great significance. According to the features of battery ESSs, 23 original sub-criteria were identified from the perspectives of technology, economy, and sociality. To obtain the final indicator system, a fuzzy-Delphi model was employed to choose vital indicators. Five experts were selected from different fields to make up the expert decision-making group, containing distinguished scholars from the ESS researching field, as well as primary investors, governors, and decision-makers of wind-photovoltaic-energy storage combination exemplary projects. We also provided assistance for five experts, especially for primary investors and governors, in understanding the technical terms, such as capacity, power, efficiency, and others to make appropriate decisions, when consulting their opinions.
First, experts were required to give their preferences on the critical degree of every original sub-criterion, during the process of which we could obtain the most optimistic value and the most conservative value of each sub-criterion. Second, the values of the conservative TFN and optimistic TFN of each sub-criterion could be calculated. Third, the consistency of experts’ opinions could be examined using the value of through comparing the value of and according to Equations (1) and (2). Finally, the critical sub-criteria could be selected through comparing the values of with the threshold value (which was 5.2 according to the geometric average value of the upper and lower limits of all assessment sub-criteria considering experts’ preferences in this research). Results are listed in Table 2, from which we could obtain that 16 critical sub-criteria were selected to evaluate the performance of the Li-ion battery, lead-acid battery, NiMH battery, NaS battery, and VRF battery from the perspectives of technology, economy, and sociality.
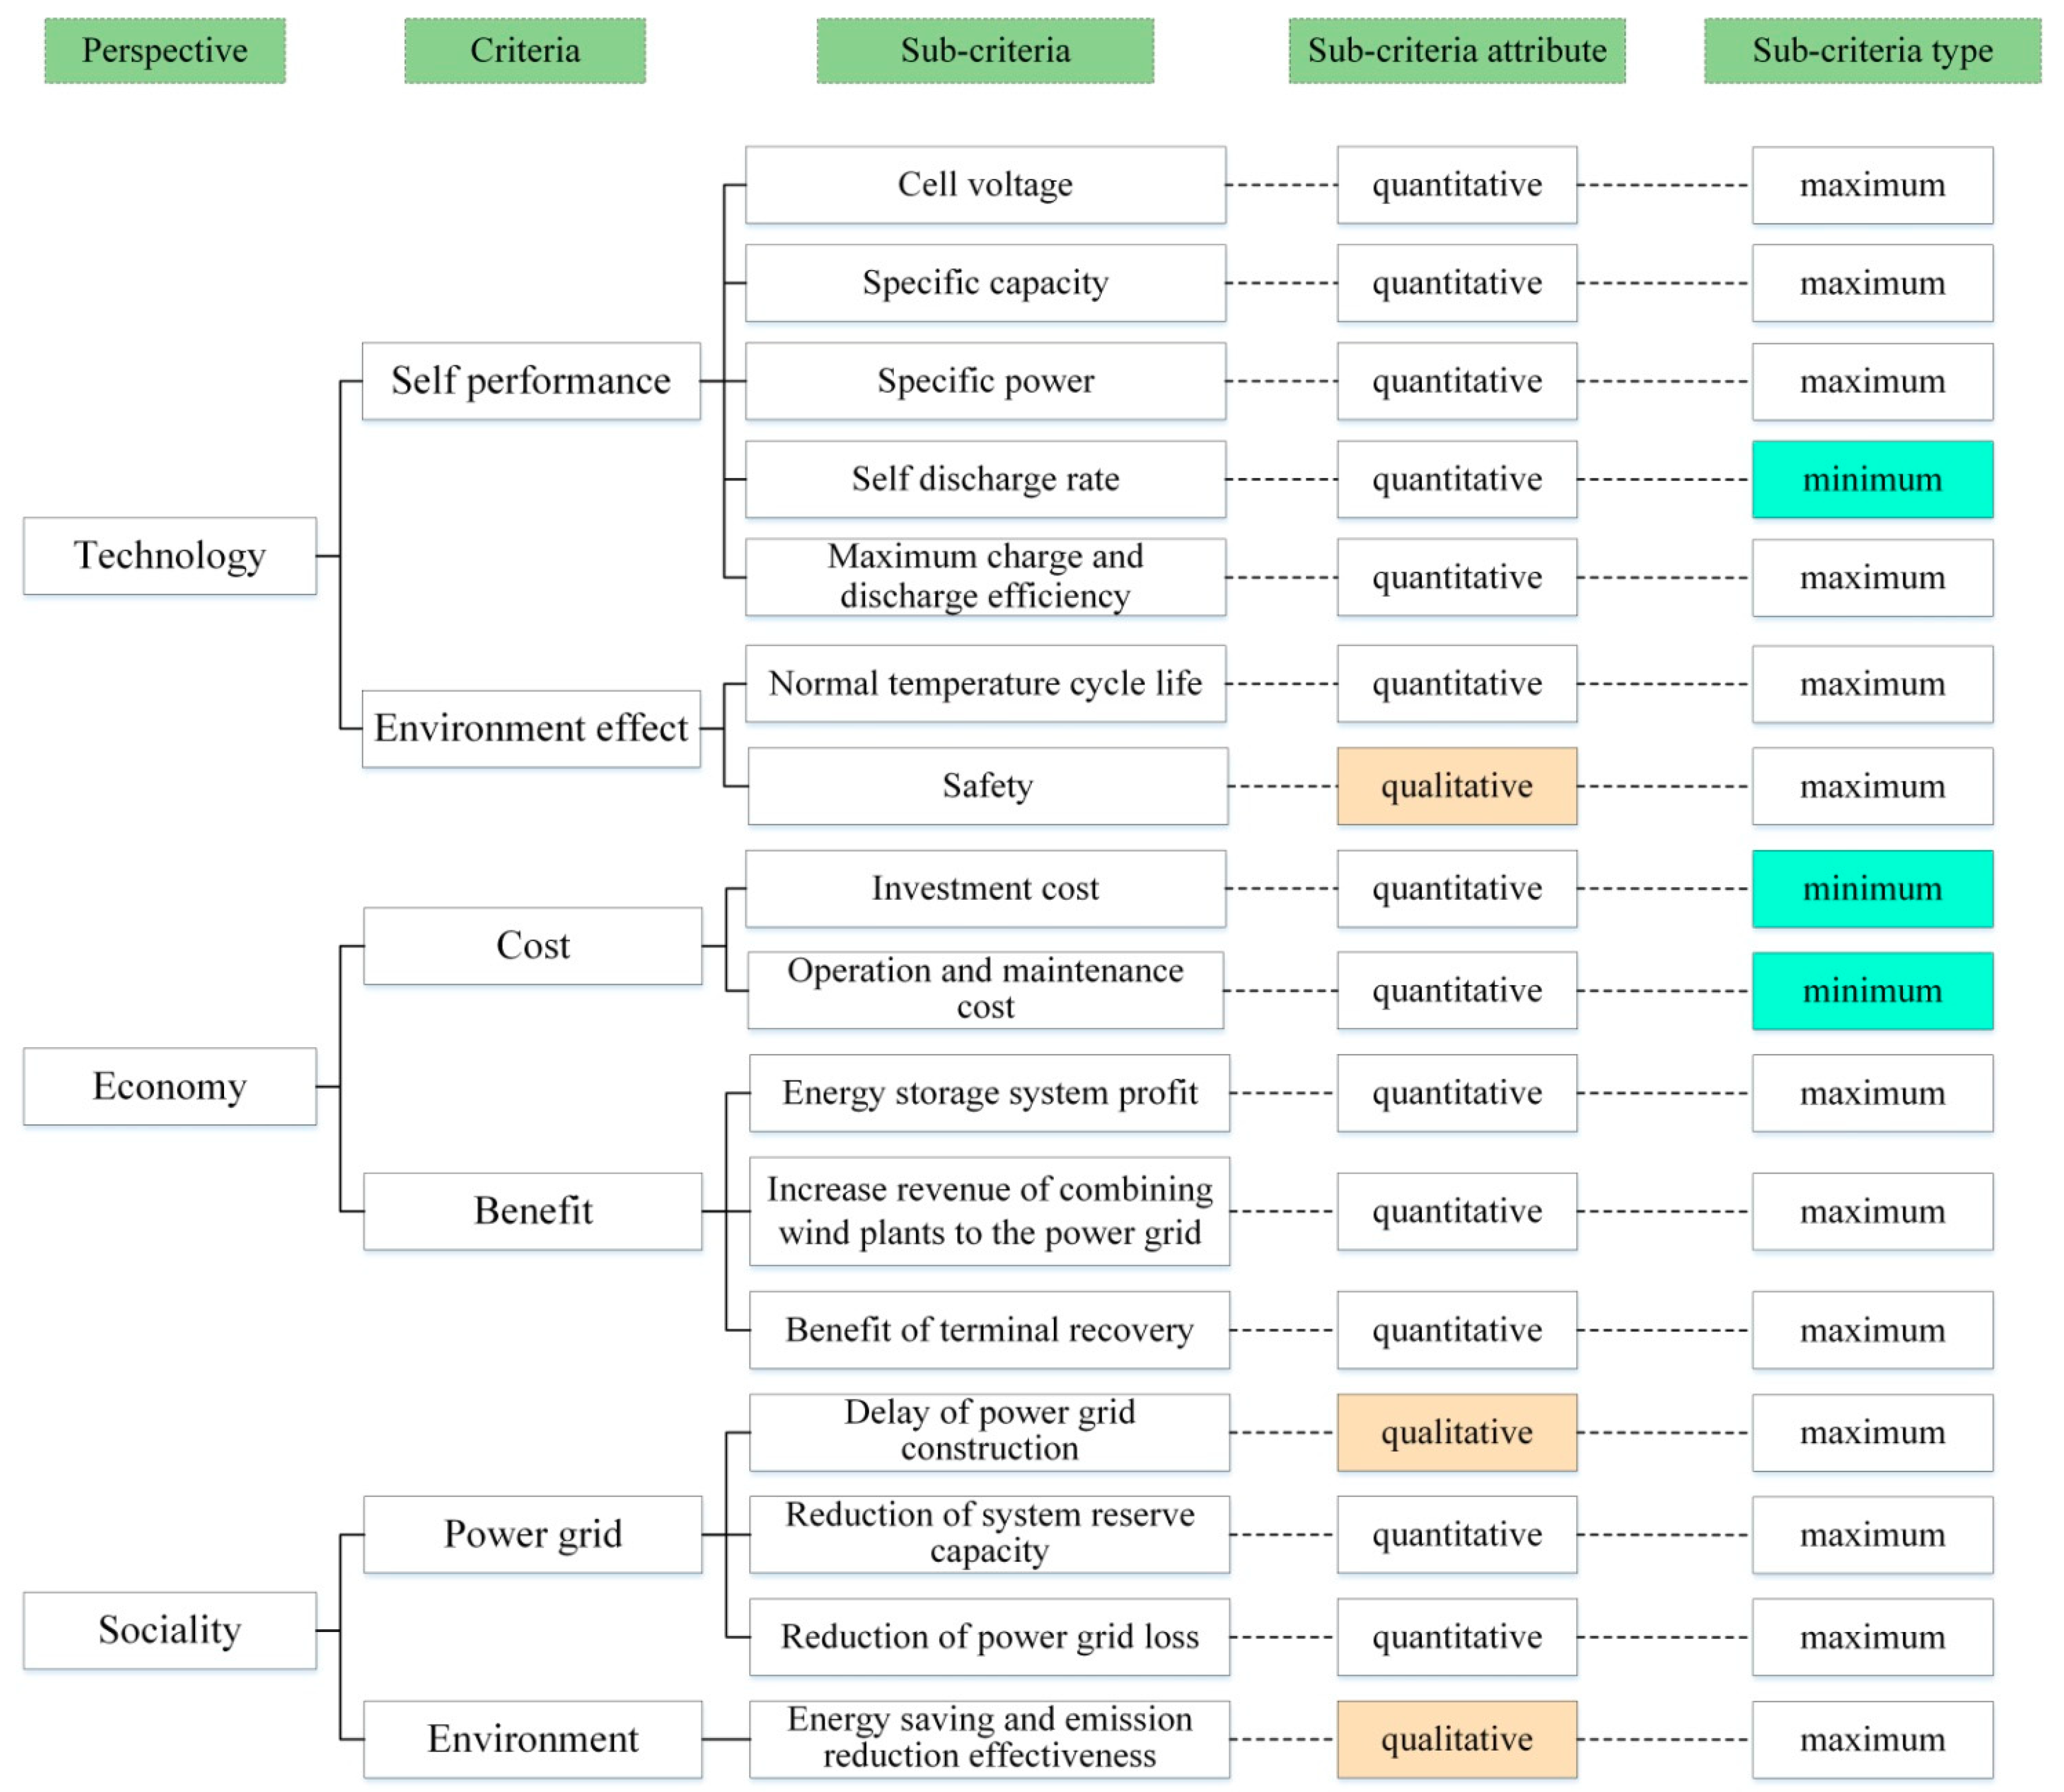
According to Figure 3, the sub-criteria contains 13 quantitative ones and 3 qualitative ones, the qualitative ones being safety, delay of power grid construction, and energy saving and emission reduction effectiveness. Moreover, there were 13 maximum type sub-criteria and 3 minimum type ones, where the minimum type ones were self-discharge rate, investment cost, and operation and maintenance cost.
5.1.1. Technology Perspective
Since the research and application of energy storage technique is not mature at present, evaluation of ESSs from the technology perspective is of significant theoretical value for ESS applications. The technological performance is influenced by its own performance and environmental factors. In this research, the self-performance criterion contains the cell voltage, specific capacity, specific power, self-discharge rate, and maximum charge and discharge efficiency, and the environment effect criterion includes normal temperature cycle life and safety. Among these seven sub-criteria, safety was a qualitative sub-criterion, and self-discharge rate was a minimum type sub-criterion, which means the smaller, the better.
Cell voltage represents the nominal voltage of each battery monomer, which will have critical influence on the composition and cost of the battery ESS. Specific capacity, also known as capacity density, refers to the effective storage capacity of a unit mass of material. Specific power, also known as power density, indicates the effective storage power of a unit mass of material. The self-discharge rate, also known as the charge holding capacity, demonstrates the ability to maintain the amount of electricity stored in a battery when the battery is in an open circuit. The self-discharge rate is primarily related to the manufacturing process and materials. The maximum charge and discharge efficiency represents the ratio of the released energy after charging to the initial storage energy of the ESS, and higher charge and discharge efficiency can bring economic benefits for an ESS.
The normal temperature cycle life demonstrates the amount of cycles that the system can support before the ESS operates at a specified value of a certain capacity under some discharge condition at a normal temperature. Safety implies the ability of an ESS to keep safe and stable operation under the influence of an exterior environment, such as changes in temperature, pressure, and other conditions.
5.1.2. Economy Perspective
Economic assessment sub-criteria are the most intuitive evaluation sub-criteria for the cost and benefit of ESSs. In this research, the cost criterion is made up of the investment cost as well as the operation and maintenance cost, and the benefit criterion consists of the ESS profit, increased revenue of combining wind plants to the power grid, and the benefit of terminal recovery. All these sub-criteria are quantitative, and two sub-criteria in the cost level were minimum type.
The investment cost means the cost of constructing a battery ESS, including the battery system construction cost, energy conversion devices cost, and site construction cost. The operation and maintenance cost is highly bound up with the capacity of the battery ESS. There exists a significant difference between the annual operation and maintenance costs of different battery ESSs with various capacities.
The ESS profit primarily originates from the price difference, for which electricity is stored during the valley period at a low price and released during the peak period at a high electricity price. For the increased revenue of combining wind plants to the power grid, the application of the ESS plays a critical role in smoothing the wind power generation, thus increasing the grid-connected power generation of wind plants that brings the increased revenue of combining wind plants to the power grid. The benefit of terminal recovery refers to the recoverable value of different components in battery ESSs after the lifetime of the ESS, including electrodes, metal materials, and carbon materials.
5.1.3. Sociality Perspective
The social benefits of the application of ESS are mainly related to the electricity grid as well as the environment. The power grid criterion is composed of the delay of the power grid construction, the reduction of system reserve capacity, and the reduction of power grid loss. The environment criterion includes energy saving and emission reduction effectiveness. Considering the limitation of objective data, the delay of power grid construction as well as energy saving and emission reduction effectiveness are qualitative sub-criteria.
For the delay of power grid construction, the battery ESS can release electrical energy to satisfy the peak load demand during the period of day load concentration due to the fast charging and discharging features of battery ESSs, thus it takes a significant role in delaying the construction of the power grid. For the reduction of the system reserve capacity, previously the power grid needed to be equipped with a large reserve capacity owing to the randomness and volatility of wind power generation, while the use of a battery ESS can reduce the use of reserve capacity. For the reduction of power grid loss, during the peak load period, a battery ESS is used as a power discharge that will reduce the load and electrical current, therefore it can decrease the network loss. Energy saving and emission reduction effectiveness in the application of battery ESS is manifested in environmental benefits of promoting wind power grid connected power generation and ESS self-charging.
5.2. Identifying the Performance Values of Battery ESSs of Qualitative Sub-Criteria
Before evaluating the comprehensive performance of a lead-acid battery (ES1), Li-ion battery (ES2), NaS battery (ES3), NiMH battery (ES4), and VRF battery (ES5), the evaluated values of subjective sub-criteria of these five battery ESSs needed to be identified. In this research, BWM was not only employed to identify the subjective weights, but also employed to determine the values of qualitative sub-criteria, including safety, delay of power grid construction, and energy saving and emission reduction effectiveness with regard to five battery ESSs.
First, the best and worst battery ESSs needed to be identified. The best battery ESS represents the one that performs the best over others, while the worst battery ESS was the opposite. The best and worst battery ESSs of every subjective sub-criterion were identified on the basis of the opinions of five experts, and are listed in Table 3.
Second, we needed to determine the comparison values between the best battery ESS and others and between others and the worst battery ESS employing the values ranging from 1 to 9 based on the experts’ views. The detailed comparison opinions of five experts can be found in Table A1 and Table A2 in the Appendix.
Thirdly, the comparison values needed to be substituted into Equation (6) to compute the performance values of each battery ESS of corresponding qualitative sub-criterion due to five experts’ views.
Finally, the average performance values of each battery ESS of every qualitative sub-criterion were obtained, and are shown in Table 4. The consistency ratios were all close to 0 representing the results were reliable and consistent. Therefore, the performance values of each evaluated battery ESS of the corresponding qualitative sub-criterion could be determined.
5.3. Determining the Weights of Sub-Criteria
Aiming at synthetically considering the preferences of experts and the actual data of each sub-criterion, we employed the BWM to calculate the subjective weights according to the views of five experts and the entropy weight determination approach to compute the objective weights in accordance with the actual data of quantitative sub-criteria. Performance values of qualitative sub-criteria were determined using the BWM. Then, the weights of all sub-criteria were computed through integrating the subjective weights and the objective weights.
5.3.1. Subjective Weights of All Sub-Criteria Employing the BWM
First, the best and worst sub-criteria chosen by experts are illustrated in Table 5.
Second, experts needed to provide the comparison values via comparing the importance degree between the best sub-criterion and others, as well as between others and the worst one using the number ranging from 1 to 9. A larger number represents the best sub-criterion was more critical than others. Also, the value of 1 implies the equal significance between the best one and others. The results are presented in Table 6 and Table 7.
Third, the comparison values could be substituted into the linear Equation (6) and the weights were obtained utilizing the BWM. Taking the comparing results of Expert 1 as an example, the formula was written as below via substituting the concrete comparison data into Equation (6):
We employed Lingo 9.0 software (Lindo System company, Chicago, IL, USA) to calculate the linear formula to get the unique weights determined by five experts for all sub-criteria. Then the average values were computed and the final subjective weights are listed in Table 8. The consistency ratio can also be obtained using Equation (7) through using the results of and the consistency indicator listed in Table 1. The consistency ratios are all close to zero, which means the results were highly consistent.
5.3.2. Objective Weights of Sub-Criteria Utilizing an Entropy Weight Determination Methodology
For the objective sub-criteria, data of these sub-criteria for the selected five evaluated battery ESSs were collected and summarized from the description of battery ESSs in References [12,23,24,25,54]. According to the collected data of quantitative sub-criteria and the performance data of subjective ones determined by experts (shown in Table 4), to obtain the objective weights utilizing entropy weight determination methodology, we needed to normalize the initial data (listed in Table A3) first using Equations (13) and (14). The normalization data of all sub-criteria are demonstrated in Table 9.
Then we could compute the objective weights employing an entropy weight determination methodology according to the Equations (8)–(11). The results of the entropy weight determination method are displayed in Table 10.
5.3.3. Integrated Weights of the Sub-Criteria
Comprehensively considering the opinions of experts, the actual data of the quantitative sub-criteria, and the evaluated values of the qualitative ones, the final weights were computed using the combination of subjective weights and objective weights in this study. Based on the results of the subjective weights obtained using the BWM and objective weights obtained using an entropy weight determination method, the integrated weights were computed by setting an equal importance to them. The final integrated weights are illustrated in Table 11.
5.4. Evaluating the Performance of Five Battery ESSs Using the VIKOR Model
Based on the integrated weights obtained above, we could evaluate the performance of the Li-ion battery, lead-acid battery, NiMH battery, NaS battery, and VRF battery ESSs. First, we needed to normalize the initial data of quantitative sub-criteria of five battery ESSs collected from References [12,23,24,25,54] and qualitative sub-criteria with respect to five battery ESSs obtained based on the experts’ opinions shown in Table 4 to get the decision matrix displayed below:
Second, the positive and negative ideal values and needed to be found in accordance with the Equation (15).
Third, and of the five battery ESSs were computed utilizing Equations (16) and (17). Results of them are listed in Table 12.
Fourth, the compromise sorting indicator for the Li-ion battery, lead-acid battery, NiMH battery, NaS battery, and VRF battery ESSs could be computed using Equation (18). Results of are also displayed in Table 12.
Then, we could rank the performance of the Li-ion battery, lead-acid battery, NiMH battery, NaS battery, and VRF battery ESSs through comparing , and , and select the optimal battery ESS that is appropriate for the construction of wind-photovoltaic-energy storage combination exemplary projects. The rankings of , and of five battery ESSs are demonstrated in Table 13. According to the results and rankings indicated in Table 12 and Table 13, it was apparent that the values of , and for Li-ion battery and NaS battery satisfed the two evaluation conditions of VIKOR listed in Section 2.3; therefore, the Li-ion battery was the optimal battery ESS, which is the most appropriate one for wind-photovoltaic-energy storage combination exemplary projects. The performance of the NaS battery ESS was close with the VRF battery ESS, both of which were superior to the lead-acid battery and NiMH battery ESSs.
6. Discussion and Policy Implications
6.1. Discussion of Evaluation Results
The performance of the Li-ion battery, lead-acid battery, NiMH battery, NaS battery, and VRF battery ESSs were evaluated through employing the integrated MCDM model integrating a fuzzy-Delphi method, the BWM, an entropy weight determination method, and the VIKOR evaluation model. The comprehensive evaluation results show that the Li-ion battery is the optimal battery ESS for wind-photovoltaic-energy storage combination exemplary projects. To get a better understanding about the comprehensive evaluation results, we will inquire into the subjective and objective weights and the performance of every sub-criterion of each battery ESS.
For the subjective weights of all sub-criteria indicated in Table 8, the most significant sub-criteria were energy saving and emission reduction effectiveness as well as safety, and the subjective weights of them were 0.126 and 0.112, respectively, which meant the selected experts containing scholars from the ESS researching field, as well as investors, governors, and decision-makers of wind-photovoltaic-energy storage combination exemplary projects paid more attention to the characteristics of environmental protection effects and electricity supply stability brought by the construction of an ESS. This was primarily due to the rapid deterioration of the environment according to experts’ comments, such as the frequent occurrence of fog and haze weather, and the urgency of developing renewable resources for electricity generation, which made the experts neglect the impact of economic costs and benefits and emphasize the role of environmental impact and electricity supply reliability.
For objective weights of all sub-criteria listed in Table 10, according to the actual data, the most critical sub-criteria were the self-discharge rate and energy saving and emission reduction effectiveness, the objective weights of which were 0.137 and 0.097, respectively, which indicates the technology characteristic and environment effect were highlighted based on objective data. Additionally, the weights for economic costs and benefits were the lowest according to the objective weights based on the entropy weight determination method. This was because the realization of the high proportion of renewable resources-based electricity generation is inseparable from the application of ESSs, which greatly depends on the mature technologies.
For the integrated weights of all sub-criteria summarized in Table 11, the most important sub-criteria were the energy saving and emission reduction effectiveness, safety, and self-discharge rate, the weights of which were 0.111, 0.089, and 0.088, respectively. This was a comprehensive result that synthetically took experts’ opinions emphasizing the importance of environmental effects and power supply reliability as well as the actual data highlighting the significance of technology and environmental impacts into consideration.
For energy saving and emission reduction effectiveness, safety, and self-discharge rate, the Li-ion battery, NaS battery, and VRF battery ESSs have superior performance over lead-acid battery and NiMH battery ESSs. Comprehensively considering the performance values of other sub-criteria, the Li-ion battery is the optimal battery ESS for wind-photovoltaic-energy storage combination exemplary projects.
6.2. Policy Implications
In view of the comprehensive evaluation on selecting a battery ESS to be applied to wind-photovoltaic-energy storage combination exemplary projects, some policy implications can be proposed based on the research results that may improve the applicability of battery ESSs and provide some references for decision-makers in related fields.
- (1)
- Break through technical bottle-necks, increase investment in technology research and development, and grasp independent intellectual property rights.
Currently, the core materials of the Li-ion battery and the VRF battery, which were the most optimal battery ESSs according to the comprehensive evaluation results, highly depend on imports that lead to high economic costs. Specifically, the import dependence of the Li-ion battery separators is more than 80%, and the import dependence of lithium hexafluorophosphate, which is the critical material of the Li-ion battery electrolyte, reaches 80%–90%. The perfluoro-ion-exchange membrane, which is the core component of the VRF battery, depends on import completely, the expense of which accounts for nearly 50% of economic costs of the VRF battery. Therefore, mastering independent intellectual property rights can reduce the dependence of core materials on imports, which can not only reduce costs, but also improve the quality of materials by independent research and development, so as to enhance the technology level of a battery ESS.
- (2)
- Develop the application of new materials to enhance the safety of battery ESSs.
The battery pack, as the hard core component of battery ESS, is a kind of high-energy component, which is potentially dangerous. With the increase of the specific capacity and specific power, the risk of causing accidents in the process of operation will also increase. Besides the external environment, the factors affecting the safety of a battery ESS include battery materials, design level, production quality, the length of service time, the effectiveness of safety measures, and the rationality of use. Among all the above factors, the most fundamental factor is battery materials. Constantly developing new and safe materials can fundamentally reduce the risk of battery ESSs in application, so as to improve the safety of these systems and guarantee the stability and reliability of electricity supply.
- (3)
- Analyze detailed data on demonstration projects and conduct appropriate financial subsidies and tax deduction and exemption policies.
China’s energy storage industry is still in the initial stage of industrial development, which is in the hard push development pattern that is a “technology push application and application push policy”. Taking a wind-energy storage combination exemplary project as an example, the application of a battery ESS increased 10%–20% of the utilization ratio of wind power and enhanced the electricity income per year by about 10–20 million yuan, but the annual depreciation cost of the battery was more than 30 million yuan. From the economic perspective, it is more economical to directly discard wind power than to apply a battery ESS. However, since the 13th Five Year Planning set the goal of reducing the rate of abandoned wind power to less than 5% in 2020 [55], it is necessary to apply ESS to absorb wind power. Considering the high cost of battery ESSs, national policy support and subsidies are needed. Towards the aim of avoiding the blind expansion of energy storage projects, we need to clearly define the subsidy quota and the subsidy objects before the policy is released. Based on this, data analysis for demonstration projects is an essential mission before formulating the policy.
7. Conclusions
The comprehensive evaluation regarding the selection of battery ESSs is necessary for battery ESSs application on wind-photovoltaic-energy storage combination exemplary projects. Therefore, this paper proposed an integrated comprehensive evaluation framework including a comprehensive evaluation index system establishment based on a fuzzy-Delphi model, the integration of objective weights as well as subjective weights determination based on the BWM and an entropy weight computation method, and a VIKOR comprehensive assessment model to select the optimal battery ESS. The significant conclusions of this research are given below:
- (1)
- Through using a fuzzy-Delphi model to choose sub-criteria, the comprehensive assessment index system was constructed from perspectives of technology, economy, and sociality containing 13 quantitative sub-criteria and 3 qualitative ones.
- (2)
- Through integrating subjective weights on the basis of the BWM and objective weights on an entropy weight determination method, energy saving and emission reduction effectiveness, safety, and self-discharge rate were the most critical sub-criteria, which synthetically considered experts’ opinions emphasizing the importance of environmental effects and power supply reliability, as well as the actual data highlighting the significance of technology and environmental impacts.
- (3)
- Through constructing the comprehensive evaluation model based on a VIKOR method, we could obtain that the Li-ion battery was the optimal battery ESS, the performance of NaS battery ESS was close to VRF battery ESS, and both of them were superior to lead-acid battery and NiMH battery ESSs.
- (4)
- Aiming at improving the comprehensive performance of battery ESSs and the applicability of battery ESSs in wind-photovoltaic-energy storage combination exemplary projects, some policy implications were put forward to provide some references for decision-makers, which are: (1) Break through technical bottle-necks, increase investment in technology research and development, and grasp independent intellectual property rights; (2) develop the application of new materials to enhance the safety of battery ESSs; and (3) analyze detailed data on demonstration projects, and conduct appropriate financial subsidies and tax deduction and exemption policies.
The application of battery ESSs is an effective way to eliminate the intermittent and fluctuation of renewable resources-based electricity generation and to decrease the discarding rate of wind power and solar power-based electricity generation. The integrated MCDM method proposed in this investigation demonstrates an effective way for assessing and ranking the performance of battery ESSs. However, there are still some places where improvement is needed. Since the index system contained three qualitative sub-criteria, and the performance values of them were determined by the opinions of experts, in the future research, we need to validate the values of safety, delay of power grid construction, and energy saving and emission reduction effectiveness with regard to different types of battery ESSs statistically. Additionally, we will also investigate detailed data on demonstration projects, and provide references for formulating appropriate financial subsidies and tax deduction and exemption policies for ESSs.
Author Contributions
S.G. and H.Z. (Huiru Zhao) put forward the structure of the study. H.Z. (Haoran Zhao) conducted the empirical analysis and completed the paper. S.G. modified the article.
Funding
This research was sponsored by the Major State Research and Development Program of China under Grant No.2016YFB0900501 and the Natural Science Foundation of China under Grant No. 71801092.
Acknowledgments
This research was sponsored by the Major State Research and Development Program of China under Grant No.2016YFB0900501 and the Natural Science Foundation of China under Grant No. 71801092.
Conflicts of Interest
The authors declare no conflict of interest.
Appendix A

Table A1.
Results of the comparisons for the best battery ESS over others for the safety sub-criterion (A), delay of power grid construction sub-criterion (B), and energy saving and emission reduction effectiveness sub-criterion (C).
Table A1.
Results of the comparisons for the best battery ESS over others for the safety sub-criterion (A), delay of power grid construction sub-criterion (B), and energy saving and emission reduction effectiveness sub-criterion (C).
| (A) Results of the comparisons for the best battery ESS over others for safety. | ||||||
| Expert Number | The Best Battery ESS | ES1 | ES2 | ES3 | ES4 | ES5 |
| 1 | ES5 | 9 | 2 | 4 | 6 | 1 |
| 2 | ES5 | 9 | 3 | 5 | 6 | 1 |
| 3 | ES5 | 9 | 5 | 3 | 7 | 1 |
| 4 | ES5 | 8 | 4 | 2 | 5 | 1 |
| 5 | ES5 | 8 | 2 | 6 | 4 | 1 |
| (B) Results of the comparisons for the best battery ESS over others for the delay of power grid construction. | ||||||
| Expert Number | The Best Battery ESS | ES1 | ES2 | ES3 | ES4 | ES5 |
| 1 | ES2 | 6 | 1 | 4 | 9 | 2 |
| 2 | ES2 | 2 | 1 | 5 | 9 | 7 |
| 3 | ES5 | 6 | 3 | 4 | 9 | 1 |
| 4 | ES2 | 9 | 1 | 4 | 6 | 2 |
| 5 | ES5 | 9 | 2 | 5 | 8 | 1 |
| (C) Results of the comparisons for the best battery ESS over others for energy saving and emission reduction effectiveness. | ||||||
| Expert Number | The Best Battery ESS | ES1 | ES2 | ES3 | ES4 | ES5 |
| 1 | ES2 | 9 | 1 | 2 | 7 | 5 |
| 2 | ES2 | 9 | 1 | 3 | 6 | 8 |
| 3 | ES2 | 7 | 1 | 2 | 9 | 6 |
| 4 | ES2 | 9 | 1 | 4 | 7 | 2 |
| 5 | ES2 | 6 | 1 | 5 | 9 | 3 |
Table A2.
Results of the comparisons for others over the worst battery ESS for safety sub-criterion (A), delay of power grid construction sub-criterion (B), and energy saving and emission reduction effectiveness sub-criterion (C).
Table A2.
Results of the comparisons for others over the worst battery ESS for safety sub-criterion (A), delay of power grid construction sub-criterion (B), and energy saving and emission reduction effectiveness sub-criterion (C).
| (A) Results of the comparisons for others over the worst battery ESS for safety | |||||
| Expert Number | 1 | 2 | 3 | 4 | 5 |
| The worst battery ESS | ES1 | ES1 | ES1 | ES1 | ES1 |
| ES1 | 1 | 1 | 1 | 1 | 1 |
| ES2 | 8 | 7 | 5 | 6 | 8 |
| ES3 | 6 | 5 | 7 | 8 | 4 |
| ES4 | 4 | 4 | 3 | 5 | 6 |
| ES5 | 9 | 9 | 9 | 8 | 8 |
| (B) Results of the comparisons for others over the worst battery ESS for the delay of power grid construction. | |||||
| Expert Number | 1 | 2 | 3 | 4 | 5 |
| The worst battery ESS | ES4 | ES4 | ES4 | ES1 | ES1 |
| ES1 | 4 | 8 | 4 | 1 | 1 |
| ES2 | 9 | 9 | 7 | 9 | 8 |
| ES3 | 6 | 5 | 6 | 6 | 5 |
| ES4 | 1 | 1 | 1 | 4 | 2 |
| ES5 | 8 | 3 | 9 | 8 | 9 |
| (C) Results of the comparisons for others over the worst battery ESS for energy saving and emission reduction effectiveness sub-criterion. | |||||
| Expert Number | 1 | 2 | 3 | 4 | 5 |
| The worst battery ESS | ES1 | ES1 | ES4 | ES1 | ES4 |
| ES1 | 1 | 1 | 3 | 1 | 4 |
| ES2 | 9 | 9 | 9 | 9 | 9 |
| ES3 | 8 | 7 | 8 | 6 | 5 |
| ES4 | 3 | 4 | 1 | 3 | 1 |
| ES5 | 5 | 2 | 4 | 8 | 7 |
Table A3.
Initial data of all sub-criteria of each ESS.
| Sub-Criteria | ES1 | ES2 | ES3 | ES4 | ES5 |
|---|---|---|---|---|---|
| Cell voltage (Volt) | 2 | 3.6 | 2.08 | 1.25 | 1.4 |
| Specific capacity (Watt-Hour/Kilogram) | 50 | 160 | 240 | 90 | 130 |
| Specific power (Watt/Kilogram) | 350 | 1200 | 230 | 1000 | 140 |
| Self-discharge rate (%) | 5 | 1 | 0 | 20 | 0 |
| Normal temperature cycle life (Number of times) | 1500 | 10,000 | 2500 | 500 | 13,000 |
| Maximum charge and discharge efficiency (%) | 80 | 95 | 90 | 70 | 80 |
| Safety | 0.043 | 0.206 | 0.168 | 0.107 | 0.476 |
| Investment cost (104 RMB yuan) | 1688 | 5946 | 4506 | 7386 | 8826 |
| Operation and maintenance cost (104 RMB yuan) | 85 | 298 | 226 | 369 | 441 |
| ESS profit (104 RMB yuan) | 998.6 | 2577.4 | 2177.3 | 2577.4 | 1797.1 |
| Increase revenue of combining wind plants to the power grid (104 RMB yuan) | 455 | 538 | 490 | 430 | 10 |
| Benefit of terminal recovery (104 RMB yuan) | 32.6 | 88.2 | 66.4 | 74.4 | 97.9 |
| Delay of power grid construction (104 RMB yuan) | 0.112 | 0.375 | 0.131 | 0.058 | 0.323 |
| Reduction of system reserve capacity (104 RMB yuan) | 3900 | 4800 | 4150 | 3560 | 4500 |
| Reduction of power grid loss (104 RMB yuan) | 733.4 | 1033.2 | 968.6 | 1033.2 | 904 |
| Energy saving and emission reduction effectiveness (104 RMB yuan) | 0.063 | 0.497 | 0.211 | 0.072 | 0.156 |
References
- British Petroleum Energy Outlook in 2018. Available online: https://www.bp.com/content/dam/bp/en/corporate/pdf/energy-economics/energy-outlook/bp-energy-outlook-2018.pdf (accessed on 10 June 2018).
- Trutnevyte, E. EXPANSE methodology for evaluating the economic potential of renewable energy from an energy mix perspective. Appl. Energy 2013, 111, 593–601. [Google Scholar] [CrossRef]
- Zhang, Y.; Lin, Z.; Liu, Q. Marine renewable energy in China: Current status and perspectives. Water Sci. Eng. 2014, 7, 288–305. [Google Scholar]
- Rahman, D.M.; Sakhawat, N.B.; Amin, R.; Ahmed, F. A study on renewable energy as a sustainable alternative for ensuring energy security in Bangladesh and related socio-economic aspects. Eng. J. 2012, 16, 47. [Google Scholar] [CrossRef]
- The BP World Energy Statistics Yearbook in 2017. Available online: https://www.bp.com/content/dam/bp/en/corporate/pdf/energy-economics/statistical-review-2017/bp-statistical-review-of-world-energy-2017-full-report.pdf (accessed on 10 June 2018).
- Aoki, I.; Tanikawa, R.; Hayasaki, N.; Matsumoto, M.; Enomoto, S. Development and operational status of wind power forecasting system. Electr. Eng. Jpn. 2014, 189, 22–29. [Google Scholar] [CrossRef]
- El-Thalji, I.; Liyanage, J.P. On the operation and maintenance practices of wind power asset: A status review and observations. J. Qual. Maint. Eng. 2012, 18, 232–266. [Google Scholar] [CrossRef]
- Sahu, B.K.; Hiloidhari, M.; Baruah, D.C. Global trend in wind power with special focus on the top five wind power producing countries. Renew. Sustain. Energy Rev. 2013, 19, 348–359. [Google Scholar] [CrossRef]
- Hernandez-Escobedo, Q.; Manzano-Agugliaro, F.; Gazquez-Parra, J.A.; Zapata-Sierra, A.J. Is the wind a periodical phenomenon? The case of Mexico. Renew. Sustain. Energy Rev. 2011, 15, 721–728. [Google Scholar] [CrossRef]
- Xu, Y.; Dong, Z.Y.; Xu, Z.; Meng, K.; Wong, P.K. An intelligent dynamic security assessment framework for power systems with wind power. IEEE Trans. Ind. Inf. 2012, 8, 995–1003. [Google Scholar] [CrossRef]
- Chen, H.; Cong, T.N.; Yang, W.; Tan, C.; Li, Y.; Ding, Y. Progress in electrical energy storage system: A critical review. Prog. Nat. Sci. 2009, 19, 291–312. [Google Scholar] [CrossRef]
- Luo, X.; Wang, J.; Dooner, M.; Clarke, J. Overview of current development in electrical energy storage technologies and the application potential in power system operation. Appl. Energy 2015, 137, 511–536. [Google Scholar] [CrossRef]
- Evans, A.; Strezov, V.; Evans, T.J. Assessment of utility energy storage options for increased renewable energy penetration. Renew. Sustain. Energy Rev. 2012, 16, 4141–4147. [Google Scholar] [CrossRef]
- Hall, P.J.; Bain, E.J. Energy-storage technologies and electricity generation. Energy Policy 2008, 36, 4352–4355. [Google Scholar] [CrossRef] [Green Version]
- Hadjipaschalis, I.; Poullikkas, A.; Efthimiou, V. Overview of current and future energy storage technologies for electric power applications. Renew. Sustain. Energy Rev. 2009, 13, 1513–1522. [Google Scholar] [CrossRef]
- Ibrahim, H.; Ilinca, A.; Perron, J. Energy storage systems—Characteristics and comparisons. Renew. Sustain. Energy Rev. 2008, 12, 1221–1250. [Google Scholar] [CrossRef]
- Baker, J. New technology and possible advances in energy storage. Energy Policy 2008, 36, 4368–4373. [Google Scholar] [CrossRef]
- Díaz-González, F.; Sumper, A.; Gomis-Bellmunt, O.; Villafafila-Robles, R. A review of energy storage technologies for wind power applications. Renew. Sustain. Energy Rev. 2012, 16, 2154–2171. [Google Scholar] [CrossRef]
- Karellas, S.; Tzouganatos, N. Comparison of the performance of compressed-air and hydrogen energy storage systems: Karpathos island case study. Renew. Sustain. Energy Rev. 2014, 29, 865–882. [Google Scholar] [CrossRef]
- Punys, P.; Baublys, R.; Kasiulis, E.; Vaisvila, A.; Pelikan, B.; Steller, J. Assessment of renewable electricity generation by pumped storage power plants in EU Member States. Renew. Sustain. Energy Rev. 2013, 26, 190–200. [Google Scholar] [CrossRef]
- Sebastián, R.; Alzola, R.P. Flywheel energy storage systems: Review and simulation for an isolated wind power system. Renew. Sustain. Energy Rev. 2012, 16, 6803–6813. [Google Scholar] [CrossRef]
- Bolund, B.; Bernhoff, H.; Leijon, M. Flywheel energy and power storage systems. Renew. Sustain. Energy Rev. 2007, 11, 235–258. [Google Scholar] [CrossRef]
- Dunn, B.; Kamath, H.; Tarascon, J.M. Electrical energy storage for the grid: a battery of choices. Science 2011, 334, 928–935. [Google Scholar] [CrossRef] [PubMed]
- Poullikkas, A. A comparative overview of large-scale battery systems for electricity storage. Renew. Sustain. Energy Rev. 2013, 27, 778–788. [Google Scholar] [CrossRef]
- Alotto, P.; Guarnieri, M.; Moro, F. Redox flow batteries for the storage of renewable energy: A review. Renew. Sustain. Energy Rev. 2014, 29, 325–335. [Google Scholar] [CrossRef]
- Ali, M.H.; Wu, B.; Dougal, R.A. An overview of SMES applications in power and energy systems. IEEE Trans. Sustain. Energy 2010, 1, 38–47. [Google Scholar] [CrossRef]
- Noriega, J.R.; Iyore, O.D.; Budime, C.; Gnade, B.; Vasselli, J. Characterization system for research on energy storage capacitors. Rev. Sci. Instrum. 2013, 84, 055109. [Google Scholar] [CrossRef] [PubMed]
- Steffen, B.; Weber, C. Efficient storage capacity in power systems with thermal and renewable generation. Energy Econ. 2013, 36, 556–567. [Google Scholar] [CrossRef]
- Rugolo, J.; Aziz, M.J. Electricity storage for intermittent renewable sources. Energy Environ. Sci. 2012, 5, 7151–7160. [Google Scholar] [CrossRef] [Green Version]
- Makarov, Y.V.; Du, P.; Kintner-Meyer, M.C.W.; Jin, C.; Illian, F.H. Sizing energy storage to accommodate high penetration of variable energy resources. IEEE Trans. Sustain. Energy 2012, 3, 34–40. [Google Scholar] [CrossRef]
- Barbour, E.; Wilson, I.A.G.; Bryden, I.G.; McGregor, G.P.; Mulheran, A.P.; Hall, J.P. Towards an objective method to compare energy storage technologies: development and validation of a model to determine the upper boundary of revenue available from electrical price arbitrage. Energy Environ. Sci. 2012, 5, 5425–5436. [Google Scholar] [CrossRef]
- Evans, L.; Guthrie, G.; Lu, A. The role of storage in a competitive electricity market and the effects of climate change. Energy Econ. 2013, 36, 405–418. [Google Scholar] [CrossRef]
- Brekken, T.K.A.; Yokochi, A.; Von Jouanne, A.; Yen, Z.Z.; Hapke, M.H.; Halamay, A.D. Optimal energy storage sizing and control for wind power applications. IEEE Trans. Sustain. Energy 2011, 2, 69–77. [Google Scholar] [CrossRef]
- Zhang, H. Research on the Economic Evaluation Method of Energy Storage System Used for Peak and Valley Cutting in Distribution Network. Master’s Thesis, North China Electric Power University, Beijing, China, 2014. [Google Scholar]
- Das, T.; Krishnan, V.; McCalley, J.D. Assessing the benefits and economics of bulk energy storage technologies in the power grid. Appl. Energy 2015, 139, 104–118. [Google Scholar] [CrossRef]
- Ren, J.; Ren, X. Sustainability ranking of energy storage technologies under uncertainties. J. Clean. Prod. 2018, 170, 1387–1398. [Google Scholar] [CrossRef]
- Tan, Z.; Ju, L.; Li, H.; Li, J.; Zhang, H. A two-stage scheduling optimization model and solution algorithm for wind power and energy storage system considering uncertainty and demand response. Int. J. Electr. Power Energy Syst. 2014, 63, 1057–1069. [Google Scholar] [CrossRef]
- Di Zio, S.; Maretti, M. Acceptability of energy sources using an integration of the Delphi method and the analytic hierarchy process. Qual. Quant. 2014, 48, 2973–2991. [Google Scholar] [CrossRef]
- Chang, I.S.; Tsujimura, Y.; Gen, M.; Tozawa, T. An efficient approach for large scale project planning based on fuzzy Delphi method. Fuzzy Sets Syst. 1995, 76, 277–288. [Google Scholar] [CrossRef]
- Kuo, Y.F.; Chen, P.C. Constructing performance appraisal indicators for mobility of the service industries using Fuzzy Delphi Method. Expert Syst. Appl. 2008, 35, 1930–1939. [Google Scholar] [CrossRef]
- Zhao, H.; Li, N. Evaluating the performance of thermal power enterprises using sustainability balanced scorecard, fuzzy Delphic and hybrid multi-criteria decision making approaches for sustainability. J. Clean. Prod. 2015, 108, 569–582. [Google Scholar] [CrossRef]
- Jafari, A.; Jafarian, M.; Zareei, A.; Zaerpour, F. Using fuzzy Delphi method in maintenance strategy selection problem. J. Uncertain Syst. 2008, 2, 289–298. [Google Scholar]
- Rezaei, J. Best-worst multi-criteria decision-making method. Omega 2015, 53, 49–57. [Google Scholar] [CrossRef]
- Rezaei, J. Best-worst multi-criteria decision-making method: Some properties and a linear model. Omega 2016, 64, 126–130. [Google Scholar] [CrossRef]
- Shemshadi, A.; Shirazi, H.; Toreihi, M.; Tarokh, M.J. A fuzzy VIKOR method for supplier selection based on entropy measure for objective weighting. Expert Syst. Appl. 2011, 38, 12160–12167. [Google Scholar] [CrossRef]
- Zhao, H.; Zhao, H.; Guo, S. Evaluating the comprehensive benefit of eco-industrial parks by employing multi-criteria decision making approach for circular economy. J. Clean. Prod. 2017, 142, 2262–2276. [Google Scholar] [CrossRef]
- Opricovic, S. Multicriteria optimization of civil engineering systems. Faculty Civ. Eng. 1998, 2, 5–21. [Google Scholar]
- Opricovic, S.; Tzeng, G.H. Multicriteria planning of post-earthquake sustainable reconstruction. Comput. Aided Civ. Infrastruct. Eng. 2002, 17, 211–220. [Google Scholar] [CrossRef]
- Kondoh, J.; Ishii, I.; Yamaguchi, H.; Murata, A.; Otani, K.; Sakuta, K.; Higuchi, N.; Sekine, S.; Kamimoto, M. Electrical energy storage systems for energy networks. Energy Convers. Manag. 2000, 41, 1863–1874. [Google Scholar] [CrossRef]
- Kawakami, N.; Iijima, Y.; Fukuhara, M.; Bando, M.; Sakanaka, Y.; Ogawa, K.; Matsuda, T. Development and field experiences of stabilization system using 34MW NAS batteries for a 51MW wind farm. In Proceedings of the 2010 IEEE International Symposium on Industrial Electronics (ISIE), Bari, Italy, 4–7 July 2010. [Google Scholar]
- Zhu, W.H.; Zhu, Y.; Davis, Z.; Tatarchuk, B.J. Energy efficiency and capacity retention of Ni–MH batteries for storage applications. Appl. Energy 2013, 106, 307–313. [Google Scholar] [CrossRef]
- Yang, Z.; Zhang, J.; Kintner-Meyer, M.C.W.; Lu, X.; Choi, D.; Lemmon, J.P.; Liu, J. Electrochemical energy storage for green grid. Chem. Rev. 2011, 111, 3577–3613. [Google Scholar] [CrossRef] [PubMed]
- Leung, P.; Li, X.; De León, C.P.; Berlouis, L.; Low, C.T.J.; Walsh, F.C. Progress in redox flow batteries, remaining challenges and their applications in energy storage. RSC Adv. 2012, 2, 10125–10156. [Google Scholar] [CrossRef]
- Zakeri, B.; Syri, S. Electrical energy storage systems: A comparative life cycle cost analysis. Renew. Sustain. Energy Rev. 2015, 42, 569–596. [Google Scholar] [CrossRef]
- 13th Five Year Planning. Available online: http://www.moa.gov.cn/zwllm/zcfg/flfg/201511/t20151103_4888538.htm (accessed on 20 June, 2018).
Figure 1.
The procedure of the fuzzy-Delphi methodology.

Figure 2.
The framework of the proposed integrated MCDM model for the comprehensive evaluation of battery ESSs.
Figure 2.
The framework of the proposed integrated MCDM model for the comprehensive evaluation of battery ESSs.

Figure 3.
Comprehensive assessment index system utilizing the fuzzy-Delphi model.

Table 1.
Consistency Indicator (CI).
| 1 | 2 | 3 | 4 | 5 | 6 | 7 | 8 | 9 | |
| CI (max) | 0.00 | 0.44 | 1.00 | 1.63 | 2.30 | 3.00 | 3.73 | 4.47 | 5.23 |
Table 2.
Results of the fuzzy-Delphi method.
| Perspectives | Original Sub-Criteria | Conservative Value | Optimistic Value | Mi−Zi | Consistent Value | ||||
|---|---|---|---|---|---|---|---|---|---|
| Gi | |||||||||
| Technology | Cell voltage | 4 | 5.45 | 7 | 6 | 8.34 | 10 | 3.55 | 6.60 > 5.2 |
| Storage capacity | 1 | 2.26 | 4 | 5 | 5.02 | 7 | 5.74 | 3.64 < 5.2 | |
| Charge and discharge frequency | 2 | 3.16 | 5 | 5 | 5.97 | 8 | 4.84 | 4.57 < 5.2 | |
| Discharge time | 1 | 3.33 | 6 | 6 | 6.16 | 9 | 5.67 | 4.75 < 5.2 | |
| Normal temperature cycle life | 5 | 6.24 | 8 | 7 | 8.66 | 10 | 2.76 | 7.49 > 5.2 | |
| Maximum charge and discharge efficiency | 4 | 6.02 | 8 | 7 | 8.79 | 10 | 2.98 | 7.47 > 5.2 | |
| Specific capacity | 5 | 7.03 | 9 | 8 | 9.05 | 10 | 1.97 | 8.35 > 5.2 | |
| Specific power | 3 | 6.34 | 9 | 6 | 7.68 | 20 | 10.66 | 7.16 > 5.2 | |
| Self-discharge rate | 4 | 7.12 | 8 | 7 | 8.23 | 10 | 1.88 | 7.58 > 5.2 | |
| Specific energy | 1 | 2.56 | 4 | 4 | 5.48 | 7 | 4.44 | 4.02 < 5.2 | |
| Safety | 5 | 6.74 | 8 | 8 | 9.33 | 10 | 3.26 | 8.04 > 5.2 | |
| Economy | Investment cost | 4 | 6.02 | 8 | 7 | 8.23 | 10 | 2.98 | 7.38 > 5.2 |
| Battery capacity cost | 2 | 3.21 | 5 | 7 | 7.16 | 8 | 6.79 | 5.19 < 5.2 | |
| Battery power cost | 2 | 2.43 | 4 | 5 | 6.32 | 8 | 6.57 | 4.38 < 5.2 | |
| Operation and maintenance cost | 4 | 5.68 | 7 | 7 | 7.89 | 10 | 4.32 | 6.79 > 5.2 | |
| Cost recovery time | 1 | 2.72 | 4 | 5 | 5.79 | 7 | 5.28 | 4.26 < 5.2 | |
| ESS profit | 5 | 6.58 | 8 | 8 | 8.14 | 10 | 3.42 | 7.36 > 5.2 | |
| Increase revenue of combining wind plants to the power grid | 1 | 5.79 | 6 | 8 | 8.22 | 10 | 6.21 | 7.01 > 5.2 | |
| Benefit of terminal recovery | 1 | 4.66 | 8 | 8 | 9.64 | 10 | 5.34 | 7.15 > 5.2 | |
| Sociality | Delay of power grid construction | 4 | 5.79 | 7 | 7 | 8.31 | 10 | 4.21 | 7.05 > 5.2 |
| Reduction of system reserve capacity | 4 | 4.58 | 7 | 7 | 8.14 | 9 | 4.42 | 6.36 > 5.2 | |
| Reduction of power grid loss | 1 | 4.25 | 6 | 8 | 8.61 | 10 | 7.75 | 6.43>5.2 | |
| Energy saving and emission reduction effectiveness | 2 | 5.55 | 8 | 7 | 8.73 | 10 | 3.45 | 7.41>5.2 | |
Table 3.
The best and worst battery ESSs of each qualitative sub-criterion considering the views of five experts.
Table 3.
The best and worst battery ESSs of each qualitative sub-criterion considering the views of five experts.
| Subjective Sub-Criteria | Expert Number | 1 | 2 | 3 | 4 | 5 |
|---|---|---|---|---|---|---|
| Safety | The best battery ESS | ES5 | ES5 | ES5 | ES5 | ES5 |
| The worst battery ESS | ES1 | ES1 | ES1 | ES1 | ES1 | |
| Delay of power grid construction | The best battery ESS | ES2 | ES2 | ES5 | ES2 | ES5 |
| The worst battery ESS | ES4 | ES4 | ES4 | ES1 | ES1 | |
| Energy saving and emission reduction effectiveness | The best battery ESS | ES2 | ES2 | ES2 | ES2 | ES2 |
| The worst battery ESS | ES1 | ES1 | ES4 | ES1 | ES4 |
Table 4.
Average performance values of selected battery ESSs of corresponding qualitative sub-criterion.
Table 4.
Average performance values of selected battery ESSs of corresponding qualitative sub-criterion.
| Battery Energy Storage System | Safety | Delay of Power Grid Construction | Energy Saving and Emission Reduction Effectiveness |
|---|---|---|---|
| Lead-acid battery | 0.043 | 0.112 | 0.063 |
| Li-ion battery | 0.206 | 0.375 | 0.497 |
| NaS battery | 0.168 | 0.131 | 0.211 |
| NiMH battery | 0.107 | 0.058 | 0.072 |
| VRF battery | 0.476 | 0.323 | 0.156 |
| Consistency Ratio | 0.022 | 0.019 | 0.019 |
Table 5.
The best and worst sub-criteria determined by experts.
| Expert Number | The Best Sub-Criteria | The Worst Sub-Criteria |
|---|---|---|
| 1 | Investment cost (C8) | Reduction of power grid loss (C15) |
| 2 | Normal temperature cycle life (C5) | Operation and maintenance cost (C9) |
| 3 | Energy saving and emission reduction effectiveness (C16) | Specific capacity (C2) |
| 4 | Safety (C7) | Operation and maintenance cost (C9) |
| 5 | Energy saving and emission reduction effectiveness (C16) | Self-discharge rate (C4) |
Table 6.
Results of the best sub-criterion over others.
| Expert Number | 1 | 2 | 3 | 4 | 5 |
|---|---|---|---|---|---|
| The best sub-criteria | C8 | C5 | C16 | C7 | C16 |
| Cell voltage | 7 | 3 | 9 | 6 | 9 |
| Specific capacity | 6 | 3 | 9 | 6 | 8 |
| Specific power | 7 | 3 | 8 | 5 | 8 |
| Self-discharge rate | 6 | 3 | 8 | 5 | 9 |
| Normal temperature cycle life | 4 | 1 | 7 | 4 | 7 |
| Maximum charge and discharge efficiency | 4 | 1 | 7 | 4 | 7 |
| Safety | 3 | 1 | 6 | 1 | 2 |
| Investment cost | 1 | 9 | 5 | 9 | 6 |
| Operation and maintenance cost | 1 | 9 | 5 | 9 | 6 |
| ESS profit | 2 | 7 | 3 | 7 | 3 |
| Increase revenue of combining wind plants to the power grid | 2 | 8 | 4 | 8 | 3 |
| Benefit of terminal recovery | 2 | 8 | 4 | 8 | 3 |
| Delay of power grid construction | 8 | 5 | 2 | 2 | 4 |
| Reduction of system reserve capacity | 8 | 5 | 2 | 2 | 4 |
| Reduction of power grid loss | 9 | 6 | 2 | 3 | 5 |
| Energy saving and emission reduction effectiveness | 7 | 4 | 1 | 1 | 1 |
Table 7.
Results of others over the worst sub-criterion.
| Expert Number | 1 | 2 | 3 | 4 | 5 |
|---|---|---|---|---|---|
| The worst sub-criteria | C15 | C9 | C2 | C9 | C4 |
| Cell voltage | 3 | 7 | 1 | 4 | 1 |
| Specific capacity | 4 | 7 | 1 | 4 | 2 |
| Specific power | 3 | 7 | 2 | 5 | 2 |
| Self-discharge rate | 4 | 7 | 2 | 5 | 1 |
| Normal temperature cycle life | 6 | 9 | 3 | 6 | 3 |
| Maximum charge and discharge efficiency | 6 | 9 | 3 | 6 | 3 |
| Safety | 7 | 9 | 4 | 9 | 8 |
| Investment cost | 9 | 1 | 5 | 1 | 4 |
| Operation and maintenance cost | 9 | 1 | 5 | 1 | 4 |
| ESS profit | 8 | 3 | 7 | 3 | 7 |
| Increase revenue of combining wind plants to the power grid | 8 | 2 | 6 | 2 | 7 |
| Benefit of terminal recovery | 8 | 2 | 6 | 2 | 7 |
| Delay of power grid construction | 2 | 5 | 8 | 8 | 6 |
| Reduction of system reserve capacity | 2 | 5 | 8 | 8 | 6 |
| Reduction of power grid loss | 1 | 4 | 8 | 7 | 5 |
| Energy saving and emission reduction effectiveness | 3 | 6 | 9 | 9 | 9 |
Table 8.
Subjective weights and consistency ratios based on five experts.
| Sub-Criteria | E1 | E2 | E3 | E4 | E5 | Mean Weight |
|---|---|---|---|---|---|---|
| Cell voltage | 0.028 | 0.064 | 0.025 | 0.035 | 0.027 | 0.036 |
| Specific capacity | 0.033 | 0.064 | 0.016 | 0.035 | 0.019 | 0.033 |
| Specific power | 0.028 | 0.064 | 0.028 | 0.042 | 0.031 | 0.039 |
| Self-discharge rate | 0.033 | 0.064 | 0.028 | 0.042 | 0.027 | 0.039 |
| Normal temperature cycle life | 0.049 | 0.158 | 0.032 | 0.052 | 0.035 | 0.065 |
| Maximum charge and discharge efficiency | 0.049 | 0.158 | 0.032 | 0.052 | 0.035 | 0.065 |
| Safety | 0.067 | 0.158 | 0.038 | 0.172 | 0.124 | 0.112 |
| Investment cost | 0.162 | 0.022 | 0.045 | 0.023 | 0.041 | 0.059 |
| Operation and maintenance cost | 0.162 | 0.014 | 0.045 | 0.015 | 0.041 | 0.055 |
| ESS profit | 0.099 | 0.028 | 0.075 | 0.030 | 0.083 | 0.063 |
| Increase revenue of combining wind plants to the power grid | 0.099 | 0.024 | 0.056 | 0.026 | 0.083 | 0.058 |
| Benefit of terminal recovery | 0.099 | 0.024 | 0.056 | 0.026 | 0.083 | 0.058 |
| Delay of power grid construction | 0.025 | 0.039 | 0.113 | 0.104 | 0.062 | 0.069 |
| Reduction of system reserve capacity | 0.025 | 0.039 | 0.113 | 0.104 | 0.062 | 0.069 |
| Reduction of power grid loss | 0.014 | 0.032 | 0.113 | 0.070 | 0.049 | 0.056 |
| Energy saving and emission reduction effectiveness | 0.028 | 0.048 | 0.185 | 0.172 | 0.198 | 0.126 |
| 0.035 | 0.034 | 0.040 | 0.037 | 0.050 | 0.039 | |
| Consistency Ratio | 0.007 | 0.007 | 0.008 | 0.007 | 0.009 | 0.008 |
Note: The five experts are expressed as E1, E2, E3, E4, and E5.
Table 9.
Normalization results of performance values for five battery ESSs.
| Sub-Criteria | Lead-Acid Battery | Li-Ion Battery | NaS Battery | NiMH Battery | VRF Battery |
|---|---|---|---|---|---|
| Cell voltage | 0.319 | 1 | 0.353 | 0 | 0.064 |
| Specific capacity | 0 | 0.579 | 1 | 0.211 | 0.421 |
| Specific power | 0.198 | 1 | 0.085 | 0.811 | 0 |
| Self-discharge rate | 0.750 | 0.950 | 1 | 0 | 1 |
| Normal temperature cycle life | 0.080 | 0.760 | 0.160 | 0 | 1 |
| Maximum charge and discharge efficiency | 0.400 | 1 | 0.800 | 0 | 0.400 |
| Safety | 0 | 0.376 | 0.290 | 0.149 | 1 |
| Investment cost | 1 | 0.403 | 0.605 | 0.202 | 0 |
| Operation and maintenance cost | 1 | 0.402 | 0.604 | 0.202 | 0 |
| ESS profit | 0 | 1 | 0.747 | 1 | 0.506 |
| Increase revenue of combining wind plants to the power grid | 0.843 | 1 | 0.909 | 0.795 | 0 |
| Benefit of terminal recovery | 0 | 0.851 | 0.518 | 0.640 | 1 |
| Delay of power grid construction | 0.172 | 1 | 0.231 | 0 | 0.835 |
| Reduction of system reserve capacity | 0.274 | 1 | 0.476 | 0 | 0.758 |
| Reduction of power grid loss | 0 | 1 | 0.785 | 1 | 0.569 |
| Energy saving and emission reduction effectiveness | 0 | 1 | 0.342 | 0.021 | 0.214 |
Table 10.
Objective weights of all sub-criteria based on an entropy weight determination method.
| Sub-Criteria | Weights |
|---|---|
| Cell voltage | 0.078 |
| Specific capacity | 0.053 |
| Specific power | 0.078 |
| Self-discharge rate | 0.137 |
| Normal temperature cycle life | 0.082 |
| Maximum charge and discharge efficiency | 0.044 |
| Safety | 0.067 |
| Investment cost | 0.054 |
| Operation and maintenance cost | 0.054 |
| ESS profit | 0.038 |
| Increase revenue of combining wind plants to the power grid | 0.033 |
| Benefit of terminal recovery | 0.037 |
| Delay of power grid construction | 0.066 |
| Reduction of system reserve capacity | 0.047 |
| Reduction of power grid loss | 0.036 |
| Energy saving and emission reduction effectiveness | 0.097 |
Table 11.
The integrated weights for sub-criteria.
| Sub-Criteria | Objective Weights | Subjective Weights | Integrated Weights |
|---|---|---|---|
| Cell voltage | 0.078 | 0.036 | 0.057 |
| Specific capacity | 0.053 | 0.033 | 0.043 |
| Specific power | 0.078 | 0.039 | 0.058 |
| Self-discharge rate | 0.137 | 0.039 | 0.088 |
| Normal temperature cycle life | 0.082 | 0.065 | 0.074 |
| Maximum charge and discharge efficiency | 0.044 | 0.065 | 0.055 |
| Safety | 0.067 | 0.112 | 0.089 |
| Investment cost | 0.054 | 0.059 | 0.056 |
| Operation and maintenance cost | 0.054 | 0.055 | 0.055 |
| ESS profit | 0.038 | 0.063 | 0.05 |
| Increase revenue of combining wind plants to the power grid | 0.033 | 0.058 | 0.045 |
| Benefit of terminal recovery | 0.037 | 0.058 | 0.047 |
| Delay of power grid construction | 0.066 | 0.069 | 0.067 |
| Reduction of system reserve capacity | 0.047 | 0.069 | 0.058 |
| Reduction of power grid loss | 0.036 | 0.056 | 0.046 |
| Energy saving and emission reduction effectiveness | 0.097 | 0.126 | 0.111 |
Table 12.
Results of Sj, Rj, and Qj of five battery ESSs.
| Alternatives | Sj | Rj | Qj |
|---|---|---|---|
| Lead-acid battery | 0.700 | 0.111 | 0.963 |
| Li-ion battery | 0.169 | 0.056 | 0 |
| NaS battery | 0.475 | 0.073 | 0.425 |
| NiMH battery | 0.743 | 0.109 | 0.979 |
| VRF battery | 0.483 | 0.087 | 0.559 |
Table 13.
The rankings of Sj, Rj, and Qj of five battery ESSs.
| Alternatives | Sj | Rj | Qj |
|---|---|---|---|
| Lead-acid battery | 4 | 5 | 4 |
| Li-ion battery | 1 | 1 | 1 |
| NaS battery | 2 | 2 | 2 |
| NiMH battery | 5 | 4 | 5 |
| VRF battery | 3 | 3 | 3 |
© 2018 by the authors. Licensee MDPI, Basel, Switzerland. This article is an open access article distributed under the terms and conditions of the Creative Commons Attribution (CC BY) license (http://creativecommons.org/licenses/by/4.0/).
Share and Cite
MDPI and ACS Style
Zhao, H.; Guo, S.; Zhao, H. Comprehensive Performance Assessment on Various Battery Energy Storage Systems. Energies 2018, 11, 2841. https://doi.org/10.3390/en11102841
AMA Style
Zhao H, Guo S, Zhao H. Comprehensive Performance Assessment on Various Battery Energy Storage Systems. Energies. 2018; 11(10):2841. https://doi.org/10.3390/en11102841
Chicago/Turabian StyleZhao, Haoran, Sen Guo, and Huiru Zhao. 2018. "Comprehensive Performance Assessment on Various Battery Energy Storage Systems" Energies 11, no. 10: 2841. https://doi.org/10.3390/en11102841
Note that from the first issue of 2016, this journal uses article numbers instead of page numbers. See further details here.