Assessing the Macro-Economic Benefit of Installing a Farm of Oscillating Water Columns in Scotland and Portugal


1
School of Engineering, Institute for Energy Systems, The University of Edinburgh, Edinburgh EH9 3DW, UK
2
WavEC Offshore Renewables, 1400-119 Lisboa, Portugal
*
Author to whom correspondence should be addressed.
Energies 2018, 11(10), 2824; https://doi.org/10.3390/en11102824
Submission received: 14 August 2018
/
Revised: 27 September 2018
/
Accepted: 16 October 2018
/
Published: 19 October 2018
(This article belongs to the Special Issue Offshore Renewable Energy: Ocean Waves, Tides and Offshore Wind)
Abstract
:The nascent wave energy sector has the potential to contribute significantly to global renewables targets, yet at present there are no proven commercially viable technologies. Macro-economic assessment is seldom used to assess wave energy projects, yet can provide insightful information on the wider economic benefits and can be used in conjunction with techno-economic analysis to inform policy makers, investors and funding bodies. Herein, we present a coupled techno–macro-economic model, which is used to assess the macro-economic benefit of installing a 5.25 MW farm of oscillating water column wave energy devices at two locations: Orkney in Scotland and Leixoes in Portugal. Through an input-output analysis, the wide-reaching macro-economic benefit of the prospective projects is highlighted; evidenced by the finding that all 29 industry sectors considered are either directly or indirectly stimulated by the project for both locations. Peak annual employment is expected to be 420 and 190 jobs in Portugal and Scotland respectively during the combined installation and manufacturing stage, with an associated peak annual GVA of over €16.6 m and €12.8 m. The discrepancies between the two locations is concluded to largely be a result of the site-specific attributes of the farm locations: specifically, increased water depth and distance to shore for the Portuguese site, resulting in higher costs associated with mooring and electrical cables and vessels. The insights gained through the presented results demonstrate the merit of macro-economic analysis for understanding the wider economic benefit of wave energy projects, while providing an understanding over key physical factors which will dominate estimated effects.
1. Introduction
Wave energy has the potential to provide copious amounts of clean, safe and reliable renewable energy [1], yet at present remains a largely under-explored resource. The oceans span 71% of the surface of the Earth [2], and are associated with a total global wave energy potential of around 2.11 TW [3]. At present, however, the development of Wave Energy Converter (WEC) devices to exploit this resource are still in the early stages and are not currently commercially viable. It has been suggested that almost a thousand WEC prototypes have been invented [4], yet at present most full-scale devices are still in the prototype stage and, as such, currently represent a significant risk to investors. By comparison, the wind power sector is now a mature industry built on decades of cumulative research efforts and optimization; resulting in reliable devices which attract consistent investment [5]. Although the rapid deployment of wind farms is helping countries approach their renewables targets, recent studies suggest that many European countries will still fall short of meeting them [6]. In future, the contribution from other technologies, such as WECs, will be important for both meeting these targets and ensuring diversification of intermittent renewable sources supplying the grid.
A possible solution to improving the invest-ability of wave energy is through thorough economic analysis of potential farms of WEC devices, enabling device design to be driven from predicted economic performance. One of the most widely used and effective methods is the techno-economic model [7]. Techno-economic analysis is a cost-benefit technique used to evaluate the cost and performance of a technology. It combines process modelling and engineering design with economic evaluation, which provides a way to assess the impact of different configurations and research breakthroughs on the economic viability of the system under analysis. For wave energy, this will include the estimated energy production for a given deployment location, while accounting for expenditure associated with materials and manufacture, statistically expected repairs and maintenance, and man-hours. This method allows for a comprehensive understanding to be gained of the areas most critical to obtaining good economic performance, and can be used to inform future design changes. Additionally if a techno-economic model indicates good Return On Invested Capital (ROIC) then it may be used to attract investment. Good examples highlighting the power of techno-economic assessment of wave energy can be found in [8,9], whereby multiple WECs are assessed in a variety of locations. This type of analysis can hence be used to identify the the most favourable device–location combination, along with providing a breakdown of where the costs lie, and hence, key areas for improvement. Other examples of techno-economic analysis of wave energy projects can be found in [7,10], while an informative review of the state-of-the-art in economic and socio-economic assessment of offshore renewables can be found in [11].
The partial limitation of the techno-economic model is the fact that the investment is assessed in its own context, separate from the rest of the market. This economic assessment, made in isolation from the industries affected, means that the wider-reaching effects are ignored. This negligence is in part a result of decades of scorn towards macro-economics which begun in the 1970s and caused a shift among the academic and business sectors in favour of micro-economics [12]. Yet, this self-imposed constraint removes a useful argument to be made to investors and policy makers, especially those closely working with governments, international organizations and local markets. These organizations are interested in part on the possible impact on the populace in making of financial decisions—which can be provided by a macro-economic assessment [11]. It incorporates the socio-economic influences on the studied economies based on the underlying market relations e.g., outsourcing tendencies, workforce available and ongoing internal structures [13]. Key outputs of macro-economic models include include total jobs created or Gross Value Added (GVA) associated with the proposed project [14]. For assessing wave energy farms, macro-economic methods may be particularly favourable as the total environmental and economic benefit can be used to inform decision making. This may be particularly relevant for policy makers when deciding the appropriate level of subsidy to stimulate the sector [15].
Several macro-economic studies have been carried out on the effect of renewables including those focusing on the impact of wind energy (e.g., [16,17]) and marine energy on regional economies. Work done by SQW Consulting [18] assesses the macro-economics of the Aquamarine Power’s Oyster device focusing on implications on employment in Orkney. In [19], the macro-economics associated with a farm of heaving buoys is assessed, using a reverse Levelized Cost of Energy (LCOE) approach with device characteristics and project spend derived from literature. In both [20] and [13] the macro-economic impact of large-scale deployment of marine renewables in Scotland is assessed (3 GW and 1.6 GW respectively) using Computable General Equilibrium (GCE) and Input-Output (IO) models [14] to provide insightful results. The inputs to drive the models described in the aforementioned publications, as is typical for macro-economic assessment, tend not to be based on a detailed techno-economic analysis. This, in addition to introducing additional uncertainty in the model results, omits some of the complexity of the expenditure and the associated consequences on the regional economic sectors.
This paper details the development of a coupled techno-macro-economic model, which is subsequently used to assess the macro-economic influence of a farm of Oscillating Water Column (OWC) devices if installed in chosen locations in Scotland and Portugal. This techno-economic aspect of the presented model includes detailed analysis of location specific expenditure such as device installation and maintenance, resource use, along with the nature of the labour required for completion. This data is directly connected to the expenditure on human resources, agreements (like rental of equipment) and supply chain management (e.g., logistics), which is intertwined with local economic profiles. Local economies offer their unique enterprise range and employee variety. These factors impact the costs of hire and transport, as well as times required for manufacture and installation—local businesses are closest to the site, have an established regional network and provide a service with knowledge of external competition. The combination of a comprehensive techno-economic model and up-to-date macro-economic profile will result in an IO model that effectively incorporates both technological nuances as well as regional impacts.
This article will describe the aforementioned IO modelling approach, carried out as part of Wave Energy Transition to Future by Evolution of Engineering and Technology (WETFEET) project [21], which is a part of European Union’s Framework Horizon 2020 (H2020). This project is detailed further in Section 2.1. The remaining sections are laid out as follows. First, the methodology and theoretical overview is given with emphasis on the information flow and assumptions made in Section 2. Results of the IO modelling work are presented for both Scotland and Portugal in Section 3. Additional discussion is carried out in Section 4, prior to offering concluding remarks in Section 5.
2. Methodology
This section provides information about the WETFEET project (Section 2.1), the farm of OWC devices modelled (Section 2.2) and the specific locations chosen for analysis (Section 2.3), before detailing the Input-Output modelling approach and implementation in Section 2.4 and Section 2.5 respectively.
2.1. WETFEET H2020 Project
WETFEET is a project participant from May 2015 under a grant number 641,334, funded by H2020 EU.3.3.5. programme for New Knowledge and Technologies established in 2013 [22]. It addresses the issues found with implementation of wave energy technologies through an analysis of identified features of critical impact: referred as ‘breakthrough features’ in project’s chosen terminology. Its main goal is to provide information that will assist in improving the wave energy technology performance in hopes of accelerating progress in the sector. The potential design breakthroughs identified for the OWC device are as follows [21]:
- Survivability: Assessed by device submergence under bad weather conditions at sea.
- Operation and Maintenance: Assessed by continuous submergence and adjustment of elements and strategies.
- Power Take-Off (PTO): Assessed by the evaluation of new PTO options and their development via dielectric membrane, opposed to standard electromechanical approach.
- Array: Assessed by distributing the connections and seabed attachments between multiple devices.
- Performance: Assessed by the functionality of an experiment involving negative spring (NS) for OWC.
These features were refined by participating member organizations. In this paper the most promising breakthrough design variant, when assessed in terms of techno-economics, was chosen for macro-economic assessment. This breakthrough, the “Negative Spring” (NS) variant—addressing the performance improvement—is used for modelling the farm of OWC devices in both Scotland and Portugal.
2.2. The Farm of Oscillating Water Column WECs
A detailed description of the OWC device and NS design variant is available in [23]. Specifics of the farm of devices chosen for the modelling work is provided here.
2.2.1. Farm Design
The Oscillating Water Column Device
Oscillating water column devices, first reported in 1978 [24], extract energy by exploiting the moving air-water interface introduced by wave action. Air turbines are subsequently used to extract the energy. Many OWC designs are fixed structures integrated into the natural coastline or breakwaters; however, the OWC modelled in this work is floating: categorized as a floating spar buoy OWC device [23]. One of the main advantages of a floating device is the ability to be deployed offshore in areas with larger wave resource, with the added benefit of reducing the visual impact of the farm; and hence likely opposition to its installation.
Farm Size
Consistent with the WETFEET project, a fixed farm size has been used throughout the analysis: 5.25 MW. For the farm of 150 kW OWC WECs this means arrays of 35 devices are considered. A multiple of 5 devices was chosen in order to allow a comparison with other design variants assessed as part of the WETFEET project; specifically the “shared moorings” breakthrough which couples five devices in a compact array.
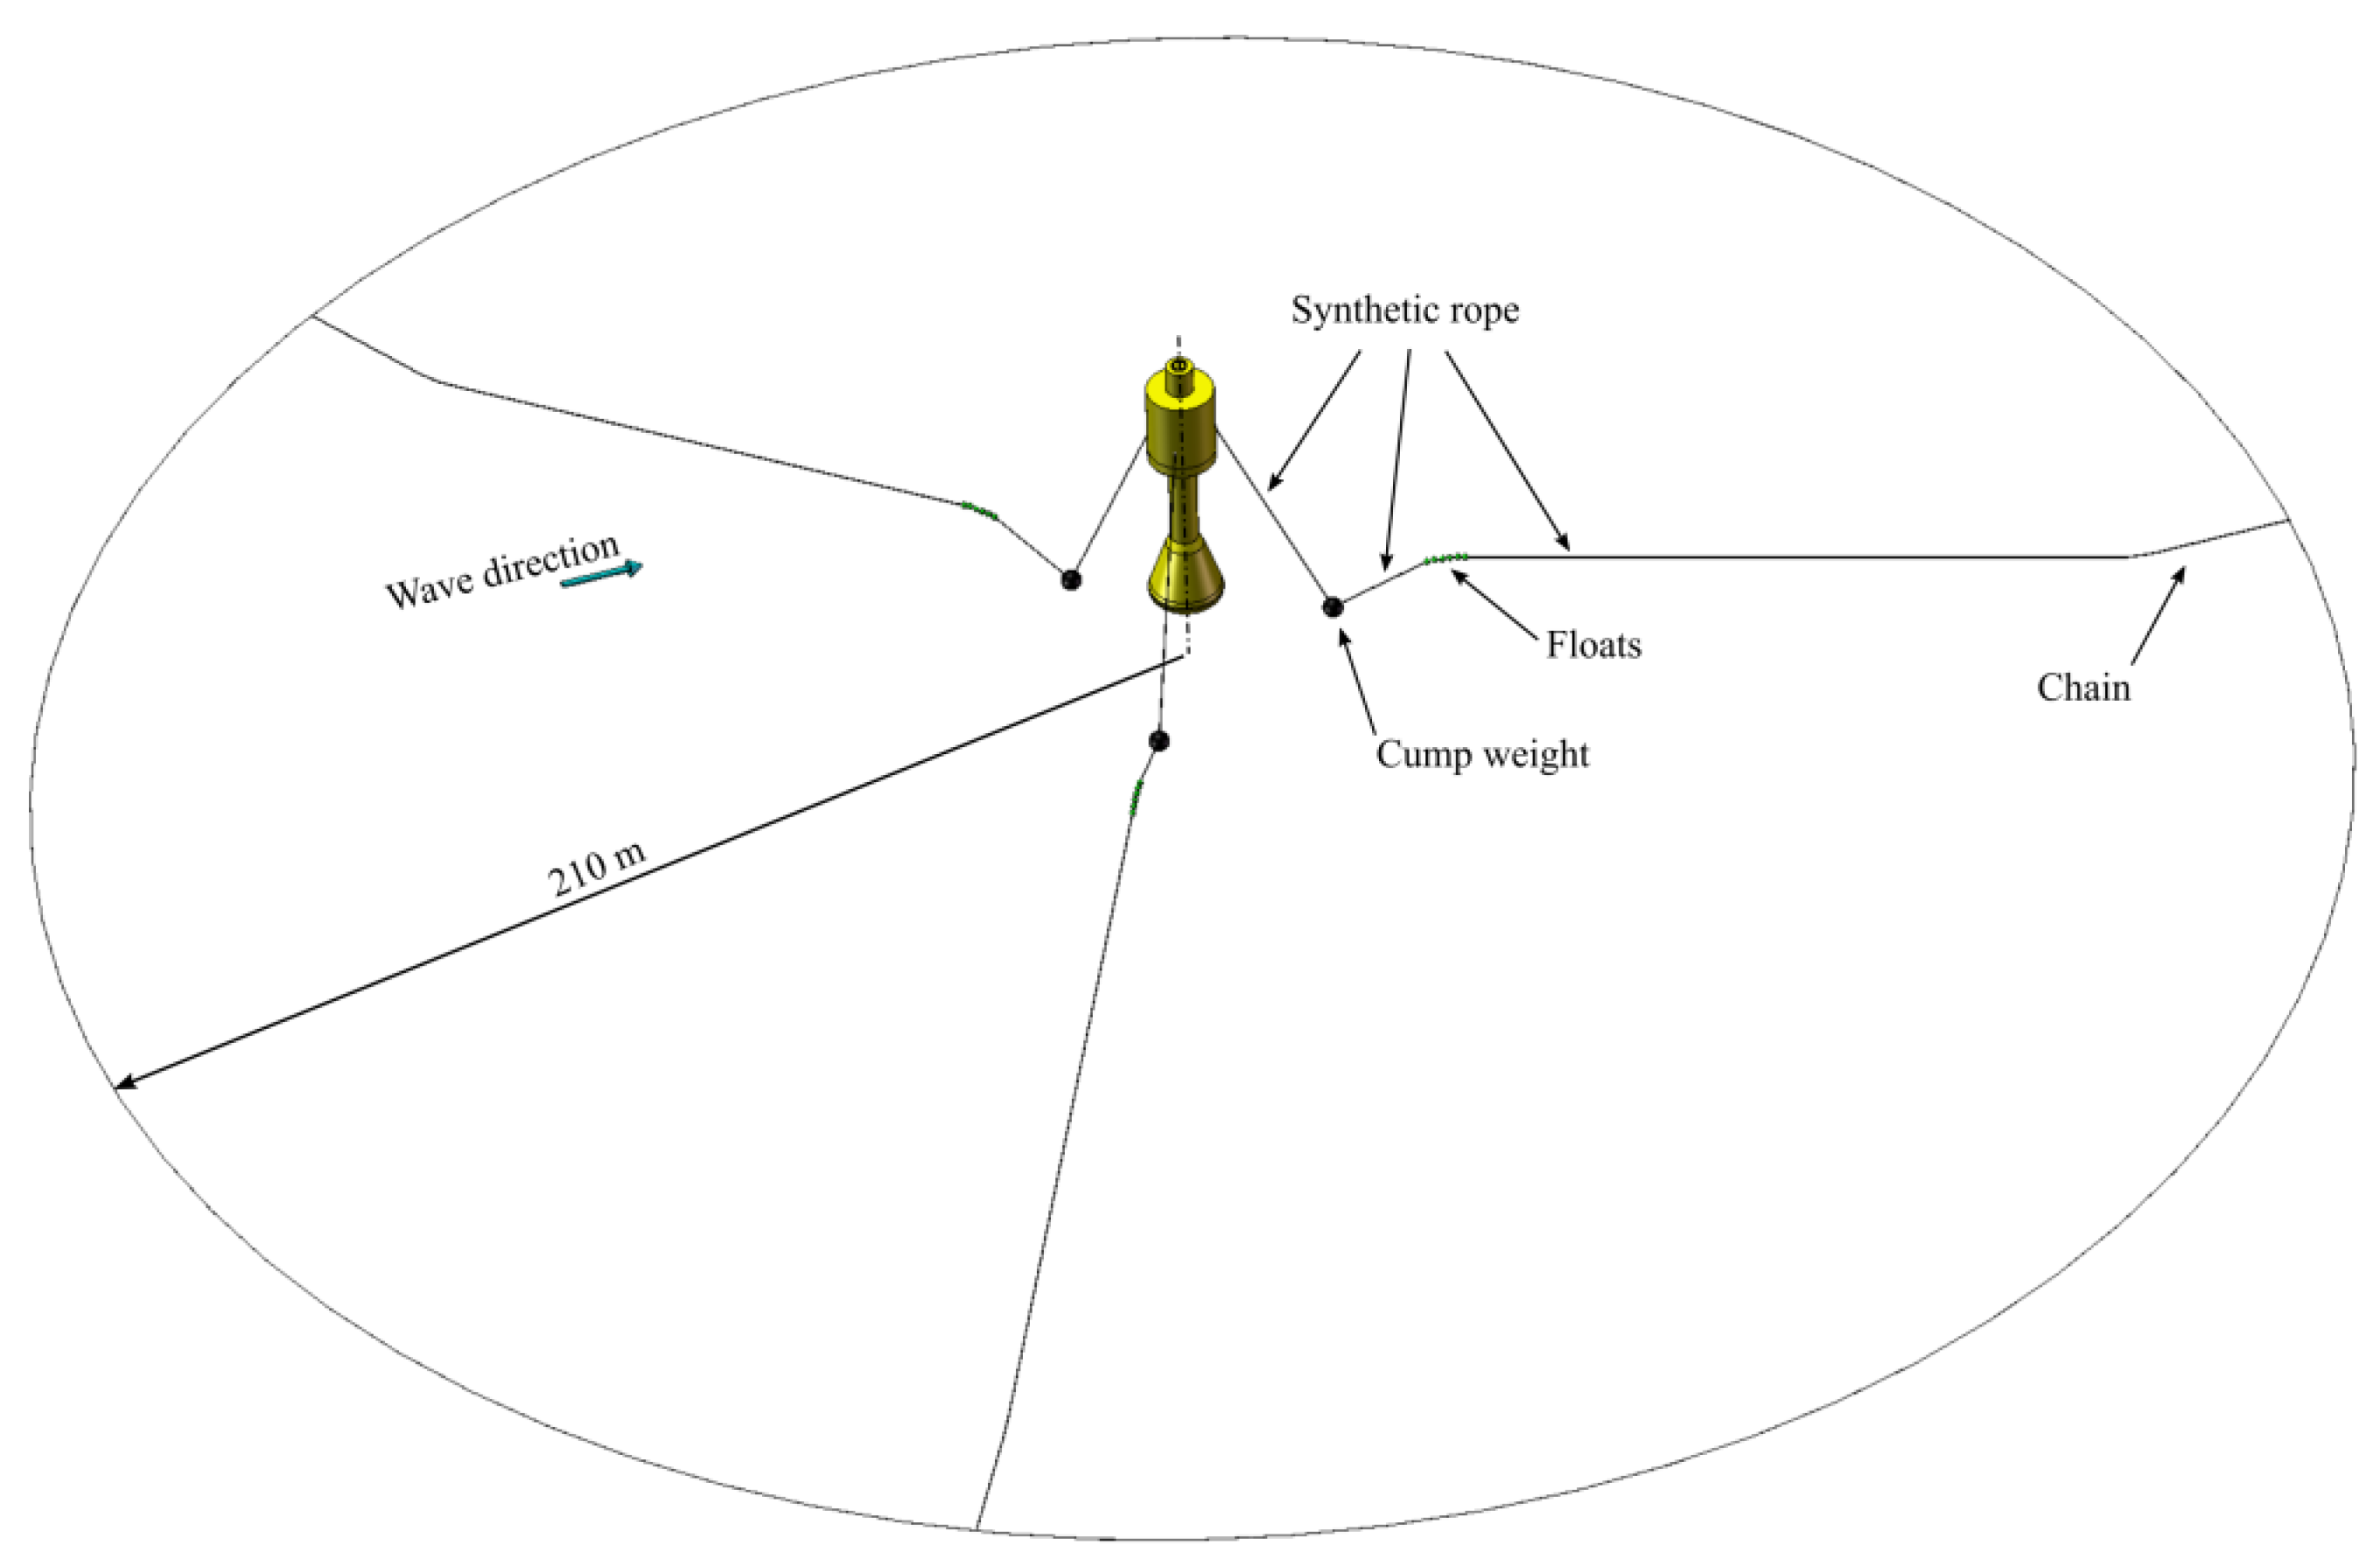
Moorings
The mooring set-up for the devices is depicted in Figure 1. A three-point catenary mooring is used using a combination of chain and synthetic rope with floats and clump weights.
Array Layout and Configuration
A variety of electrical configurations and array layouts are considered in the techno-economic model. For the macro-economic assessment a single array layout and electrical configuration was considered. For the farm layout, effectively 2 rows of devices is considered, with the distance between devices set as just over 13 device diameters. For the electrical configuration, a star array was chosen as it provided a lower LCOE than a string configuration, and has advantages in terms of redundancy of the system. In this configuration, each device has its own umbilical cable, and ‘stars’ of devices are grouped prior to connection to the offshore substation. This is illustrated in Figure 2, whereby one star of five devices is depicted. Six other static cables connect the remaining 30 devices to the offshore substation.
2.2.2. Farm Lifetime
The operational lifetime of the farm is assumed to be 20 years. Prior to the operational phase, three years of manufacturing is assumed, with two years of installation commencing after the first year of manufacturing. A one year decommissioning phase is incorporated after the 20 year lifetime of the farm.
2.3. The Locations
Precise locations are required for completion of the modelling work. For the techno-economics the deployment site is critical as the associated wave climate dominates the expected power output of the farm. The distances to small and large ports, water depth, and wave climate also influence the cost of installation along with the O&M costs over the project lifetime. It is therefore necessary to identify two prospective sites. These locations are detailed below, and have been chosen due to their associated wave climate and potential suitability as WEC farm deployment locations:
- European Marine Energy Centre (EMEC) [25], Orkney, Scotland, UKGrid-connected test facility for wave and tidal energy devices
- Leixoes, PortugalMajor port in the north of Portugal, located in Matosinhos near the city of Porto.
These two locations vary greatly on values of distances to shore, largest port and nearest O&M ports, as well as water depth, as shown in Table 1. In case of Leixoes, the distances from site and ports are almost two times larger compared to the EMEC site, and the distance from site to shore differs in a factor of 7. In terms of depth, the Leixões is at 80 m, and EMEC at 50 m. This suggests that the costs associated with water transport (especially in installation stage), electrical cables and mooring components (textiles and fabricated metal) will be significantly higher in case of Leixoes than EMEC.
Contours describing the relative abundance of significant wave height, , and energy period, , for the two sites are shown in Figure 3, based on data from [26,27]. This demonstrates the differing nature of the two sites in terms of spread of likely sea state conditions. The mean values, however, are comparable, with the Leixoes site having mean values of and of 2.0 m and 8.6 s, and EMEC 1.8 m and 8.8 s.
2.4. Input-Output Modelling
IO modelling is a quantitative method of macro-economic analysis, considering interdependencies between different branches of the economy. This modelling approach enables the wider economic benefit to a specified region to be assessed, based on knowledge of direct sectoral spend along with relevant multipliers accounting for the inter-relationships between economic sectors. Estimates can be obtained for the number of created jobs and the total Gross Added Value (GVA) associated with the proposed project. For this work, IO modelling is used to quantify and understand the effects of installing a farm of oscillating water column WECs on Scottish and Portuguese economies.
To complete classical IO modelling it is necessary to make several simplifying assumptions. The key assumptions required are as follows [11,19]:
- The supply side of the regional economy is passive, and does not itself influence demand
- The intervention with the model takes all supply regardless of external demand
- Fixed coefficients can be used to describe the interdependencies between sectors i.e., sectors inputs respond linearly to changes in output.
The implications of these assumptions are discussed in Section 4.2.2. Underlying all IO models are Industry by Industry (IxI) matrices which describe the total inter-sectoral spend for all Standard Industrial Classes (SIC). These are published by countries, along with certain autonomous regions, and are normalised to compute multiplier effect from the known interdependencies. To compute macro-economic effects it is therefore required to have up-to-date IxI matrices, and to allocate all project spend to SICs.
2.5. Model Implementation
To complete the input-output computations, reliable estimates of project expenditure are needed. The IO model is therefore coupled to a techno-economic model, which is described along with the model considerations and options in Section 2.5.1. The procedure to carry out the IO modelling is described separately Section 2.5.2.
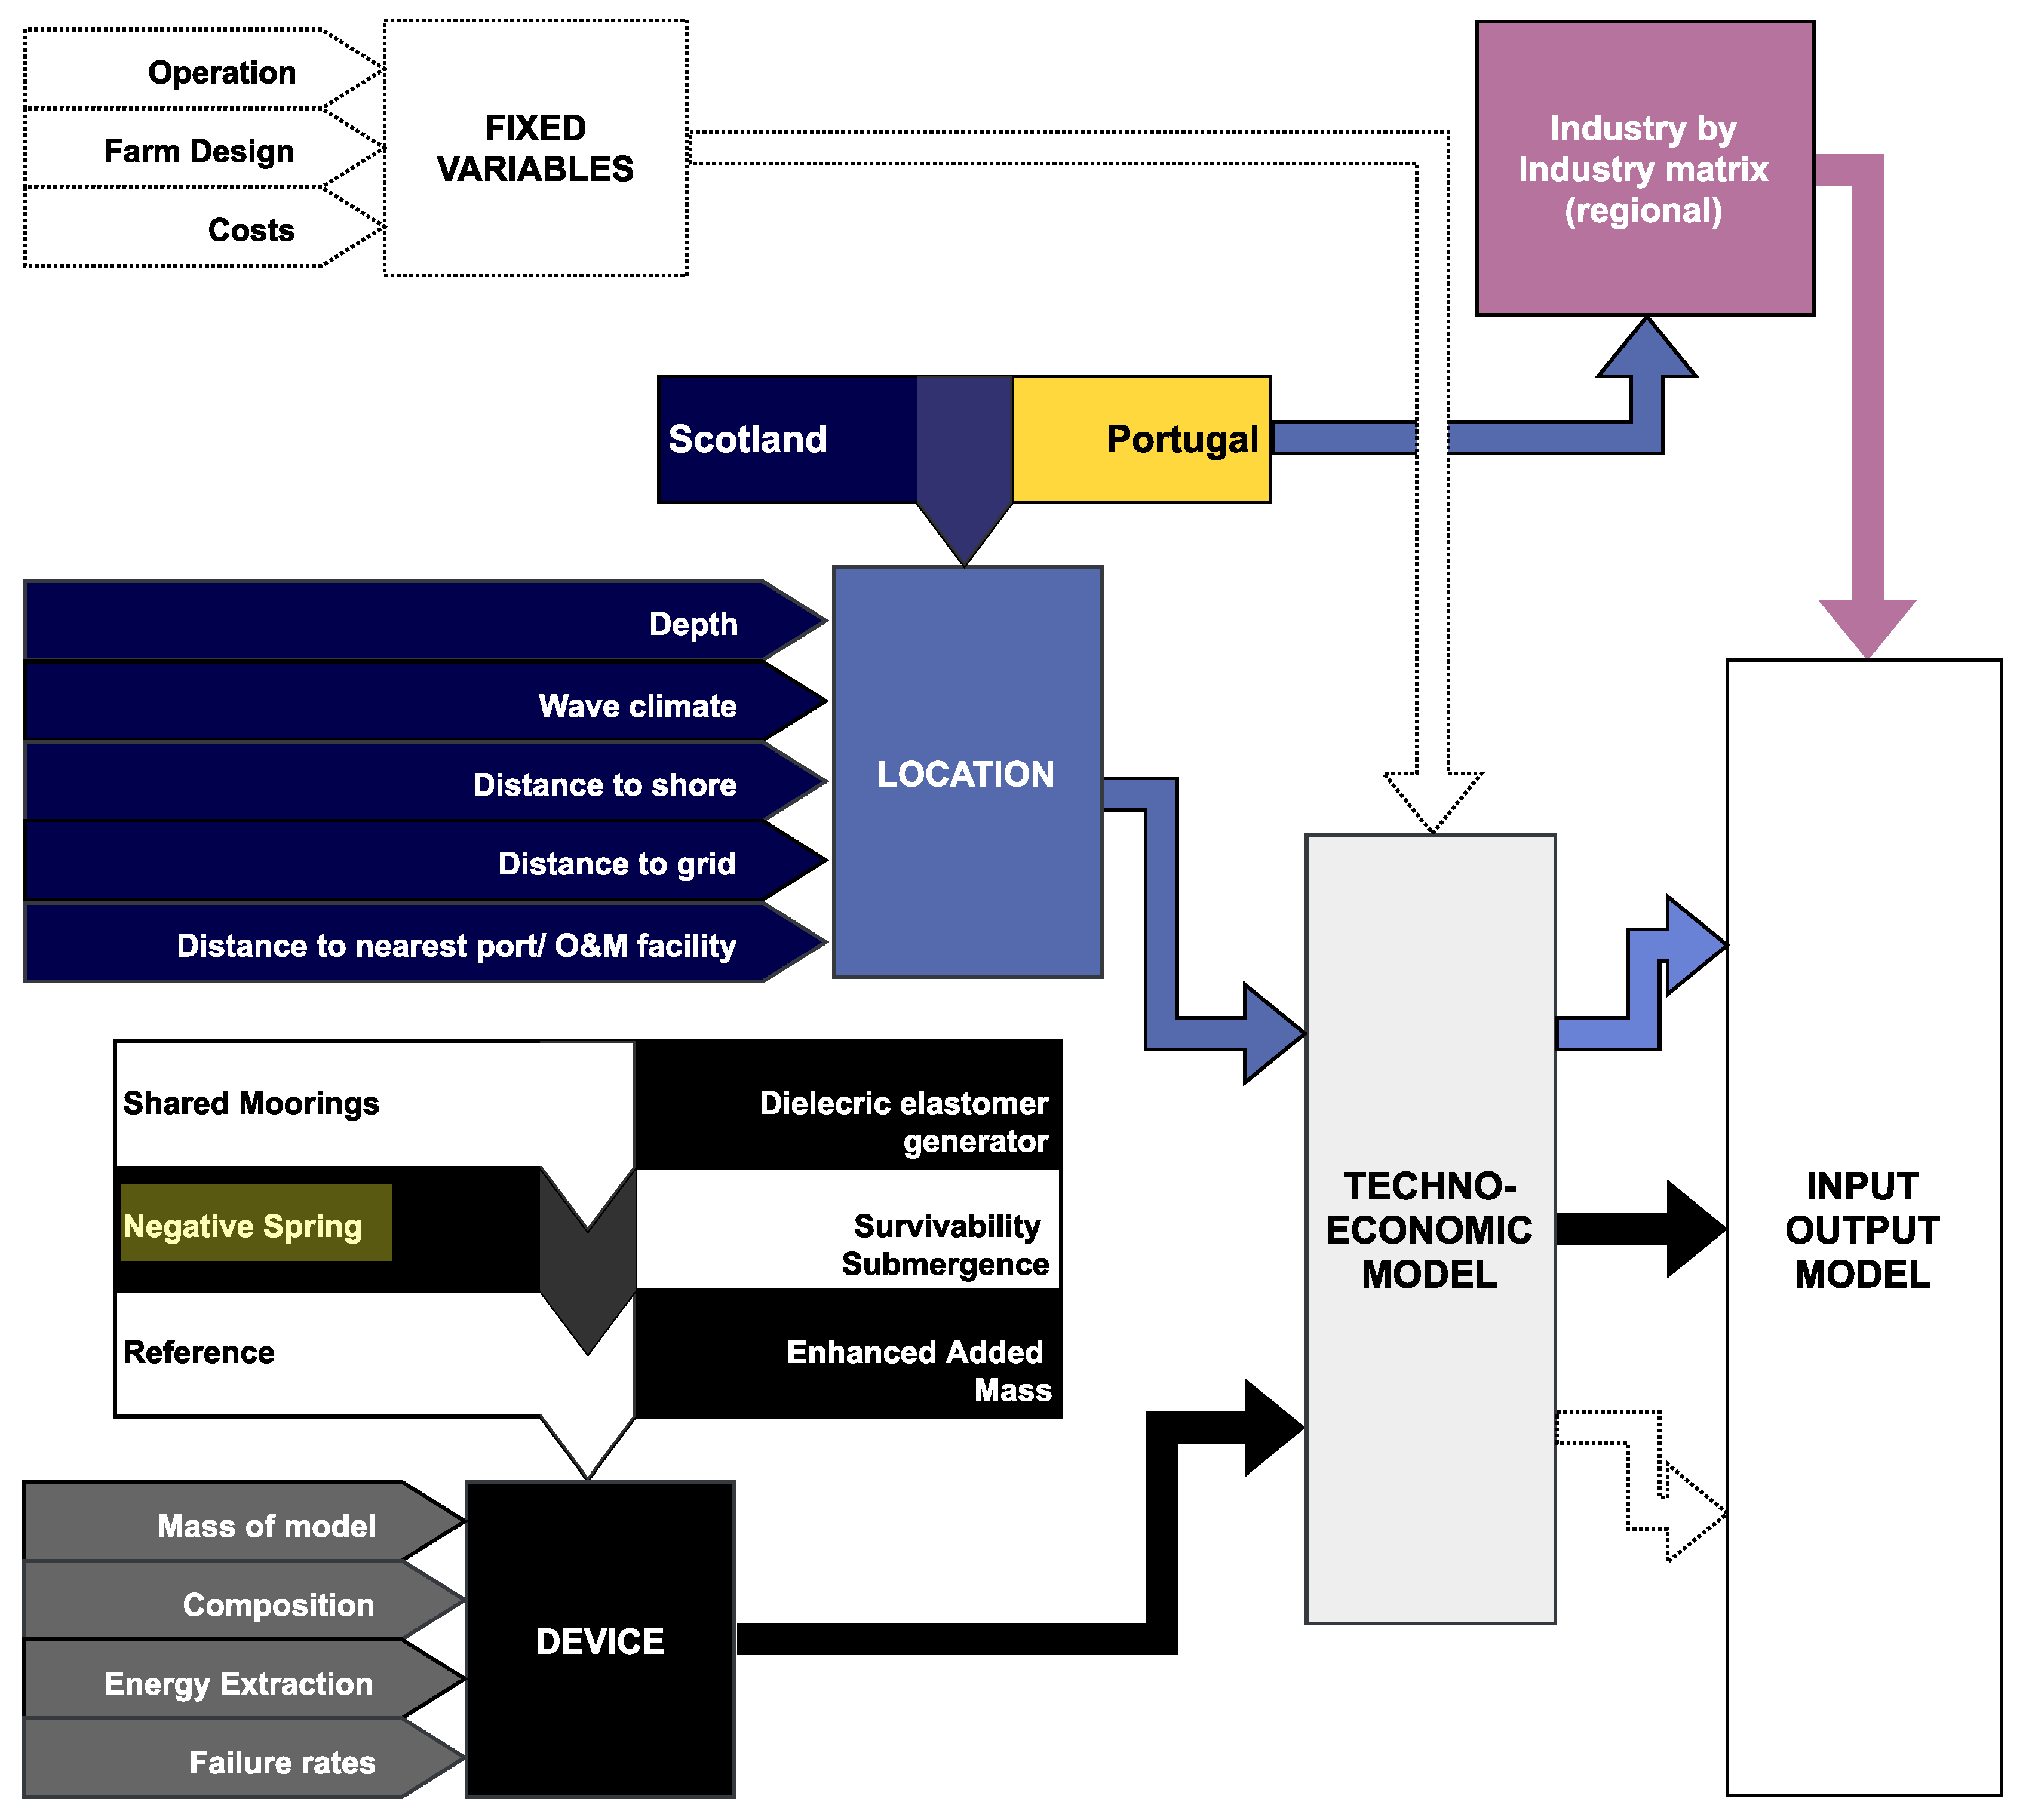
2.5.1. Coupled Techno-economic–IO Model
The techno-economic–IO model considers a wide variety of parameters, enabling the assessment of various locations, device types (and associated failure rates), farm layouts, materials, vessels and other variables. The details of the logistic model used to compute the techno-economic analysis can be found in [28,29], with techno-economic model outputs for the WETFEET project in [30]. Detailed CAPEX and OPEX entries are then passed to the IO model, along with other key variables, such as location, which directly influence the modelling work. The key inputs and considerations in the model is depicted in Figure 4. Outputs of the IO model for all of the breakthrough cases can be found in [31].
It is demonstrated in Figure 4 that there are two main categories of inputs to the model: those related to the device specification and those associated with the deployment location, which are accompanied by several additional variables required to complete the analysis. These catagories are expanded upon below:
Device
Specifics of the mechanical, electrical, and electro-mechanical components of the device are required to compute the CAPEX associated with the devices themselves. Associated device failure rates and power matrices enable the O&M costs and electricity sales to be considered in the overall economic analysis.
Location
Detailed understanding of the deployment location is required (as described in Section 2.3) to ensure distances are properly accounted for to obtain reasonable estimates for mooring and electrical cable lengths, along with vessel journey times for installation, maintenance and decommissioning. A basic understanding of the wave climate is also required, in conjunction to the power matrix of the device, to predict annual energy production. This is key to Levelized Cost of Energy (LCOE) calculations; however, is not an input to the IO model.
Fixed Variables
In addition to key inputs associated with the device and location, additional fixed variables are required to complete the modelling work. Crucially, it is required to use a database of costs (for e.g., wage and material costs) to convert from technical and logistical aspects of the model to equivalent CAPEX and OPEX entries. Although easy to change in the model, for the purpose of the analysis the farm operation and design have been considered as fixed variables; details of which are provided in Section 2.2.
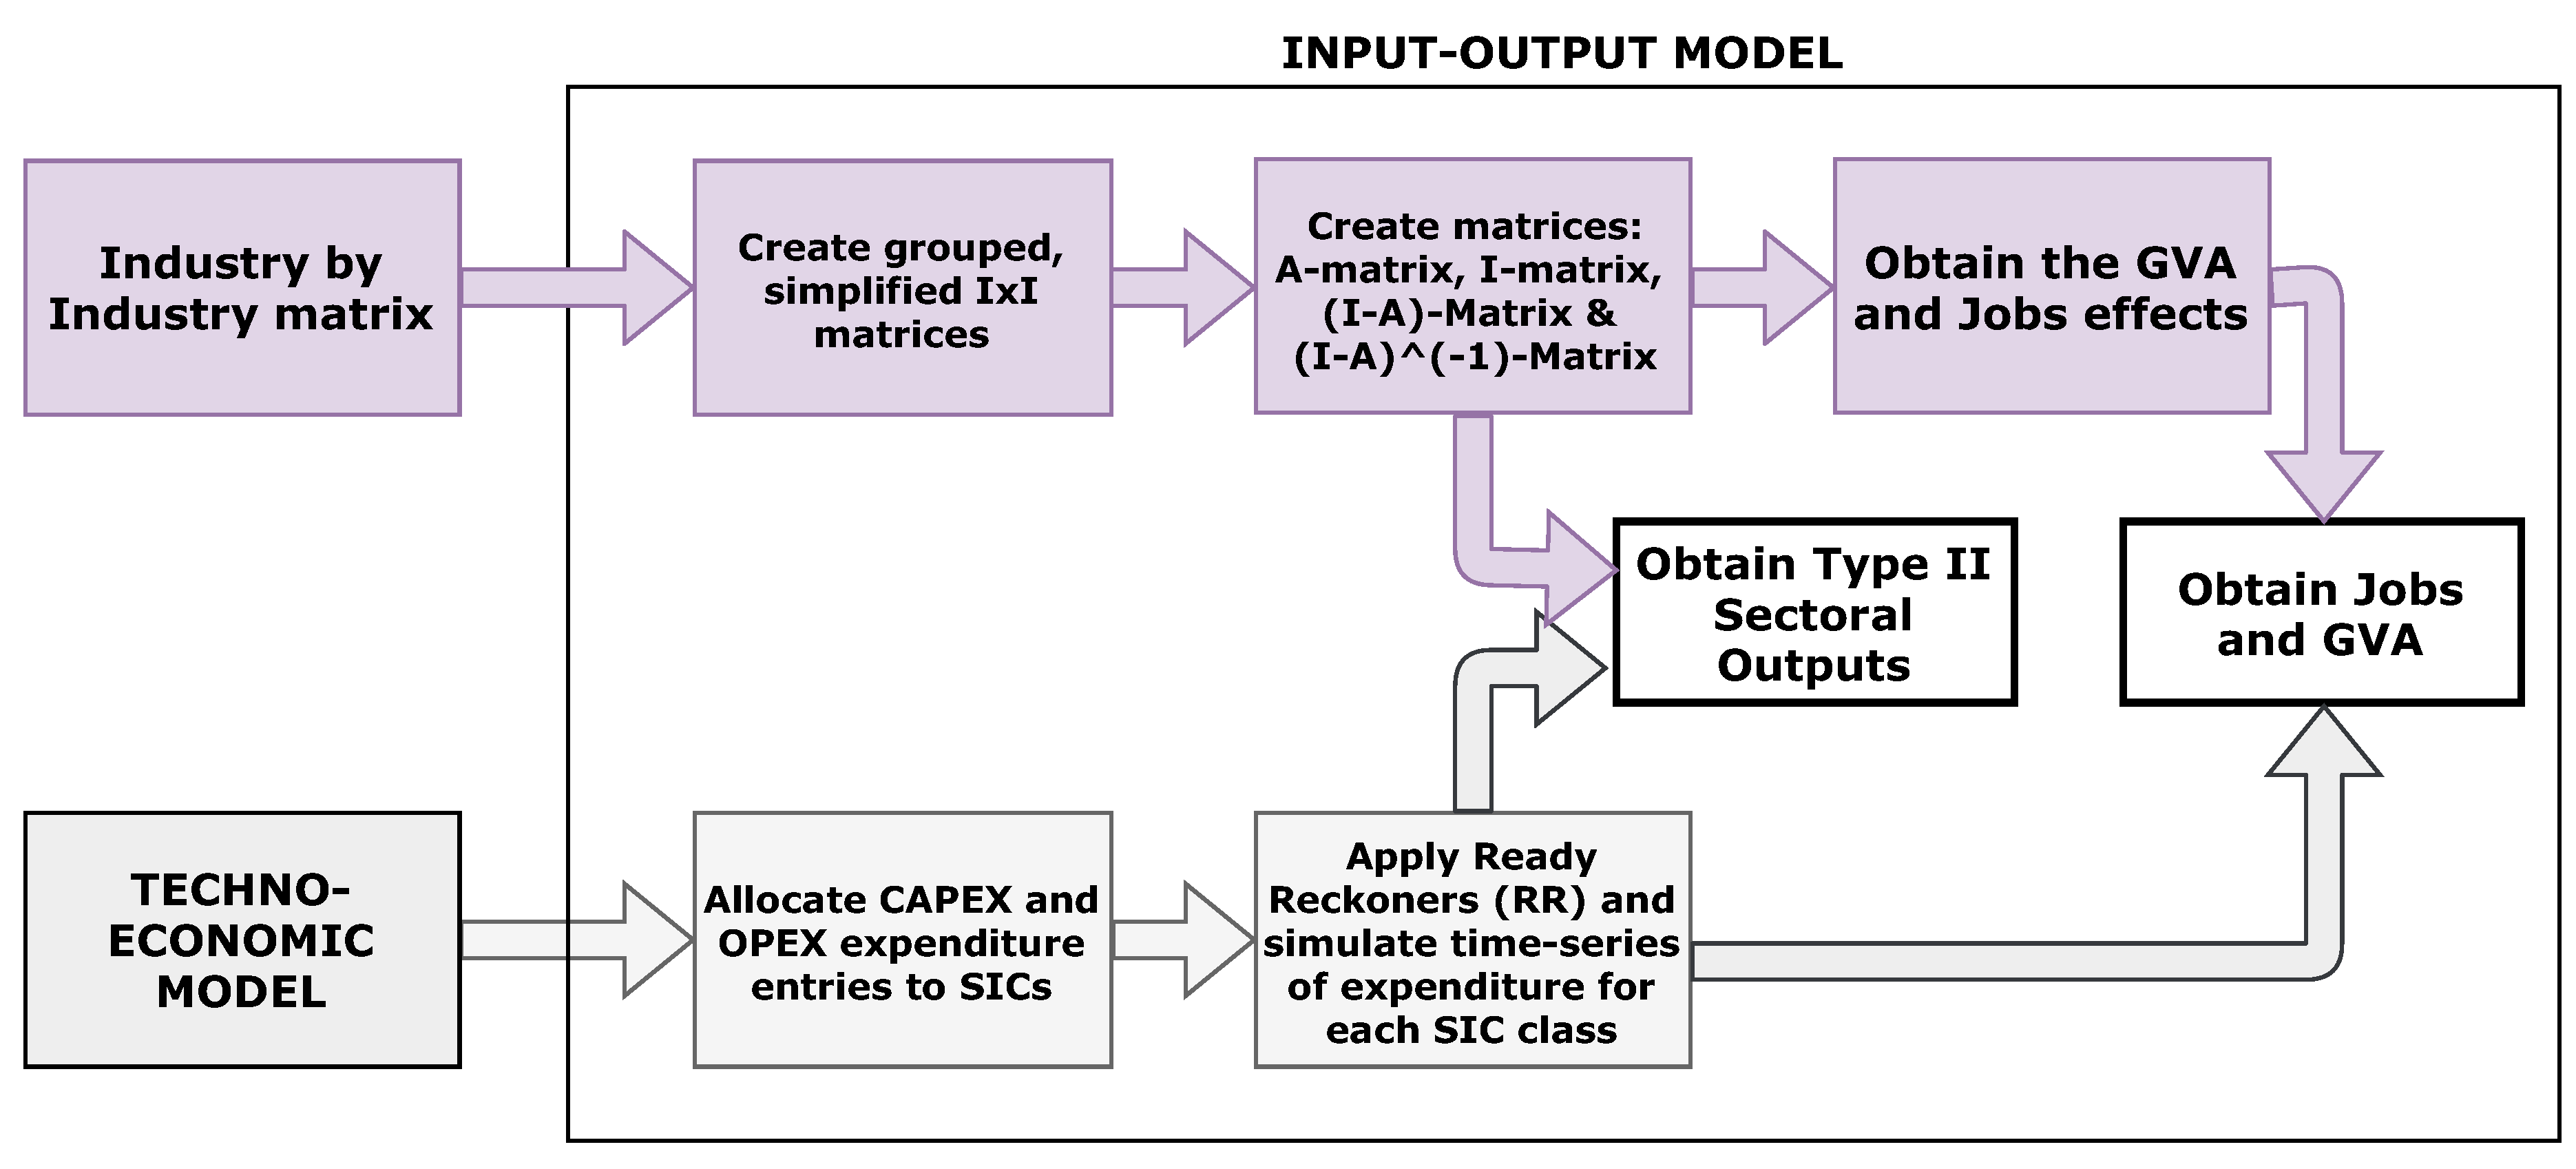
2.5.2. IO Modelling
The outputs of the techno-economic model, along with the IxI matrices are used as inputs to the IO model. The procedure used to carry out the IO modelling work is as follows:
- Allocate CAPEX and OPEX expenditure entries to SICs
- Create grouped, simplified IxI matrices
- Apply Ready Reckoners (RR) and simulate time-series of expenditure for each SIC class
- Compute IO model: obtain direct and type II output, jobs and GVA
The methodology for completing this procedure is described below, with the process depicted in Figure 5.
Allocate CAPEX and OPEX Expenditure Entries to SICs
As the matrices which describe sector inter-dependency use standard classes, it is required that all project expenditure be allocated to these classes. To achieve this, each CAPEX and OPEX entry of the techno-economic model has been separated into the differing associated materials and services, and costs allocated to the most appropriate classes.
The attribution to classes for CAPEX and OPEX has been done by detailed assessment identifying the industry most influenced by the cost entry. In some cases, this means attributing costs between multiple industries by the expected relative influence. Summing total expenditure in each class provides indication as to the key sectors being shocked, and hence which ones should be kept as separate classes, and which can be aggregated to simplify the analysis and presentation of results.
Create Grouped, Simplified IxI Matrices
Once key industrial sectors have been identified in the classification procedure, a process of aggregation can be carried out on those sectors of reduced interest. For this model the process resulted in 29 groups, clustered from the original SIC (2007) list of 98 separate industries. This has been carried out by identifying common characteristics e.g., the aggregated category “Food and Drink processing” encompasses industries such as dairy, meat and wine. The resulting aggregated groups are presented in Table 2, where sectors without aggregation are interpreted as those of most interest to the study.
Once the aggregated groups have been formulated, it is necessary to use these new classes to create grouped IxI matrices, describing the inter-dependency between defined aggregated groups. The same methodology needs to be applied to compute aggregated expenditure, and updated values of multipliers corresponding to the new classes.
Apply Ready Reckoners (RR) and Simulate Time-Series of Expenditure for Each SIC Class
Ready reckoners are required to compute the net spend in each of the grouped cost centres for the area of interest. These additionalities contain information that try to account for the extent the project is directly responsible for the influence on the economy. To estimate the total net spend in each of the classes Equation (1) is used, where e.g., [32] can be used for definitions of the different ready reckoners.
where Y is the net sector demand and is gross impact. The ready reckoners are Leakage (L), Displacement (), Deadweight () and Substitution (S).
For implementation in the model, the ready reckoners presented in Table 3 have been used for both Scotland and Portugal. These are effectively ‘best guess’ values based on the country profiles and nature of the sectors. Only sectors directly ‘shocked’ have associated RR values and are presented in Table 3. The sensitivity to these assumptions are discussed further in Section 4.2.
Once the total demand values, Y, are estimated via ready reckoners and gross impact (allocated to SICs) a time-series of expenditure for each grouped class can be created. The classified CAPEX/OPEX entries are allocated appropriately to the 4 phases described in Section 2.2.2, providing a time-series of the annual demand for each directly shocked sectors.
Compute IO Model: Obtain Direct and Type II Output, Jobs and GVA
The methodology described provides the final demand, Y, of the aggregated sectors, j, as appropriate for the region of interest. The IO model enables the wider effect of this spend to be assessed considering the multiplier effect resulting from sector interdependency. These multiplier effects can be split in two categories:
- Supply linked—due to companies’ supply chain. Sometimes referred as indirect multiplier.
- Income linked—due to expenditure from people whose income is supplied from the project. Sometimes called induced multiplier.
Type II incorporates both effects, while Type I only incorporates indirect multiplier effects. Type II multiplier effects are considered in this work to fully account for the macro-economic benefit of the wave farms; incorporating direct, indirect and induced effects on sector output, jobs and GVA.
Type II Sector Output
The basic principle of computing IO models is that developed by Leontief [33], in that sectoral outputs can be linked to final demand via the well-known matrix equation:
where X is the sectoral outputs and Y is the demand. I is an identity matrix. The matrix (Type I) is essentially the normalised equivalent of the IxI matrix developed for the aggregated groups. For Type I multipliers describes the relative amount of sector i required to create one unit of output for sector j.
For Type II, the effects of households also need to be considered, which can be formally described as:
where is the Type I matrix, is the amount of industry i required per unit of household income, and is the compensation of employees per unit of output of sector i. Type II sectoral outputs can then be calculated by:
where is commonly referred to as the Type II inverse Leontief matrix.
Type II Employment and GVA
Type II GVA and employment can be computed using the following equations [34]:
where is the Full Time Equivalent (FTE) employment for industry i divided by the column total of total output at basic prices, and is the GVA for industry i divided by the column total. represents the total impact on employment throughout the economy resulting from a unit change in final demand of industry j, and the GVA equivalent. and are commonly referred to as the employment effect and GVA effect. These must be calculated for the aggregated groups defined in Table 2.
3. Results
3.1. Levelised Cost of Energy (LCOE)
Although the focus of this article is on the macro-economic outputs, the techno-economic component of the coupled model enables key performance metrics to be calculated including the Levelized Cost of Energy (LCOE), computed using Equation (9):
where is the levelized cost of energy, is the annual electricity production at year t, r is the discount rate and n is the system lifetime. The numerator represents the sum of expenditure in year t. Further details on the inputs to the calculation can be found in [30].
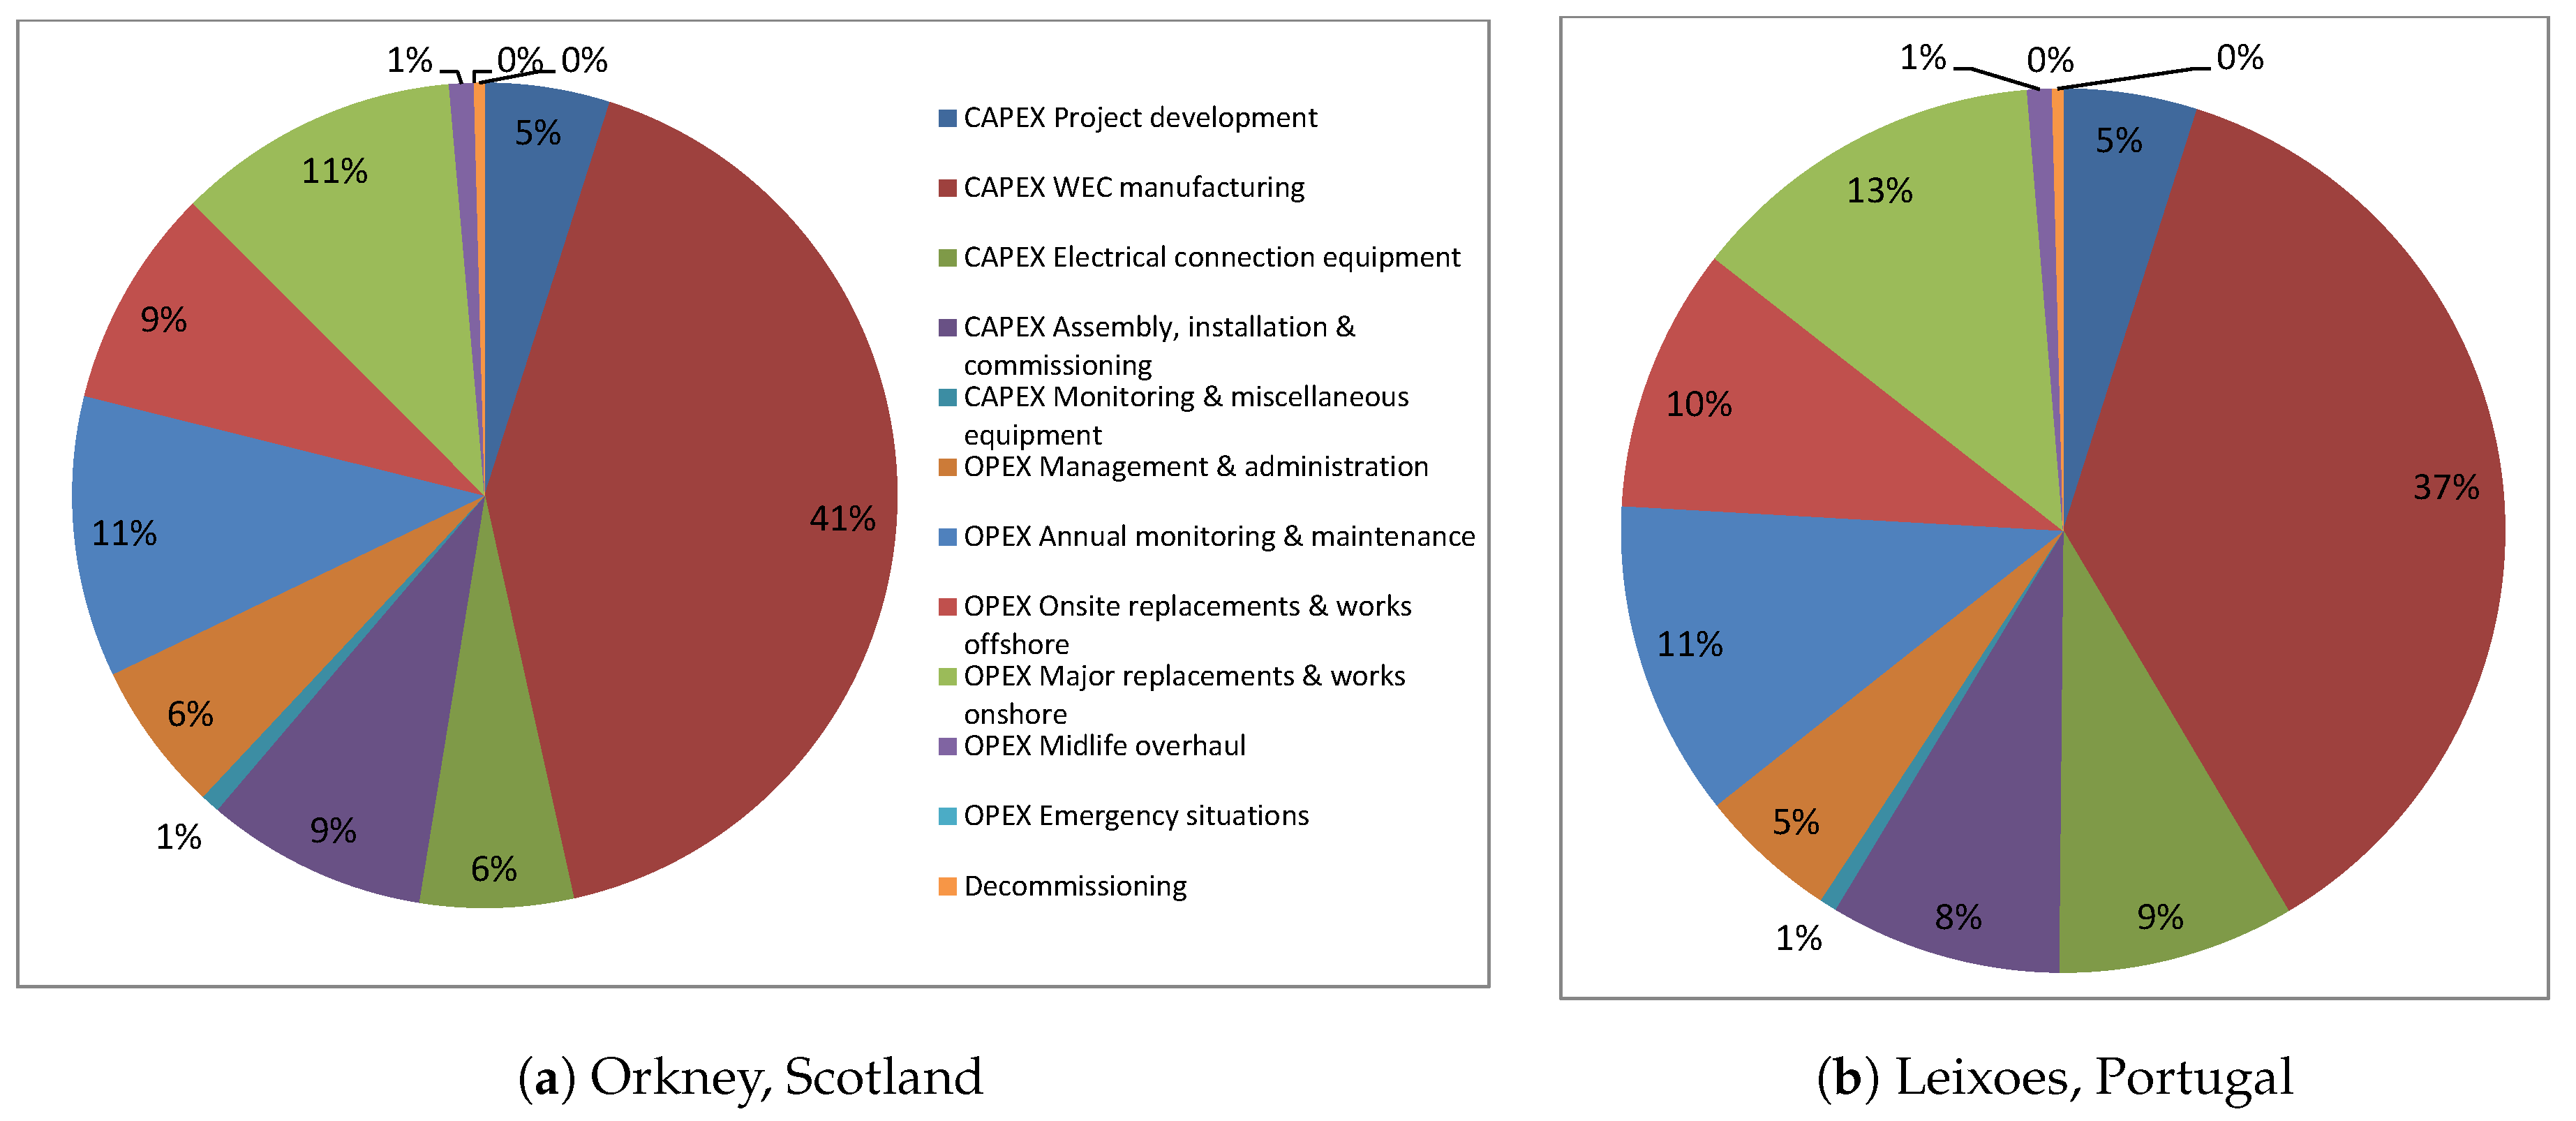
The LCOE computed for the OWC farms installed in EMEC, Scotland and Leixoes, Portugal are 105 c€/kWh and 130 c€/kWh respectively, with the corresponding breakdown of the LCOE into major cost centers is depicted in Figure 6a,b. The values for LCOE are notably higher than conventional electricity generation, which as detailed in [35] tend to range between 5 c€/kWh and 20 c€/kWh. It is worth noting, however, that there is no learning rate assumed in the LCOE calculation and the farm is relatively small and hence does not take advantage of economies of scale. It is also true (and evident in Figure 6) that there is high ratio of manufacturing cost, and material, to the rated power of the OWC. This suggests that the size of the OWC device may be sub-optimal, and a larger device may represent a more material efficient machine. This aspect, however, is not the focus of the presented study.
Assessing the LCOE breakdowns for the OWC farm installed in Scotland and Portugal, it is evident that for the Leixoes site a higher proportion of LCOE is attributed to installation, and works both onshore and offshore. This is attributed to the greater distances to port and to shore for the Leixoes site, increasing the costs associated with mooring and electrical cables, and vessels for installation and maintenance. WEC manufacturing is associated with a smaller relative value of LCOE compared with the EMEC site, despite the cost of the device being slightly higher for the Leixões case (due to higher mooring costs). This relative reduction, however, reflects that the expenditure in other cost centres has increased, rather than manufacturing costs decreasing for this site.
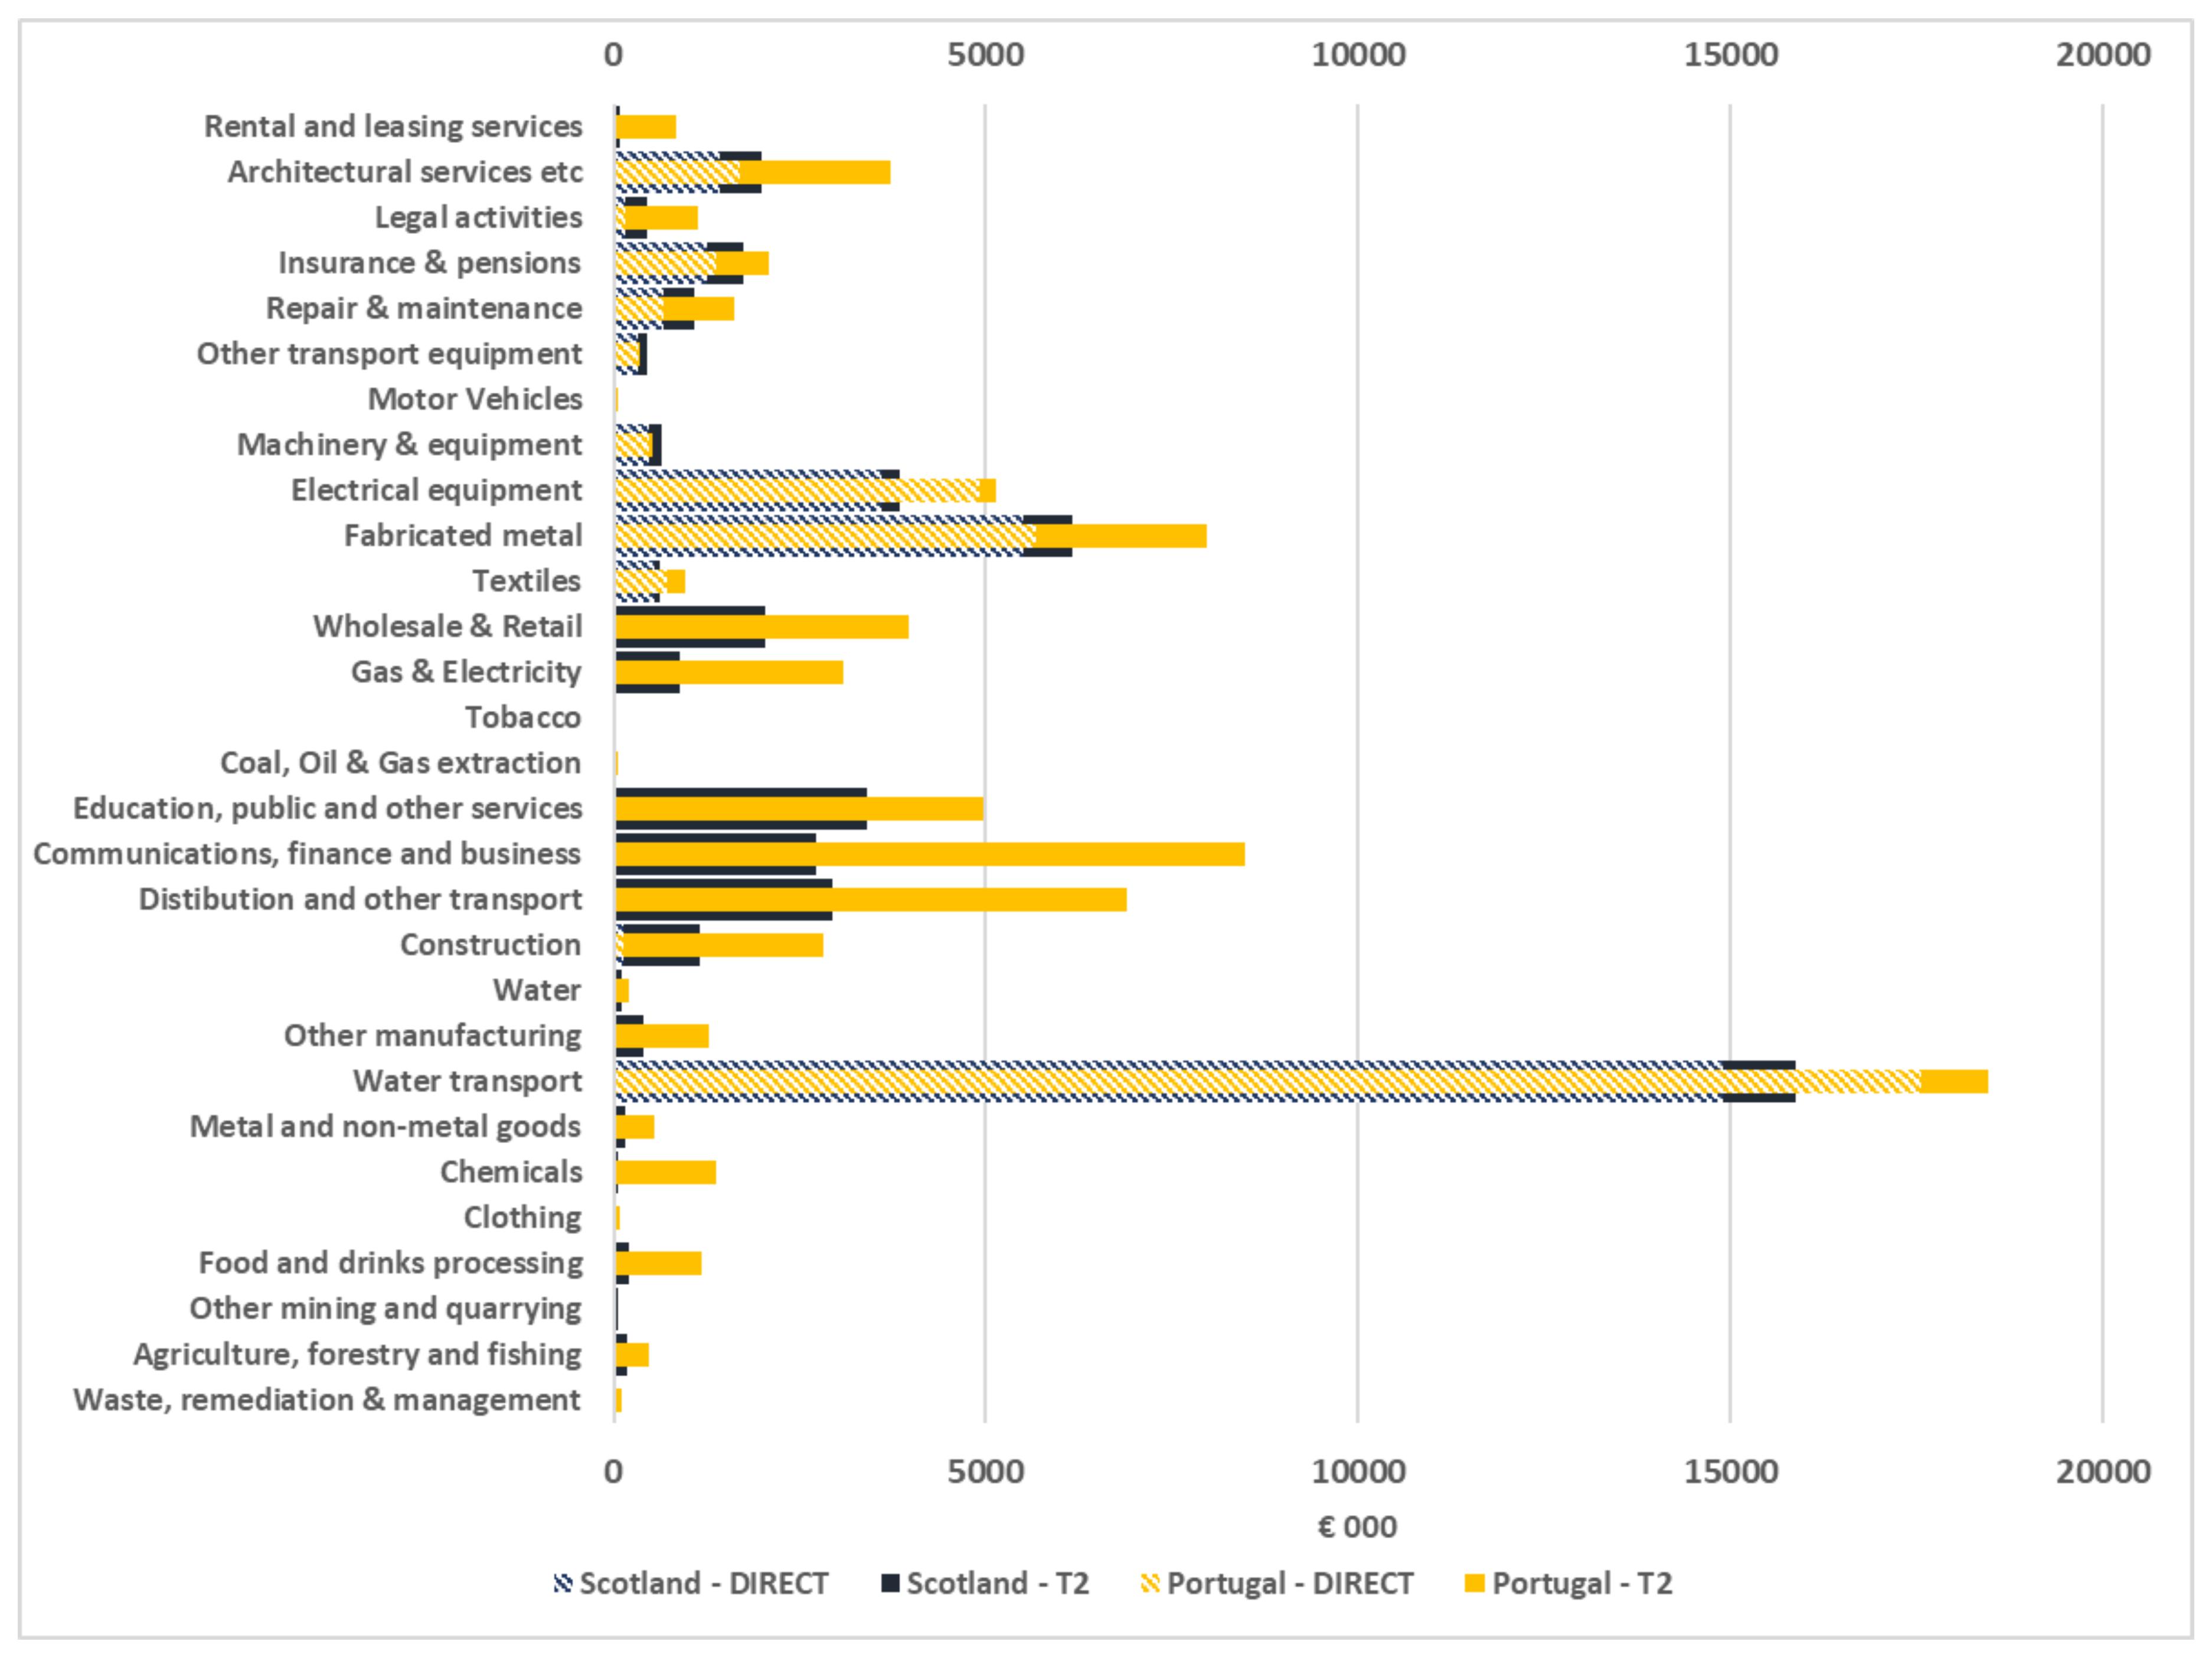
3.2. Direct and Type II Sectoral Outputs
The type II outputs for the 29 aggregated sectors is shown here for the projects deployed in Scotland and Portugal. Results are shown relative to the direct demand associated with the sectors for the prospective projects. This comparison is concisely presented in Figure 7, enabling comparisons to be made between type II outputs and demand, along with the relative values for the two locations studied.
From Figure 7, several findings can be inferred. Comparing the direct to the type II outputs indicates the extent of the multiplier effect introduced from inter-sectoral dependencies in the studied economies. It is clear that, although only 13 sectors are directly shocked, practically all sectors are affected by the project indirectly. Some of these indirect and induced outputs are very significant (e.g., “communications, finance and business”) demonstrating the significant and wide-reaching effects resulting from project developments of this type. Also evident is the extent of the multiplier effects for those sectors which are directly stimulated, for example. “Architectural services”, where the total type II output is double the demand for the Portuguese location.
Comparing between the two locations it is clear that the output associated with installing the farm of OWC devices in Portugal is significantly higher than that when installed in Scotland. Assessing the location profiles describes in Table 1 in conjunction with Figure 7 the reasons for this become apparent. Water depths along with distances to ports and shore are significantly larger for the Leixoes site. The greater water depth results in increased costs due to larger mooring and electrical cable requirements. The larger distance to shore also results in longer electrical cables, while the distance to port means the vessel costs (categorized as water transport) for installation, O&M and decommissioning are also increased. The increased demand for Portugal consequently increases the type II outputs for dependent sectors, and had a positive effect on macro-economics. This highlights an apparent trade-off between positive techno-economics and macro-economics, in that higher project costs are associated with more favourable macro-economics. However, this apparent trade-off is under the crude assumption that a project is able to sustain itself at arbitrarily high costs, which is clearly not sustainable.
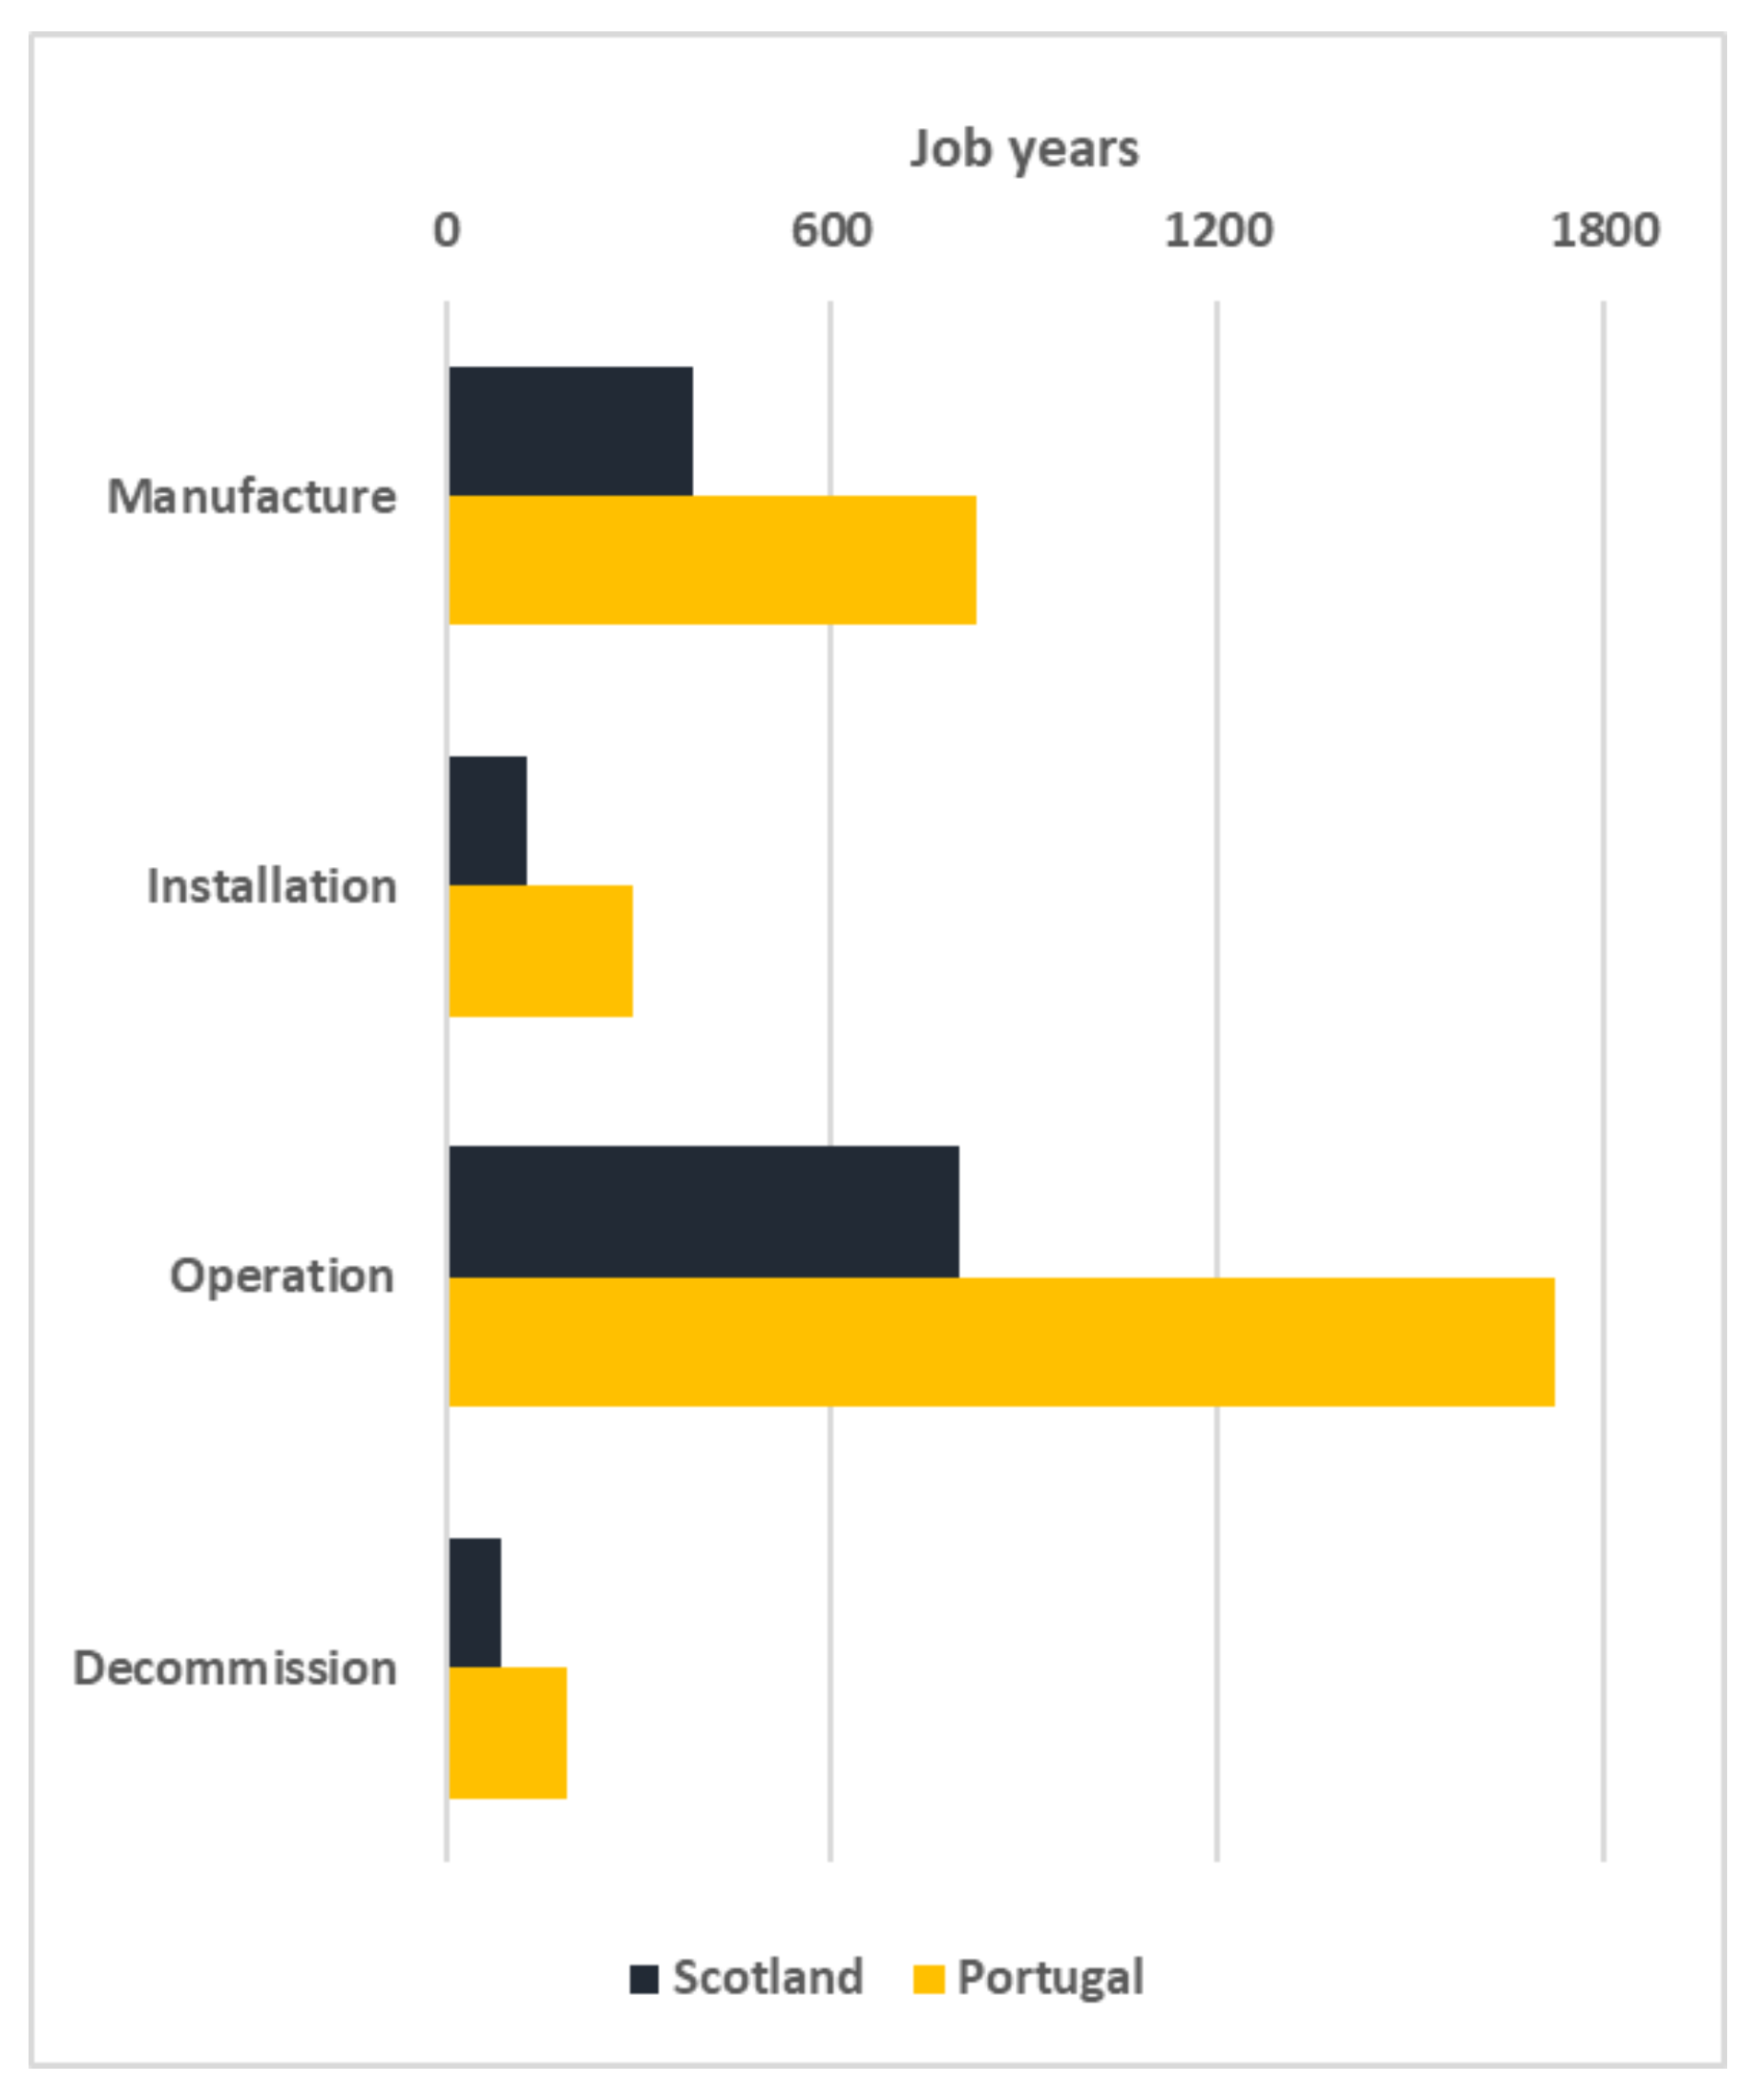
3.3. Jobs Creation
The total jobs associated with the four project phases are presented in Figure 8 for both Scotland and Portugal. In this figure the job years are presented, which is the sum over the project phase of the total (type II) number of jobs supported in each year, across all sectors. Peak employment occurs during the combined installation and manufacturing phase, where over 420 jobs are supported each year for Portugal and over 190 for Scotland. This large difference is owed to the larger CAPEX required for the Portugese development, due to the additional mooring and cabling requirements for the Leixoes site compared with EMEC. Similarly, the increase in jobs supported for the operational, installation and decommissioning phase is largely due to the cost associated with increased water transport for O&M tasks and the associated multiplier effects through the economies.
For comparison, the number of job years associated with a hypothetical 200 MW deployment of Aquamarine’s Oyster devices in Orkney was calculated to be 8503 [18]; equalling 45.5 job years/MW. For the current study, 60 and 133 job years/MW are computed for the farm of OWC devices deployed in Scotland and Portugal respectively; indicating similar but larger numbers for the OWC deployed in Orkney then for the Oyster device. This suggests that the the expenditure (per MW) associated with the OWC device is greater (assuming distribution of expenditure across economic sectors is approximately equal). The values computed in this analysis also compare favourably to other forms of electricity generation. For example, a 2015 study attributes only around 2 and 17 job years/MW for gas and coal power plants respectively [36].
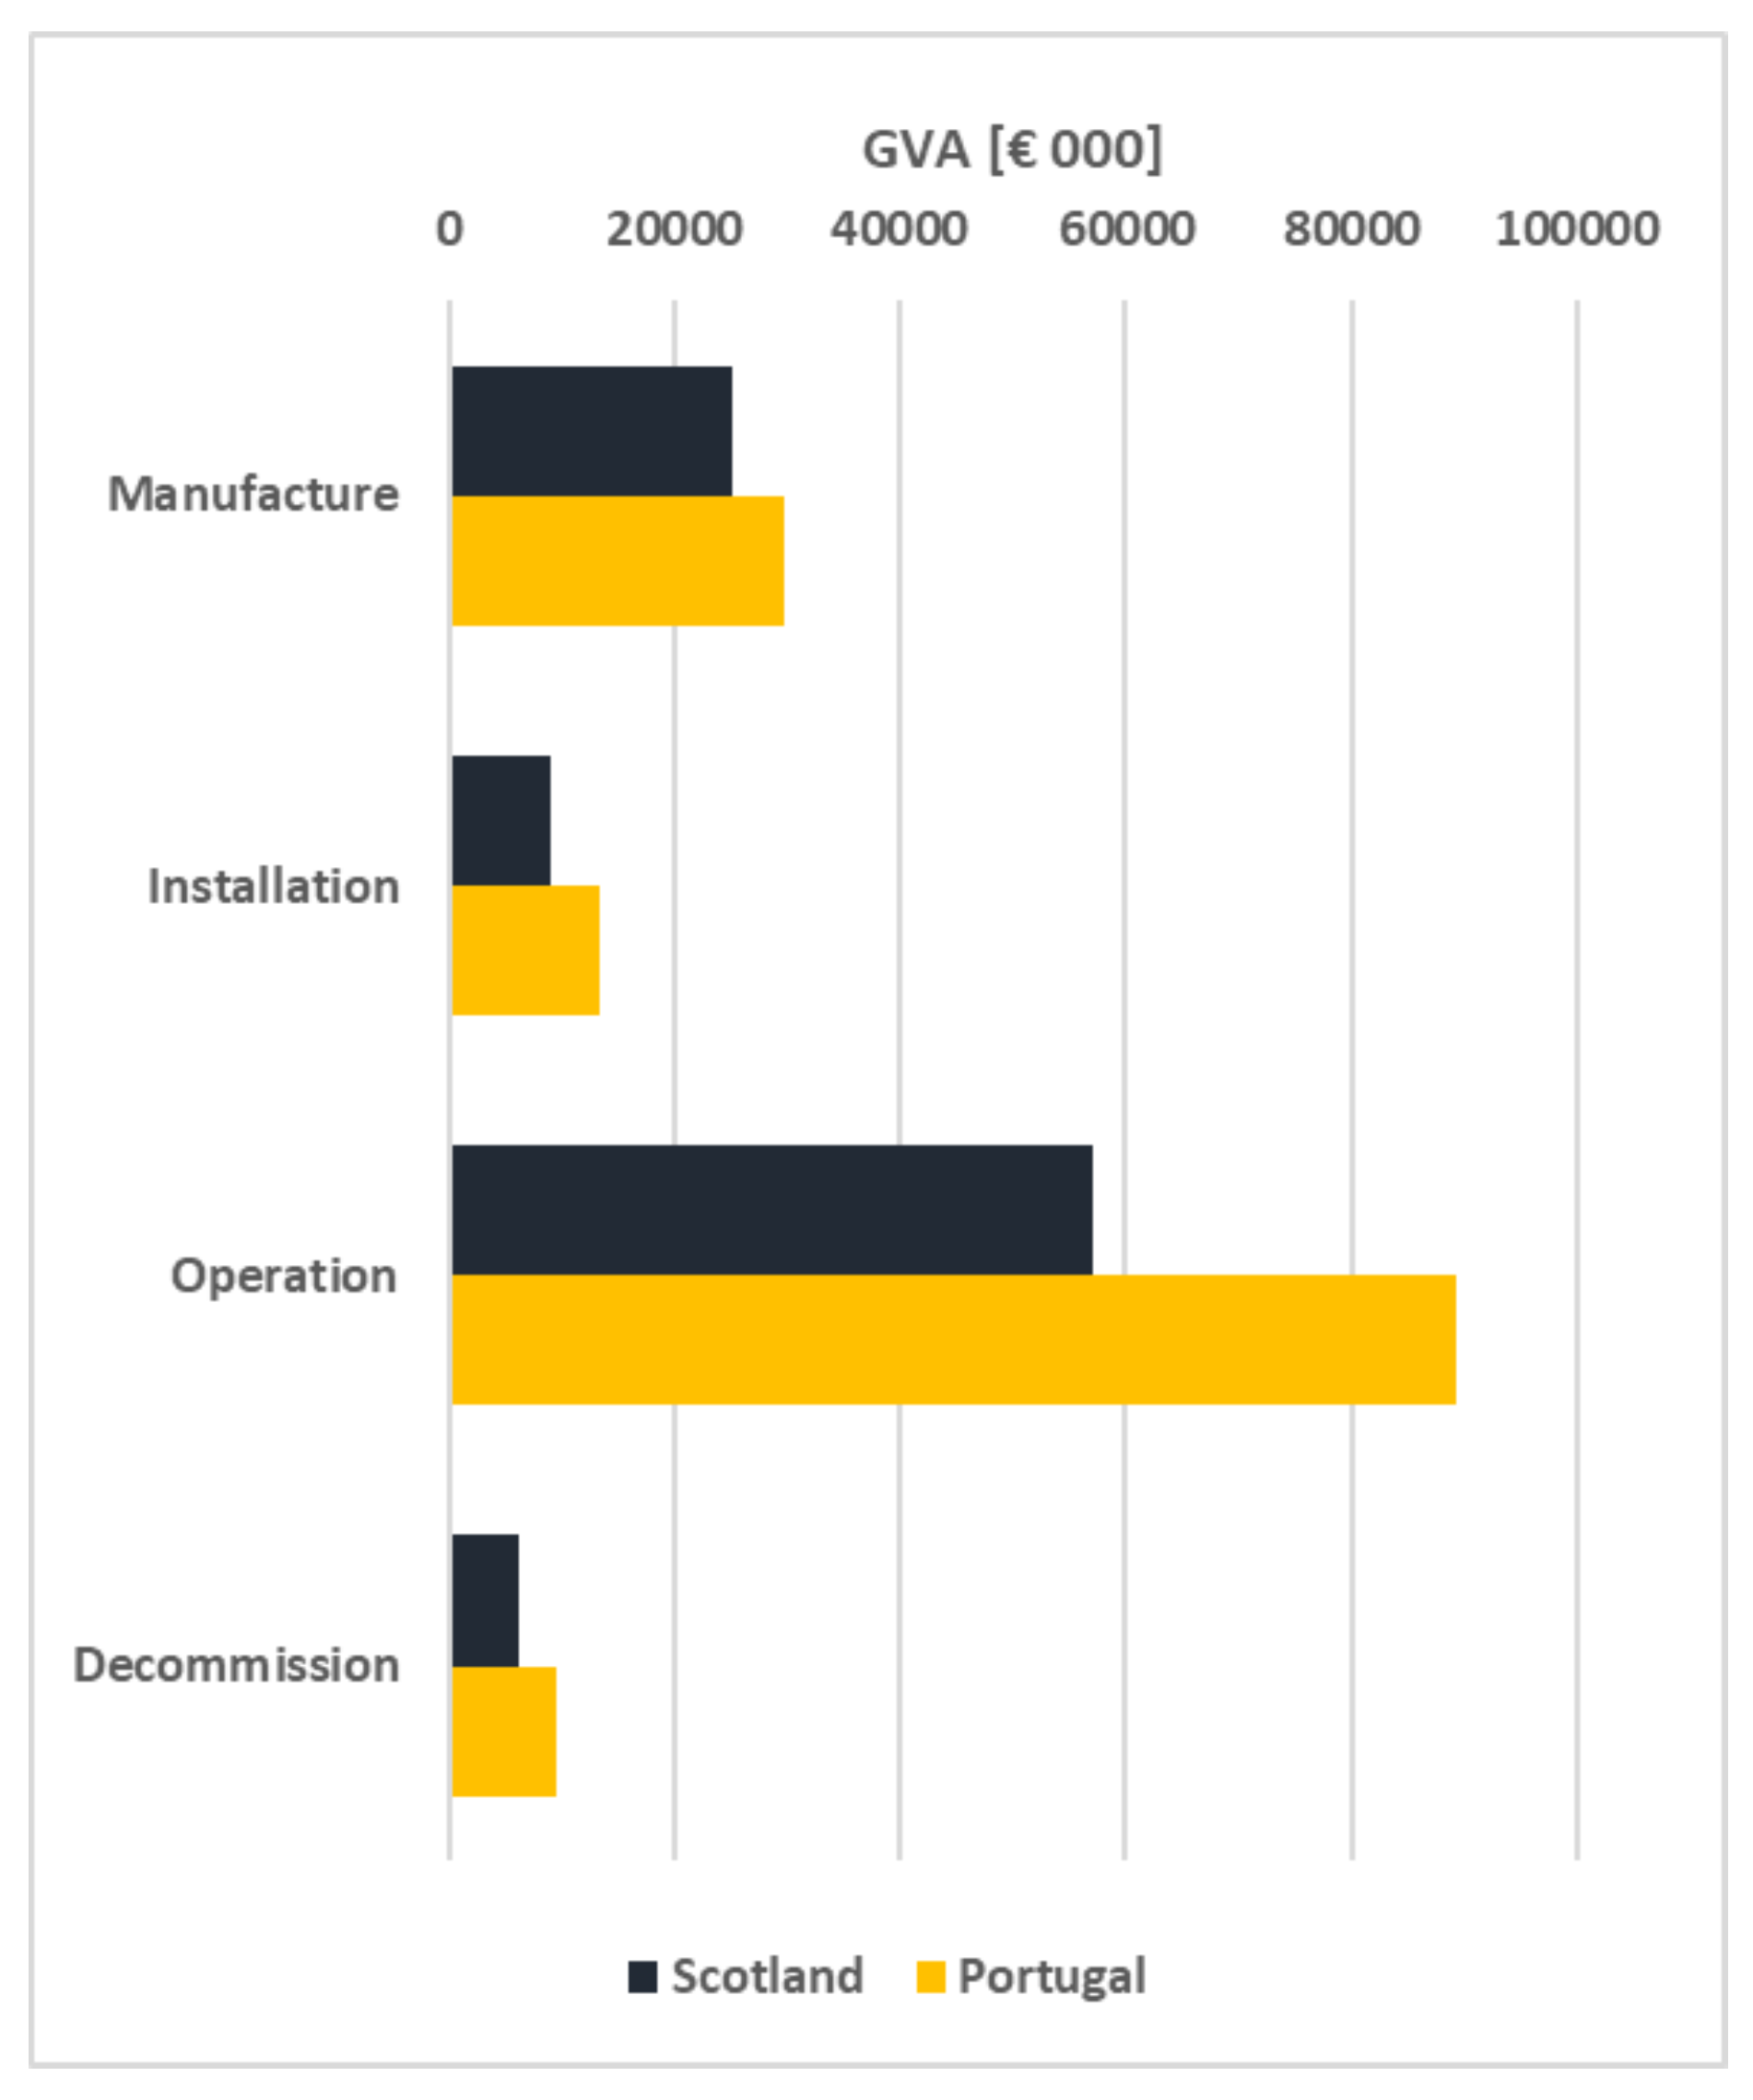
3.4. GVA
The total GVA associated with each of the project phases is presented in Figure 9. Peak annual GVA exceeds €16.5 m for the Portugal development, and €12.8 m for the Scotland equivelent. As expected there is a strong correlation between number of jobs and GVA for each project phase. However, it is evident that there is a larger proportion of total GVA associated with the operational phase, than the proportion of total jobs attributed to this phase. This is likely due to the nature of employment associated with the two phases; suggesting that a greater number of personnel is required per output of manufacture work than operations, which may be attributed to the large proportion of costs associated with vessel hire.
For the farm of OWC devices deployed in Scottish and Portuguese waters the normalized GVA was found to be €4.14 m/MW and €5.83 m/MW respectively. This (under normal exchange rates) is significantly larger than the hypothetical deployment of Aquamarine’s Oyster devices in Orkney with a value of £1.44 m/MW [18]. This is predominantly attributed to greater expenditure for the OWC device per MW than the Oyster; indicative of poorer techno-economic performance yet seemingly more beneficial macro-economics.
4. Discussion
4.1. Potential for Integrated Analysis Approach
Techno-economic models can be used to assess the LCOE of a given project, the potential cost reduction of a given technology, to aid in the design process of a technology and for preliminary feasibility studies for a project. By coupling a techno-economic model with a macro-economic model, the macro-economic benefits can be assessed at the same time, and inform in the decision making process.
As noted throughout the results section (Section 3), there is an apparent trade-off between techno-economic performance and macro-economic benefit of projects. The coupled model presented demonstrates the ability to integrate the analysis of both macro and techno-economics, enabling a consideration of this trade-off and a new (potentially subjective) optimum found for the technical design of the project. The most desirable outcome of the coupled analysis would depend on the perspective of the individual assessor. For example, project developers may prioritize reduction in LCOE and simply present the resulting expected number of jobs and GVA to funding bodies and local councils, whereas government bodies may prioritize jobs created associated with a project providing a threshold LCOE value is satisfied.
This type of integrated analysis approach also lends itself to the assessment of the both macro and techno-economic benefits of a circular economy implementation (see e.g., [37,38]), when assessed for a specific project. It has been suggested that the transition to a circular economy should have a broadly positive effect on the macro-economics (or at least not very negative) [39]. The project-specific effect of, for example: re-use, refurbishment and recycling of components in terms of micro-economics can be identified in the techno-economic model. A coupled model, similar to the one presented, also enables the possibility to assess the macro-economic implications associated with the change in external activities as a result of the circular economy system implementation.
4.2. Uncertainty and Model Sensitivity
As with all modeling work, there are several sources of uncertainty, stemming from the datasets used, assumptions implemented, and the modeling approach used. These are expanded upon in this section and are separated into those associated with the techno-economic model, and macro-economic model on Section 4.2.1 and Section 4.2.2respectively.
4.2.1. Techno-Economic Component
Techno-economic analysis presupposes a certain number of assumptions. At early stage technology development this is especially true, as many of the inputs are yet to be determined or decided, and it is common to use this type of analysis for design choice considerations.
In the case of the WETFEET project, the goal was to do a preliminary analysis under the Multi-disciplinary Assessment for Large-scale Deployment workpackage, in order to assess the viability of each breakthrough in relation to a reference case with no breakthroughs. While the analysis assessed the LCOE, the results presented were of a normalized LCOE, in reference to the reference case. The assumptions for this analysis were equal across breakthroughs and the reference case.
For this analysis, the power matrices used for energy output calculation were produced through numerical modelling, with no experimental validation. While the energy output has no impact on the macro-economic analysis, it has an inverse power relationship with the LCOE, meaning that a small deviation of capacity factor will not have a big impact, but a capacity factor 25% lower can represent a LCOE increase of 33%.
The costing of the device and its variants was done on the basis of the materials required, and typical values for fabrication of steel devices. Likewise, PTO costs were derived from cost curves for OWC devices. The structural costs are one of the major drivers of the CAPEX, and any variation will have a strong impact on the final LCOE (a change of 10% in structural costs represents a 3–4% change in LCOE).
For the logistic operations of installation and maintenance, the algorithms developed for the DTOcean project [29] have been adapted within the model, making use of the vessel database developed in the same project. This database in by no means exhaustive, and while all the unfeasible vessels (in terms of lifting capability, bollard pull and deck space) have been filtered out for this analysis, over dimensioned vessels were still included. The choice of vessel was made on the basis of minimizing the LCOE; however, for the same class of vessel, there can be a variability of cost of over 2x, that can represent up to an increase of 8% on the LCOE.
Furthermore, for the calculation of weather windows and storm conditions, statistical data derived from 20-year time series was used. While this is a rather simplistic approach, for the purpose of the project, a more detailed analysis was deemed unnecessary.
4.2.2. Macro-Economic Component
As the techno-economic outputs are used as inputs to the macro-economic model, any uncertainty in the CAPEX and OPEX values propagate into the macro-economic outputs. As the IO model is linear, as is the manner in which errors propagate. The extent these will affect the total macro-economic assessment will depend on magnitude of the errors in each sector, along with their associated multipliers.
In addition to uncertainty resulting from the techno-economic modeling outputs there are number of notable areas of uncertainty pertinent to the macro-economic modeling work. One of these is the method of classifying CAPEX and OPEX expenditure entries to SICs. As discussed in Section 2.5.2, sometimes this relied on judgment for the allocation, and the occasional individual entry was split across multiple SICs. Although the overall errors associated with mis-classification are likely to be minimal, they are somewhat difficult to quantify, with their relative influence determined by the precise nature of the disputed sectors.
The use of estimated ready reckoner values (see Section 2.5.2) enables a more conservative and realistic figure to be used for the macro-economic modeling work. The model is highly sensitive to these estimated values, as they essentially reduce the expenditure to account only for the amount which influences the economic region of interest, and as such it is a significant area of uncertainty. Again, resulting from the linear nature of the model a change in ready reckoner for a given directly stimulated sector will induce a proportional alteration to total jobs, GVA and output associated with that SIC class. Specifically how this affects indirectly stimulated sectors will depend on the inter-sector relationships, and how the total (all class) values vary will depend on the relative expenditure associated with the class and its respective type II multipliers.
Lastly, it is worth discussing the implications of using an IO model to assess the macro-economic implications of the proposed wave farm. As mentioned (Section 2.4) this approach makes several simplifying assumptions, including that the supply side is completely passive. It is suggested in [13] that this has the effect of over-estimating the immediate effects and ignoring longer-term “legacy” effects when compared to more advanced Computable General Equilibrium (CGE) methods. Hence in reality the peak value of jobs, GVA and sectoral outputs are likely to be reduced when compared to the presented IO results, yet will be more smoothed out over time and will extend beyond the end of the project lifetime.
5. Conclusions
A coupled techno-economic–IO model was developed as part of the WETFEET project, and used to assess the macro-economic benefit of installing a 5.25 MW farm of oscillating water column wave energy devices in chosen locations in Scotland and Portugal. The analysis indicates that the development will directly stimulate several sectors associated with the construction, installation and operation of the devices, along with those associated with insurance and project management. Peak employment of 420 jobs and 190 jobs, for Portugal and Scotland respectively, is predicted during the combined installation and manufacturing phase, which is accompanied by an associated GVA for the same year of over €16.5 m and €12.8 m respectively. The differences for these project phases, along with the operation and decommissioning phases, are attributed to the increased distance to shore/port and the increased water depth at the Leixoes site in Portugal. This results in larger costs for the mooring and electrical cables, along with the expenditure on vessels for installation and maintenance of the farm.
The model outputs highlight the wide-reaching macro-economic benefit of projects of this type, and when used in combination with techno-economic analysis will provide additional information to investors, policy makers and funding bodies. The apparent trade-off between techno and macro-economics highlights the benefits of considering both and taking a holistic approach to project assessment.
Author Contributions
S.D. and I.S. jointly created the Input-Output model and led on the subsequent analysis and write up. M.S. developed and provided the techno-economic aspects of the model, while D.M.I. led the study. All authors read, edited and approved the manuscript.
Funding
This research was funded by the European Commission though the WETFEET project. Grant no. 641334.
Acknowledgments
The authors are grateful to the European Commission for funding the WETFEET project as part of the Horizon 2020 framework. A special thanks is owed to Grant Allan and David Crooks for their early guidance in the model development.
Conflicts of Interest
The authors declare no conflict of interest.
References
- Evans, D.V. A theory for wave-power absorption by oscillating bodies. J. Fluid Mech. 1976, 77, 1–25. [Google Scholar] [CrossRef]
- Cheng, E. Area of Earth’s Oceans—The Physics Factbook. 1997. Available online: https://hypertextbook.com/facts/1997/EricCheng.shtml (accessed on 11 September 2018).
- Gunn, K.; Stock-Williams, C. Quantifying the global wave power resource. Renew. Energy 2012, 44, 296–304. [Google Scholar] [CrossRef]
- Mustapa, M.; Yaakob, O.; Ahmed, Y.M.; Rheem, C.K.; Koh, K.; Adnan, F.A. Wave energy device and breakwater integration: A review. Renew. Sustain. Energy Rev. 2017, 77, 43–58. [Google Scholar] [CrossRef]
- ECONorthwest. Economic Impact Analysis of Wave Energy: Phase One; Technical report; ECONorthwest: Portland, OR, USA, 2009. [Google Scholar]
- Cucchiella, F. Future Trajectories of Renewable Energy Consumption in the European Union. Resources 2018, 7, 10. [Google Scholar] [CrossRef]
- De Andres, A.; Maillet, J.; Todalshaug, J.H.; Möller, P.; Bould, D.; Jeffrey, H. Techno-Economic Related Metrics for a Wave Energy Converters Feasibility Assessment. Sustainability 2016, 8, 1109. [Google Scholar] [CrossRef]
- Quitoras, M.R.D.; Abundo, M.L.S.; Danao, L.A.M. A techno-economic assessment of wave energy resources in the Philippines. Renew. Sustain. Energy Rev. 2018, 88, 68–81. [Google Scholar] [CrossRef]
- O’Connor, M.; Lewis, T.; Dalton, G. Techno-economic performance of the Pelamis P1 and Wavestar at different ratings and various locations in Europe. Renew. Energy 2013, 50, 889–900. [Google Scholar] [CrossRef]
- Costello, R.; Teillant, B.; Weber, J.; Ringwood, J.V. Techno-Economic Optimisation for Wave Energy Converters. In Proceedings of the 4h International Conference on Ocean Energy, Dublin, Ireland, 17–19 October 2012. [Google Scholar]
- Dalton, G.; Allan, G.; Beaumont, N.; Georgakaki, A.; Hacking, N.; Hooper, T.; Kerr, S.; O’Hagan, A.M.; Reilly, K.; Ricci, P.; et al. Economic and socio-economic assessment methods for ocean renewable energy: Public and private perspectives. Renew. Sustain. Energy Rev. 2015, 45, 850–878. [Google Scholar] [CrossRef] [Green Version]
- Bårdsen, G.; Nymoen, R. The Econometrics of Macroeconomic Modelling; Oxford Univeristy Press: Oxford, UK, 2004. [Google Scholar]
- Allan, G.J.; Lecca, P.; McGregor, P.G.; Swales, J.K. The economic impacts of marine energy developments: A case study from Scotland. Mar. Policy 2014, 43, 122–131. [Google Scholar] [CrossRef]
- Calculating the Economic Contribution of Beatrice Offshore Windfarm Limited; Beatrice Offshore Windfarm Ltd.: Moray Firth, UK, 2017; Available online: https://www.google.com.tw/url?sa=t&rct=j&q=&esrc= s&source=web&cd=1&ved=2ahUKEwi3toX9yZHeAhVOPHAKHad9D18QFjAAegQICRAC&url= http%3A%2F%2Fsse.com%2Fmedia%2F475205%2FBOWL-methodology-document-FINAL.pdf&usg= AOvVaw34RcX2spXhUXMh2RXwCjQG (accessed on 11 September 2018).
- Fraser of Allander Institute. Impact Study into the Development of the UK Offshore Renewable Energy Industry to 2020; Project Report; Fraser of Allander Institute: Glasgow, UK, 2014; pp. 1–24. [Google Scholar]
- Ernst & Young. Analysis of the Value Creation Potential of Wind Energy Policies; Ernst & Young: London, UK, 2012. [Google Scholar]
- Okkonen, L.; Lehtonen, O. Socio-economic impacts of community wind power projects in Northern Scotland. Renew. Energy 2016, 85, 826–833. [Google Scholar] [CrossRef]
- SQW Consulting. Socio-Economic Impact Assessment of Aquamarine Power’s Oyster Projects: Report to Aquamarine Power; Technical Report; SQW Consulting: Cambridge, UK, 2009. [Google Scholar]
- Crooks, D.; De Andres, A.; Medina-Lopez, E.; Jeffrey, H. Demonstration of a Socio-economic Cost of Energy Analysis of a Wave Energy Converter Array. In Proceedings of the 12th European Wave and Tidal Energy Conference, Cork, Ireland, 27 August–1 September 2017; pp. 1–11. [Google Scholar]
- Allan, G.J.; Bryden, I.; McGregor, P.G.; Stallard, T.; Kim Swales, J.; Turner, K.; Wallace, R. Concurrent and legacy economic and environmental impacts from establishing a marine energy sector in Scotland. Energy Policy 2008, 36, 2734–2753. [Google Scholar] [CrossRef] [Green Version]
- WETFEET. WETFEET Project. 2018. Available online: http://www.wetfeet.eu/wetfeet-project/ (accessed on 11 September 2018).
- CORDIS. Wave Energy Transition to Future by Evolution of Engineering and Technology; H2020. CORDIS, 2015. Available online: https://cordis.europa.eu/project/rcn/193803_en.html (accessed on 11 September 2018).
- Teillant, B.; Debruyne, Y.; Sarmento, A.; Silva, M.; Simas, T.; Gomes, R.P.; Henriques, J.C.; Philippe, M.; Combourieu, A.; Fontana, M. D2.1—Designs and Specifications of an OWC Able to Integrate The Negative Spring; Technical Report 641334; WETFEET: Lisboa, Portugal, 2016. [Google Scholar]
- Evans, D.V. The oscillating water column wave energy device. IMA J. Appl. Math. 1978, 22, 423–433. [Google Scholar]
- EMEC. Facilities. 2015. Available online: http://www.emec.org.uk/facilities/ (accessed on 11 September 2018).
- Pontes, M.T.; Rebêlo, L.; Silva, P.; Pata, C. Database of wave energy potential in Portugal. In Proceedings of the ASME 2005 24th International Conference on Offshore Mechanics and Arctic Engineering, Halkidiki, Greece, 2–17 June 2005; pp. 803–809. [Google Scholar]
- Wave Energy Scotland. WES O&M Model: P2; Wave Energy Scotland: Inverness, UK, 2017. [Google Scholar]
- Teillant, B.; Raventos, A.; Chainho, P.; Victor, L.; Goormachtigh, J.; Nava, V.; Ruiz, P.; Minguela, R.J. Deliverable 5.1: Methodology Report and Logistic Model Flow Charts; DTOcean, 2014. Available online: https://www.google.com.tw/search?newwindow=1&ei=GlPJW4z7ApH1wAPoz6XADQ&q= Deliverable+5.1%3A+Methodology+Report+and+Logistic+Model+Flow+Charts&oq=Deliverable+5.1% 3A+Methodology+Report+and+Logistic+Model+Flow+Charts&gs_l=psy-ab.3...0.0.0.28320.0.0.0.0.0.0.0.0..0.0....0...1..64.psy-ab..0.0.0....0.zPkarVc4m_Q (accessed on 11 September 2018).
- Teillant, B.; Chainho, P.; Vrousos, C.; Vicente, P.; Charbonier, K.; Ybert, S.; Monbet, P.; Giebhardt, J. Report on Logistical Model for Ocean Energy Array and Considerations; Project Deliverable D5.6. DTOcean, 2016. Available online: http://www.dtocean.eu/Deliverables/Deliverables/Logistical-model (accessed on 11 September 2018).
- Silva, M.; Afferni, L.; Sebastian, R. D7.3 Techno-Economic Assessment of the Proposed Breakthroughs For Large Scale Deployment; Technical Report; WETFEET: Lisboa, Portugal, 2018. [Google Scholar]
- Draycott, S.; Szankowska, I.; Chaperon, C.; Yerzhanov, A. D7.5—LCA and Socio-Economic Implications of Large Scale Deployment of the Proposed Breakthroughs; Technical Report; WETFEET: Lisboa, Portugal, 2018. [Google Scholar]
- Scottish Enterprise. Additionality & Economic Impact Assessment Guidance Note; Scottish Enterprise: Glasgow, UK, 2008; pp. 1–28. [Google Scholar]
- Leontief, W. Input-Ouput Economics; Oxford University Press: Oxford, UK, 1986; p. 396. [Google Scholar]
- Crossdale, S.; Campbell, G.; O’Neill, K. Input-Output Methodology Guide; The Scottish Government: Edinburgh, UK, 2015. [Google Scholar]
- None, N. Annual Energy Outlook 2016 With Projections to 2040; Technical Report; USDOE Energy Information Administration (EI): Washington, DC, USA, 2016. [Google Scholar]
- Rutovitz, J.; Dominish, E.; Downes, J. Calculating Global Energy Sector Jobs: 2015 Methodology Update; Institute for Sustainable Futures: University of Technology, Sydney, Australia, 2015. [Google Scholar]
- Prieto-Sandoval, V.; Jaca, C.; Ormazabal, M. Towards a consensus on the circular economy. J. Clean. Prod. 2018, 179, 605–615. [Google Scholar] [CrossRef]
- Kirchherr, J.; Piscicelli, L.; Bour, R.; Kostense-Smit, E.; Muller, J.; Huibrechtse-Truijens, A.; Hekkert, M. Barriers to the Circular Economy: Evidence From the European Union (EU). Ecol. Econ. 2018, 150, 264–272. [Google Scholar] [CrossRef]
- McCarthy, A.; Dellink, R.; Bibas, R. The Macroeconomics of the Circular Economy Transition: A Critical Review of Modelling Approaches; Technical Report; OECD Publishing: Paris, France, 2018. [Google Scholar]
Figure 1.
Diagram depicting the three point catenary mooring used for the model.

Figure 2.
Diagram depicting the farm of OWC devices (5 of 35 devices shown). The sub-sea cable configuration is shown, using a star configuration for umbilical cables.
Figure 2.
Diagram depicting the farm of OWC devices (5 of 35 devices shown). The sub-sea cable configuration is shown, using a star configuration for umbilical cables.

Figure 3.
Scatter diagrams of significant wave height and energy period for the locations in Scotland and Portugal. Use of colour and associated values denote the probability of occurrence of a sea state in a given bin for the site. Bin sizes are 0.5 m and 1 s.
Figure 3.
Scatter diagrams of significant wave height and energy period for the locations in Scotland and Portugal. Use of colour and associated values denote the probability of occurrence of a sea state in a given bin for the site. Bin sizes are 0.5 m and 1 s.

| 0.49 | 0.49 |
| (a) | (b) |
Figure 4.
Diagram showing the main inputs and information flow for the coupled techno-economic–IO model. The key model choices (location and breakthrough type) are displayed above the blocks, while the attributes associated with those choices are shown from the left.
Figure 4.
Diagram showing the main inputs and information flow for the coupled techno-economic–IO model. The key model choices (location and breakthrough type) are displayed above the blocks, while the attributes associated with those choices are shown from the left.

Figure 5.
Diagram depicting the process and interdependencies of completing the IO model.

Figure 6.
LCOE breakdown for OWC farms installed in in Scotland and Portugal.

| 0.58 | 0.40 |
| (a) b | (b) b |
Figure 7.
Total direct and Type II output for the 29 aggregated sectors, shown for the OWC farm installed in Portugal and Scotland.
Figure 7.
Total direct and Type II output for the 29 aggregated sectors, shown for the OWC farm installed in Portugal and Scotland.

Figure 8.
Total job years per project phase, shown for the farm of OWC device installed in both Portugal and Scotland.
Figure 8.
Total job years per project phase, shown for the farm of OWC device installed in both Portugal and Scotland.

Figure 9.
Total GVA per project phase, shown for the farm of OWC device installed in both Portugal and Scotland.
Figure 9.
Total GVA per project phase, shown for the farm of OWC device installed in both Portugal and Scotland.


Table 1.
Site-specific distances and water depths.
| Leixoes | EMEC | |
|---|---|---|
| Distance from nearest large port to site (km) | 25 | 13 |
| Distance from nearest small O&M port to site (km) | 25 | 13 |
| Distance from site to shore (km) | 26 | 3.7 |
| Distance from shore to substation/grid (km) | 2 | 0.25 |
| Water depth at central farm location (km) | 80 | 50 |
Table 2.
Aggregated SIC classes used for IO modelling.
| SIC | Grouped Sector Names |
|---|---|
| 38.–39. | Waste, remediation & management |
| 01.–03. | Agriculture, forestry and fishing |
| 09. | Other mining and quarrying |
| 10.–11. | Food and drinks processing |
| 14. | Clothing |
| 19.–20. | Chemicals |
| 15.–18. | Metal and non-metal goods |
| 50. | Water transport |
| 21.–24., 31.–32. | Other manufacturing |
| 36.–37. | Water |
| 41.–43., 81 | Construction |
| 49., 51.–52. | Distribution and other transport |
| 61.–64., 66.–68., 82. | Communications, finance and business |
| 53.–60., 73.–75., 78.–80., 84.–97. | Education, public and other services |
| 05.–08. | Coal, Oil and Gas extraction |
| 12. | Tobacco |
| 35. | Gas and Electricity |
| 45.–47. | Wholesale and Retail |
| 13. | Textiles |
| 25. | Fabricated metal |
| 26.–27. | Electrical equipment |
| 28. | Machinery and equipment |
| 29. | Motor Vehicles |
| 30. | Other transport equipment |
| 33. | Repair and maintenance |
| 65. | Insurance and pensions |
| 69. | Legal activities |
| 70.–72. | Architectural services etc |
| 77. | Rental and leasing services |
Table 3.
Ready Reckoners implemented in the IO model.
| Textiles | Deadweight | Leakage | Displacement | Substitution |
|---|---|---|---|---|
| Cement lime and plaster | 0.00 | 0.50 | 0.00 | 0.00 |
| Fabricated metal | 0.00 | 0.50 | 0.00 | 0.00 |
| Electrical equipment | 0.00 | 0.50 | 0.00 | 0.00 |
| Machinery and equipment | 0.00 | 0.50 | 0.00 | 0.00 |
| Motor Vehicles | 0.00 | 0.50 | 0.00 | 0.00 |
| Other transport equipment | 0.00 | 0.80 | 0.25 | 0.25 |
| Repair and maintenance | 0.00 | 0.00 | 0.00 | 0.00 |
| Construction | 0.00 | 0.00 | 0.00 | 0.00 |
| Water transport | 0.00 | 0.00 | 0.25 | 0.50 |
| Insurance and pensions | 0.00 | 0.00 | 0.00 | 0.20 |
| Legal activities | 0.00 | 0.00 | 0.00 | 0.00 |
| Architectural services etc | 0.00 | 0.00 | 0.00 | 0.00 |
| Rental and leasing services | 0.00 | 0.00 | 0.00 | 0.00 |
© 2018 by the authors. Licensee MDPI, Basel, Switzerland. This article is an open access article distributed under the terms and conditions of the Creative Commons Attribution (CC BY) license (http://creativecommons.org/licenses/by/4.0/).
Share and Cite
MDPI and ACS Style
Draycott, S.; Szadkowska, I.; Silva, M.; Ingram, D.M. Assessing the Macro-Economic Benefit of Installing a Farm of Oscillating Water Columns in Scotland and Portugal. Energies 2018, 11, 2824. https://doi.org/10.3390/en11102824
AMA Style
Draycott S, Szadkowska I, Silva M, Ingram DM. Assessing the Macro-Economic Benefit of Installing a Farm of Oscillating Water Columns in Scotland and Portugal. Energies. 2018; 11(10):2824. https://doi.org/10.3390/en11102824
Chicago/Turabian StyleDraycott, Samuel, Iwona Szadkowska, Marta Silva, and David M Ingram. 2018. "Assessing the Macro-Economic Benefit of Installing a Farm of Oscillating Water Columns in Scotland and Portugal" Energies 11, no. 10: 2824. https://doi.org/10.3390/en11102824
Note that from the first issue of 2016, this journal uses article numbers instead of page numbers. See further details here.