Article

Energy Production Benefits by Wind and Wave Energies for the Autonomous System of Crete

by
George Lavidas
1,*,† and
Vengatesan Venugopal
2,†
1
Faculty of Maritime, Mechanical & Materials Engineering, Delft University of Technology, 2628 CD Delft, The Netherlands
2
Institute for Energy Systems, The University of Edinburgh, Edinburgh EH8 9YL, UK
*
Author to whom correspondence should be addressed.
These authors contributed equally to this work.
Energies 2018, 11(10), 2741; https://doi.org/10.3390/en11102741
Submission received: 14 September 2018 / Revised: 4 October 2018 / Accepted: 9 October 2018 / Published: 12 October 2018
(This article belongs to the Special Issue Offshore Renewable Energy: Ocean Waves, Tides and Offshore Wind)

Abstract

:
At autonomous electricity grids Renewable Energy (RE) contributes significantly to energy production. Offshore resources benefit from higher energy density, smaller visual impacts, and higher availability levels. Offshore locations at the West of Crete obtain wind availability ≈80%, combining this with the installation potential for large scale modern wind turbines (rated power) then expected annual benefits are immense. Temporal variability of production is a limiting factor for wider adaptation of large offshore farms. To this end multi-generation with wave energy can alleviate issues of non-generation for wind. Spatio-temporal correlation of wind and wave energy production exhibit that wind and wave hybrid stations can contribute significant amounts of clean energy, while at the same time reducing spatial constrains and public acceptance issues. Offshore technologies can be combined as co-located or not, altering contribution profiles of wave energy to non-operating wind turbine production. In this study a co-located option contributes up to 626 h per annum, while a non co-located solution is found to complement over 4000 h of a non-operative wind turbine. Findings indicate the opportunities associated not only in terms of capital expenditure reduction, but also in the ever important issue of renewable variability and grid stability.

1. Introduction

Greece is located at the East Mediterranean Sea and among its unique characteristics is the high number of islands that rely on fossil fuels, constituting a wide number of small decentralized energy systems. Crete is the biggest island of Greece, its electricity system can be characterized as a decentralized (autonomous) network which relies for its energy production on a mixture of predominately wind and solar. Renewable energy (RE) such as wind (≈187.6 MW) and solar (≈95.5 MW) have experienced a growth in their installed capacities, although their base load and peak demand is still heavily dependent on conventional fuels [1,2]. The Cretan electrical system is heavily dependent on three oil-fired thermal power plants with ≈700 MW rated capacity.
The stochastic nature of RE often is not able to provide energy and cover demand when needed [3,4]. Higher scenarios of renewable integration have been proposed, with main limitation for higher penetration their perceived effects on electrical grid stability [5]. To assist in the adaptation of renewables alternatives which reduce conventional fuels and increase energy independence such as storage and/or mainland interconnection have been suggested [6,7,8].
There are significant financial considerations to be taken into account with the future increase of RE expected. They are associated with the infrastructure needed to maintain uninterrupted power supply and the cost of energy [9,10,11,12]. Several solutions have been proposed to assist with the energy transition, such as energy storage alternatives [13,14,15,16], and development of small autonomous grids, to reduce the curtailments of RE when peak demand is exceeded [17,18,19]. More specifically [3] explored seasonal variations of wind energy in the Danish system, and assessed the system’s response flexibility due to high energy curtailments. An alternative was to considered electricity storage technologies for power system balancing with potential technologies including batteries, flow batteries, electric vehicles, Compressed Air Energy Systems (CAES), and Pumped Hydro Systems (PHS).
For the Greek region Kaldellis et al. [20] explored energy system losses, and the implications of income losses due to restricted access of renewable energy to the local grid. This has prompted numerous studies to explore methods to complement of renewable curtailments and income losses due to system restriction. Alternatives explored have been batteries, Pumped Hydro Storage (PHS), desalination and CAES among other proposed solutions [16,21,22,23,24].
This study addresses the temporal combination of two overlapping resources, that can assist in addressing the intermittent production and accelerate the level of RE acceptance in the local grid. Greece has relied heavily on limited number of renewable resource, with others under-investigated [25,26,27].
The results enhance knowledge in the opportunities of wind and wave multi-generation, and provide tangible evidence for the inclusion of the other untapped resources that exist in the Aegean Sea. Temporal interconnection of RE can reduce the variability issues and adjust generation into a more continuous profile. To ensure such a coupling the power production trends of major renewable components in a system have to be evaluated temporally and coupling alternatives must provide some level of temporal satisfaction.
While a deterministic solution is not feasible at this stage, the methodology, data sourcing/manipulation and analysis for energy production is applicable globally. Resources are firstly quantified independently, and their power performance is analyzed. Subsequently, co-located and non co-located scenarios are assessed in terms of coverage for missing production intervals. Since wind power is more established, proven, and offers higher rated capacity devices it is consider as the “base” energy source. Wave converters act as a substitution mechanism. Temporal overlaps in energy production are assessed and determine the coverage that can be offered based on two installation options, co-located and non co-located.

2. Materials and Methods

2.1. Benefits of Multi-generation

Use of multiple renewable technologies can provide some levels of “storage” through resource dependence, due to resource dependence. Currently, in Crete, the most dominant RE technology is wind followed by photovoltaic (PV) and solar. In terms of operating profiles PV/solar have a specific range of temporal operation. This is associated with hours of sunshine, hence predominately over a period of 8–9 a.m. to 18–19 p.m., on the other hand wind generation is temporally more distributed. While, this is a major benefit in terms of total production hours, the disadvantage of wind is its associated variability i.e. wind tend to change at rapid rates. Bai et al. [28] discussed the necessity for realistic wind forecasting in order to minimize losses due to the variable nature of wind. The study focused on forecasting and presented the complexities that exist in uncertainty reduction.
Another resource available to the region, though under-investigated is the wave energy resource [25,29]. Waves predominately are generated by wind interactions with the upper layer of the sea. This in turn generates and propagates waves, for this reason wave resources are classified as wind-waves (locally generated or enhanced) and swells. Swells represent wave components generated and propagated in a far distance from our interest locations. These components when propagated over large depths are able to amplify their energy content and encompass large fluxes of energy. Indirectly waves, due to their nature and properties act as a “storage” medium for wind energy. Wave velocities can exceed the wind speed, though the majority of times the wave resource is propagated with a time-lag from its originating wind [15,30,31].

2.2. Methodology

Offshore wind data are obtained from the Climate Forecast System Reanalysis (CFSR) wind global datasets [32]. Wave data are extracted by a wave hindcast database produced by the authors with a high–resolution nearshore wave numerical model. Calibration, validation and a resource analysis can be found in Lavidas et al. [33] and Lavidas and Venugopal [25]. Both datasets have a 1-h timestep interval and correspond to the same offshore coordinates (see Figure 1). Distance of locations from nearest coast is also accounted for, to provide realistic and feasible estimate according to international practises, for Point 1 is ≈14 km and for Point 2 ≈12.5 km.
To estimate energy production capabilities both resources are evaluated against potential devices. The offshore wind turbine is a Vestas V112-3.3 MW [34]. There are numerous wave energy converters (WECs) [35], although their level of maturity varies. In contrast to solar and wind power production, wave energy poses a more complex problem. To estimate power production both wave height ( H s i g ) and appropriate wave period have be combined. Selecting a suitable WEC depends highly on the local environment, and critical decision making. Performance of seven different WEC has been automatically estimated for the location, with the capacity factor indicating the optimal selection. This allowed us to select the optimum operating device based on the characteristics of local resource and corresponding power matrix. A detailed discussion, on how to estimate and perform a coupling for wave energy and resource assessment has been presented in previous studies [25,36,37].
The overlapping production is achieved as there is a dependence of waves by wind resources. The analysis does not considered separation of swell waves, as focus is given on the energy produced by the WEC based on complex mixed sea states. To determine the cross-correlation ( c R ) of wind and wave energy, the following Equation (1) is used:
c R ( τ ) = 1 N · t = 1 N τ W i n d e l t μ W i n d e l · W a v e e l t + τ μ W a v e e l s t d W i n d e l · s t d W a v e e l
where τ is the time lag, set at 1 h, s t d the standard deviation, μ the mean electrical power (of wind and/or wave), and N the sample size over time (t). The c R provides the correspondence of variables, classifying the instantaneous production. One hour step interval provides important information about the potential use of co-located wind-wave farms, that are expected to reduce variability of production. Fusco et al. [30] suggested that although the time-lag can be subjected to any range, a higher range will deteriorate the correlation for system balancing, and reduces c R . Astariz and Iglesias [38] gave similar insights on cross-correlation of resources, both authors suggested a time lag of 1 h. In Table 1 we have classified the levels of cross correlation according to c R values.
Another metric also considered is the standard deviation of produced electrical power. This examines deviation of energy production, and assesses its “distance” from the nominal installed capacity. Representing a percentage of variability within the sample.

3. Results and Analysis

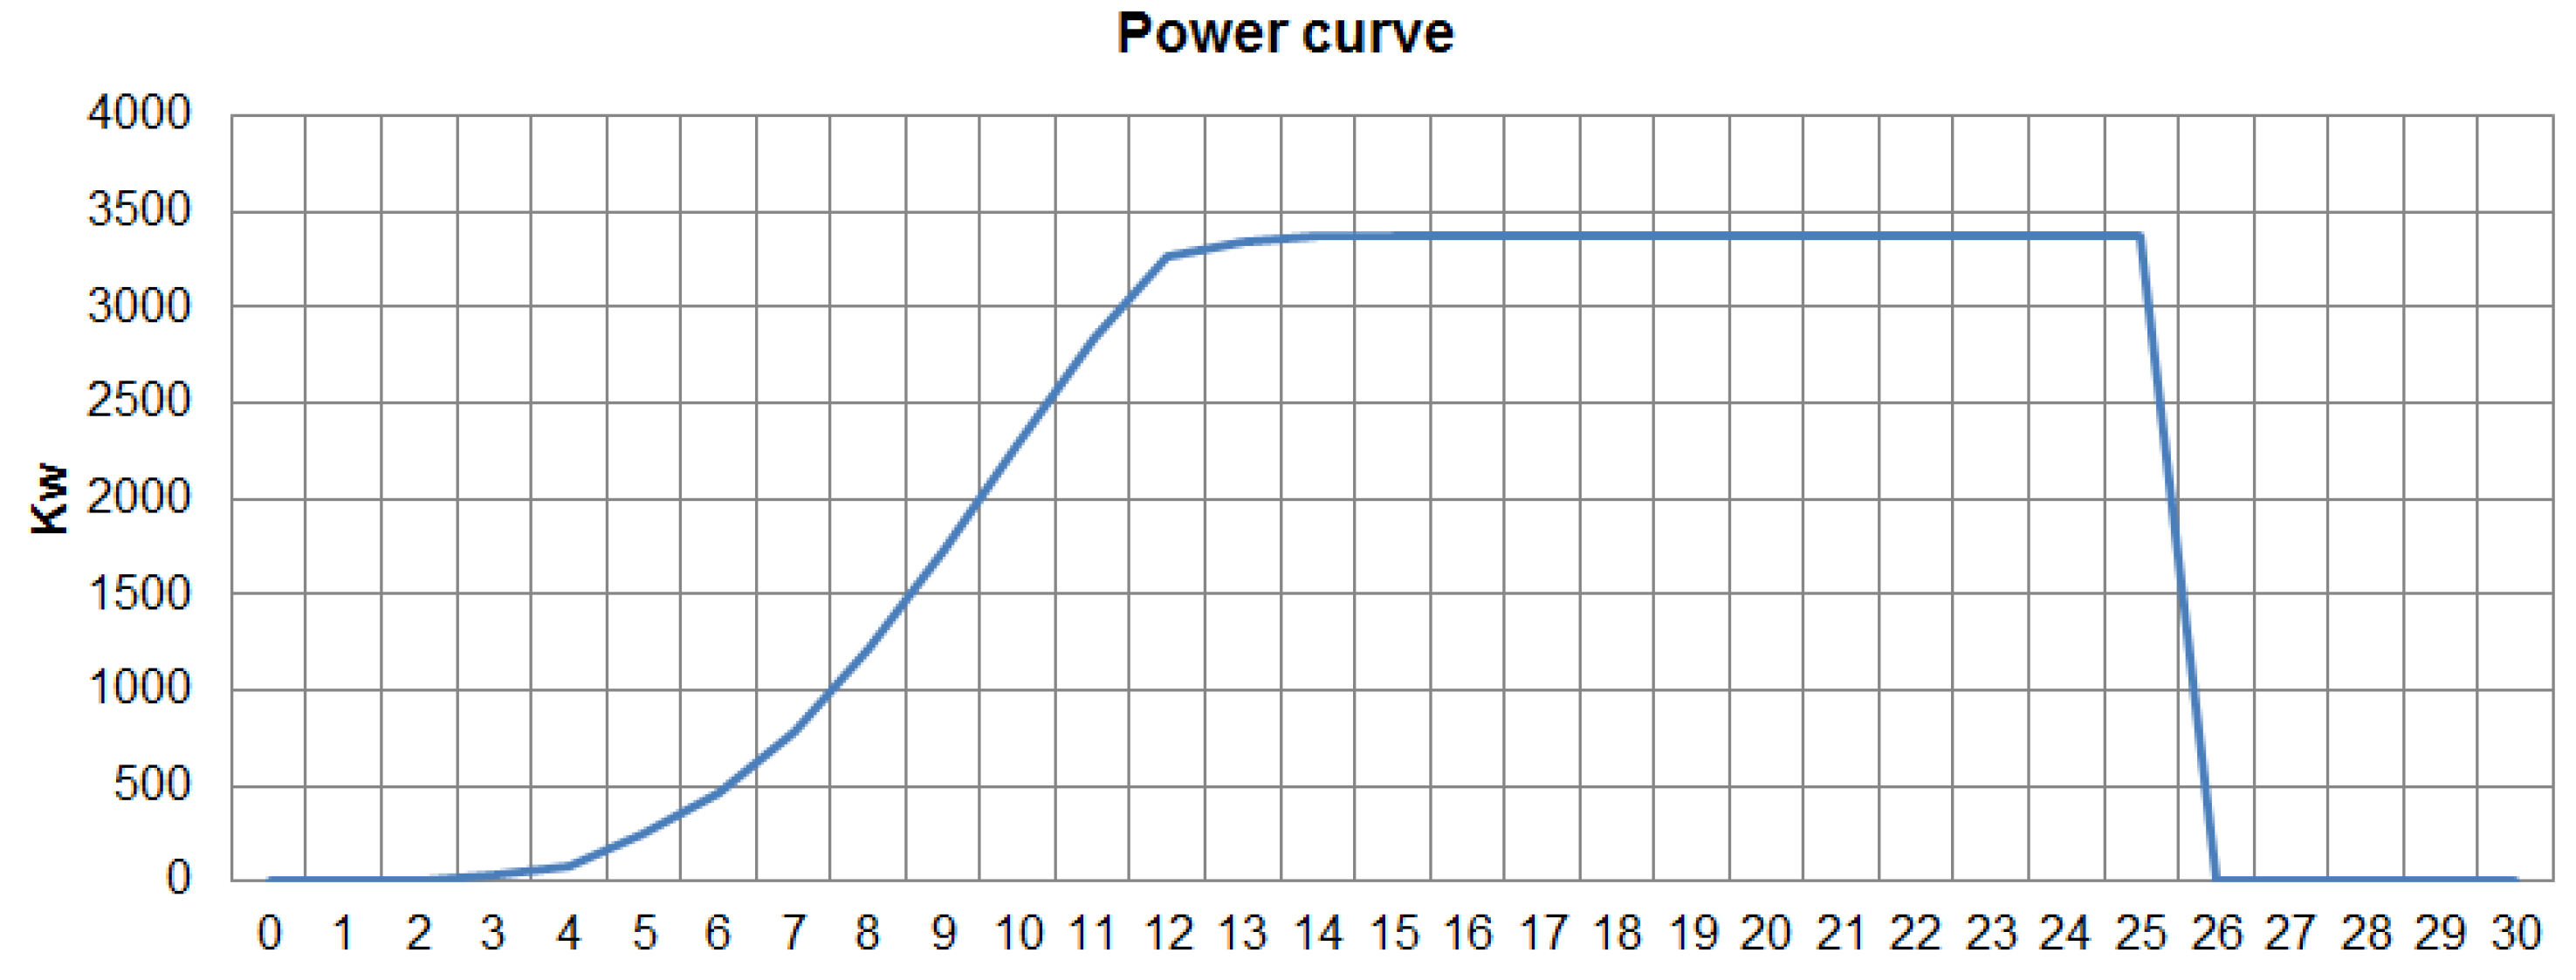
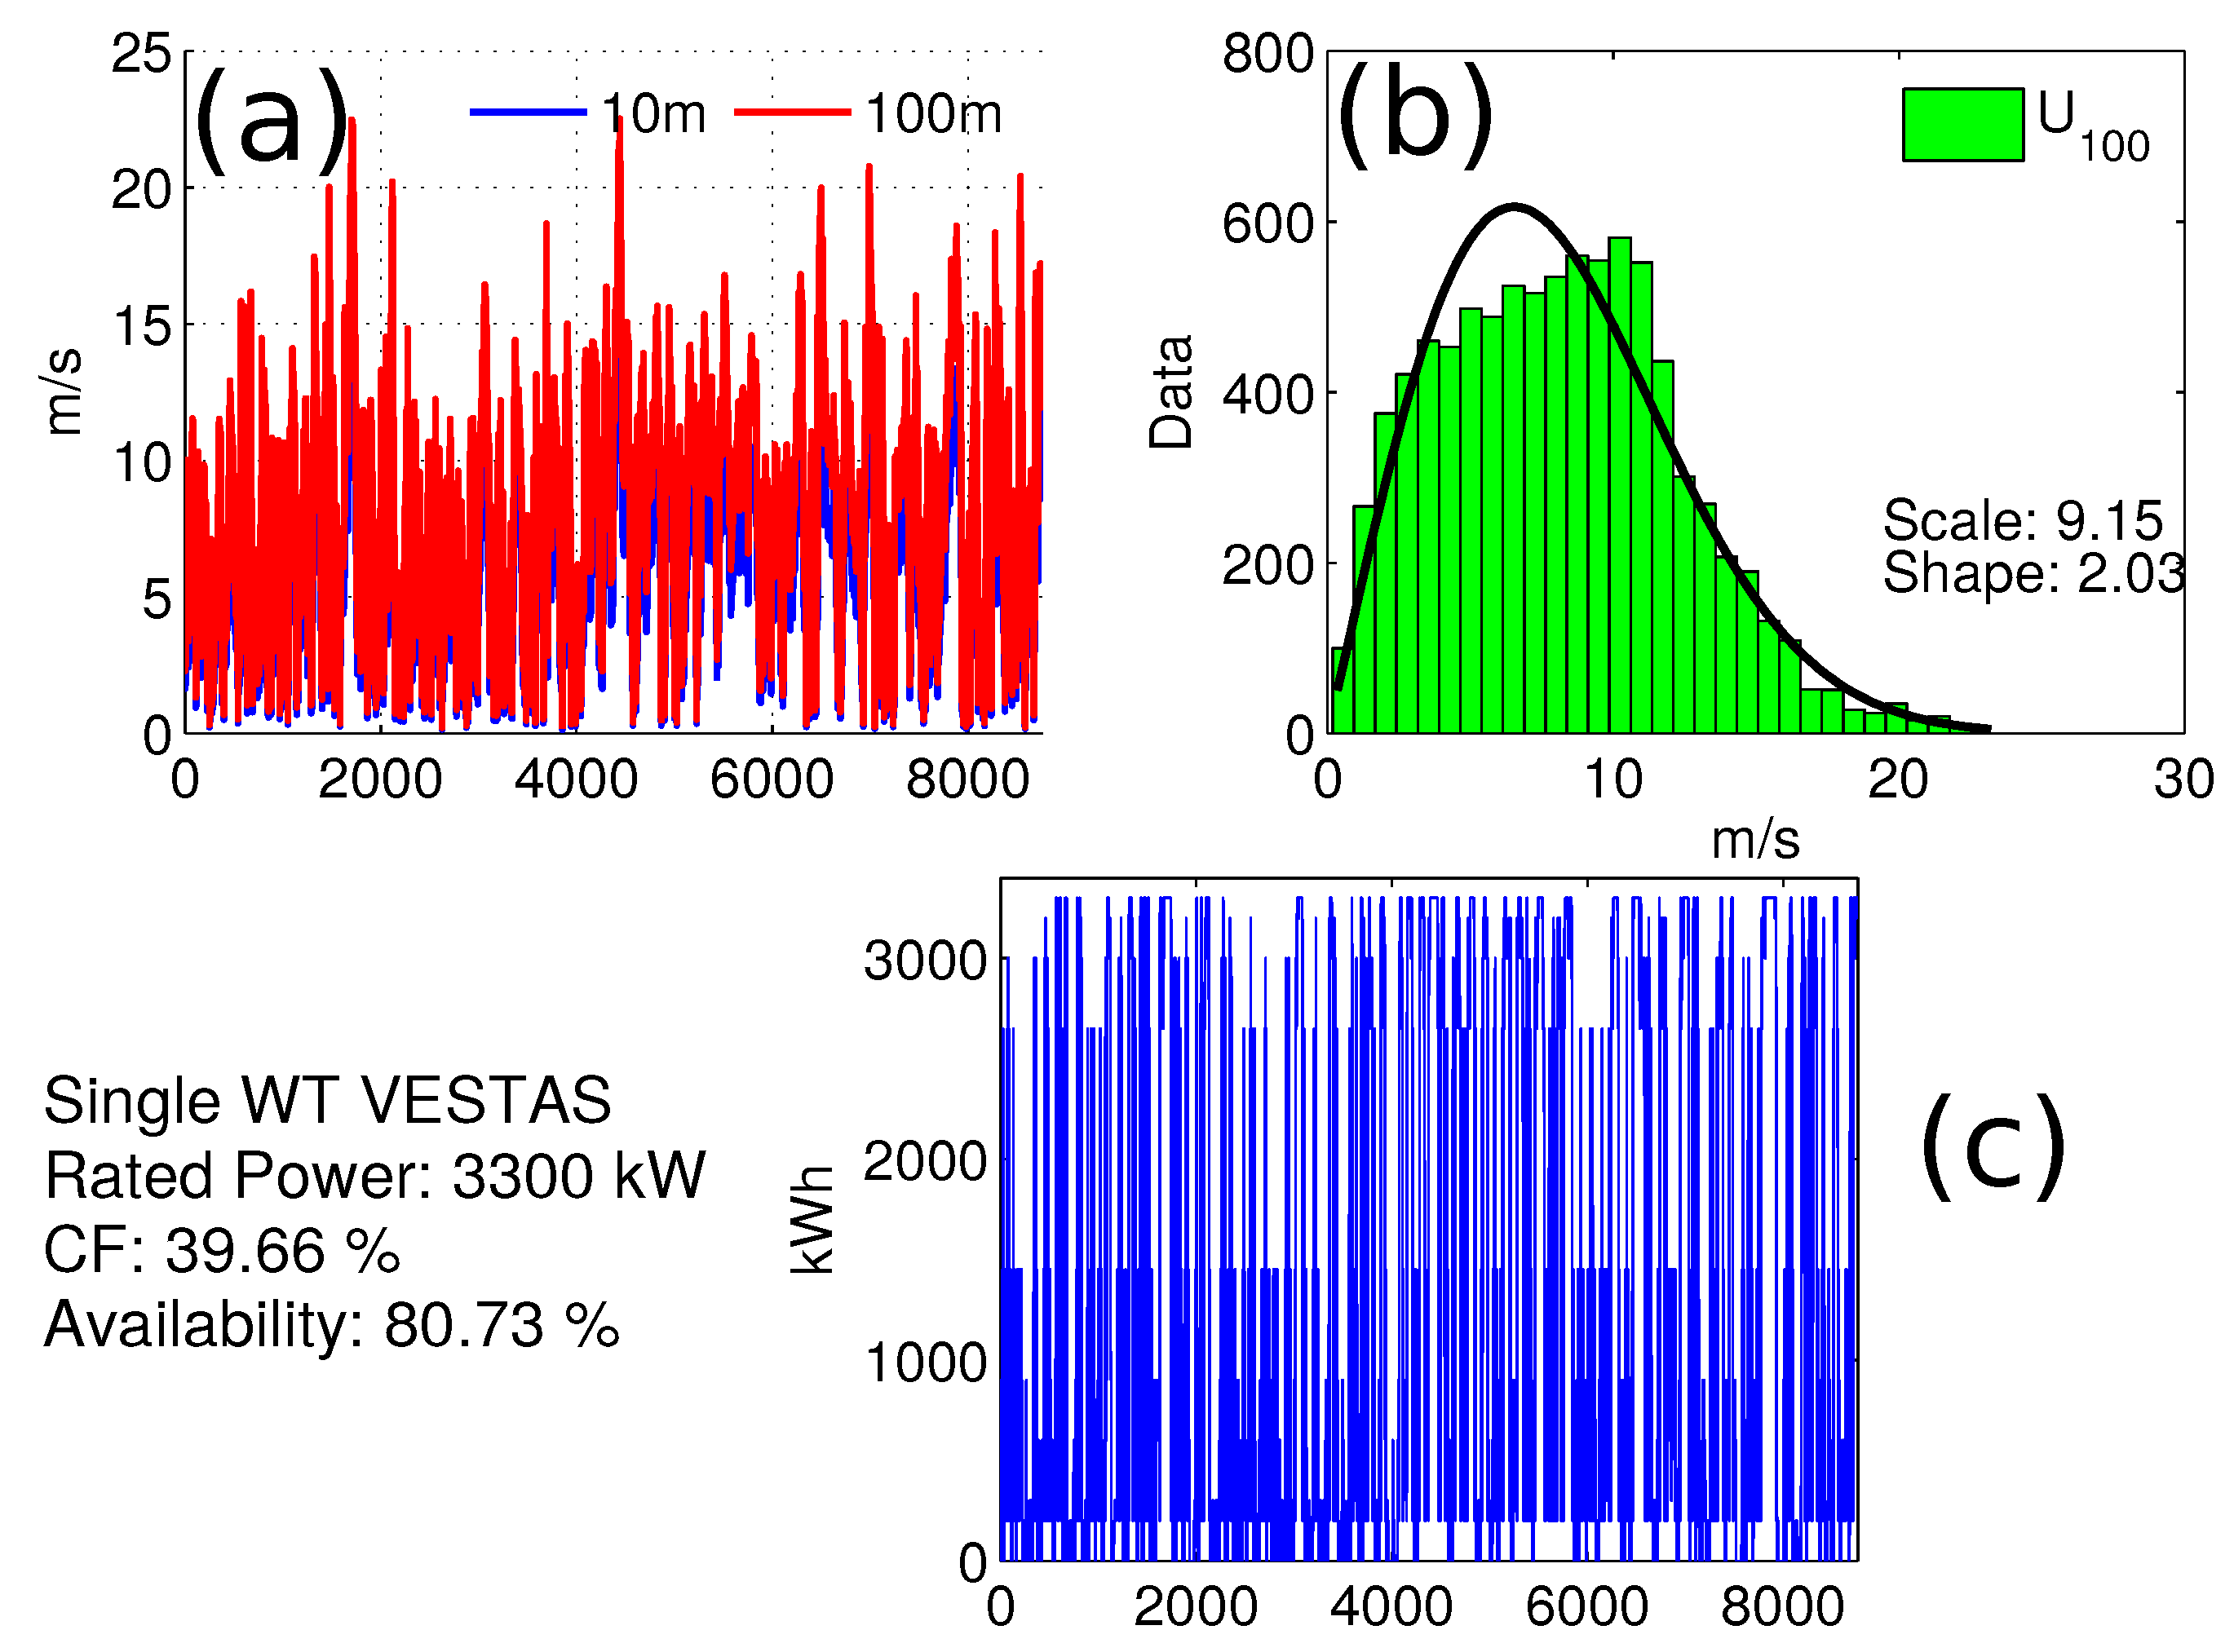
3.1. Wind Resource and Power Extracted

The wind resource is taken at height of 10 m ( h 10 m), however in order to realistically represent wind turbine production, adjustment of the resource is necessary. The structural characteristics of the turbine provide rotor diameter of 112 m 2 and blade length of 54.65 m, hence hub height considerations require to scale up the resource to 100 m ( h 100 ). The energy analysis of wind speeds are subjected to height modification under the power law (see Equation (2)), and all subsequent data correspond to 100 m.
U 100 U 10 = h 100 h 10 a
where α representing the power law exponent, that can be considered as quite volatile. However, experimental results and literature review suggest a value of α = 1 / 7 [39]. Figure 2 shows the power curve and characteristics of the wind turbine. Operation starts at U w C I = 3 m/s and stops at U w C O = 25 m/s, nominal power is given at U w N O = 13 m/s. The U w C I , U w C O and U w N O are used to assess availability of production.
The power curve has been applied to the scaled wind speeds and the Weibull distribution is fitted to the data (see Figure 3 top right). On the bottom left of Figure 3 the simulated energy production is given. The estimated availability took into account the U w C O . Western location (Point 1) yield availability ≈80% and a capacity factor 39.66 % . Eastern location (Point 2) has lower availability at ≈70% and a reduced capacity factor of 15.86 % . In both locations the availability i.e. potential percentage of time for favourable operation is very high (≥70%).

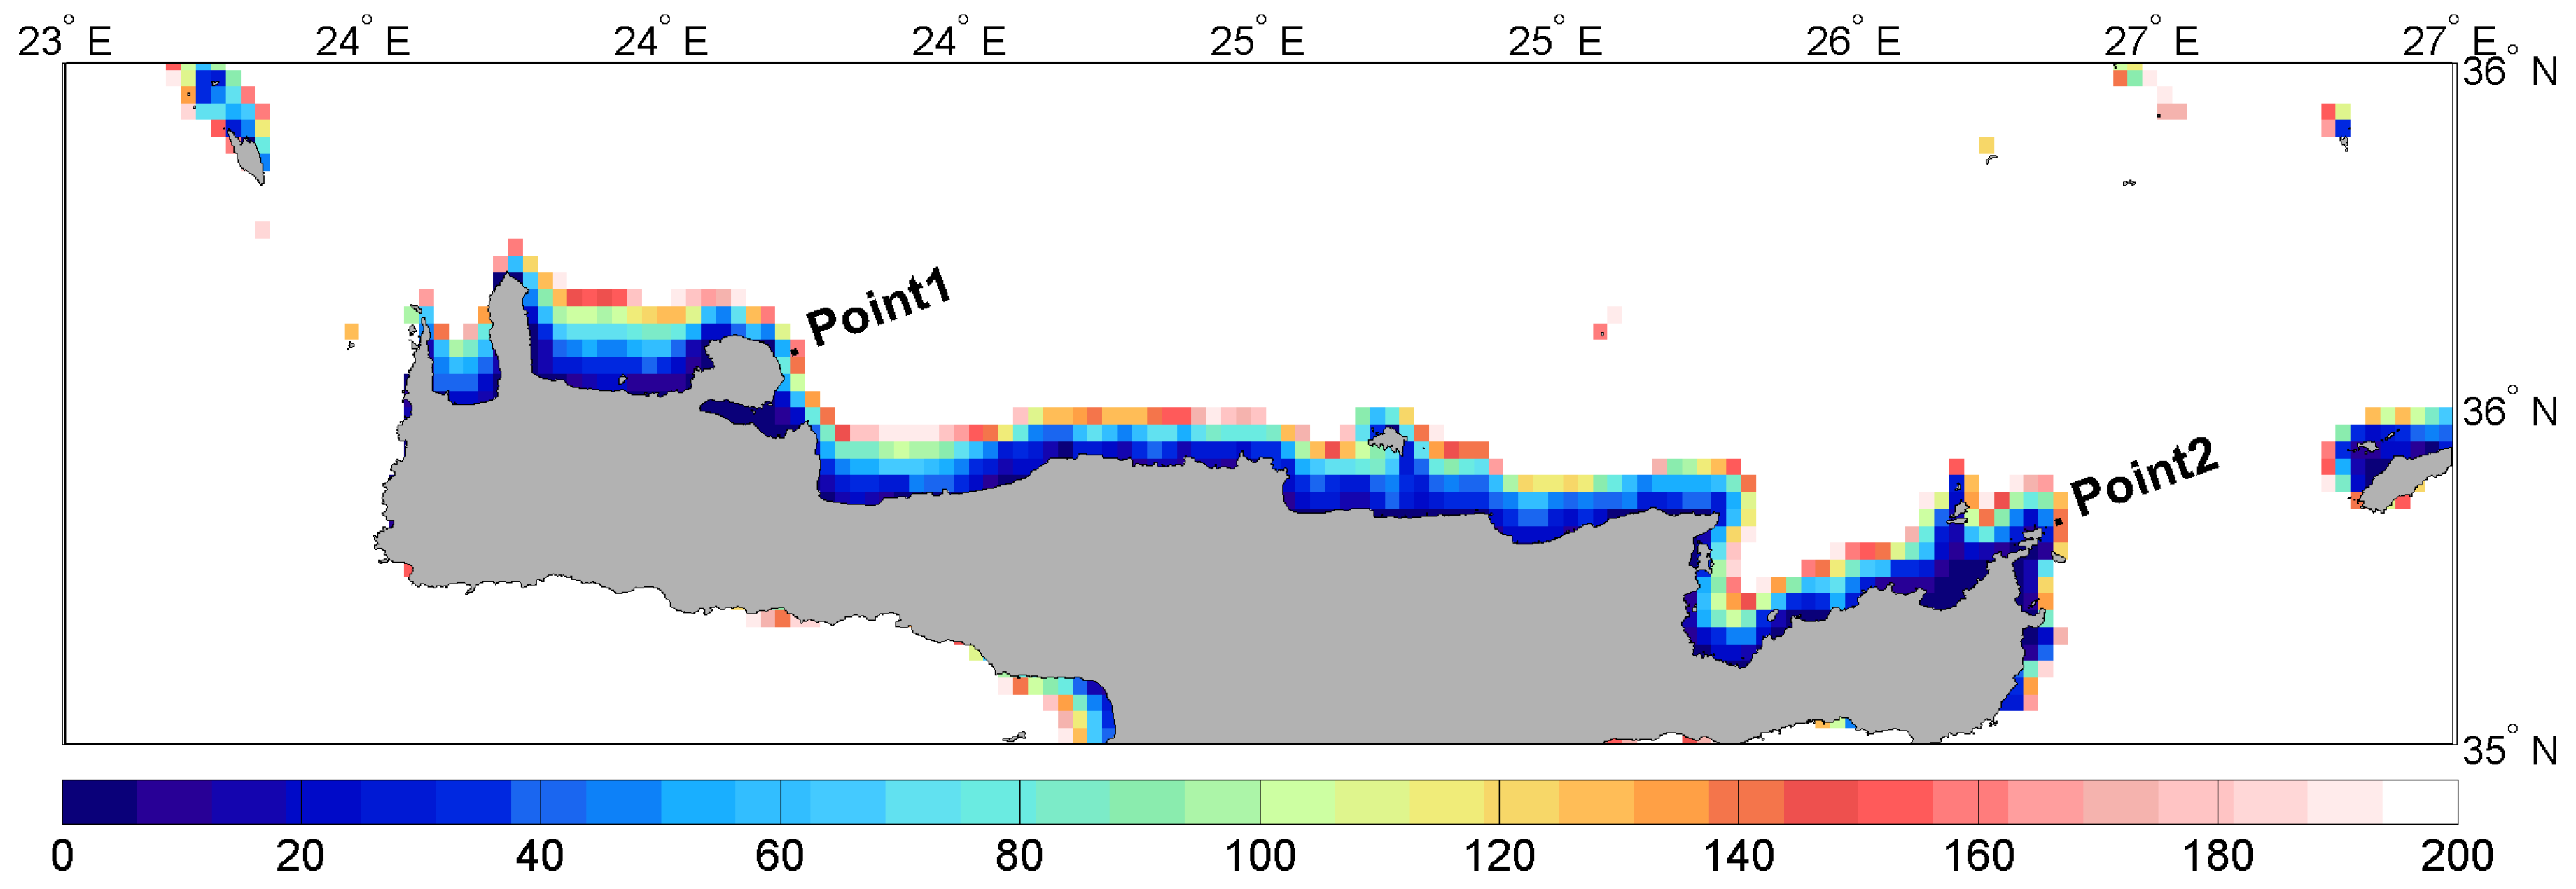
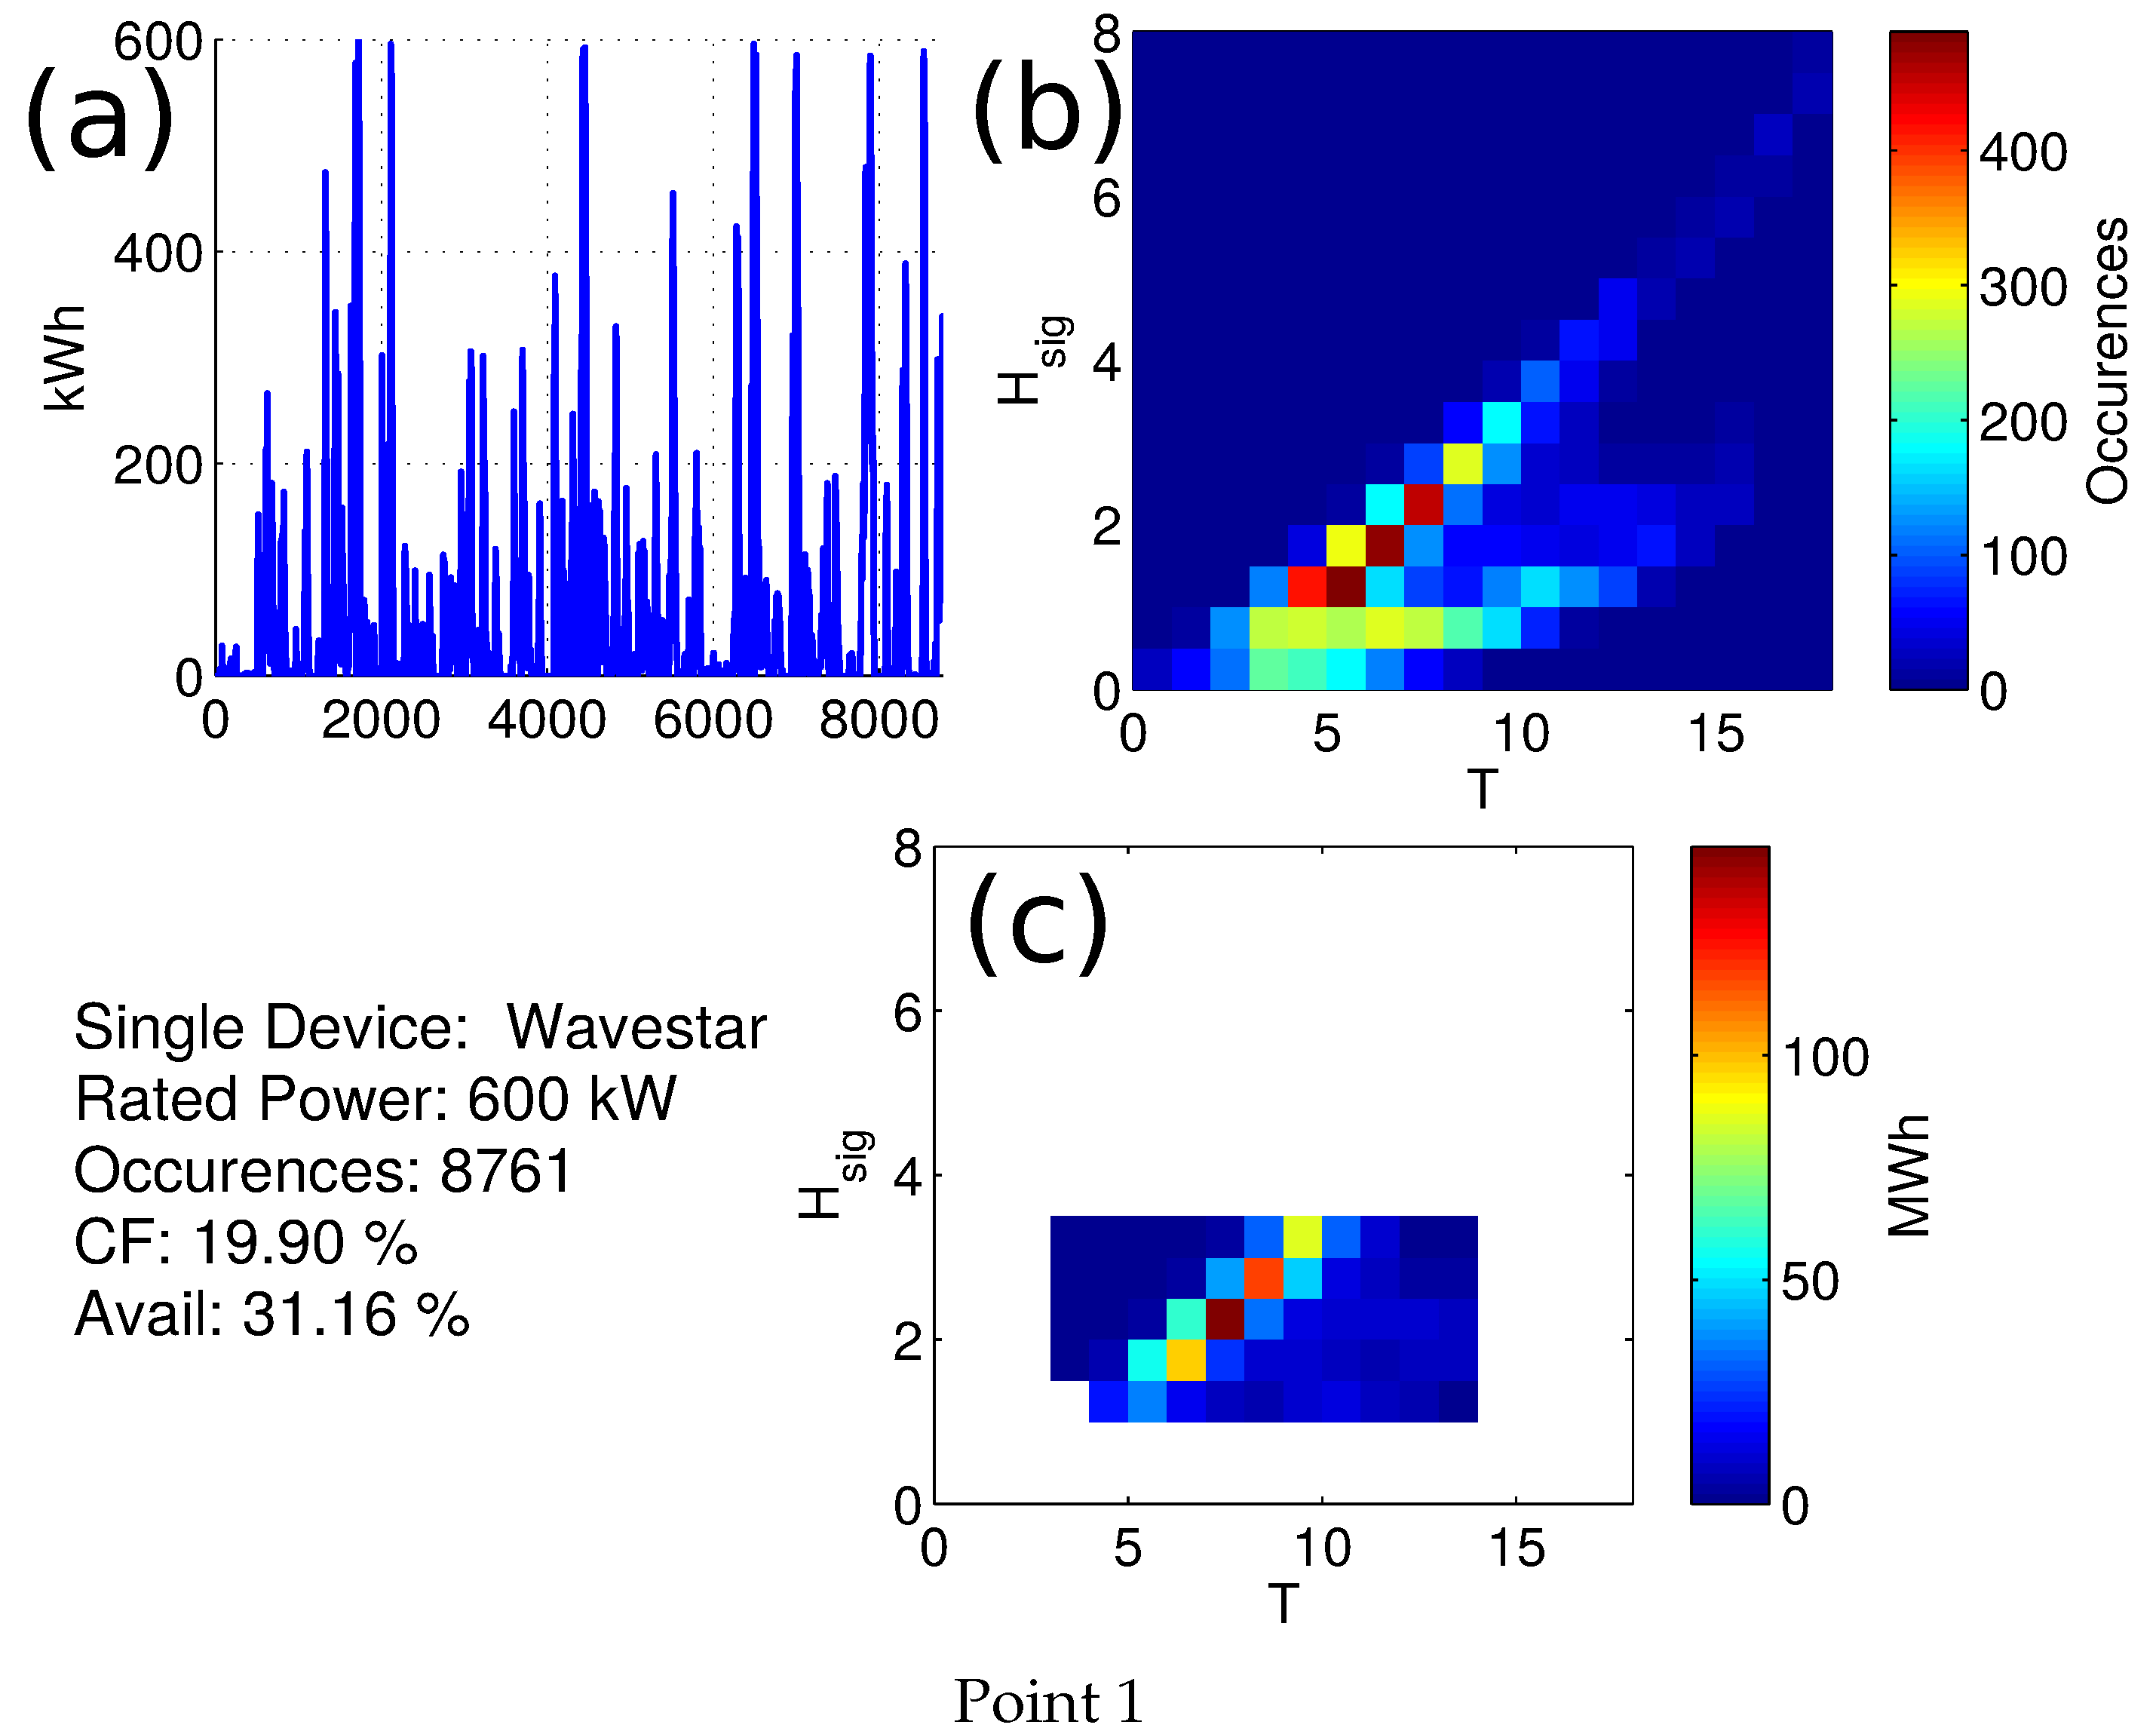
3.2. Wave Resource and Extracted Power

Selection of a wave energy converter (WEC) depends highly on the location’s metocean conditions, depth, WEC characteristics (type of operation, power-take-off (PTO) etc.). Operating principles are vital to the proper selection of WEC, a apply a wide array of WECs that represent different technologies were used to select the device with most suitable characteristics.There are several different technologies based on different principles of operation such as an oscillating water column [40], an over-topping converter [41] and many more. It has to be noted that while all WECs share one parameter H s i g , the wave period associated with their operation changes per device. Some devices use peak period T p e a k , mean zero crossing ( T m 02 ), and other the mean absolute wave period ( T m 01 ). The wave database includes all periods necessary for numerous converters and applications. Energy quantification for WEC, is done on basis of investigating the joint distribution of wave height-wave period. From there we can estimate the probabilities of occurrence, and apply the power matrix. Each estimated annual-based production, uses the proper wave period, more information on the power matrices used can found in [35,37].
All power matrices are coupled with bivariate metocean distributions with available WECs as in the process presented also in [25]. From the comparison and based on the location’s characteristics, best annual performance was achieved by the WaveStar converter 600 kW [42]. Availability of location and device are assessed according to the power matrix of this converter and H s i g . The H c u t i n is at 1 m and wave period of 4 s, nominal power is achieved at 3 m and periods from 4–8 s, with stop of operation at wave heights over H c u t o f f 3 m. Annual analysis indicates that Point 1 has higher availability and capacity factor than Point 2. Specifically, Point 1 availability is ≈31%, and its capacity factor 19.9 % . Availability is almost twofold than Point 2 (≈17%) with a lower capacity factor of 11.5 % . Instantaneous electrical production ( E e l ) was estimated using a linear interpolation of the power matrix ( P P M i , j ) to provide with specific production corresponding to the hourly (t) components [15] (see Equation (3)).
E e l ( t ) = t = 1 t = 8761 P P M i , j ( H s i g i , j ; T m 02 i , j )
Wave resource and device characteristics are given at Figure 4, in each sub-figure the top right panel shows the interpolated instantaneous power production at hourly timesteps, top left panel displays the bivariate distribution and number of combined occurrences. Lastly the bottom panel shows the expected cumulative production achieved by the device at specified intervals. For Point 1 dominant conditions describing the location are wave heights 1.5–3.5 m and wave periods from 4–9 s. Point 2 has dominant conditions at much lower magnitudes of H s i g from 0.5–1.5 m, and higher frequencies 3–7 s.

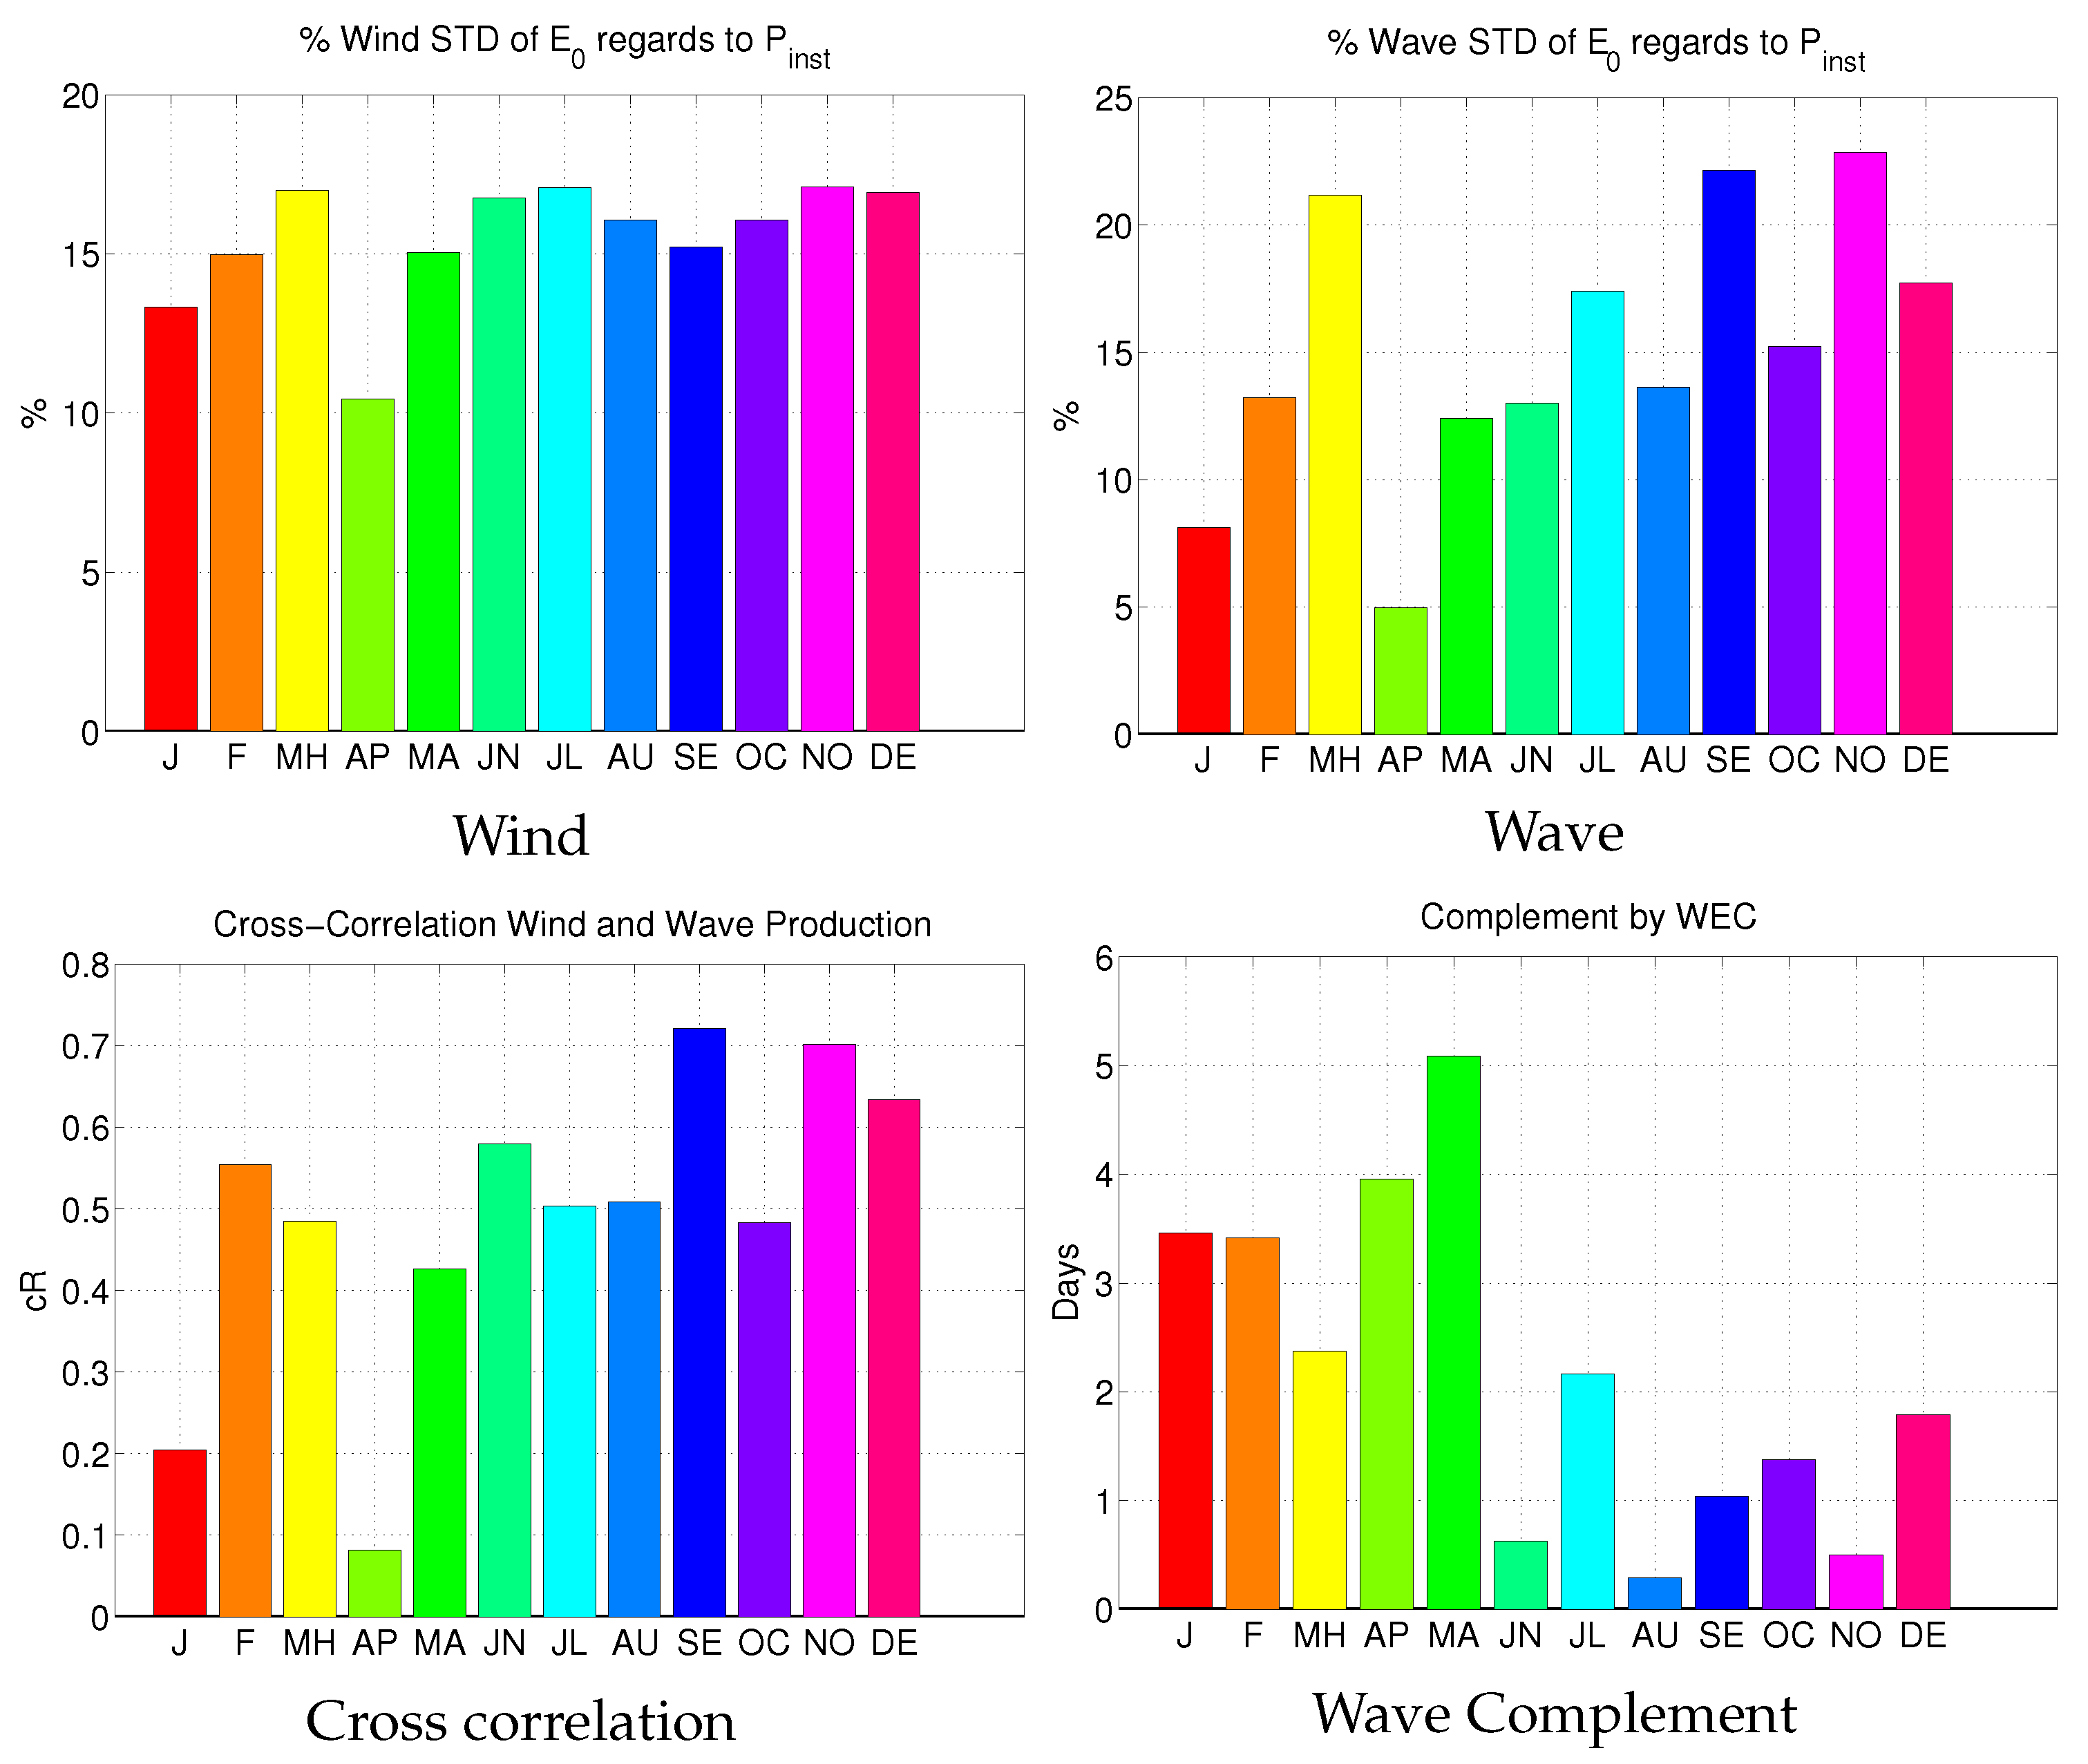
3.3. Co-Located Combined Production

As any RE production depends on resource availability there are possibilities for potential overlaps and supplementary production by different technologies. As a “primary” source of contribution wind energy is considered, while wave energy contributions on non-operative hours are assessed in a complementary way. The levels of contribution and cross-correlation are based on the WEC providing additional energy production when the wind turbine is not operating.
At Point 1 the wind-wave co-located device can complement 26.08 days or 626 h of wind non-operation. The average c R between the production is 0.49 moderately positive. The mean annual s t d W i n d = 1239.88 kWh and s t d W a v e = 52.31 kWh. Point 2 wind has a slightly lower operational availability, complemented amounted hours from the wave device are 702 h or ≈29.25% days. The c R between resource production is highly positive at ≈0.6%. Mean annual s t d W i n d = 699.52 kWh and s t d W a v e = 74.63 kWh.
Supplementing many hours is beneficial for grid operators and can improve power quality consideration. Over-lapping production can provide added security by RE generation and assist in the alleviation of non-predictability. While, this is based on an hourly annual timeseries approach it is more interesting to evaluate the short-term benefit, i.e., monthly. Wind resource has a high level of uncertainty, with fast changing wind speeds and directions. On the other hand, the wave resource is less volatile though the energy production is highly dependent on a much more parameters. WEC performance depends on three variable, wave height, period, direction, however the directional matrix is not provided in international literature for the majority of WECs. Therefore, the amount of energy produced is highly dependent on wave height and period joint occurrences (see Figure 4).
The analysis also considers the monthly wave production and associated values of c R and s t d . The wave resource is subjected to lower levels during the late spring and summer months, expressed as power per meter unit crest (kW/m). This dictates that during lower energetic months, the magnitude of wave heights is smaller, while the frequency of wave is higher (smaller periods), indicating the selection of the device.
The wind power curve uses the available resource and produces almost at all months its nominal rated power, as supported by the higher levels of availability and capacity factor. On the other hand WEC is able to produce its rated power during some portion of months. For January-February the area is exposed to higher magnitude waves, which do not allow full use but instead push the WEC in cut-off mode. The situation changes during low energy months May-July, where wave heights are not as energetic allows for a much higher operation, from September to December metocean conditions allows the WEC to produce near its nominal values at higher rates.
The s t d of production is expressed as a percentage in regards to nominal rated power, expressing the variability of s t d in regards to potential highest energy production. Cross-correlation considers wind as “base” production, and wave electricity as supplementing energy when no production is given the wind turbine (see Figure 5). Lowest levels of wind standard deviation are achieved in April at 10 % . This can be attributed to operational wind speeds that achieve lower levels of nominal production (see also Figure 3). On the other hand, WEC shows significantly lower levels of deviation 5 % for April, highest s t d occurs in March, September and November. In this case, higher deviation are attributed to higher magnitude waves which are met during the winter and early spring periods (see also Figure 4).
In the case of production cross-correlation (see Figure 5) higher levels are encountered in February, September and November. The summation of hours per month allows to quantify energy complementing benefits from the co-located farm. Highest levels of cross-correlation are achieved during winter months, where wind speeds initiate cut-off states. Contribution of WEC device also varies per month, though significant levels of complemented energy can be achieved (see panel (d) Figure 5). The highest temporal contribution by the WEC is achieved from January to May. In summer months the wind turbine achieves higher operation with August having the highest at 96%. In August WEC availability is also at it highest at 47%. From September-December WEC availability decreases to ≈25–26%, while wind has higher level ranging from 78–85%. In terms of absolute energy contributions, the wind turbine has the highest levels of contribution. While its production fluctuates, its mean value is ≈1 GWh. The WEC production has greater fluctuations, with mean monthly ≈39 MWh.
In terms of wind s t d lower levels are for April and August, while waves have exhibit the lowest at April below 5 % (see Figure 6). Cross-correlation has a more diverse profile than Point 1, highest c R is similarly achieved at September ≈0.8. Although in April where Point 1 has the lowest c R , Point 2 has a stronger correlation 0.47 , and maximum complemented days for waves to wind production lower than Point 1. December and March have the highest contributions with ≈3.5 days. Lowest overlap contribution is seen in September with less than a day or 24 h. In terms of energy production wave and wind show the same temporal maximum in March, with 56 and 538 MWh respectively.
In Table 2, the monthly information on cross correlation and energy production are displayed. In the table we also the availability of the resource for production at least 50 % of the nominal power of each converter. For the wind turbine (W/T) operational time is high throughout the months for both locations. Consistently W/T is able to produce energy at above 70 % of the time. On the other hand, the WEC has a lower Total Time (TT) production. Point 1 has significantly higher performance almost 20 % increased than Point 2, over all months. c R is much higher at Point 2 for the majority of the months.
Additionally, to operational information the table also provides the resource availability that corresponds to at least 50 % of nominal rated power production. As expected the wind turbine has higher levels of percentages. Most energetic location in regards to wind is Point 1, which consistently has over 30 % opportunities for nominal rated production. In contrast the WEC shows poor results in terms of potential nominal production at the location, with results slightly favoring Point 1. This suggests that the WEC should be adjusted according to local environment and its peak rated power should be re-adjusted to facilitate lower H s i g . Thus, while wave % TT is higher, the availability based on nominal suggests that the majority of operational hours the WEC produces less than nominal and seldom achieves rated production.

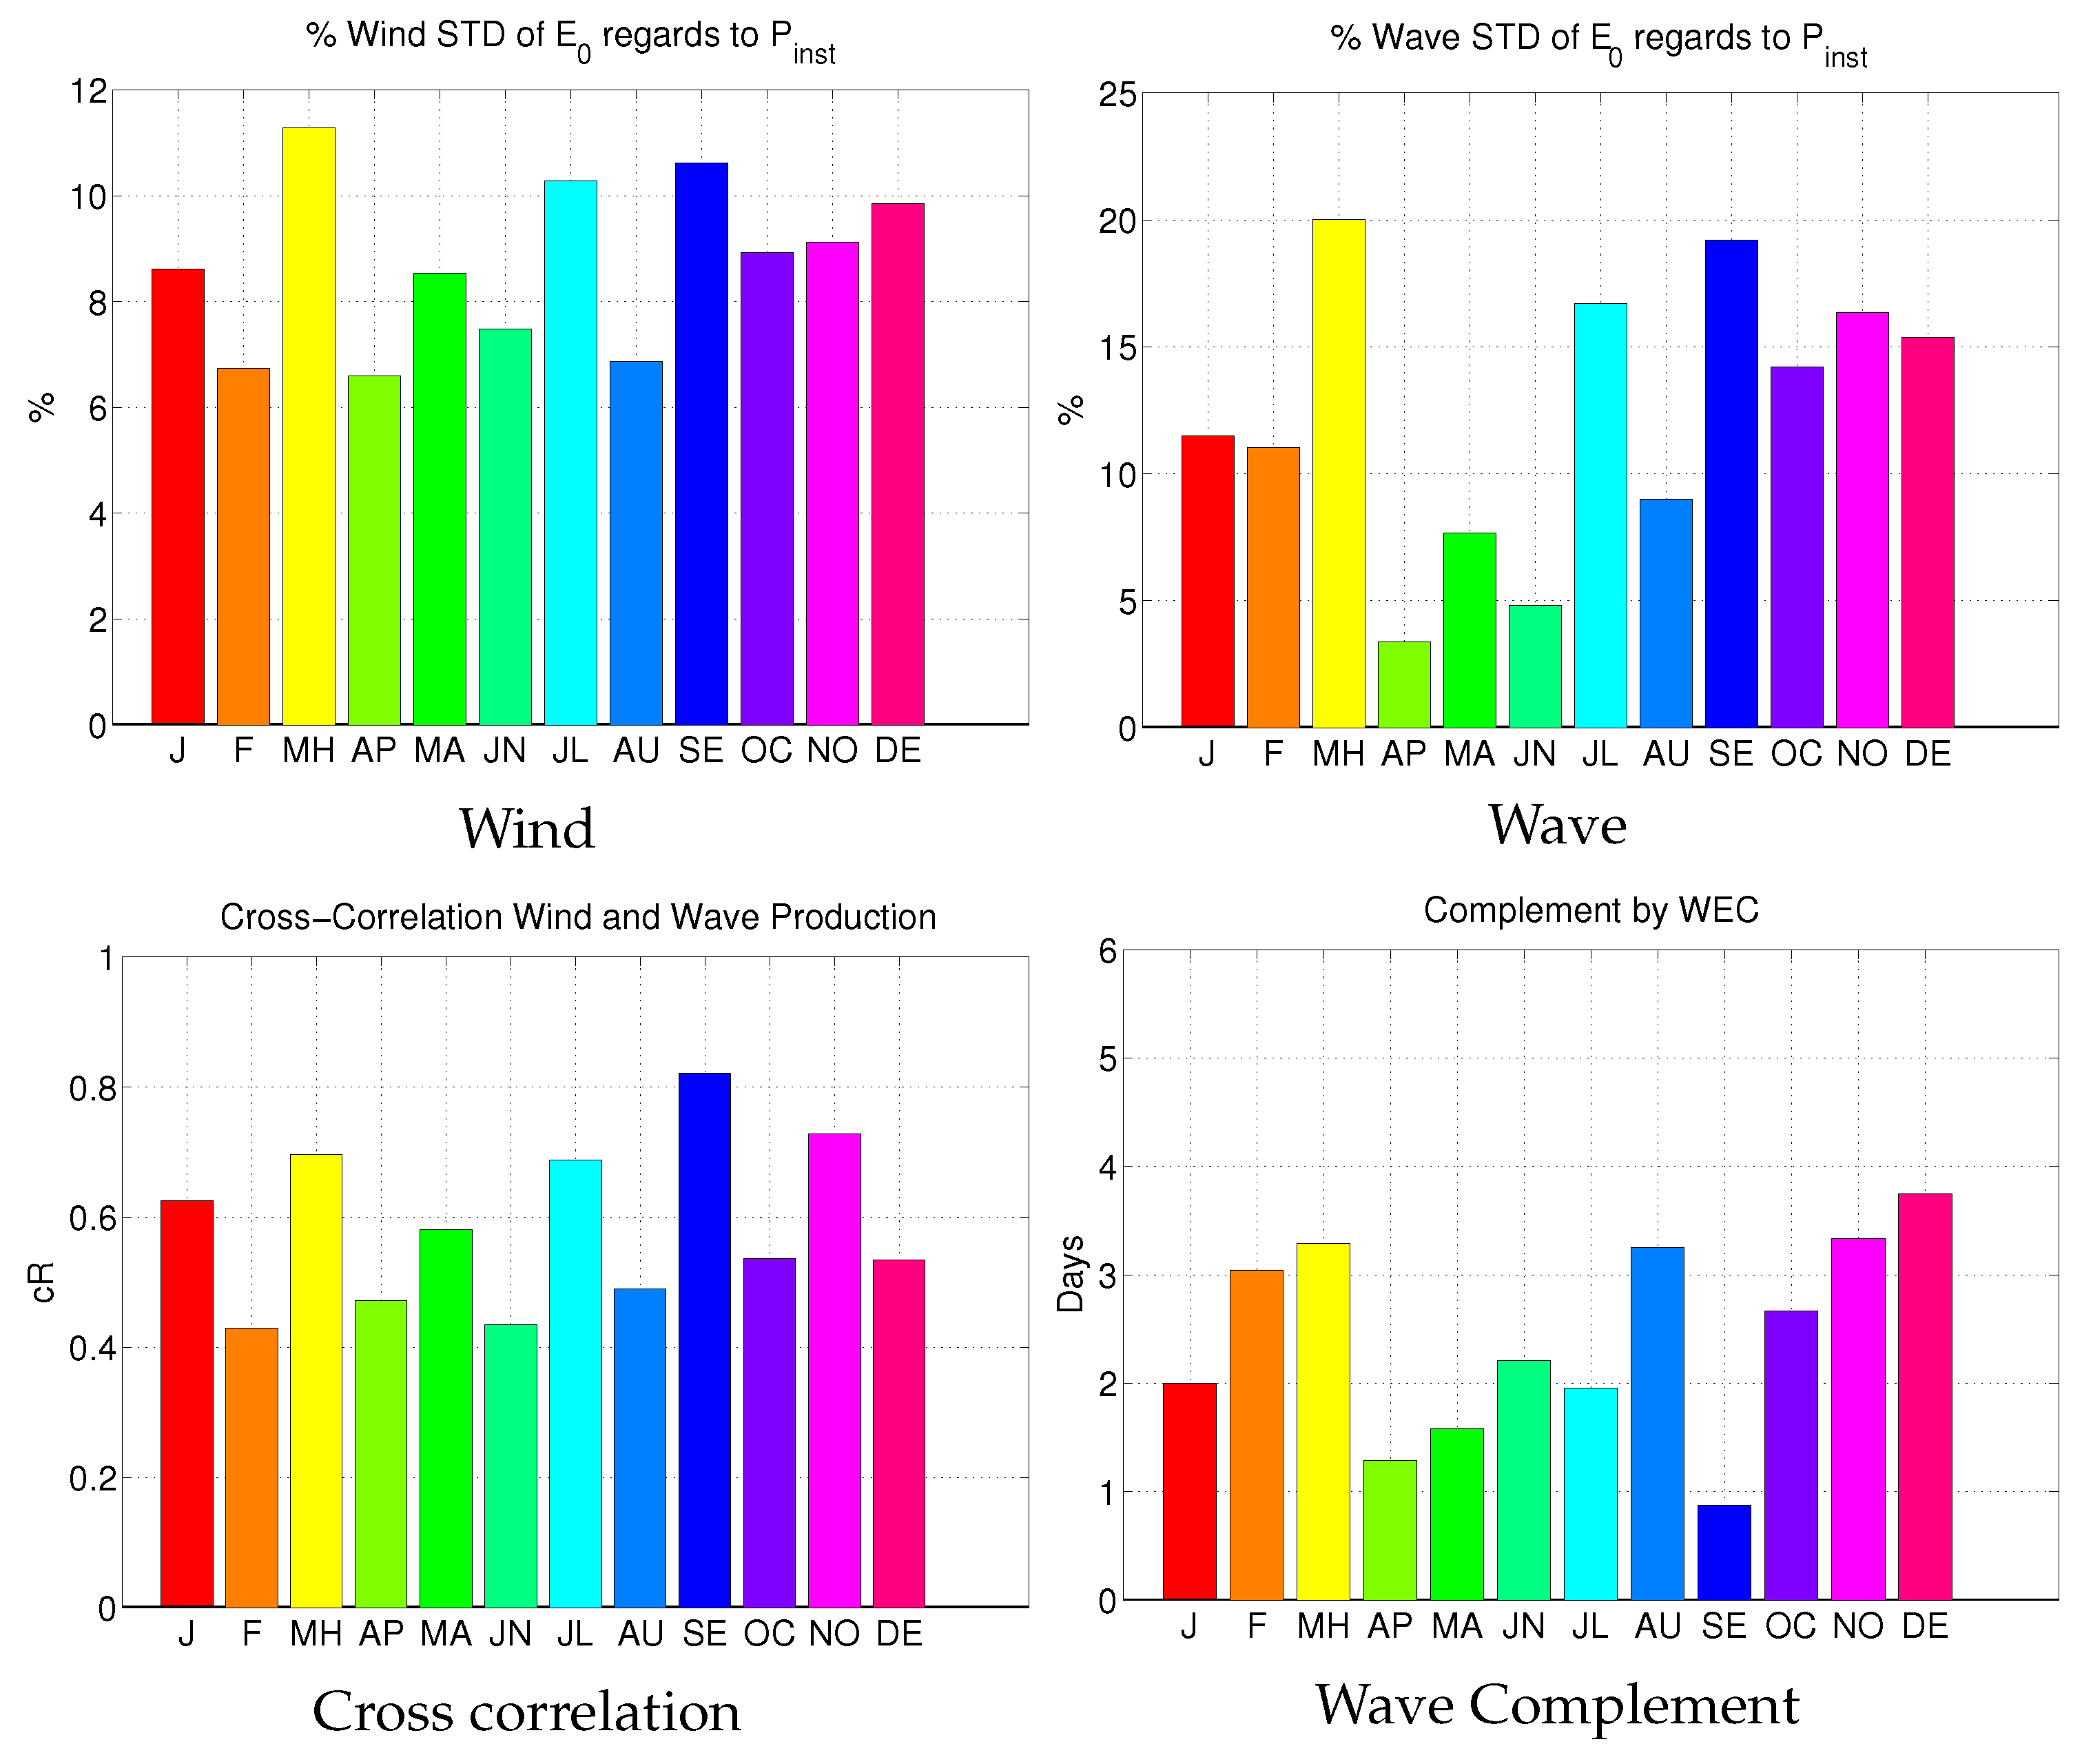
3.4. Non Co-Located Combined Production
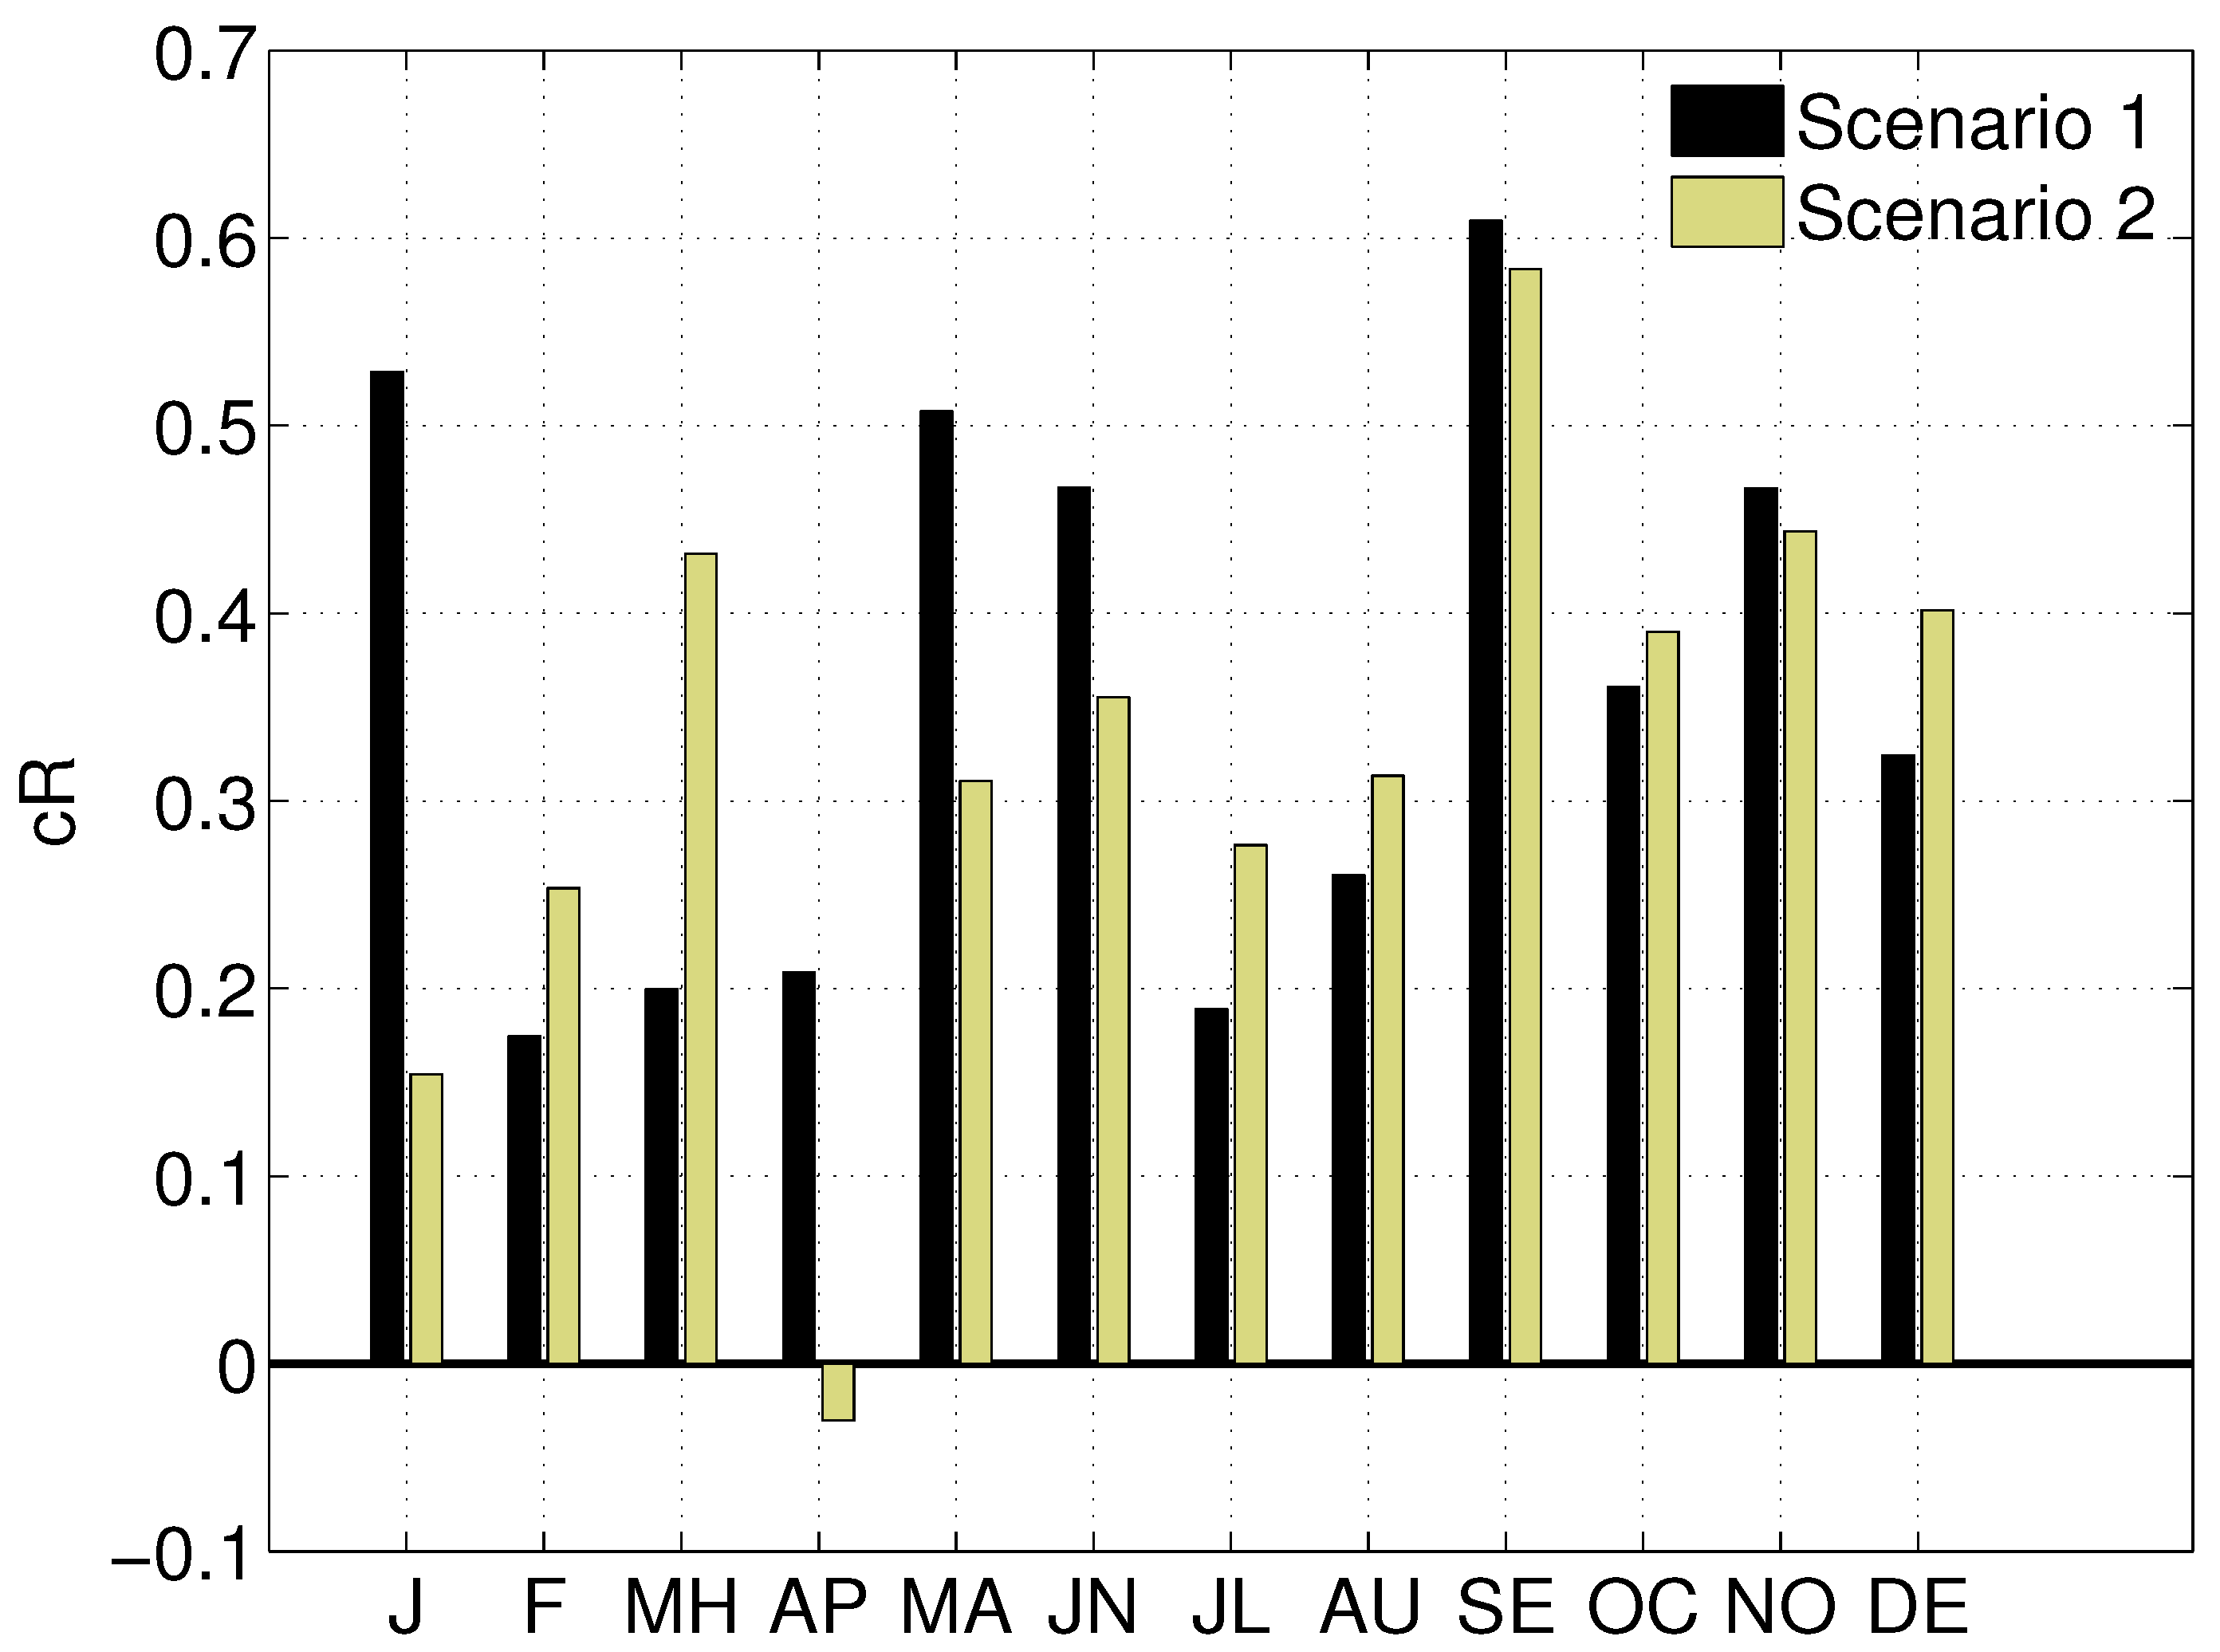
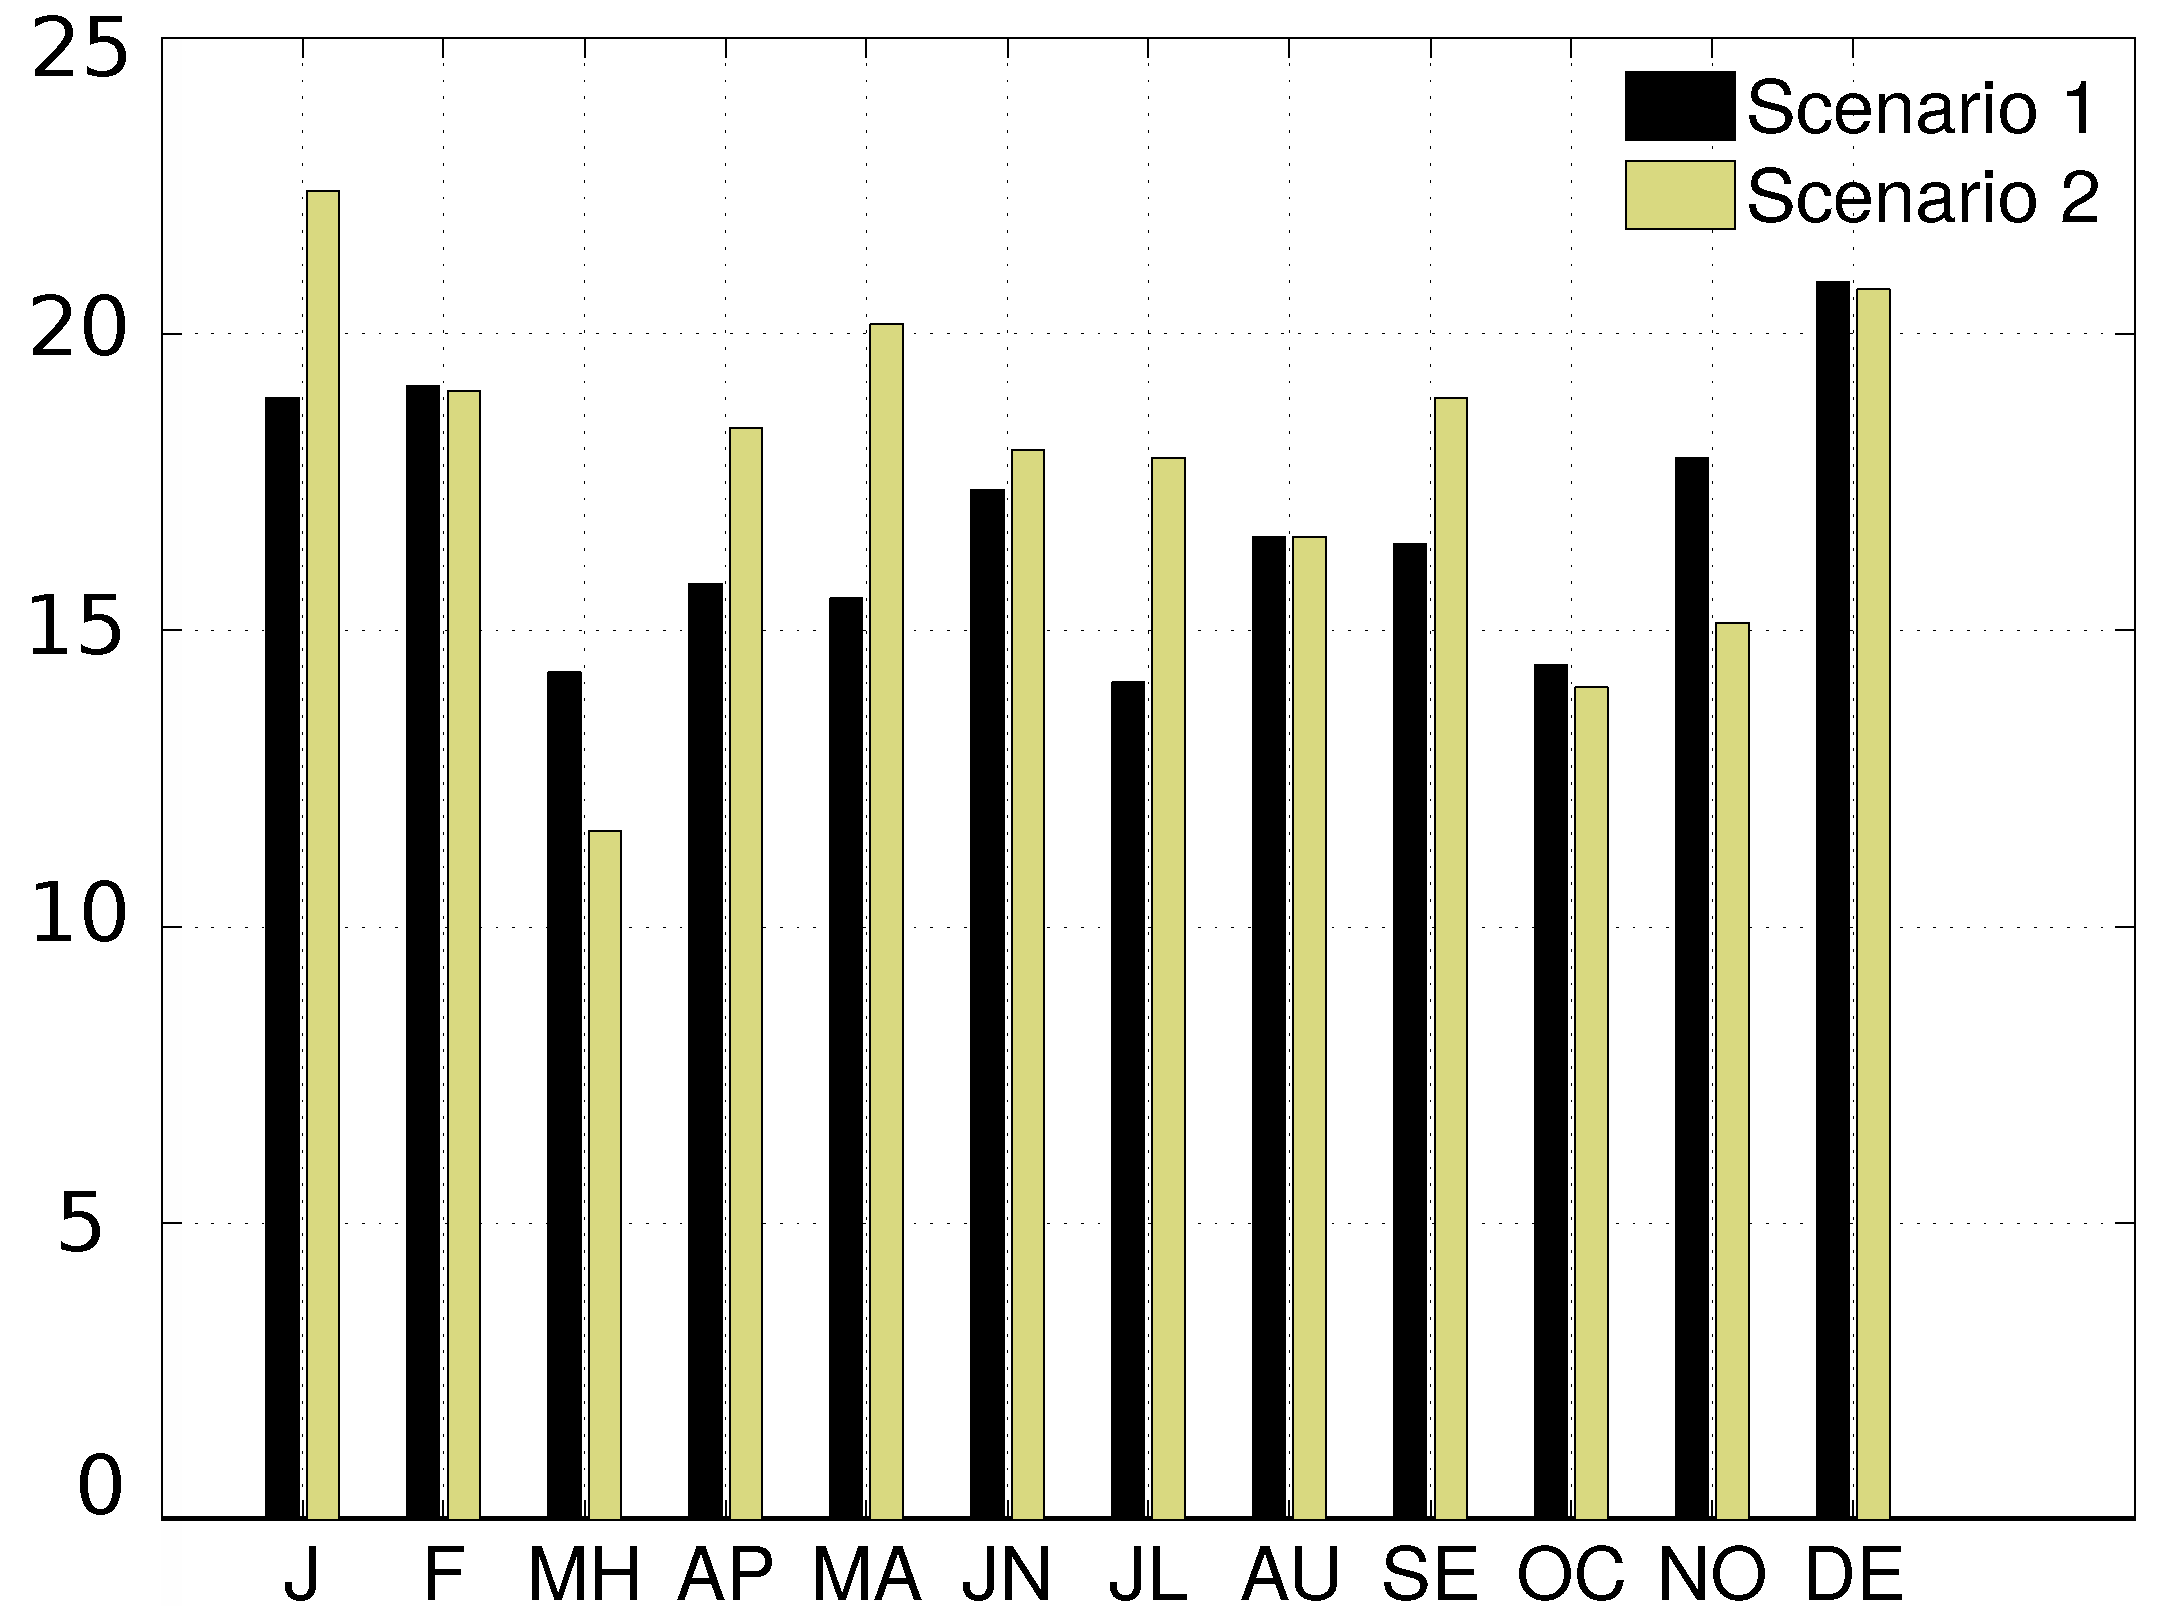
So far co-located temporal configuration showed that production overlap can provide some level of stabilization. In an energy system though, autonomous or not, a consistent flow of energy and reduction of variability is maybe of greater importance than just power contribution, which can be scaled up by increasing installed capacities. For this reason, the study also considers a dispersed spatial option. We consider the installation of wind and wave converters between the two locations, as seen in Figure 1, Points 1 and 2 are positioned in completely different regions. In Section 3.1 and Section 3.2, the local characteristics also denoted their differences. For this reason, two different scenarios are taken into account:
● Scenario 1: Point 1 (WEC) with Point 2 (W/T)
● Scenario 2: Point 1 (W/T) with Point 2 (WEC)
The results are assessed in terms of potential overlap in days. The contribution of wave production in regards to non wind operation is potential highly beneficial in reducing variability effects.
In terms of c R the co-located option acquires higher annual mean values. Although, in the non co-located option, c R of production is higher for some months. For example Scenario 1 for January has higher correlation than Point 1, Point 2 has strong positive correlation c R for all months (see Figure 7).
Scenario 2 also shows similar results with specific months of higher c R when compared with Point 1 c R . Interestingly, during the month of April it is the first time that a inverse correlation exist between production of converters. Indicating that during these months WEC benefit from swells.
The scenarios are also assessed for potential contribution by spatially dispersed WEC and W/T, see Figure 8. As presented in Section 3.3, co-located W/T-WEC can provide complemented production which amounts up to ≈5 days (see Figure 5 and Figure 6 and Table 2). The large distances between the scenarios and different hourly resource characteristics, make the contribution of non-operative hours greater. Both scenarios outperform the co-located options examined in the previous section.
Interestingly, both scenarios contribute multiple hours of reduced variability. In the co-located examination, maximum hours of WEC complementing are achieved in April for Point 1 (95 h), and December at Point 2 (90 h). In the same months both Scenarios 1–2 contribute ≈>370 h in April and ≈500 h December. Thus, annual potential contribution in terms of days are 201 and 213 for Scenarios 1 and 2, respectively.

4. Discussion

In terms of energy production levels and availability use by the wind turbine all monthly indices are high. Since maturity of wind converters has evolved through offshore installation and have contributed significant energy benefits to the system. On the other hand WECs are an emerging technology with a variety of devices which can be suited to extract maximum benefits.
In regards to resource connectivity, wind and waves can complement each other in temporal terms. Wave energy can provide supplements in production for hours of which a wind turbine (farm) is not producing. That said, one major drawback is that most WECs have been constructed with preferred operational ranges suitable for higher latitudes and more energetic (open ocean) conditions. This proves a significant disadvantage for their applicability in lower latitudes.
The selected device had the best performance from the WECs investigated, this is supported by its operational characteristics. For the dataset of our analysis, the co-located option contributed significant amount of hours in a years, which correspond to ≈26 and ≈29 days for Point 1 and 2 respectively. Greater benefits, in terms of WEC complemented hours and potential reduction of variability are found when there is an non co-located configuration. In these instances the two scenarios tested, provided larger temporal production coverage. Both solution were able to cover non-wind operative hours ≥55% or ≥200 days.
However, some concerns have to be discussed concerning the availability at 50 % of rated capacity. The majority of WECs are designed for higher energetic region and oceanic waters. To fully maximize the potential of wave energy extraction rated capacity of a WEC must be adapted for smaller energetic region. Based on its performance characteristics, a scale down approach may be taken to ensure that maximum wave power can be achieved at lower resource wave heights, such as the one found in the Aegean. Such a downscale must be driven through by a hydrodynamic model, which allows the incorporation of spectra by a wave numerical model. A down-scaled converter idea was presented in [43,44], and proved that the use and capacity factor almost doubled in a variety of devices examined. A similar approach can be taken to enhance the production at availability 50 % of nominal rated WEC power. It is important though, that such an optimization is based on long-term metocean data, that include the intra-annual, seasonal, and decadal variations of the area.
Such an approach will have multiple benefits for a co-located farm. In terms of energy and variations, the levels of variability are expected to be reduced significantly. In terms of the WEC component, a down-scaled device will accelerate the proof-of-concept for dual platforms. Another benefit, is the added survivability of the WEC, due to the smaller wave heights, structural integrity of the device will not be compromised as much as in oceanic region. Although, to establish the probable extreme values a long-term metocean dataset is vital.
This study did not consider the effects of production by large offshore wind and wave farms, more specifically wind turbine wake, wave directions and wave to wave interactions were not fully accounted for. The reason for the “simplified” single converter were (1) that deployment regions have not been assigned for offshore wind and/or wave farm in Greece, hence deployment strategy needs (2) in regards to WECs directional information are often not published, and the hydrodynamic losses, optimal spacing of WECs is still very device dependent and require different analysis. Finally, cost estimates and amortization periods especially for the emerging wave energy field, are volatile and the pay-back periods will depend on the nature of selling price and/or support scheme. For wave energy development in Greece a detail techno-economic analysis can be found in [25].

5. Conclusions

In this study, the potential temporal benefits from co-located and non co-located wind and converters are examined. Offshore combined farms are expected to reduce capital expenditures for the devices, and allow better spatial planning. This study examined energy production overlap between wind and wave energy converters. The data are extracted by a wind re-analysis and wave database, which offer all major components for energy estimates in hourly intervals. With wind being a volatile resource, the necessity for a RE converter complementing its production attributes is vital, to reduce intermittent nature. With wave energy directly correlated with wind resource, it is evident that potential overlaps will benefit the end user and/or distributor.
For a low energetic wave and a moderate wind resource region, there are significant benefits, specifically through cross-correlation of two resources wave energy can provide production overlap to wind production. The wave device used was selected after comparison of the dataset with several devices, ensuring that the selection will maximize metocean conditions at the location.
Between the two technologies and available resource, wind obtains the highest availability. Similarly, the capacity factor is larger for the selected wind turbine, while the wave converter used follows with ≈50% reduction in regards to the wind capacity factor (≈20%) at Point 1 location. The correlation of energy production patterns, indicated that the WEC even at mild levels is able to contribute production, when the wind turbine was non-operating.
Depending on the selection, co or non co-located temporal effects change, the co-located examined WEC complemented W/T non-production ≈626 h (Point 1) and ≈720 h (Point 2). The highest number of complemented hours by the co-located configuration is predominately in the months of January till May for Point 1. However, Point 2 has also a “high” month contribution in August where the wind resource seems to be reduced and the low operational range of the WEC favors the complemented production. Throughout the winter months the wind resource forces the wind turbine to go into safety (cut-off) mode. In both cases there is a positive moderate to high cross-correlation which assists in the consideration for local co-generation. Highest temporal benefits are established in the non co-located options, where the different scenarios provide WEC overlap ≈≥4000 h within a year. Overlap coverage of production can decrease variability, and allow for smoother energy contribution to autonomous grids. Combination of multiple RE forms of energy, re-affirms the fact that electricity can be supplied in a more predictable manner that can reduce deferral capital expenditures to the grid and ensures sustainable development.

Author Contributions

Conceptualization was done through the collaboration of G.L. and V.V. Formal Analysis was performed by G.L. and reviewed V.V. The writing and review was performed by both authors.

Funding

This research received no external funding.

Acknowledgments

The author would like to thank Ioannis (Yannis) Katsigiannis for his comments on improving the manuscript. The author would like to thank the reviewers for their constructive comments, which helped at improving the manuscript.

Conflicts of Interest

The authors declare no conflict of interest.

Abbreviations

The following abbreviations are used in this manuscript:
RERenewable Energy
CAESCompressed Air Energy Systems
PHSPumped Hydro Systems
PVPhotovoltaic
mmetres
Kmkilometres
CFSRClimate Forecast System Reanalysis
H s i g Significant Wave Height
c R Cross-Correlation
τ time lag
stdstandard deviation
Nsample size
WECWave Energy Converter
h m hub height at metres
PTOPower-Take-Off
T p e a k Peak wave period
T m 01 mean absolute wave period
T m 02 mean zero crossing wave period
H c u t i n Initiate operation of WEC based on wave height
H c u t o f f Stop operation of WEC based on wave height

References

  1. Regional Energy Agency of Crete. Available online: https://ec.europa.eu/energy/intelligent/projects/en/partners/regional-energy-agency-crete (accessed on 6 July 2016).
  2. Karapidakis, E.; Katsigiannis, Y.; Tsikalakis, A.; Maravelakis, E. Current Status and Future Prospects of Crete’s Power System. In Proceedings of the International Symposium on Fundamental of Electrical Engineering, Bucharest, Romania, 28–29 November 2014. [Google Scholar]
  3. Hedegaard, K.; Meibom, P. Wind power impacts and electricity storage—A time scale perspective. Renew. Energy 2012, 37, 318–324. [Google Scholar] [CrossRef]
  4. Michalena, E.; Hills, J.M. Renewable energy issues and implementation of European energy policy: The missing generation? Energy Policy 2012, 45, 201–216. [Google Scholar] [CrossRef]
  5. Karapidakis, E.S.; Katsigiannis, Y.A.; Georgilakis, P.S.; Thalassinakis, E. Generation expansion planning of Crete power system for high penetration of renewable energy sources. Mater. Sci. Forum 2011, 670, 407–414. [Google Scholar] [CrossRef]
  6. Jacobson, M.Z.; Delucchi, M.A. Providing all global energy with wind, water, and solar power, Part I: Technologies, energy resources, quantities and areas of infrastructure, and materials. Energy Policy 2011, 39, 1154–1169. [Google Scholar] [CrossRef]
  7. Zafirakis, D.; Chalvatzis, K.; Kaldellis, J. “Socially just” support mechanisms for the promotion of renewable energy sources in Greece. Renew. Sustain. Energy Rev. 2013, 21, 478–493. [Google Scholar] [CrossRef]
  8. Vaona, A. The effect of renewable energy generation on import demand. Renew. Energy 2016, 86, 354–359. [Google Scholar] [CrossRef]
  9. Schaber, K.; Steinke, F.; Hamacher, T. Transmission grid extensions for the integration of variable renewable energies in Europe: Who benefits where? Energy Policy 2013, 43, 123–135. [Google Scholar] [CrossRef]
  10. Connolly, D.; Lund, H.; Mathiesen, B.; Pican, E.; Leahy, M. The technical and economic implications of integrating fluctuating renewable energy using energy storage. Renew. Energy 2012, 43, 47–60. [Google Scholar] [CrossRef]
  11. Skea, J.; Anderson, D.; Green, T.; Gross, R.; Heptonstall, P.; Leach, M. Intermittent renewable generation and the cost of maintaining power system reliability. System 2008, 2, 82–89. [Google Scholar] [CrossRef]
  12. Verbruggen, A.; Fischedick, M.; Moomaw, W.; Weir, T.; Nadaï, A.; Nilsson, L.J.; Nyboer, J.; Sathaye, J. Renewable energy costs, potentials, barriers: Conceptual issues. Energy Policy 2010, 38, 850–861. [Google Scholar] [CrossRef]
  13. Madlener, R.; Latz, J. Economics of centralized and decentralized compressed air energy storage for enhanced grid integration of wind power. Appl. Energy 2013, 101, 299–309. [Google Scholar] [CrossRef]
  14. Barbour, E. An Investigation into the Potential of Energy Storage to Tackle Intermittency in Renewable Energy Generation. Ph.D Thesis, University of Edinburgh, Edinburgh, UK, 2013. [Google Scholar]
  15. Friedrich, D.; Lavidas, G. Combining offshore and onshore renewables with energy storage and diesel generators in a stand-alone Hybrid Energy System. In Proceedings of the OSES Offshore Energy Storage Symposium, Edinburgh, UK, 1–3 July 2015. [Google Scholar]
  16. Kaldellis, J.; Zafirakis, D.; Kavadias, K. Techno-economic comparison of energy storage systems for island autonomous electrical networks. Renew. Sustain. Energy Rev. 2009, 13, 378–392. [Google Scholar] [CrossRef]
  17. Battaglini, A.; Lilliestam, J.; Haas, A.; Patt, A. Development of SuperSmart Grids for a more efficient utilisation of electricity from renewable sources. J. Clean. Prod. 2009, 17, 911–918. [Google Scholar] [CrossRef]
  18. Giannoulis, E.; Haralambopoulos, D. Distributed Generation in an isolated grid: Methodology of case study for Lesvos-Greece. Appl. Energy 2011, 88, 2530–2540. [Google Scholar] [CrossRef]
  19. Hammons, T. Integrating renewable energy sources into European grids. Int. J. Electr. Power Energy Syst. 2008, 30, 462–475. [Google Scholar] [CrossRef]
  20. Kaldellis, J.; Kavadias, K.; Filios, A.; Garofallakis, S. Income loss due to wind energy rejected by the Crete island electrical network—The present situation. Appl. Energy 2004, 79, 127–144. [Google Scholar] [CrossRef]
  21. Kaldellis, J.; Kavadias, K. Optimal wind-hydro solution for Aegean Sea islands’ electricity-demand fulfilment. Appl. Energy 2001, 70, 333–354. [Google Scholar] [CrossRef]
  22. Kaldellis, J. Stand-Alone and Hybrid Wind Energy Systems. Technology, Energy Storage and Applications; Woodhead Publishing Limited: Cambridge, UK, 2011. [Google Scholar]
  23. Zafirakis, D.; Kaldellis, J. Economic evaluation of the dual mode CAES solution for increased wind energy contribution in autonomous island networks. Energy Policy 2009, 37, 1958–1969. [Google Scholar] [CrossRef]
  24. Zafirakis, D.; Kaldellis, J. Autonomous dual-mode CAES systems for maximum wind energy contribution in remote island networks. Energy Convers. Manag. 2010, 51, 2150–2161. [Google Scholar] [CrossRef]
  25. Lavidas, G.; Venugopal, V. A 35 year high-resolution wave atlas for nearshore energy production and economics at the Aegean Sea. Renew. Energy 2017, 103, 401–417. [Google Scholar] [CrossRef]
  26. Kaldellis, J.; Efstratiou, C.; Nomikos, G.; Kondili, E. Wave Energy Exploitation in the North Aegean Sea: Spatial Planning of Potential Wave Power Stations. In Proceedings of the 15th International Conference on Environmental Science and Technology, Rhodes, Greece, 31 August–2 September 2017. [Google Scholar]
  27. Soukissian, T.; Denaxa, D.; Karathanasi, F.; Prospathopoulos, A.; Sarantakos, K.; Iona, A.; Georgantas, K.; Mavrakos, S. Marine Renewable Energy in the Mediterranean Sea: Status and Perspectives. Energies 2017, 10, 1512. [Google Scholar] [CrossRef]
  28. Bai, W.; Lee, D.; Lee, K.Y. Stochastic Dynamic AC Optimal Power Flow Based on a Multivariate Short-Term Wind Power Scenario Forecasting Model. Energies 2017, 10, 2138. [Google Scholar] [CrossRef]
  29. Lavidas, G.; Venugopal, V.; Friedrich, D. Investigating the opportunities for wave energy in the Aegean Sea. In Proceedings of the 7th International Science Conference Energy Climate Change, Athens, Greece, 8–10 October 2014. [Google Scholar]
  30. Fusco, F.; Nolan, G.; Ringwood, J.V. Variability reduction through optimal combination of wind/wave resources-An Irish case study. Energy 2010, 35, 314–325. [Google Scholar] [CrossRef]
  31. Cradden, L.; Mouslim, H.; Duperray, O.; Ingram, D. Joint Exploitation of Wave and Offshore Wind Power. Available online: https://www.research.ed.ac.uk/portal/files/21760167/221.pdf (accessed on 2 February 2015).
  32. Saha, S.; Moorthi, S.; Pan, H.L.; Wu, X.; Wang, J.; Nadiga, S.; Tripp, P.; Kistler, R.; Woollen, J.; Behringer, D.; et al. The NCEP climate forecast system reanalysis. Bull. Am. Meteorol. Soc. 2010, 91, 1015–1057. [Google Scholar] [CrossRef]
  33. Lavidas, G.; Agarwal, A.; Venugopal, V. Long-Term Evaluation of the Wave Climate and Energy Potential in the Mediterranean Sea. In Proceedings of the 4th IAHR Europe Congress, Liege, Belgium, 27–29 July 2016. [Google Scholar]
  34. Vestas. Vestas Offshore V112-3.3 MW Product IEC IB. Technical Report; 2016. Available online: https://www.nhsec.nh.gov/projects/2013-02/documents/131212appendix_15.pdf (accessed on 11 November 2018).
  35. Babarit, A. A database of capture width ratio of wave energy converters. Renew. Energy 2015, 80, 610–628. [Google Scholar] [CrossRef]
  36. Rusu, E.; Onea, F. Estimation of the wave energy conversion efficiency in the Atlantic Ocean close to the European islands. Renew. Energy 2016, 85, 687–703. [Google Scholar] [CrossRef]
  37. Babarit, A.; Hals, J.; Muliawan, M.; Kurniawan, A.; Moan, T.; Krokstad, J. Numerical benchmarking study of a selection of wave energy converters. Renew. Energy 2012, 41, 44–63. [Google Scholar] [CrossRef]
  38. Astariz, S.; Iglesias, G. Output power smoothing and reduced downtime period by combined wind and wave energy farms. Energy 2016, 97, 69–81. [Google Scholar] [CrossRef]
  39. Manwell, J.; McGowan, J.; Rogers, A. Wind Energy Explained: Theory, Design and Application, 2nd ed.; John Wiley & Sons Ltd.: Hoboken, NJ, USA, 2009. [Google Scholar]
  40. Zhang, X.; Yang, J. Power capture performance of an oscillating-body WEC with nonlinear snap through PTO systems in irregular waves. Appl. Ocean Res. 2015, 52, 261–273. [Google Scholar] [CrossRef]
  41. Martins, J.; Goulart, M.; Gomes, M.N.; Souza, J.; Rocha, L.; Isoldi, L.; dos Santos, E. Geometric evaluation of the main operational principle of an overtopping wave energy converter by means of Constructal Design. Renew. Energy 2018, 118, 727–741. [Google Scholar] [CrossRef]
  42. WaveStar. 2015. Available online: http://wavestarenergy.com/ (accessed on 5 January 2015).
  43. Bozzi, S.; Miquel, A.M.; Antonini, A.; Passoni, G.; Archetti, R. Modeling of a point absorber for energy conversion in Italian seas. Energies 2013, 6, 3033–3051. [Google Scholar] [CrossRef] [Green Version]
  44. Bozzi, S.; Archetti, R.; Passoni, G. Wave electricity production in Italian offshore: A preliminary investigation. Renew. Energy 2014, 62, 407–416. [Google Scholar] [CrossRef]
Figure 1. Location and bathymetry in meters.
Energies 11 02741 g001
Figure 2. Wind turbine Power curve as adapted from [34].
Energies 11 02741 g002
Figure 3. Wind characteristics of Point 1. (a) Wind resource at 10m & adjusted at 100m; (b) Wind distribution; (c) Hourly production, CF: 39.66%.
Energies 11 02741 g003
Figure 4. Point 1 wave locations characteristics (a) Hourly production (b) Joint distribution (c) Cumulative production (binned).
Energies 11 02741 g004
Figure 5. Monthly characteristics at Point 1.
Energies 11 02741 g005
Figure 6. Monthly characteristics at Point 2.
Energies 11 02741 g006
Figure 7. c R scenarios for non co-located.
Energies 11 02741 g007
Figure 8. Days complemented by WEC for non co-located.
Energies 11 02741 g008
Table 1. Cross Correlation Classification.
Cross-Correlation RangesValue
c R = 1 High positive
c R > 0 & c R 0.5 Moderate Positive
c R = 0 No cross-correlation
c R > 0 & c R 0.5 Moderate Inverse
c R = 1 High Inverse
Table 2. Operational Information for Wave Energy Converter (WEC) and Wind turbine (W/T).
Point 1
JanFebMarAprMayJunJulAugSepOctNovDec
c R 0.200.550.480.080.430.580.500.510.720.480.700.63
Hours Comp83.0082.0057.0095.00122.0015.0052.007.0025.0033.0012.0043.00
WEC Avail at 50% Rated0.00%2.53%8.20%0.00%0.00%0.83%4.03%2.15%10.83%3.90%8.19%4.56%
W/T Avail at 50% Rated31.59%40.18%48.39%19.31%33.60%46.81%63.17%75.81%45.83%50.54%50.97%44.43%
Point 2
c R 0.630.430.700.470.580.430.690.490.820.540.730.53
Hours Comp48.0073.0079.0031.0038.0053.0047.0078.0021.0064.0080.0090.00
WEC Avail at 50% Rated1.21%0.00%6.85%0.00%0.00%0.00%4.03%0.00%6.94%2.15%3.19%3.36%
W/T Avail at 50% Rated13.44%8.18%24.06%12.92%13.98%8.33%16.53%9.68%15.56%17.88%13.61%11.01%

