Article

Fracture Characteristics and Their Influence on Gas Seepage in Tight Gas Reservoirs in the Kelasu Thrust Belt (Kuqa Depression, NW China)

1
School of Energy Resources, China University of Geosciences, Beijing 100083, China
2
Research Institute of Petroleum Exploration and Development, PetroChina, Beijing 100083, China
*
Author to whom correspondence should be addressed.
Energies 2018, 11(10), 2808; https://doi.org/10.3390/en11102808
Submission received: 30 September 2018 / Revised: 14 October 2018 / Accepted: 15 October 2018 / Published: 18 October 2018

Abstract

:
Natural fractures were generally accepted as a key factor influencing the gas seepage performance in tight gas reservoirs in Kelasu Thrust Belt (KTB). However, the mechanism was not fully clarified, especially from a microscopic perspective. Based on observation of core samples and cast thin sections and gas charging experiment on core plugs, the parameters of fractures and seepage performance in fractured tight reservoirs are studied; further, the controlling effect of fractures on gas seepage was discussed. The results show that in KTB fractures could be categorized by the size of their apertures as macro-fractures (aperture width ranges from 0.1 to 2 mm) and micro-fractures (aperture width ranges from 5 to 100 μm), which appear in the form of fractures networks. Tectonic deformations and abnormal high fluid pressure control the fracture density: near faults or anticlines (folds), fracture density increases, and fluid pressure of 15 MPa increases the aperture by 50%, and induces new fractures. The fracture networks with high linear density significantly improves tight reservoir quality and seepage performance: it enhances the reservoir permeability by 1–4 orders of magnitude, and the relative gas permeability by 2–10 magnitude; by enhancing permeability, the fracture networks reduce the initial flowing gradient from as high as 0.41 MPa/cm to 0 Mpa/cm, and make the gas flowing possible.

1. Introduction

Tight sandstone reservoirs, including tight gas reservoirs and tight oil reservoirs, are one of the most significant unconventional oil & gas resources in the 21st century [1,2]. Despite their low porosity (<10%) and permeability (<0.1 × 10⁻³ μm2) [3,4,5,6], it is predicted that tight sandstone reservoirs will comprise 21% of the world total exploitation of unconventional oil and gas in the next twenty years [7,8]. In the meantime, natural fracture becomes a popular topic in tight gas reservoir researches. The type, scale, distribution, and timing of development of the natural fractures greatly influence the migration [9], accumulation [10], and development efficiency [11] of tight gas. For these reasons, it is of great importance to clarify the characteristics of natural fractures in the exploration and development processes.
In the Kelasu Thrust Belt (abbreviated as KTB) in the Kuqa Depression, tight sandstone gas reservoirs are widely developed across the Cretaceous Bashijiqike Formation. The reservoirs display high gas contents (60% to 85%), and proved reserves of 2 × 10¹² m3 and gas yield of 0.4–2.8 × 10⁶ m3 per day in a single well [12] at depths of 6000–8000 m. Compared with tight gas reservoirs in other basins like the Ordos Basin in China [13,14], Sichuan Basin in China [15], Western Canadian Basin in Canada [16], the reduction of tight gas reservoirs in KTB is several times higher. Studies have been carried out on the tectonic evolution [17,18,19,20,21,22,23,24], structural characteristics [25,26], stratigraphy [27,28], reservoirs [29,30,31,32], and hydrocarbon migration histories [33,34] in KTB, to explain why tight gas reservoirs in KTB have such high gas reserves and production at such great depths. It is generally agreed that tectonic faults and fractures played an important role in enhancing gas migration and production efficiency. Tao [35] fully described the characteristics of the natural fractures in KTB using FMI images and cores, and explain the relationship between fracture formation and in-situ stress. Sun [36] further studied the fracture-pore systems using cast thin sections, and identified a fracture zone in KTB. On this basis, Shen [24] determined gas source faults as key elements in natural gas migration and accumulation, and evaluated their effectiveness combining geochemistry and fluid potential analysis method. However, these studies explained the high reserve of KTB tight reservoirs in a macro view, and had not clarified the microscopic mechanism of gas seepage in gas charging or production process, including but not limited to pathways, characteristics, and controlling factors; whereas, a deep understanding of above could help explain and predict gas saturation and distribution, which is of great value to further explorations.
The effects of fractures in improving permeability and seepage performance of tight reservoirs were studied and discussed in the KTB. First, different scales of fractures were identified on outcrops, core samples and thin sections, and thereafter classified by their aperture as macro-fractures and micro-fractures. The features of two groups of fractures were characterized and compared in details. Second, based on core charging experiments, the mechanisms how fractures control the seepage performance were explained. Third, how different scales of fractures improve permeability which directly controls gas charging and production processes was discussed, and further what factors influence this improvement.

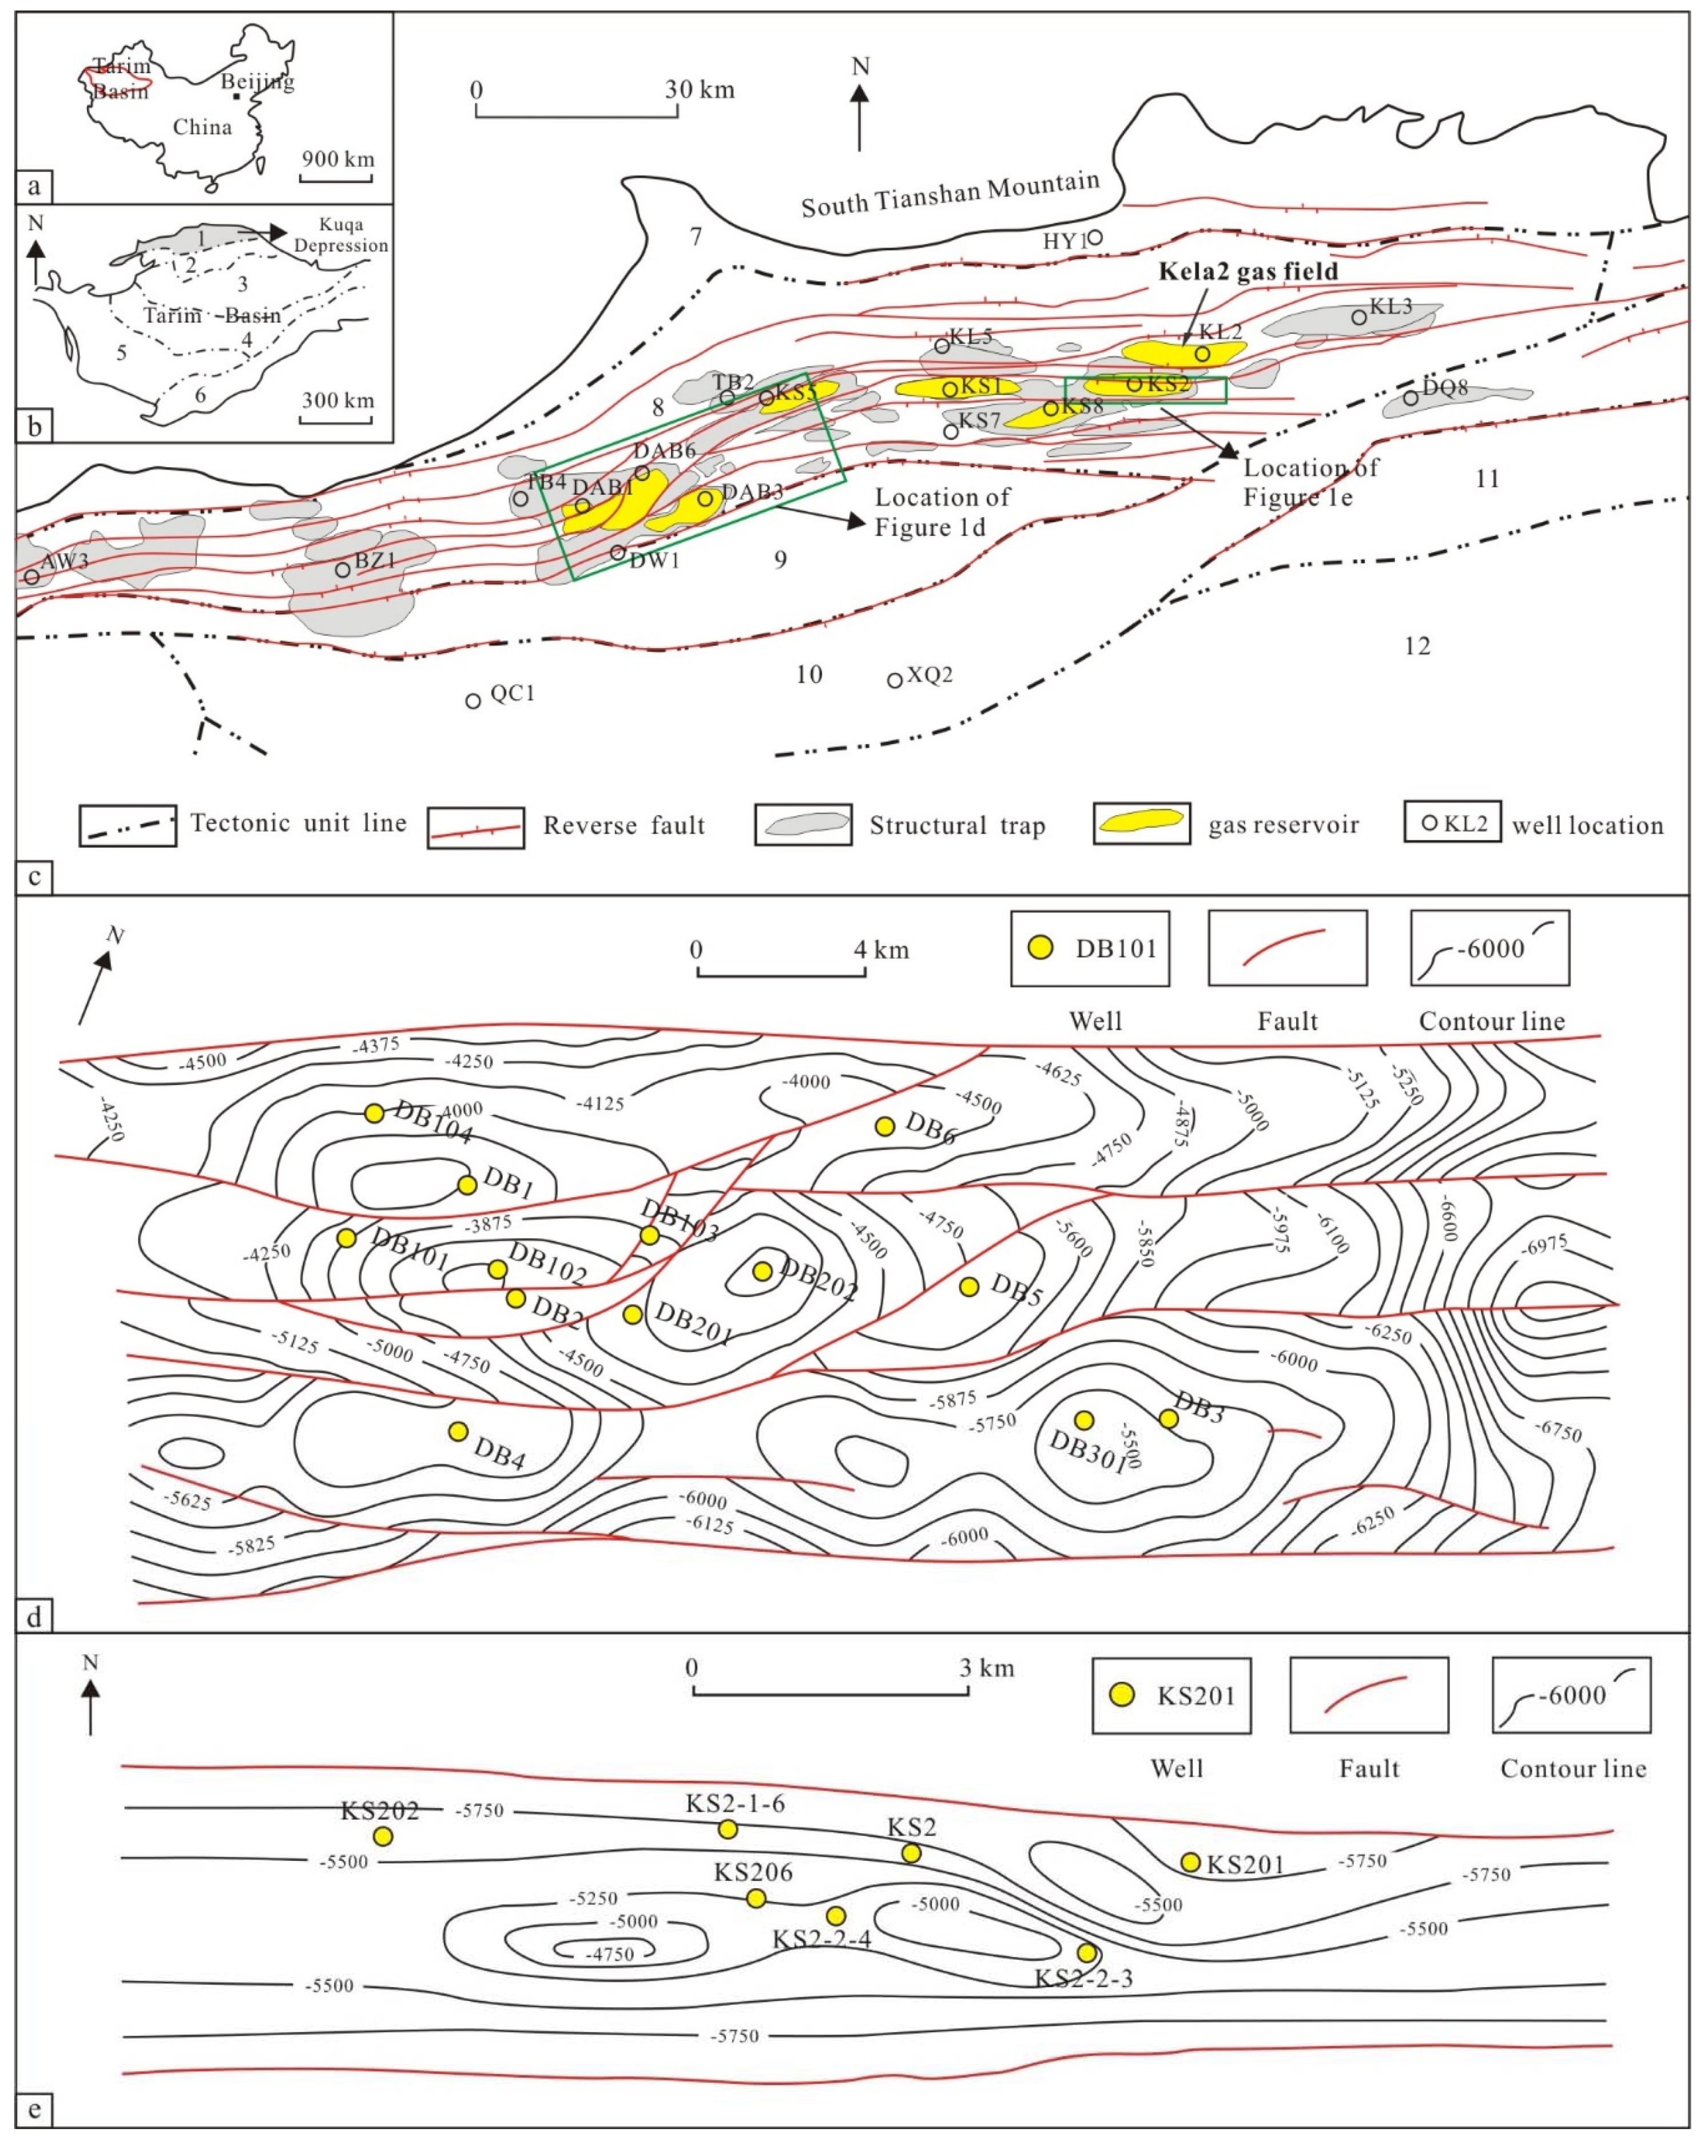
2. Geological Setting

2.1. Tectonic Setting and Structural Evolution
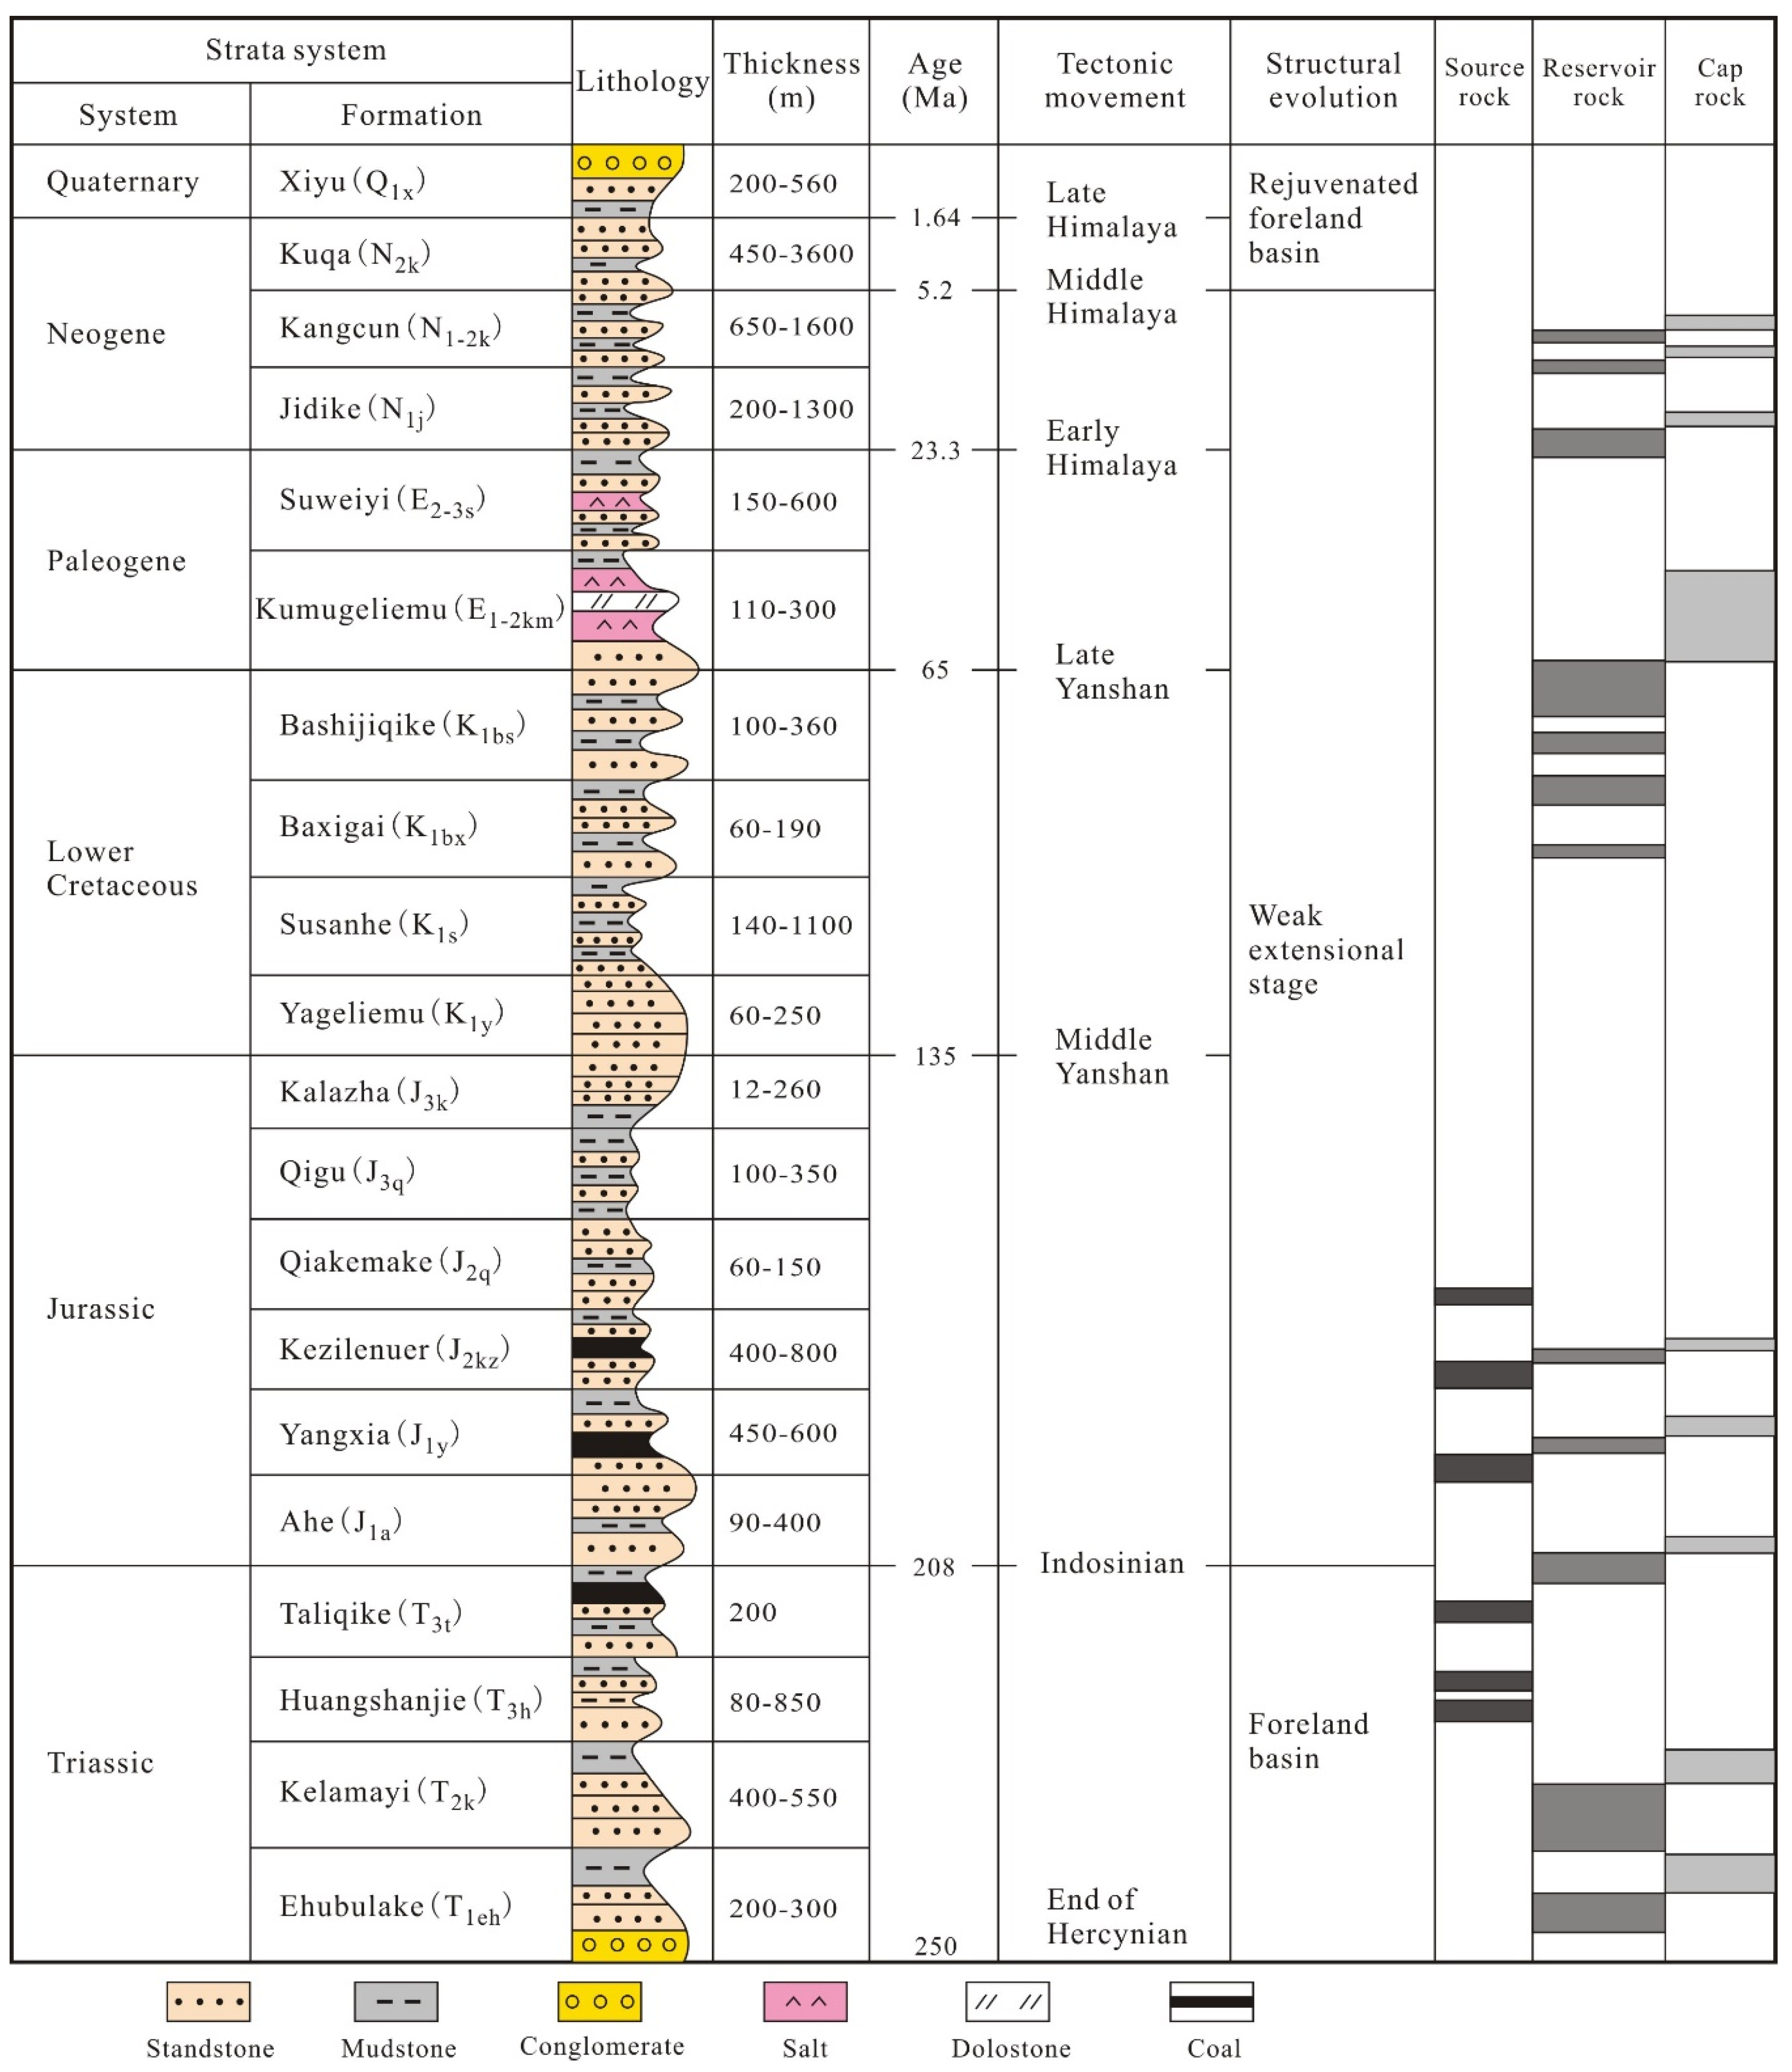
The Kuqa Depression is located in the northern part of the Tarim Basin and to the south of Tianshan, and is further divided into seven substructural units, including the Northern Monoclinal Belt, Kelasu Thrust Belt, Yiqikelike Thrust Belt, Wushi Sag, Baicheng Sag, Yangxia Sag, and Qiulitak Anticlinal Structural Belt (Figure 1). The KTB is located in the northwest of the Kuqa Depression, and could be further divided into four segments, including the Awate, Bozi, Dabei, and Keshen, from west to east. Several studies have covered the structural evolution of the Kuqa Depression [19,37,38], and a prevailing conclusion was drawn that the Kuqa Depression has experienced three stages of evolution [39,40]: the late Permian-Triassic peripheral foreland basin stage; the Jurassic-Paleogene extensional rift basin stage; the Neogene reactivated foreland basin stage. The continuous structural deformation caused by the Cenozoic Tianshan uplifting shaped the Kuqa Depression [41,42], and led to the formation of a series of thrust faults and strike-slip faults [42]. These faults are reported as pathways for oil migration and accumulation in Paleogene and Neogene period, and gas migration in Neogene and Quaternary period [23].

2.2. Stratigraphy

The KTB area of the Kuqa Depression is filled with Mesozoic-Cenozoic formations except upper Cretaceous because of the regional uplift in late Cretaceous (Figure 2). Main lithology of the strata contains mudstone, sandstone and conglomerate. The thick and widely developed sandstone in fan-delta and braided river delta sedimentary facies in the Cretaceous Bashijiqike Formation form the tight sandstone reservoirs. The thick layer of gypsum and salt in the Paleogene Kumugeliemu Formation are reported as effective caprocks [33,43] for tight gas reservoirs. Liang [32] reported that the Middle to Lower Jurassic and Upper Triassic coals and mudstones are source rocks for this area which experienced multi-stage oil and gas generation from 5 to 2 Ma.

2.3. Tight Gas Reservoirs

Gas reservoirs in the KTB are mainly distributed in the Cretaceous Bashijiqike Formation, at depths of 6000–8000 m. Except for the KL2 gas reservoir (the gas reservoirs that penetrated by the KL2 well, Figure 1a), all the other gas reservoirs discovered so far are tight gas reservoirs, with average porosity less than 5% and permeability less than 0.5 × 10⁻³ μm2 (Figure 3). Compared with tight gas reservoirs worldwide, there are two predominant features in the gas reservoirs in the KTB. First, abnormal high fluid pressure is very common with pressure coefficient ranging from 1.65–2.27 (Table 1). The high fluid pressure is reported as a result of regional tectonic movements [22,23], and may relate to the high productivity of the reservoirs.
Another important feature of the gas reservoirs in the KTB is their high level of gas saturation. Table 1 shows the comparison of gas saturation in the KTB and other basins worldwide. The average porosity of the tight reservoirs in the KTB is similar to that of the other reservoirs; however, in KTB the gas saturation is much higher (Table 1). In the meanwhile, the gas yield in the KTB is also much higher. Du [12] reported that the highest gas yield from tight gas reservoirs in a single well in the KTB reached 0.4–2.8 × 10⁶ m3 per day without hydraulic fracturing treatment. Compared with other areas, the gas yield in the KTB is tens of times higher (Table 1).

3. Samples and Methods

3.1. Samples

In this research, core samples, core plugs and cast thin sections were used for observations and experiments. Core samples from six wells in the Bashijiqike Formation in the KTB were analyzed, and the total core length reached 1025 m (Table 2). The inclination angle, apparent length, aperture, and density of the fractures were measured. In addition, 100 cast thin sections and six core plugs (Table 3, sample No. 2–7) were made from core samples to further study the features of fractures and seepage characteristics. All the cast thin sections were made along the vertical direction to make sure that inclination angles could be measured. All the fracture parameters were also measured. Because of different scales, the parameters of fractures measured on core samples and in thin sections displayed pronounced differences. These core plugs, 5–6 cm in length and 2.54 cm in diameter, were used for gas charging experiments to study the seepage features in the reservoirs.

3.2. Methods

3.2.1. Counting Linear Density

All the fracture parameters could be directly measured on the core samples or in thin sections, except for the density of the fractures. On core samples, the number of macro-fractures were counted on each segment of the cores, and linear density of the macro-fractures are defined as [47]:
  D L C = 1 n F n 1 n L n  
in the equation above, DLC is the linear fracture density of core samples (piece/m), n is the total number of segments, Fn is the number of fractures on the nth segment, Ln is the length of the nth segment (m).
Linear density of the micro-fractures, which is observed in cast thin sections, is calculated in a similar way. The number of micro-fractures was counted on each circular view shed of the microscope, and the linear density of the micro-fractures is defined as:
  D L T = 1 n F n n × L  
in the above equation, DLT is linear fracture density in thin sections (piece/mm), n is the total number of the view sheds, Fn is the number of fractures on the nth view shed, L is the diameter of the circular view shed of the microscope (mm).

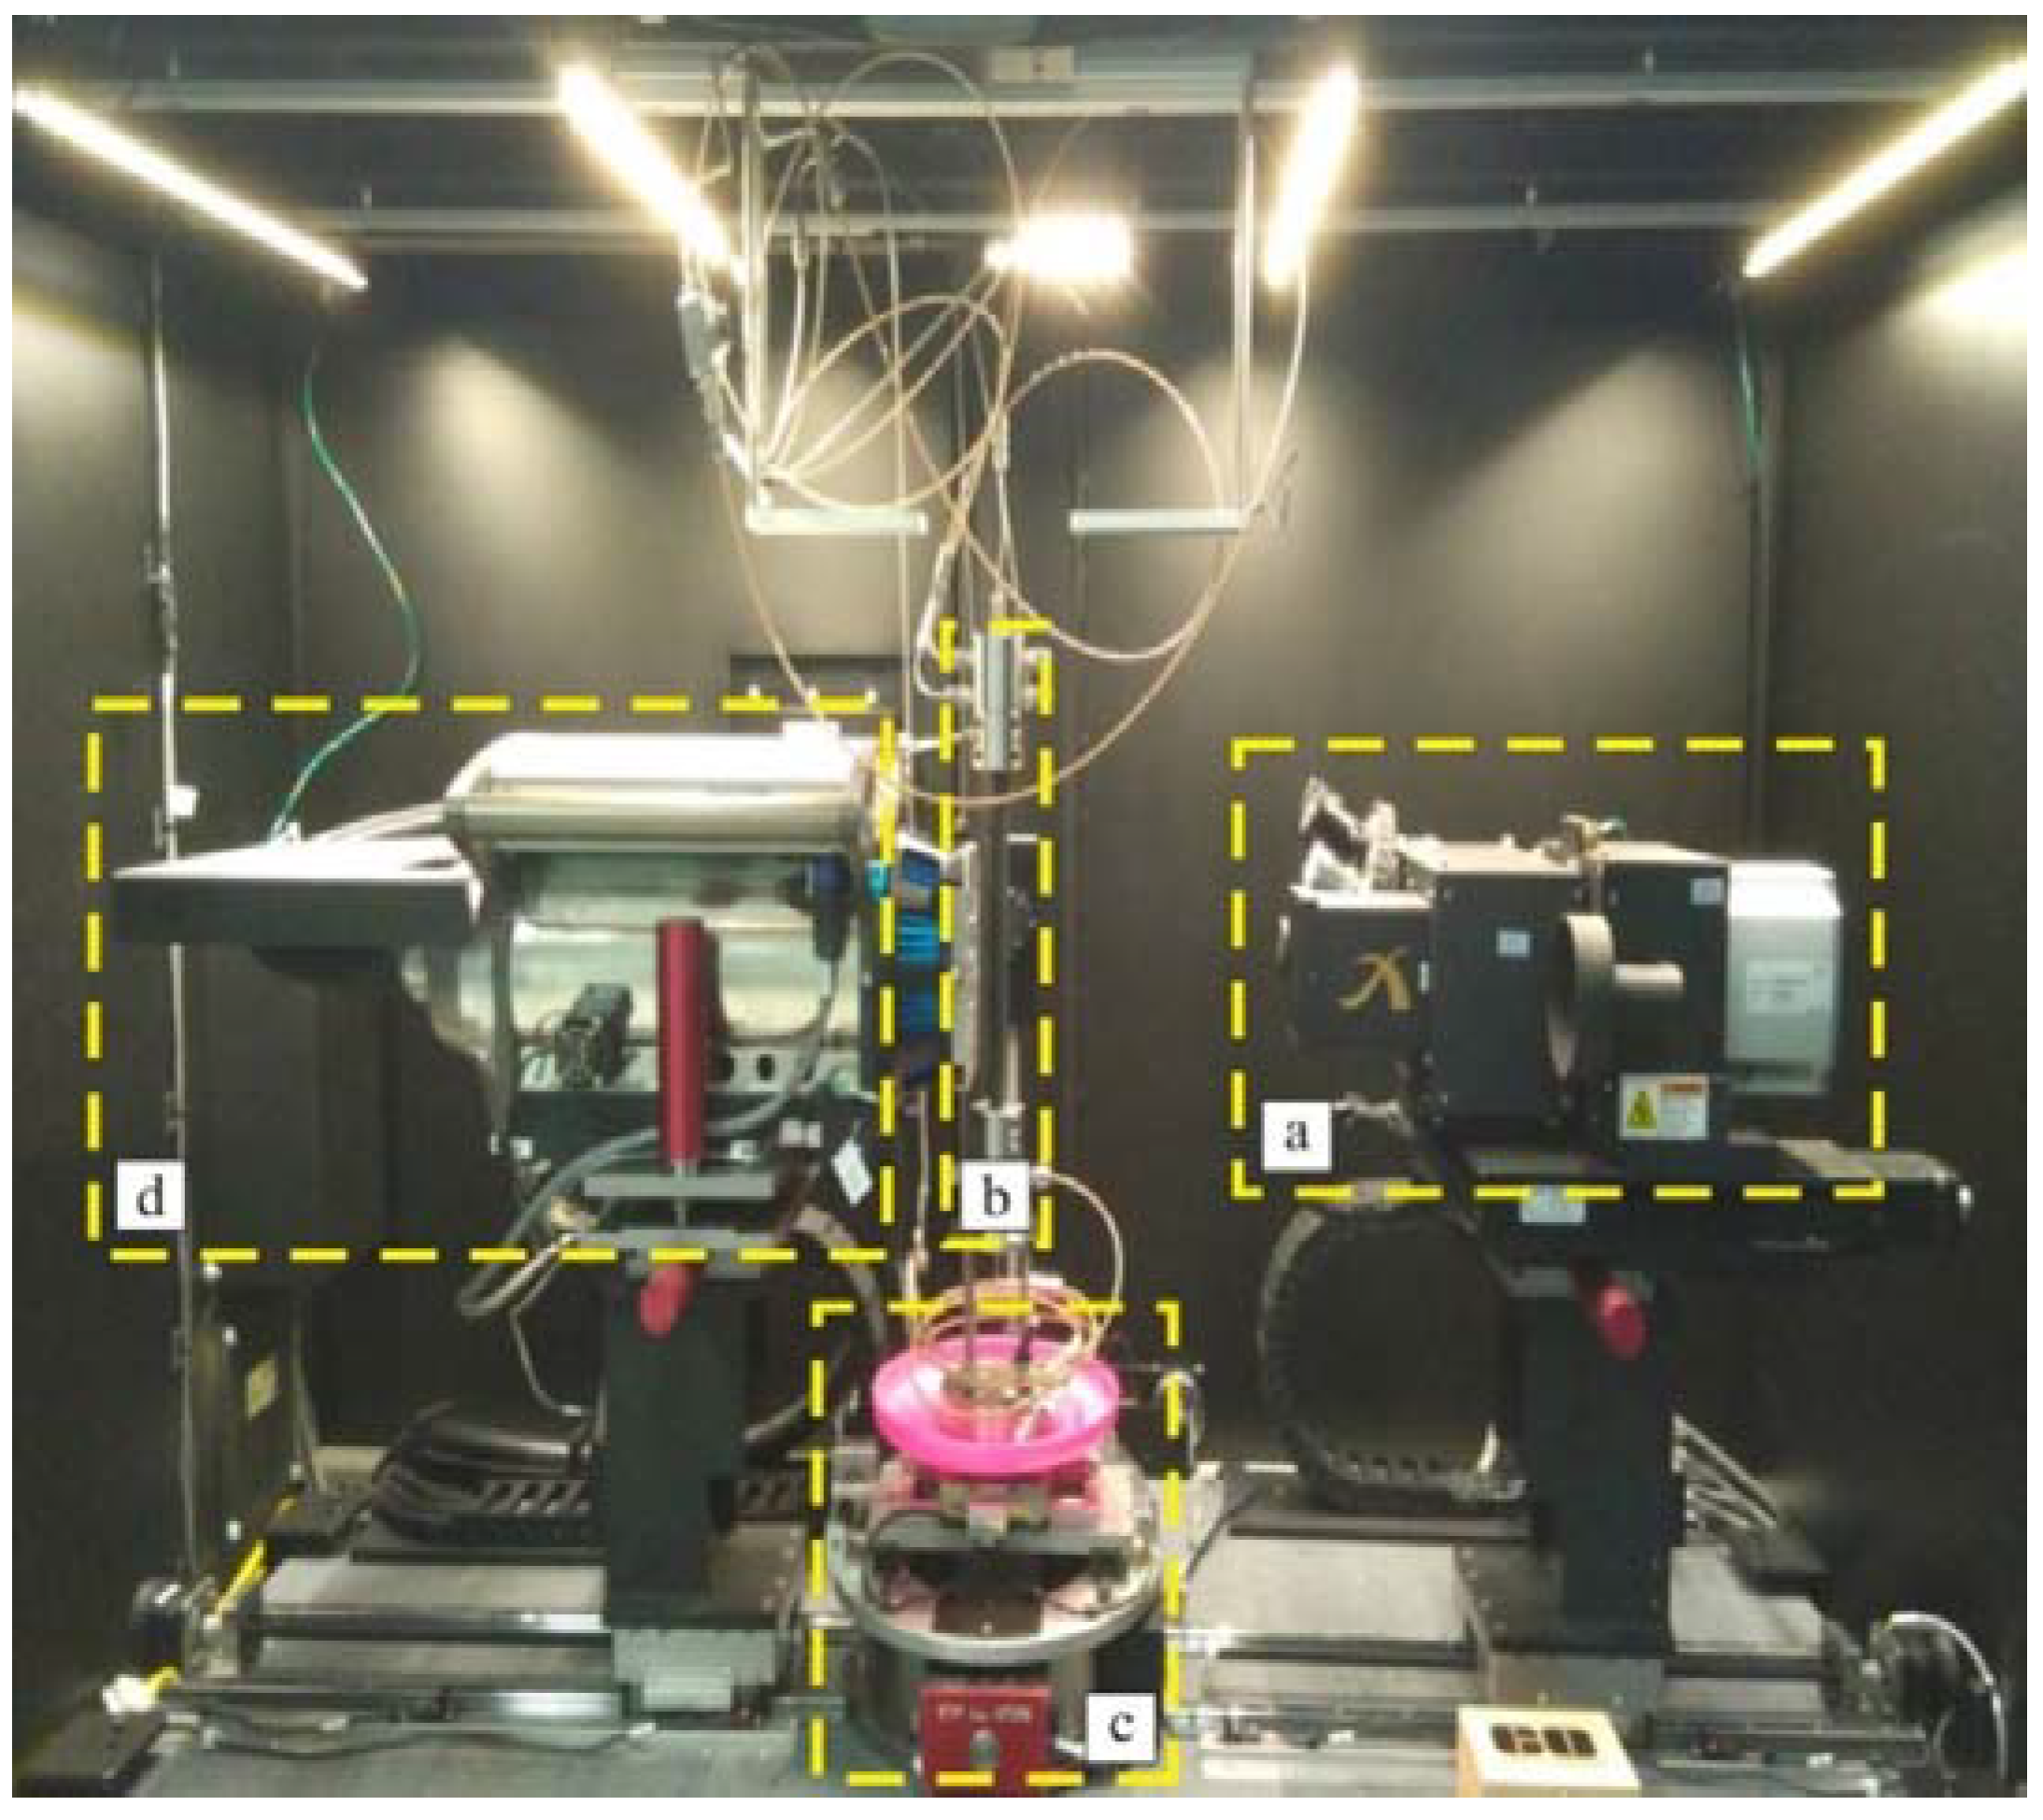
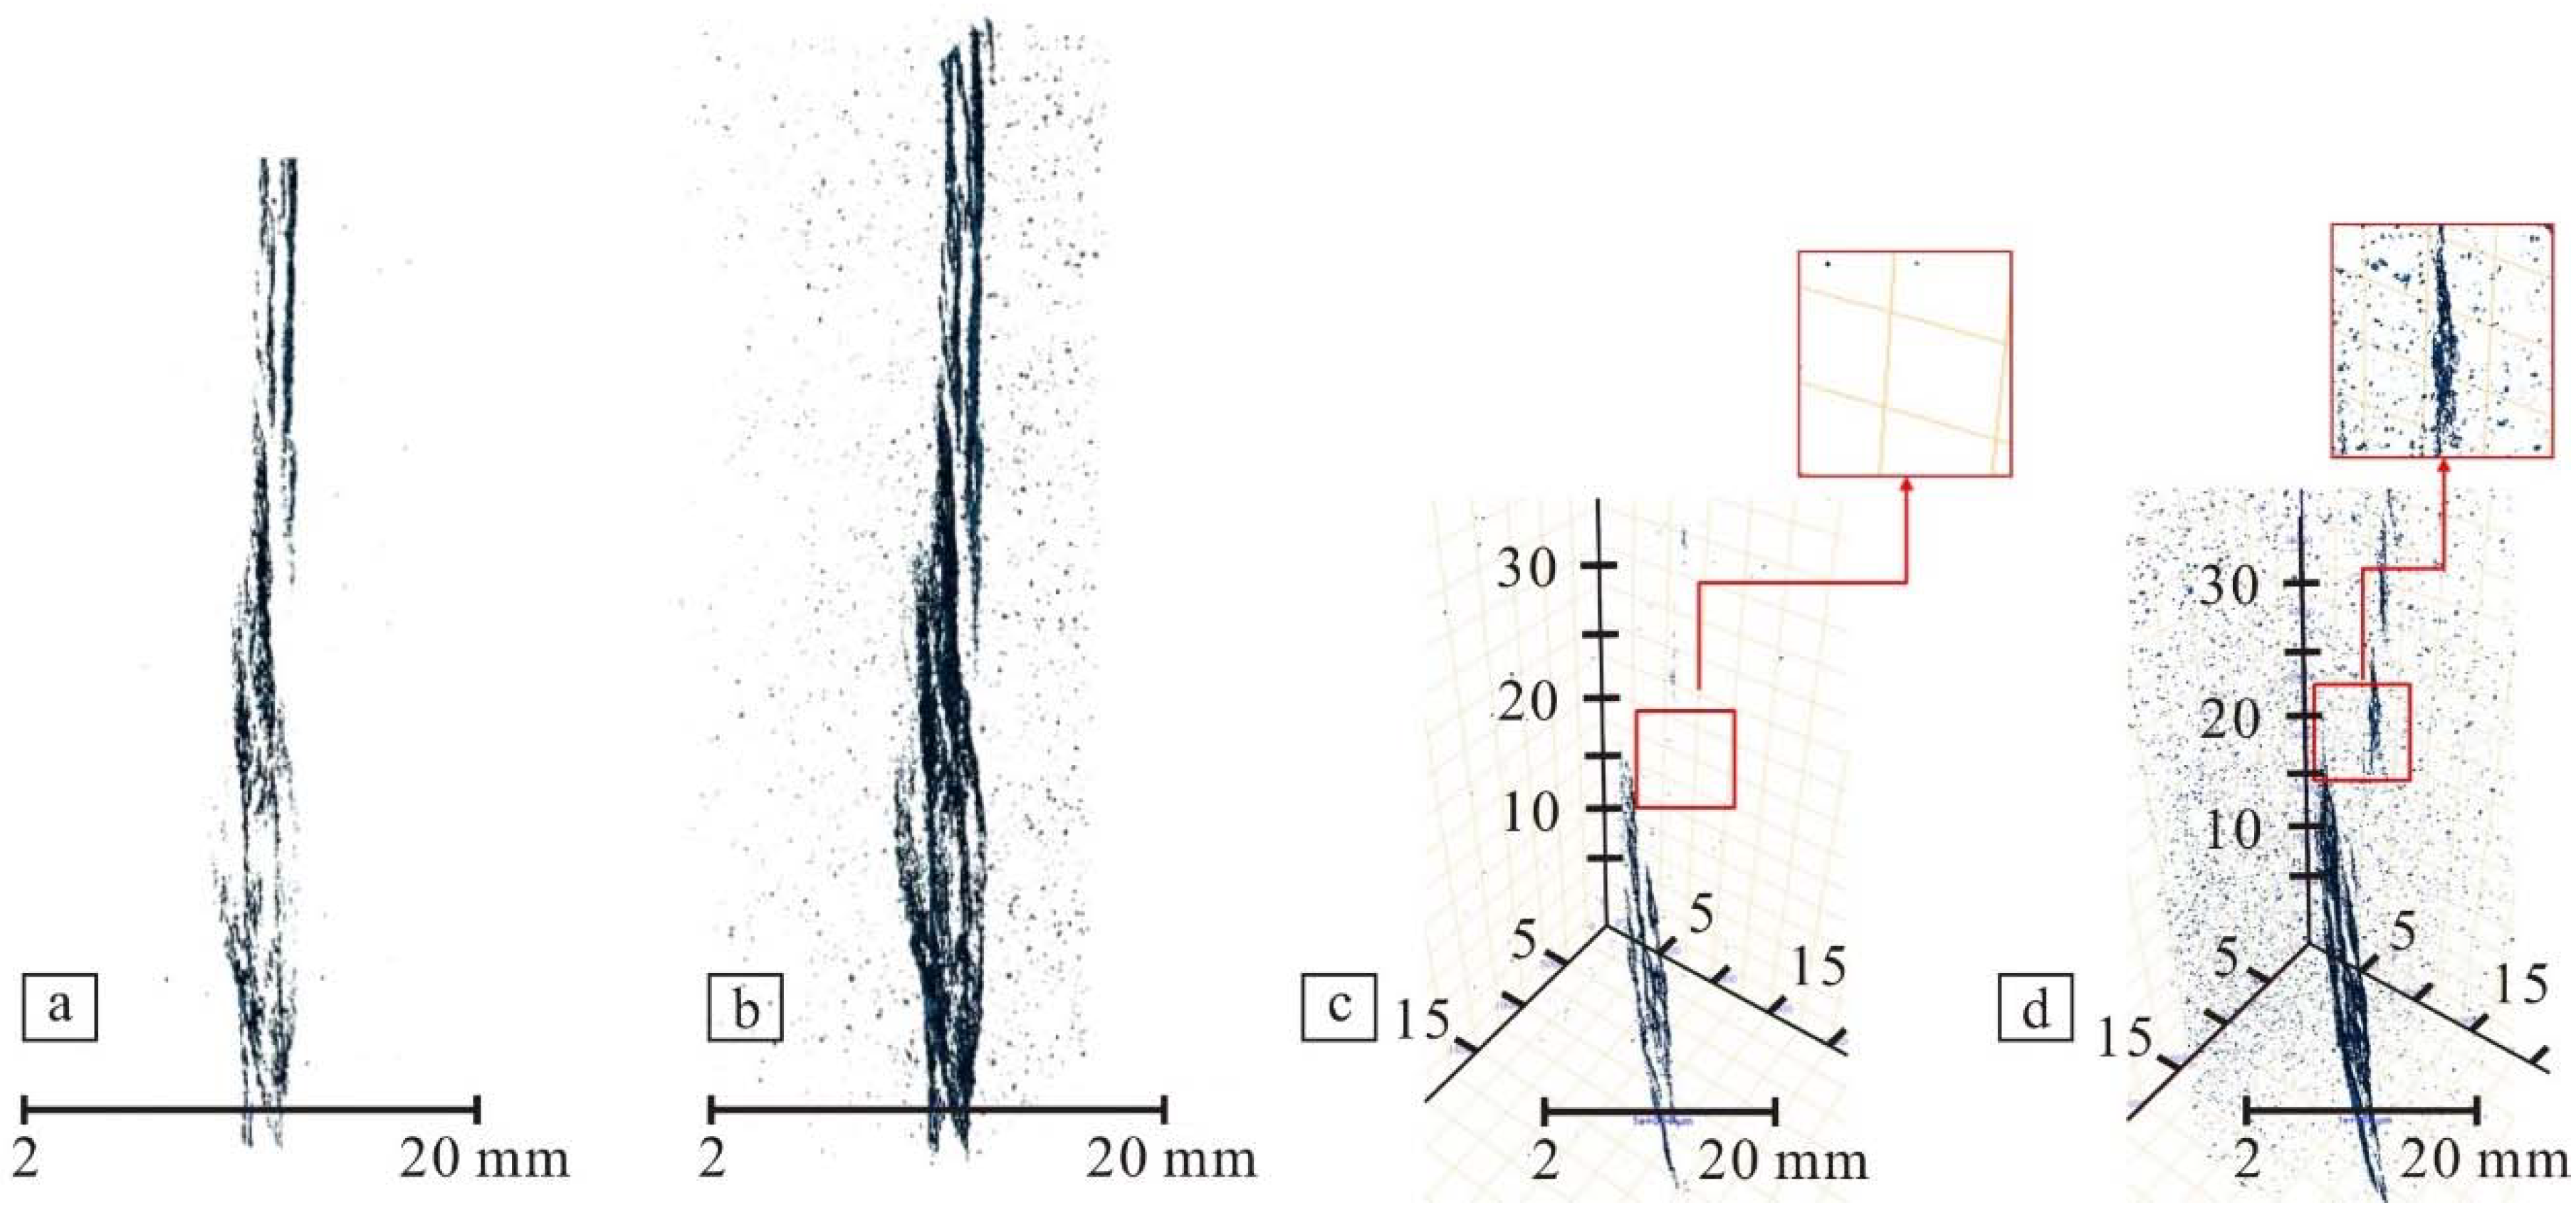
3.2.2. Pressure Experiments on Fractured Core Samples

The objective of pressure experiments is to study the change of fracture characteristics when abnormal high fluid pressure exists. In the Bashijiqike Formation, the fluid pressure coefficient reaches up to 1.83–2.21 with strong overpressure [22], and its effect on fractures characteristics such as aperture and length is non-negligible. Taking the KS205 well as an example, the fluid pressure is up to 159.5 MPa at buried depth of 7088 m, the pressure coefficient is up to 2.25, and the effective confining pressure is only 10 MPa. Using a Xradia 510 Versa X-ray microscope (ZEISS, Beijing, China) a high pressure and high temperature (HPHT) carbon fiber core holder and a gas charging system (its relative parameters are described in Figure 4), a workflow was designed to study the effects of abnormal fluid pressure on fractures:
  • Cut the core samples (Well KS205, 7204.9 m) to 5–6 cm long cylinders of 2.54 cm diameter.
  • Put the core plug into the HPHT carbon fiber core holder and set the confining pressure at 15 MPa, then use the X-ray microscope to scan the core samples at 0 MPa pore pressure.
  • Use the gas charging system to inject He gas into the core samples until the pore pressure reaches 2 MPa and 5 MPa respectively, and maintain each pressure for 48 h.
  • Use the X-ray microscope to scan the core samples respectively at the two pore pressures above.
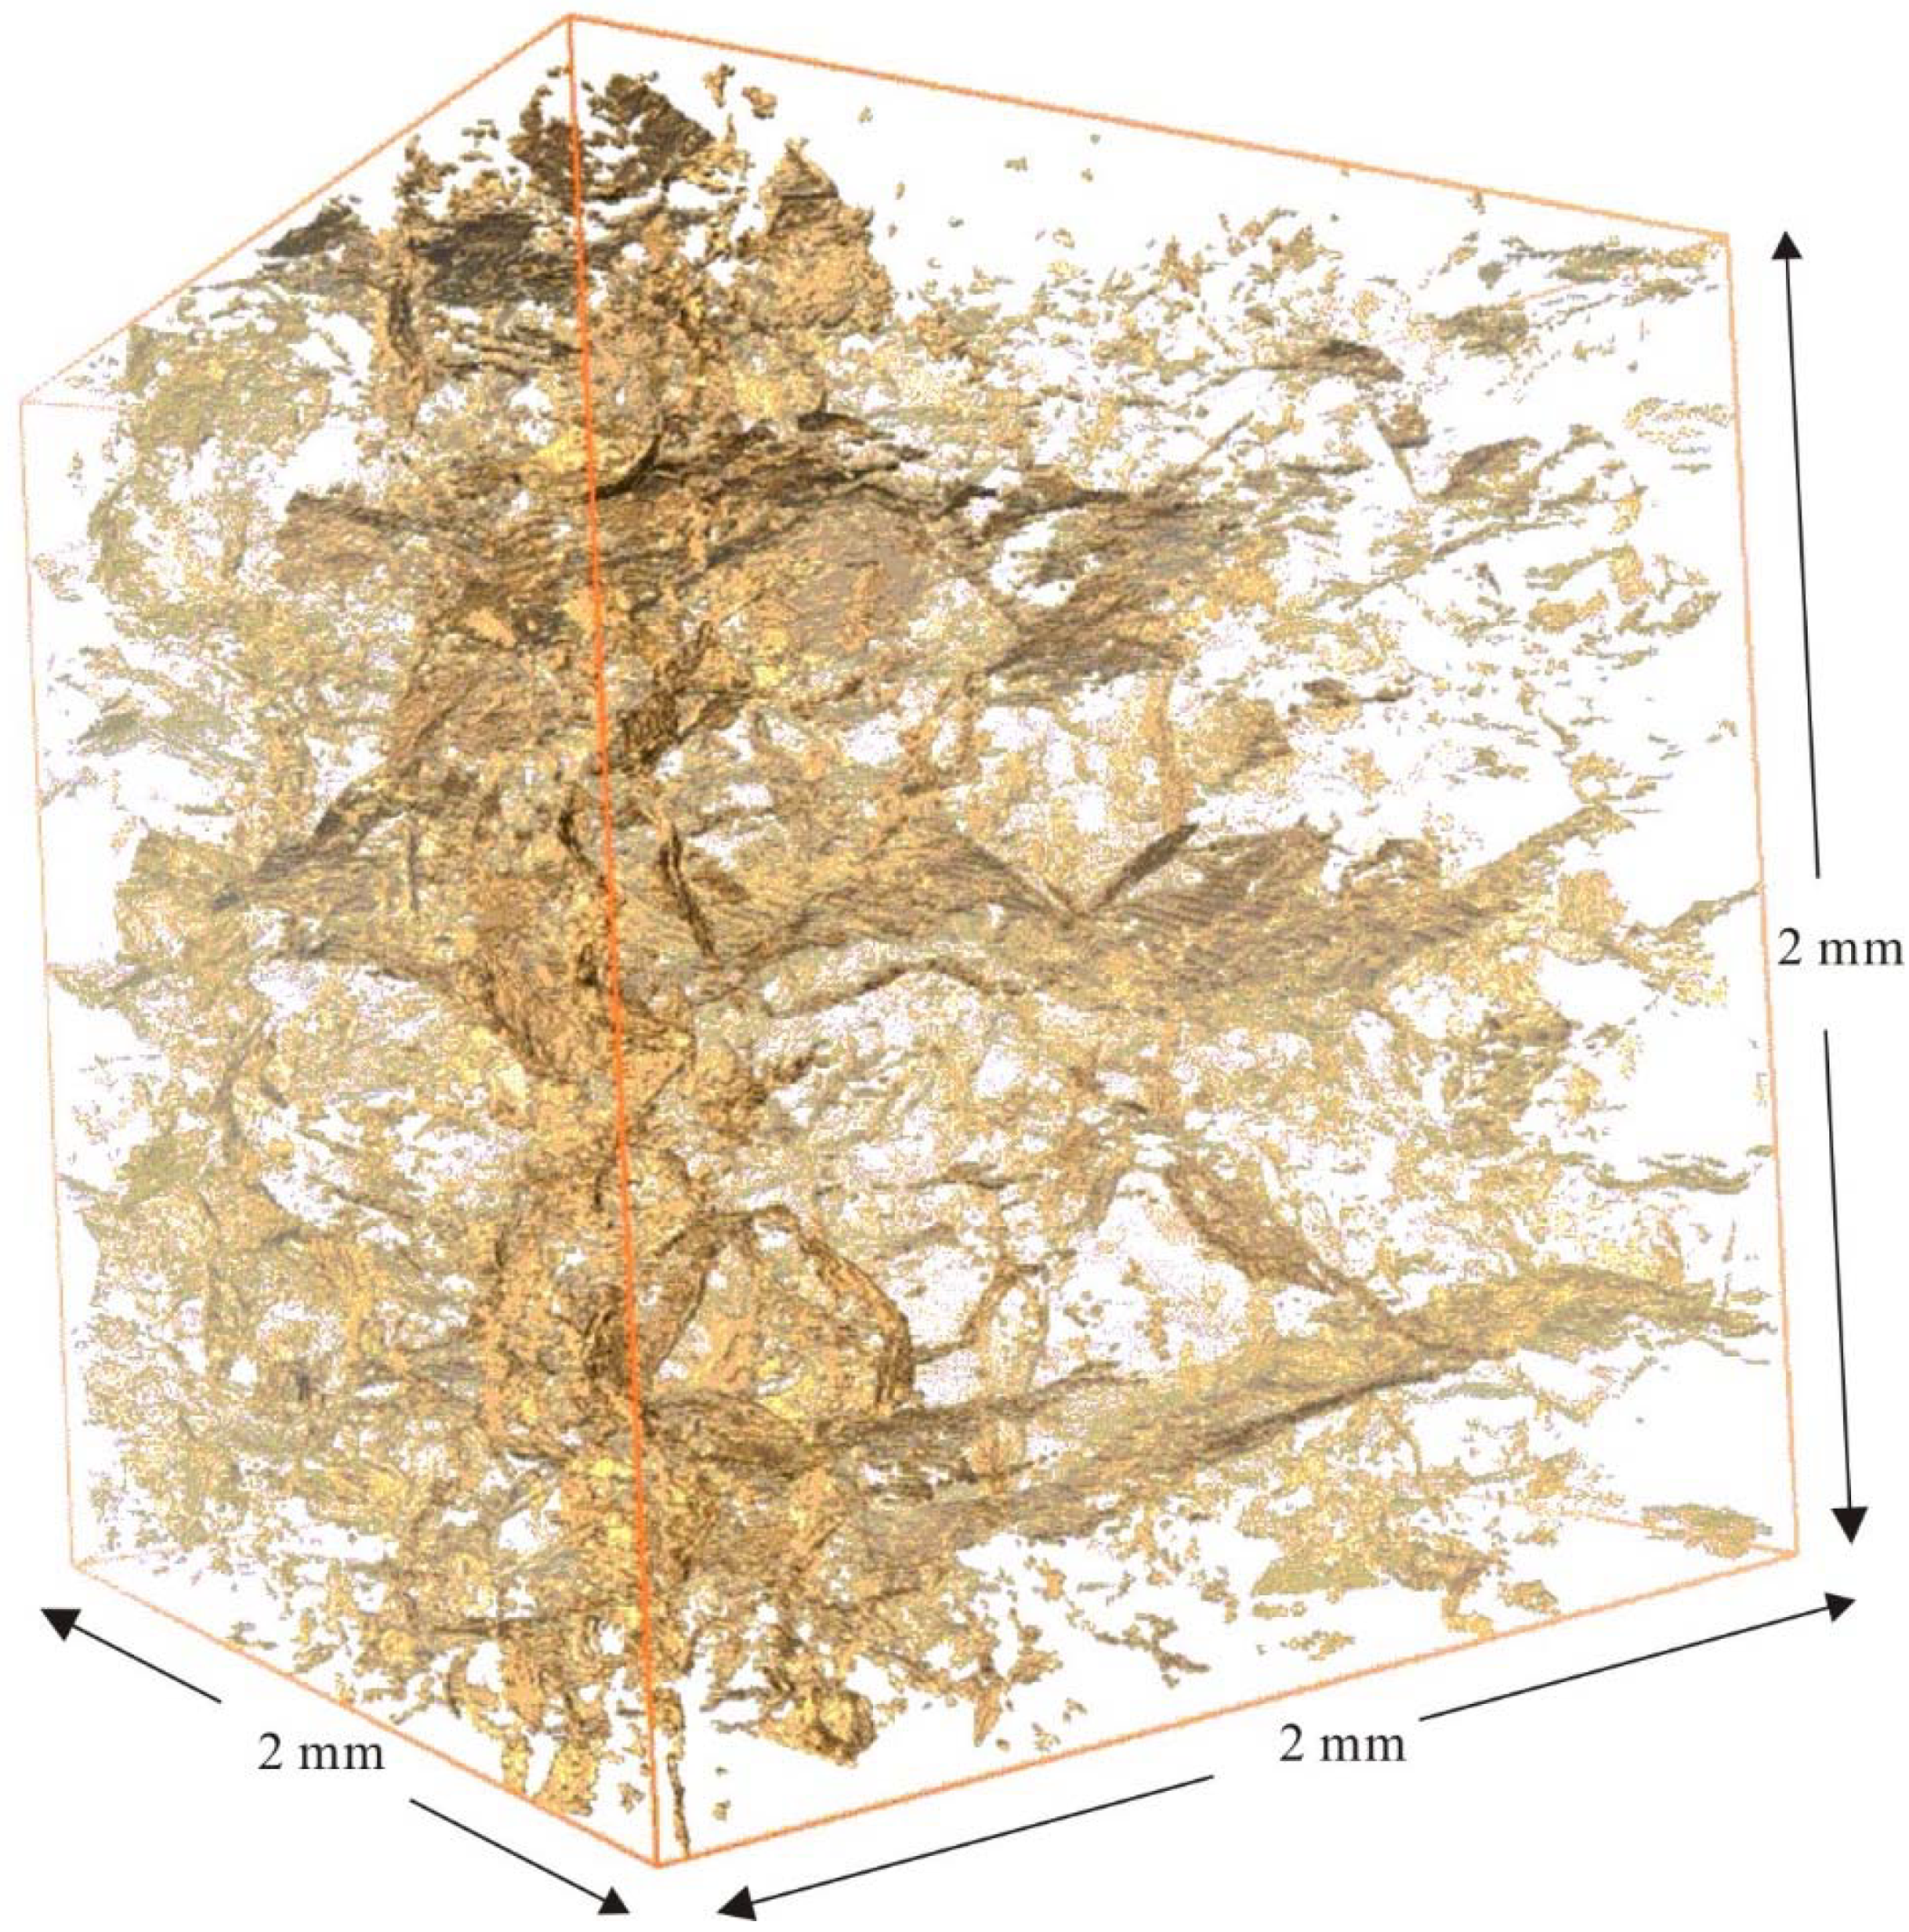
  • Use Avizo software to interpret the three datasets from the 3D micro-CT scanner.
  • Compare the fracture parameters interpreted by the micro-CT scanner with confining pressure of 15 MPa and pore pressures of 0 MPa, 2 MPa and 5 MPa, respectively.

3.2.3. Core Charging Experiment

The objective of core charging experiments is to measure the initial flowing pressure gradient and flow rate in core plugs when charging gas into them. An ISCO100DX micro-injection pump (Teledyne, Thousand Oaks, CA, USA) was used for gas injection. Its minimum injecting rate is 0.01 uL/min, and rated pressure is 68.96 MPa (10,000 psi). In the experiment, the actual injecting pressure (radial pressure) was controlled by the computer. An HBS-2 constant pressure pump (Huabao Instrument, Yangzhou, China) was used to adjust and maintain the confining pressure to make sure that the gas flows through the core plugs instead of the annular space between the core plug and the holder. This pump was also controlled by the computer and could automatically increase the confining pressure (initial pressure was set as 3 MPa) as the radial pressure rises. A differential pressure gauge was used to measure the pressure difference between the inlet and outlet during the experiment. A gas flow meter was used to measure the gas flow rate on the outlet after gas-water separation. The experiment was conducted at 20 °C. The core sample was first saturated by water. To avoid the adsorption of the plug, Ar was used as injection gas. The inlet pressure (read at the micro-injection pump) was increased from 0 to 8 MPa in a controlled manner. The initial confining pressure was set as 3 MPa, and automatically increased with the radial pressure.

4. Results

4.1. Fractures Classification

Origin and scale are two commonly used indices for fracture classification [48]. The origin of fractures is determined by their occurrence and angular relationship with bed surface. It is generally believed that in the tight gas reservoirs of the KTB, structural fracture is the main form of the fractures which was a result of regional tectonic movements. On the core samples it was easily observed that structural fractures cut through formation boundaries, which shows the controlling effects of tectonism on fracture development. Fractures of other forms such as dissolved fractures or diagenetic fractures were rarely observed, as reported by Shen [24].
Classification of fractures by their scales is more meaningful for the research of gas seepage and productivity. Though sharing the same origin, fractures in tight gas reservoirs of KTB feature a wide range of scales. Foremost, aperture width is key to the classification of fractures, because it directly controls the seepage of natural gas in fractures. Furthermore, Neuman [49], through numerical analysis, pointed out that average fracture length, a power function of aperture width, is another important parameter controlling gas flow characteristics. Based on different characteristics of aperture width and length, four types of fractures were identified and categorized in the Bashijiqike Formation:
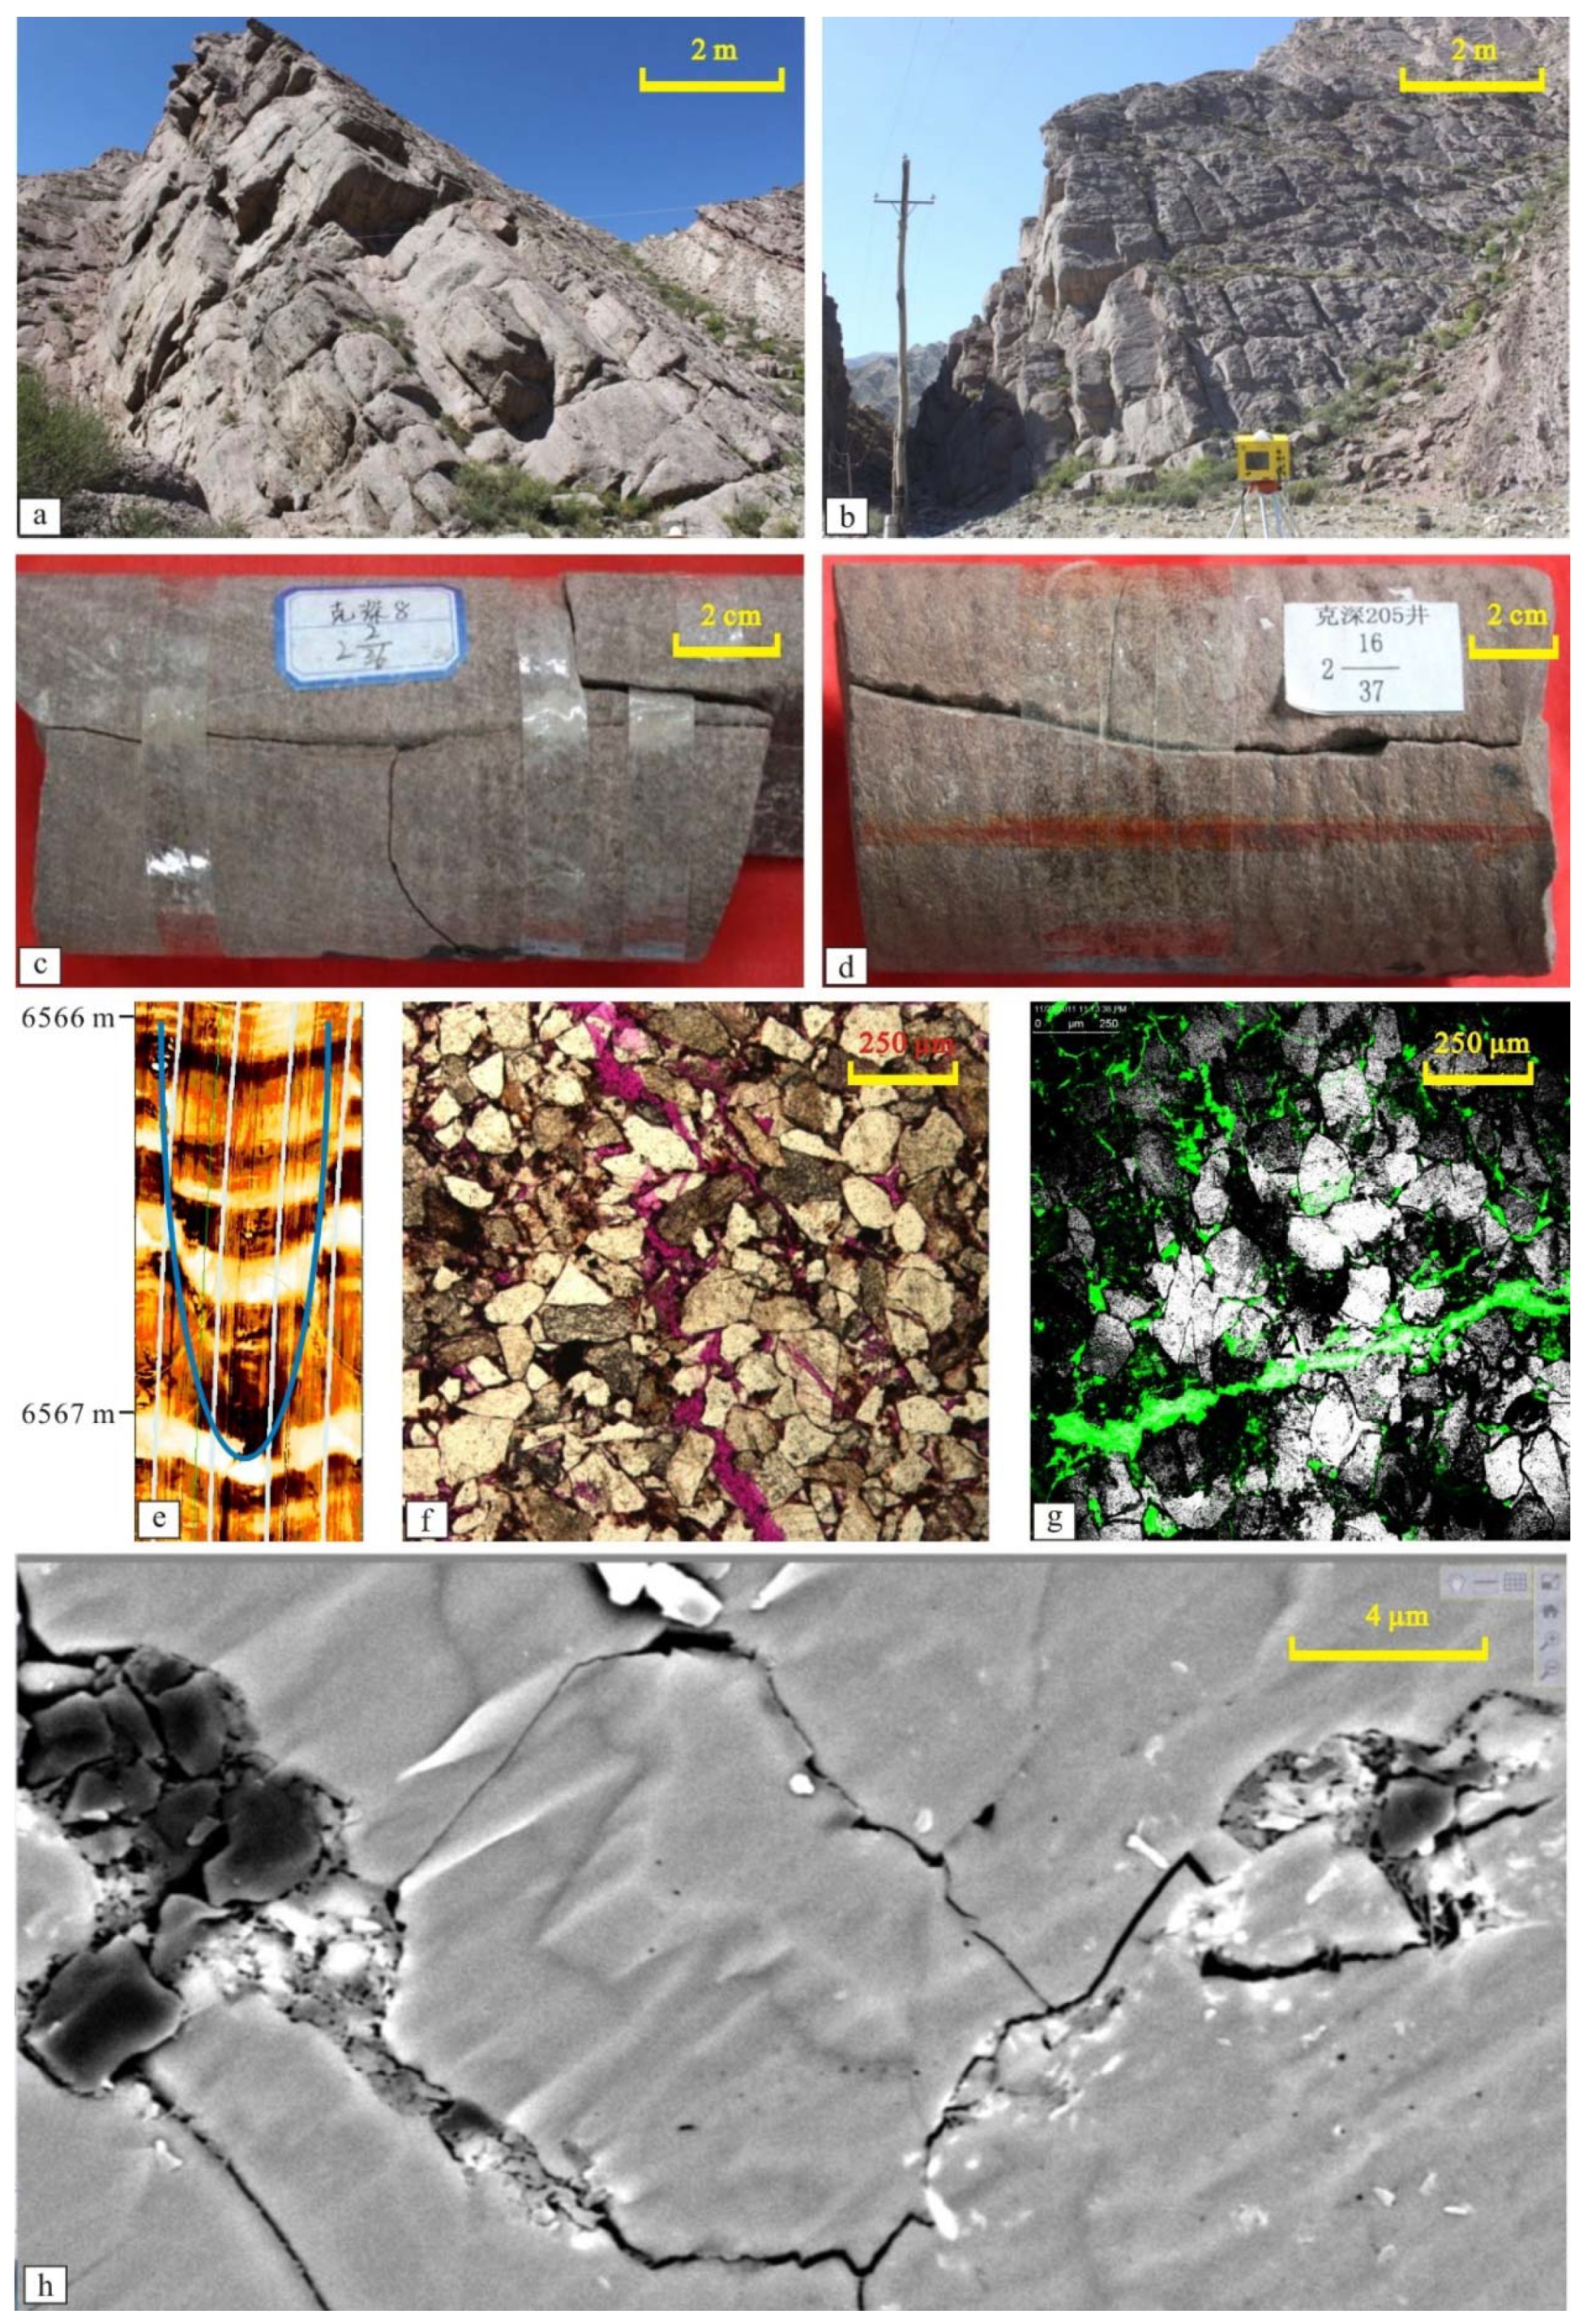
  • Giant fractures (with length > 10 m and aperture width > 1 cm), which are recognized on outcrops and usually cut through sandstone members (Figure 5a,b).
  • Macro-fractures (with length of 0.05–3 m and aperture width of 0.1–2 mm), which are recognized on cores and FMI logs (Figure 5c–e).
  • Micro-fractures (with length of 0.05–2.5 mm and aperture width of 5–100 μm), which are recognized in thin sections and usually cut through grains (Figure 5f,g).
  • Nano-fractures (with length circa. 50 μm and aperture width circa. 50 nm), which extend along the edges of grains (Figure 5h).
Giant fractures are so large that existing techniques are unable to quantitatively measure its contribution, though non-negligible, to permeability and seepage mechanism. Nano-fractures are too small and yet relevant data is not sufficient for detailed study. So in this paper, the characteristics of macro- and micro-fractures is the main object. Table 2 shows the characteristics of these two types of fractures in several wells of the Bashijiqike Formation. It is worth noting that both macro- and micro-fractures can be filled by calcite, which was observed in core samples and thin sections. These fractures have no contribution to permeability improvement for tight reservoirs. Only effective fractures, which are unfilled or partially filled, were counted on core samples or thin sections.

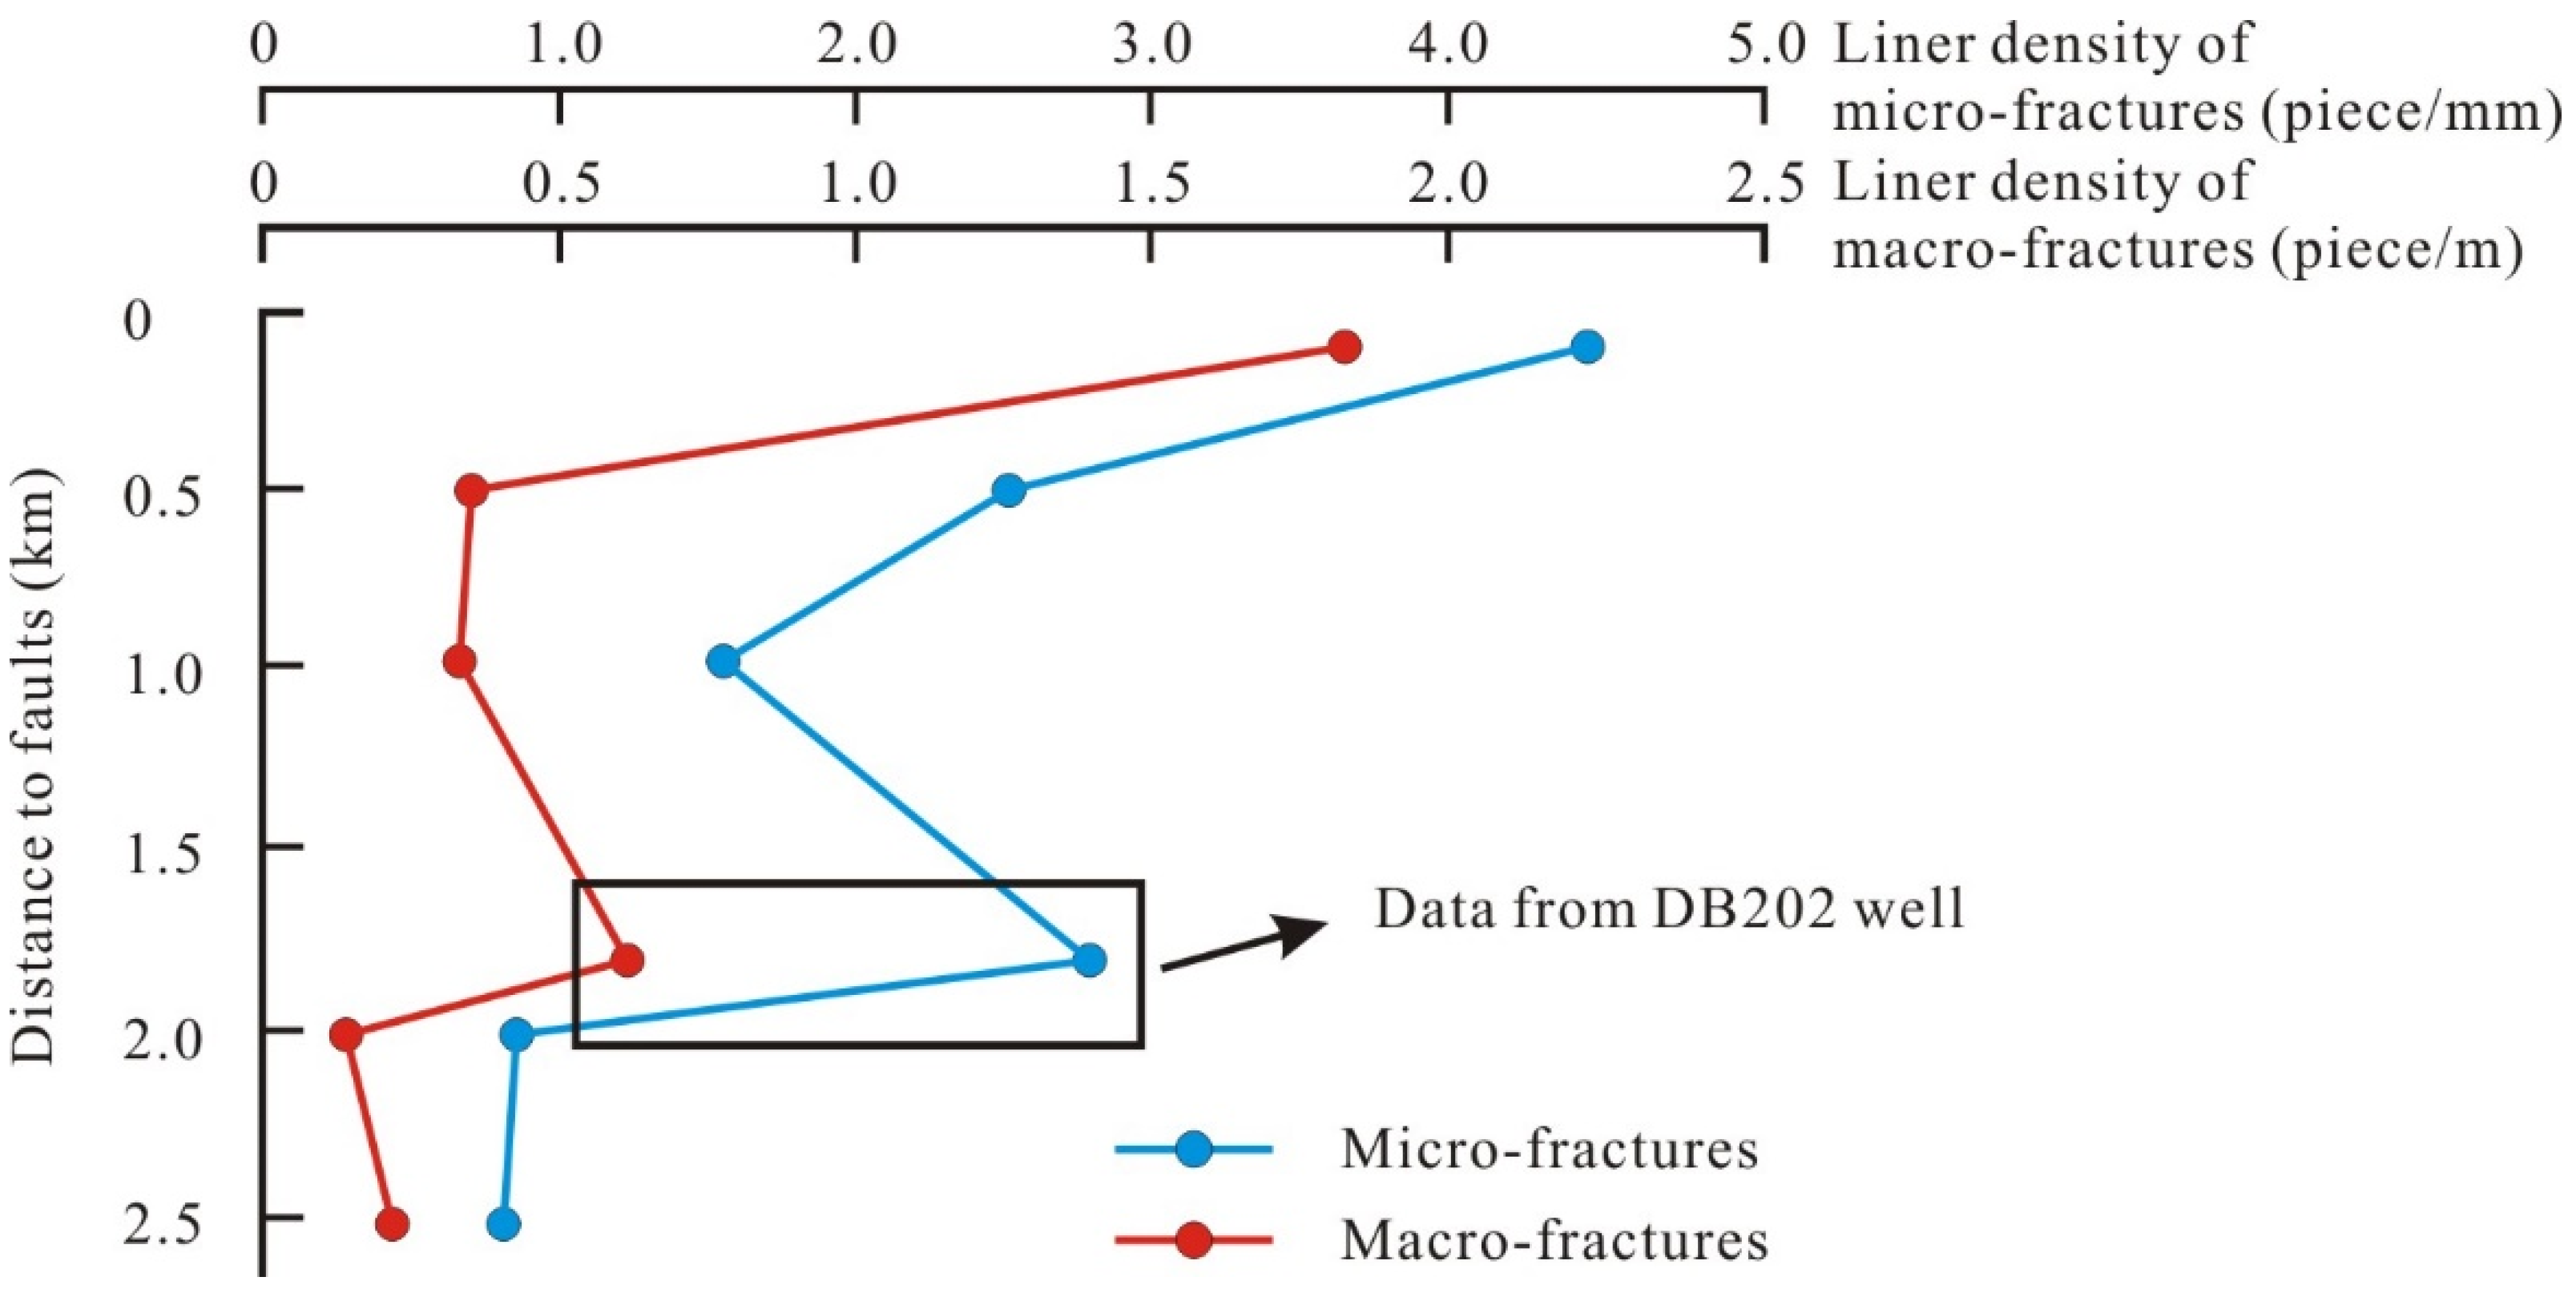
4.2. Characteristics of Macro- and Micro-Fractures

Though sharing the same origin, these two types of fractures have distinct characteristics. Firstly, the inclination angles vary. Macro-fractures that are directly controlled by tectonism under the geological background of thrust belt feature high inclination angles of relatively narrow range (44° to 86°). On the contrary, micro-fractures that normally derive from macro-fractures feature a wide range of inclination angles (12° to 89°) (Table 2). Secondly, there is also evidence of difference in fracture lengths. The apparent length of the macro-fractures ranges from 0.03 m to 3.54 m on core samples; some fractures with high inclination angles are even long enough to split the core sample (Figure 5c,d). However, the apparent length of the micro-fractures is much smaller, and cannot be accurately measured. This is because the density of the micro-fractures observed in thin sections is so high that they connect and intersect with each other and, as a result, form fractures network (Figure 6), which makes it difficult to identify the original extension of one single fracture. Nevertheless, a small number of fractures found on the flank of the network show that the apparent length of the micro-fractures is less than 2.5 mm overall.
Density of fractures is an important parameter that characterizes the extent to which fractures develop. The density of effective fractures (defined as fractures that are unfilled or partially filled) usually controls by how much the permeability of tight reservoirs can be improved. Linear density and areal density are commonly used parameters that characterize the density of fractures. The former refers to the average number of fractures in unit length, and the latter refers to the average number of fractures in unit area. In this paper linear density was used for simplification. In our research, linear density of macro-fractures on core samples ranges from 0.19 piece/m to 1.79 piece/m. Considering the significant apparent lengths and low linear density of macro-fractures, in our observations these fractures do not intersect with each other, therefore have little connectivity. The micro-fractures, in comparison, display much different characteristics. The linear density of micro-fractures ranges from 0.82 piece/mm to 4.37 piece/mm. It is worth mentioning that due to sampling bias, the actual linear density of micro-fractures would be smaller than the measured value given above. This is because the best parts of the core samples were used to make cast thin sections. However, it is still concluded that micro-fractures intersect and connect with each other. Figure 6 shows the CT scanning images of micro-fractures in samples of Well DB202, 5872.6 m. It shows that micro-fractures frequently intersect with each other on a large scale, and form a fracture network which extends to every part of the sample. It is not difficult to understand that this micro-fracture network also connects the macro-fractures, and the entire fractures network plays an important role in improving the permeability of the reservoir.

4.3. Effects of Abnormal High Fluid Pressure on Fracture Characteristics

Abnormal high fluid pressure is a common characteristic in the Kuqa Depression, especially in the KTB. The pressure coefficient in the Bashijiqike Formation is normally larger than 2. It is intuitive that this high fluid pressure significantly controlled the fracture characteristics such as aperture width and length. However, this was rarely reported in previous research. Using specially designed device (relative parameters are described in Figure 4) and workflow, the characteristics of fractures under high fluid pressures were quantitatively measured, and the results are shown in Figure 7.
Fracture lengths and aperture widths are significantly influenced by abnormal high fluid pressures. As shown in Figure 7a, before the experiment the aperture width and apparent length of a fracture in the core sample are 0.21 mm and 24.74 mm respectively (indicating a macro-fracture, as described in Section 4.1). At 15 MPa (fluid pressure) and 25 °C in the experiment, the aperture width and apparent length reached 0.44 mm and 27.5 mm under high fluid pressure (Figure 7b), which saw an increase of 50% and 10% respectively.
Not only the fracture length and aperture width are influenced by high fluid pressure, but also the fracture densities. As shown in Figure 7c,d, at zero fluid pressure there was only one fracture in the view shed, while at 15 MPa other smaller fractures (with aperture of 800–1000 μm) appeared. This shows that high fluid pressure induced new fractures and increased the fracture density.

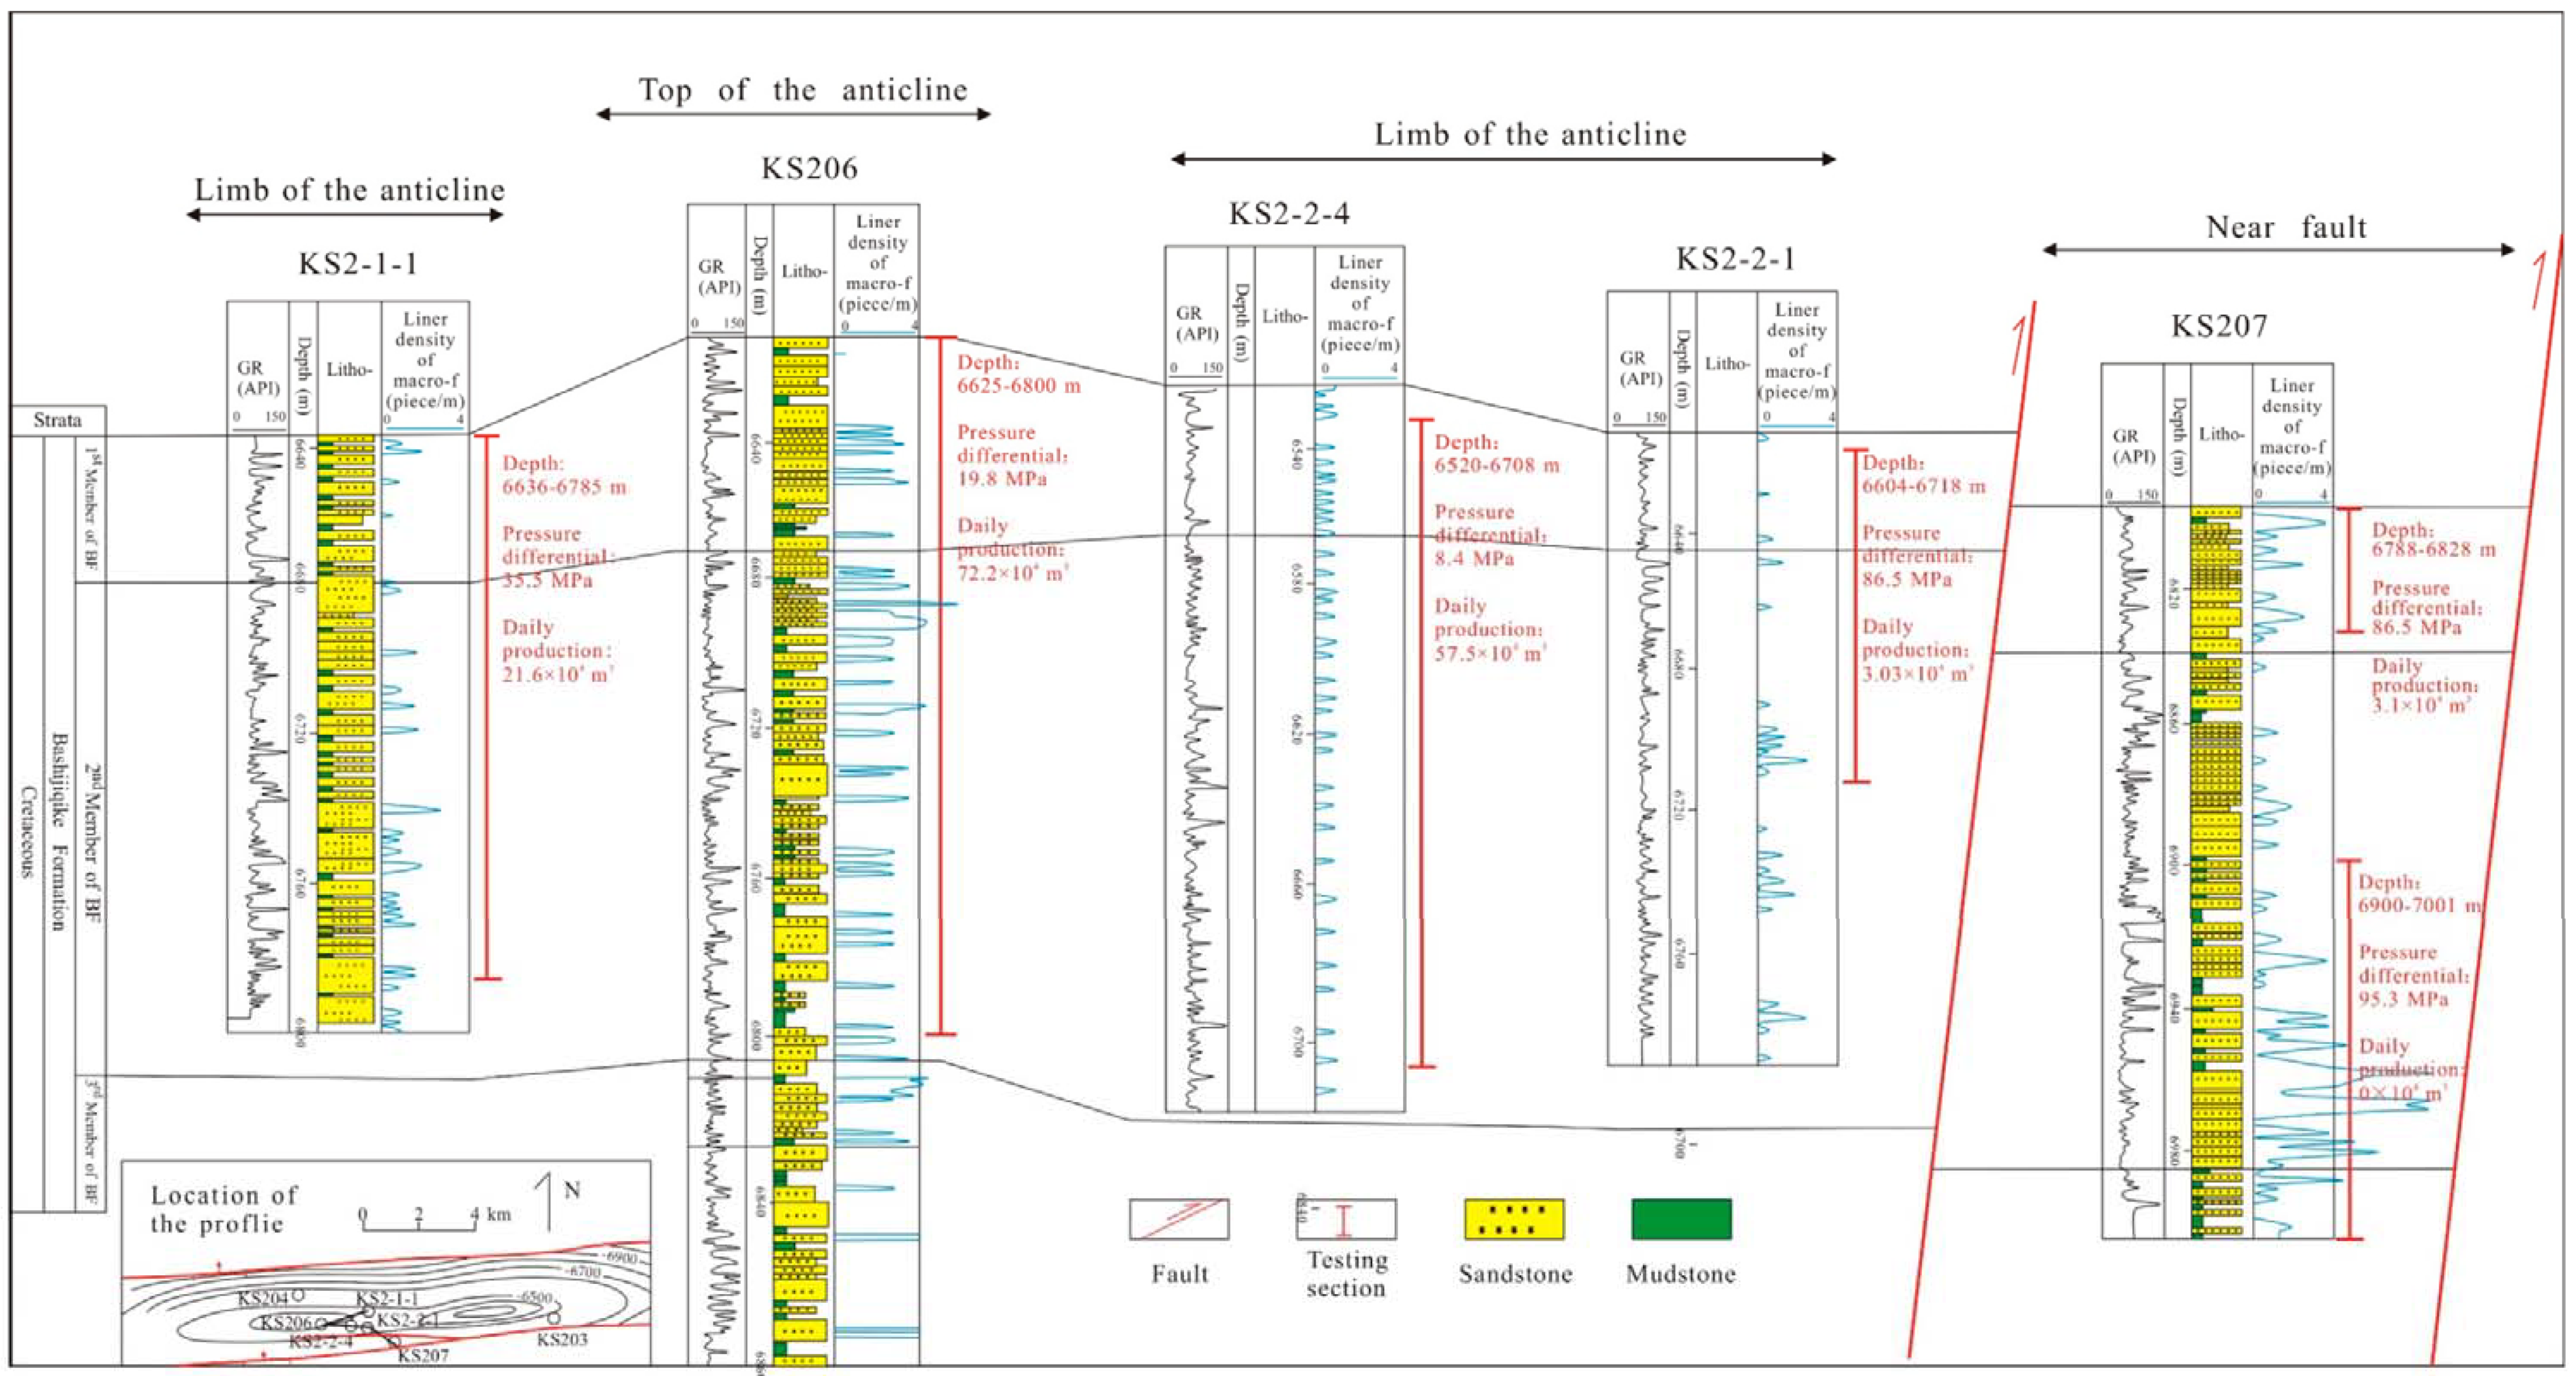
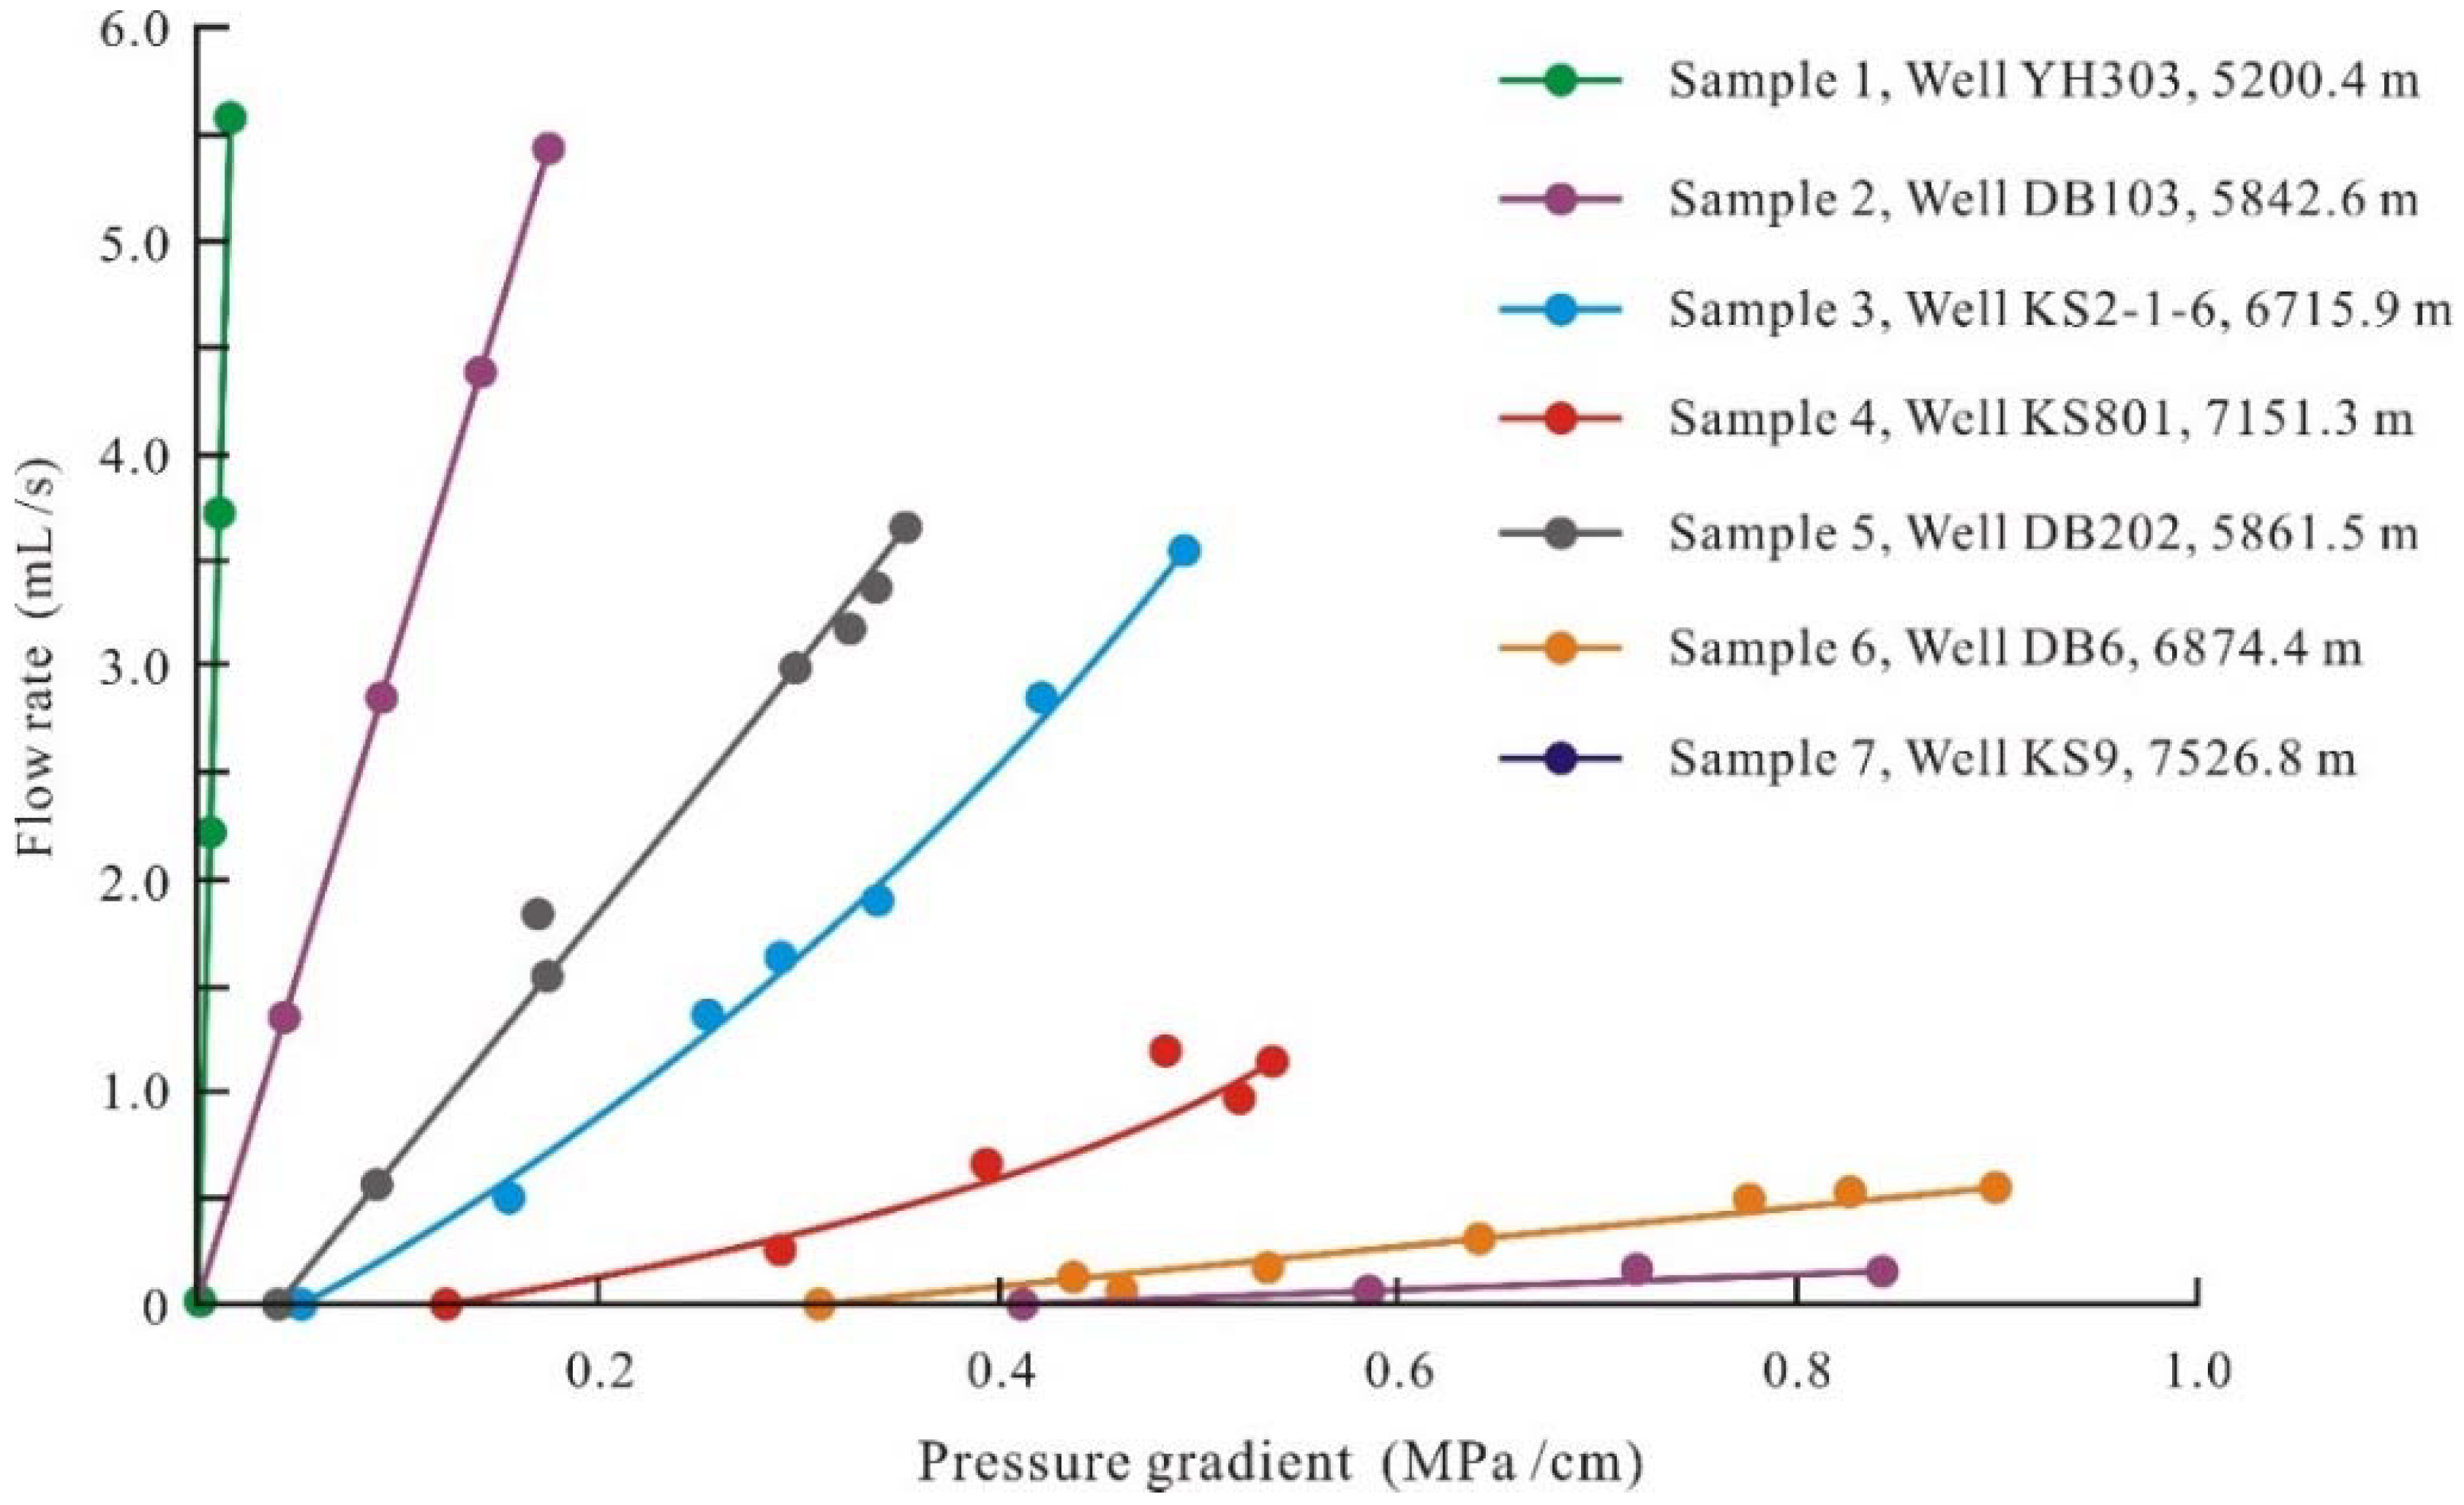
4.4. Seepage Performance in Tight Gas Reservoirs

Initial flowing pressure is a popular topic in fluid flow studies of tight reservoirs [50,51]. Different from conventional sandstone reservoirs, initial flowing pressure in tight reservoirs is a precondition to fluid flow in the gas charging and production processes: only when actual pressure gradient is greater than initial flowing pressure gradient, fluid (oil or gas) begins to flow. Initial flowing pressure gradient (MPa/cm) is the parameter used to calculate initial flowing pressure. The smaller the initial flowing pressure gradient, the easier the fluid tends to flow. Lv [50] reported that initial flowing pressure gradient is closely related to the permeability of the porous media, and if permeability is high enough, initial flowing pressure gradient would become zero. Table 3 and Figure 8 show the initial flowing pressure gradients of the reservoir samples from the Bashijiqike Formation. For comparison purpose, data (Sample 1) from Lu [46] is referred to.
The initial flowing pressure gradients of all the samples collected from the Bashijiqike Formation range from 0 to 0.41 MPa/cm. It is closely related to the overall permeability of the samples: in samples 1 and 2, permeability reached over 100 × 10−3 μm2 and initial flowing pressure gradient is nil, which means fluid flows at a very small actual pressure gradient; when the overall permeability decreases, initial flowing pressure gradient increases, which means fluid flow becomes harder. It is important to note that the seepage performance enhancement mentioned above mainly reflects the effects of micro-fractures, because the lengths of samples used for core charging experiment are only several centimeters, but the highest linear density of macro-fractures in the samples is 1.79 piece/m. However, this does not mean macro-fractures has no effect in reducing initial flowing pressure gradient. Despite of their relatively low density, macro-fractures display longer extension and larger aperture width, all these are favorable characteristics for enhancing seepage performance.
When the actual pressure gradient is greater than initial flowing pressure gradient, flow rate controls how fast gas charges into the reservoir, and indirectly influences gas content and production. Figure 8 shows the flow rate difference in some samples in the Bashijiqike Formation. The samples of various permeability display very different features. For samples 1 [46] and 2, flow rate reached over 6.0 mL/s under the pressure gradient of less than 0.2 MPa/cm; while for samples 6 and 7 of low permeabilities, flow rates were both less than 1.0 mL/s even under pressure gradient of 0.8 MPa/cm. It is concluded that permeability has a profound influence on the seepage characteristics of tight reservoirs.

5. Discussion

5.1. Controlling Factors of Fracture Density

Structural fractures in tight reservoirs are reported to be closely related to tectonic deformation [9,52]. Our data shows that linear density of both micro- and macro-fractures are generally negatively correlated with distance to faults (Figure 9, Table 2). In the Bashijiqike Formation, KTB, the linear density decreases quickly with increasing distances to faults, especially when the distance ranges from 0 to 0.5 km (Figure 9). This can be deemed as the “impact zone” for the influence of faults to fracture development and evolution. Beyond this zone, the influence of faults to fracture density becomes much smaller.
Data from DB202 well seems to deviate from the rule above. Compared with KS2-1-6 well (0.5 km to the nearest fault), DB202 is much farther from the nearest fault (1.8 km), however, the linear density of both macro- and micro-fractures is larger than that of KS2-1-6, especially the latter. This shows that fault is not the only factor that controls fracture development in the KTB. Other forms of tectonic deformation like folds are also reported as key factors that impact fracture development [53]. Our data provides proof for this conclusion: DB202 is located only 50 m to the top of an anticline (Figure 1d), while KS2-1-6 is located 1.5 km to that of another (Figure 1e). Folding process led to dense fracture formation [53], especially at the core of the synclines, or top of the anticlines. The nearer to the anticline top, the denser the fractures are.
Thus, it is concluded that in the Bashijiqike Formation of the KTB, faults and folds both have an impact on fracture density. However, because of limited data, a detailed evaluation of the correlation between fracture (macro- and micro-fractures) density and distance to folds is not discussed in this paper. Nevertheless, fracture density identified from well log data may support our conclusion. As shown in Figure 10, the fracture density of five wells were obtained and analyzed, and the fractures are comparable to, if not larger than, the macro-fractures mentioned above. The fracture density is at large determined by their location on the folds: the fracture density of KS206 well, which is located at the top of the anticline, ranges from 3.3 piece/m to 4 piece/m, and is much higher than that of KS2-1-1 well, KS2-1-4 well, and KS2-2-1 well (0 piece/m to 2.3 piece/m), which are located on the limbs of the anticline.
In addition to tectonic deformations such as faults and folds, abnormal high fluid pressure also has significant influence on fracture density. High fluid pressure breaks down the rock and, as a result, generates new fractures, as discussed in Section 4.3. However, drawing an easy correlation of abnormal high fluid pressure and high fracture density is questionable, because it lacks evidence on the timing of the fracture formation as well as the evolution of the high fluid pressure. More details are discussed in Section 5.3.

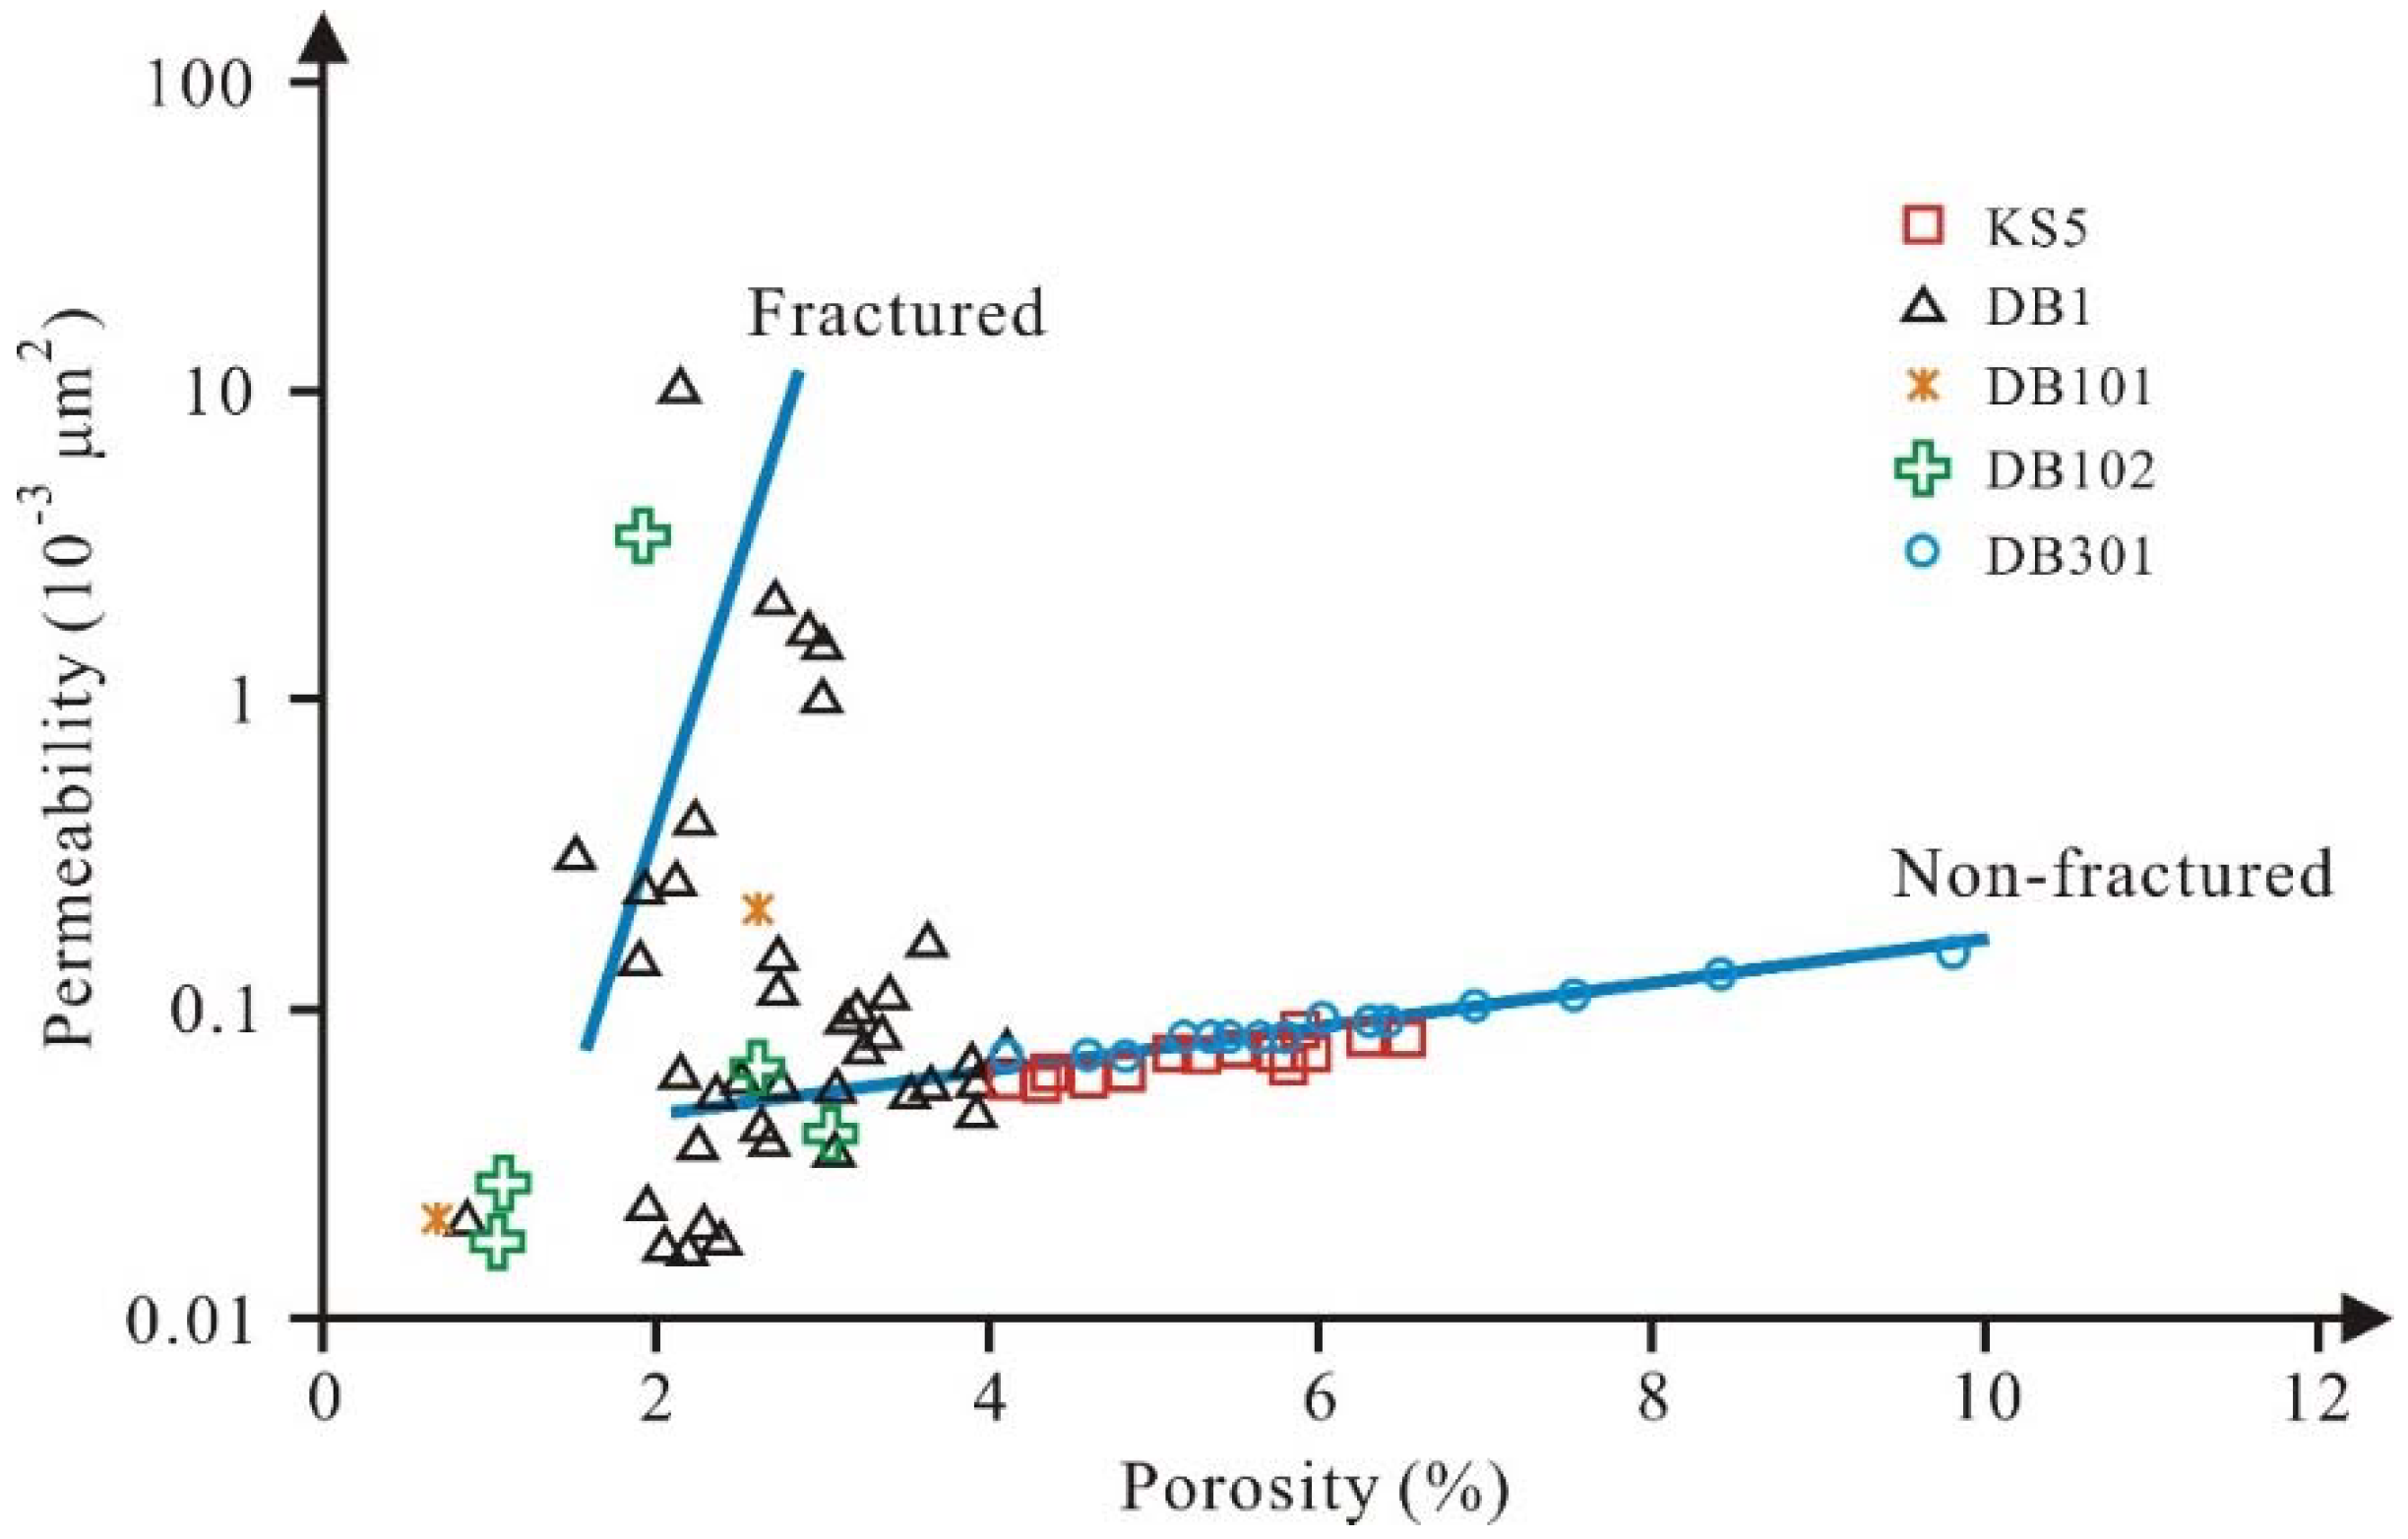
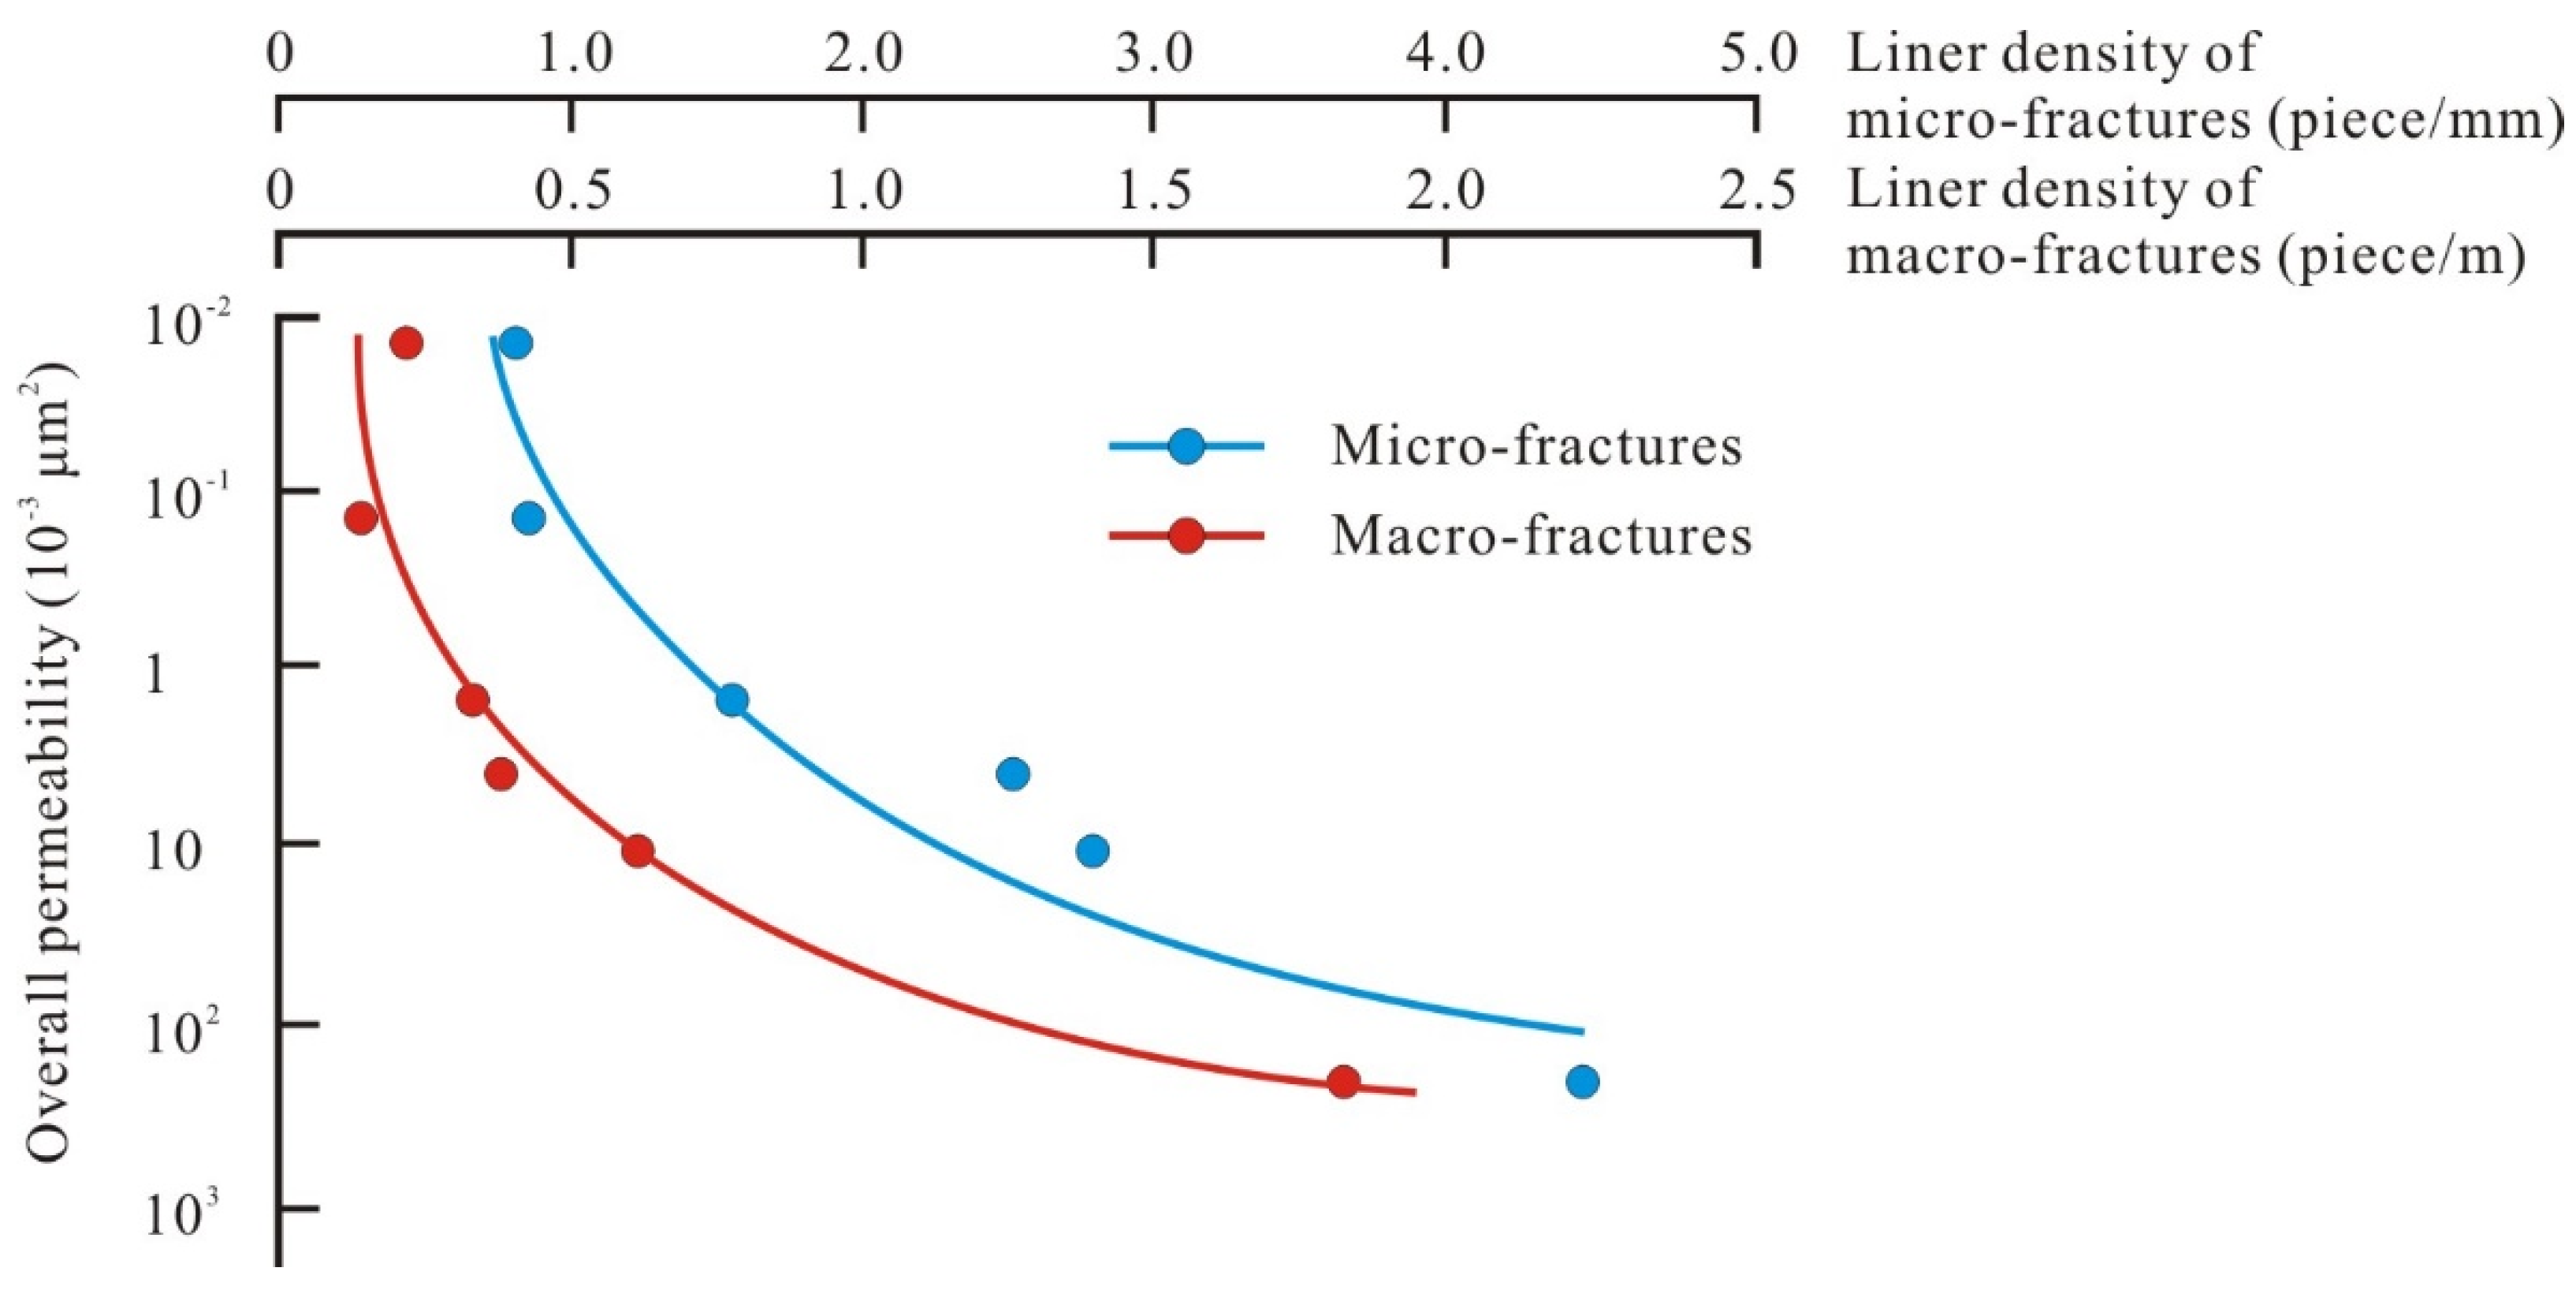
5.2. Contribution of Fractures to Permeability

Due to low permeability and porosity of tight reservoirs, the reservoir trapping process is very slow, which largely affects gas content and recoverable reserves. However, with the presence and development of fractures it is another story. In this paper, contribution of fractures to permeability is defined as [51]:
  η = 1 K m K  
Km represents matrix permeability (10−3 μm2), and K represents overall permeability of the samples (10−3 μm2). Table 3 shows that η ranges from 64.71% to 99.99% in the Bashijiqike Formation of the KTB. Moreover, the linear densities of macro- and micro-fractures are both correlated well with overall permeability (Table 2 and Table 3, Figure 11).
As the linear density of micro- or macro fractures increases, the overall permeability increases rapidly at first; but when the liner densities of micro- and macro fractures reach 2.5 piece/mm and 0.6 piece/m respectively the overall permeability increases relatively slow. These results mean that the extent of fracture development, characterized by linear density, largely determines the permeability of the reservoirs. Further, permeability, as shown by Figure 8 and Table 3, is a key factor that determines the seepage performance of the reservoirs. The higher the linear density, the better the seepage performance. In reservoir trapping and production processes, better seepage performance means more gas is charged into or discharged out of the reservoirs. Therefore, larger linear density is a key indication of more gas reserves or production. Data from Lu [51] and Hou [54] supported this conclusion. They found out that in the Jurassic fractured tight gas reservoirs in the eastern Kuqa Depression, daily gas production of well DX1 of fracture density of 0.5 piece/m reached 726,416 m3/day; while that of well DB102 of fracture density of 0.02 piece/m was merely 20,768 m3/day.

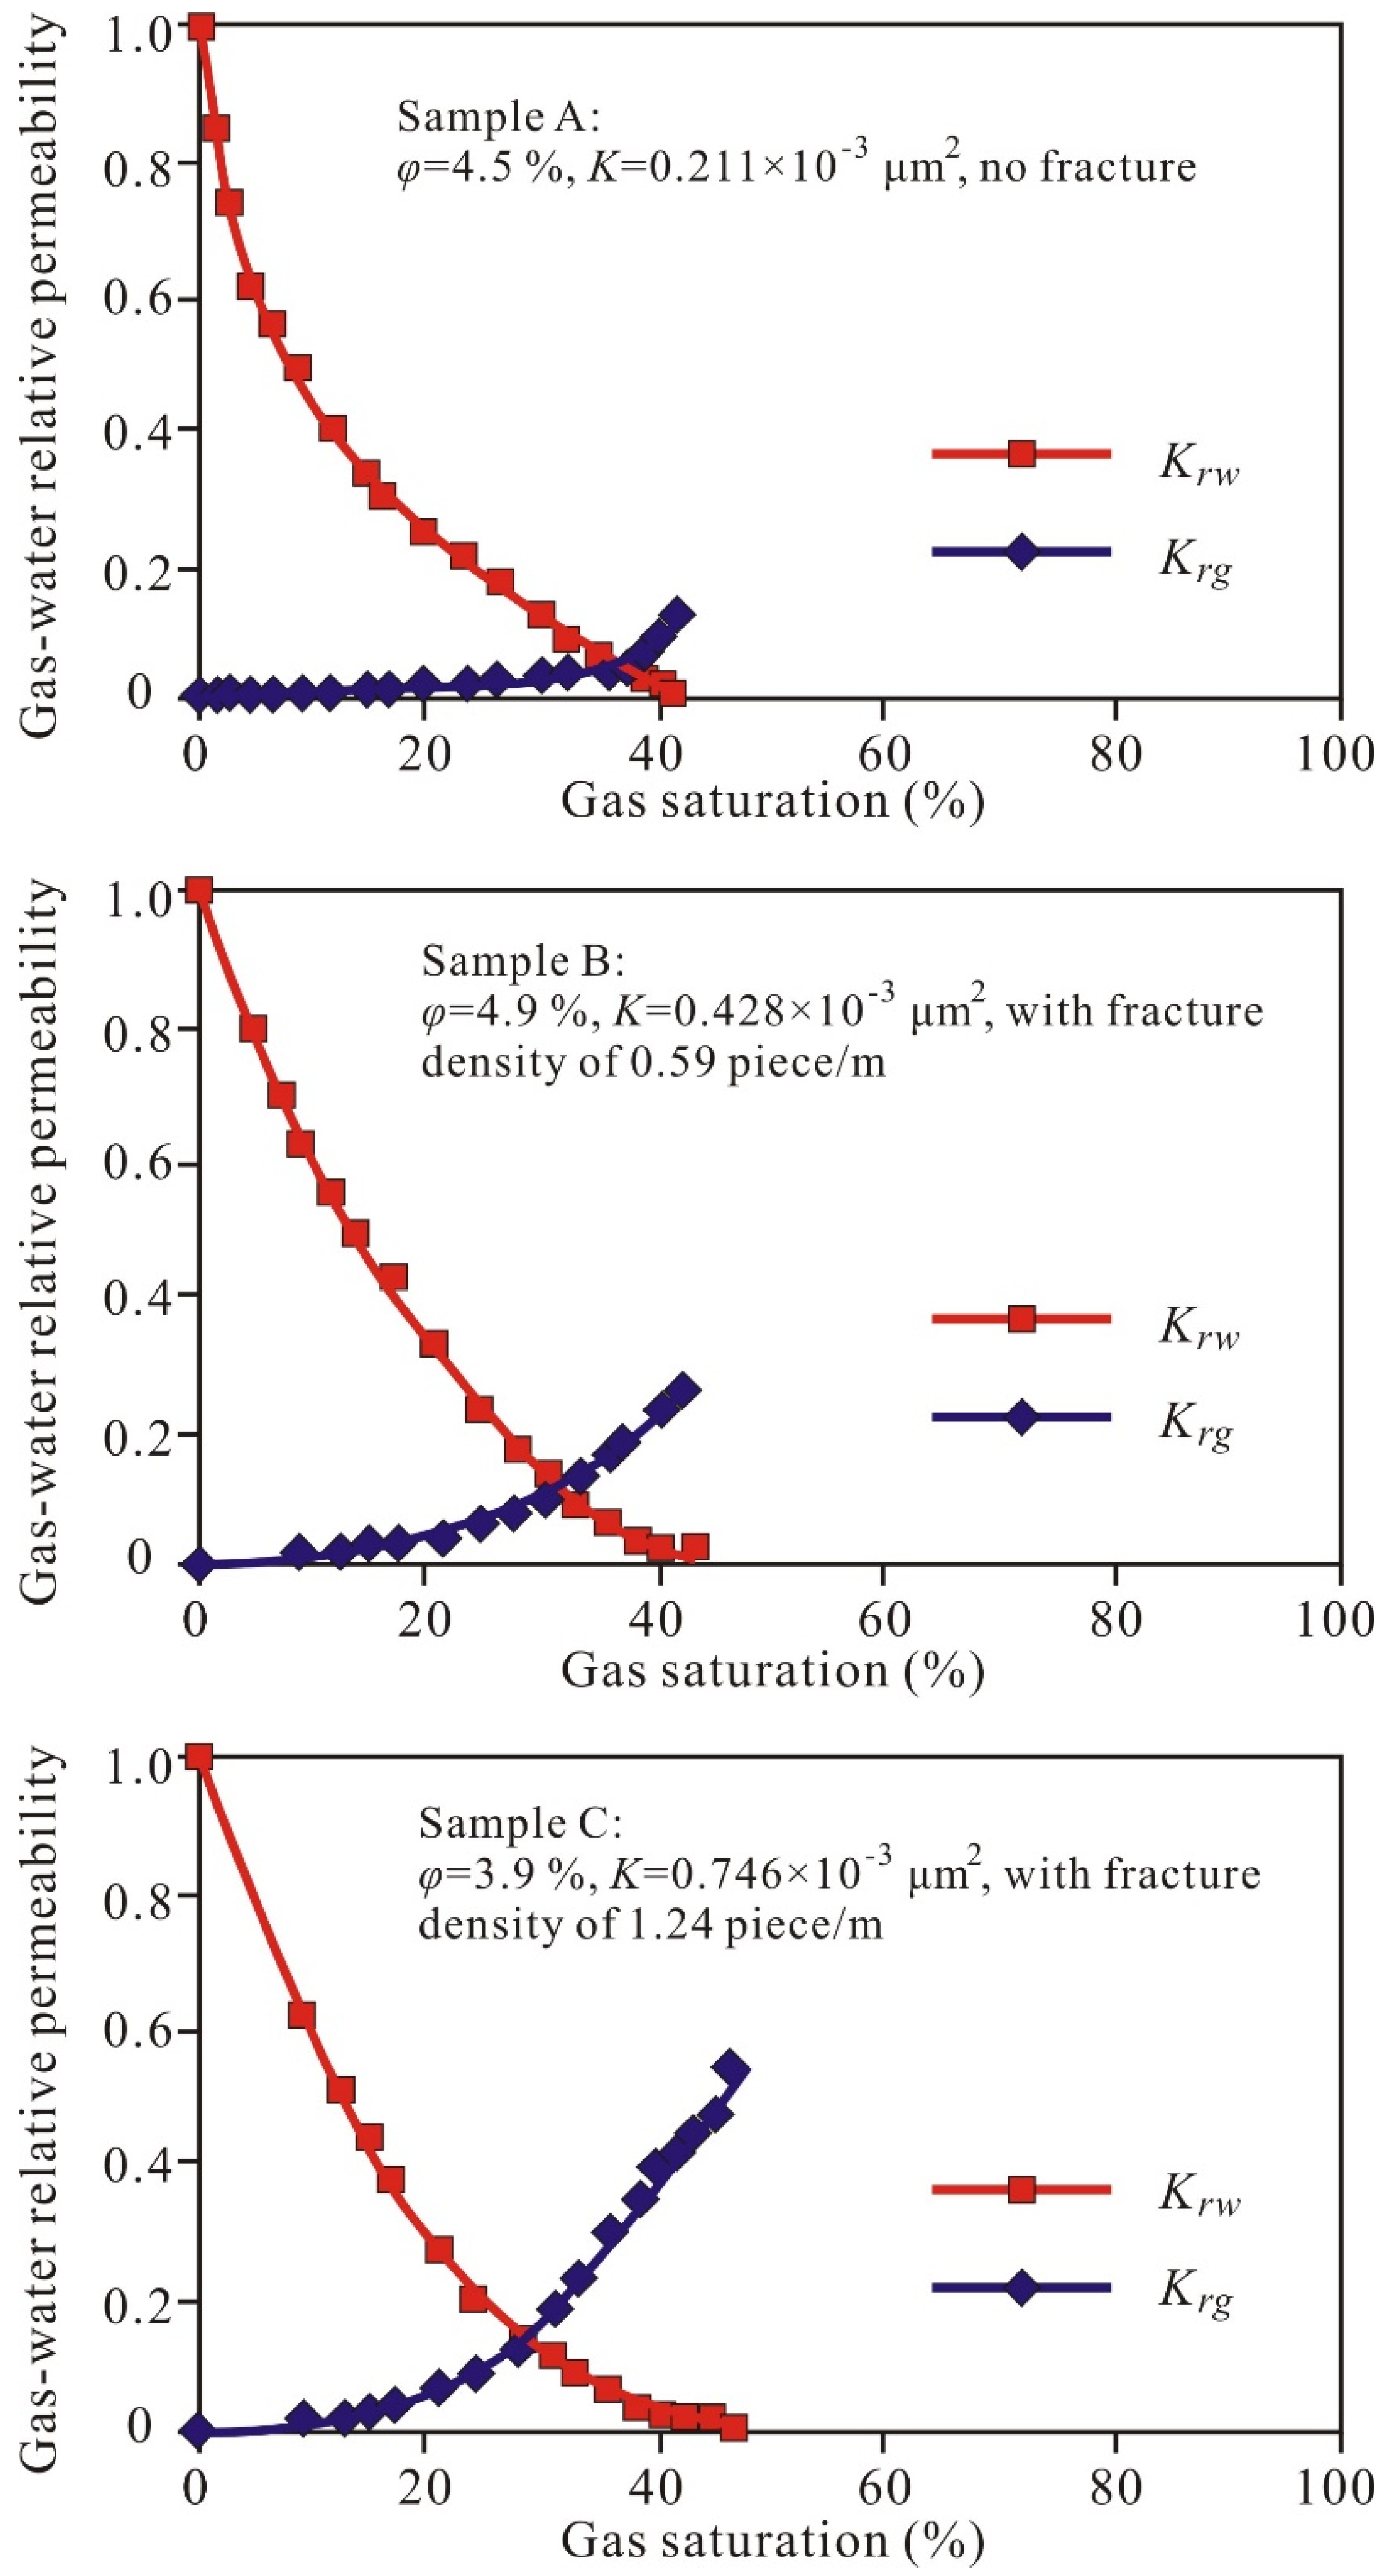
5.3. Impact of Fractures on Gas Seepage

Micro- and macro-fractures both work as pathways in the reservoir trapping process. However, their distinct linear density determines that they have different distribution patterns, and as a result contributed in different ways to the fracture networks. The linear density of macro-fractures is not high enough so they seldom connect or intersect with each other. With large apertures, macro-fractures could effectively enhance the permeability of the reservoirs. But this type of fractures alone has limited effect because they are rarely interconnected, which means macro-fractures have limited capability to migrate gas to most parts of the reservoirs. Micro-fractures, on the other hand, have relatively limited potential in enhancing the overall permeability of the reservoirs because of their limited scales and affected vicinity; however, their density is orders of magnitude time that of macro-fractures, and frequently intersect and connected with each other (Figure 6). In a nutshell, macro- and micro-fractures together form an effective fracture network that connects almost every part of the reservoir.
Gas migration and charging model is generalized in Figure 12. Major faults that connect source rocks and reservoirs are pathways for natural gas to migrate into the Bashijiqike Formation. The overlying plastic salt rocks prevent faults and fractures from developing further, and thus act as cap rocks. Giant fractures, macro- and micro-fractures are dense at the top of the anticline or near faults (Figure 12a). Giant fractures are large in fracture length and aperture width, through which gas can move into the complex fracture networks jointly formed by macro- and micro-fractures (Figure 12b); these fractures could act as both reservoir space and pathways. In this way, the natural gas migrates and charges into the fractured reservoirs. As fractures greatly improve the permeability of the reservoir, the migration and trapping process becomes more effective. At the limbs of the anticline and the areas distant from faults, the fracture systems are not developed. However, the nano-fractures, which were not generated by tectonic activity, are still dense at these location (Figure 12c), but their scale is small and yet they are less effective for gas charging. Without permeability enhancement induced by the macro- and micro-fractures, the gas migration and trapping process in tight reservoirs are ineffective, which points to small gas saturation and reserves.
Both reservoir trapping and production are seepage processes, either into or out of the reservoir. These two processes largely control the reserves and production of tight gas reservoirs. Table 2 and Table 3, Figure 8 and Figure 11 together show that fractures improve the seepage performance by enhancing permeability in tight reservoirs of the KTB: higher fracture density leads to higher permeability, and thus, smaller initial flowing pressure gradient and higher flow rate. However, a key factor still needs to be considered, that is, the timing of fracture formation. If fractures formed before or with reservoir trapping, fractures can significantly reduce the initial flowing pressure gradient (as shown in Table 3 and Figure 8) required to overcome resistance caused by capillary force (characterized by initial flowing pressure gradient), so that the charging process would be easy. In addition, once the charging process began, flow rate would be higher in the reservoir with higher fracture density, which brings more gas reserves to the reservoir. Reversely, if fractures formed after gas charging, the permeability and seepage performance enhancement induced by fractures would not improve the reserves, if not damage it. Several studies have discussed the timing of fracture development and gas charging. Fan [55] and Zeng [23] reported that in the KTB, the formation of structural fractures caused by tectonic compression happened simultaneously with gas charging. Based on this, it can be inferred that fractures played a key role in enhancing gas reserves in the Bashijiqike Formation of the KTB.
This conclusion provides more information about the correlation of reservoir trapping, fluid pressure, and fracture density. Hydrocarbon generation and overcharging is the widely accepted origin for abnormal high fluid pressure in the Bashijiqike Formation of the KTB [33,55]. As discussed above, tectonic compression and gas charging happened simultaneously. Therefore, it can be deduced that fractures induced by tectonic compression created pathways for natural gases; vice versa, the high fluid pressure caused by large amount of natural gas enhanced the density of the fractures, as shown in Figure 7.
The permeability only defines the flow performance of single-phase fluids, which is rare in real world [56,57,58]. The characteristics of multiphase fluid flow are more meaningful, in which the relative permeability of natural gas is a function of water saturation. Shanley [59] reported that contrary to the conventional reservoirs, there is a limited range of gas-water cut for flow to happen; and even permeability has dead zones in which neither gas nor water could flow. Lu [51] reported the relative permeability and maximum saturation of gas in reservoirs with or without fractures. It was concluded by Lu, as shown in Figure 13, that the presence of fractures (comparison between sample A and C) enhanced the relative permeability and maximum gas saturation.
More details of the sample and experiment can be found in the article published by Lu [51]. Based on this work, this paper made a step further by adding the parameter of fracture linear density to quantitatively study the influence of fractures to gas flow. Relevant data from Research Institute Petroleum Exploration and Development and PetroChina Tarim Oilfield Company was obtained, and it showed that sample C [51] had macro-fracture density of 1.24 piece/m. Moreover, the relative permeability curve of a sample with macro-fracture density of 0.59 piece/m (sample B) was added. The results show that fractures have little influence on the relative permeability of water, but greatly enhance the relative permeability of gas. Sample A of no fractures has very low relatively gas permeability (only 0.06 when gas saturation is 40%), even its porosity reaches 4.5%. The relative permeability of gas increases as fracture density increases, (example of Sample B); and when fracture density reaches 1.24 piece/m, the relative gas permeability is much higher (0.42 when gas saturation is 40%, 7 times that of sample A), although its porosity is less than that of sample A.

6. Conclusions

Classified by their densities and apertures, four types of natural fractures, including giant fractures, macro-fractures, micro-fractures, and nano-fractures, exist in the Bashijiqike Formation, KTB. Tectonic deformations and abnormal high fluid pressure greatly influence the linear density and aperture: near faults or anticlines (folds), the linear density increases, especially in the distance of less than 0.5 km; further, fluid pressure of 15 MPa in lab, much less than actual fluid pressure in KTB, still increases the fracture aperture by 50%, and induces new fractures. Fracture linear density is the key parameter that controls the fracture connectivity and effects on gas seepage performance. The linear density of macro-fractures ranges from 0.19 to 1.79 piece/m, and that of micro-fractures ranges from 0.82 to 4.37 piece/mm; the latter ones, with larger densities, frequently intersect with each other and, together with the former ones, form a fracture network, which increase the permeability of the reservoirs by 1–4 orders of magnitude, and the relative gas permeability by 2–10 magnitude. By enhancing the overall and relative permeability, the fracture networks reduce the initial flowing gradient from as high as 0.41 MPa/cm to 0 Mpa/cm, and increase the flow rate greatly. By enhancing permeability and gas seepage performance, the fracture network is the key factor that improves tight reservoir quality and reserve quantity.

Author Contributions

Investigation, methodology, and writing-original draft, Y.D.; project administration, X.L. and Q.Z.; Data curation, J.F.; writing-review & editing, X.L.

Funding

This research was funded by Chinese National Science and Technology Major Project (grant no. 2016ZX05003-002), and CNPC (grant no. 2016B-0502).

Acknowledgments

The Research Institute of Petroleum Exploration and Development, Petro China, and Tarim Oil Company are specially thanked, for providing samples, data, and experiment equipment for us.

Conflicts of Interest

The authors declare no conflict of interest.

References

  1. Shanley, K.W.; Cluff, R.M. The evolution of pore-scale fluid-saturation in low-permeability sandstone reservoirs. AAPG Bull. 2015, 99, 1957–1990. [Google Scholar] [CrossRef]
  2. Zou, C.N.; Zhu, R.K.; Wu, S.T. Types, characteristics, genesis and prospects of conventional and unconventional hydrocarbon accumulations: Taking tight oil and tight gas in China as an instance. Acta Pet. Sin. 2012, 33, 173–187. [Google Scholar]
  3. Elkins, L.E. The technology and economics of gas recovery from tight sands. In Proceedings of the SPE Production Technology Symposium, Hobbs, NM, USA, 30–31 October 1978. [Google Scholar] [CrossRef]
  4. Mocavoy, P.W. Natural gas policy act of 1978. Nat. Res. J. 1979, 19, 4–15. [Google Scholar]
  5. Spencer, C.W. Geologic aspects of tight gas reservoirs in the rocky mountain region. J. Pet. Technol. 1983, 37, 1308–1314. [Google Scholar] [CrossRef]
  6. Li, J.Z.; Zheng, M.; Zhang, G.S. Potential and prospect of conventional and unconventional natural gas resource in China. Acta Pet. Sin. 2012, 33, 89–98. [Google Scholar]
  7. Holditch, S.A. Tight Gas Sands. J. Pet. Technol. 2006, 58, 86–93. [Google Scholar] [CrossRef]
  8. Energy Information Administration. Annual Energy Outlook 2012: With Projections to 2035; Energy Information Administration: Washington, DC, USA, 2012.
  9. Olson, J.E.; Laubach, S.E.; Lander, R.H. Natural fracture characterization in tight gas sandstones: Integrating mechanics and diagenesis. AAPG Bull. 2009, 93, 1535–1549. [Google Scholar] [CrossRef]
  10. Lyu, W.L.; Zeng, L.B.; Zhang, B.J. Influence of natural fractures on gas accumulation in the Upper Triassic tight gas sandstones in the northwestern Sichuan Basin, China. Mar. Pet. Geol. 2017, 83, 60–72. [Google Scholar] [CrossRef]
  11. Gonzalez, L.; Aguilera, R. Effect of Natural Fracture Density on Production Variability of Individual Wells in the Tight Gas Nikanassin Formation. J. Can. Pet. Technol. 2013, 52, 187–195. [Google Scholar] [CrossRef]
  12. Du, J.H.; Wang, Z.M.; Hu, S.Y. Formation and geological characteristics of deep giant gas provinces in the Kuqa foreland thrust belt, Tarim basin, NW China. Pet. Explor. Dev. 2012, 39, 385–393. [Google Scholar] [CrossRef]
  13. He, M.; Li, N.; Xiao, Y. Recovery and treatment of fracturing flowback fluids in the Sulige Gasfield, Ordos Basin. Nat. Gas Ind. B 2015, 2, 467–472. [Google Scholar] [CrossRef]
  14. Xu, M.A.; Hao, R.F.; Lai, X.A. Field test of volume fracturing for horizontal wells in Sulige tight sandstone gas reservoirs, NW China. Pet. Explor. Dev. 2014, 41, 810–816. [Google Scholar]
  15. Yue, D.; Wu, S.; Xu, Z. Reservoir quality, natural fractures, and gas productivity of upper Triassic Xujiahe tight gas sandstones in western Sichuan Basin, China. Mar. Pet. Geol. 2018, 89, 370–386. [Google Scholar] [CrossRef]
  16. Behmanesh, H.; Hamdi, H.; Clarkson, C.R. Reservoir and fluid characterization of a tight gas condensate well in the Montney Formation using recombination of separator samples and black oil history matching. J. Nat. Gas Sci. Eng. 2018, 49, 227–240. [Google Scholar] [CrossRef]
  17. Lu, H.F.; David, G.H.; Jia, D. Rejuvenation of the Kuqa Foreland Basin, Northern Flank of the Tarim Basin, Northwest China. Int. Geol. Rev. 1994, 36, 1151–1158. [Google Scholar]
  18. Zhang, P. Late Cenozoic tectonic deformation in the Tianshan Mountain and its foreland basins. Chin. Sci. Bull. 2004, 49, 311–321. [Google Scholar] [CrossRef]
  19. Chen, S.; Tang, L.; Jin, Z. Thrust and fold tectonics and the role of evaporites in deformation in the Western Kuqa Foreland of Tarim Basin, Northwest China. Mar. Pet. Geol. 2004, 21, 1027–1042. [Google Scholar] [CrossRef]
  20. Yu, S.; Chen, W.; Lü, X. (U-Th)/He thermochronometry constraints on the Mesozoic-Cenozoic tectono-thermal evolution of Kuqa basin: A case study of well TZ2. Chin. J. Geophys. 2014, 57, 62–74. [Google Scholar]
  21. Chen, J.; Lu, H.; Wang, S. Geometric tests and their application to fault-related folds in Kuqa. Asian J. Earth Sci. 2005, 25, 473–480. [Google Scholar] [CrossRef]
  22. Guo, X.W.; Liu, K.Y.; Jia, C.Z. Effects of tectonic compression on petroleum accumulation in the Kelasu Thrust Belt of the Kuqa Sub-Basin, Tarim Basin, NW China. Org. Geochem. 2016, 101, 22–37. [Google Scholar] [CrossRef]
  23. Zeng, L.B.; Wang, H.J.; Gong, L. Impacts of the tectonic stress field on natural gas migration and accumulation: A case study of the Kuqa Depression in the Tarim Basin, China. Mar. Pet. Geol. 2010, 27, 1616–1627. [Google Scholar] [CrossRef]
  24. Shen, Y.Q.; Lv, X.X.; Guo, S. Effective evaluation of gas migration in deep and ultra-deep tight sandstone reservoirs of Keshen structural belt, Kuqa depression. J. Nat. Gas Sci. Eng. 2017, 46, 119–131. [Google Scholar] [CrossRef]
  25. Chun, L.; Qingxin, G.; Ronghu, Z. Characteristics and origin of microfracture in lower Cretaceous tight sandstone from Kuqa foreland basin, NW China. In Proceedings of the International Petroleum Technology Conference, Beijing, China, 26–28 March 2013. [Google Scholar] [CrossRef]
  26. Yang, M.; Jin, Z.; Lu, X. Structural evolution of the Eastern Qiulitagh fold and thrust belt, northern Tarim Basin, China. Acta Geol. Sin. 2009, 83, 347–358. [Google Scholar] [CrossRef]
  27. Ming, X.M.; Bing, S.Y.; Wei, G.J. Sequence Stratigraphy of the desert system: A case study of the Lower Cretaceous in the Kuqa Basin in Xinjiang, northwestern China. Acta Geol. Sin. 2004, 78, 744–755. [Google Scholar] [CrossRef]
  28. Li, S.; Wang, X.; Suppe, J. Compressional salt tectonics and synkinematic strata of the western Kuqa foreland basin, southern Tian Shan, China. Basin Res. 2012, 24, 475–497. [Google Scholar] [CrossRef]
  29. Wu, C.D.; Lin, C.S.; Shen, Y.P. Composition of sandstone and heavy minerals implies the provenance of Kuqa Depression in Jurassic, Tarim basin, China. Prog. Nat. Sci. 2005, 15, 633–640. [Google Scholar]
  30. Lin, C.; Liu, J.; Zhang, Y. Depositional architecture of the Tertiary tectonic sequences and their response to foreland tectonism in the Kuqa depression, the Tarim Basin. Sci. China Ser. D Earth Sci. 2002, 45, 250–258. [Google Scholar] [CrossRef]
  31. Tang, X.; Yang, S.; Hu, S. Thermal and maturation history of Jurassic source rocks in the Kuqa foreland depression of Tarim Basin, NW China. Asian J. Earth Sci. 2014, 89, 1–9. [Google Scholar] [CrossRef]
  32. Liang, D.; Zhang, S.; Chen, J. Organic geochemistry of oil and gas in the Kuqa depression, Tarim Basin, NW China. Org. Geochem. 2003, 34, 873–888. [Google Scholar] [CrossRef]
  33. Lu, X.S.; Liu, K.Y.; Zhuo, Q.G. Palaeo-fluid evidence of the multi-stage hydrocarbon charges in Kela-2 gas field, Kuqa foreland basin, Tarim Basin. Pet. Explor. Dev. 2012, 39, 574–582. [Google Scholar] [CrossRef]
  34. Zhang, S.; Zhang, B.; Zhu, G. Geochemical evidence for coal-derived hydrocarbons and their charge history in the Dabei Gas Field, Kuqa Thrust Belt, Tarim Basin, NW China. Mar. Pet. Geol. 2011, 28, 1364–1375. [Google Scholar] [CrossRef]
  35. Tao, N.; Wang, G.; Xiao, C. Determination of in-situ stress orientation and subsurface fracture analysis from image-core integration: An example from ultra-deep tight sandstone (BSJQK Formation) in the Kelasu Belt, Tarim Basin. J. Pet. Sci. Eng. 2016, 147, 495–503. [Google Scholar]
  36. Sun, S.; Hou, G.; Zheng, C. Fracture zones constrained by neutral surfaces in a fault-related fold: Insights from the Kelasu tectonic zone, Kuqa Depression. J. Struct. Geol. 2017, 104, 112–124. [Google Scholar] [CrossRef]
  37. Allen, M.B.; Vincent, S.J.; Jia, D. Structural Features of Northern Tarim Basin: Implications for Regional Tectonics and Petroleum Traps: Discussion & Reply. AAPG Bull. 1999, 83, 1279–1283. [Google Scholar]
  38. Li, Z.; Song, W.; Peng, S. Mesozoic–Cenozoic tectonic relationships between the Kuqasubbasin and Tian Shan, northwest China: Constraints from depositional records. Sediment. Geol. 2004, 172, 223–249. [Google Scholar] [CrossRef]
  39. Graham, S.A.; Hendrix, M.S.; Wang, L.B. Collisional successor basins of western China: Impact of tectonic inheritance on sand composition. Geol. Soc. Am. Bull. 1993, 105, 323–344. [Google Scholar] [CrossRef]
  40. Dumitru, T.A.; Zhou, D.; Chang, E.Z. Uplift, exhumation, and deformation in the Chinese Tian Shan. Mem. Geol. Soc. Am. 2001, 71–100. [Google Scholar] [CrossRef]
  41. Lu, H.; Jia, D.; Chen, C. Evidence for growth fault-bend folds in the Tarim basin and its implications for fault-slip rates in the Mesozoic and Cenozoic. Proc. Int. Geol. Congr. 1997, 14, 253–262. [Google Scholar]
  42. Zeng, L.B.; Tan, C.X.; Zhang, M.L. Tectonic stress field and its effect on hydrocarbon migration and accumulation in Mesozoic and Cenozoic in Kuqa depression, Tarim basin. Sci. China Ser. D Earth Sci. 2004, 47, 114–124. [Google Scholar] [CrossRef]
  43. Zhuo, Q.G.; Meng, F.W.; Zhao, M.J. The salt chimney effect: Delay of thermal evolution of deep hydrocarbon source rocks due to high thermal conductivity of evaporites. Geofluids 2016, 16, 440–451. [Google Scholar] [CrossRef]
  44. Wang, W.; Yin, H.; Jia, D. A sub-salt structural model of the Kelasu structure in the Kuqa foreland basin, northwest China. Mar. Pet. Geol. 2017, 88, 115–126. [Google Scholar] [CrossRef]
  45. Tong, X.G.; Guo, B.C.; Li, J.Z. Comparison study on accumulation and distribution of tight sandstone gas between China and the United States and its significance. Eng. Sci. 2012, 6, 001. [Google Scholar]
  46. Lu, H.; Lu, X.S.; Fan, J.J. Controlling effect of fractures on gas accumulation and production within the tight sandstone: A case study on the Jurassic Dibei gas reservoir in the eastern part of the Kuqa foreland basin, China. J. Nat. Gas Geosci. 2016, 1, 61–71. [Google Scholar] [CrossRef]
  47. Reda, S.Z. Fracture density estimation from core and conventional well logs data using artificial neural networks: The Cambro-Ordovician reservoir of Mesdar oil field, Algeria. J. Afr. Earth Sci. 2013, 83, 55–73. [Google Scholar]
  48. Zeng, L.B.; Qi, J.F.; Wang, Y.X. Origin type of tectonic fractures and geological conditions in low-permeability reservoirs. Acta Pet. Sin. 2007, 28, 52. [Google Scholar]
  49. Neuman, S.P. Multiscale relationships between fracture length, aperture, density and permeability. Geophys. Res. Lett. 2015, 35, 1092–1104. [Google Scholar] [CrossRef]
  50. Lv, C.; Wang, J.; Sun, Z. An experimental study on initial flowing pressure gradient of fluids flow in low permeability sandstone porous media. Pet. Explor. Dev. 2002, 29, 86–89. [Google Scholar]
  51. Zhao, G.Z. Numerical simulation of 3D and three-phase flow with variable start-up pressure gradient. Acta Pet. Sin. 2006, 27, 119–128. [Google Scholar]
  52. Rijken, P.; Holder, J.; Olson, J.E. Predicting fracture attributes in the Travis Peak Formation using quantitative mechanical modeling and structural diagenesis. GCAGS Trans. 2002, 52, 837–847. [Google Scholar]
  53. Smart, K.J.; Ferrill, D.A.; Morris, A.P. Impact of interlayer slip on fracture prediction from geomechanical models of fault-related folds. AAPG Bull. 2009, 93, 1447–1458. [Google Scholar] [CrossRef]
  54. Hou, G.T. The Formation Mechanism and Prediction of the Jurassic Structural Fractures in the Eastern Kuqa Depression. Ph.D. Thesis, Peking University, Beijing, China, 2012. [Google Scholar]
  55. Fan, J.J.; Zhou, H.M.; Liu, S.B. Pore structure and gas migration characterization of tight sandstone in Kuqa depression of Tarim basin. J. Grad. Univ. Chin. Acad. Sci. 2014, 31, 108–116. [Google Scholar]
  56. Wang, X.X.; Hou, J.G.; Song, S.H.; Wang, D.X.; Gong, L.; Ma, K.; Liu, Y.M.; Li, Y.; Yan, L. Combining pressure-controlled porosimetry and rate-controlled porosimetry to investigate the fractal characteristics of full-range pores in tight oil reservoirs. J. Pet. Sci. Eng. 2018, 171, 353–361. [Google Scholar] [CrossRef]
  57. Liu, Y.M.; Ma, K.; Hou, J.G.; Yan, L.; Chen, F. Diagenetic controls on the quality of the Middle Permian Lucaogou Formation tight reservoir, Southeastern Junggar Basin, Northwestern China. Asian J. Earth Sci. 2018. accepted. [Google Scholar] [CrossRef]
  58. Liu, Y.M.; Zhang, B.; Dong, Y.; Qu, Z.P.; Hou, J.G. The determination of variogram in the presence of horizontal wells—An application to a conglomerate reservoir modeling, East China. J. Pet. Sci. Eng. 2018. accepted. [Google Scholar] [CrossRef]
  59. Shanley, K.W.; Cluff, R.M.; Robinson, J.W. Factors controlling prolific gas production from low permeability sandstone reservoirs: Implication for resource assessment, prospect development and risk analysis. AAPG Bull. 2004, 88, 1083–1121. [Google Scholar] [CrossRef]
Figure 1. Tectonic location and structures of the Kelasu Thrust Belt, KTB for abbreviation, in Tarim Basin, China. (a) Location of the Tarim Basin in China; (b) Structural division of the Tarim Basin, in which 1 refers to the Kuqa Depression, 2 refers to the Tabei Uplift, 3 refers to the North Depression, 4 refers to the Central Uplift, 5 refers to the Southwest Depression, and 6 refers to the South East Depression; (c) Structural subdivision of the Kuqa Depression, in which 7 refers to the North Monocline Zone, 8 refers to the Kelasu Tectonic Belt, 9 refers to the Baicheng Sag, 10 refers to the Qiulitage Tectonic Belt, 11 refers to the Yangxia Sag, and 12 refers to the South Slope Belt; (d) Schematic view of Dabei Well Block; (e) Schematic view of Keshen Well Block.
Energies 11 02808 g001
Figure 2. Mesozoic-Cenozoic stratigraphy, tectonic events, structural evolution history, and distribution of source, reservoir, and cap rocks of KTB (modified from Wang [44] and Guo [22]).
Energies 11 02808 g002
Figure 3. Porosity-permeability crossplot of sandstone reservoirs in the Bashijiqike Formation, KTB, in which fractured and non-fractured reservoirs show different characteristics.
Energies 11 02808 g003
Figure 4. ZEISS Xradia 510 Versa X-ray microscope and high pressure and high temperature (HPHT) carbon fiber core holder for pressure experiment. (a) X-ray receiver, ZEISS; (b) HPHT carbon fiber core holder, core diameter: 25.4 mm, core length: 5–6 cm, fluid pressure: <30 MPa, confining pressure: <70 MPa, working temperature: <150 °C, the pressure and temperature is controlled by the self-developed fluid charging system; (c) Rotary table for 3D scanning; (d) X-ray source, ZEISS, with working power of 70 eV.
Energies 11 02808 g004
Figure 5. Fractures with various scales. (a,b) Giant fractures on outcrops; (c) Macro-fractures, well KS8, 6719 m; (d) Macro-fracture, well KS205, 7086 m; (e) FMI of Well KS2-2-12, 6566–6567 m; (f) Micro-fractures, well KS8, 6735.39 m; (g) Micro-fracture that cut grains, well DB103, 5927.64 m; (h) Nano-fractures, well KS207, 6932.57 m.
Energies 11 02808 g005
Figure 6. 3D CT images of micro-fracture networks. The sample are from core sample of Well DB202, 5872.6 m. The micro-fractures intersect with each other and form a complex network.
Energies 11 02808 g006
Figure 7. Change of fracture characteristics under high inner fluid pressure, core samples are from Well KS205, 7204.9 m. (a,c) CT images of one fracture under no fluid pressure under confining pressure of 15 MPa; (b,d) CT images of the same fracture under fluid pressure of 5 MPa and confining pressure of 15 MPa.
Energies 11 02808 g007
Figure 8. Relationship between flow rate and pressure gradient of different samples in the Bashijiqike Formation, KTB. More details of the samples are shown in Table 3. As permeability increases, the initial flowing pressure decreases, and the flow rate increases under certain pressure gradient.
Energies 11 02808 g008
Figure 9. Relationship of liner density and distance to faults for micro- and macro-fractures in the Bashijiqike Formation, KTB.
Energies 11 02808 g009
Figure 10. Fracture density identified in single wells and its relationship with anticline.
Energies 11 02808 g010
Figure 11. Relationship of linear density and overall permeability for micro- and macro-fractures in the Bashijiqike Formation, KTB.
Energies 11 02808 g011
Figure 12. Pathways and processes of reservoir trapping, and reservoir rooms of natural gas from macroscopic view to microscopic view in the Bashijiqike Formation, KTB. (a) In a macroscopic view, hydrocarbon gas migrates upwards from the lower strata through faults, and flow into the reservoir through the fracture network formed by giant, macro- and micro-fractures, and at the top of the anticlines and near fault, where fractures are dense, the gas accumulates; (b) At the location where fractures are dense, micro-fractures and nano-fractures form a fracture-network, which enlarge the reservoir space and connect most part of the rock, and thus enhance the gas saturation; (c) At the location where fractures are sparse or absent, only some nano-fractures develop, and hydrocarbon gas cannot effectively flow into these fractures because of their small scale and little permeability.
Energies 11 02808 g012
Figure 13. Gas-water relative permeability curve in samples with different macro-fracture linear density. In the legend Krw represents relative permeability of water, and Krg represents relative permeability of gas.
Energies 11 02808 g013
Table 1. Parameter statistics of tight sandstone gas reservoirs worldwide.
BasinDenver [45]San Juan [45]Appalachia [45]ErdosSichuanKuqa
Gas fieldWattenbergBlanco MesaverdeAppalachianSuligeGuanganKelasu
FormationMuddyMesaverdeClinton-MedinaShiheziXujiaheBashijiqike
Depth (m)2070–28301677–19001220–18292850–36002300–26506000–8000
Porosity (%)8–128–105–106–122–122.2–10
Permeability (10−3 μm2)0.05–0.0050.5–2<0.10.880.380.57
Pressure coefficientAbnormal low pressureAbnormal low pressureAbnormal low pressure0.83–0.891.2–1.51.65–2.27
Gas saturation (%)56664945–6035–6560–85
Gas yield (104 m3/day)2.0–5.20.57–0.962–50.5–422–117
Table 2. Fracture characteristics of the Bashijiqike Formation, Kelasu Thrust Belt, KTB for abbreviation, Kuqa Depression 1.
WellDepth (m)Fracture CharacteristicsDistance to Fault (km)
OriginScaleInclination Angle (°)Apparent LengthApertureLinear Density 2
DB1035677–5953Structural fractureMacro-67–800.16–0.86 m0.2–1.12 mm1.79 piece/m0.1
Micro-22–810.25–2.50 mm12–50 μm4.37 piece/mm
KS2-1-66591–6822Macro-55–850.26–3.00 m0.10–0.35 mm0.39 piece/m0.5
Micro-12–800.42–1.54 mm9–38 μm2.51 piece/mm
KS8017048–7291Macro-65–830.30–0.57 m0.17–0.48 mm0.34 piece/m1.0
Micro-25–860.05–1.09 mm6–15 μm1.62 piece/mm
DB2025711–5956Macro-64–850.54–3.54 m0.12–1.51 mm0.6 piece/m1.8
Micro-62–890.31–2.12 mm10–29 μm2.98 piece/mm
DB66857–6925Macro-44–720.05–0.22 m0.29–1.20 mm0.19 piece/m2.0
Micro-20–820.02–1.43 mm7–19 μm0.85 piece/mm
KS97438–7580Macro-64–810.03–0.20 m0.23–0.55 mm0.24 piece/m2.5
Micro-12–850.06–0.73 mm3–10 μm0.82 piece/mm
1 Typical wells are chosen to be shown in table instead of all the data, for space consideration. 2 The linear density of macro-fractures was calculated using 100 m cores per well, and the micro-fracture linear density is calculated using 100 view sheds per well; specific method is shown in Section 3.2.1.
Table 3. Sandstone properties in the Bashijiqike Formation, KTB 1.
No.WellDepth (m)LithologyPorosity (%) 2Matrix Permeability (10−3 μm2) 3Overall Permeability (10−3 μm2) 4Permeability Contribution from FracturesInitial Flowing Pressure Gradient (MPa/cm)
1 2YH3035200.4Sandstone21.4/521.410.00%0
2DB1035842.6Tight sandstone6.50.08178.6699.99%0
3KS2-1-66715.9Tight sandstone5.80.057.2399.98%0.06
4KS8017151.3Tight sandstone7.60.022.6199.98%0.13
5DB2025861.5Tight sandstone1.80.0615.9899.98%0.05
6DB66874.4Tight sandstone3.10.060.1764.71%0.32
7KS97526.8Tight sandstone1.20.010.0475.00%0.41
1 Typical wells are chosen to be shown in table instead of all the data, for space consideration. 2 data from Lu [46]. 3 the permeability of the tight sandstone matrix without fractures, data measured from core plugs. 4 the permeability of the tight sandstone samples with fractures, data computed from downhole gas production testing data provided by Tarim Oilfield.

