Article

A Multi-Objective Energy and Environmental Systems Planning Model: Management of Uncertainties and Risks for Shanxi Province, China

1
School of Control and Computer Engineering, North China Electric Power University, Beijing 102206, China
2
Institute for Energy, Environment and Sustainability Research, UR-NCEPU, North China Electric Power University, Beijing 102206, China
3
Institute for Energy, Environment and Sustainable Communities, UR-BNU, 3737 Wascana Parkway, Regina, SK S4S 0A2, Canada
*
Author to whom correspondence should be addressed.
Energies 2018, 11(10), 2723; https://doi.org/10.3390/en11102723
Submission received: 11 September 2018 / Revised: 27 September 2018 / Accepted: 2 October 2018 / Published: 11 October 2018
(This article belongs to the Special Issue Applied Energy System Modeling 2018)

Abstract

:
In this study, a fuzzy chance-constrained fractional programming (FCFP) approach is developed to help tackle various uncertainties involved in electric power systems (EPSs) management. The FCFP approach is capable of solving ratio optimization decision problems in power systems associated with random and fuzzy information by chance-constrained programming (CCP) method, fuzzy measure programming, fractional programming (FP) into a general framework. It can tackle inexact information expressed as fuzzy set and probability distributions, comprehensively reflect the decision maker’s pessimistic and optimistic preferences, and balance dual objectives of system economy and sustainability. To demonstrate its applicability, FCFP approach is then applied to a case study of Shanxi Province, a typical coal-heavy electricity region in China. The results indicate that the FCFP approach reveals uncertain interactions among the decision maker’s preferences and various random variables. Reasonable solutions have been generated for Shanxi EPS management practices, which can provide strategies in mitigating pollutant emissions, reducing system costs, and promoting coalbed methane as an alternative energy source for coal-fired and plays an essential role in Shanxi’s municipal planning. The solutions will help decision makers generate alternatives in the event of the reducing coal-fired power generation and could be applicable in other coal-heavy electricity regions.

1. Introduction

Over the past 20 years, fossil-fuel combustion in the electric power system (EPS) has caused about three-quarters of the world’s carbon dioxide emissions [1]. The sustainable development of EPSs continues to be a focused concern for most countries worldwide. To mitigate global greenhouse gas (GHG) emissions, utilization of renewable energy has been given priority in many countries and regions in the world. With the reduction in the proportion of coal-fired power generation, the CO2 emissions of the power industry in many countries and regions are decreasing. However, the sustainable management of EPS still faces many difficulties. Firstly, renewable energy, as an alternative energy source, has the characteristics of cleanliness, non-depletion, and easier operation and maintenance. However, the cost of generating electricity from renewable energy is higher, and its availability is intermittent and unreliable. It is thus difficult to identify the tradeoffs among conflicting economic, environmental, and system security concerns. Secondly, extensive uncertainties associated with systems modeling objectives, constraints, and parameters exist in EPS management, such as future electricity demands and fossil-fuel price. Therefore, advanced mathematical programming techniques are desired to address the above complexities and uncertainties and thus enhance the relevant decision robustness.
Previously, researchers have made great efforts in planning the shift from the existing energy demand and supply system towards sustainability. Table 1 lists some previous studies on energy and environmental planning problems. Among them, inexact programming methods are widely used to provide comprehensive management solutions under specific system conditions, which were generally based on fuzzy mathematical programming (FMP) and stochastic mathematical programming (SMP). FMP can effectively address the imprecise/vague information in decision-making problems, which is formulated by possibility distribution with the subjective experience/knowledge of specialists, stakeholders, and decision makers [2,3,4,5,6,7]. For example, Zhang et al. [8] proposed a fuzzy credibility programming method for regional EPS to address the imprecision of the constrained left-hand parameters. SMP could integrate inexact information expressed as chances or probabilities into the optimization framework [9,10,11,12,13,14]. For example, Wu et al. [15] introduced a stochastic mixed-integer programming approach for Qingdao’s EPS to tackle uncertainties expressed as probability distributions and discrete intervals. There are various uncertainties in EPS, and the potential interactions of these uncertainties may further exacerbate the complexity of the decision-making process. However, each approach mentioned above could only address the uncertainties described in one single format. It has difficulties in dealing with the uncertainties that exist at multiple levels.
In order to reflect the multi-dimensionality of sustainable development goals, many researchers advance multiple objective programming (MOP) approaches to planning energy and environmental issues [16,17,18,19,20,21,22]. For example, Meza et al. [23] propose a multi-objective model for the long-term power generation expansion planning of Mexican EPS. The model optimizes simultaneous multiple objectives in the EPS planning process (i.e., minimizes costs, environmental impact, imported fuel, and fuel price risks). Nevertheless, the MOP approach neglects the trade-offs among multiple objectives and the complexity of the EPS could not be adequately reflected. Moreover, the weight chosen in MOP is highly dependent on subjective inputs. Compared to traditional single-objective or multi-objective optimization methods, fractional programming (FP) has the advantage of better reflecting real-problems by optimizing economic and environmental ratios. For example, Zhu et al. [24] presented a stochastic FP method for the long-term planning of EPS to maximize the ratio between renewable energy generation and system cost. FP was considered an effective tool to reflect both economic and environmental targets related to sustainability [25,26]. However, few of the FP problems in EPS planning involved analyzing the randomness of the parameters, the uncertainties due to managers’ subjective judgments and preferences, and uncertainties existed at multiple levels, which were not effectively tackled by the previous studies.
Therefore, this study aims to develop a fuzzy chance-constrained fractional programming (FCFP) model to support Shanxi’s EPS planning and environmental management under multiple uncertainties. Shanxi Province is one of the important coal producing areas in China, which is facing resource depletion, severe environmental pollution, ecological destruction, and other resulting economic and social pressures. This study is the first attempt to cope with the various complexities in Shanxi’s EPS while exploring the transition pathways toward sustainable EPSs, especially for the coal-heavy electricity region. The FCFP approach will integrate chance-constrained programming (CCP) and fuzzy programming within a FP framework to address complex uncertainties in model parameters, inputs, and structures and enhance the robustness of the obtained decisions. Then, the FCFP approach will be applied to a typical case study to develop the FCFP-Shanxi model. Through solving the FCFP-Shanxi model, reasonable solutions for Shanxi EPS management practices will be generated. It will help decision makers generate alternatives in the event of the reducing coal-fired power generation, gain in-depth insights into potential system risk as well as analyze the trade-off between system economy and environmental objectives, and analyze the impact of various possible scenarios due to different end-user demand situations, etc.

2. Overview of the Study Area

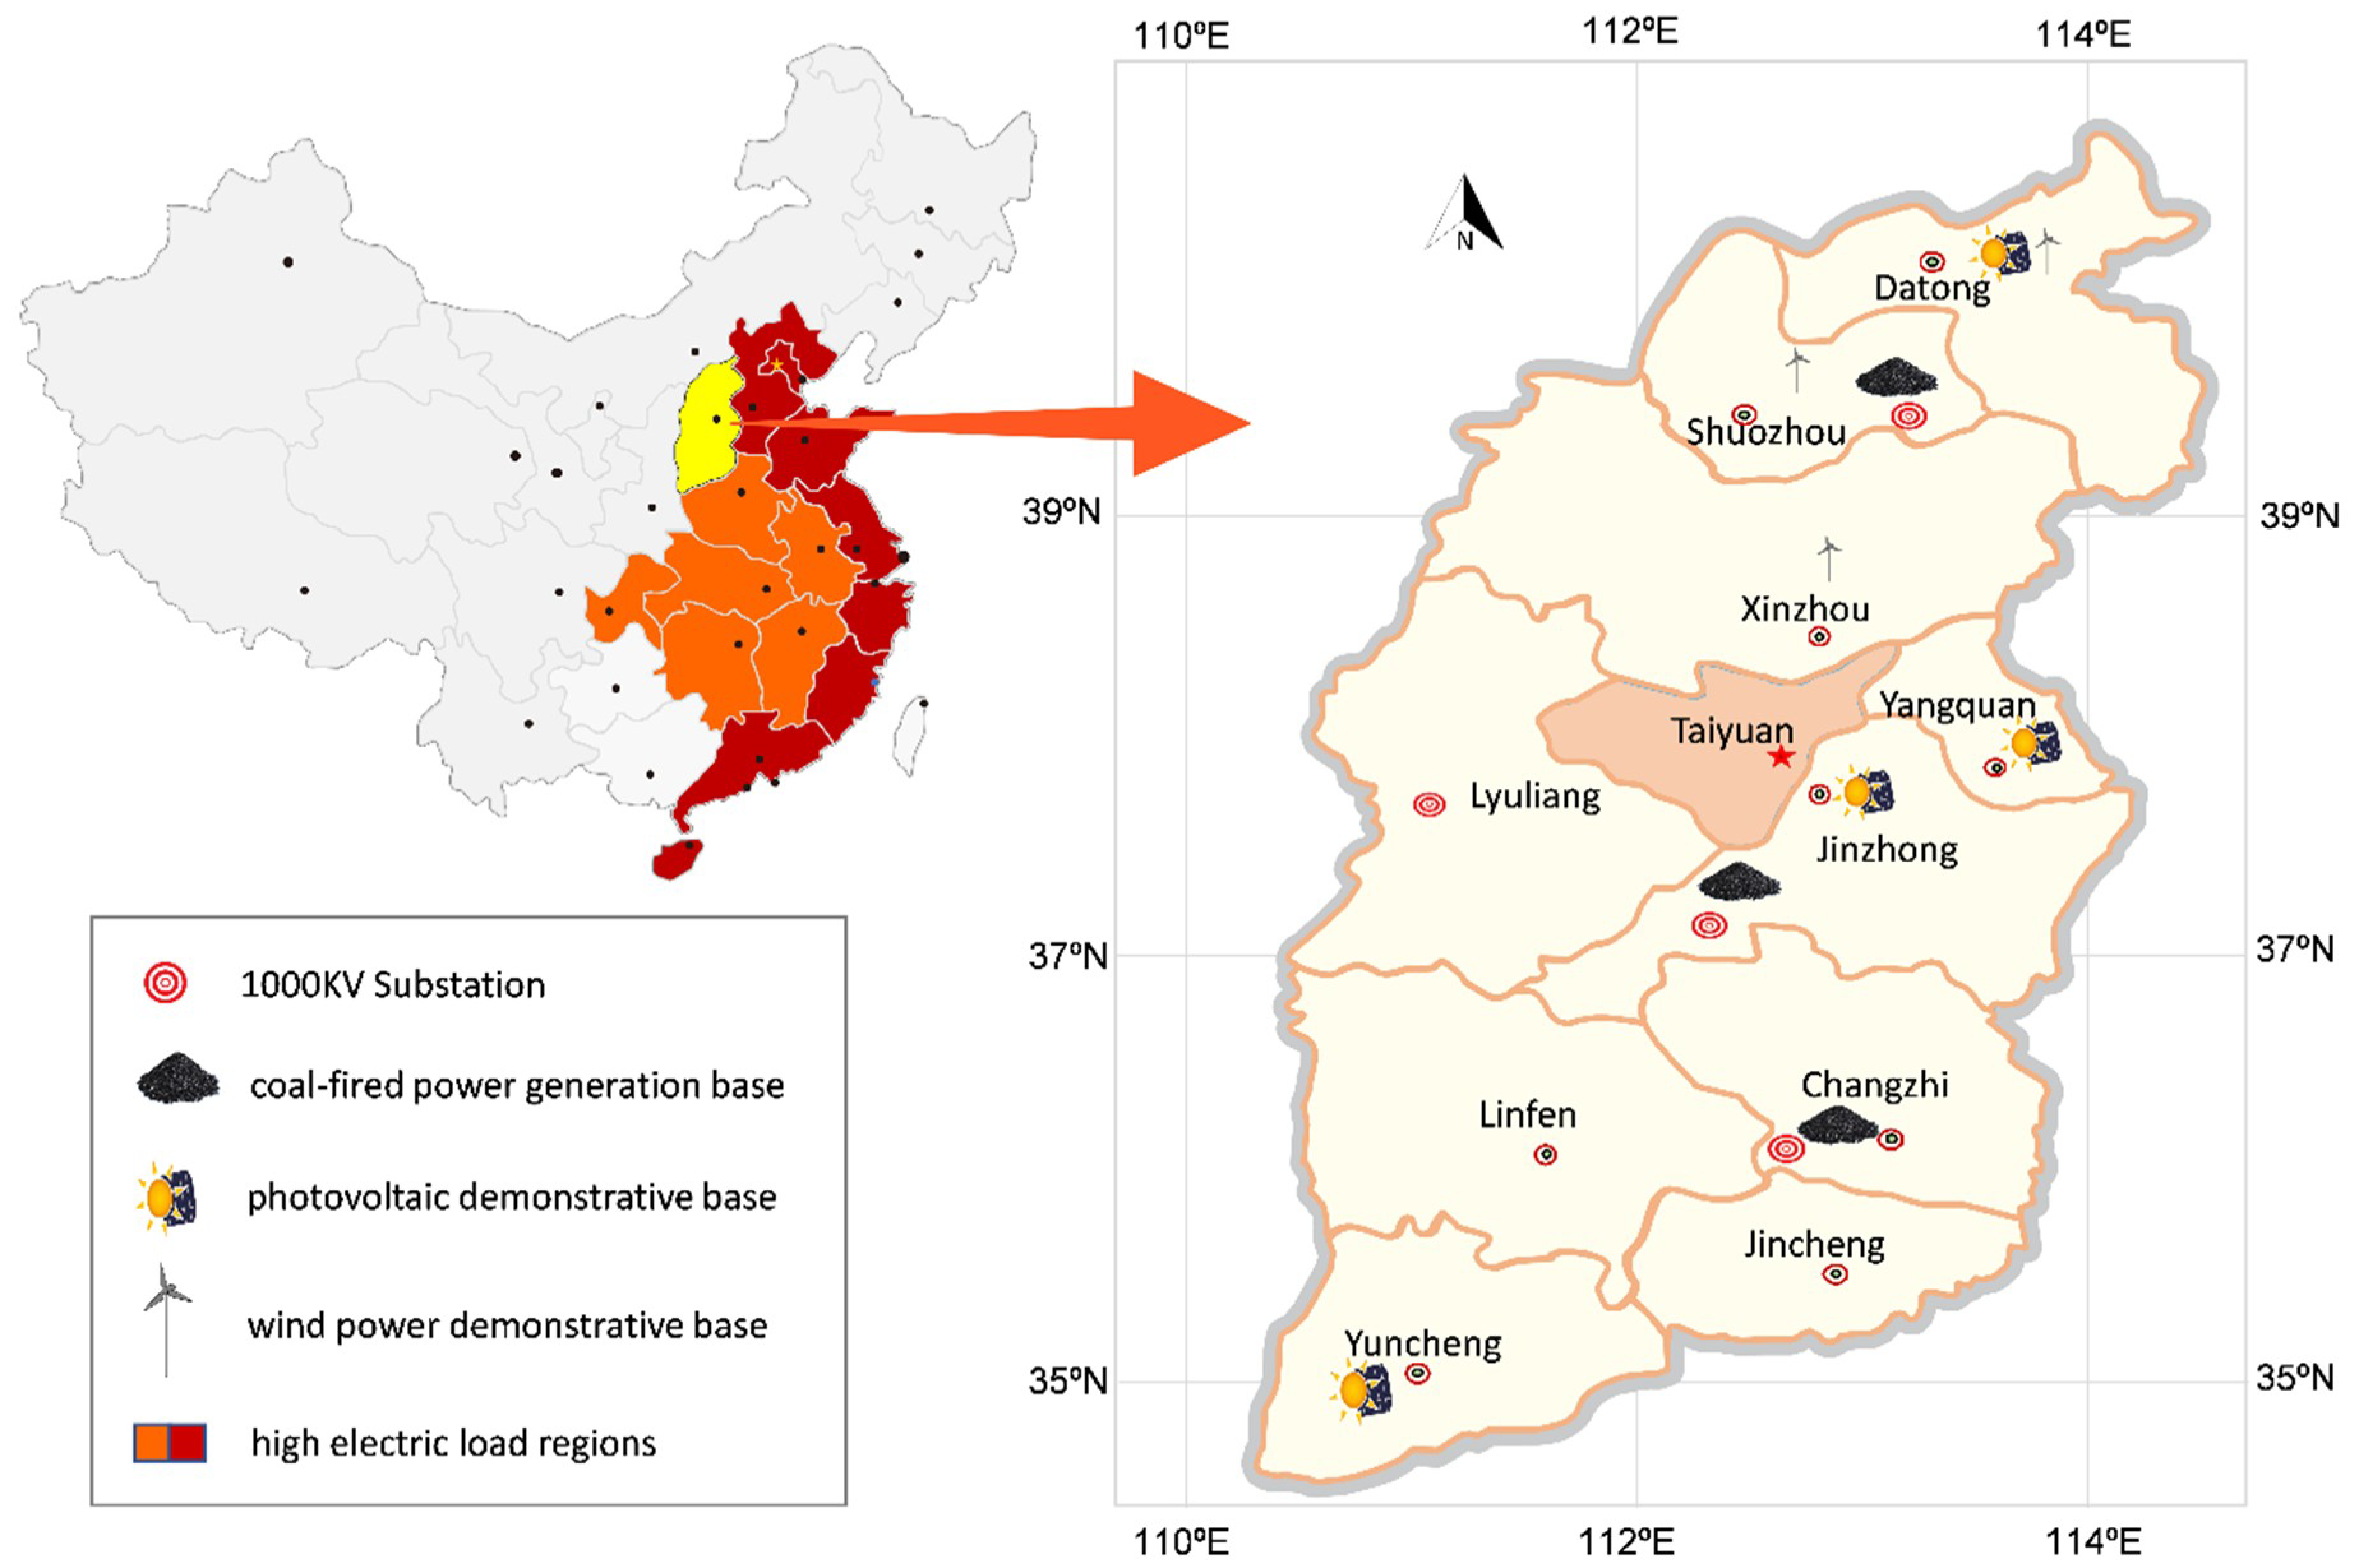
2.1. The Province of Shanxi

Shanxi Province (34°34′–40°44′ N, 110°14′–114°33′ E, see Figure 1) is located at the east of Loess Plateau in north-central China. The province occupied an area of 156,804 km2. At the end of 2016, the permanent population of Shanxi Province was 36.81 million, and the GDP reached by 12,966.2 billion (RMB). The province is an essential integrated energy base in China and has 62,000 km2 possesses coal reserves, accounting for 40.4% of the total area [27]. The province has three large-scale coal bases with a scale of over 100 million tons and three large coal-fired power bases with a capacity of 10 million kilowatts. The province has abundant renewable energy resources. The potential technical-development capacity of wind energy resources (≥200 watts/m2) of about 70 m is 28.14 × 10⁶ kW; the annual average solar radiation amount reaches 1624 kWh/m2; straw energy utilization is about 5 million tons per year and garbage resources up to 8500 tons per day; the total amount of prospective geothermal extractable resources is 1.41 × 10¹⁷ kJ/year; and the reserve of coalbed methane resources is about 10.39 × 10¹² m3, ranking first in China. Shanxi Province is adjacent to high electric load regions (see Figure 1) and is an important province for electricity exports.

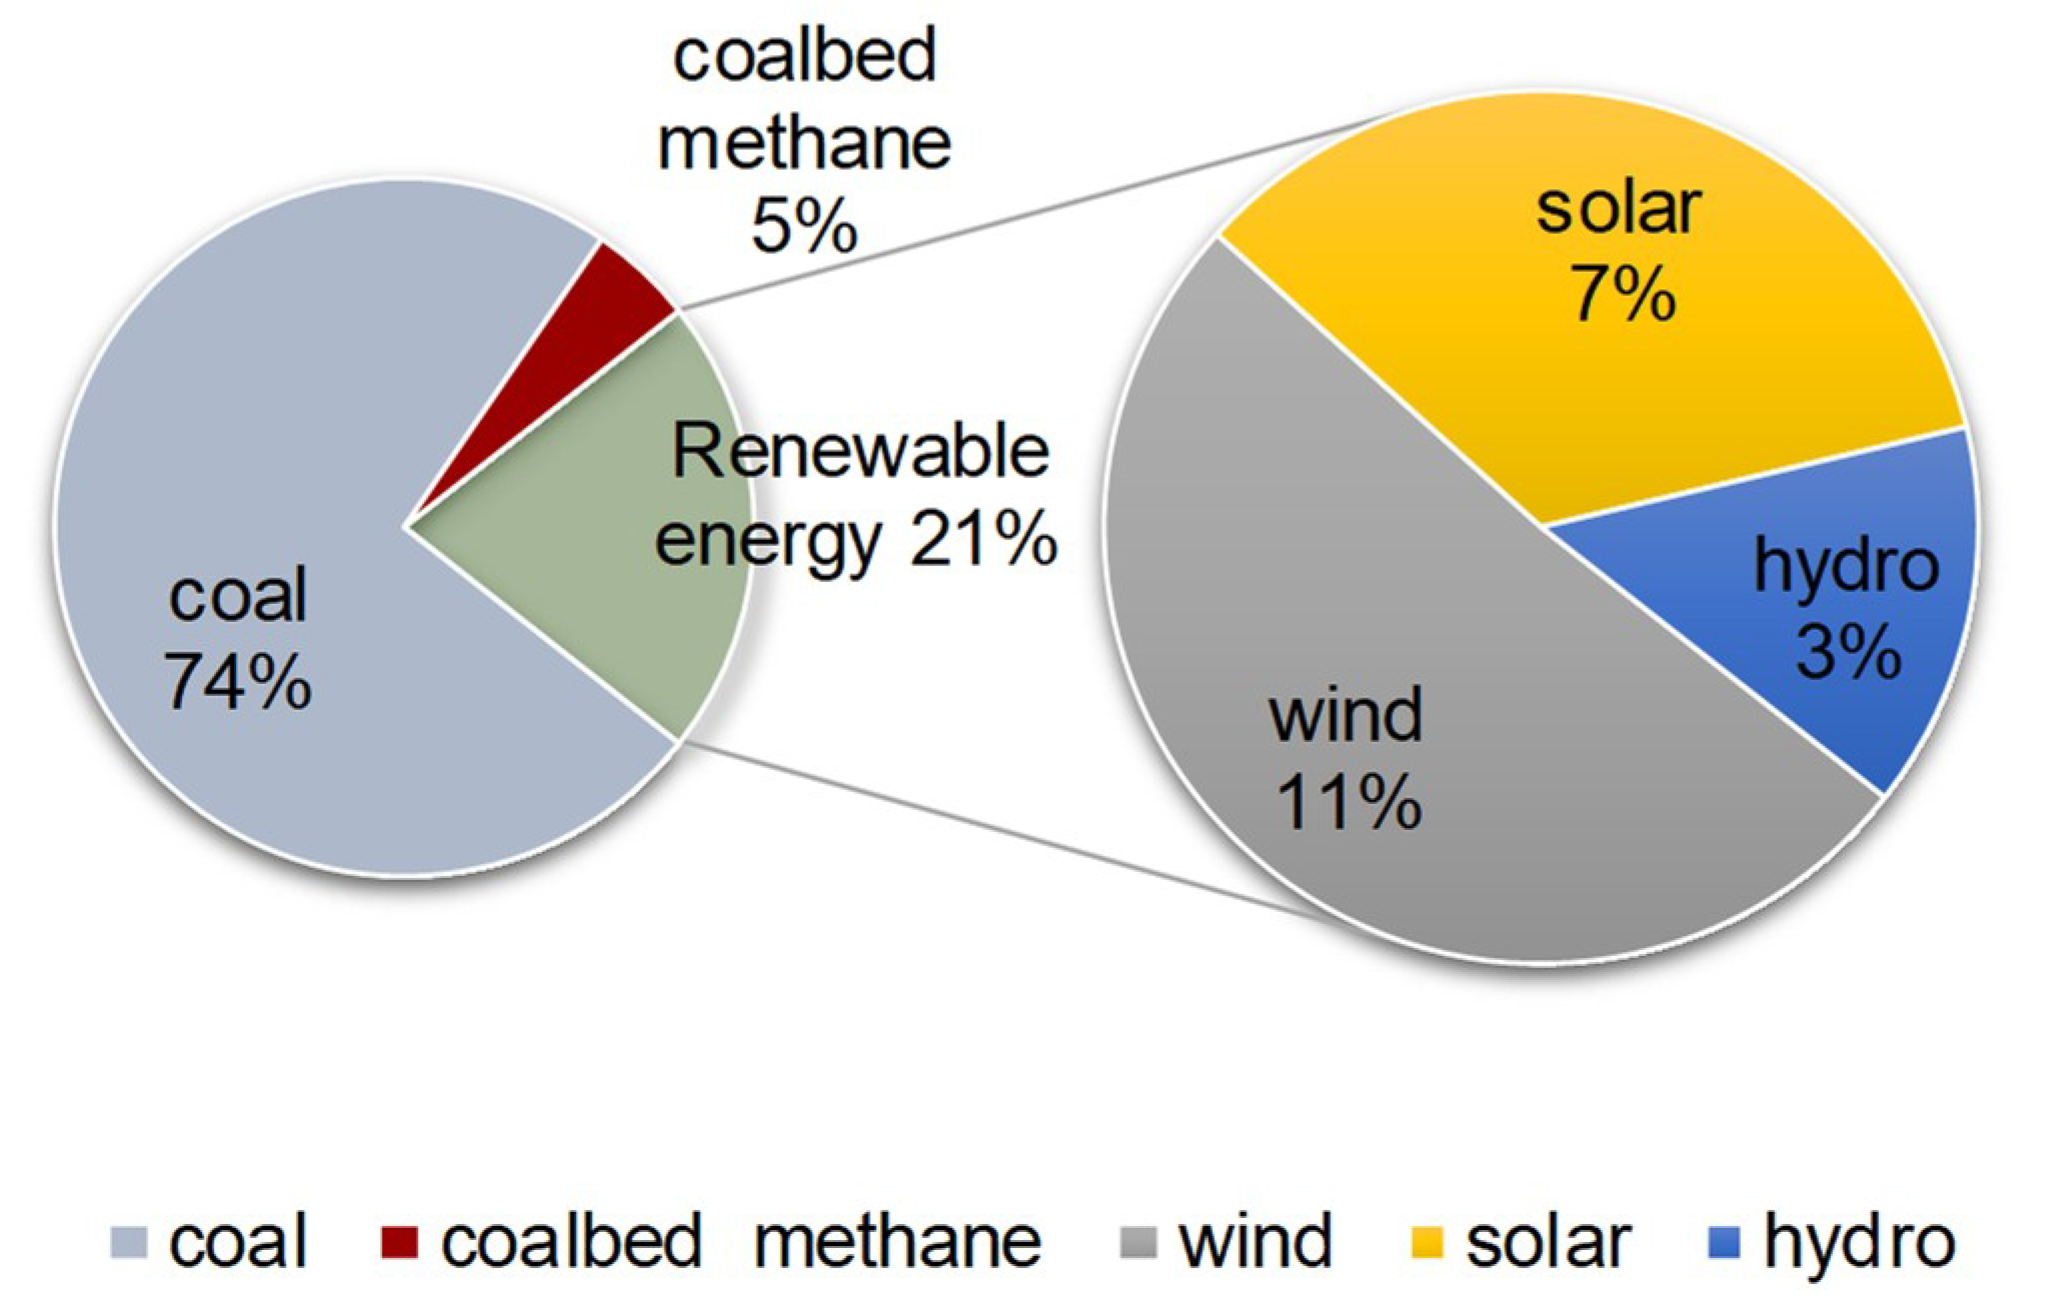
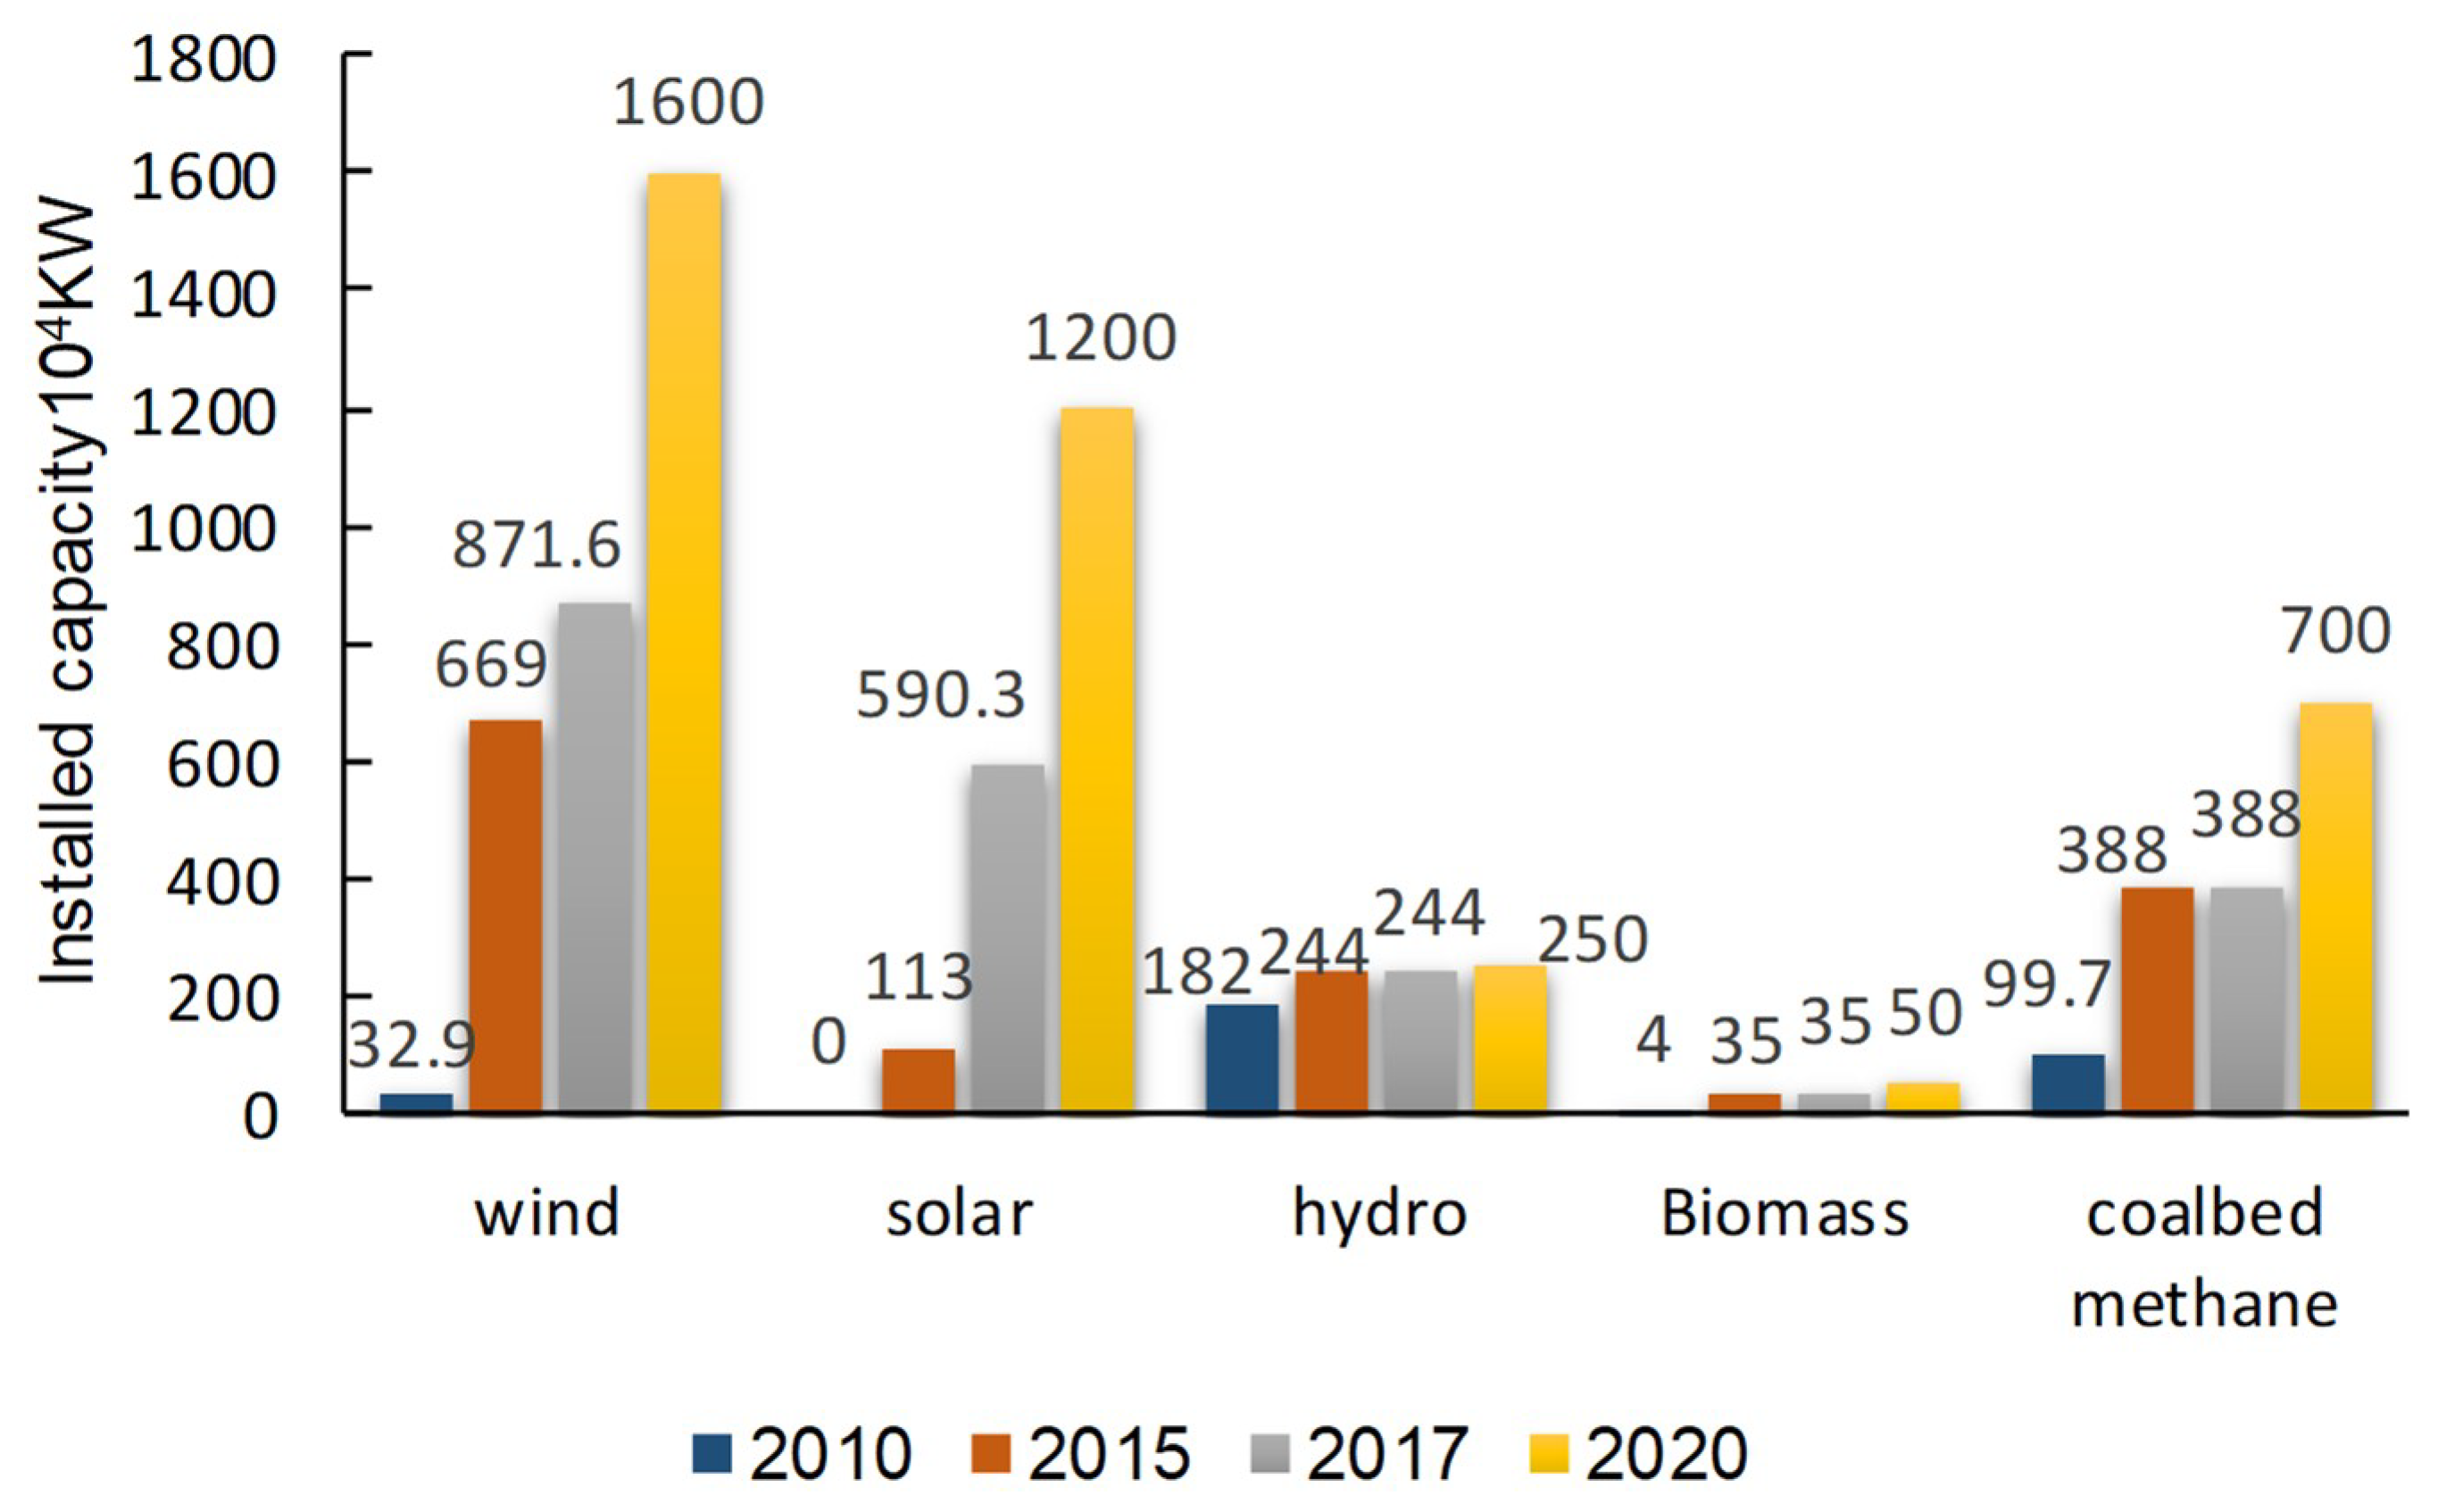
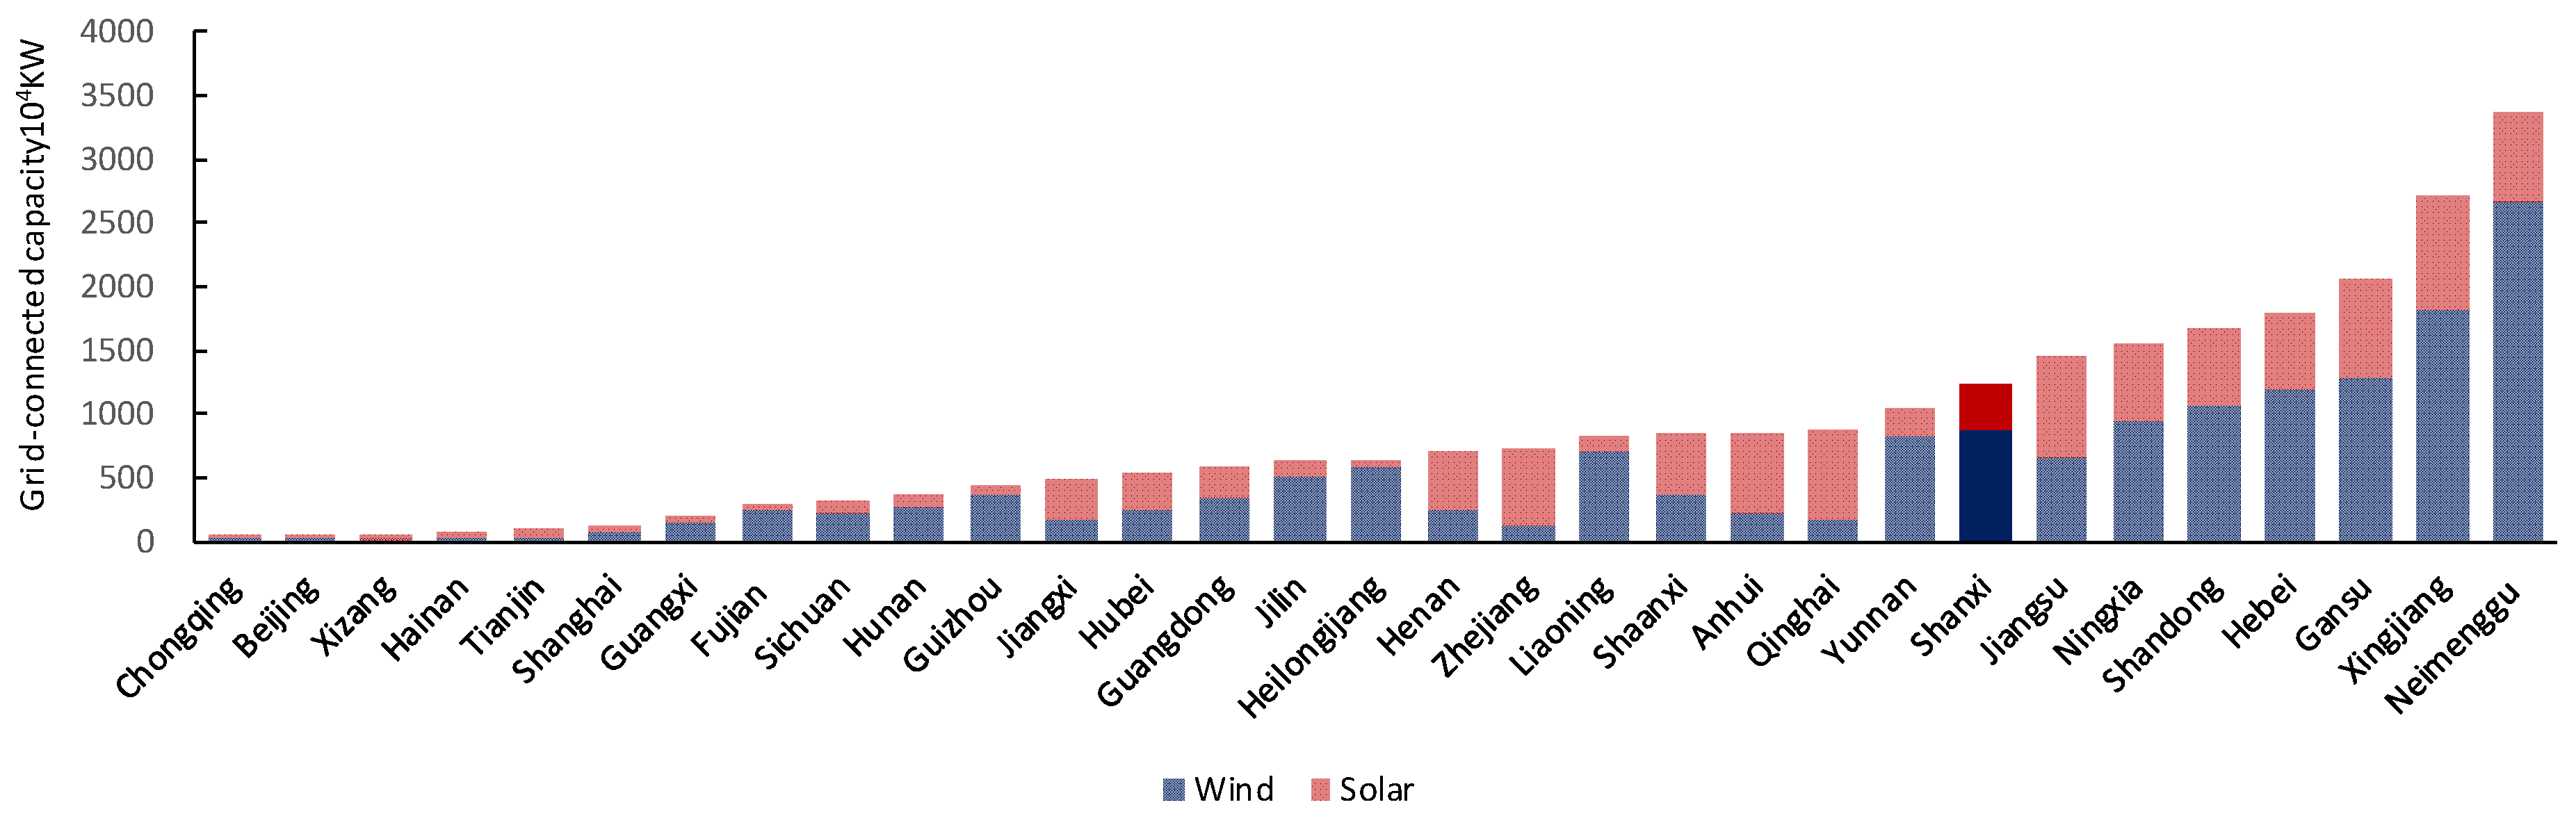
2.2. Shanxi Electric Power System

Coal resource in Shanxi Province is abundant, and coal-fired power generation is, therefore, the dominant sources of electric supply. As shown in Figure 2, the coal-fired power installed capacity occupied 74% of total capacity in 2017. Among them, 300,000 kilowatts and below of generating units accounted for 32%, and these coal-fired generating units will gradually phase out for reducing pollutant emissions. On the other hand, Shanxi Province has been aggressively pursuing sustainable development to reduce high dependence on coal-fired power generation. By the end of 2017, the province’s electric installed capacities had reached 80.73 × 10⁶ kW, where wind power, photovoltaic and other renewable energy generator assembly capacities were 17.06 × 10⁶ kW, accounting for 21% of the province’s installed capacity. Coalbed methane power generation only accounts for 5% of the total power generation, while Shanxi has the high reservation of coalbed methane. Shanxi Province is in the Yellow River Basin, but the hydropower resources of the Yellow River’s north mainstream have not been developed yet, and hydropower only accounts for 3% of the total power-generation.
Figure 3 shows the installed capacity of clean energy (we assumed coalbed methane resources as the clean energy). The new energy industry of Shanxi Province started relatively late but have had a rapid development. In 2010, the installed wind power capacity was only 0.33 × 10⁶ kW. Till the end of 2017, it had reached 8.72 × 10⁶ kW. Similarly, the installed photovoltaic power capacity raised from 0 in 2010 to 5.9 × 10⁶ kW in 2017. The new energy development targets for 2020 were released by the Shanxi Provincial Development and Reform Commission (see Figure 3). In the next few years, the province will also accelerate the pace of new energy construction for promoting the transformation of the energy structure. As can be seen from Figure 1, by 2020, the installed capacity of wind power, photovoltaic power, and coalbed methane power generation is expected to have double the amount compared to 2017.
Figure 4 shows the accumulated grid-connected capacity of wind power and photovoltaics in China by the end of 2017. Due to geographical advantages, Shanxi has abundant renewable energy resources, with the total installed capacity of wind power and photovoltaics ranked eighth in China by the end of 2017.
Shanxi Province is one of the most important electricity exporter provinces. In addition to providing electric power resources for the region, it is also responsible for providing electric power resources to the Beijing-Tianjin-Tangshan area, Hebei Province, and other regions. As Figure 5 indicates, the proportion of power transmission to total power generation has shown an overall growth trend, with the highest ratio accounting for 34.22% and a minimum of 19.19% over the past 18 years. In addition to the existing long-distance transmission lines, there is three ultra-high voltage (UHV) electric transmission lines (two 1000 kV UHV alternating current and one 800 kV UHV direct current transmission lines) that are under construction or are completed and pass-through Shanxi Province. Through these lines, Shanxi Province can provide long-distance power transmission to eight provinces and municipalities including Beijing, Tianjin, Hebei, Hubei, Hunan, Shandong, Jiangsu, and Zhejiang, and is especially important for the development and stability of major municipalities such as Beijing and Tianjin. The transmission of electricity by the UHV grid is an important way for Shanxi Province to mitigate the excess supply of electricity.

2.3. Statement of Problems

The EPS management in Shanxi faces many challenges. First, coalbed methane power generation has a lower share of total electricity supply in Shanxi (~5%), while Shanxi has the great reservation of coalbed methane (a common characteristic of coal-rich areas), which make it a higher chance to develop such resource. In many previous studies, sustainable development focuses on expanding the share of renewable energy generation, and coalbed methane has not been considered a clean energy resource. Coalbed methane power generation is a desired substitute for coal-fired generation, and it can also help stabilize the instability of wind power and photovoltaic generation and increase the robustness and reliability of the power grid. Therefore, how to expand the share of coalbed methane power generation as an alternative energy technology should be considered in decision-making. For other similar areas with abundant coal/coalbed methane resources, it is equally important to find the solution to this issue.
Second, the development of coal-fired power and new energy in Shanxi Province has been multiplying, but the electricity consumption market has grown slowly. The excess power supply severely hinders the growth of the power generation market. Expanding the scale of export power is a common measure in areas with similar problems. However, the impact of the different scales of power export and the share of renewable energy in the whole supply on power generation patterns has not been thoroughly analyzed by previous studies. Thus, it is necessary to analyze these effects by scenario-based modeling to provide decision support for areas with similar issues.
Third, the decision-making process is complicated because policymakers, energy suppliers, and power companies face a range of uncertainties, including energy prices, emission reduction targets, and the impact of renewable energy and technology. Accordingly, advanced mathematical planning methods are desired to deal with these uncertainties.
Therefore, this study attempts to introduce the FCFP approach into Shanxi’s EPS planning to address these complexities and uncertainties. The development of FCFP necessitates sub-tasks including: (i) satisfying the power demand of end-users in local and exporting regions; (ii) addressing the dual objectives of maximizing clean power generation (including coalbed methane), and minimizing system cost; (iii) achieving a trade-off among economic costs, environmental requirements, and system violation risk; and (iv) identifying specific capacity expansion solutions.

3. Model Development

3.1. Methodology

FP can be an effective tool to tackle dual objective optimization problems. A general FP problem can be expressed as follows:
M a x   f = C X + α D X + β  
subject to:
A ( t ) X B ( t )  
x j 0   , x j X ,   j = 1 , 2 , n  
where X is a column vector of decision variable; C and D are the coefficient in numerator and denominator of the objective, respectively; α and β are constant.
In the formulation process of decision problems, many coefficients of the objectives and constraints of the model are specified by specialists usually. However, the potential values of these coefficients are ambiguous or vague known to specialists. Such uncertainties cannot be addressed through the conventional FP and the FMP methods. As a result, techniques of CCP and FMP will be coupled in a general FP framework to handle such complexities; this leads to a FCFP model as follows:
M a x   f ˜ = j = 1 n c ˜ j x j + α j = 1 n d ˜ j x j + β  
subject to:
j = 1 n a i j x j b ˜ i ,   i = 1 , 2 , m 1  
j = 1 n a r j x j b r ,   r = 1 , 2 , m 2  
x j 0 ,   j = 1 , 2 , n  
where c ˜ j , d ˜ j and b ˜ i are fuzzy coefficients with possibility distributions; i is the number of constraints with the fuzzy right-hand side coefficients; r is the number of general constraints. The continuous membership function of the fuzzy number c ˜ j can be defined as follows:
μ c ˜ j ( x ) = { f c ˜ j ( x ) ,   if   c j 1 x c j 2 1 ,   if   c j 2 x c j 3 g c ˜ j ( x ) ,   if   c j 3 x c j 4 0 ,   if   x < c j 1   or   x > c j 4  
where f c ˜ j ( x ) is a continuously and monotonically increasing function; g c ˜ j ( x ) is a continuously and monotonically decreasing function. A fuzzy number is trapezoidal when f c ˜ j ( x ) and g c ˜ j ( x ) are linear functions, and expressed by c ˜ j = ( c j 1 , c j 2 , c j 3 , c j 4 ) . Particularly, when c j 2 = c j 3 , fuzzy number c ˜ j becomes triangular. By introducing the expected value and the expected interval of the fuzzy number, the inexact objective function with fuzzy coefficients can be converted into a deterministic one [28,29,30,31]. The expected interval of a fuzzy number c ˜ j can be defined as follows:
E I ( c ˜ j ) = [ E ( c ˜ j ) , E ( c ˜ j ) ]  
where:
E ( c ˜ j ) = c j 2 c j 1 c j 2 f c ˜ j ( x ) d x = 0 1 f c ˜ j 1 ( x ) d x  
E ( c ˜ j ) = c j 3 c j 3 c j 4 g c ˜ j ( x ) d x = 0 1 g c ˜ j 1 ( x ) d x  
The expected value of the fuzzy number c ˜ j is defined as the center of the expected interval of the number and it can be denoted as follows:
E V ( c ˜ j ) = [ E ( c ˜ j ) + E ( c ˜ j ) ] / 2  
According to Jiménez et al. [30], the expected interval and the expected value can also be expressed as follows:
E I ( c ˜ j ) = [ ( c j 1 + c j 2 ) / 2 , ( c j 3 + c j 4 ) / 2 ]  
E V ( c ˜ j ) = ( c j 1 + c j 2 + c j 3 + c j 4 ) / 4  
Thus, the reconstructed deterministic objective can be expressed as follows:
M a x   f ˜ = E V ( c ˜ j ) x j + α E V ( d ˜ j ) x j + β  
Besides, b ˜ i is the right-hand side coefficients of the i-th constraint that express the maximum (≤) requirement and is assumed as triangular fuzzy numbers ( b ˜ i = ( b 1 , b 2 , b 3 ) ), which membership function is expressed as follows:
μ b ˜ i ( x ) = { ( x b 1 ) / ( b 2 b 1 ) ,   if   b 1 x b 2 ( x b 3 ) / ( b 2 b 3 ) ,   if   b 2 x < b 3 0 ,   other    
In practical applications, the chance of a fuzzy event was commonly adopted for the possibility and necessity measures to reflect. The definition of these two measures is as follows [32,33,34]:
P o s { a b ˜ } = sup a x μ ( x )  
N e c { a b ˜ } = 1 P o s { a > b ˜ } = 1 sup a > x μ ( x )  
where P o s { } and N e c { } denote the possibility and certainty of the event in { } . According to Equation (10), P o s { a b ˜ } and N e c { a b ˜ } are denoted by the following calculation equations.
P o s { a b ˜ } = { 1 ,   if   a b 2 a b 3 / b 2 b 3 ,   if   b 2 a b 3 0 ,   if   a > b 3
N e c { a b ˜ } = { 1 ,   if   a b 1 a b 2 / b 1 b 2 ,   if   b 1 a b 2 0 ,   if   a > b 2  
Generally, pessimistic managers prefer to meet the constraints under a high degree of necessity. On the contrary, for optimistic managers, the optimistic measure is much more acceptable. Therefore, the mλ measure is introduced to balance them (see Figure 6). The mλ measure, which is a trade-off measure of possibility and necessity, was employed to convert the fuzzy random variables into crisp values to comprehensively reflect the decision maker’s pessimistic and optimistic preferences, and it can be expressed as follow:
m λ { a b ˜ } = λ P o s { a b ˜ } + ( 1 λ ) N e c { a b ˜ }  
where preference parameter λ ( λ [ 0 , 1 ] ) reflects the decision maker’s pessimistic and optimistic preferences. Thus, we obtain the following mλ measures defined by Equations (13)–(15):
m λ { a b ˜ } = { 1 ,   if   a b 1 ( 1 λ ) a + λ b 1 b 2 / b 1 b 2 ,   if   b 1 a b 2 λ a λ b 3 / b 2 b 3 ,   if   b 1 a b 2 0 ,   if   a > b 3
Then, Equation (16) can be transformed by the Equation (17), which are satisfied with at the least level of ξ.
m λ { a b ˜ } ξ  
where ξ represents the predetermined confidence level. Let substitute j = 1 n a i j x j for the a. Thus, vector. X is feasible if and only if the necessity measure of the event j = 1 n a i j x j b ˜ i is at least ξ level. Then, fuzzy constraint in Equation (2b) can be converted into the following defuzzification one [35,36,37].
m λ { j = 1 n a i j x j b ˜ i } ξ i , i = 1 , 2 , m 1  
Generally, the constraints are meaningful only if the confidence level is greater than 0.5 [10]. Then, according to Zhang et al. [34], the constraints in Equation (18) under different λ and ξ can be further denoted into the following two scenarios:
j = 1 n a i j x j ( 1 ξ i ) b i 2 + ( ξ i λ ) b i 1 ( 1 λ ) ,   if   λ ξ i  
j = 1 n a i j x j ( λ ξ i ) b i 3 + λ b i 2 λ ,   if   λ > ξ i  
CCP is another effective method for dealing with uncertainty problems. In EPS planning, many parameters are random, such as the availability of renewable energy resources. The verification of constraints can be changed from “rigid satisfaction” to “flexible response”. Due to the stochastic nature of the input data, decision-makers can be prepared to permit certain violations in the decision process. CCP is effective for coping with random variables and analyzing the risk of violating constraints. If b r ± is a random right-hand-side parameter, the constraints in Equation (2c) can be transformed as follows:
Pr { j = 1 n a r j x j b r } δ r , r = 1 , 2 , , m  
This means that, for each constraint, the possible region of occurrence defined by the left-hand side should lie within the satisfactory or tolerable region associated with the right-hand side. Thus, by incorporating the CCP method and tolerance measures δ r ( 0 δ r 1 ) , the Equation (20) can be converted to the deterministic equivalents as follows.
j = 1 n a r j x j b r ( p r ) , r = 1 , 2 , , m 2  
where b r ( p r ) = F r 1 ( p r ) ,   r = 1 , 2 , , m 2 ; p r = 1 δ r , given the cumulative distribution function of br (i.e., Fr(br)) and the probability of violating constraint in Equation (21) (pr). The constraint of the model in the optimization process is changed from “rigid satisfaction” to “flexible response”. Therefore, the scheme can meet the optimization target with flexibility and maneuverability.
Accordingly, the FCFP model can be formulated as follows:
M a x   f ˜ = j = 1 n c ˜ j x j + α j = 1 n d ˜ j x j + β  
m λ { j = 1 n a i j x j b ˜ i } ξ i , i = 1 , 2 , m 1  
j = 1 n a r j x j b r ( p r ) , r = 1 , 2 , , m 2  

3.2. Fuzzy Chance-Constrained Fractional Programming-Shanxi Modeling Formulation

Based on the FCFP approach, this section will develop the FCFP-Shanxi model for planning the EPS of Shanxi. We assumed coalbed methane resources as our clean energy power generation. Accordingly, the objective is to maximize the ratio between clean power generation and economic cost, while a series of constraints define the interrelationships among the system objective and conditions such as environmental and end-users demands.
To reflect the dynamic features of the study system, three time periods (5-year for each period) are considered in a 15-year planning horizon. A sufficient electric supply at minimum cost is important to the electric generation expansion planning. The system cost C is denoted as a sum of the following:
C = f 1 + f 2 +   f 3 +   f 4 +   f 5 +   f 6 f 7  
(1)
the total cost for primary energy supply:
f 1 = t = 1 T j = 1 I C P E ˜ t j × A P E t j  
(2)
fixed and variable operating costs for power generation:
f 2 = t = 1 T j = 1 J k = 1 K C P G t j × A P G t j k  
(3)
cost for capacity expansions:
f 3 = t = 1 T j = 1 J m = 1 M C E P t j × E C A t j m × Y t j m  
(4)
cost for pollutant mitigation:
f 4 = t = 1 T j = 1 I n = 1 N k = 1 K C P M t j n × A P G t j k × c f t j n  
(5)
penalty for pollutant emission:
f 5 = t = 1 T j = 1 I n = 1 N k = 1 K C E E t j n × A P G t j k ×   c f t j n × ( 1 η t j n )  
(6)
transmission cost of electricity export:
f 6 = t = 1 T k = 1 K j = 1 J C T D t k × A P G t j k  
(7)
fiscal subsidy of renewable energy generation and pollution treatment:
f 7 = t = 1 T j = 1 I k = 1 K S P T t j × A P G t j k + t = 1 T j = I J k = 1 K S R G t j × A P G t j k  
M ax   f = renewable   power   generation   +   coalbed   methane   generation system   cos t   = t = 1 T j = I + 1 J k = 1 K A P G t j k + t = 1 T k = 1 k A P G t 2 k f 1 + f 2 +   f 3 +   f 4 +   f 5 +   f 6 f 7
Renewable energy resources are intermittent and unreliable, such as solar energy and wind energy, which are subject to fluctuations in spatial and/or temporal [4]. The coalbed methane generation with low carbon dioxide emissions can stabilize the risk of the intermittent and unpredictable nature of renewable energy generation. Thus, in this study, we assumed natural gas resources as the clean energy.
The constraints are listed as follows:
(1)
electricity demand constraints:
j = 1 J A P G t j k D M t × ( 1 + θ t k ) , t , k = 1  
j = 1 J A P G t j k D E t × ( 1 + θ t k ) , t , k = 2  
(2)
capacity limitation constraint for power generation facilities:
k = 1 K A P G t j k ( R C A t j + m = 1 M ( E C A ( t 1 ) j m × Y ( t 1 ) j m ) R E T ( t 1 ) j ) × S T M t j , t , j  
(3)
primary energy availability constraints:
A P E t j U P E t j , t , j = 1 , 2  
k = 1 K A P G t j k × r f t j A P E t j , t , j = 1 , 2  
(4)
capacity expansion constraints:
R C A t j + m = 1 M ( E C A ( t 1 ) j m × Y ( t 1 ) j m ) R E T ( t 1 ) j U C A t j , t , j  
(5)
expansion options constraints:
m = 1 M Y t j m 1 ,   t , j  
Ytjm = 1, if expansion is undertaken
Ytjm = 0, otherwise
(6)
renewable energy availability constraints:
k = 1 K A P G t 3 k / c r f t 3 A V H t , t  
k = 1 K A P G t 4 k / c r f t 4 A V W t ( p r ) , t  
k = 1 K A P G t 5 k / c r f t 5 A V S t ( p r ) , t  
(7)
export electricity constraints:
j = I + 1 J A P G t j k ( j = 1 J A P G t j k ) σ t , t , k = 2  
According to the government’s planning requirement, power export needs contain a certain percentage of the electricity generation from renewable energy sources. Thus, σt is used to represent the lowest ratio of power generated from renewable resources.
(1)
pollutants emission constraints:
j = 1 I k = 1 K A P G t j k × c f t j n × ( 1 η t j n ) E M ˜ t n , t , n  
(2)
export constraints:
j = 1 J A P G t j 2 U H V t × S T t , t  
(3)
non-negativity constraints:
A P E t j , A P G t j k , Y t j m 0     t , j , k , m  

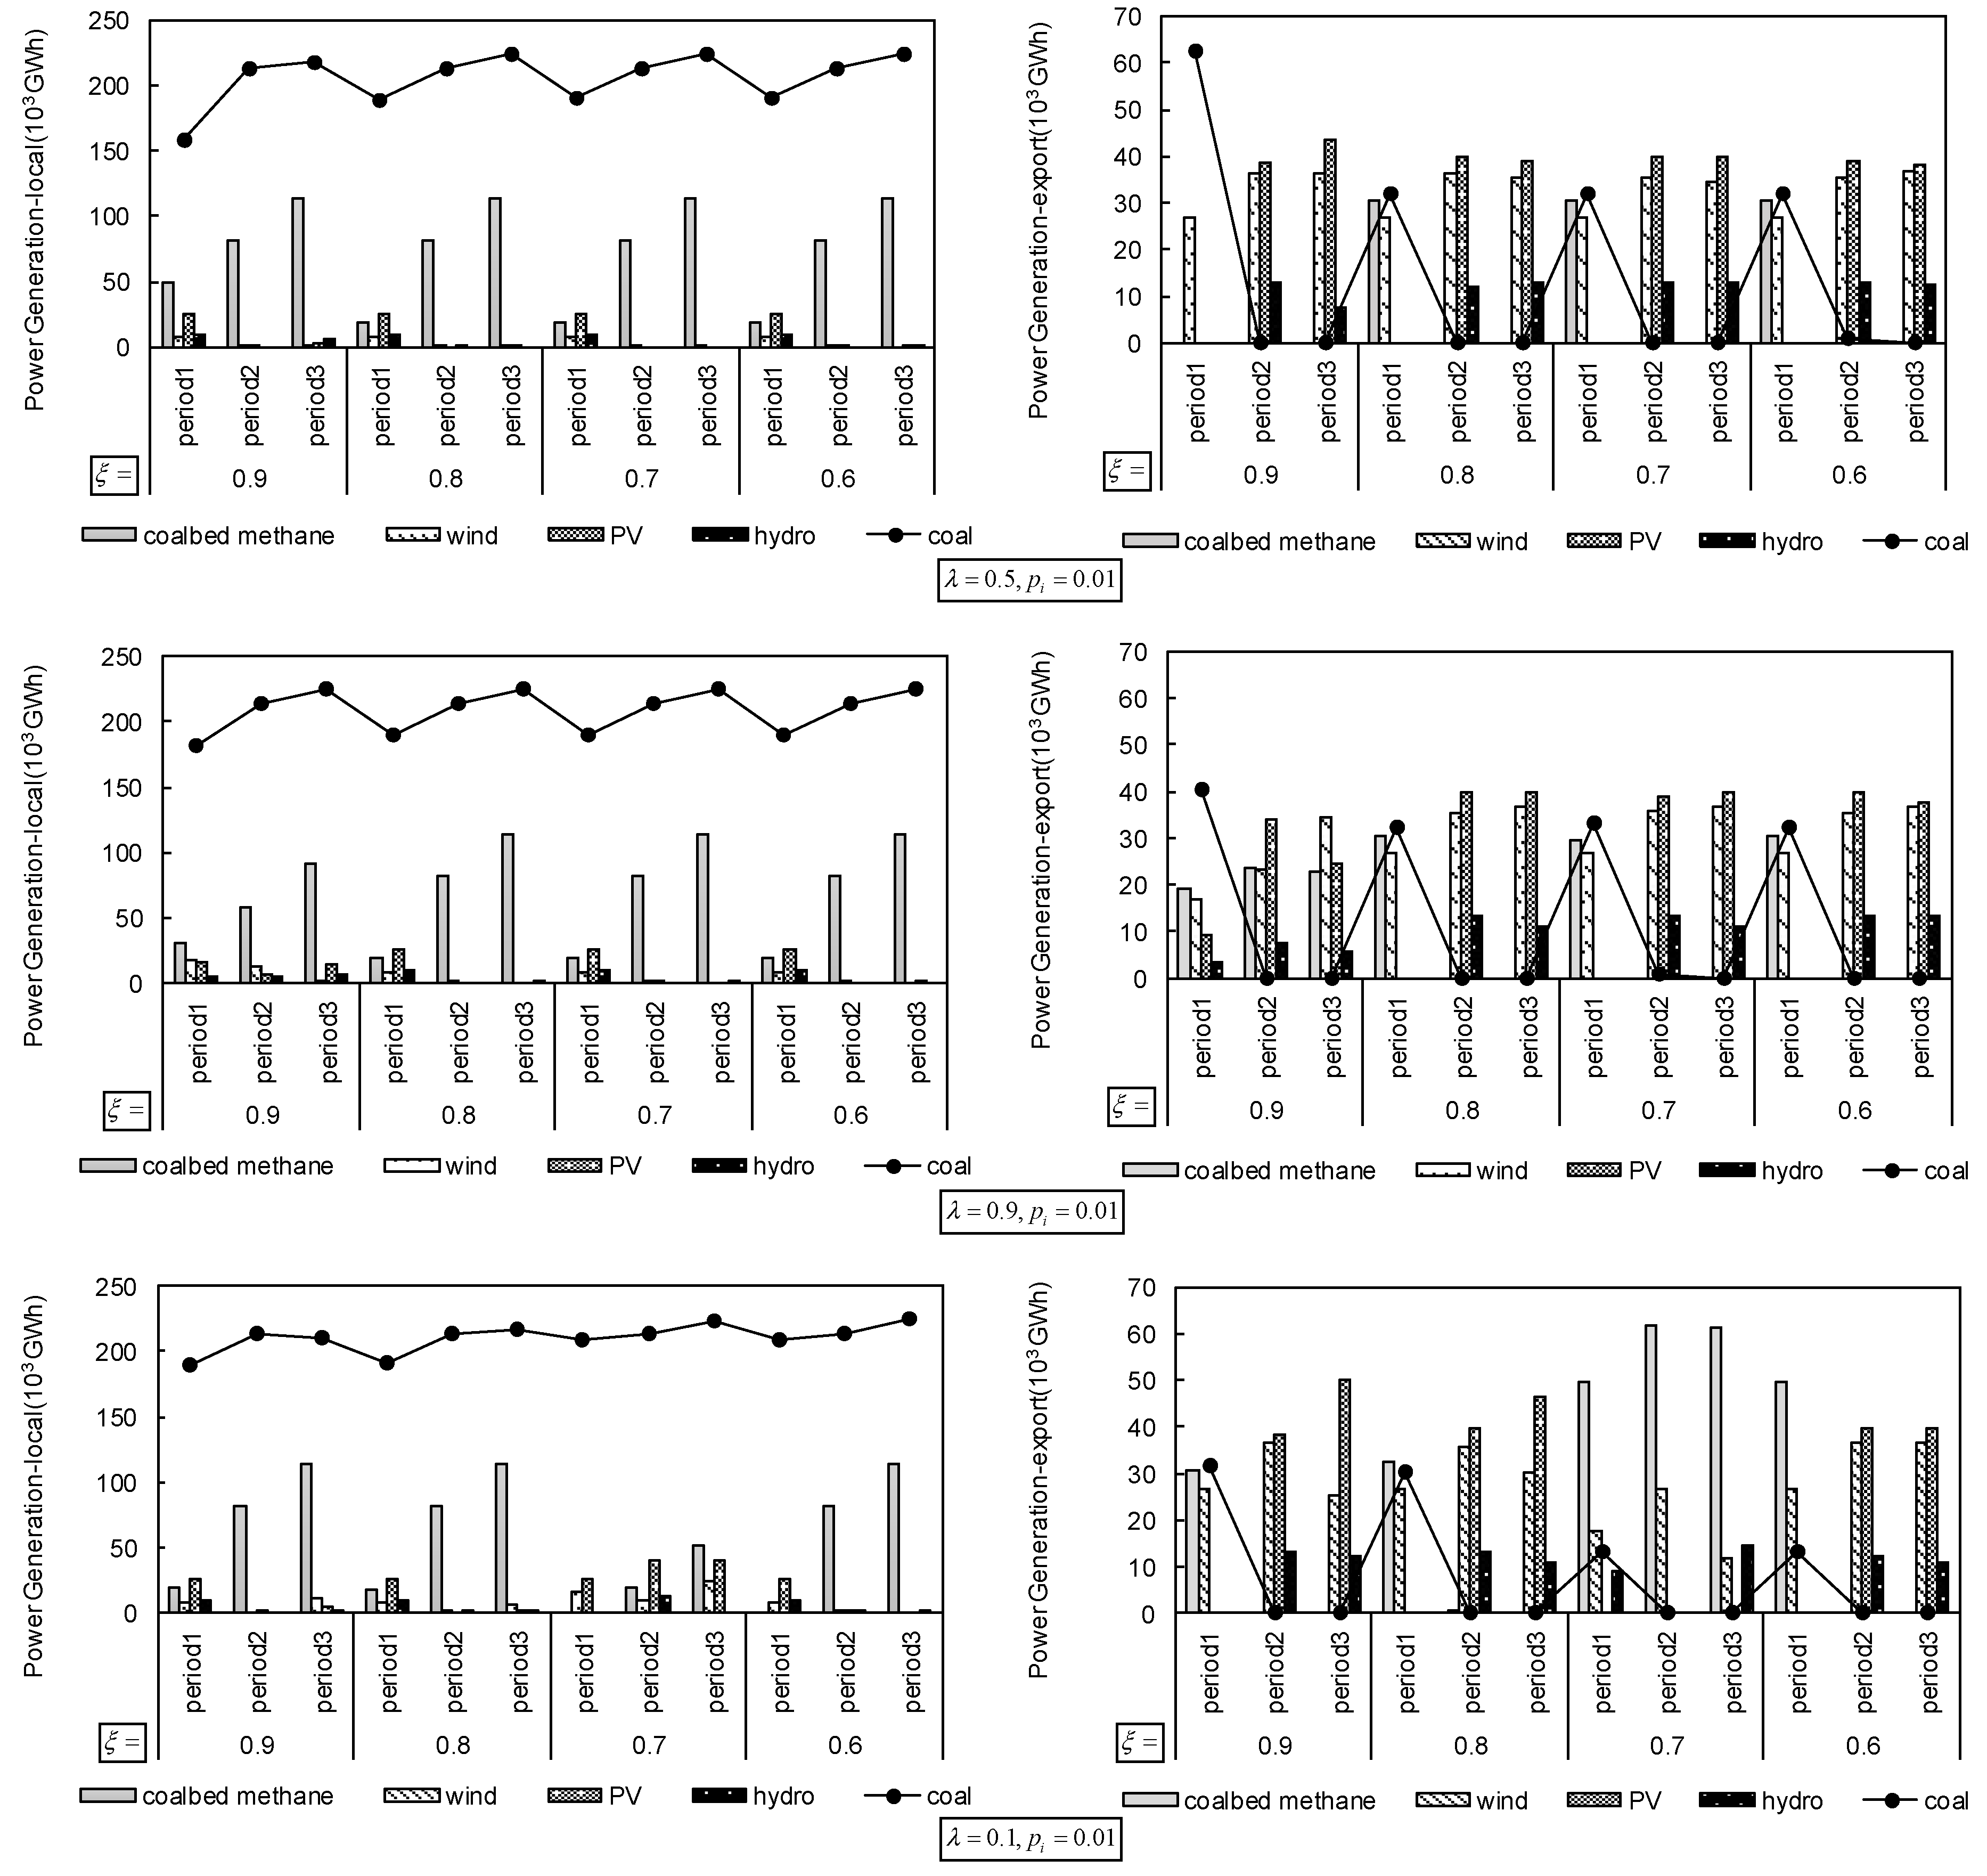
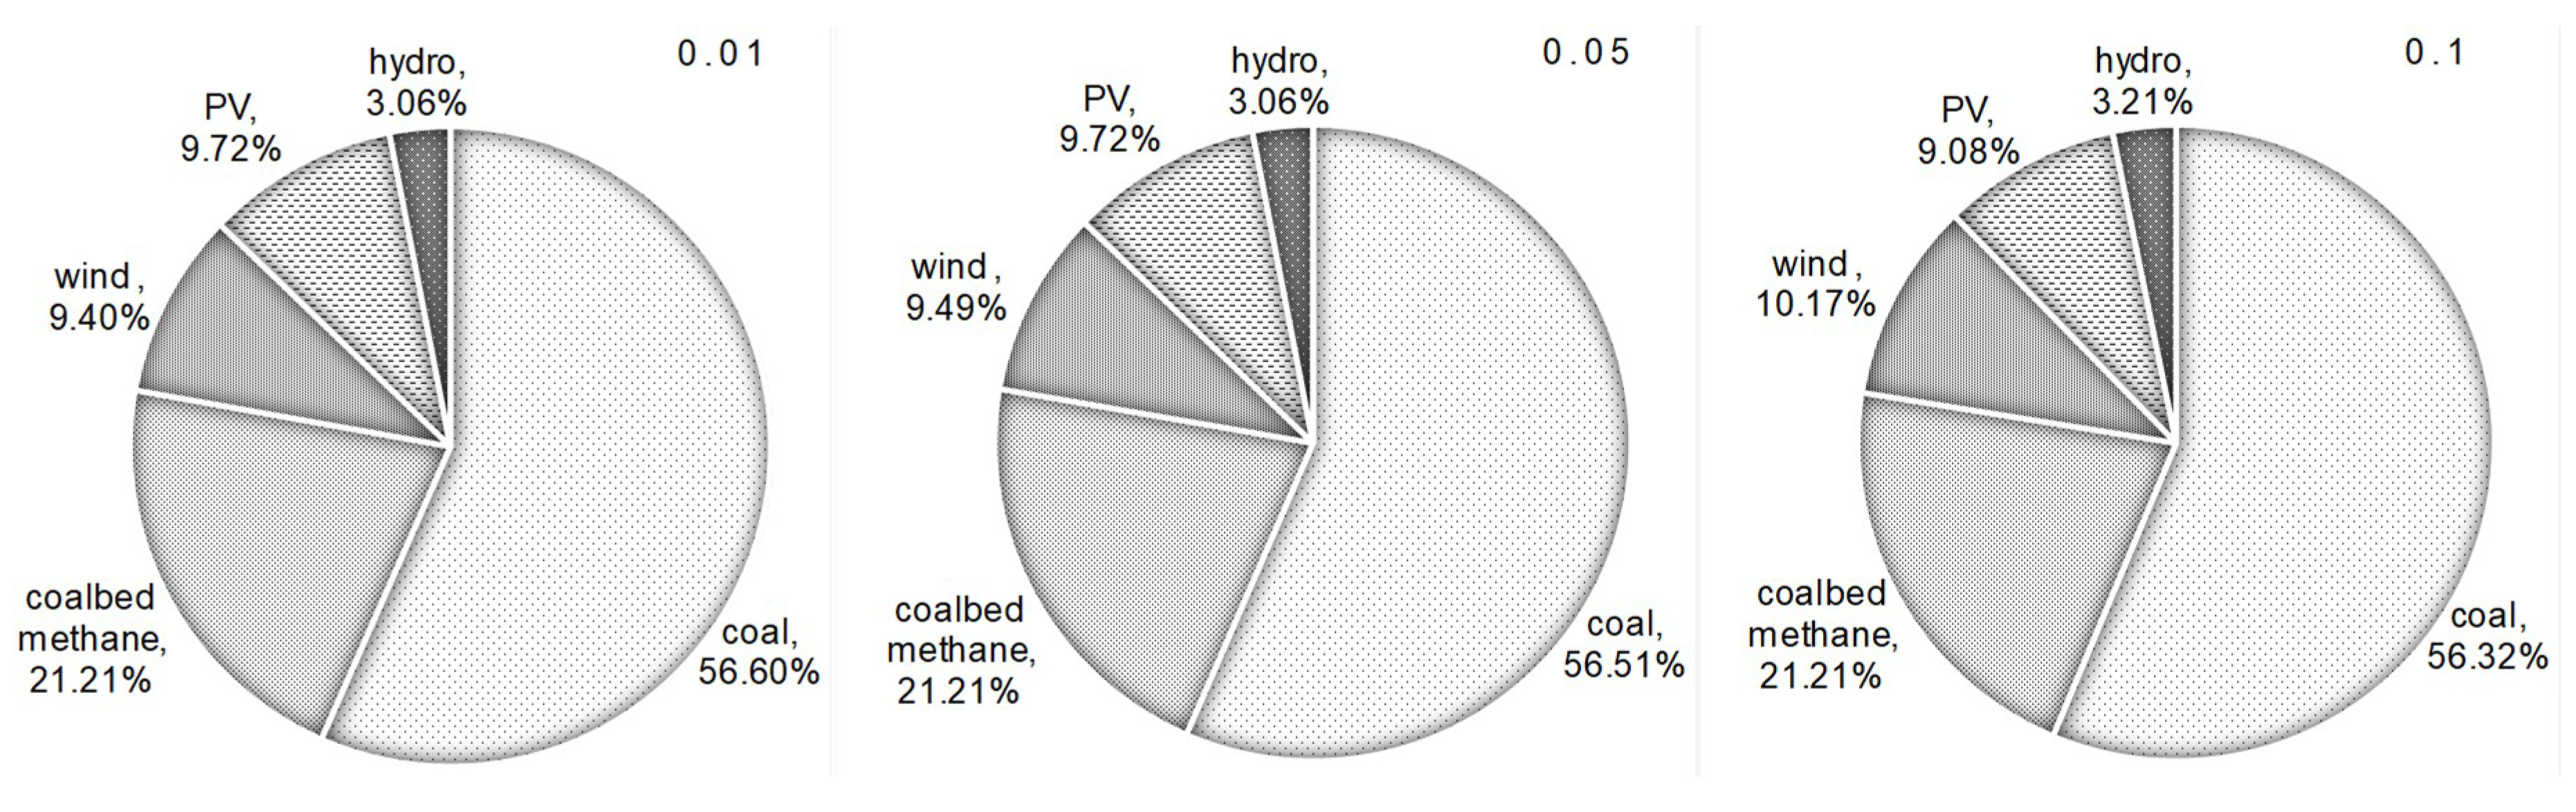
4. Data Collection and Results Analysis

The planning horizon is 15 years (three 5-year periods). The relevant cost parameters were collected from Shanxi Province Statistical Yearbook; technical data and other parameters were obtained from official reports, such as the 13th Five-Year Plan for Economic and Social Development of the Shanxi Province, 13th FYP development plan for renewable energy of the Shanxi Province, etc. Table 2 lists the cost of primary energy supply and the related conversion parameters. Table 3 presents the capacity expansion options, the residual capacity, and the planned retirement unit capacity.
The above mentioned FCFP model aims at maximizing the clean energy utilization per unit of economic cost. A least-system-cost model is developed to focus on the economic aspect with the objective of minimizing the system cost. The advantages and advances of the developed FCFP model are further demonstrated by a comparison with the least-system-cost model. The optimal-ratio problem can be converted into a least-system-cost objective by applying the following objective:
M i n   f = system   cos t   =   C = f 1 + f 2 +   f 3 +   f 4 +   f 5 +   f 6 f 7  
Figure 7 compares the solution for capacity expansion corresponding to the FCFP and the least-cost model over three planning periods. Differences in capacity-expansion option can be found between the results of two models. The FCFP model leads to a relatively higher percentage of capacity expansion of clean energy; in comparison, the least-cost model leads to relatively higher percentages of capacity expansion of coal-fired facilities. Take coal-fired power as an example, the capacity expansion solution from the least-cost model would respectively be 2.2 GW, 6.55 GW, and 10.9 GW in Period 1, Period 2, and Period 3. Comparatively, the FCFP model would only add 2.2 GW to the residual coal-fired power capacity in Period 3. The coalbed methane power facility would have no capacity expansion in Periods 2 and 3 from the least-cost model; whereas it would have the capacity expansion over three planning periods from the FCFP model. In addition, these two models lead to similar capacity expansion schemes for hydropower and PV facilities in Period 1 and Period 2. According to the solution from the FCFP model, the wind power facilities would be expanded with a capacity of 7.28 GW in Period 1 (the same as the least-system-cost model) and another 5.28 GW in Period 2, which is different from the least-cost model in Period 2. Consequently, the proportion of total clean energy power installed capacity from FCFP model solution would be significantly higher than those from the least-cost model.
Figure 8 displays the power generation schemes output from FCFP and the least-cost model. These two models lead to the same total power generation over three planning periods (340.27 × 10³ GWh in period 1384.91 × 103 GWh in Period 2, and 427.97 × 10³ GWh in Period 3), but there are significant differences in the power generation sources from the two models. For example, to meet local electricity demand, the total coal-fired power generation obtained from the least-cost model would be 190.81 × 10³ GWh, 231.93 × 10³ GWh, and 299.30 × 10³ GWh in Periods 1, 2, and 3, respectively. In comparison, the FCFP model results in coal-fired power generations would be 159.25 × 10³ GWh, 213.63 × 10³ GWh, and 217.27 × 10³ GWh, respectively, which are significantly lower than the least-cost model. In contrast, the coalbed methane power generation obtained from the FCFP model would be 49.5 × 10³ GWh, 81.54 × 10³ GWh, and 113.58 × 10³ GWh, respectively, which are higher than those of the least-cost model (34.91 × 10³ GWh, 0 GWh, and 0 GWh, respectively). The alternative scheme from the FCFP model may be of more interest to decision makers due to its high clean energy power generation.
Figure 9 compares the system cost obtained from FCFP and least-cost models. The FCFP model would lead to higher system cost than the least-cost model over three planning horizons. According to the solutions from the FCFP model, the system cost would be 67.74 × 10⁹ $, 62.31 × 10⁹ $, and 58.44 × 10⁹ $ in Periods 1, 2, and 3, respectively. In comparison, the least-cost model achieves lower system costs over three periods (i.e., 63.41 × 10⁹ $, 60.09 × 10⁹ $, and 44.34 × 10⁹ $, respectively). In planning Period 3, the system cost obtained from the least-cost model is 24.12% lower than that of the FCFP model. This is because more strict emission policies in planning Period 3 lead to a significant increase in the proportion of clean energy power generation.
Electricity export is one of the main demands for the development of renewable energy resources. The proportion of renewable energy power generation in the electricity export is usually no less than 30% in China. Thus, three renewable power generation export proportion scenarios (30%, 40%, and 50%) are set in this study. Figure 10 depicts the power generation patterns under different scenarios (when λ = 0.5, ξ = 0.9, pi = 0.01). The FCFP model treats coalbed methane as an alternative energy source to generate electricity, which can both stabilize the fluctuation of renewable energy power generation and mitigate the emission of pollutants. Therefore, in the solution given by the FCFP model, the coalbed methane electricity supply would be 244.62 × 10³ GWh (when σ = 30%), 89.43 × 10³ GWh (when σ = 40%), and 211.67 × 10³ GWh (when σ = 50%), which are higher than the results obtained from the least-cost model (34.91 × 10³ GWh in all three scenarios). However, coal-fired electricity supply still plays an essential role in EPS due to its high stability and competitive price during the planning horizon.
Figure 11 shows the variations of the total system costs under different λ and ξ levels when pi = 0.01. The results show that the system cost would present an upward trend with the descending value of the preference parameter λ, corresponding to higher necessity degree and lower possibility degree. For example, when ξ= 0.8, the system cost would increase from 182.868 × 10⁹ $ (λ = 0.9) to 188.501 × 10⁹ $ (λ = 0.1). Similarly, the results under other ξ levels (ξ= 0.9 and ξ= 0.7) can be interpreted. When λ ≤ 0.5, there would be a decrease tendency of system cost with decreasing ξ level. For instance, when λ = 0.1, the system cost would drop from 192.859 × 10⁹ $ (ξ= 0.9) to 183.631 × 10⁹ $ (ξ= 0.7). When λ > 0.5, with the ξ level decrease, the system cost would slightly decrease or remain unchanged. For example, when λ = 0.9, with the ξ level decreasing, it would lead to the unchanged system cost of 182.868 × 10⁹ $. When the proportion of necessity measures are higher than the possibility measures (λ ≤ 0.5), it is more sensitive to change in ξ level. In general, a higher ξ level and a lower λ value would correspond to tighter environmental conditions, thus leading to a higher system cost. An ascending λ value and descending ξ level would bring the alternative of lower system cost but lead to the decrease of system reliability. Through balancing the tradeoffs among expected system cost, emission-control level, possibility degree, and necessity degree, decision alternatives can be generated with different λ values and ξ levels (see Figure 12).
Figure 13 exhibits the power structures under different renewable energy availability levels (pi) when the export percentage of renewable power generation is set to 40% and λ = 0.5, ξ= 0.9. Due to the optimization objective in FCFP model is to maximize the proportion of clean energy supply, coalbed methane power generation would keep the same proportion when the confidence levels in the availabilities of renewable energy resources change. As shown in Figure 13, under different confidence levels, the proportion of coalbed methane power generation would be 21.21%. The lower confidence level means that the availability of renewable energy resources would increase, which would lead to the decreased trend of coal-fired power generation. In detail, the percentage of coal-fired power generation would have a slight decrease from 56.6% (when pi = 0.01) to 56.32% (when pi = 0.1).
The above alternatives denote a variety of options between economic and environmental tradeoffs. In the FCFP model, the proportion of renewable power generation will be maximized, resulting in the capacity expansion of renewable energy. At the same time, due to the higher capital and maintenance cost of renewable power, the system cost will increase with a higher renewable penetration. On the other hand, in the least-cost model, the system cost is well controlled and minimized. The consequence of such an objective is the increasing expansion of cheap coal-fired power facilities. The significance of economic and environmental effects between maximized renewable energy and minimized system cost can be well reflected in the FCFP and least-cost models. Moreover, a willingness to accept a high system cost will guarantee meeting the objective of increasing the proportion of clean energy. A strong desire to acquire the low system cost will cause the risk of violating emission constraints. Also, the variation in results can be examined by giving different preference parameters and confidence levels. In general, the above research results can reflect interrelationships among system efficiencies, decision preferences, and constraint-violation risk levels favored by decision makers due to their flexibility and preference for practical decision-making processes.

5. Conclusions

A FCFP method is presented for power systems management under uncertainties. It is applied to a case study of Shanxi province, China. In the developed model, mλ measure and CCP are incorporated into a FP optimization framework. The obtained results are useful for supporting Shanxi EPS management. The advantages of the presented FCFP-Shanxi model are summarized as below:
(a)
A FCFP approach could balance the dual objectives of maximizing clean energy generation and minimizing economic cost and the trade-offs between the environmental constraints and system efficiency.
(b)
A FCFP approach could convert the availability parameters of renewable energy with intermittent characteristics into determined model input parameters.
(c)
A FCFP approach could provide various decision alternatives with different risk preferences. Comparison and sensitivity analysis of results obtained from the alternatives could help decision makers make more appropriate decisions.
(d)
A FCFP approach could offer a large number of scenario-based results, which could capture the impact of different energy policies on an expansion scheme, power generation patterns, and system costs.
This study compares the solution from the FCFP-Shanxi model with that from the traditional least-cost model. The comparative solutions indicated that the solution provided by the FCFP-Shanxi model has a lower share of coal-fired power generation in energy supply than the least-cost model. Accordingly, lower capacity expansions of coal-fired power facilities are undertaken. This study is the first attempt to address various complexities in Shanxi’s EPS through the developed FCFP-Shanxi model while exploring the transition pathways toward sustainability. The results reveal that FCFP could also be applicable in other coal-heavy electricity regions.

Author Contributions

Writing—original draft preparation, C.Z. and J.C.; methodology, C.Z., J.C. and G.H. All authors made contributions to the study and the writing of the manuscript.

Funding

This research was funded by the Fundamental Research Funds for the Central Universities, NCEPU Grant Number 2018BJ0293, the National Key Research and Development Plan Grant Number 2016YFC0502800, the Natural Sciences Foundation Grant Numbers 51520105013, 51679087, and the 111 Program Grant Number B14008.

Conflicts of Interest

The authors declare no conflicts of interest.

Nomenclature

Indices
tindex for the time periods (t = 1, 2, …, T, 5 year for each period).
jindex for the power generation technology (j = 1, 2, …, J, and j = 1 coal-fired power, j = 2 coalbed methane power, j = 3 hydropower, j = 4 wind power, j = 5 photovoltaic).
Ithe number of non-renewable power generation technology (I = 2).
kthe type of electricity demand (where k = 1 for local demand, k = 2 for export).
mindex for the capacity expansion options (m = 1, 2, …, M).
nthe type of pollutant, n = 1, 2, 3 (where n = 1 for SOx, 2 for NOx, 3 for PM).
Decision Variables
A P E t j supply of primary energy resource (coal and coalbed methane) for power generation technology j in period t (TJ).
A P G t j k decision variable and represents electricity generation from power generation technology j in period t (GWh).
Y t j m capacity option m for power generation technology j in period t.
Parameters
A V H t availability of hydropower in period t.
A V W t ( p r ) availability of wind energy in period t under level pr.
A V S t ( p r ) availability of solar energy in period t under level pr.
C E P t j cost for expanding capacity for generating electricity technology j in period t (103 $/GW).
C E E t j n penalty of pollutant n emission of power generation technology j in period t (103 $/tonne).
C P E ˜ t j cost for primary energy supply for power generation technology in period t (103 $/TJ).
C P G t j fixed and variable costs for generating electricity via technology j in period t (103 $/GWh).
C P M t j n cost for pollutant n mitigation of power generation technology j in period t (103 $/tonne).
C T D t k cost for transmission and distribution in period t (103 $/GWh).
D M t local electricity demand (GWh) in period t.
D E t export electricity demand of other provinces (GWh) in period t.
E C A t j m capacity expansion option m of power generation technology j under different scheme in period t (GW).
E M ˜ t n the permitted emission of air contaminant in period t (103 tonne).
R C A t j the current capacity of power generation technology j in period t (GW).
R E T t j retirement capacity of power generation technology j in period t (GW).
S P T t j subsidy of pollution treatment from fossil-fired generation technology j in period t.
S R G t j subsidy of renewable energy generation technology j in period t.
S T M t j the maximum service time of power generation technology j in period t (h).
S T t the maximum service time of electric transmission line in period t (h).
U C A t j maximum capacity of generation technology j in period t (GW).
U P E t j available primary energy j in period t (TJ).
U H V t the maximum electric transmission capacity in period t.
c f t j n emission factor of the pollutant n in period t (103 tonne/GWh).
c r f t 3 conversion rate from hydropower to electricity in period t.
c r f t 4 conversion rate from wind energy to electricity in period t.
c r f t 5 conversion rate from solar energy to electricity in period t.
r f t j energy consumption conversion rate by power generation technology j in period t (TJ/GWh).
θ t k transmission loss in period t (k = 1, local; k = 2, export).
σ t the minimum share of power generation by renewable energy in the whole energy supply.

References

  1. Song, H.; Dotzauer, E.; Thorin, E.; Guziana, B.; Huopana, T.; Yan, J. A dynamic model to optimize a regional energy system with waste and crops as energy resources for greenhouse gases mitigation. Energy 2012, 46, 522–532. [Google Scholar] [CrossRef]
  2. Huang, G.H. A hybrid inexact-stochastic water management model. Eur. J. Oper. Res. 1998, 107, 137–158. [Google Scholar] [CrossRef]
  3. Huang, G.H.; Loucks, D.P. An inexact two-stage stochastic programming model for water resources management under uncertainty. Civ. Eng. Syst. 2000, 17, 95–118. [Google Scholar] [CrossRef]
  4. Cai, Y.P.; Huang, G.H.; Yang, Z.F.; Tan, Q. Identification of optimal strategies for energy management systems planning under multiple uncertainties. Appl. Energy 2009, 86, 480–495. [Google Scholar] [CrossRef]
  5. Li, Y.F.; Li, Y.P.; Huang, G.H.; Chen, X. Energy and environmental systems planning under uncertainty—An inexact fuzzy-stochastic programming approach. Appl. Energy 2010, 87, 3189–3211. [Google Scholar] [CrossRef]
  6. Zhu, Y.; Li, Y.P.; Huang, G.H. Planning carbon emission trading for Beijing’s electric power systems under dual uncertainties. Renew. Sustain. Energy Rev. 2013, 23, 113–128. [Google Scholar] [CrossRef]
  7. Chen, B.; Li, P.; Wu, H.J.; Husain, T.; Khan, F. MCFP: A Monte Carlo Simulation-based Fuzzy Programming Approach for Optimization under Dual Uncertainties of Possibility and Continuous Probability. J. Environ. Inform. 2017, 29, 88–97. [Google Scholar] [CrossRef]
  8. Zhang, Y.M.; Huang, G.H.; Lin, Q.G.; Lu, H.W. Integer fuzzy credibility constrained programming for power system management. Energy 2012, 38, 398–405. [Google Scholar] [CrossRef]
  9. Guo, X.; Bao, Z.; Li, Z.; Yan, W. Adaptively Constrained Stochastic Model Predictive Control for the Optimal Dispatch of Microgrid. Energies 2018, 11, 243. [Google Scholar] [CrossRef]
  10. Li, W.; Bao, Z.; Huang, G.H.; Xie, Y.L. An Inexact Credibility Chance-Constrained Integer Programming for Greenhouse Gas Mitigation Management in Regional Electric Power System under Uncertainty. J. Environ. Inform. 2017, 31, 111–122. [Google Scholar] [CrossRef]
  11. Hu, J.; Sun, L.; Li, C.H.; Wang, X.; Jia, X.L.; Cai, Y.P. Water Quality Risk Assessment for the Laoguanhe River of China Using a Stochastic Simulation Method. J. Environ. Inform. 2018, 31, 123–136. [Google Scholar] [CrossRef]
  12. Huang, C.Z.; Nie, S.; Guo, L.; Fan, Y.R. Inexact Fuzzy Stochastic Chance Constraint Programming for Emergency Evacuation in Qinshan Nuclear Power Plant under Uncertainty. J. Environ. Inform. 2017, 30, 63–78. [Google Scholar] [CrossRef]
  13. Wang, S.; Huang, G.H. A multi-level Taguchi-factorial two-stage stochastic programming approach for characterization of parameter uncertainties and their interactions: An application to water resources management. Eur. J. Oper. Res. 2015, 240, 572–581. [Google Scholar] [CrossRef]
  14. Wang, S.; Huang, G.H.; Baetz, B.W. An inexact probabilistic–possibilistic optimization framework for flood management in a hybrid uncertain environment. IEEE Trans. Fuzzy Syst. 2015, 23, 897–908. [Google Scholar] [CrossRef]
  15. Wu, C.B.; Huang, G.H.; Xin, B.G.; Chen, J.K. Scenario analysis of carbon emissions’ anti-driving effect on Qingdao’s energy structure adjustment with an optimization model, Part I: Carbon emissions peak value prediction. J. Clean. Prod. 2018, 172, 466–474. [Google Scholar] [CrossRef]
  16. Rekik, M.; Abdelkafi, A.; Krichen, L. A micro-grid ensuring multi-objective control strategy of a power electrical system for quality improvement. Energy 2015, 88, 351–363. [Google Scholar] [CrossRef]
  17. Azadeh, A.; Raoofi, Z.; Zarrin, M. A multi-objective fuzzy linear programming model for optimization of natural gas supply chain through a greenhouse gas reduction approach. J. Nat. Gas Sci. Eng. 2015, 26, 702–710. [Google Scholar] [CrossRef]
  18. Meza, J.; Espitia, H.; Montenegro, C.; Crespo, R.G. Statistical analysis of a multi-objective optimization algorithm based on a model of particles with vorticity behavior. Soft Comput. 2016, 20, 3521–3536. [Google Scholar] [CrossRef]
  19. Sarkar, B.; Ganguly, B.; Sarkar, M.; Pareek, S. Effect of variable transportation and carbon emission in a three-echelon supply chain model. Transp. Res. Part E 2016, 91, 112–128. [Google Scholar] [CrossRef]
  20. Habiboghli, A.; Jalali, T. A Solution to the N-Queens Problem Using Biogeography-Based Optimization. Int. J. Interact. Multimed. Artif. Intell. 2017, 4, 20–26. [Google Scholar] [CrossRef]
  21. Li, K.; Pan, L.; Xue, W.; Jiang, H.; Mao, H. Multi-objective optimization for energy performance improvement of residential buildings: A comparative study. Energies 2017, 10, 245. [Google Scholar] [CrossRef]
  22. Meza, J.; Espitia, H.; Montenegro, C.; Giménez, E.; González-Crespo, R. MOVPSO: Vortex multi-objective particle swarm optimization. Appl. Soft Comput. 2017, 52, 1042–1057. [Google Scholar] [CrossRef]
  23. Meza, J.L.C.; Yildirim, M.B.; Masud, A.S. A model for the multiperiod multiobjective power generation expansion problem. IEEE Trans. Power Syst. 2007, 22, 871–878. [Google Scholar] [CrossRef]
  24. Zhu, H.; Huang, G.H. Dynamic stochastic fractional programming for sustainable management of electric power systems. Int. J. Electr. Power Energy Syst. 2013, 53, 553–563. [Google Scholar] [CrossRef]
  25. Zhu, H.; Huang, W.W.; Huang, G.H. Planning of regional energy systems: An inexact mixed-integer fractional programming model. Appl. Energy 2014, 113, 500–514. [Google Scholar] [CrossRef]
  26. Wang, L.; Huang, G.; Wang, X.; Zhu, H. Risk-based electric power system planning for climate change mitigation through multi-stage joint-probabilistic left-hand-side chance-constrained fractional programming: A Canadian case study. Renew. Sustain. Energy Rev. 2018, 82, 1056–1067. [Google Scholar] [CrossRef]
  27. Cao, X. Policy and regulatory responses to coalmine closure and coal resources consolidation for sustainability in Shanxi, China. J. Clean. Prod. 2017, 145, 199–208. [Google Scholar] [CrossRef]
  28. Heilpern, S. The expected value of a fuzzy number. Fuzzy Sets Syst. 1992, 47, 81–86. [Google Scholar] [CrossRef]
  29. Gen, M.; Tsujimura, Y.; Ida, K. Method for solving multiobjective aggregate production planning problem with fuzzy parameters. Comput. Ind. Eng. 1992, 23, 117–120. [Google Scholar] [CrossRef]
  30. Jiménez, M.; Arenas, M.; Bilbao, A.; Rodrı, M.V. Linear programming with fuzzy parameters: An interactive method resolution. Eur. J. Oper. Res. 2007, 177, 1599–1609. [Google Scholar] [CrossRef]
  31. Zhou, Y.; Li, Y.P.; Huang, G.H. Planning sustainable electric-power system with carbon emission abatement through CDM under uncertainty. Appl. Energy 2015, 140, 350–364. [Google Scholar] [CrossRef]
  32. Liu, B.; Iwamura, K. Chance constrained programming with fuzzy parameters. Fuzzy Sets Syst. 1998, 94, 227–237. [Google Scholar] [CrossRef]
  33. Dubois, D.; Prade, H. (Eds.) Fundamentals of Fuzzy Sets; The Handbooks of Fuzzy Sets Series; Kluwer Academic Publishers: Boston, MA, USA, 2000. [Google Scholar]
  34. Zhang, C.; Zhang, F.; Guo, S.; Liu, X.; Guo, P. Inexact nonlinear improved fuzzy chance-constrained programming model for irrigation water management under uncertainty. J. Hydrol. 2018, 556, 397–408. [Google Scholar] [CrossRef]
  35. Ramík, J. Duality in fuzzy linear programming with possibility and necessity relations. Fuzzy Sets Syst. 2006, 157, 1283–1302. [Google Scholar] [CrossRef]
  36. Mula, J.; Peidro, D.; Poler, R. The effectiveness of a fuzzy mathematical programming approach for supply chain production planning with fuzzy demand. Int. J. Prod. Econ. 2010, 128, 136–143. [Google Scholar] [CrossRef]
  37. Chinnadurai, V.; Muthukumar, S. Solving the linear fractional programming problem in a fuzzy environment: Numerical approach. Appl. Math. Model. 2016, 40, 6148–6164. [Google Scholar] [CrossRef]
Figure 1. The study area.
Energies 11 02723 g001
Figure 2. Distribution of electricity installed capacity in the Province of Shanxi in 2017.
Energies 11 02723 g002
Figure 3. Installed electricity capacity by source in the Province of Shanxi (2017).
Energies 11 02723 g003
Figure 4. Accumulated grid-connected capacity of wind power and photovoltaics of China in 2017.
Energies 11 02723 g004
Figure 5. Electric consumption in Shanxi Province over 1999–2016.
Energies 11 02723 g005
Figure 6. Three measures of a fuzzy event including fuzzy set.
Energies 11 02723 g006
Figure 7. Solution for capacity expansion. (a) Fuzzy chance-constrained fractional programming (FCFP) model; and (b) least-system-cost model.
Energies 11 02723 g007
Figure 8. Comparison of power generations from FCFP and Least-system-cost models. (a) FCFP model; and (b) least-system-cost model.
Energies 11 02723 g008aEnergies 11 02723 g008b
Figure 9. Comparison of system cost from FCFP and Least-system-cost models.
Energies 11 02723 g009
Figure 10. Power generation patterns under different export electricity scenarios.
Energies 11 02723 g010
Figure 11. Total system cost under different λ values and ξ levels.
Energies 11 02723 g011
Figure 12. Power generation patterns under different λ values and ξ levels.
Energies 11 02723 g012
Figure 13. Power structure under different renewable energy availability confidence levels.
Energies 11 02723 g013
Table 1. Previous studies related to the subject.
Ref. No.Objective TypeMathematical MethodSolution TypeAnalysis Mode
SOMODOFMPSMPILPFPOthersMCMBMSEOthersScenarioSensitivity
[1]---------
[4]---------
[5]--------
[6]---------
[7]---------
[8]----------
[9]-----------
[10]---------
[12]--------
[17]----------
[19]----------
[21]- ---------
[24]---------
[26]---------
[31]----------
[33]-----------
[37]--------
Note: SO: single objective; MO: multi-objective; DO dual objective; FMP: fuzzy mathematical programming; SMP: stochastic mathematical programming; ILP: interval linear programming; FP: fractional programming; MC: minimize the cost; MB: maximize the system benefit; MSE: maximize system efficiency; and ✓: literature type.
Table 2. Cost of primary energy supply and conversion parameters.
Periodt = 1t = 2t = 3
Energy supply cost (103 $/TJ)Coal[3.26,4.05,4.48][4.46,4.68,5.19][5.38,5.76,5.90]
Coalbed methane[6.36,6.86,6.96][7.14,7.42,7.77][7.98,8.18,8.38]
Units of energy carrier per units of power generation (TJ/GWh)Coal9.239.068.89
Coalbed methane7.817.546.79
Emission factor of the pollutant (tonne/GWh)CoalSOx3.93.3152.702
NOx3.63.062.6
PM0.80.650.5
Coalbed methaneSOx3.7343.1742.698
NOx1.8811.5991.359
PM0.7030.5630.45
Table 3. Parameters for the capacity of different power generation technology.
ResidualPeriod
Capacityt = 1t = 2t = 3
Capacity expansion options (GW)m = 1m = 2m = 3m = 1m = 2m = 3m = 1m = 2m = 3
Coal59.432.26.5510.92.26.5510.92.26.5510.9
Coalbed methane3.883.125.127.123.125.127.123.125.127.12
Wind8.725.286.287.285.286.287.285.286.287.28
PV5.94.16.18.14.16.18.14.16.18.1
Hydro2.440.61.352.070.61.352.070.61.352.07
Retirement unit capacity of coal-fired (GW)7.8612.610.13

